In an era dominated by digital landscapes, protecting your brand’s identity has become more challenging than ever. Malicious actors regularly build lookalike websites, complete with official logos and spoofed domains, to try to dupe customers and employees. These kinds of phishing attacks can damage your reputation, erode customer trust, or even result in data breaches.
In March 2023 we introduced Cloudflare’s Brand and Phishing Protection suite, beginning with Brand Domain Name Alerts. This tool recognizes so-called “confusable” domains (which can be nearly indistinguishable from their authentic counterparts) by sifting through the trillions of DNS requests passing through Cloudflare’s DNS resolver, 1.1.1.1. This helps brands and organizations stay ahead of malicious actors by spotting suspicious domains as soon as they appear in the wild.
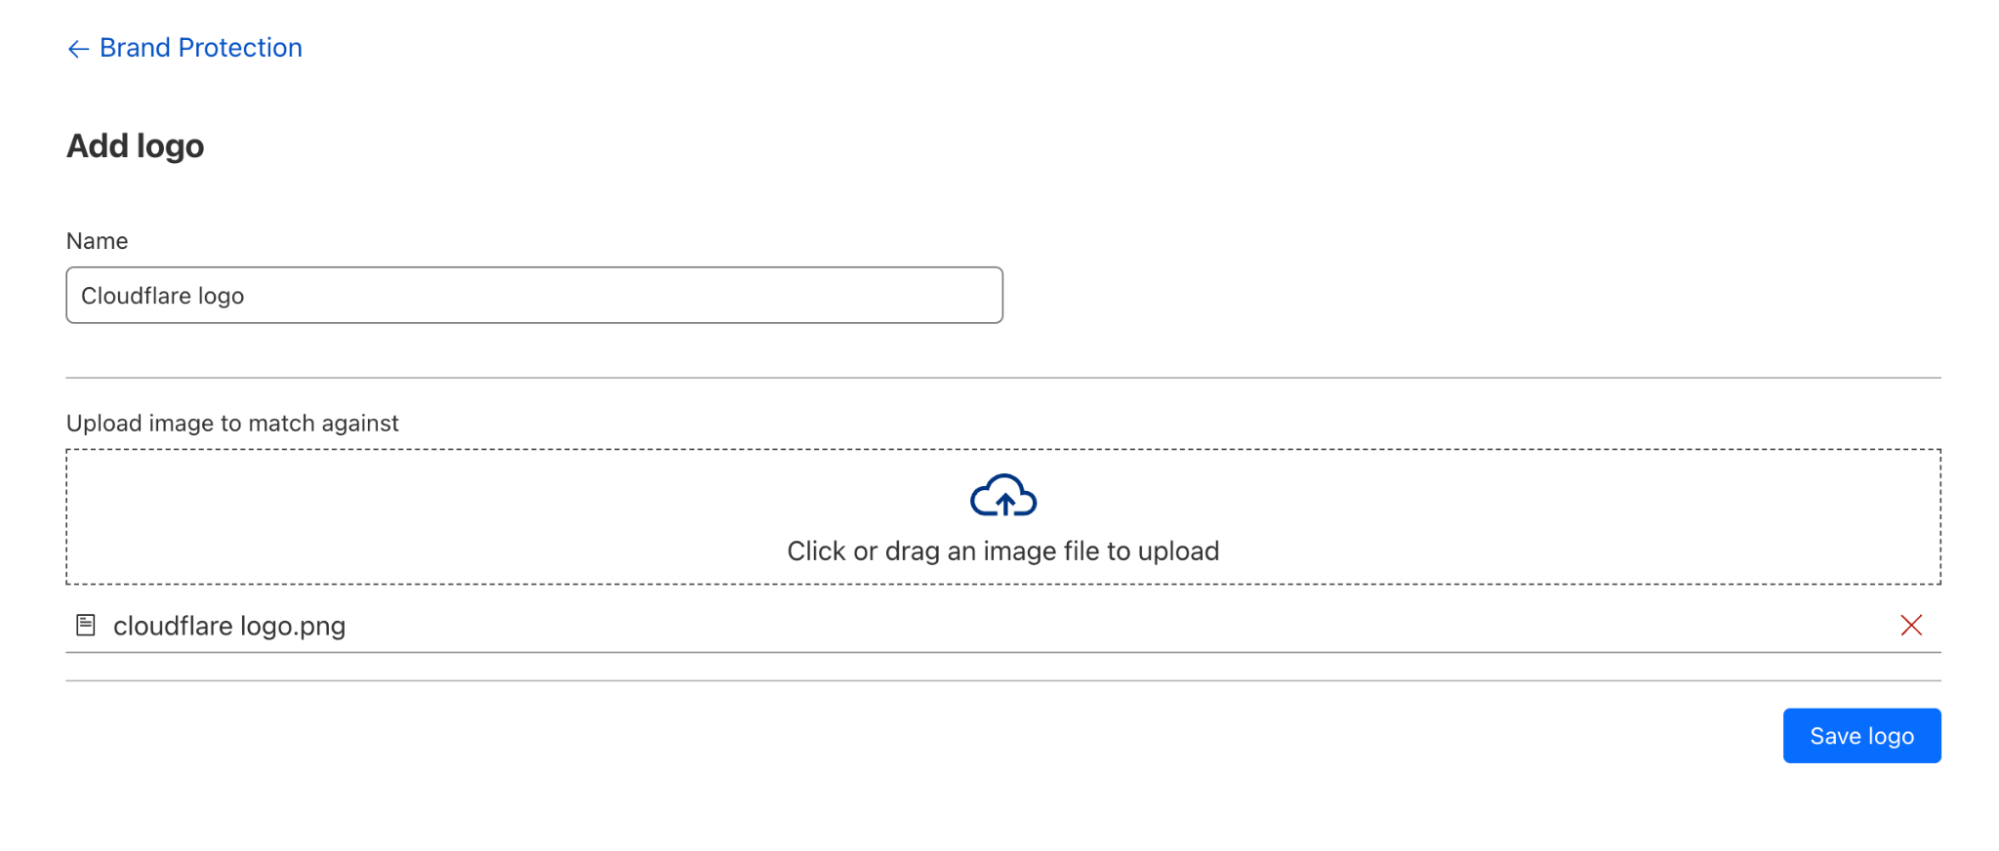
Today we are excited to expand our Brand Protection toolkit with the addition of Logo Matching. Logo Matching is a powerful tool that allows brands to detect unauthorized logo usage: if Cloudflare detects your logo on an unauthorized site, you receive an immediate notification.
The new Logo Matching feature is a direct result of a frequent request from our users. Phishing websites often use official brand logos as part of their facade. In fact, the appearance of unauthorized logos is a strong signal that a hitherto dormant suspicious domain is being weaponized. Being able to identify these sites before they are widely distributed is a powerful tool in defending against phishing attacks. Organizations can use Cloudflare Gateway to block employees from connecting to sites with a suspicious domain and unauthorized logo use.
Imagine having the power to fortify your brand’s presence and reputation. By detecting instances where your logo is being exploited, you gain the upper hand in protecting your brand from potential fraud and phishing attacks.
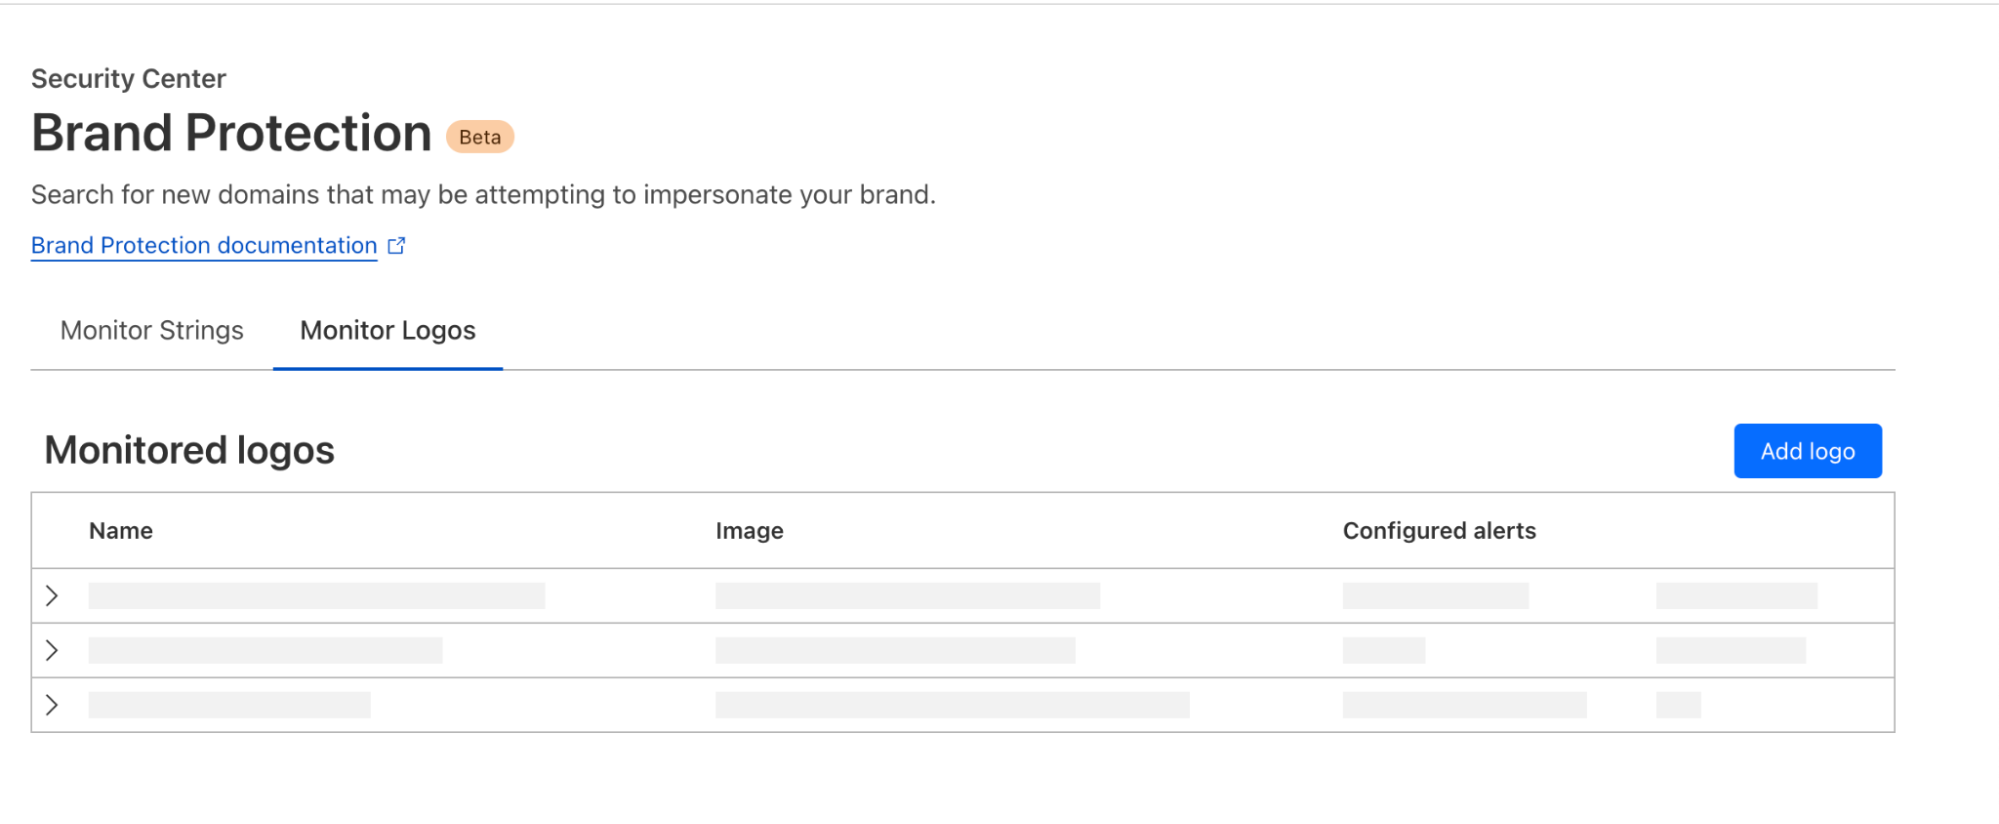
Getting started with Logo Matching
For most brands, the first step to leveraging Logo Matching will be to configure Domain Name Alerts. For example, we might decide to set up an alert for example.com, which will use fuzzy matching to detect lookalike, high-risk domain names. All sites that trigger an alert are automatically analyzed by Cloudflare’s phishing scanner, which gathers technical information about each site, including SSL certificate data, HTTP request and response data, page performance data, DNS records, and more — all of which inform a machine-learning based phishing risk analysis.
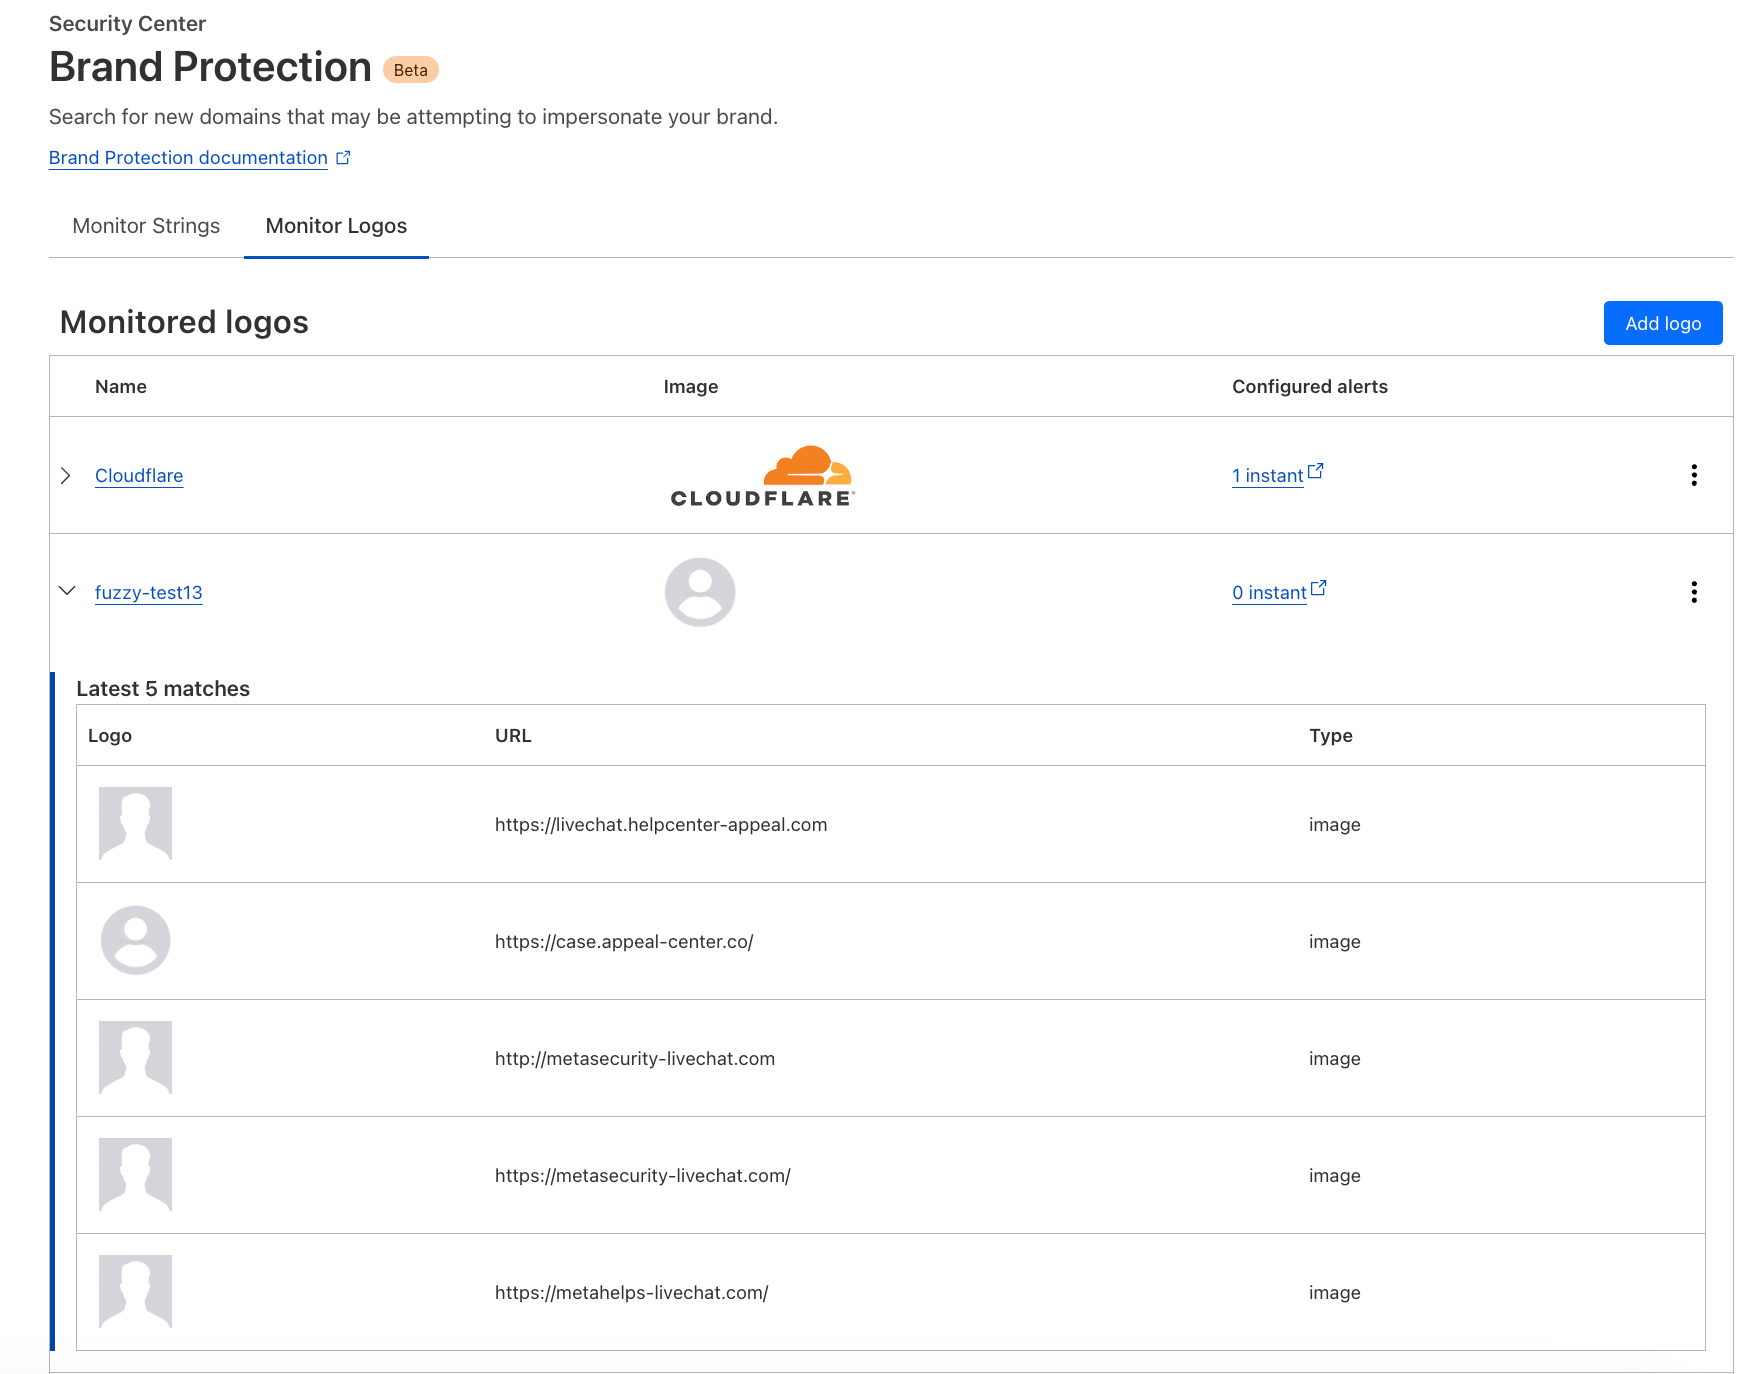
Logo Matching further extends this scan by looking for matching images. The system leverages image recognition algorithms to crawl through scanned domains, identifying matches even when images have undergone slight modifications or alterations.
Once configured, Domain Name Alerts and the scans they trigger will continue on an ongoing basis. In addition, Logo Matching monitors for images across all domains scanned by Cloudflare’s phishing scanner, including those scanned by other Brand Protection users, as well as scans initiated via the Cloudflare Radar URL scanner, and the Investigate Portal within Cloudflare’s Security Center dashboard.
How we built Logo Matching for Brand Protection
Under the hood of our API Insights
Now, let’s dive deeper into the engine powering this feature – our Brand Protection API. This API serves as the backbone of the entire process. Not only does it enable users to submit logos and brand images for scanning, but it also orchestrates the complex matching process.
When a logo is submitted through the API, the Logo Matching feature not only identifies potential matches but also allows customers to save a query, providing an easy way to refer back to their queries and see the most recent results. If a customer chooses to save a query, the logo is swiftly added to our data storage in R2, Cloudflare’s zero egress fee object storage. This foundational feature enables us to continuously provide updated results without the customer having to create a new query for the same logo.
The API ensures real-time responses for logo submissions, simultaneously kick-starting our internal scanning pipelines. An image look-back ID is generated to facilitate seamless tracking and processing of logo submissions. This identifier allows us to keep a record of the submitted images, ensuring that we can efficiently manage and process them through our system.
Scan result retrieval
As images undergo scanning, the API remains the conduit for result retrieval. Its role here is to constantly monitor and provide the results in real time. During scanning, the API ensures users receive timely updates. If scanning is still in progress, a “still scanning” status is communicated. Upon completion, the API is designed to relay crucial information — details on matches if found, or a simple “no matches” declaration.
Storing and maintaining logo data
In the background, we maintain a vectorized version of all user-uploaded logos when the user query is saved. This system, acting as a logo matching subscriber, is entrusted with the responsibility of ensuring accurate and up-to-date logo matching.
To accomplish this, two strategies come into play. Firstly, the subscriber stays attuned to revisions in the logo set. It saves vectorized logo sets with every revision and regular checks are conducted by the subscriber to ensure alignment between the vectorized logos and those saved in the database.
While monitoring the query, the subscriber employs a diff-based strategy. This recalibrates the vectorized logo set against the current logos stored in the database, ensuring a seamless transition into processing.
Shaping the future of brand protection: our roadmap ahead
With the introduction of the Logo Matching feature, Cloudflare’s Brand Protection suite advances to the next level of brand integrity management. By enabling you to detect and analyze, and act on unauthorized logo usage, we’re helping businesses to take better care of their brand identity.
At Cloudflare, we’re committed to shaping a comprehensive brand protection solution that anticipates and mitigates risks proactively. In the future, we plan to add enhancements to our brand protection solution with features like automated cease and desist letters for swift legal action against unauthorized logo use, proactive domain monitoring upon onboarding, simplified reporting of brand impersonations and more.
Getting started
If you’re an Enterprise customer, sign up for Beta Access for Brand protection now to gain access to private scanning for your domains, logo matching, save queries and set up alerts on matched domains. Learn more about Brand Protection here.
Security updates have been issued by Debian (edk2, postgresql-13, and postgresql-15), Fedora (engrampa, vim, and xen), Mageia (mbedtls and quictls), Oracle (nss, openssh, and tcpdump), Red Hat (.NET 8.0), SUSE (hugin, kernel, pdns-recursor, python3, tomcat, and tomcat10), and Ubuntu (clamav, edk2, linux-gcp-6.2, linux-intel-iotg-5.15, linux-oem-6.1, and ujson).
Good essay on software bloat and the insecurities it causes.
The world ships too much code, most of it by third parties, sometimes unintended, most of it uninspected. Because of this, there is a huge attack surface full of mediocre code. Efforts are ongoing to improve the quality of code itself, but many exploits are due to logic fails, and less progress has been made scanning for those. Meanwhile, great strides could be made by paring down just how much code we expose to the world. This will increase time to market for products, but legislation is around the corner that should force vendors to take security more seriously.
The use of generative AI tools (e.g. ChatGPT) in education is now common among young people (see data from the UK’s Ofcom regulator). As a computing educator or researcher, you might wonder what impact generative AI tools will have on how young people learn programming. In our latest research seminar, Barbara Ericson and Xinying Hou (University of Michigan) shared insights into this topic. They presented recent studies with university student participants on using generative AI tools based on large language models (LLMs) during programming tasks.
Using Parson’s Problems to scaffold student code-writing tasks
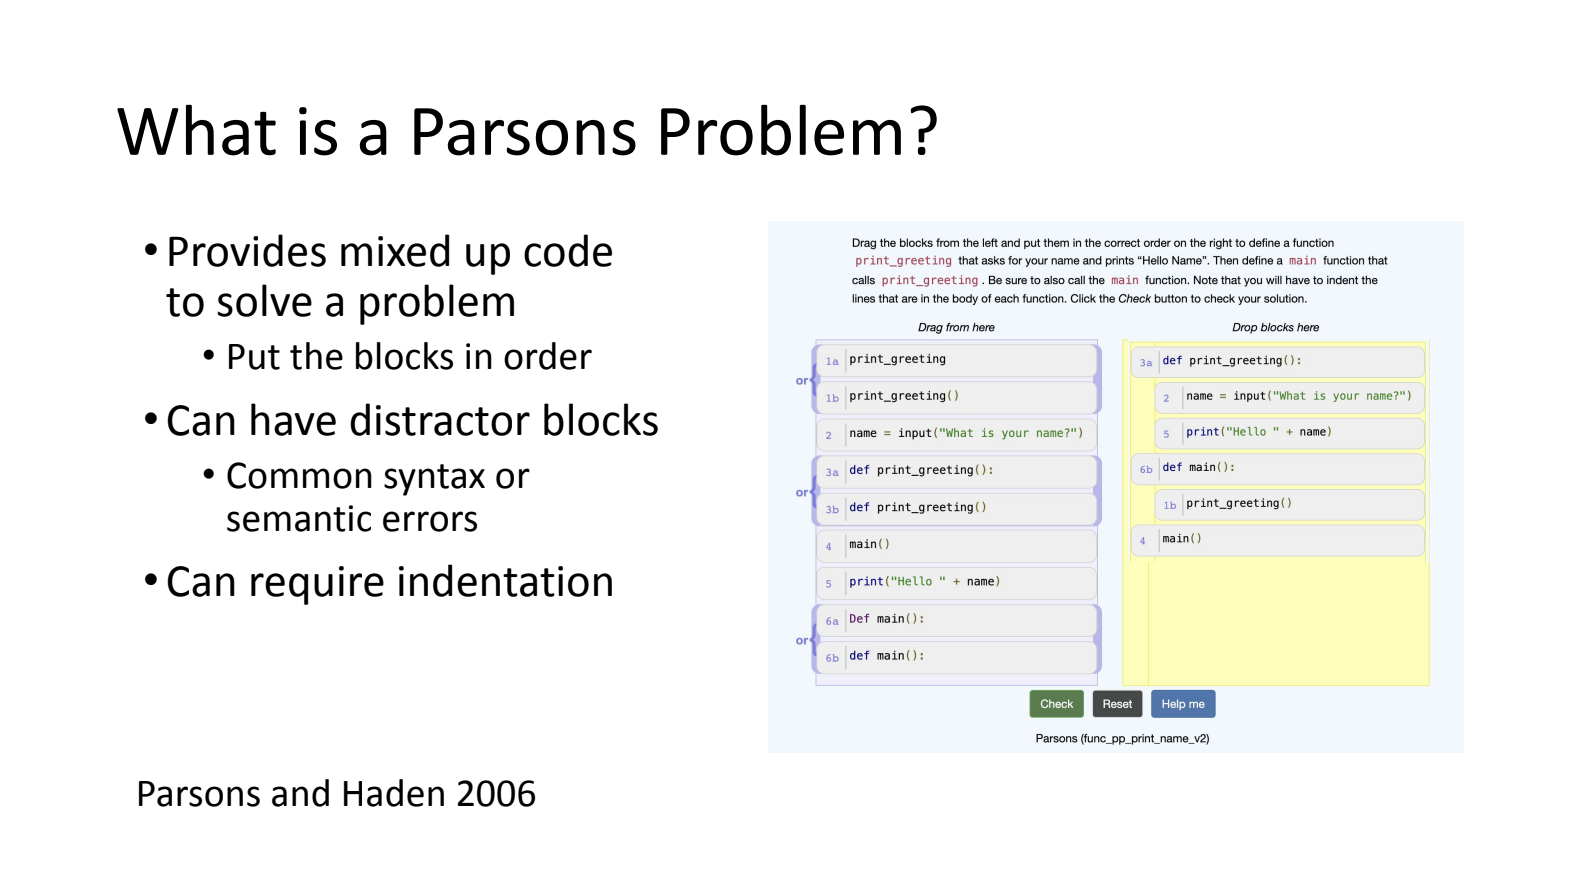
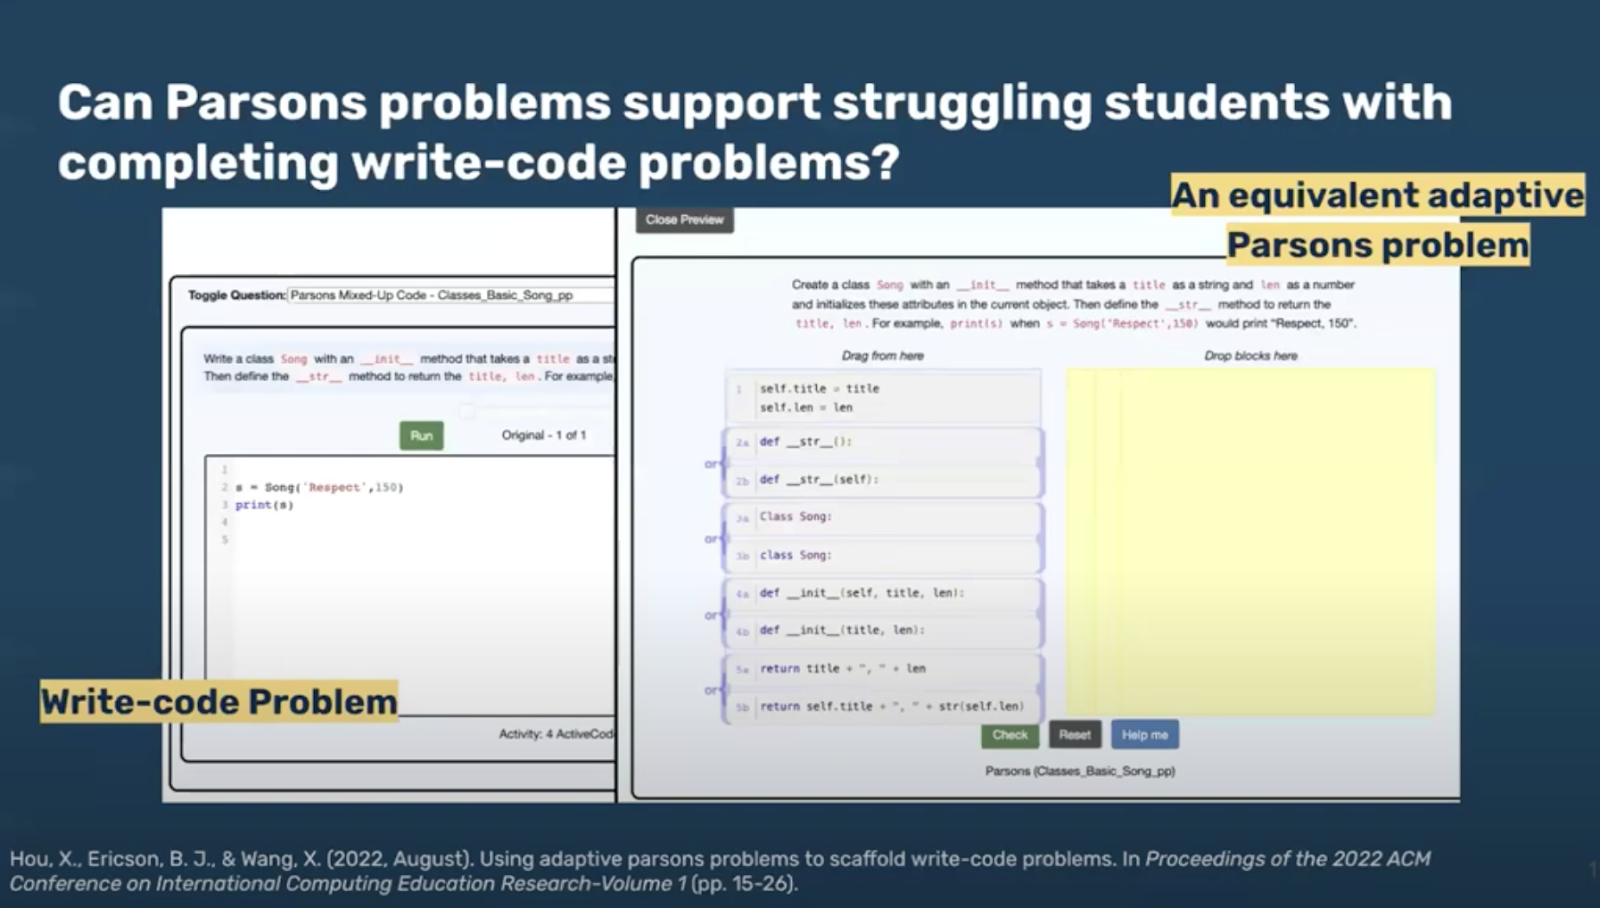
Barbara and Xinying started their seminar with an overview of their earlier research into using Parson’s Problems to scaffold university students as they learn to program. Parson’s Problems (PPs) are a type of code completion problem where learners are given all the correct code to solve the coding task, but the individual lines are broken up into blocks and shown in the wrong order (Parsons and Haden, 2006). Distractor blocks, which are incorrect versions of some or all of the lines of code (i.e. versions with syntax or semantic errors), can also be included. This means to solve a PP, learners need to select the correct blocks as well as place them in the correct order.
In one study, the research team asked whether PPs could support university students who are struggling to complete write-code tasks. In the tasks, the 11 study participants had the option to generate a PP when they encountered a challenge trying to write code from scratch, in order to help them arrive at the complete code solution. The PPs acted as scaffolding for participants who got stuck trying to write code. Solutions used in the generated PPs were derived from past student solutions collected during previous university courses. The study had promising results: participants said the PPs were helpful in completing the write-code problems, and 6 participants stated that the PPs lowered the difficulty of the problem and speeded up the problem-solving process, reducing their debugging time. Additionally, participants said that the PPs prompted them to think more deeply.
This study provided further evidence that PPs can be useful in supporting students and keeping them engaged when writing code. However, some participants still had difficulty arriving at the correct code solution, even when prompted with a PP as support. The research team thinks that a possible reason for this could be that only one solution was given to the PP, the same one for all participants. Therefore, participants with a different approach in mind would likely have experienced a higher cognitive demand and would not have found that particular PP useful.
Supporting students with varying self-efficacy using PPs
To understand the impact of using PPs with different learners, the team then undertook a follow-up study asking whether PPs could specifically support students with lower computer science self-efficacy. The results show that study participants with low self-efficacy who were scaffolded with PPs support showed significantly higher practice performance and higher problem-solving efficiency compared to participants who had no scaffolding. These findings provide evidence that PPs can create a more supportive environment, particularly for students who have lower self-efficacy or difficulty solving code writing problems. Another finding was that participants with low self-efficacy were more likely to completely solve the PPs, whereas participants with higher self-efficacy only scanned or partly solved the PPs, indicating that scaffolding in the form of PPs may be redundant for some students.
These two studies highlighted instances where PPs are more or less relevant depending on a student’s level of expertise or self-efficacy. In addition, the best PP to solve may differ from one student to another, and so having the same PP for all students to solve may be a limitation. This prompted the team to conduct their most recent study to ask how large language models (LLMs) can be leveraged to support students in code-writing practice without hindering their learning.
Generating personalised PPs using AI tools
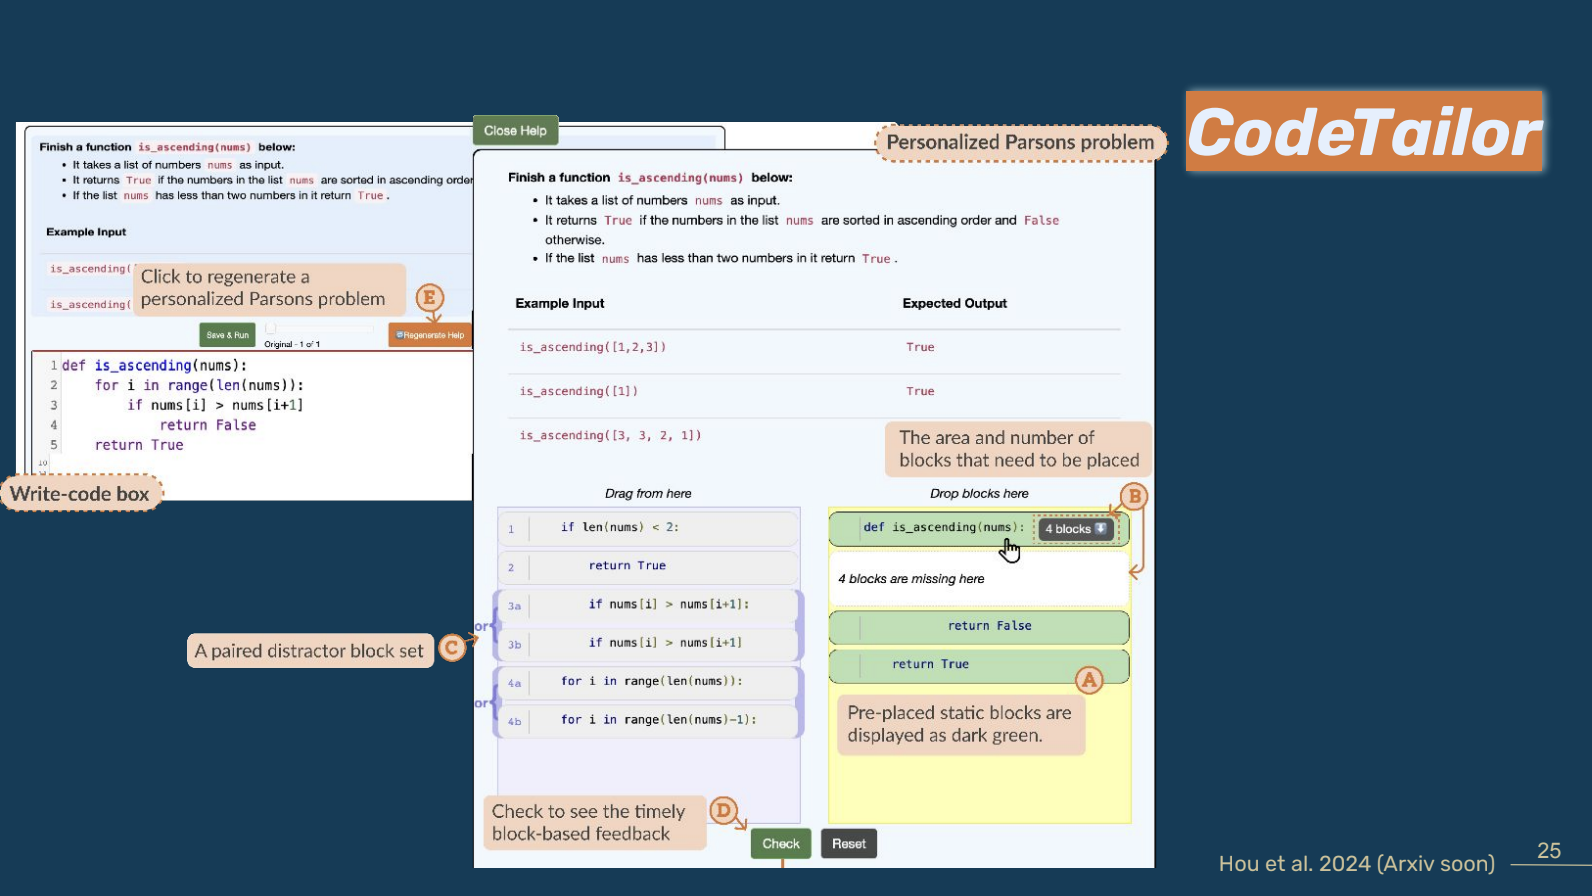
This recent third study focused on the development of CodeTailor, a tool that uses LLMs to generate and evaluate code solutions before generating personalised PPs to scaffold students writing code. Students are encouraged to engage actively with solving problems as, unlike other AI-assisted coding tools that merely output a correct code correct solution, students must actively construct solutions using personalised PPs. The researchers were interested in whether CodeTailor could better support students to actively engage in code-writing.
In a study with 18 undergraduate students, they found that CodeTailor could generate correct solutions based on students’ incorrect code. The CodeTailor-generated solutions were more closely aligned with students’ incorrect code than common previous student solutions were. The researchers also found that most participants (88%) preferred CodeTailor to other AI-assisted coding tools when engaging with code-writing tasks. As the correct solution in CodeTailor is generated based on individual students’ existing strategy, this boosted students’ confidence in their current ideas and progress during their practice. However, some students still reported challenges around solution comprehension, potentially due to CodeTailor not providing sufficient explanation for the details in the individual code blocks of the solution to the PP. The researchers argue that text explanations could help students fully understand a program’s components, objectives, and structure.
In future studies, the team is keen to evaluate a design of CodeTailor that generates multiple levels of natural language explanations, i.e. provides personalised explanations accompanying the PPs. They also aim to investigate the use of LLM-based AI tools to generate a self-reflection question structure that students can fill in to extend their reasoning about the solution to the PP.
Barbara and Xinying’s seminar is available to watch here:
Find examples of PPs embedded in free interactive ebooks that Barbara and her team have developed over the years, including CSAwesome and Python for Everybody. You can also read more about the CodeTailor platform in Barbara and Xinying’s paper.
Join our next seminar
The focus of our ongoing seminar series is on teaching programming with or without AI.
For our next seminar on Tuesday12 March at 17:00–18:30 GMT, we’re joined by Yash Tadimalla and Prof. Mary Lou Maher (University of North Carolina at Charlotte). The two of them will share further insights into the impact of AI tools on the student experience in programming courses. To take part in the seminar, click the button below to sign up, and we will send you information about joining. We hope to see you there.
Инвестиране на 1 000 месечно или 10 000 лева на куп с цел ПАСИВЕН ДОХОД – от опита на професионалния консултант
С колеги подготвяме онлайн курсове за финансова грамотност и фирмени финанси. Все пак идва криза и фирмите и кредитополучателите трябва да се приготвят. Според мен имат около 6 месеца или дори по-малко за да свършат това.
В тази връзка пуснах във Фейсбук пост с въпрос „-В какво бихте инвестирали ежемесечно 1 000 лева или 10 000 на куп.“ Трябва да призная, че получих изключително много и интересни предложения или по-скоро предположения от страна на участниците. Някои изключително креативни и оригинални, които ще се опитам да систематизирам тук.
Забелязаха се обаче и някои сериозни пропуски в инвестиционната култура, които могат да се окажат фатални предвид очакваната криза.
Едни от най-сериозните пропуски се оказа НЕПРАВЕНЕТО НА РАЗЛИКА МЕЖДУ ИНВЕСТИЦИЯ И СПЕСТЯВАНЕ.
Това може би е нормално, предвид заливащата ни информация в интернет и ограничените възможности за инвестиране в България.
Примерно съветите за инвестиране в ценни книжа като форма на инвестиция носеща „ПАСИВЕН ДОХОД“, не са най-практичното нещо. Не за друго, а защото инвестицията се превръща в спестяване за повечето хора. Да, зарибяващо е да гледаш ежедневно котировките и да доходността на портфейла си, но за да реализираш печалбата си в почти всички случаи трябва да продадеш ценната книга, която си купил или дяловете си в ETF-a. И в този момент мантрата за пасивния доход вече е невалидна, защото ако сметнете колко време сте отделили да следите котировките и да четете новините разбирате, че това вече е ДОПЪЛНИТЕЛЕН ДОХОД а не ПАСИВЕН ДОХОД. Но за пасивния доход ще дам пример по-натам с любимата „дъвка“ на съвременните финансови гурута – покупката на недвижим имот с цел доход от наем.
Това което наблюдавам е, че инвестициите в ценни книжа и ETF-и постепенно стават спестявания. А това в сегашната ситуация е опасно. Изобщо търговията с ETF-и и ценни книжа, в никакъв случай не бива да се съчетава с думите „ПАСИВЕН ДОХОД“, защото веднага от инвестиция, операцията става спестяване. А това както казахме е опасно в тази ситуация.
За да съм още по-ясен – представете си как всеки месец си „получавате печалбата“ от инвестицията в ценни книги. Аз поне не познавам някoй да го прави като форма на „ПАСИВЕН ДОХОД“. Познавам доста професионални трейдъри, но те не го правят с 1 000 лева на месец или 10 000 лева капитал и не като ПАСИВЕН ДОХОД, а по занятие.
Моят извод е, че търговията с ценните книжа не е най-удачната форма на редовна инвестиция с по 1 000 лева месечно или 10 000 лева капитал. Форма на спестяване с по-висока лихва ДА, но не и инвестиция с цел ПАСИВЕН ДОХОД. Не забравяйте, че високата лихва е висок риск!
Има ли вече изобщо ПАСИВЕН ДОХОД
Моето мнение е, че такова животно вече почти няма. Една от най-честите спекулации е, че това е наема. Така е – съласен съм! Наемът беше басивен доход до преди 10 години. В днешно време не е точно така.
Изчислявал съм многократно рентабилността на една такава инвестиция. Тя варира от 3-4% годишно, до към максимум 12-13%, но във втория случай вече не се говори за „ПАСИВЕН ДОХОД“ под никаква форма. Говори се за ОСНОВЕН ДОХОД ли в най-добрия случай ДОПЪЛНИТЕЛЕН ДОХОД, защото вемето, което отделяте за реализирането на тези 12-13% е огромно. А когато в покупката има и кредит, тогава доходнотта съвсем намалява.
Няма да правя сметки в тази статия (може би по-натам), но бих описал необходимите знания, умения и времето за реализиране на доход от покупката на недвижим имот с цел отдаване под наем.
Най-напред изборът на имот си е проблем у нас. Знаете как е със строителите и техните адокати, когато дойде време за предварителния договор? Брокерът обикновено си е взел комисиона и вече го няма, а Вие оставате в ръцете на Вашия адвокат, чийто труд Ви се вижда много скъп
После следва кредита и разправиите с банката. Врно е, че по-хитрите ползват моите услуги или на консултанти като мен, но голяма част все още си мислят, че са много важни за банките и ще свършат всичко сами. Признавам, че някои успяват, но по-голямата част страдат на даден етап.
Следват майсторите, понеже взимате имота на шпакловка и замазка. Сакрален момент за всеки инвеститор в имот е дейността на майсторите.
Следват обзавеждане, търсене на наематели, договор с тях, както и ремонти след тяхното изнасяне. Някои наричат ремонта със звучното определение „ОСВЕЖАВАНЕ“, но нека не забравяме, че и то се прави от майстори.
Разбира се освежаването можете и сами да си го направите, но тогава си говорим за инвестираното време в тази сделка носеща уж „ПАСИВЕН ДХОД“.
Миналата седмица се изнесоха дългогодишни, препоръчани наематели на мой приятел. Изнесоха му също и пералната, печката, хладилника, мебелите… Аз по-съсипан апартамент не съм виждал. Човекът е принуден да продаде имота, защото точно в момента няма средства за ремонт. А с ремонта вече знаете как е – майстори, пари, размотаване на материали… Както казахме по-горе може и сами да го направите, но пак се връщаме на въпроса за времето?
Изобщо оказва се, че „ПАСИВНИЯТ ДОХОД“ не бил много пасивен. А ако решите да отдавате чрез AIRBNB и да гоните 10-12% рентабилност, тогава вече говорим за работа на пълно работно време.
Така или иначе имот не се купува с 1 000 лева на месец или 10 000 лева в брой, затова се връщаме на някои от предложенията, които смятам за най-подходящи в този случая.
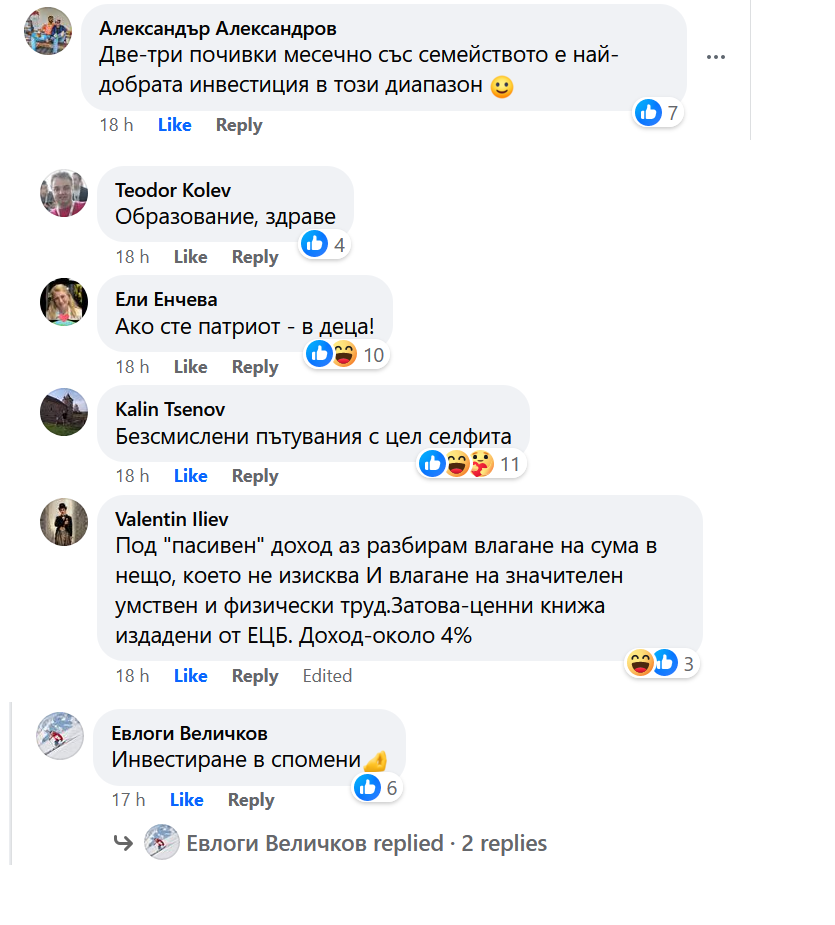
Не мога да публикувам всички мнения и предложения, но Вие можете да се абониране за Телеграм канала Kendov.com и да се апдейтвате редовно. Там ще четете коментарите на останалите и ще давате своите.
ИНВЕСТИЦИЯ = ВРЕМЕ + ЗНАНИЯ
Останах приятно изненадан, че голяма част от хората са на мнение, че трябва да се инвестира в това от което разбираш. Много рядко ми се е случвало да консултирам успешна инвестиция в сфера в която човекът не разбора нищо. Никога обаче не съм срещал успешна инвестиция, която да е станала без да е отделено време. Колкото по-незапознат си, толкова повече време трябва да отделиш за една инвестиция. Ето и няйкои коментари в тази насока:
ИНВЕСТИРАЙ НЕТРАДИЦИОННО
Трябва да призная че Bai R. Ivanov даде най-оригиналното предложение. Не се заблуждавайте обаче, че можете да подходите нетрадиционно в инвестирането без съответния опит. Bai. R. Ivanov има колосален опит в тази сфера, за да даде подобно предложение
Ако сте стигнали до тук с четенето, значи можете да чуете и съветите които давам в случаите с 1000 лева на месец или 10 000 в брой.
Естествено съветите зависят от профила и знанията на клиента, както е отбелязала Роси
Затова карам по пирамидата на Маслоу. Съветвам клиента да харчи парите си за задоволяване на най-първичните си потребности с предимство. Ако нямаш апартамент, тези 1000 лева отиват за вноска по кредит. 10 000-те хиляди също.
Ако имаш апартамент, но можеш да спестиш от енергия – сменаш дограми и санираш с този доход.
Ако имаш бизнес или познания в някоя област – инвстираш там. Дали ще са ETF-и, дали ще е черешова градина или крипто, няма значение. Инвстираш в това, което разбираш.
На „инвеститори“ бъркащи инвестицията със спестяванията, препоръчвам инвестиционно злато.
За всички останали – препоръчвам инвестиция в себе си – екскурзии, почивки, курсове за квалификация в област, която Ви е интересна. С 1 000 лева на месец или 10 000 в брой – толкова.
За по-големи суми и по-сериозни инвестиции си трябва лична среща. Не става с прочитането на една статия. Става с бизнес план и сметки.
Ако Ви е харесала статята, моля споделете я във ФБ и помогнете на блога да се развие
Моля използвайте приложената форма за записване на час за среща
[contact-form-7]
Д-р Славяна Галева е акушер-гинеколог, дипломиран специалист от King’s College Hospital в областта на майчино-феталната медицина. Завършила е и обучение в областта на медицинската генетика и имунология в Harvard Medical School. В момента е началник на отделението по фетална медицина във Втора САГБАЛ „Шейново“ и преподавател в СУ „Св. Климент Охридски“.
В момент, в който публичният разговор за качеството на здравеопазването сякаш най-после е започнал, говорим с нея за качеството на родилната помощ в България. Страната ни е сред водещите по детска смъртност в Европейския съюз, както и по дял на ражданията чрез цезарово сечение. В същото време по темата се говори само когато по медиите избухне скандал, най-често след нечия смърт.
С д-р Славяна Галева разговаря Надежда Цекулова.
Д-р Галева, Вие сте сред критичните гласове в гилдията Ви. Къде да търсим корена на проблемите в родилната помощ според Вас?
Сега ще разкажа една история от моя личен живот. Моята сестра преди 11 години ражда в голям областен град. Тя е дентален лекар, специалист по орална хирургия. Ражда навръх Великден, малко след полунощ. Бебето е добре, но при сестра ми се получава усложнение, което може да се получи при всяка раждаща жена – задържа се плацентата. Дежурният лекар трябва да извърши животоспасяваща процедура, която обаче е и животозастрашаваща и се извършва под упойка. Трябва да се извади спешно плацентата, защото започва масивно кървене с обем половин литър в минута и пациентката изпада в тежко състояние.
Акушерката на смяна е в напреднала възраст, с бастун. Анестезиологът, който е един за цялата болница, в този момент е в животоспасяваща операция на друг човек. И гинекологът, който води раждането, извършва манипулацията без упойка. Изважда някакъв невероятен късмет. Все пак е и с доста опит. И слава богу, въпреки тежкото състояние, сестра ми е спасена.
Този гинеколог е нашата майка.
Разказвам тази история, защото тя завърши щастливо, но ако не беше? Когато си лекар, поставен си в тези условия, кой би понесъл отговорност, ако детето ти умре, докато водиш раждането му? Кой ще е виновен?
Когато говорим за качество в медицината, в случая в родилната помощ, често засягаме големи теми. Но то се състои в това как колегите на терен се справят с трудните ситуации в работата.
Медицинските стандарти и правилата за добра медицинска практика не следва ли да дават насоки точно за това?
Да, би трябвало. Но на практика не се случва и въпросът е защо. Спекулира се, че лекарите не искат да работят по правила. Аз съм минала през абсолютно всички нива – от санитар, докато бях студент, през медицинска сестра, специализант, лекар-специалист. Няма лекар, когото да познавам, който да не иска да работи по протокол. Не е вярно и твърдението, че липсата на ясни правила ни пази от съдебни дела – точно обратното е. През 2022 г. излезе една публикация на адв. Величка Костадинова, която анализира делата в сферата на акушерството и гинекологията. Това е втората най-често съдена специалност и тази с най-висок дял уважени искове – над 60%. Проблемът е, че това не води до промени в стандартите или до въвеждане на по-прецизни правила.
Ако лекарите искат да работят по ясни правила и пациентите искат лекарите им да работят по ясни правила, а дори председателят на Българския лекарски съюз беше обявил на един форум, че съсловната организация е в дълг, защото още не е готова с изготвянето на правилата за добра медицинска практика, как така сме в ситуацията десетилетия наред такива ясни правила да не могат да бъдат изработени, приети и приложени?
Личното ми мнение е, че има страх. Защото ако утре се въведат тези ясни, но и строги правила, за които говорим, първите, които ще възнегодуват, ще са пациентите. Например много голям дял – над половината – от бременните, които идват при нас за болничен, всъщност нямат нужда от него. Следващите, които ще са против, са лекари, които прилагат методи, неосновани на доказателства. В нашата сфера, примерно, се предлагат витаминотерапия, ембрионална реанимация…
Ембрионална реанимация?
Да. Това е измислена медицина и ако имахме адекватни правила, не би могло да съществува. Но сега е много печеливш бизнес. Следващият бизнес, който е печеливш, са лабораториите. Давам пример: в София имаме на година около 15 000 раждащи жени. Над половината са си направили изследването за тромбофилия, а по света около 1% от жените се насочват към него. При 400 лв. цена на изследване… След това отиваме при хранителните добавки. Всички тези практики биха били невъзможни при ясни правила, чието прилагане се контролира безпристрастно.
Такива обществени нагласи обаче не се създават от само себе си, без участието на специалистите. Липсата на стандарти също не може да се поддържа десетилетия без съгласието на специалистите.
Участват един тесен сегмент специалисти, които са повече администратори, отколкото лекари. Как да направиш промяна, когато нямаш подкрепа от управлението за това, което правиш? Ето, ние [II САГБАЛ „Шейново“ – б.а.] чакаме Столичната община да реши дали това, което сме изградили, ще бъде съхранено, или ще бъде разрушено. В Комисията по здравеопазване на Столичния общински съвет има само един лекар, който през годините обаче не е показал отношение към качеството. На какво да се надяваме?
Към Министерството на здравеопазването пък може да се отправи въпросът по какви критерии се избират членовете на експертните съвети. А директорите на лечебните заведения?
Изобщо, най-лесно е да се търси вина у редовите лекари, но от тази позиция е трудно да правиш промени. Отне ни 10 години, за да изградим нашето отделение по фетална медицина. Аз съм единственият специалист с такава квалификация, който работи в общинска болница и е достъпен до всички. Но това не знам колко може да продължи. Нужни са хора в управлението с визия, които да подкрепят развитието на специалистите и на системата.
Как си представяте, че трябва да стане това?
Трябва да се започне от студентската скамейка. Давам веднага пример със скандинавските страни. Чували ли сте за професията „професионален пациент“? Там тя съществува. Има хора, на които се плаща, за да може в определени дни в годината да ги извикат и да ги преглеждат студенти, които да се учат върху тях. Така започва изграждането на качествени специалисти.
Следващата точка е как привличаме повече хора към тези професии. Доц. Диана Димитрова, която е преподавател по здравни грижи, споделя, че всяка година във Варна и във Велико Търново отварят 100 места за акушерки, но попълват 20. Едно проучване сочи, че младите момичета намират професията за непривлекателна заради комбинацията от висока отговорност, нощен труд и ниско заплащане. В същото време при нас например 2/3 от акушерките са над 70-годишни.
После идват контролът на качеството и продължаващото обучение. Във Великобритания, където имам опит, държавата инвестира в специалиста и го контролира. За всеки специалист има статистика. Контролиращият орган знае, че д-р Галева например е извършила за годината 2000 прегледа, знае и от тях колко пъти е сбъркала. Така беше при проф. Николаидес, при когото се обучавах. Вика те комисията и ти казва: „Имаш неправилно извършени измервания.“ Това не се прави като лов на вещици – специалистът се изпраща на допълнително обучение, което държавата му заплаща, за да може той да повиши качеството си на работа.
При нас, за съжаление, не се извършва нито една от двете дейности. Аз решавам да инвестирам в себе си, да ходя на курсове – и съответно да си ги плащам. Също така никой не отива в болниците с 90% цезарови сечения, за да провери защо резултатите са такива. Разчита се на самоконтрол.
Каква е ролята на пациентите, в случая с родилната помощ – на бъдещите майки, в усилията за подобряване на качеството? Попадам на публикации, включително претендиращи за научност, в които се твърди, че родилките са виновни за високия дял на ражданията с цезарово сечение. Аз не мога да се съглася с подобна констатация.
Комбинирани са нещата. Насложеното недоверие към специалистите у нас налага избора на екип. А изборът на екип, когато един лекар и една акушерка са силно натоварени, води до този резултат. Защото едно нормално раждане обикновено продължава повече, може да продължи много часове и дори дни – и няма специалист, който може да отдели това време. Жената често избира секциото заради недоверието към другите специалисти, при които би могла да попадне, а не заради предпочитанията си към този метод на родоразрешение.
От изследването на д-р Румен Велев в нашата болница се вижда и друго – ако една жена избере акушерка за раждането си, вероятността да роди нормално е 80%. Ако избере лекар, шансовете за това драстично намаляват. В по-малките клиники пък няма достатъчно хора, които да са на разположение за цялото време на едно нормално раждане, затова предпочитат цезаровите сечения.
Въвеждането на акушерски модел на грижа за бременни и раждащи жени се сочи като оптимален вариант за подобряване на качеството в родилната помощ. У нас не изглежда да сме близо до такова решение, но болницата, в която работите, се опитва частично да го прилага. Бихте ли разказали как става това?
При нас акушерките следят бременността и пациентката може да ги избира и за раждане. Разбира се, определени прегледи се извършват от лекар. Но ето днес например три от пациентките ми са избрали да следят бременността си при акушерка. Аз правя високоспециализиран преглед, на който тези жени идват с избраната акушерка. Тя, така да се каже, си ги води за ръка, обсъждат си неща, за които конкретно акушерката може да помогне. Аз правя феталната морфология, но допълнителната информация и подкрепа, която жените получават от акушерката, за мен също е от много голяма помощ. В рамките на няколко години направихме доста добро стиковане и изградихме много ясен протокол за действие. Но това е система, която се поддържа с непрекъснато самоусъвършенстване и обучения.
Как се финансират техните прегледи? От 2022 г. държавата плаща повече прегледи за здравно неосигурени бременни и един болничен престой. Високоспециализираните изследвания, които Вие правите, не са включени в този пакет.
Този разход се поема от болницата. Но това не е устойчиво и в този смисъл – не е точно здравеопазване. Това е благотворителност.
Имате ли данни какъв е делът на жените, които минават за сметка на болницата през Вашия кабинет?
Около 50%. Около 2000 жени минават годишно, от тях тези, които са по платен ценоразпис на Касата, са около 50%.
Вероятно не печелите особено много от тази дейност?
Да, това ми е хоби (смее се). Работя частно, за да си финансирам хобито. Например не си използвах майчинството след второто раждане, защото трябва да се изплаща апаратът, с който преглеждам в частния си кабинет. Понякога си мисля, че съм много лоша майка, но не бих искала да задълбаваме в това.
Защо, хубаво е да се знае, че когато системата е в колапс, функционирането ѝ се крепи на личните усилия на работещите в нея.
Не искам да звучи като оплакване. В същото време ние почваме в 7 ч. сутринта с акушерка Топалова. Тя е на 75, докога е длъжна да издържа на това темпо?
Когато личната цена да вършиш една работа е твърде висока, хората просто не се наемат да я вършат. И така се връщаме там, където започнахме разговора – нужни са системни усилия и визионерство. Хората отлично го разбират. Имам предвид пациентите, работещите в системата лекари и акушерки. Защото често ни представят като срещуположни лагери, а не сме. Ние сме едно.
През последните четири години пътувах и живях на различни места из Севера – Норвегия, Исландия, Фарьорските острови и Гренландия. Ще започна разказите си с най-отдалечения остров, който ме впечатляваше години наред и изглеждаше някак загадъчен и недостижим. През годините любопитството ми нарастваше, а аз самата, от остров на остров, все повече се доближавах до него. Докато накрая ми се отвори възможност не само да посетя Гренландия, но и да живея и работя там – в едно инуитско селце зад Полярния кръг.
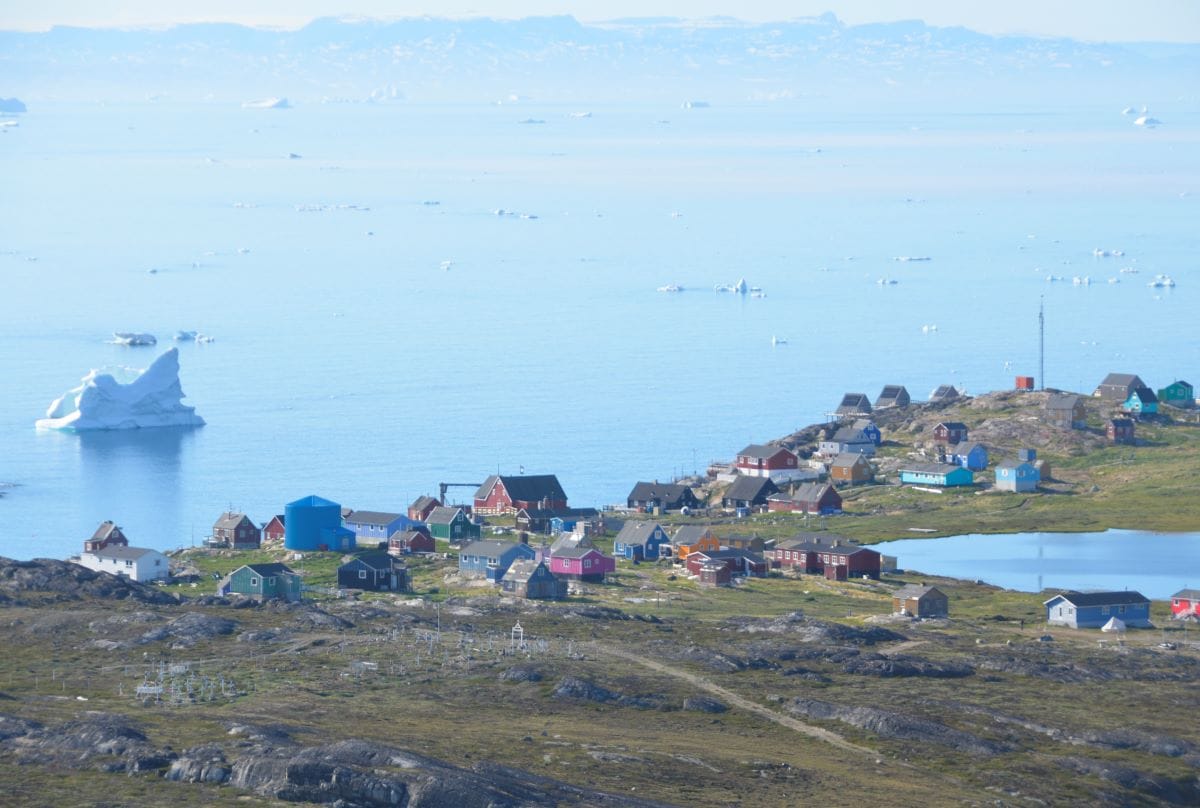
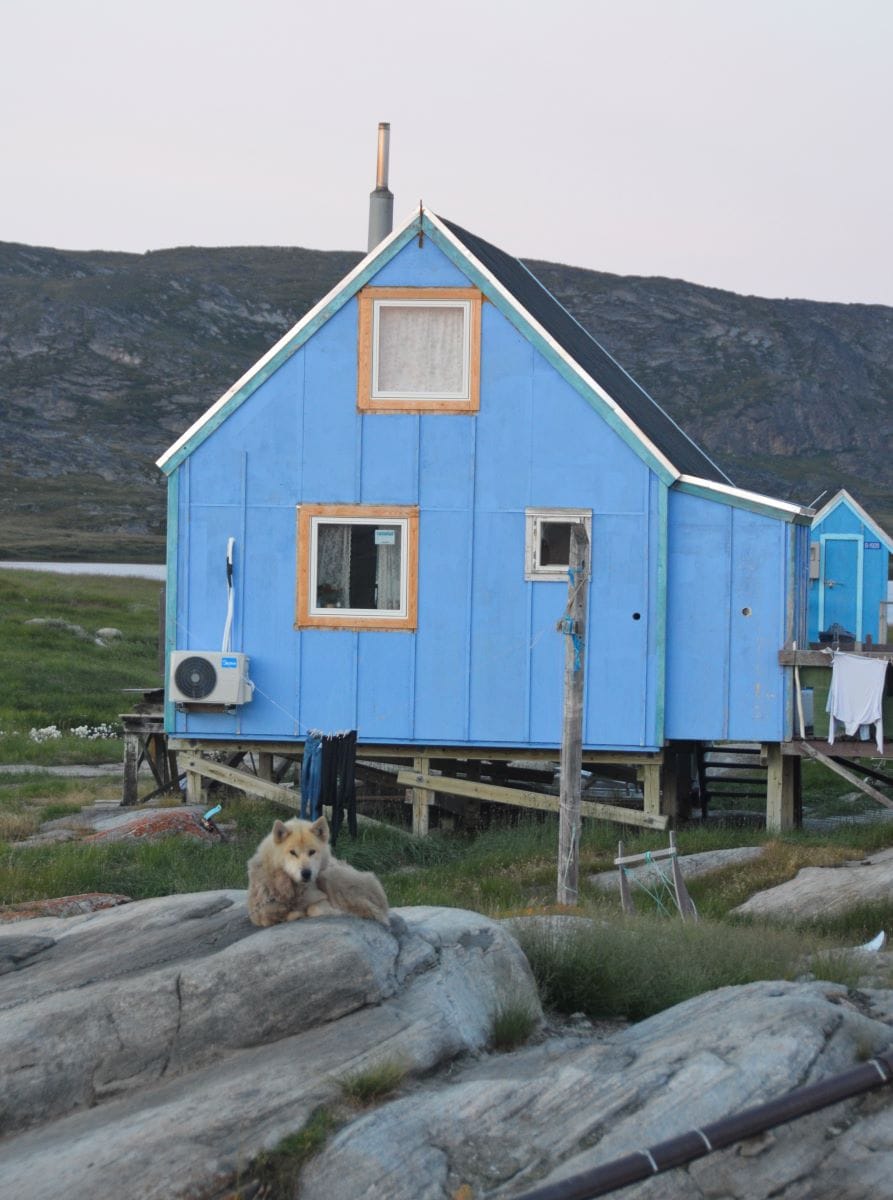
В Гренландия е късна вечер, а слънцето упорито пече високо над хоризонта. Няма да залезе поне два месеца. От прозореца ми се белеят безброй късове лед, по-големите не помръдват, приличат на плаващи къщи, пуснали котва. Яркосинята повърхност на водата проблясва срамежливо, докато не се усили в ослепителен блясък в центъра на слънчевата пътека. Отвън се чуват птички, а днес съзрях две, които никога не бях виждала преди, като че долетели от друг свят. Топло е, но подухва прохладен морски бриз с лек мирис на разтапящ се в океана лед. Намирам се в едно малко, сякаш забравено от останалия свят селище, на ръба на дълъг фиорд, претъпкан с ледове. Те се откъсват, спускат се и се сгромолясват в океана.
Това написах първата вечер, прекарана в Илиманак, на западното крайбрежие на Гренландия.
Но нека започна отначало: Гренландия е най-големият остров в света с площ 2 млн. км2, което е почти 20 пъти колкото България или приблизително 1/5 от Европа. По-голямата част е покрита с дебел слой лед, достигащ до 3000 м височина, докато заселените места се намират по крайбрежието, основно по югозападното и малко по източното.
Населението за сметка на това е едва около 57 000 души, почти колкото населението на Велико Търново.
В продължение на векове Гренландия е под властта на Дания, но през 1979 г. е обявена за автономна област на Кралство Дания, а през 2009 г. си извоюва още по-голяма самостоятелност. Столица е Нуук, със старо датско име Готхоб, а другите два най-големи града са Сисимиут, разположен точно на Полярния кръг, 66-ти паралел, и Илюлисат, в залива Диско, на 69-ти паралел. Знамето е в червено и бяло, за да символизира връзката с Дания, а формата в центъра напомня залязващото в океана слънце. На герба е изобразен най-големият бозайник на острова – бялата мечка.
Гренландия е едно огромно бяло поле. Тя е слабо изследвана, слабо населена, слабо обработена. Една от малкото части на Северното полукълбо, на чиито географски карти има места с надпис unexplored – неизследвани, следователно незасегнати от човешко присъствие. От една страна, неизвестността плаши и отблъсква, а от друга, възбужда интереса толкова много, че опознаването, прекосяването, „очовечаването“, наименуването, а и постепенното застрояване се превръщат във фетиш.
Затова едно време викингите, мореплавателите и полярните изследователи са трасирали света и са достигали неподозирани дотогава места на планетата. Целите им са били разширяване на границите, достъп до нови богатства, а по-късно – и развитие на науката. При всички обаче водещо е било желанието за откриване и обуздаване на чуждото, за укротяване на дивото в новите земи: някои – кипящи от живот, плодородни, изобилстващи от непознати дарове, а други – стягащи в ледената си хватка дръзналите да ги покорят, докато безмилостните ветрове помитали шейни, кораби и самолети, пазейки ревниво териториите си.
Първият, дръзнал да покори остров Гренландия, е младият полярен изследовател Фритьоф Нансен. Едва преди 134 години норвежецът предприема тази експедиция заедно с петимата си другари. С цената на неимоверни усилия те се справят и прекосяват онова „отвъд“, което будело любопитството на много поколения. Имало предположения, че някъде там, зад онези грамадни и страшни ледени маси, има райски кът – обрасъл в трева, плодороден и подходящ за живот. Но истината е коренно различна. Около 80% от площта на Гренландия е вековен лед – бяла пустиня със сух климат и оскъдни валежи, която бавно, но сигурно изтича в океана.
Защо обаче ледниците се движат и как това отдалечено място може да е подходящо за живот?
Ледът в Гренландия представлява огромна, тежка маса и заради гравитацията се спуска под формата на огромни ледникови езици през пробойните на крайбрежните планини. Поради разликата в температурата, между леда и земята се образува тънък слой вода. Този слой значително намалява сцеплението със земната повърхност, което кара леда да се плъзга, задействан от силата на собствената си тежест. Когато достигне водната повърхност, той се отчупва, тъй като вече няма опора.
Например фиордът Кангиа, дълъг 80 км и широк 7 км, който разделя град Илюлисат от село Илиманак в Западна Гренландия, представя нагледно как отчупените ледове в най-вътрешната част на водното образувание започват бавно да се носят по повърхността на водата. Година по-късно те достигат устието на фиорда и тръгват по свой път в открито море. Съществуват хипотези, основани на изучаването на океанските течения, че ледникът, повалил кораба „Титаник“ през 1912 г. е „роден“ именно в Кангиа.
От птичи поглед фиордът изглежда чисто бял, защото е изпълнен с различни по размер късове лед. Ако човек се опита да стъпи върху някоя ледена буца обаче, тя, естествено, ще поддаде. Най-високите айсберги достигат височина 100 м над морското равнище, което означава, че останалите 90% ледена маса са под водата. Възможно е благодарение на дълбочината, надхвърляща 1000 м, а това позволява безпрепятственото плаване на грамадите. Те се носят славно по течението и чрез движението си „разбъркват“ водата, създавайки активност сред фауната там. Движението предизвиква размножаване на малките морски организми, което привлича риби, тюлени и китове, а това от своя страна прави района богат на морски улов и подходящ за заселване.
Движението на ледниците в океана е наистина впечатляващо. Една късна вечер написах в джобното си тефтерче следното:
Вечерта останах за малко навън. Наоколо цареше почти пълна тишина. Гъста мъгла загръщаше селото и прозираха очертанията на най-близките къщи. Леко клокочеше само ручеят, спускащ се в морето. И изведнъж – тряс! – като че гръмотевица разцепи небето, прогърмя и се разплиска във водата. След няколко секунди гръмна отново. Огромният ледник, който от седмица стоеше заклещен недалеч от пристанището, се беше разрушил. През мъглата обаче не се виждаше нищичко. Обикновено когато ледникът се чупи, се получава нещо като взрив. Хилядите малки балончета въздух в леда изведнъж се пръсват и отдалеч изглежда, сякаш някой е поставил експлозив във вътрешността. Оттам откъсналото се парче се спуска във водата и предизвиква вълна, която в зависимост от размерите е способна да задейства и цяло цунами. Понякога морето наоколо се напълва с множество малки отломки, разпилели се заради подобни мащабни експлозии. Така пресичането на фиорда от Илиманак до Илюлисат отнема повече време, тъй като се налага да се обикаля или да се кара направо измежду ледниците, но по-бавно, за да не се пропука корпусът на ферибота. И двата варианта обаче предоставят възможност за по-дълго пътуване в океана, а това е великолепно.
Често при пътуванията ни с ферибота между селото и големия град събирахме с кеп парчета лед, които разглеждахме с интерес. Този лед изглеждаше по-специален от обикновения, който всеки замразява у дома. Той беше пълен със ситни балончета с въздух. По-късно научих, че се образуват, когато снегът се натрупва върху старите слоеве, впоследствие сляга и се превръща във все по-твърда маса. По време на този процес въздухът между снежинките проправя пътя си навън. Но все пак малък процент от него остава и с натрупването на новите слоеве няма къде да отиде, при което се задържа консервиран в леда. Когато въпросният лед достигне океана, отчупи се от общата маса и заплава във водата, той постепенно се разтапя, а балончетата се освобождават от вековната клетка. Затова и щом сложим парче ледников лед в чаша вода, може да се чуе едва осезаемо съскане – освобождаването на балончетата с въздух.
Тези миниатюрни капсули съдържат безценна информация за времето, в което са се образували,
а именно за съдържанието на въздуха, температурата и наличието на фини прахови частици от вулканични изригвания или други природни феномени. Днес по средата на гренландския ледник е изградена научна база, която сондира леда на километри дълбочина, изважда хиляди метри лед във формата на цилиндър и изследва въздуха от балончетата, съхранени във времето. Това дава сведения за миналото на планетата и температурните разлики през годините, за климата и отлагането на вулканичен прах по повърхността. Самата научна база всъщност е в постоянно движение. Тъй като ледникът се придвижва бавно от центъра към периферията, същото важи и за базата върху него – като бръмбар върху костенурка.
Всеки път, когато плавахме измежду ледовете в океана, усещах особен мирис – на студено и свежо, на чисто и бистро. Едно момиче ми каза, че така миришели ледниците – освобождавали се всички онези затворени в леда балончета въздух от едно време. Вдишвахме история. И изведнъж:
Тряс!
Следва: В селото на име Илиманак, в което прекарах няколко месеца, живеят петдесетина гренландци. Пристигайки, човек се изкачва по стръмен кей, около който се клатушкат навързани множество лодки. Досами кея се вижда магазин и в него се продава всичко – от мляко и ябълки до въдици и пушки. За няколкото деца в селото е учредено училище с местна учителка. Съвсем наблизо е и селската баня, служеща едновременно и за перално помещение, фитнес зала и кафене. Банята работи с купони за душовете, които служител перфорира преди всяко къпане. Често същата сграда, обединяваща множество функции, се превръща в място за спонтанни срещи…
Version 21 of LineageOS,
an Android-based distribution, has been released.
With all that said, we have been working extremely hard since
Android 14’s release last October to port our features to this new
version of Android. Thanks to our hard work adapting to Google’s
largely UI-based changes in Android 12/13, and Android 14’s
dead-simple device bring-up requirements, we were able to rebase
our changes onto Android 14 much more efficiently.
This lets us spend some much overdue time on our apps suite!
Applications such as Aperture had their features and UX improved
significantly, while many of our aging apps such as Jelly, Dialer,
Contacts, Messaging, LatinIME (Keyboard), and Calculator got near
full redesigns that bring them into the Material You era!
This post from last year was posted to a forum, so I thought I’d write up some rebuttals to their comments.
The first comment is by David Chisnall, creator of CHERI C/C++, which proposes we can solve the problem with CPU instruction set extensions. It’s a good idea, but after 14 years, CPUs haven’t had their instruction-sets upgraded. Even mainstream RISC V processors haven’t been created using those extensions.
Chisnall: “If your safety requires you to insert explicit checks, it’s not safe“. This is true from one perspective, false from another. My proposal includes compilers spitting out warnings whenever bounds information doesn’t exist.
C is full of problems in theory that doesn’t exist in practice because the compiler spits out warnings telling programmers to fix the problem. Warnings can also note cases where programmers probably made mistakes. We can’t achieve perfect guarantees, because programmers can still make mistakes, but we can certainly achieve “good enough”.
Chisnall: ….tread safety….. I’m not sure I full understand the comment. I understand that CHERI can guarantee atomicity of bounds checking, which would require multiple (interruptible) instructions otherwise. The number of cases where this is a problem, and the C proposal would be no worse than other languages like Rust.
Chisnall: Temporal safety…. A lot of Rust “ownership” techniques can be applied to C with these annotations, namely, marking which variables OWN allocated memory and which simply BORROW it. I’ve reviewed a lot of famous use-after-free and double-free bugs, and most can be trivially fixed by annotation.
Chisnall: If you are writing a blog never having actually tried to make large (million line or more) C codebases memory safe, you probably underestimate the difficulty by at least one order of magnitude.I’m both a programmer who has written a million lines of code in my lifetime as well as a hacker with decades of experience looking for such bugs. The goal isn’t to pursue the ideal of 100% safe language, but of getting rid of 99% of safety errors. 1% less safe makes the goal an order of magnitude easier to reach.
snej: This post seems to epitomize the common engineer trait of seeing any problem you haven’t personally worked on as trivial. Sure bro, you’ll add a few patches to Clang and GCC and with those new attributes our C code will be safe. It’ll only take a few weeks and then no one will need Rust anymore. But I’ve spent decades working on this. The comment epitomizes the common trait of not realizing how much thought and expertise is behind the post. I few patches to clang and GCC will make make C safer. The solution is far less safe than Rust. In fact, my proposal makes code more interoperable and translatable into Rust. Right now, translating C into Rust creates just a bunch of ‘unsafe’ code that needs to be cleaned up. With such annotations, in a refactoring step using existing testing frameworks, results in code that can no be auto-translated safely in to Rust.
As for existing clang/gcc attributes, there are only a couple that match the macros I propose. They dod show how trivial it would be to actually go further.
danso: In addition to the criticisms I share with everyone else, I found this to be one of the most “talk is cheap, show me the code” posts I’ve ever read. The reason I wrote the post is because learning clang/gcc internals is a long process, and when asking for help, I needed something to point to “this is what I’m trying to achieve”. I’m not trying to communicate what other people should do, I’m communicating what I’m trying to do. I still don’t know clang/gcc internals enough to even get started … any pointers would be helpful.
In January, we experienced three incidents that resulted in degraded performance across GitHub services.
January 09 12:20 UTC (lasting 140 minutes)
On January 9 between 12:20 and 14:40 UTC, services in one of our three sites experienced elevated latency for connections. This led to a sustained period of timed-out requests across a number of services, including but not limited to our Git backend. An average of 5% and max of 10% of requests failed with a 5xx response or timed out during this period.
This was caused by an upgrade of hosts, which led to temporarily reduced capacity as the upgrade rolled through the fleet. While these hosts had plenty of capacity to handle the increased load, we found that the configured connection limit was lower than it should have been. We have increased that limit to prevent this from recurring. We have also identified improvements to our monitoring of connection limits and behavior and changes to reduce the risk of host upgrades leading to reduced capacity.
January 21 02:01 UTC (lasting 7 hours 3 minutes)
On January 21 at 2:01 UTC, we experienced an incident that affected customers using GitHub Codespaces. Customers encountered issues creating and resuming Codespaces in multiple regions due to operational issues with compute and storage resources.
Around 25% of customers were impacted, primarily in East US and West Europe. We re-routed traffic for Codespace creations to less impacted regions, but existing Codespaces in these regions may have been unable to resume during the incident.
By 7:30 UTC, we had recovered connectivity to all regions except West Europe, which had an extended recovery time due to increased load in that particular region. The incident was resolved on January 21 at 9:34 UTC once Codespace creations and resumes were working normally in all regions.
We are working to improve our alerting and resiliency to reduce the duration and impact of region-specific outages.
January 31 12:30 UTC (lasting 147 minutes)
On January 31, we deployed an infrastructure change to our load balancers in preparation towards our longer term goal of IPv6 enablement at GitHub.com. This change was deployed to a subset of our global edge sites. The change had the unintended consequence of causing IPv4 addresses to start being passed as an IPv4-mapped IPv6-compatible address (for example, 10.1.2.3 became ::ffff:10.1.2.3) to our IP Allow List functionality. While our IP Allow List functionality was developed with IPv6 in mind, it wasn’t developed to handle these mapped addresses, and hence, started blocking requests as it deemed these to be not in the defined list of allowed addresses. Request error rates peaked at 0.23% of all requests.
In addition to changes deployed to remediate the issues, we have taken steps to improve testing and monitoring to better catch these issues in the future.
Please follow our status page for real-time updates on status changes and post-incident recaps. To learn more about what we’re working on, check out the GitHub Engineering Blog.
Gunnar has been a steadfast contributor to Ubuntu and Debian for well over a decade. His work around translation and localization efforts has helped enable people from around the world to use and enjoy the software that we all love. It goes without saying that people like Gunnar are the foundation of our community, and his passing is a tremendous loss.
The Fedora Project is working toward the release
of Fedora Linux 40, and (as with each release) that means changes
to the way the project works and the software included in its repositories. Most
of the changes
set for Fedora 40 are uncontroversial, but one change is causing quite
a stir. The KDE Special Interest Group’s (SIG) proposal to adopt KDE Plasma 6 with only Wayland session support, which it interpreted as a mandate to block any X11 packages for Plasma. Others saw it as overreach by the SIG, and an attempt to block users and contributors from maintaining software they needed.
The Common Vulnerabilities and
Exposures (CVE) system was set up in 1999 as a way to refer
unambiguously to known vulnerabilities in software. That system has found
itself under increasing strain over the years, and numerous projects have
responded by trying to assert greater control over how CVE numbers are
assigned for their code. On February 13, though, a big shoe dropped when
the Linux kernel project announced
that it, too, was taking control of CVE-number assignments. As is often
the case, though, the kernel developers are taking a different approach to
vulnerabilities, with possible implications for the CVE system as a whole.
I’m giving a keynote on “AI and Trust” at Generative AI, Free Speech, & Public Discourse. The symposium will be held at Columbia University in New York City and online, at 3 PM ET on Tuesday, February 20, 2024.
I’m speaking (remotely) on “AI, Trust and Democracy” at Indiana University in Bloomington, Indiana, USA, at noon ET on February 20, 2024. The talk is part of the 2023-2024 Beyond the Web Speaker Series, presented by The Ostrom Workshop and Hamilton Lugar School.
In November 2023, we announced the launch of code scanning autofix, leveraging AI to suggest fixes for security vulnerabilities in users’ codebases. This post describes how autofix works under the hood, as well as the evaluation framework we use for testing and iteration.
What is code scanning autofix?
GitHub code scanning analyzes the code in a repository to find security vulnerabilities and other errors. Scans can be triggered on a schedule or upon specified events, such as pushing to a branch or opening a pull request. When a problem is identified, an alert is presented to the user. Code scanning can be used with first- or third-party alerting tools, including open source and private tools. GitHub provides a first party alerting tool powered by CodeQL, our semantic code analysis engine, which allows querying of a codebase as though it were data. Our in-house security experts have developed a rich set of queries to detect security vulnerabilities across a host of popular languages and frameworks. Building on top of this detection capability, code scanning autofix takes security a step further, by suggesting AI-generated fixes for alerts. In its first iteration, autofix is enabled for CodeQL alerts detected in a pull request, beginning with JavaScript and TypeScript alerts. It explains the problem and its fix strategy in natural language, displays the suggested fix directly in the pull request page, and allows the developer to commit, dismiss, or edit the suggestion.
The basic idea behind autofix is simple: when a code analysis tool such as CodeQL detects a problem, we send the affected code and a description of the problem to a large language model (LLM), asking it to suggest code edits that will fix the problem without changing the functionality of the code. The following sections delve into some of the details and subtleties of constructing the LLM prompt, processing the model’s response, evaluating the quality of the feature, and serving it to our users.
The autofix prompt
At the core of our technology lies a request to an LLM, expressed through an LLM prompt. CodeQL static analysis detects a vulnerability, generating an alert that references the problematic code location as well as any other relevant locations. For example, for a SQL-injection vulnerability, the alert flags the location where tainted data is used to build a database query, and also includes one or more flow paths showing how untrusted data may reach this location without sanitization. We extract information from the alert to construct an LLM prompt consisting of:
General information about this type of vulnerability, typically including a general example of the vulnerability and how to fix it, extracted from the CodeQL query help.
The source-code location and content of the alert message.
Relevant code snippets from the locations all along the flow path and any code locations referenced in the alert message.
Specification of the response we expect.
We then ask the model to show us how to edit the code to fix the vulnerability.
We describe a strict format for the model output, to allow for automated processing. The model outputs Markdown consisting of the following sections:
Detailed natural language instructions for fixing the vulnerability.
A full specification of the needed code edits, following the format defined in the prompt.
A list of dependencies that should be added to the project, if applicable. This is needed, for example, if the fix makes use of a third-party sanitization library on which the project does not already depend.
We surface the natural language explanation to users together with the code scanning alert, followed by a diff patch constructed from the code edits and added dependencies. Users can review the suggested fix, edit and adjust it if necessary, and apply it as a commit in their pull request.
Pre- and post-processing
If our goal were to produce a nice demo, this simple setup would suffice. Supporting real-world complexity and overcoming LLM limitations, however, requires a combination of careful prompt crafting and post-processing heuristics. A full description of our approach is beyond the scope of this post, but we outline some of the more impactful aspects below.
Selecting code to show the model
CodeQL alerts include location information for the alert and sometimes steps along the data flow path from the source to the sink. Sometimes additional source-code locations are referenced in the alert message. Any of these locations may require edits to fix the vulnerability. Further parts of the codebase, such as the test suite, may also need edits, but we focus on the most likely candidates due to prompt length constraints.
For each of these code locations, we use a set of heuristics to select a surrounding region that provides the needed context while minimizing lines of code, eliding less relevant parts as needed to achieve the target length. The region is designed to include the imports and definitions at the top of the file, as these often need to be augmented in the fix suggestion. When multiple locations from the CodeQL alert reside in the same file, we structure a combined code snippet that gives the needed context for all of them.
The result is a set of one or more code snippets, potentially from multiple source-code files, showing the model the parts of the project where edits are most likely to be needed, with line numbers added so as to allow reference to specific lines both in the model prompt and in the model response. To prevent fabrications, we explicitly constrain the model to make edits only to the code included in the prompt.
Adding dependencies
Some fixes require adding a new project dependency, such as a data sanitation library. To do so, we need to find the configuration file(s) that list project dependencies, determine whether the needed packages are already included, and if not make the needed additions. We could use an LLM for all these steps, but this would require showing the LLM the list of files in the codebase as well as the contents of the relevant ones. This would increase both the number of model calls and the number of prompt tokens. Instead, we simply ask the model to list external dependencies used in its fix. We implement language-specific heuristics to locate the relevant configuration file, parse it to determine whether the needed dependencies already exist, and if not add the needed edits to the diff patch we produce.
Specifying a format for code edits
We need a compact format for the model to specify code edits. The most obvious choice would be asking the model to output a standard diff patch directly. Unfortunately, experimentation shows that this approach exacerbates the model’s known difficulties with arithmetic, often yielding incorrect line number computations without enough code context to make heuristic corrections. We experimented with several alternatives, including defining a fixed set of line edit commands the model can use. The approach that yielded the best results in practice involves allowing the model to provide “before” and “after” code blocks, demonstrating the snippets that require changes (including some surrounding context lines) and the edits to be made.
Overcoming model errors
We employ a variety of post-processing heuristics to detect and correct small errors in the model output. For example, “before” code blocks might not exactly match the original source-code, and line numbers may be slightly off. We implement a fuzzy search to match the original code, overcoming and correcting errors in indentation, semicolons, code comments, and the like. We use a parser to check for syntax errors in the edited code. We also implement semantic checks such as name-resolution checks and type checks. If we detect errors we are unable to fix heuristically, we flag the suggested edit as (partially) incorrect. In cases where the model suggests new dependencies to add to the project, we verify that these packages exist in the ecosystem’s package registry and check for known security vulnerabilities or malicious packages.
Evaluation and iteration
To make iterative improvements to our prompts and heuristics while at the same time minimizing LLM compute costs, we need to evaluate fix suggestions at scale. In taking autofix from demo quality to production quality, we relied on an extensive automated test harness to enable fast evaluation and iteration.
The first component of the test harness is a data collection pipeline that processes open source repositories with code scanning alerts, collecting alerts that have test coverage for the alert location. For JavaScript / TypeScript, the first supported languages, we collected over 1,400 alerts with test coverage from 63 CodeQL queries.
The second component of the test harness is a GitHub Actions workflow that runs autofix on each alert in the evaluation set. After committing the generated fix in a fork, the workflow runs both CodeQL and the repository’s test suite to evaluate the validity of the fix. In particular, a fix is considered successful only if:
It removes the CodeQL alert.
It introduces no new CodeQL alerts.
It produces no syntax errors.
It does not change the outcome of any of the repository tests.
As we iterated on the prompt, the code edit format, and various post-processing heuristics, we made use of this test harness to ensure that our changes were improving our success rate. We coupled the automated evaluations with periodic manual triage, to focus our efforts on the most prevalent problems, as well as to validate the accuracy of the automated framework. This rigorous approach to data-driven development allowed us to triple our success rate while at the same time reducing LLM compute requirements by a factor of six.
Architecture, infrastructure, and user experience
Generating useful fixes is a first step, but surfacing them to our users requires further front- and back-end modifications. Designing for simplicity, we’ve built autofix on top of existing functionality wherever possible. The user experience enhances the code scanning pull request experience. Along with a code scanning alert, users can now see a suggested fix, which may include suggested changes in multiple files, optionally outside the scope of the pull request diff. A natural language explanation of the fix is also displayed. Users can commit the suggested fixes directly to the pull request, or edit the suggestions in their local IDE or in a GitHub Codespace.
The backend, too, is built on top of existing code scanning infrastructure, making it seamless for our users. Customers do not need to make any changes to their code scanning workflows to see fix suggestions for supported CodeQL queries.
The user opens a pull request or pushes a commit. Code scanning runs as usual, as part of an actions workflow or workflow in a third-party CI system, uploading the results in the SARIF format to the code scanning API. The code scanning backend service checks whether the results are for a supported language. If so, it runs the fix generator as a CLI tool. The fix generator leverages the SARIF alert data, augmented with relevant pieces of source-code from the repository, to craft a prompt for the LLM. It calls the LLM via an authenticated API call to an internally-deployed API running LLMs on Azure. The LLM response is run through a filtering system which helps prevent certain classes of harmful responses. The fix generator then post-processes the LLM response to produce a fix suggestion. The code scanning backend stores the resulting suggestion, making it available for rendering alongside the alert in pull request views. Suggestions are cached for reuse where possible, reducing LLM compute requirements.
As with all GitHub products, we followed standard and internal security procedures, and put our architectural design through a rigorous security and privacy review process to safeguard our users. We also took precautions against AI-specific risks such as prompt injection attacks. While software security can never be fully guaranteed, we conducted red team testing to stress-test our model response filters and other safety mechanisms, assessing risks related to security, harmful content, and model bias.
Telemetry and monitoring
Before launching autofix, we wanted to ensure that we could monitor performance and measure its impact in the wild. We don’t collect the prompt or the model responses because these may contain private user code. Instead, we collect anonymized, aggregated telemetry on user interactions with suggested fixes, such as the percentage of alerts for which a fix suggestion was generated, the percentage of suggestions that were committed as-is to the branch, the percentage of suggestions that were applied through the GitHub CLI or Codespace, the percentage of suggestions that were dismissed, and the fix rate for alerts with suggestions versus alerts without. As we onboard more users onto the beta program, we’ll look at this telemetry to understand the usefulness of our suggestions.
Additionally, we’re monitoring the service for errors, such as overloading of the Azure model API or triggering of the filters that block harmful content. Before expanding autofix to unlimited public beta and eventually general availability, we want to ensure a consistent, stable user experience.
What’s next?
As we roll out the code scanning autofix beta to an increasing number of users, we’re collecting feedback, fixing papercuts, and monitoring metrics to ensure that our suggestions are in fact useful for security vulnerabilities in the wild. In parallel, we’re expanding autofix to more languages and use cases, and improving the user experience. If you want to join the public beta, sign up here. Keep an eye out for more updates soon!
To provide the best experiences, we use technologies like cookies to store and/or access device information. Consenting to these technologies will allow us to process data such as browsing behavior or unique IDs on this site. Not consenting or withdrawing consent, may adversely affect certain features and functions.
Functional
Always active
The technical storage or access is strictly necessary for the legitimate purpose of enabling the use of a specific service explicitly requested by the subscriber or user, or for the sole purpose of carrying out the transmission of a communication over an electronic communications network.
Preferences
The technical storage or access is necessary for the legitimate purpose of storing preferences that are not requested by the subscriber or user.
Statistics
The technical storage or access that is used exclusively for statistical purposes.The technical storage or access that is used exclusively for anonymous statistical purposes. Without a subpoena, voluntary compliance on the part of your Internet Service Provider, or additional records from a third party, information stored or retrieved for this purpose alone cannot usually be used to identify you.
Marketing
The technical storage or access is required to create user profiles to send advertising, or to track the user on a website or across several websites for similar marketing purposes.