Tag Archives: Expert (400)

Building end-to-end AWS DevSecOps CI/CD pipeline with open source SCA, SAST and DAST tools

Post Syndicated from Srinivas Manepalli original https://aws.amazon.com/blogs/devops/building-end-to-end-aws-devsecops-ci-cd-pipeline-with-open-source-sca-sast-and-dast-tools/

DevOps is a combination of cultural philosophies, practices, and tools that combine software development with information technology operations. These combined practices enable companies to deliver new application features and improved services to customers at a higher velocity. DevSecOps takes this a step further, integrating security into DevOps. With DevSecOps, you can deliver secure and compliant application changes rapidly while running operations consistently with automation.

Having a complete DevSecOps pipeline is critical to building a successful software factory, which includes continuous integration (CI), continuous delivery and deployment (CD), continuous testing, continuous logging and monitoring, auditing and governance, and operations. Identifying the vulnerabilities during the initial stages of the software development process can significantly help reduce the overall cost of developing application changes, but doing it in an automated fashion can accelerate the delivery of these changes as well.

To identify security vulnerabilities at various stages, organizations can integrate various tools and services (cloud and third-party) into their DevSecOps pipelines. Integrating various tools and aggregating the vulnerability findings can be a challenge to do from scratch. AWS has the services and tools necessary to accelerate this objective and provides the flexibility to build DevSecOps pipelines with easy integrations of AWS cloud native and third-party tools. AWS also provides services to aggregate security findings.

In this post, we provide a DevSecOps pipeline reference architecture on AWS that covers the afore-mentioned practices, including SCA (Software Composite Analysis), SAST (Static Application Security Testing), DAST (Dynamic Application Security Testing), and aggregation of vulnerability findings into a single pane of glass. Additionally, this post addresses the concepts of security of the pipeline and security in the pipeline.

You can deploy this pipeline in either the AWS GovCloud Region (US) or standard AWS Regions. As of this writing, all listed AWS services are available in AWS GovCloud (US) and authorized for FedRAMP High workloads within the Region, with the exception of AWS CodePipeline and AWS Security Hub, which are in the Region and currently under the JAB Review to be authorized shortly for FedRAMP High as well.

Services and tools

In this section, we discuss the various AWS services and third-party tools used in this solution.

CI/CD services

For CI/CD, we use the following AWS services:

  • AWS CodeBuild – A fully managed continuous integration service that compiles source code, runs tests, and produces software packages that are ready to deploy.
  • AWS CodeCommit – A fully managed source control service that hosts secure Git-based repositories.
  • AWS CodeDeploy – A fully managed deployment service that automates software deployments to a variety of compute services such as Amazon Elastic Compute Cloud (Amazon EC2), AWS Fargate, AWS Lambda, and your on-premises servers.
  • AWS CodePipeline – A fully managed continuous delivery service that helps you automate your release pipelines for fast and reliable application and infrastructure updates.
  • AWS Lambda – A service that lets you run code without provisioning or managing servers. You pay only for the compute time you consume.
  • Amazon Simple Notification Service – Amazon SNS is a fully managed messaging service for both application-to-application (A2A) and application-to-person (A2P) communication.
  • Amazon Simple Storage Service – Amazon S3 is storage for the internet. You can use Amazon S3 to store and retrieve any amount of data at any time, from anywhere on the web.
  • AWS Systems Manager Parameter Store – Parameter Store gives you visibility and control of your infrastructure on AWS.

Continuous testing tools

The following are open-source scanning tools that are integrated in the pipeline for the purposes of this post, but you could integrate other tools that meet your specific requirements. You can use the static code review tool Amazon CodeGuru for static analysis, but at the time of this writing, it’s not yet available in GovCloud and currently supports Java and Python (available in preview).

  • OWASP Dependency-Check – A Software Composition Analysis (SCA) tool that attempts to detect publicly disclosed vulnerabilities contained within a project’s dependencies.
  • SonarQube (SAST) – Catches bugs and vulnerabilities in your app, with thousands of automated Static Code Analysis rules.
  • PHPStan (SAST) – Focuses on finding errors in your code without actually running it. It catches whole classes of bugs even before you write tests for the code.
  • OWASP Zap (DAST) – Helps you automatically find security vulnerabilities in your web applications while you’re developing and testing your applications.

Continuous logging and monitoring services

The following are AWS services for continuous logging and monitoring:

Auditing and governance services

The following are AWS auditing and governance services:

  • AWS CloudTrail – Enables governance, compliance, operational auditing, and risk auditing of your AWS account.
  • AWS Identity and Access Management – Enables you to manage access to AWS services and resources securely. With IAM, you can create and manage AWS users and groups, and use permissions to allow and deny their access to AWS resources.
  • AWS Config – Allows you to assess, audit, and evaluate the configurations of your AWS resources.

Operations services

The following are AWS operations services:

  • AWS Security Hub – Gives you a comprehensive view of your security alerts and security posture across your AWS accounts. This post uses Security Hub to aggregate all the vulnerability findings as a single pane of glass.
  • AWS CloudFormation – Gives you an easy way to model a collection of related AWS and third-party resources, provision them quickly and consistently, and manage them throughout their lifecycles, by treating infrastructure as code.
  • AWS Systems Manager Parameter Store – Provides secure, hierarchical storage for configuration data management and secrets management. You can store data such as passwords, database strings, Amazon Machine Image (AMI) IDs, and license codes as parameter values.
  • AWS Elastic Beanstalk – An easy-to-use service for deploying and scaling web applications and services developed with Java, .NET, PHP, Node.js, Python, Ruby, Go, and Docker on familiar servers such as Apache, Nginx, Passenger, and IIS. This post uses Elastic Beanstalk to deploy LAMP stack with WordPress and Amazon Aurora MySQL. Although we use Elastic Beanstalk for this post, you could configure the pipeline to deploy to various other environments on AWS or elsewhere as needed.

Pipeline architecture

The following diagram shows the architecture of the solution.
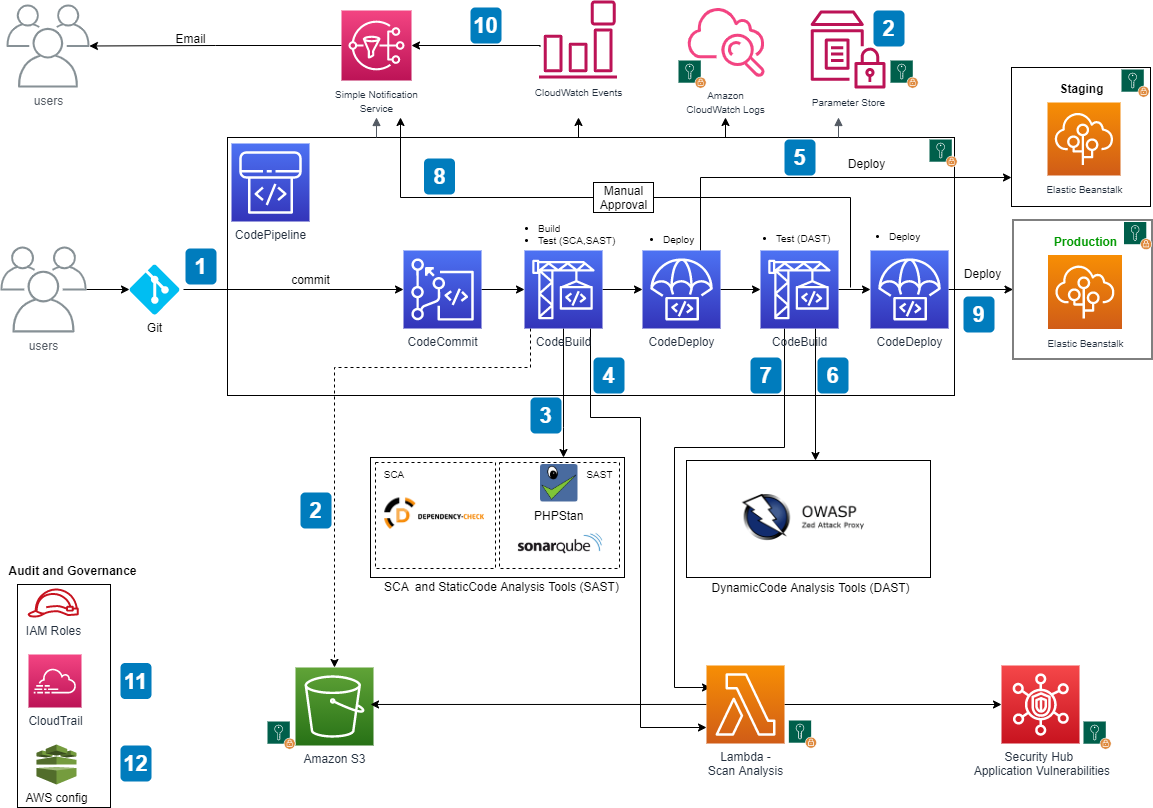
AWS DevSecOps CICD pipeline architecture

AWS DevSecOps CICD pipeline architecture


The main steps are as follows:

  1. When a user commits the code to a CodeCommit repository, a CloudWatch event is generated which, triggers CodePipeline.
  2. CodeBuild packages the build and uploads the artifacts to an S3 bucket. CodeBuild retrieves the authentication information (for example, scanning tool tokens) from Parameter Store to initiate the scanning. As a best practice, it is recommended to utilize Artifact repositories like AWS CodeArtifact to store the artifacts, instead of S3. For simplicity of the workshop, we will continue to use S3.
  3. CodeBuild scans the code with an SCA tool (OWASP Dependency-Check) and SAST tool (SonarQube or PHPStan; in the provided CloudFormation template, you can pick one of these tools during the deployment, but CodeBuild is fully enabled for a bring your own tool approach).
  4. If there are any vulnerabilities either from SCA analysis or SAST analysis, CodeBuild invokes the Lambda function. The function parses the results into AWS Security Finding Format (ASFF) and posts it to Security Hub. Security Hub helps aggregate and view all the vulnerability findings in one place as a single pane of glass. The Lambda function also uploads the scanning results to an S3 bucket.
  5. If there are no vulnerabilities, CodeDeploy deploys the code to the staging Elastic Beanstalk environment.
  6. After the deployment succeeds, CodeBuild triggers the DAST scanning with the OWASP ZAP tool (again, this is fully enabled for a bring your own tool approach).
  7. If there are any vulnerabilities, CodeBuild invokes the Lambda function, which parses the results into ASFF and posts it to Security Hub. The function also uploads the scanning results to an S3 bucket (similar to step 4).
  8. If there are no vulnerabilities, the approval stage is triggered, and an email is sent to the approver for action.
  9. After approval, CodeDeploy deploys the code to the production Elastic Beanstalk environment.
  10. During the pipeline run, CloudWatch Events captures the build state changes and sends email notifications to subscribed users through SNS notifications.
  11. CloudTrail tracks the API calls and send notifications on critical events on the pipeline and CodeBuild projects, such as UpdatePipeline, DeletePipeline, CreateProject, and DeleteProject, for auditing purposes.
  12. AWS Config tracks all the configuration changes of AWS services. The following AWS Config rules are added in this pipeline as security best practices:
  13. CODEBUILD_PROJECT_ENVVAR_AWSCRED_CHECK – Checks whether the project contains environment variables AWS_ACCESS_KEY_ID and AWS_SECRET_ACCESS_KEY. The rule is NON_COMPLIANT when the project environment variables contains plaintext credentials.
  14. CLOUD_TRAIL_LOG_FILE_VALIDATION_ENABLED – Checks whether CloudTrail creates a signed digest file with logs. AWS recommends that the file validation be enabled on all trails. The rule is noncompliant if the validation is not enabled.

Security of the pipeline is implemented by using IAM roles and S3 bucket policies to restrict access to pipeline resources. Pipeline data at rest and in transit is protected using encryption and SSL secure transport. We use Parameter Store to store sensitive information such as API tokens and passwords. To be fully compliant with frameworks such as FedRAMP, other things may be required, such as MFA.

Security in the pipeline is implemented by performing the SCA, SAST and DAST security checks. Alternatively, the pipeline can utilize IAST (Interactive Application Security Testing) techniques that would combine SAST and DAST stages.

As a best practice, encryption should be enabled for the code and artifacts, whether at rest or transit.

In the next section, we explain how to deploy and run the pipeline CloudFormation template used for this example. Refer to the provided service links to learn more about each of the services in the pipeline. If utilizing CloudFormation templates to deploy infrastructure using pipelines, we recommend using linting tools like cfn-nag to scan CloudFormation templates for security vulnerabilities.

Prerequisites

Before getting started, make sure you have the following prerequisites:

Deploying the pipeline

To deploy the pipeline, complete the following steps: Download the CloudFormation template and pipeline code from GitHub repo.

  1. Log in to your AWS account if you have not done so already.
  2. On the CloudFormation console, choose Create Stack.
  3. Choose the CloudFormation pipeline template.
  4. Choose Next.
  5. Provide the stack parameters:
    • Under Code, provide code details, such as repository name and the branch to trigger the pipeline.
    • Under SAST, choose the SAST tool (SonarQube or PHPStan) for code analysis, enter the API token and the SAST tool URL. You can skip SonarQube details if using PHPStan as the SAST tool.
    • Under DAST, choose the DAST tool (OWASP Zap) for dynamic testing and enter the API token, DAST tool URL, and the application URL to run the scan.
    • Under Lambda functions, enter the Lambda function S3 bucket name, filename, and the handler name.
    • Under STG Elastic Beanstalk Environment and PRD Elastic Beanstalk Environment, enter the Elastic Beanstalk environment and application details for staging and production to which this pipeline deploys the application code.
    • Under General, enter the email addresses to receive notifications for approvals and pipeline status changes.

CF Deploymenet - Passing parameter values

CloudFormation deployment - Passing parameter values

CloudFormation template deployment

After the pipeline is deployed, confirm the subscription by choosing the provided link in the email to receive the notifications.

The provided CloudFormation template in this post is formatted for AWS GovCloud. If you’re setting this up in a standard Region, you have to adjust the partition name in the CloudFormation template. For example, change ARN values from arn:aws-us-gov to arn:aws.

Running the pipeline

To trigger the pipeline, commit changes to your application repository files. That generates a CloudWatch event and triggers the pipeline. CodeBuild scans the code and if there are any vulnerabilities, it invokes the Lambda function to parse and post the results to Security Hub.

When posting the vulnerability finding information to Security Hub, we need to provide a vulnerability severity level. Based on the provided severity value, Security Hub assigns the label as follows. Adjust the severity levels in your code based on your organization’s requirements.

  • 0 – INFORMATIONAL
  • 1–39 – LOW
  • 40– 69 – MEDIUM
  • 70–89 – HIGH
  • 90–100 – CRITICAL

The following screenshot shows the progression of your pipeline.

CodePipeline stages

CodePipeline stages

SCA and SAST scanning

In our architecture, CodeBuild trigger the SCA and SAST scanning in parallel. In this section, we discuss scanning with OWASP Dependency-Check, SonarQube, and PHPStan. 

Scanning with OWASP Dependency-Check (SCA)

The following is the code snippet from the Lambda function, where the SCA analysis results are parsed and posted to Security Hub. Based on the results, the equivalent Security Hub severity level (normalized_severity) is assigned.

Lambda code snippet for OWASP Dependency-check

Lambda code snippet for OWASP Dependency-check

You can see the results in Security Hub, as in the following screenshot.

SecurityHub report from OWASP Dependency-check scanning

SecurityHub report from OWASP Dependency-check scanning

Scanning with SonarQube (SAST)

The following is the code snippet from the Lambda function, where the SonarQube code analysis results are parsed and posted to Security Hub. Based on SonarQube results, the equivalent Security Hub severity level (normalized_severity) is assigned.

Lambda code snippet for SonarQube

Lambda code snippet for SonarQube

The following screenshot shows the results in Security Hub.

SecurityHub report from SonarQube scanning

SecurityHub report from SonarQube scanning

Scanning with PHPStan (SAST)

The following is the code snippet from the Lambda function, where the PHPStan code analysis results are parsed and posted to Security Hub.

Lambda code snippet for PHPStan

Lambda code snippet for PHPStan

The following screenshot shows the results in Security Hub.

SecurityHub report from PHPStan scanning

SecurityHub report from PHPStan scanning

DAST scanning

In our architecture, CodeBuild triggers DAST scanning and the DAST tool.

If there are no vulnerabilities in the SAST scan, the pipeline proceeds to the manual approval stage and an email is sent to the approver. The approver can review and approve or reject the deployment. If approved, the pipeline moves to next stage and deploys the application to the provided Elastic Beanstalk environment.

Scanning with OWASP Zap

After deployment is successful, CodeBuild initiates the DAST scanning. When scanning is complete, if there are any vulnerabilities, it invokes the Lambda function similar to SAST analysis. The function parses and posts the results to Security Hub. The following is the code snippet of the Lambda function.

Lambda code snippet for OWASP-Zap

Lambda code snippet for OWASP-Zap

The following screenshot shows the results in Security Hub.

SecurityHub report from OWASP-Zap scanning

SecurityHub report from OWASP-Zap scanning

Aggregation of vulnerability findings in Security Hub provides opportunities to automate the remediation. For example, based on the vulnerability finding, you can trigger a Lambda function to take the needed remediation action. This also reduces the burden on operations and security teams because they can now address the vulnerabilities from a single pane of glass instead of logging into multiple tool dashboards.

Conclusion

In this post, I presented a DevSecOps pipeline that includes CI/CD, continuous testing, continuous logging and monitoring, auditing and governance, and operations. I demonstrated how to integrate various open-source scanning tools, such as SonarQube, PHPStan, and OWASP Zap for SAST and DAST analysis. I explained how to aggregate vulnerability findings in Security Hub as a single pane of glass. This post also talked about how to implement security of the pipeline and in the pipeline using AWS cloud native services. Finally, I provided the DevSecOps pipeline as code using AWS CloudFormation. For additional information on AWS DevOps services and to get started, see AWS DevOps and DevOps Blog.


Srinivas Manepalli is a DevSecOps Solutions Architect in the U.S. Fed SI SA team at Amazon Web Services (AWS). He is passionate about helping customers, building and architecting DevSecOps and highly available software systems. Outside of work, he enjoys spending time with family, nature and good food.

Automatically update security groups for Amazon CloudFront IP ranges using AWS Lambda

Post Syndicated from Yeshwanth Kottu original https://aws.amazon.com/blogs/security/automatically-update-security-groups-for-amazon-cloudfront-ip-ranges-using-aws-lambda/

Amazon CloudFront is a content delivery network that can help you increase the performance of your web applications and significantly lower the latency of delivering content to your customers. For CloudFront to access an origin (the source of the content behind CloudFront), the origin has to be publicly available and reachable. Anyone with the origin domain name or IP address could request content directly and bypass CloudFront. In this blog post, I describe an automated solution that uses security groups to permit only CloudFront to access the origin.

Amazon Simple Storage Service (Amazon S3) origins provide a feature called Origin Access Identity, which blocks public access to selected buckets, making them accessible only through CloudFront. When you use CloudFront to secure your web applications, it’s important to ensure that only CloudFront can access your origin (such as Amazon Elastic Cloud Compute (Amazon EC2) or Application Load Balancer (ALB)) and any direct access to origin is restricted. This blog post shows you how to create an AWS Lambda function to automatically update Amazon Virtual Private Cloud (Amazon VPC) security groups with CloudFront service IP ranges to permit only CloudFront to access the origin.

AWS publishes the IP ranges in JSON format for CloudFront and other AWS services. If your origin is an Elastic Load Balancer or an Amazon EC2 instance, you can use VPC security groups to allow only CloudFront IP ranges to access your applications. The IP ranges in the list are separated by service and Region, and you must specify only the IP ranges that correspond to CloudFront.

The IP ranges that AWS publishes change frequently and without an automated solution, you would need to retrieve this document frequently to understand the current IP ranges for CloudFront. Frequent polling is inefficient because there is no notice of when the IP ranges change, and if these IP ranges aren’t modified immediately, your client might see 504 errors when they access CloudFront. Additionally, there are numerous IP ranges for each service, performing the change manually isn’t an efficient way of updating these ranges. This means you need infrastructure to support the task. However, in that case you end up with another host to manage—complete with the typical patching, deployment, and monitoring. As you can see, a small task could quickly become more complicated than the problem you intended to solve.

An Amazon Simple Notification Service (Amazon SNS) message is sent to a topic whenever the AWS IP ranges change. Enabling you to build an event-driven, serverless solution that updates the IP ranges for your security groups, as needed by using a Lambda function that is triggered in response to the SNS notification.

Here are the steps we are going to take to implement the solution:

  1. Create your resources
    1. Create an IAM policy and execution role for the Lambda function
    2. Create your Lambda function
  2. Test your Lambda function
  3. Configure your Lambda function’s trigger

Create your resources

The first thing you need to do is create a Lambda function execution role and policy. Lambda function uses execution role to access or create AWS resources. This Lambda function is triggered by an SNS notification whenever there’s a change in the IP ranges document. Based on the number of IP ranges present for CloudFront and also the number of ports (for example, 80,443) that you want to whitelist on the origin, this Lambda function creates the required security groups. These security groups will allow only traffic from CloudFront to your ELB load balancers or EC2 instances.

Create an IAM policy and execution role for the Lambda function

When you create a Lambda function, it’s important to understand and properly define the security context for the Lambda function. Using AWS Identity and Access Management (IAM), you can create the Lambda execution role that determines the AWS service calls that the function is authorized to complete. (Learn more about the Lambda permissions model.)

To create the IAM policy for your role

  1. Log in to the IAM console with the user account that you will use to manage the Lambda function. This account must have administrator permissions.
  2. In the navigation pane, choose Policies.
  3. In the content pane, choose Create policy.
  4. Choose the JSON tab and copy the text from the following JSON policy document. Paste this text into the JSON text box.
    {
      "Version": "2012-10-17",
      "Statement": [
        {
          "Sid": "CloudWatchPermissions",
          "Effect": "Allow",
          "Action": [
            "logs:CreateLogGroup",
            "logs:CreateLogStream",
            "logs:PutLogEvents"
          ],
          "Resource": "arn:aws:logs:*:*:*"
        },
        {
          "Sid": "EC2Permissions",
          "Effect": "Allow",
          "Action": [
            "ec2:DescribeSecurityGroups",
            "ec2:AuthorizeSecurityGroupIngress",
            "ec2:RevokeSecurityGroupIngress",
            "ec2:CreateSecurityGroup",
            "ec2:DescribeVpcs",
    		"ec2:CreateTags",
            "ec2:ModifyNetworkInterfaceAttribute",
            "ec2:DescribeNetworkInterfaces"
            
          ],
          "Resource": "*"
        }
      ]
    }
    

  5. When you’re finished, choose Review policy.
  6. On the Review page, enter a name for the policy name (e.g. LambdaExecRolePolicy-UpdateSecurityGroupsForCloudFront). Review the policy Summary to see the permissions granted by your policy, and then choose Create policy to save your work.

To understand what this policy allows, let’s look closely at both statements in the policy. The first statement allows the Lambda function to create and write to CloudWatch Logs, which is vital for debugging and monitoring our function. The second statement allows the function to get information about existing security groups, get existing VPC information, create security groups, and authorize and revoke ingress permissions. It’s an important best practice that your IAM policies be as granular as possible, to support the principal of least privilege.

Now that you’ve created your policy, you can create the Lambda execution role that will use the policy.

To create the Lambda execution role

  1. In the navigation pane of the IAM console, choose Roles, and then choose Create role.
  2. For Select type of trusted entity, choose AWS service.
  3. Choose the service that you want to allow to assume this role. In this case, choose Lambda.
  4. Choose Next: Permissions.
  5. Search for the policy name that you created earlier and select the check box next to the policy.
  6. Choose Next: Tags.
  7. (Optional) Add metadata to the role by attaching tags as key-value pairs. For more information about using tags in IAM, see Tagging IAM Users and Roles.
  8. Choose Next: Review.
  9. For Role name (e.g. LambdaExecRole-UpdateSecurityGroupsForCloudFront), enter a name for your role.
  10. (Optional) For Role description, enter a description for the new role.
  11. Review the role, and then choose Create role.

Create your Lambda function

Now, create your Lambda function and configure the role that you created earlier as the execution role for this function.

To create the Lambda function

  1. Go to the Lambda console in N. Virginia region and choose Create function. On the next page, choose Author from scratch. (I’ll be providing the code for your Lambda function, but for other functions, the Use a blueprint option can be a great way to get started.)
  2. Give your Lambda function a name (e.g UpdateSecurityGroupsForCloudFront) and description, and select Python 3.8 from the Runtime menu.
  3. Choose or create an execution role: Select the execution role you created earlier by selecting the option Use an Existing Role.
  4. After confirming that your settings are correct, choose Create function.
  5. Paste the Lambda function code from here.
  6. Select Save.

Additionally, in the Basic Settings of the Lambda function, increase the timeout to 10 seconds.

To set the timeout value in the Lambda console

  1. In the Lambda console, choose the function you just created.
  2. Under Basic settings, choose Edit.
  3. For Timeout, select 10s.
  4. Choose Save.

By default, the Lambda function has these settings:

  • The Lambda function is configured to create security groups in the default VPC.
  • CloudFront IP ranges are updated as inbound rules on port 80.
  • The created security groups are tagged with the name prefix AUTOUPDATE.
  • Debug logging is turned off.
  • The service for which IP ranges are extracted is set to CloudFront.
  • The SDK client in the Lambda function set to us-east-1(N. Virginia).

If you want to customize these settings, set the following environment variables for the Lambda function. For more details, see Using AWS Lambda environment variables.

Action Key-value data
To create security groups in a specific VPC Key: VPC_ID
Value: vpc-id
To create security groups rules for a different port or multiple ports
 
The solution in this example supports a total of two ports. One can be used for HTTP and another for HTTPS.

Key: PORTS
Value: portnumber
or
Key: PORTS
Value: portnumber,portnumber
To customize the prefix name tag of your security groups Key: PREFIX_NAME
Value: custom-name
To enable debug logging to CloudWatch Key: DEBUG
Value: true
To extract IP ranges for a different service other than CloudFront Key: SERVICE
Value: servicename
To configure the Region for the SDK client used in the Lambda function
 
If the CloudFront origin is present in a different Region than N. Virginia, the security groups must be created in that region.
Key: REGION
Value: regionname

To set environment variables in the Lambda console

  1. In the Lambda console, choose the function you created.
  2. Under Environment variables, choose Edit.
  3. Choose Add environment variable.
  4. Enter a key and value.
  5. Choose Save.

Test your Lambda function

Now that you’ve created your function, it’s time to test it and initialize your security group.

To create your test event for the Lambda function

  1. In the Lambda console, on the Functions page, choose your function. In the drop-down menu next to Actions, choose Configure test events.
  2. Enter an Event Name (e.g. TriggerSNS)
  3. Replace the following as your sample event, which will represent an SNS notification and then select Create.
    {
        "Records": [
            {
                "EventVersion": "1.0",
                "EventSubscriptionArn": "arn:aws:sns:EXAMPLE",
                "EventSource": "aws:sns",
                "Sns": {
                    "SignatureVersion": "1",
                    "Timestamp": "1970-01-01T00:00:00.000Z",
                    "Signature": "EXAMPLE",
                    "SigningCertUrl": "EXAMPLE",
                    "MessageId": "95df01b4-ee98-5cb9-9903-4c221d41eb5e",
                    "Message": "{\"create-time\": \"yyyy-mm-ddThh:mm:ss+00:00\", \"synctoken\": \"0123456789\", \"md5\": \"7fd59f5c7f5cf643036cbd4443ad3e4b\", \"url\": \"https://ip-ranges.amazonaws.com/ip-ranges.json\"}",
                    "Type": "Notification",
                    "UnsubscribeUrl": "EXAMPLE",
                    "TopicArn": "arn:aws:sns:EXAMPLE",
                    "Subject": "TestInvoke"
                }
      		}
        ]
    }
    

  4. After you’ve added the test event, select Save and then select Test. Your Lambda function is then invoked, and you should see log output at the bottom of the console in Execution Result section, similar to the following.
    Updating from https://ip-ranges.amazonaws.com/ip-ranges.json
    MD5 Mismatch: got 2e967e943cf98ae998efeec05d4f351c expected 7fd59f5c7f5cf643036cbd4443ad3e4b: Exception
    Traceback (most recent call last):
      File "/var/task/lambda_function.py", line 29, in lambda_handler
        ip_ranges = json.loads(get_ip_groups_json(message['url'], message['md5']))
      File "/var/task/lambda_function.py", line 50, in get_ip_groups_json
        raise Exception('MD5 Missmatch: got ' + hash + ' expected ' + expected_hash)
    Exception: MD5 Mismatch: got 2e967e943cf98ae998efeec05d4f351c expected 7fd59f5c7f5cf643036cbd4443ad3e4b
    

  5. Edit the sample event again, and this time change the md5 value in the sample event to be the first MD5 hash provided in the log output. In this example, you would update the md5 value in the sample event configured earlier with the hash value seen in the error ‘2e967e943cf98ae998efeec05d4f351c’. Lambda code successfully executes only when the original hash of the IP ranges document and the hash received from the event trigger match. After you modify the hash value from the error message received earlier, the test event matches the hash of the IP ranges document.
  6. Select Save and test. This invokes your Lambda function.

After the function is invoked the second time with updated md5 has Lambda function should execute without any errors. You should be able to see the new security groups created and the IP ranges of CloudFront updated in the rules in the EC2 console, as shown in Figure 1.
 

Figure 1: EC2 console showing the security groups created

Figure 1: EC2 console showing the security groups created

In the initial successful run of this function, it created the total number of security groups required to update all the IP ranges of CloudFront for the ports mentioned. The function creates security groups based on the maximum number of rules that can be added to individual security groups. The new security groups can be identified from the EC2 console by the name AUTOUPDATE_random if you used the default configuration, or a custom name if you provided a PREFIX_NAME.

You can now attach these security groups to your Elastic LoadBalancer or EC2 instances. If your log output is different from what is described here, the output should help you identify the issue.

Configure your Lambda function’s trigger

After you’ve validated that your function is executing properly, it’s time to connect it to the SNS topic for IP changes. To do this, use the AWS Command Line Interface (CLI). Enter the following command, making sure to replace Lambda ARN with the Amazon Resource Name (ARN) of your Lambda function. You can find this ARN at the top right when viewing the configuration of your Lambda function.

aws sns subscribe - -topic-arn "arn:aws:sns:us-east-1:806199016981:AmazonIpSpaceChanged" - -region us-east-1 - -protocol lambda - -notification-endpoint "Lambda ARN"

You should receive the ARN of your Lambda function’s SNS subscription.

Now add a permission that allows the Lambda function to be invoked by the SNS topic. The following command also adds the Lambda trigger.

aws lambda add-permission - -function-name "Lambda ARN" - -statement-id lambda-sns-trigger - -region us-east-1 - -action lambda:InvokeFunction - -principal sns.amazonaws.com - -source-arn "arn:aws:sns:us-east-1:806199016981:AmazonIpSpaceChanged"

When AWS changes any of the IP ranges in the document, an SNS notification is sent and your Lambda function will be triggered. This Lambda function verifies the modified ranges in the document and efficiently updates the IP ranges on the existing security groups. Additionally, the function dynamically scales and creates additional security groups if the number of IP ranges for CloudFront is increased in future. Any newly created security groups are automatically attached to the network interface where the previous security groups are attached in order to avoid service interruption.

Summary

As you followed this blog post, you created a Lambda function to create a security groups and update the security group’s rules dynamically whenever AWS publishes new internal service IP ranges. This solution has several advantages:

  • The solution isn’t designed as a periodic poll, so it only runs when it needs to.
  • It’s automatic, so you don’t need to update security groups manually which lowers the operational cost.
  • It’s simple, because you have no extra infrastructure to maintain as the solution is completely serverless.
  • It’s cost effective, because the Lambda function runs only when triggered by the AmazonIpSpaceChanged SNS topic and only runs for a few seconds, this solution costs only pennies to operate.

If you have feedback about this post, submit comments in the Comments section below. If you have questions about this post, start a new thread on the Amazon CloudFront forum. If you have any other use cases for using Lambda functions to dynamically update security groups, or even other networking configurations such as VPC route tables or ACLs, we’d love to hear about them!

Want more AWS Security how-to content, news, and feature announcements? Follow us on Twitter.

Author

Yeshwanth Kottu

Yeshwanth is a Systems Development Engineer at AWS in Cupertino, CA. With a focus on CloudFront and Lambda@Edge, he enjoys helping customers tackle challenges through cloud-scale architectures. Yeshwanth has an MS in Computer Systems Networking and Telecommunications from Northeastern University. Outside of work, he enjoys travelling, visiting national parks, and playing cricket.

Building, bundling, and deploying applications with the AWS CDK

Post Syndicated from Cory Hall original https://aws.amazon.com/blogs/devops/building-apps-with-aws-cdk/

The AWS Cloud Development Kit (AWS CDK) is an open-source software development framework to model and provision your cloud application resources using familiar programming languages.

The post CDK Pipelines: Continuous delivery for AWS CDK applications showed how you can use CDK Pipelines to deploy a TypeScript-based AWS Lambda function. In that post, you learned how to add additional build commands to the pipeline to compile the TypeScript code to JavaScript, which is needed to create the Lambda deployment package.

In this post, we dive deeper into how you can perform these build commands as part of your AWS CDK build process by using the native AWS CDK bundling functionality.

If you’re working with Python, TypeScript, or JavaScript-based Lambda functions, you may already be familiar with the PythonFunction and NodejsFunction constructs, which use the bundling functionality. This post describes how to write your own bundling logic for instances where a higher-level construct either doesn’t already exist or doesn’t meet your needs. To illustrate this, I walk through two different examples: a Lambda function written in Golang and a static site created with Nuxt.js.

Concepts

A typical CI/CD pipeline contains steps to build and compile your source code, bundle it into a deployable artifact, push it to artifact stores, and deploy to an environment. In this post, we focus on the building, compiling, and bundling stages of the pipeline.

The AWS CDK has the concept of bundling source code into a deployable artifact. As of this writing, this works for two main types of assets: Docker images published to Amazon Elastic Container Registry (Amazon ECR) and files published to Amazon Simple Storage Service (Amazon S3). For files published to Amazon S3, this can be as simple as pointing to a local file or directory, which the AWS CDK uploads to Amazon S3 for you.

When you build an AWS CDK application (by running cdk synth), a cloud assembly is produced. The cloud assembly consists of a set of files and directories that define your deployable AWS CDK application. In the context of the AWS CDK, it might include the following:

  • AWS CloudFormation templates and instructions on where to deploy them
  • Dockerfiles, corresponding application source code, and information about where to build and push the images to
  • File assets and information about which S3 buckets to upload the files to

Use case

For this use case, our application consists of front-end and backend components. The example code is available in the GitHub repo. In the repository, I have split the example into two separate AWS CDK applications. The repo also contains the Golang Lambda example app and the Nuxt.js static site.

Golang Lambda function

To create a Golang-based Lambda function, you must first create a Lambda function deployment package. For Go, this consists of a .zip file containing a Go executable. Because we don’t commit the Go executable to our source repository, our CI/CD pipeline must perform the necessary steps to create it.

In the context of the AWS CDK, when we create a Lambda function, we have to tell the AWS CDK where to find the deployment package. See the following code:

new lambda.Function(this, 'MyGoFunction', {
  runtime: lambda.Runtime.GO_1_X,
  handler: 'main',
  code: lambda.Code.fromAsset(path.join(__dirname, 'folder-containing-go-executable')),
});

In the preceding code, the lambda.Code.fromAsset() method tells the AWS CDK where to find the Golang executable. When we run cdk synth, it stages this Go executable in the cloud assembly, which it zips and publishes to Amazon S3 as part of the PublishAssets stage.

If we’re running the AWS CDK as part of a CI/CD pipeline, this executable doesn’t exist yet, so how do we create it? One method is CDK bundling. The lambda.Code.fromAsset() method takes a second optional argument, AssetOptions, which contains the bundling parameter. With this bundling parameter, we can tell the AWS CDK to perform steps prior to staging the files in the cloud assembly.

Breaking down the BundlingOptions parameter further, we can perform the build inside a Docker container or locally.

Building inside a Docker container

For this to work, we need to make sure that we have Docker running on our build machine. In AWS CodeBuild, this means setting privileged: true. See the following code:

new lambda.Function(this, 'MyGoFunction', {
  code: lambda.Code.fromAsset(path.join(__dirname, 'folder-containing-source-code'), {
    bundling: {
      image: lambda.Runtime.GO_1_X.bundlingDockerImage,
      command: [
        'bash', '-c', [
          'go test -v',
          'GOOS=linux go build -o /asset-output/main',
      ].join(' && '),
    },
  })
  ...
});

We specify two parameters:

  • image (required) – The Docker image to perform the build commands in
  • command (optional) – The command to run within the container

The AWS CDK mounts the folder specified as the first argument to fromAsset at /asset-input inside the container, and mounts the asset output directory (where the cloud assembly is staged) at /asset-output inside the container.

After we perform the build commands, we need to make sure we copy the Golang executable to the /asset-output location (or specify it as the build output location like in the preceding example).

This is the equivalent of running something like the following code:

docker run \
  --rm \
  -v folder-containing-source-code:/asset-input \
  -v cdk.out/asset.1234a4b5/:/asset-output \
  lambci/lambda:build-go1.x \
  bash -c 'GOOS=linux go build -o /asset-output/main'

Building locally

To build locally (not in a Docker container), we have to provide the local parameter. See the following code:

new lambda.Function(this, 'MyGoFunction', {
  code: lambda.Code.fromAsset(path.join(__dirname, 'folder-containing-source-code'), {
    bundling: {
      image: lambda.Runtime.GO_1_X.bundlingDockerImage,
      command: [],
      local: {
        tryBundle(outputDir: string) {
          try {
            spawnSync('go version')
          } catch {
            return false
          }

          spawnSync(`GOOS=linux go build -o ${path.join(outputDir, 'main')}`);
          return true
        },
      },
    },
  })
  ...
});

The local parameter must implement the ILocalBundling interface. The tryBundle method is passed the asset output directory, and expects you to return a boolean (true or false). If you return true, the AWS CDK doesn’t try to perform Docker bundling. If you return false, it falls back to Docker bundling. Just like with Docker bundling, you must make sure that you place the Go executable in the outputDir.

Typically, you should perform some validation steps to ensure that you have the required dependencies installed locally to perform the build. This could be checking to see if you have go installed, or checking a specific version of go. This can be useful if you don’t have control over what type of build environment this might run in (for example, if you’re building a construct to be consumed by others).

If we run cdk synth on this, we see a new message telling us that the AWS CDK is bundling the asset. If we include additional commands like go test, we also see the output of those commands. This is especially useful if you wanted to fail a build if tests failed. See the following code:

$ cdk synth
Bundling asset GolangLambdaStack/MyGoFunction/Code/Stage...
✓  . (9ms)
✓  clients (5ms)

DONE 8 tests in 11.476s
✓  clients (5ms) (coverage: 84.6% of statements)
✓  . (6ms) (coverage: 78.4% of statements)

DONE 8 tests in 2.464s

Cloud Assembly

If we look at the cloud assembly that was generated (located at cdk.out), we see something like the following code:

$ cdk synth
Bundling asset GolangLambdaStack/MyGoFunction/Code/Stage...
✓  . (9ms)
✓  clients (5ms)

DONE 8 tests in 11.476s
✓  clients (5ms) (coverage: 84.6% of statements)
✓  . (6ms) (coverage: 78.4% of statements)

DONE 8 tests in 2.464s

It contains our GolangLambdaStack CloudFormation template that defines our Lambda function, as well as our Golang executable, bundled at asset.01cf34ff646d380829dc4f2f6fc93995b13277bde7db81c24ac8500a83a06952/main.

Let’s look at how the AWS CDK uses this information. The GolangLambdaStack.assets.json file contains all the information necessary for the AWS CDK to know where and how to publish our assets (in this use case, our Golang Lambda executable). See the following code:

{
  "version": "5.0.0",
  "files": {
    "01cf34ff646d380829dc4f2f6fc93995b13277bde7db81c24ac8500a83a06952": {
      "source": {
        "path": "asset.01cf34ff646d380829dc4f2f6fc93995b13277bde7db81c24ac8500a83a06952",
        "packaging": "zip"
      },
      "destinations": {
        "current_account-current_region": {
          "bucketName": "cdk-hnb659fds-assets-${AWS::AccountId}-${AWS::Region}",
          "objectKey": "01cf34ff646d380829dc4f2f6fc93995b13277bde7db81c24ac8500a83a06952.zip",
          "assumeRoleArn": "arn:${AWS::Partition}:iam::${AWS::AccountId}:role/cdk-hnb659fds-file-publishing-role-${AWS::AccountId}-${AWS::Region}"
        }
      }
    }
  }
}

The file contains information about where to find the source files (source.path) and what type of packaging (source.packaging). It also tells the AWS CDK where to publish this .zip file (bucketName and objectKey) and what AWS Identity and Access Management (IAM) role to use (assumeRoleArn). In this use case, we only deploy to a single account and Region, but if you have multiple accounts or Regions, you see multiple destinations in this file.

The GolangLambdaStack.template.json file that defines our Lambda resource looks something like the following code:

{
  "Resources": {
    "MyGoFunction0AB33E85": {
      "Type": "AWS::Lambda::Function",
      "Properties": {
        "Code": {
          "S3Bucket": {
            "Fn::Sub": "cdk-hnb659fds-assets-${AWS::AccountId}-${AWS::Region}"
          },
          "S3Key": "01cf34ff646d380829dc4f2f6fc93995b13277bde7db81c24ac8500a83a06952.zip"
        },
        "Handler": "main",
        ...
      }
    },
    ...
  }
}

The S3Bucket and S3Key match the bucketName and objectKey from the assets.json file. By default, the S3Key is generated by calculating a hash of the folder location that you pass to lambda.Code.fromAsset(), (for this post, folder-containing-source-code). This means that any time we update our source code, this calculated hash changes and a new Lambda function deployment is triggered.

Nuxt.js static site

In this section, I walk through building a static site using the Nuxt.js framework. You can apply the same logic to any static site framework that requires you to run a build step prior to deploying.

To deploy this static site, we use the BucketDeployment construct. This is a construct that allows you to populate an S3 bucket with the contents of .zip files from other S3 buckets or from a local disk.

Typically, we simply tell the BucketDeployment construct where to find the files that it needs to deploy to the S3 bucket. See the following code:

new s3_deployment.BucketDeployment(this, 'DeployMySite', {
  sources: [
    s3_deployment.Source.asset(path.join(__dirname, 'path-to-directory')),
  ],
  destinationBucket: myBucket
});

To deploy a static site built with a framework like Nuxt.js, we need to first run a build step to compile the site into something that can be deployed. For Nuxt.js, we run the following two commands:

  • yarn install – Installs all our dependencies
  • yarn generate – Builds the application and generates every route as an HTML file (used for static hosting)

This creates a dist directory, which you can deploy to Amazon S3.

Just like with the Golang Lambda example, we can perform these steps as part of the AWS CDK through either local or Docker bundling.

Building inside a Docker container

To build inside a Docker container, use the following code:

new s3_deployment.BucketDeployment(this, 'DeployMySite', {
  sources: [
    s3_deployment.Source.asset(path.join(__dirname, 'path-to-nuxtjs-project'), {
      bundling: {
        image: cdk.BundlingDockerImage.fromRegistry('node:lts'),
        command: [
          'bash', '-c', [
            'yarn install',
            'yarn generate',
            'cp -r /asset-input/dist/* /asset-output/',
          ].join(' && '),
        ],
      },
    }),
  ],
  ...
});

For this post, we build inside the publicly available node:lts image hosted on DockerHub. Inside the container, we run our build commands yarn install && yarn generate, and copy the generated dist directory to our output directory (the cloud assembly).

The parameters are the same as described in the Golang example we walked through earlier.

Building locally

To build locally, use the following code:

new s3_deployment.BucketDeployment(this, 'DeployMySite', {
  sources: [
    s3_deployment.Source.asset(path.join(__dirname, 'path-to-nuxtjs-project'), {
      bundling: {
        local: {
          tryBundle(outputDir: string) {
            try {
              spawnSync('yarn --version');
            } catch {
              return false
            }

            spawnSync('yarn install && yarn generate');

       fs.copySync(path.join(__dirname, ‘path-to-nuxtjs-project’, ‘dist’), outputDir);
            return true
          },
        },
        image: cdk.BundlingDockerImage.fromRegistry('node:lts'),
        command: [],
      },
    }),
  ],
  ...
});

Building locally works the same as the Golang example we walked through earlier, with one exception. We have one additional command to run that copies the generated dist folder to our output directory (cloud assembly).

Conclusion

This post showed how you can easily compile your backend and front-end applications using the AWS CDK. You can find the example code for this post in this GitHub repo. If you have any questions or comments, please comment on the GitHub repo. If you have any additional examples you want to add, we encourage you to create a Pull Request with your example!

Our code also contains examples of deploying the applications using CDK Pipelines, so if you’re interested in deploying the example yourself, check out the example repo.


About the author

Cory Hall

Cory is a Solutions Architect at Amazon Web Services with a passion for DevOps and is based in Charlotte, NC. Cory works with enterprise AWS customers to help them design, deploy, and scale applications to achieve their business goals.

Improving customer experience and reducing cost with CodeGuru Profiler

Post Syndicated from Rajesh original https://aws.amazon.com/blogs/devops/improving-customer-experience-and-reducing-cost-with-codeguru-profiler/

Amazon CodeGuru is a set of developer tools powered by machine learning that provides intelligent recommendations for improving code quality and identifying an application’s most expensive lines of code. Amazon CodeGuru Profiler allows you to profile your applications in a low impact, always on manner. It helps you improve your application’s performance, reduce cost and diagnose application issues through rich data visualization and proactive recommendations. CodeGuru Profiler has been a very successful and widely used service within Amazon, before it was offered as a public service. This post discusses a few ways in which internal Amazon teams have used and benefited from continuous profiling of their production applications. These uses cases can provide you with better insights on how to reap similar benefits for your applications using CodeGuru Profiler.

Inside Amazon, over 100,000 applications currently use CodeGuru Profiler across various environments globally. Over the last few years, CodeGuru Profiler has served as an indispensable tool for resolving issues in the following three categories:

  1. Performance bottlenecks, high latency and CPU utilization
  2. Cost and Infrastructure utilization
  3. Diagnosis of an application impacting event

API latency improvement for CodeGuru Profiler

What could be a better example than CodeGuru Profiler using itself to improve its own performance?
CodeGuru Profiler offers an API called BatchGetFrameMetricData, which allows you to fetch time series data for a set of frames or methods. We noticed that the 99th percentile latency (i.e. the slowest 1 percent of requests over a 5 minute period) metric for this API was approximately 5 seconds, higher than what we wanted for our customers.

Solution

CodeGuru Profiler is built on a micro service architecture, with the BatchGetFrameMetricData API implemented as set of AWS Lambda functions. It also leverages other AWS services such as Amazon DynamoDB to store data and Amazon CloudWatch to record performance metrics.

When investigating the latency issue, the team found that the 5-second latency spikes were happening during certain time intervals rather than continuously, which made it difficult to easily reproduce and determine the root cause of the issue in pre-production environment. The new Lambda profiling feature in CodeGuru came in handy, and so the team decided to enable profiling for all its Lambda functions. The low impact, continuous profiling capability of CodeGuru Profiler allowed the team to capture comprehensive profiles over a period of time, including when the latency spikes occurred, enabling the team to better understand the issue.
After capturing the profiles, the team went through the flame graphs of one of the Lambda functions (TimeSeriesMetricsGeneratorLambda) and learned that all of its CPU time was spent by the thread responsible to publish metrics to CloudWatch. The following screenshot shows a flame graph during one of these spikes.

TimeSeriesMetricsGeneratorLambda taking 100% CPU

As seen, there is a single call stack visible in the above flame graph, indicating all the CPU time was taken by the thread invoking above code. This helped the team immediately understand what was happening. Above code was related to the thread responsible for publishing the CloudWatch metrics. This thread was publishing these metrics in a synchronized block and as this thread took most of the CPU, it caused all other threads to wait and the latency to spike. To fix the issue, the team simply changed the TimeSeriesMetricsGeneratorLambda Lambda code, to publish CloudWatch metrics at the end of the function, which eliminated contention of this thread with all other threads.

Improvement

After the fix was deployed, the 5 second latency spikes were gone, as seen in the following graph.

Latency reduction for BatchGetFrameMetricData API

Cost, infrastructure and other improvements for CAGE

CAGE is an internal Amazon retail service that does royalty aggregation for digital products, such as Kindle eBooks, MP3 songs and albums and more. Like many other Amazon services, CAGE is also customer of CodeGuru Profiler.

CAGE was experiencing latency delays and growing infrastructure cost, and wanted to reduce them. Thanks to CodeGuru Profiler’s always-on profiling capabilities, rich visualization and recommendations, the team was able to successfully diagnose the issues, determine the root cause and fix them.

Solution

With the help of CodeGuru Profiler, the CAGE team identified several reasons for their degraded service performance and increased hardware utilization:

  • Excessive garbage collection activity – The team reviewed the service flame graphs (see the following screenshot) and identified that a lot of CPU time was spent getting garbage collection activities, 65.07% of the total service CPU.

Excessive garbage collection activities for CAGE

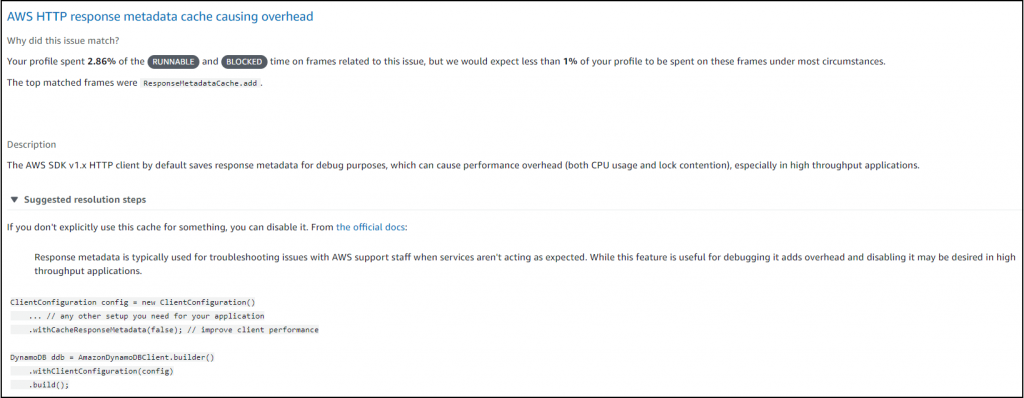
  • Metadata overhead – The team followed CodeGuru Profiler recommendation to identify that the service’s DynamoDB responses were consuming higher CPU, 2.86% of total CPU time. This was due to the response metadata caching in the AWS SDK v1.x HTTP client that was turned on by default. This was causing higher CPU overhead for high throughput applications such as CAGE. The following screenshot shows the relevant recommendation.

Response metadata recommendation for CAGE

  • Excessive logging – The team also identified excessive logging of its internal Amazon ION structures. The team initially added this logging for debugging purposes, but was unaware of its impact on the CPU cost, taking 2.28% of the overall service CPU. The following screenshot is part of the flame graph that helped identify the logging impact.

Excessive logging in CAGE service

The team used these flame graphs and CodeGuru Profiler provided recommendations to determine the root cause of the issues and systematically resolve them by doing the following:

  • Switching to a more efficient garbage collector
  • Removing excessive logging
  • Disabling metadata caching for Dynamo DB response

Improvements

After making these changes, the team was able to reduce their infrastructure cost by 25%, saving close to $2600 per month. Service latency also improved, with a reduction in service’s 99th percentile latency from approximately 2,500 milliseconds to 250 milliseconds in their North America (NA) region as shown below.

CAGE Latency Reduction

The team also realized a side benefit of having reduced log verbosity and saw a reduction in log size by 55%.

Event Analysis of increased checkout latency for Amazon.com

During one of the high traffic times, Amazon retail customers experienced higher than normal latency on their checkout page. The issue was due to one of the downstream service’s API experiencing high latency and CPU utilization. While the team quickly mitigated the issue by increasing the service’s servers, the always-on CodeGuru Profiler came to the rescue to help diagnose and fix the issue permanently.

Solution

The team analyzed the flame graphs from CodeGuru Profiler at the time of the event and noticed excessive CPU consumption (69.47%) when logging exceptions using Log4j2. See the following screenshot taken from an earlier version of CodeGuru Profiler user interface.

Excessive CPU consumption when logging exceptions using Log4j2

With CodeGuru Profiler flame graph and other metrics, the team quickly confirmed that the issue was due to excessive exception logging using Log4j2. This downstream service had recently upgraded to Log4j2 version 2.8, in which exception logging could be expensive, due to the way Log4j2 handles class-loading of certain stack frames. Log4j 2.x versions enabled class loading by default, which was disabled in 1.x versions, causing the increased latency and CPU utilization. The team was not able to detect this issue in pre-production environment, as the impact was observable only in high traffic situations.

Improvement

After they understood the issue, the team successfully rolled out the fix, removing the unnecessary exception trace logging to fix the issue. Such performance issues and many others are proactively offered as CodeGuru Profiler recommendations, to ensure you can proactively learn about such issues with your applications and quickly resolve them.

Conclusion

I hope this post provided a glimpse into various ways CodeGuru Profiler can benefit your business and applications. To get started using CodeGuru Profiler, see Setting up CodeGuru Profiler.
For more information about CodeGuru Profiler, see the following:

Investigating performance issues with Amazon CodeGuru Profiler

Optimizing application performance with Amazon CodeGuru Profiler

Find Your Application’s Most Expensive Lines of Code and Improve Code Quality with Amazon CodeGuru


How to automate incident response in the AWS Cloud for EC2 instances

Post Syndicated from Ben Eichorst original https://aws.amazon.com/blogs/security/how-to-automate-incident-response-in-aws-cloud-for-ec2-instances/

One of the security epics core to the AWS Cloud Adoption Framework (AWS CAF) is a focus on incident response and preparedness to address unauthorized activity. Multiple methods exist in Amazon Web Services (AWS) for automating classic incident response techniques, and the AWS Security Incident Response Guide outlines many of these methods. This post demonstrates one specific method for instantaneous response and acquisition of infrastructure data from Amazon Elastic Compute Cloud (Amazon EC2) instances.

Incident response starts with detection, progresses to investigation, and then follows with remediation. This process is no different in AWS. AWS services such as Amazon GuardDuty, Amazon Macie, and Amazon Inspector provide detection capabilities. Amazon Detective assists with investigation, including tracking and gathering information. Then, after your security organization decides to take action, pre-planned and pre-provisioned runbooks enable faster action towards a resolution. One principle outlined in the incident response whitepaper and the AWS Well-Architected Framework is the notion of pre-provisioning systems and policies to allow you to react quickly to an incident response event. The solution I present here provides a pre-provisioned architecture for an incident response system that you can use to respond to a suspect EC2 instance.

Infrastructure overview

The architecture that I outline in this blog post automates these standard actions on a suspect compute instance:

  1. Capture all the persistent disks.
  2. Capture the instance state at the time the incident response mechanism is started.
  3. Isolate the instance and protect against accidental instance termination.
  4. Perform operating system–level information gathering, such as memory captures and other parameters.
  5. Notify the administrator of these actions.

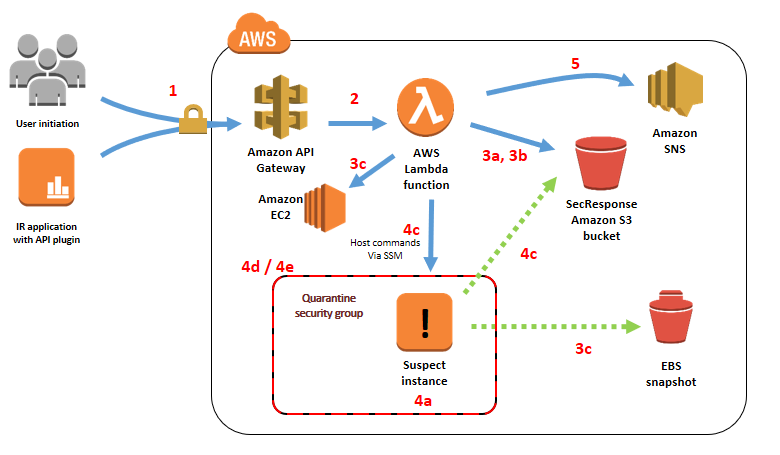
The solution in this blog post accomplishes these tasks through the following logical flow of AWS services, illustrated in Figure 1.
 

Figure 1: Infrastructure deployed by the accompanying AWS CloudFormation template and associated task flow when invoking the main API

Figure 1: Infrastructure deployed by the accompanying AWS CloudFormation template and associated task flow when invoking the main API

  1. A user or application calls an API with an EC2 instance ID to start data collection.
  2. Amazon API Gateway initiates the core logic of the process by instantiating an AWS Lambda function.
  3. The Lambda function performs the following data gathering steps before making any changes to the infrastructure:
    1. Save instance metadata to the SecResponse Amazon Simple Storage Service (Amazon S3) bucket.
    2. Save a snapshot of the instance console to the SecResponse S3 bucket.
    3. Initiate an Amazon Elastic Block Store (Amazon EBS) snapshot of all persistent block storage volumes.
  4. The Lambda function then modifies the infrastructure to continue gathering information, by doing the following steps:
    1. Set the Amazon EC2 termination protection flag on the instance.
    2. Remove any existing EC2 instance profile from the instance.
    3. If the instance is managed by AWS Systems Manager:
      1. Attach an EC2 instance profile with minimal privileges for operating system–level information gathering.
      2. Perform operating system–level information gathering actions through Systems Manager on the EC2 instance.
      3. Remove the instance profile after Systems Manager has completed its actions.
    4. Create a quarantine security group that lacks both ingress and egress rules.
    5. Move the instance into the created quarantine security group for isolation.
  5. Send an administrative notification through the configured Amazon Simple Notification Service (Amazon SNS) topic.

Solution features

By using the mechanisms outlined in this post to codify your incident response runbooks, you can see the following benefits to your incident response plan.

Preparation for incident response before an incident occurs

Both the AWS CAF and Well-Architected Framework recommend that customers formulate known procedures for incident response, and test those runbooks before an incident. Testing these processes before an event occurs decreases the time it takes you to respond in a production environment. The sample infrastructure shown in this post demonstrates how you can standardize those procedures.

Consistent incident response artifact gathering

Codifying your processes into set code and infrastructure prepares you for the need to collect data, but also standardizes the collection process into a repeatable and auditable sequence of What information was collected when and how. This reduces the likelihood of missing data for future investigations.

Walkthrough: Deploying infrastructure and starting the process

To implement the solution outlined in this post, you first need to deploy the infrastructure, and then start the data collection process by issuing an API call.

The code example in this blog post requires that you provision an AWS CloudFormation stack, which creates an S3 bucket for storing your event artifacts and a serverless API that uses API Gateway and Lambda. You then execute a query against this API to take action on a target EC2 instance.

The infrastructure deployed by the AWS CloudFormation stack is a set of AWS components as depicted previously in Figure 1. The stack includes all the services and configurations to deploy the demo. It doesn’t include a target EC2 instance that you can use to test the mechanism used in this post.

Cost

The cost for this demo is minimal because the base infrastructure is completely serverless. With AWS, you only pay for the infrastructure that you use, so the single API call issued in this demo costs fractions of a cent. Artifact storage costs will incur S3 storage prices, and Amazon EC2 snapshots will be stored at their respective prices.

Deploy the AWS CloudFormation stack

In future posts and updates, we will show how to set up this security response mechanism inside a separate account designated for security, but for the purposes of this post, your demo stack must reside in the same AWS account as the target instance that you set up in the next section.

First, start by deploying the AWS CloudFormation template to provision the infrastructure.

To deploy this template in the us-east-1 region

  1. Choose the Launch Stack button to open the AWS CloudFormation console pre-loaded with the template:
     
    Select the Launch Stack button to launch the template
  2. (Optional) In the AWS CloudFormation console, on the Specify Details page, customize the stack name.
  3. For the LambdaS3BucketLocation and LambdaZipFileName fields, leave the default values for the purposes of this blog. Customizing this field allows you to customize this code example for your own purposes and store it in an S3 bucket of your choosing.
  4. Customize the S3BucketName field. This needs to be a globally unique S3 bucket name. This bucket is where gathered artifacts are stored for the demo in this blog. You must customize it beyond the default value for the template to instantiate properly.
  5. (Optional) Customize the SNSTopicName field. This name provides a meaningful label for the SNS topic that notifies the administrator of the actions that were performed.
  6. Choose Next to configure the stack options and leave all default settings in place.
  7. Choose Next to review and scroll to the bottom of the page. Select all three check boxes under the Capabilities and Transforms section, next to each of the three acknowledgements:
    • I acknowledge that AWS CloudFormation might create IAM resources.
    • I acknowledge that AWS CloudFormation might create IAM resources with custom names.
    • I acknowledge that AWS CloudFormation might require the following capability: CAPABILITY_AUTO_EXPAND.
  8. Choose Create Stack.

Set up a target EC2 instance

In order to demonstrate the functionality of this mechanism, you need a target host. Provision any EC2 instance in your account to act as a target for the security response mechanism to act upon for information collection and quarantine. To optimize affordability and demonstrate full functionality, I recommend choosing a small instance size (for example, t2.nano) and optionally joining the instance into Systems Manager for the ability to later execute Run Command API queries. For more details on configuring Systems Manager, refer to the AWS Systems Manager User Guide.

Retrieve required information for system initiation

The entire security response mechanism triggers through an API call. To successfully initiate this call, you first need to gather the API URI and key information.

To find the API URI and key information

  1. Navigate to the AWS CloudFormation console and choose the stack that you’ve instantiated.
  2. Choose the Outputs tab and save the value for the key APIBaseURI. This is the base URI for the API Gateway. It will resemble https://abcdefgh12.execute-api.us-east-1.amazonaws.com.
  3. Next, navigate to the API Gateway console and choose the API with the name SecurityResponse.
  4. Choose API Keys, and then choose the only key present.
  5. Next to the API key field, choose Show to reveal the key, and then save this value to a notepad for later use.

(Optional) Configure administrative notification through the created SNS topic

One aspect of this mechanism is that it sends notifications through SNS topics. You can optionally subscribe your email or another notification pipeline mechanism to the created SNS topic in order to receive notifications on actions taken by the system.

Initiate the security response mechanism

Note that, in this demo code, you’re using a simple API key for limiting access to API Gateway. In production applications, you would use an authentication mechanism such as Amazon Cognito to control access to your API.

To kick off the security response mechanism, initiate a REST API query against the API that was created in the AWS CloudFormation template. You first create this API call by using a curl command to be run from a Linux system.

To create the API initiation curl command

  1. Copy the following example curl command.
    curl -v -X POST -i -H "x-api-key: 012345ABCDefGHIjkLMS20tGRJ7othuyag" https://abcdefghi.execute-api.us-east-1.amazonaws.com/DEMO/secresponse -d '{
      "instance_id":"i-123457890"
    }'
    

  2. Replace the placeholder API key specified in the x-api-key HTTP header with your API key.
  3. Replace the example URI path with your API’s specific URI. To create the full URI, concatenate the base URI listed in the AWS CloudFormation output you gathered previously with the API call path, which is /DEMO/secresponse. This full URI for your specific API call should closely resemble this sample URI path: https://abcdefghi.execute-api.us-east-1.amazonaws.com/DEMO/secresponse
  4. Replace the value associated with the key instance_id with the instance ID of the target EC2 instance you created.

Because this mechanism initiates through a simple API call, you can easily integrate it with existing workflow management systems. This allows for complex data collection and forensic procedures to be integrated with existing incident response workflows.

Review the gathered data

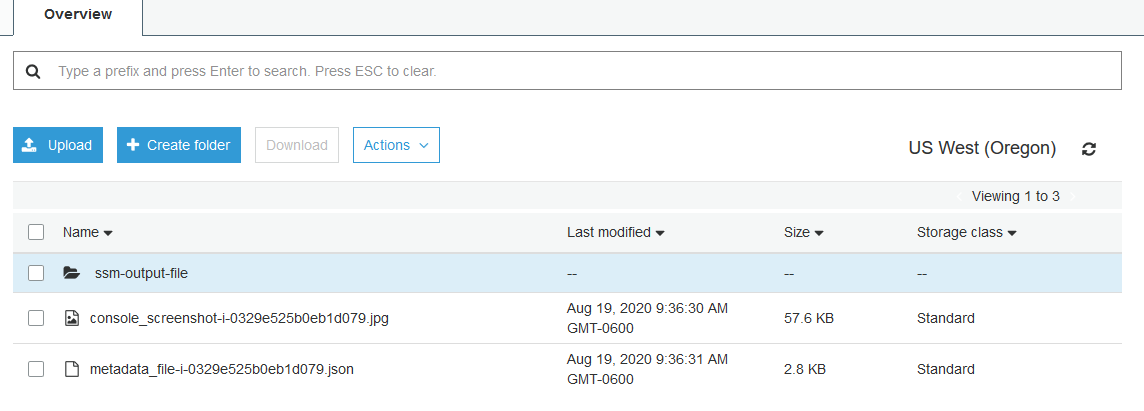
Note that the following items were uploaded as objects in the security response S3 bucket:

  1. A console screenshot, as shown in Figure 2.
  2. (If Systems Manager is configured) stdout information from the commands that were run on the host operating system.
  3. Instance metadata in JSON form.


Figure 2: Example outputs from a successful completion of this blog post's mechanism

Figure 2: Example outputs from a successful completion of this blog post’s mechanism

Additionally, if you load the Amazon EC2 console and scroll down to Elastic Block Store, you can see that EBS snapshots are present for all persistent disks as shown in Figure 3.
 

Figure 3: Evidence of an EBS snapshot from a successful run

Figure 3: Evidence of an EBS snapshot from a successful run

You can also verify that the previously outlined security controls are in place by viewing the instance in the Amazon EC2 console. You should see the removal of AWS Identity and Access Management (IAM) roles from the target EC2 instances and that the instance has been placed into network isolation through a newly created quarantine security group.

Note that for the purposes of this demo, all information that you gathered is stored in the same AWS account as the workload. As a best practice, many AWS customers choose instead to store this information in an AWS account that’s specifically designated for incident response and analysis. A dedicated account provides clear isolation of function and restriction of access. Using AWS Organizations service control policies (SCPs) and IAM permissions, your security team can limit access to adhere to security policy, legal guidance, and compliance regulations.

Clean up and delete artifacts

To clean up the artifacts from the solution in this post, first delete all information in your security response S3 bucket. Then delete the CloudFormation stack that was provisioned at the start of this process in order to clean up all remaining infrastructure.

Conclusion

Placing workloads in the AWS Cloud allows for pre-provisioned and explicitly defined incident response runbooks to be codified and quickly executed on suspect EC2 instances. This enables you to gather data in minutes that previously took hours or even days using manual processes.

If you have feedback about this post, submit comments in the Comments section below. If you have questions about this post, start a new thread on the Amazon EC2 forum or contact AWS Support.

Want more AWS Security how-to content, news, and feature announcements? Follow us on Twitter.

Author

Ben Eichorst

Ben is a Senior Solutions Architect, Security, Cryptography, and Identity Specialist for AWS. He works with AWS customers to efficiently implement globally scalable security programs while empowering development teams and reducing risk. He holds a BA from Northwestern University and an MBA from University of Colorado.

New IAMCTL tool compares multiple IAM roles and policies

Post Syndicated from Sudhir Reddy Maddulapally original https://aws.amazon.com/blogs/security/new-iamctl-tool-compares-multiple-iam-roles-and-policies/

If you have multiple Amazon Web Services (AWS) accounts, and you have AWS Identity and Access Management (IAM) roles among those multiple accounts that are supposed to be similar, those roles can deviate over time from your intended baseline due to manual actions performed directly out-of-band called drift. As part of regular compliance checks, you should confirm that these roles have no deviations. In this post, we present a tool called IAMCTL that you can use to extract the IAM roles and policies from two accounts, compare them, and report out the differences and statistics. We will explain how to use the tool, and will describe the key concepts.

Prerequisites

Before you install IAMCTL and start using it, here are a few prerequisites that need to be in place on the computer where you will run it:

To follow along in your environment, clone the files from the GitHub repository, and run the steps in order. You won’t incur any charges to run this tool.

Install IAMCTL

This section describes how to install and run the IAMCTL tool.

To install and run IAMCTL

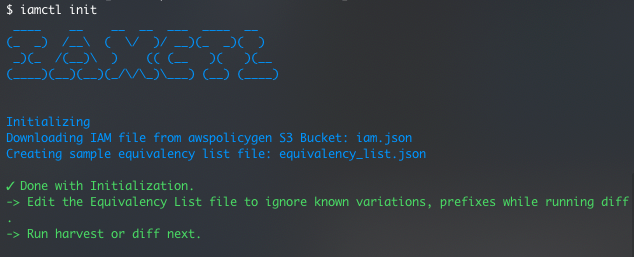
  1. At the command line, enter the following command:
    pip3 install git+ssh://[email protected]/aws-samples/[email protected]
    

    You will see output similar to the following.

    Figure 1: IAMCTL tool installation output

    Figure 1: IAMCTL tool installation output

  2. To confirm that your installation was successful, enter the following command.
    iamctl –h
    

    You will see results similar to those in figure 2.

    Figure 2: IAMCTL help message

    Figure 2: IAMCTL help message

Now that you’ve successfully installed the IAMCTL tool, the next section will show you how to use the IAMCTL commands.

Example use scenario

Here is an example of how IAMCTL can be used to find differences in IAM roles between two AWS accounts.

A system administrator for a product team is trying to accelerate a product launch in the middle of testing cycles. Developers have found that the same version of their application behaves differently in the development environment as compared to the QA environment, and they suspect this behavior is due to differences in IAM roles and policies.

The application called “app1” primarily reads from an Amazon Simple Storage Service (Amazon S3) bucket, and runs on an Amazon Elastic Compute Cloud (Amazon EC2) instance. In the development (DEV) account, the application uses an IAM role called “app1_dev” to access the S3 bucket “app1-dev”. In the QA account, the application uses an IAM role called “app1_qa” to access the S3 bucket “app1-qa”. This is depicted in figure 3.

Figure 3: Showing the “app1” application in the development and QA accounts

Figure 3: Showing the “app1” application in the development and QA accounts

Setting up the scenario

To simulate this setup for the purpose of this walkthrough, you don’t have to create the EC2 instance or the S3 bucket, but just focus on the IAM role, inline policy, and trust policy.

As noted in the prerequisites, you will switch between the two AWS accounts by using the AWS CLI named profiles “dev-profile” and “qa-profile”, which are configured to point to the DEV and QA accounts respectively.

Start by using this command:

mkdir -p iamctl_test iamctl_test/dev iamctl_test/qa

The command creates a directory structure that looks like this:
Iamctl_test
|– qa
|– dev

Now, switch to the dev folder to run all the following example commands against the DEV account, by using this command:

cd iamctl_test/dev

To create the required policies, first create a file named “app1_s3_access_policy.json” and add the following policy to it. You will use this file’s content as your role’s inline policy.

{
    "Version": "2012-10-17",
    "Statement": [
        {
            "Effect": "Allow",
            "Action": [
                "s3:Get*",
                "s3:List*"
            ],
            "Resource": [
         "arn:aws:s3:::app1-dev/shared/*"
            ]
        }
    ]
}

Second, create a file called “app1_trust_policy.json” and add the following policy to it. You will use this file’s content as your role’s trust policy.

{
  "Version": "2012-10-17",
  "Statement": [
    {
      "Effect": "Allow",
      "Principal": {
        "Service": "ec2.amazonaws.com"
      },
      "Action": "sts:AssumeRole"
    }
  ]
}

Now use the two files to create an IAM role with the name “app1_dev” in the account by using these command(s), run in the same order as listed here:

#create role with trust policy

aws --profile dev-profile iam create-role --role-name app1_dev --assume-role-policy-document file://app1_trust_policy.json

#put inline policy to the role created above
 
aws --profile dev-profile iam put-role-policy --role-name app1_dev --policy-name s3_inline_policy --policy-document file://app1_s3_access_policy.json

In the QA account, the IAM role is named “app1_qa” and the S3 bucket is named “app1-qa”.

Repeat the steps from the prior example against the QA account by changing dev to qa where shown in bold in the following code samples. Change the directory to qa by using this command:

cd ../qa

To create the required policies, first create a file called “app1_s3_access_policy.json” and add the following policy to it.

{
    "Version": "2012-10-17",
    "Statement": [
        {
            "Effect": "Allow",
            "Action": [
                "s3:Get*",
                "s3:List*"
            ],
            "Resource": [
         "arn:aws:s3:::app1-qa/shared/*"
            ]
        }
    ]
}

Next, create a file, called “app1_trust_policy.json” and add the following policy.

{
  "Version": "2012-10-17",
  "Statement": [
    {
      "Effect": "Allow",
      "Principal": {
        "Service": "ec2.amazonaws.com"
      },
      "Action": "sts:AssumeRole"
    }
  ]
}

Now, use the two files created so far to create an IAM role with the name “app1_qa” in your QA account by using these command(s), run in the same order as listed here:

#create role with trust policy
aws --profile qa-profile iam create-role --role-name app1_qa --assume-role-policy-document file://app1_trust_policy.json

#put inline policy to the role create above
aws --profile qa-profile iam put-role-policy --role-name app1_qa --policy-name s3_inline_policy --policy-document file://app1_s3_access_policy.json

So far, you have two accounts with an IAM role created in each of them for your application. In terms of permissions, there are no differences other than the name of the S3 bucket resource the permission is granted against.

You can expect IAMCTL to generate a minimal set of differences between the DEV and QA accounts, assuming all other IAM roles and policies are the same, but to be sure about the current state of both accounts, in IAMCTL you can run a process called baselining.

Through the process of baselining, you will generate an equivalency dictionary that represents all the known string patterns that reduce the noise in the generated deviations list, and then you will introduce a change into one of the IAM roles in your QA account, followed by a final IAMCTL diff to show the deviations.

Baselining

Baselining is the process of bringing two accounts to an “equivalence” state for IAM roles and policies by establishing a baseline, which future diff operations can leverage. The process is as simple as:

  1. Run the iamctl diff command.
  2. Capture all string substitutions into an equivalence dictionary to remove or reduce noise.
  3. Save the generated detailed files as a snapshot.

Now you can go through these steps for your baseline.

Go ahead and run the iamctl diff command against these two accounts by using the following commands.

#change directory from qa to iamctl-test
cd ..

#run iamctl init
iamctl init

The results of running the init command are shown in figure 4.

Figure 4: Output of the iamctl init command

Figure 4: Output of the iamctl init command

If you look at the iamctl_test directory now, shown in figure 5, you can see that the init command created two files in the iamctl_test directory.

Figure 5: The directory structure after running the init command

Figure 5: The directory structure after running the init command

These two files are as follows:

  1. iam.jsonA reference file that has all AWS services and actions listed, among other things. IAMCTL uses this to map the resource listed in an IAM policy to its corresponding AWS resource, based on Amazon Resource Name (ARN) regular expression.
  2. equivalency_list.jsonThe default sample dictionary that IAMCTL uses to suppress false alarms when it compares two accounts. This is where the known string patterns that need to be substituted are added.

Note: A best practice is to make the directory where you store the equivalency dictionary and from which you run IAMCTL to be a Git repository. Doing this will let you capture any additions or modifications for the equivalency dictionary by using Git commits. This will not only give you an audit trail of your historical baselines but also gives context to any additions or modifications to the equivalency dictionary. However, doing this is not necessary for the regular functioning of IAMCTL.

Next, run the iamctl diff command:

#run iamctl diff
iamctl diff dev-profile dev qa-profile qa
Figure 6: Result of diff command

Figure 6: Result of diff command

Figure 6 shows the results of running the diff command. You can see that IAMCTL considers the app1_qa and app1_dev roles as unique to the DEV and QA accounts, respectively. This is because IAMCTL uses role names to decide whether to compare the role or tag the role as unique.

You will add the strings “dev” and “qa” to the equivalency dictionary to instruct IAMCTL to substitute occurrences of these two strings with “accountname” by adding the follow JSON to the equivalency_list.json file. You will also clean up some defaults already present in there.

echo “{“accountname”:[“dev”,”qa”]}” > equivalency_list.json

Figure 7 shows the equivalency dictionary before you take these actions, and figure 8 shows the dictionary after these actions.

Figure 7: Equivalency dictionary before

Figure 7: Equivalency dictionary before

Figure 8: Equivalency dictionary after

Figure 8: Equivalency dictionary after

There’s another thing to notice here. In this example, one common role was flagged as having a difference. To know which role this is and what the difference is, go to the detail reports folder listed at the bottom of the summary report. The directory structure of this folder is shown in figure 9.

Notice that the reports are created under your home directory with a folder structure that mimics the time stamp down to the second. IAMCTL does this to maintain uniqueness for each run.

tree /Users/<username>/aws-idt/output/2020/08/24/08/38/49/
Figure 9: Files written to the output reports directory

Figure 9: Files written to the output reports directory

You can see there is a file called common_roles_in_dev_with_differences.csv, and it lists a role called “AwsSecurity***Audit”.

You can see there is another file called dev_to_qa_common_role_difference_items.csv, and it lists the granular IAM items from the DEV account that belong to the “AwsSecurity***Audit” role as compared to QA, but which have differences. You can see that all entries in the file have the DEV account number in the resource ARN, whereas in the qa_to_dev_common_role_difference_items.csv file, all entries have the QA account number for the same role “AwsSecurity***Audit”.

Add both of the account numbers to the equivalency dictionary to substitute them with a placeholder number, because you don’t want this role to get flagged as having differences.

echo “{“accountname”:[“dev”,”qa”],”000000000000”:[“123456789012”,”987654321098”]}” > equivalency_list.json

Now, re-run the diff command.

#run iamctl diff
iamctl diff dev-profile dev qa-profile qa

As you can see in figure 10, you get back the result of the diff command that shows that the DEV account doesn’t have any differences in IAM roles as compared to the QA account.

Figure 10: Output showing no differences after completion of baselining

Figure 10: Output showing no differences after completion of baselining

This concludes the baselining for your DEV and QA accounts. Now you will introduce a change.

Introducing drift

Drift occurs when there is a difference in actual vs expected values in the definition or configuration of a resource. There are several reasons why drift occurs, but for this scenario you will use “intentional need to respond to a time-sensitive operational event” as a reason to mimic and introduce drift into what you have built so far.

To simulate this change, add “s3:PutObject” to the qa app1_s3_access_policy.json file as shown in the following example.

{
    "Version": "2012-10-17",
    "Statement": [
        {
            "Effect": "Allow",
            "Action": [
                "s3:Get*",
                "s3:List*",
                "s3:PutObject"
            ],
            "Resource": [
         "arn:aws:s3:::app1-qa/shared/*"
            ]
        }
    ]
}

Put this new inline policy on your existing role “app1_qa” by using this command:

aws --profile qa-profile iam put-role-policy --role-name app1_qa --policy-name s3_inline_policy --policy-document file://app1_s3_access_policy.json

The following table represents the new drift in the accounts.

Action Account-DEV
Role name: app1_dev
Account-QA
Role name: app1_qa
s3:Get* Yes Yes
s3:List* Yes Yes
s3: PutObject No Yes

Next, run the iamctl diff command to see how it picks up the drift from your previously baselined accounts.

#change directory from qa to iamctL-test
cd ..
iamctl diff dev-profile dev qa-profile qa
Figure 11: Output showing the one deviation that was introduced

Figure 11: Output showing the one deviation that was introduced

You can see that IAMCTL now shows that the QA account has one difference as compared to DEV, which is what we expect based on the deviation you’ve introduced.

Open up the file qa_to_dev_common_role_difference_items.csv to look at the one difference. Again, adjust the following path example with the output from the iamctl diff command at the bottom of the summary report in Figure 11.

cat /Users/<username>/aws-idt/output/2020/09/18/07/38/15/qa_to_dev_common_role_difference_items.csv

As shown in figure 12, you can see that the file lists the specific S3 action “PutObject” with the role name and other relevant details.

Figure 12: Content of file qa_to_dev_common_role_difference_items.csv showing the one deviation that was introduced

Figure 12: Content of file qa_to_dev_common_role_difference_items.csv showing the one deviation that was introduced

You can use this information to remediate the deviation by performing corrective actions in either your DEV account or QA account. You can confirm the effectiveness of the corrective action by re-baselining to make sure that zero deviations appear.

Conclusion

In this post, you learned how to use the IAMCTL tool to compare IAM roles between two accounts, to arrive at a granular list of meaningful differences that can be used for compliance audits or for further remediation actions. If you’ve created your IAM roles by using an AWS CloudFormation stack, you can turn on drift detection and easily capture the drift because of changes done outside of AWS CloudFormation to those IAM resources. For more information about drift detection, see Detecting unmanaged configuration changes to stacks and resources. Lastly, see the GitHub repository where the tool is maintained with documentation describing each of the subcommand concepts. We welcome any pull requests for issues and enhancements.

If you have feedback about this post, submit comments in the Comments section below. If you have questions about this post, start a new thread on the AWS IAM forum or contact AWS Support.

Want more AWS Security how-to content, news, and feature announcements? Follow us on Twitter.

Author

Sudhir Reddy Maddulapally

Sudhir is a Senior Partner Solution Architect who builds SaaS solutions for partners by day and is a tech tinkerer by night. He enjoys trips to state and national parks, and Yosemite is his favorite thus far!

Author

Soumya Vanga

Soumya is a Cloud Application Architect with AWS Professional Services in New York, NY, helping customers design solutions and workloads and to adopt Cloud Native services.

Improved client-side encryption: Explicit KeyIds and key commitment

Post Syndicated from Alex Tribble original https://aws.amazon.com/blogs/security/improved-client-side-encryption-explicit-keyids-and-key-commitment/

I’m excited to announce the launch of two new features in the AWS Encryption SDK (ESDK): local KeyId filtering and key commitment. These features each enhance security for our customers, acting as additional layers of protection for your most critical data. In this post I’ll tell you how they work. Let’s dig in.

The ESDK is a client-side encryption library designed to make it easy for you to implement client-side encryption in your application using industry standards and best practices. Since the security of your encryption is only as strong as the security of your key management, the ESDK integrates with the AWS Key Management Service (AWS KMS), though the ESDK doesn’t require you to use any particular source of keys. When using AWS KMS, the ESDK wraps data keys to one or more customer master keys (CMKs) stored in AWS KMS on encrypt, and calls AWS KMS again on decrypt to unwrap the keys.

It’s important to use only CMKs you trust. If you encrypt to an untrusted CMK, someone with access to the message and that CMK could decrypt your message. It’s equally important to only use trusted CMKs on decrypt! Decrypting with an untrusted CMK could expose you to ciphertext substitution, where you could decrypt a message that was valid, but written by an untrusted actor. There are several controls you can use to prevent this. I recommend a belt-and-suspenders approach. (Technically, this post’s approach is more like a belt, suspenders, and an extra pair of pants.)

The first two controls aren’t new, but they’re important to consider. First, you should configure your application with an AWS Identity and Access Management (IAM) policy that only allows it to use specific CMKs. An IAM policy allowing Decrypt on “Resource”:”*” might be appropriate for a development or testing account, but production accounts should list out CMKs explicitly. Take a look at our best practices for IAM policies for use with AWS KMS for more detailed guidance. Using IAM policy to control access to specific CMKs is a powerful control, because you can programmatically audit that the policy is being used across all of your accounts. To help with this, AWS Config has added new rules and AWS Security Hub added new controls to detect existing IAM policies that might allow broader use of CMKs than you intended. We recommend that you enable Security Hub’s Foundational Security Best Practices standard in all of your accounts and regions. This standard includes a set of vetted automated security checks that can help you assess your security posture across your AWS environment. To help you when writing new policies, the IAM policy visual editor in the AWS Management Console warns you if you are about to create a new policy that would add the “Resource”:”*” condition in any policy.

The second control to consider is to make sure you’re passing the KeyId parameter to AWS KMS on Decrypt and ReEncrypt requests. KeyId is optional for symmetric CMKs on these requests, since the ciphertext blob that the Encrypt request returns includes the KeyId as metadata embedded in the blob. That’s quite useful—it’s easier to use, and means you can’t (permanently) lose track of the KeyId without also losing the ciphertext. That’s an important concern for data that you need to access over long periods of time. Data stores that would otherwise include the ciphertext and KeyId as separate objects get re-architected over time and the mapping between the two objects might be lost. If you explicitly pass the KeyId in a decrypt operation, AWS KMS will only use that KeyId to decrypt, and you won’t be surprised by using an untrusted CMK. As a best practice, pass KeyId whenever you know it. ESDK messages always include the KeyId; as part of this release, the ESDK will now always pass KeyId when making AWS KMS Decrypt requests.

A third control to protect you from using an unexpected CMK is called local KeyId filtering. If you explicitly pass the KeyId of an untrusted CMK, you would still be open to ciphertext substitution—so you need to be sure you’re only passing KeyIds that you trust. The ESDK will now filter KeyIds locally by using a list of trusted CMKs or AWS account IDs you configure. This enforcement happens client-side, before calling AWS KMS. Let’s walk through a code sample. I’ll use Java here, but this feature is available in all of the supported languages of the ESDK.

Let’s say your app is decrypting ESDK messages read out of an Amazon Simple Queue Service (Amazon SQS) queue. Somewhere you’ll likely have a function like this:

public byte[] decryptMessage(final byte[] messageBytes,
                             final Map<String, String> encryptionContext) {
    // The Amazon Resource Name (ARN) of your CMK.
    final String keyArn = "arn:aws:kms:us-west-2:111122223333:key/1234abcd-12ab-34cd-56ef-1234567890ab";

    // 1. Instantiate the SDK
    AwsCrypto crypto = AwsCrypto.builder().build();

Now, when you create a KmsMasterKeyProvider, you’ll configure it with one or more KeyIds you expect to use. I’m passing a single element here for simplicity.

	// 2. Instantiate a KMS master key provider in Strict Mode using buildStrict()
    final KmsMasterKeyProvider keyProvider = KmsMasterKeyProvider.builder().buildStrict(keyArn); 

Decrypt the message as normal. The ESDK will check each encrypted data key against the list of KeyIds configured at creation: in the preceeding example, the single CMK in keyArn. The ESDK will only call AWS KMS for matching encrypted data keys; if none match, it will throw a CannotUnwrapDataKeyException.

	// 3. Decrypt the message.
    final CryptoResult<byte[], KmsMasterKey> decryptResult = crypto.decryptData(keyProvider, messageBytes);

    // 4. Validate the encryption context.
    //

(See our documentation for more information on how encryption context provides additional authentication features!)

	checkEncryptionContext(decryptResult, encryptionContext);

    // 5. Return the decrypted bytes.
    return decryptResult.getResult();
}

We recommend that everyone using the ESDK with AWS KMS adopt local KeyId filtering. How you do this varies by language—the ESDK Developer Guide provides detailed instructions and example code.

I’m especially excited to announce the second new feature of the ESDK, key commitment, which addresses a non-obvious property of modern symmetric ciphers used in the industry (including the Advanced Encryption Standard (AES)). These ciphers have the property that decrypting a single ciphertext with two different keys could give different plaintexts! Picking a pair of keys that decrypt to two specific messages involves trying random keys until you get the message you want, making it too expensive for most messages. However, if you’re encrypting messages of a few bytes, it might be feasible. Most authenticated encryption schemes, such as AES-GCM, don’t solve for this issue. Instead, they prevent someone who doesn’t control the keys from tampering with the ciphertext. But someone who controls both keys can craft a ciphertext that will properly authenticate under each key by using AES-GCM.

All of this means that if a sender can get two parties to use different keys, those two parties could decrypt the exact same ciphertext and get different results. That could be problematic if the message reads, for example, as “sell 1000 shares” to one party, and “buy 1000 shares” to another.

The ESDK solves this problem for you with key commitment. Key commitment means that only a single data key can decrypt a given message, and that trying to use any other data key will result in a failed authentication check and a failure to decrypt. This property allows for senders and recipients of encrypted messages to know that everyone will see the same plaintext message after decryption.

Key commitment is on by default in version 2.0 of the ESDK. This is a breaking change from earlier versions. Existing customers should follow the ESDK migration guide for their language to upgrade from 1.x versions of the ESDK currently in their environment. I recommend a thoughtful and careful migration.

AWS is always looking for feedback on ways to improve our services and tools. Security-related concerns can be reported to AWS Security at [email protected]. We’re deeply grateful for security research, and we’d like to thank Thai Duong from Google’s security team for reaching out to us. I’d also like to thank my colleagues on the AWS Crypto Tools team for their collaboration, dedication, and commitment (pun intended) to continuously improving our libraries.

If you have feedback about this post, submit comments in the Comments section below. If you have questions about this post, start a new thread on the AWS Crypto Tools forum or contact AWS Support.

Want more AWS Security how-to content, news, and feature announcements? Follow us on Twitter.

Author

Alex Tribble

Alex is a Principal Software Development Engineer in AWS Crypto Tools. She joined Amazon in 2008 and has spent her time building security platforms, protecting availability, and generally making things faster and cheaper. Outside of work, she, her wife, and children love to pack as much stuff into as few bikes as possible.