Tag Archives: How-to

What takes disk space

Post Syndicated from Aigars Kadiķis original https://blog.zabbix.com/what-takes-disk-space/13349/

In today’s class let’s talk about where the disk space goes. Which items and hosts objects consume the disk space the most.

The post will cover things like:
Biggest tables in a database
Biggest data coming to the instance right now
Biggest data inside one partition of the DB table
Print hosts and items which consumes the most disk space

Biggest tables

In general, the leading tables are:

history
history_uint
history_str
history_text
history_log
events

‘history_uint’ will store integers. ‘history’ will store decimal numbers.
‘history_str’, ‘history_text’, ‘history_log’ stores textual data.
In the table ‘events’ goes problem events, internal events, agent auto-registration events, discovery events.

Have a look yourself in a database which tables take the most space. On MySQL:

SELECT table_name,
       table_rows,
       data_length,
       index_length,
       round(((data_length + index_length) / 1024 / 1024 / 1024),2) "Size in GB"
FROM information_schema.tables
WHERE table_schema = "zabbix"
ORDER BY round(((data_length + index_length) / 1024 / 1024 / 1024),2) DESC
LIMIT 8;

On PostgreSQL:

SELECT *, pg_size_pretty(total_bytes) AS total , pg_size_pretty(index_bytes) AS index ,
       pg_size_pretty(toast_bytes) AS toast , pg_size_pretty(table_bytes) AS table
FROM (SELECT *, total_bytes-index_bytes-coalesce(toast_bytes, 0) AS table_bytes
   FROM (SELECT c.oid,
             nspname AS table_schema,
             relname AS table_name ,
             c.reltuples AS row_estimate ,
             pg_total_relation_size(c.oid) AS total_bytes ,
             pg_indexes_size(c.oid) AS index_bytes ,
             pg_total_relation_size(reltoastrelid) AS toast_bytes
      FROM pg_class c
      LEFT JOIN pg_namespace n ON n.oid = c.relnamespace
      WHERE relkind = 'r' ) a) a;

Detect big data coming to instance right now

Analyze ‘history_log’ table for the last 30 minutes:

SELECT hosts.host,items.itemid,items.key_,
COUNT(history_log.itemid)  AS 'count', AVG(LENGTH(history_log.value)) AS 'avg size',
(COUNT(history_log.itemid) * AVG(LENGTH(history_log.value))) AS 'Count x AVG'
FROM history_log 
JOIN items ON (items.itemid=history_log.itemid)
JOIN hosts ON (hosts.hostid=items.hostid)
WHERE clock > UNIX_TIMESTAMP(NOW() - INTERVAL 30 MINUTE)
GROUP BY hosts.host,history_log.itemid
ORDER BY 6 DESC
LIMIT 1\G

With PostgreSQL:

SELECT hosts.host,history_log.itemid,items.key_,
COUNT(history_log.itemid) AS "count", AVG(LENGTH(history_log.value))::NUMERIC(10,2) AS "avg size",
(COUNT(history_log.itemid) * AVG(LENGTH(history_log.value)))::NUMERIC(10,2) AS "Count x AVG"
FROM history_log 
JOIN items ON (items.itemid=history_log.itemid)
JOIN hosts ON (hosts.hostid=items.hostid)
WHERE clock > EXTRACT(epoch FROM NOW()-INTERVAL '30 MINUTE')
GROUP BY hosts.host,history_log.itemid,items.key_
ORDER BY 6 DESC
LIMIT 5
\gx

Re-run the same query but replace ‘history_log’ (in all places) with ‘history_text’ or ‘history_str’.

Which hosts consume the most space

This is a very heavy query. We will go back one day and analyze 6 minutes of that data:

SELECT ho.hostid, ho.name, count(*) AS records, 
(count(*)* (SELECT AVG_ROW_LENGTH FROM information_schema.tables 
WHERE TABLE_NAME = 'history_text' and TABLE_SCHEMA = 'zabbix')/1024/1024) AS 'Total size average (Mb)', 
sum(length(history_text.value))/1024/1024 + sum(length(history_text.clock))/1024/1024 + sum(length(history_text.ns))/1024/1024 + sum(length(history_text.itemid))/1024/1024 AS 'history_text Column Size (Mb)'
FROM history_text
LEFT OUTER JOIN items i on history_text.itemid = i.itemid 
LEFT OUTER JOIN hosts ho on i.hostid = ho.hostid 
WHERE ho.status IN (0,1)
AND clock > UNIX_TIMESTAMP(now() - INTERVAL 1 DAY - INTERVAL 6 MINUTE)
AND clock < UNIX_TIMESTAMP(now() - INTERVAL 1 DAY)
GROUP BY ho.hostid
ORDER BY 4 DESC
LIMIT 5\G

If “6-minute query” works in a relatively good time frame, try “INTERVAL 60 MINUTE”.
If “INTERVAL 60 MINUTE” works good, try “INTERVAL 600 MINUTE”.

Analyze in partition level (MySQL)

On MySQL, if database table partitioning is enabled we can list the biggest partitions on a filesystem:

ls -lh history_log#*

It will print:

-rw-r-----. 1 mysql mysql  44M Jan 24 20:23 history_log#p#p2021_02w.ibd
-rw-r-----. 1 mysql mysql  24M Jan 24 21:20 history_log#p#p2021_03w.ibd
-rw-r-----. 1 mysql mysql 128K Jan 11 00:59 history_log#p#p2021_04w.ibd

From previous output, we can take partition name ‘p2021_02w’ and use it in a query:

SELECT ho.hostid, ho.name, count(*) AS records, 
(count(*)* (SELECT AVG_ROW_LENGTH FROM information_schema.tables 
WHERE TABLE_NAME = 'history_log' and TABLE_SCHEMA = 'zabbix')/1024/1024) AS 'Total size average (Mb)', 
sum(length(history_log.value))/1024/1024 + 
sum(length(history_log.clock))/1024/1024 +
sum(length(history_log.ns))/1024/1024 + 
sum(length(history_log.itemid))/1024/1024 AS 'history_log Column Size (Mb)'
FROM history_log PARTITION (p2021_02w)
LEFT OUTER JOIN items i on history_log.itemid = i.itemid 
LEFT OUTER JOIN hosts ho on i.hostid = ho.hostid 
WHERE ho.status IN (0,1)
GROUP BY ho.hostid
ORDER BY 4 DESC
LIMIT 10;

You can reproduce a similar scenario while listing:

ls -lh history_text#*
ls -lh history_str#*

Free up disk space (MySQL)

Deleting a host in GUI will not free up data space on MySQL. It will create empty rows in table where the new data can be inserted. If you want to really free up disk space, we can rebuild partition. At first list all possible partition names:

SHOW CREATE TABLE history\G

To rebuild partition:

ALTER TABLE history REBUILD PARTITION p202101160000;

Free up disk space (PostgreSQL)

On PostgreSQL, there is a process which is responsible for vacuuming the table. To ensure a vacuum has been done lately, kindly run:

SELECT schemaname, relname, n_live_tup, n_dead_tup, last_autovacuum
FROM pg_stat_all_tables
WHERE n_dead_tup > 0
ORDER BY n_dead_tup DESC;

In output, we look at ‘n_dead_tup’ it means a dead tuple.
If the last auto vacuum has not occurred in last 10 days, it’s bad. We have to install a different definition. We can increase vacuum priority by having:

vacuum_cost_page_miss = 10
vacuum_cost_page_dirty = 20
autovacuum_vacuum_threshold = 50
autovacuum_vacuum_scale_factor = 0.01
autovacuum_vacuum_cost_delay = 20ms
autovacuum_vacuum_cost_limit = 3000
autovacuum_max_workers = 6

Alright. That is it for today.

Getting your notifications via Signal

Post Syndicated from Brian van Baekel original https://blog.zabbix.com/getting-your-notifications-via-signal/13286/

Recently, Whatsapp pushed their new privacy policy where they announced to share more data with Facebook, causing an exodus to other platforms, where Signal is one of the more popular ones, among Telegram. Both are great alternatives, but I prefer Signal due to the open-source part, end to end encryption, and last but not least: their business model (living on donations instead of selling your data).

Typically, Zabbix is sending notifications to whatever medium you’ve chosen if a problem is detected. We all know the Email messages, the various webhook integrations with Slack/MS Teams/ Jira, etc, perhaps even some text message integrations and such. Now, if we’re migrating to Signal, we suddenly have access to the Signal API and can utilize it to receive Zabbix notifications. Nice!

There is only one drawback. You need a separate phone number to register against Signal. Don’t use your own phone number – unless you want to lose the ability to use Signal ;(

There are various ways to get a phone number for this purpose:

  • Use the phone number of your current SMS gateway
  • Use the company phone number (a lot of cloud PBX are providing the option to receive the verification email)
  • Purchase a prepaid phone number.
  • Use a service like Twilio

You just need to receive one text message, the rest of the communications will go via the internet

Time to get rid of Whatsapp and move to Signal! But… How to use Signal to get your notifications?

Signal-cli

Although we could built everything from scratch, talking to the API of Signal, there is a nice implementation available in order to talk to Signal within a few minutes: Signal-cli

Although this github page is very comprehensive in order to get Signal-cli installed, but of course it is not doing anything with Zabbix.

Configuration tasks

For this guide, we’re using:

  • Centos 8
  • Zabbix 5.2

signal-cli installation

First, lets install the Signal-cli utility, and in order to do so we need to resolve the dependency of Java by installing the openjdk application:

dnf -y install java-11-openjdk-devel.x86_64

After this installation, we should be good to continue with the installation of signal-cli. According to their installation guide, this should be sufficient:

export VERSION="0.7.3"
wget https://github.com/AsamK/signal-cli/releases/download/v"${VERSION}"/signal-cli-"${VERSION}".tar.gz
sudo tar xf signal-cli-"${VERSION}".tar.gz -C /opt
sudo ln -sf /opt/signal-cli-"${VERSION}"/bin/signal-cli /usr/local/bin/

At the time of writing, the most recent version is 0.7.3, and that’s what we’re installing here. If in the future a new version is released, of course you should install that!

If everything went as expected, we should be able to register ourself to Signal.

signal-cli registration

Since we want to execute these commands by Zabbix, we must make sure the registration is done with the correct user on the Zabbix server, otherwise you will get the following error message:

Unregistered user error

(ERROR App – User +19293771253 is not registered.)

In order to prevent this error, lets do the authentication against Signal as Zabbix user:

Important: The USERNAME (your phone number) must include the country calling code, i.e. the number must start with a “+” sign and you must replace everything between the  < > in the following examples with your own values

runuser -l zabbix -c 'signal-cli -u <NUMBER> register'

Now, check for incoming test messages on this phone number. Within seconds you should receive a 6 digit code in the following format: xxx-xxx

Once you’ve received the text, it’s time to complete the registration:

runuser -l zabbix -c 'signal-cli -u <NUMBER> verify <CODE>'

Since we’re running these commands as a different user, we won’t see the output of them. Let’s just test!

Sending messages from the command line is straight forward:

runuser -l zabbix -c 'signal-cli -u <NUMBER> send -m <MESSAGE> <RECEIVER NUMBER>'

You will see the message id as output. Simply ignore it, since it’s not relevant at this point.

Within seconds:

It works! Great.

So now we’ve got this part covered, time to get the AlertScript set up, before heading to the frontend.

Zabbix AlertScript setup

Ok, so now we’ve got the registration done, we need to make sure Zabbix can utilise it. In order to do so, we use a very old method. Although it would’ve made more sense to use the webhook option, that means I had to built the communication with Signal from scratch.

So AlertScripts it is. In your terminal/SSH session with the Zabbix server open a new file with this command: vi /usr/lib/zabbix/alertscripts/signal.sh and insert the following contents:

#!/bin/bash
signal-cli -u '+19293771253' send -m "$1" $2

 That’s right. just 2 lines. After saving the file, change the owner and set the permissions:

chown zabbix:zabbix /usr/lib/zabbix/alertscripts/signal.sh
chmod 7000 /usr/lib/zabbix/alertscripts/signal.sh

and it’s time to move to our frontend.

Zabbix mediatype configuration

In the frontend, go to Administration -> Mediatypes and create a new mediatype:

Signal Mediatype

Name: Signal
Type: Script
Script name: signal.sh
Script parameters:
    {ALERT.MESSAGE}
    {ALERT.SENDTO}

don’t forget to configure some Message templates as well (second tab in the Mediatype configuration). You can just use the defaults if you click on ‘add’

Zabbix media configuration

Next step. Navigate to Administration -> Users (or just open your own user profile) and create a new media:

new-media

Type: Signal
Sendto: <your number>
When active / severity as per needs

Important: The USERNAME (your phone number) must include the country calling code, i.e. the number must start with a “+” sign

We’re almost there, just some configuration on the actions

Zabbix action configuration

This step is only needed if you are sending notifications right now via a specific mediatype. If you configured the ‘send only to’ option to ‘- All -‘ there is nothing to change, and it will work straight away!

Otherwise, navigate to Configuration -> Actions and find the action you want to change, and in the Operations, Recovery operations and Update operations change the ‘send only to’ option to ‘Signal’

Save your action and it’s time to test – Generate some problem to confirm the implementation actually works.

Wrap up

That’s it. By now you should have a working implementation where Zabbix is sending notifications to Signal. The setup was extremely straight forward and easy to configure. Nevertheless, if you need help getting this going, we (Opensource ICT Solutions) offer consultancy services as well, and are more than happy to help you out!


Examine Data Overview

Post Syndicated from Aigars Kadiķis original https://blog.zabbix.com/examine-data-overview/13225/

In this lab, let’s practice to create an on-screen report of the data (most recent metrics) which is very important for us.

This post represents one technique how to advance from functionality under:
“Monitoring” => “Overview”.

To create a report of the things you are fancy, we need to somehow mark those things. We need to mark items to belong under a specific application. The best way is to modify the name of an existing application and add some extra keywords inside. Please don’t create a second application. I will explain later why to not do so.

Here is a thought process of how to mark items under a single application.

Sample 1:

Total Memory
Total amount of CPU cores

Sample 2:

Current usage CPU
Current usage Memory

Sample 3:

TCP state ESTABLISHED
TCP state LISTEN
TCP state TIME_WAIT
...

It’s always only one application. Notice that each group has a common keyword: “Total”, “Current usage”, “TCP state”.

Now to list the data coming from a specific application:

  1. “Monitoring” => “Overview”
  2. Select “Data overview”
  3. Pick a “Host groups”
  4. Set an “Application”
  5. On the right top corner set Hosts location: “Left”
  6. Apply

It is always quite challenging to think of a naming system which is very independent and not overlapping. Good luck and keep “challenge accepted” running in your heart.

Of course, you can create an “extra” application for each item, for example, an application “Overview1”, but that will create a duplicate entry while browsing data under:
“Monitoring” => “Latest data”.

It’s possible to reach some limitations in the “Data overview” page if there are more than 50 entries to represent. We will see the message at the bottom of the page:

Not all results are displayed. Please provide more specific search criteria.

To solve this problem starting with 5.2 there is an option to configure the limit (default is 50):

On version 5.0 to customize this, have to modify ‘defines.inc.php’

# cd /usr/share/zabbix/include
# grep ZBX_MAX_TABLE_COLUMNS defines.inc.php
define('ZBX_MAX_TABLE_COLUMNS', 50);

Summarize devices that are not reachable

Post Syndicated from Aigars Kadiķis original https://blog.zabbix.com/summarize-devices-that-are-not-reachable/13219/

In this lab, we will list all devices which are not reachable by a monitoring tool. This is good when we want to improve the overall monitoring experience and decrease the size queue (metrics which has not been arrived at the instance).

Tools required for the job: Access to a database server or a Windows computer with PowerShell

To summarize devices that are not reachable at the moment we can use a database query. Tested and works on 4.0, 5.0, on MySQL and PostgreSQL:

SELECT hosts.host,
       interface.ip,
       interface.dns,
       interface.useip,
       CASE interface.type
           WHEN 1 THEN 'ZBX'
           WHEN 2 THEN 'SNMP'
           WHEN 3 THEN 'IPMI'
           WHEN 4 THEN 'JMX'
       END AS "type",
       hosts.error
FROM hosts
JOIN interface ON interface.hostid=hosts.hostid
WHERE hosts.available=2
  AND interface.main=1
  AND hosts.status=0;

A very similar (but not exactly the same) outcome can be obtained via Windows PowerShell by contacting Zabbix API. Try this snippet:

$headers = New-Object "System.Collections.Generic.Dictionary[[String],[String]]"
$headers.Add("Content-Type", "application/json")
$url = 'http://192.168.1.101/api_jsonrpc.php'
$user = 'api'
$password = 'zabbix'

# authorization
$key = Invoke-RestMethod $url -Method 'POST' -Headers $headers -Body "
{
    `"jsonrpc`": `"2.0`",
    `"method`": `"user.login`",
    `"params`": {
        `"user`": `"$user`",
        `"password`": `"$password`"
    },
    `"id`": 1
}
" | foreach { $_.result }
echo $key

# filter out unreachable Agent, SNMP, JMX, IPMI hosts
Invoke-RestMethod $url -Method 'POST' -Headers $headers -Body "
{
    `"jsonrpc`": `"2.0`",
    `"method`": `"host.get`",
    `"params`": {
        `"output`": [`"interfaces`",`"host`",`"proxy_hostid`",`"disable_until`",`"lastaccess`",`"errors_from`",`"error`"],
        `"selectInterfaces`": `"extend`",
        `"filter`": {`"available`": `"2`",`"status`":`"0`"}
    },
    `"auth`": `"$key`",
    `"id`": 1
}
" | foreach { $_.result }  | foreach { $_.interfaces } | Out-GridView

# log out
Invoke-RestMethod $url -Method 'POST' -Headers $headers -Body "
{
    `"jsonrpc`": `"2.0`",
    `"method`": `"user.logout`",
    `"params`": [],
    `"id`": 1,
    `"auth`": `"$key`"
}
"

Set a valid credential (URL, username, password) on the top of the code before executing it.

The benefit of PowerShell here is that we can use some on-the-fly filtering:

What is the exact meaning of the field ‘type’ we can understand by looking on the previous database query:

       CASE interface.type
           WHEN 1 THEN 'ZBX'
           WHEN 2 THEN 'SNMP'
           WHEN 3 THEN 'IPMI'
           WHEN 4 THEN 'JMX'
       END AS "type",

On Windows PowerShell, it is possible to download the unreachable hosts directly to CSV file. To do that, in the code above, we need to change:

Out-GridView

to

Export-Csv c:\temp\unavailable.hosts.csv

Alright, this was the knowledge bit today. Let’s keep Zabbixing!

Code your own Pipe Mania puzzler | Wireframe #46

Post Syndicated from Ryan Lambie original https://www.raspberrypi.org/blog/code-your-own-pipe-mania-puzzler-wireframe-46/

Create a network of pipes before the water starts to flow in our re-creation of a classic puzzler. Jordi Santonja shows you how.

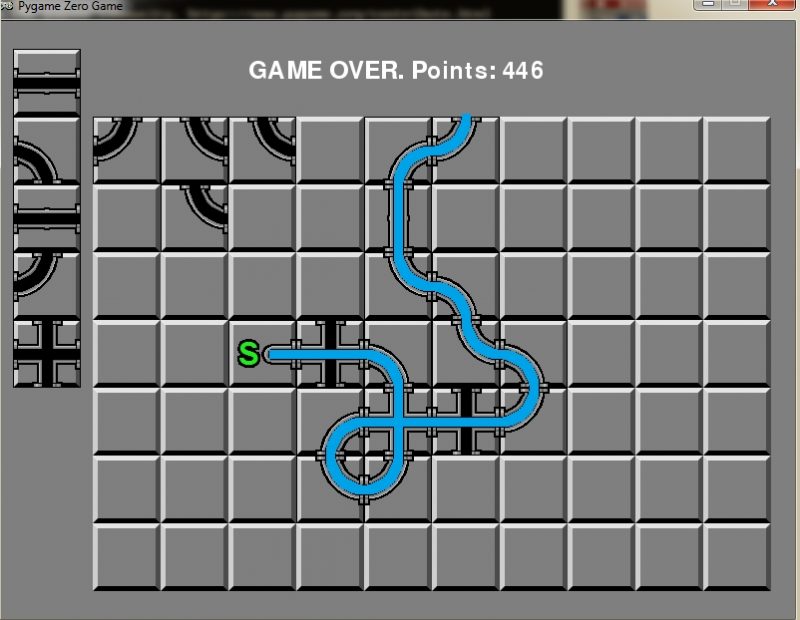
A screen grab of the game in motion
Pipe Mania’s design is so effective, it’s appeared in various guises elsewhere – even as a minigame in BioShock.

Pipe Mania, also called Pipe Dream in the US, is a puzzle game developed by The Assembly Line in 1989 for Amiga, Atari ST, and PC, and later ported to other platforms, including arcades. The player must place randomly generated sections of pipe onto a grid. When a counter reaches zero, water starts to flow and must reach the longest possible distance through the connected pipes.

Let’s look at how to recreate Pipe Dream in Python and Pygame Zero. The variable start is decremented at each frame. It begins with a value of 60*30, so it reaches zero after 30 seconds if our monitor runs at 60 frames per second. In that time, the player can place tiles on the grid to build a path. Every time the user clicks on the grid, the last tile from nextTiles is placed on the play area and a new random tile appears at the top of the next tiles. randint(2,8) computes a random value between 2 and 8.

Our Pipe Mania homage. Build a pipeline before the water escapes, and see if you can beat your own score.

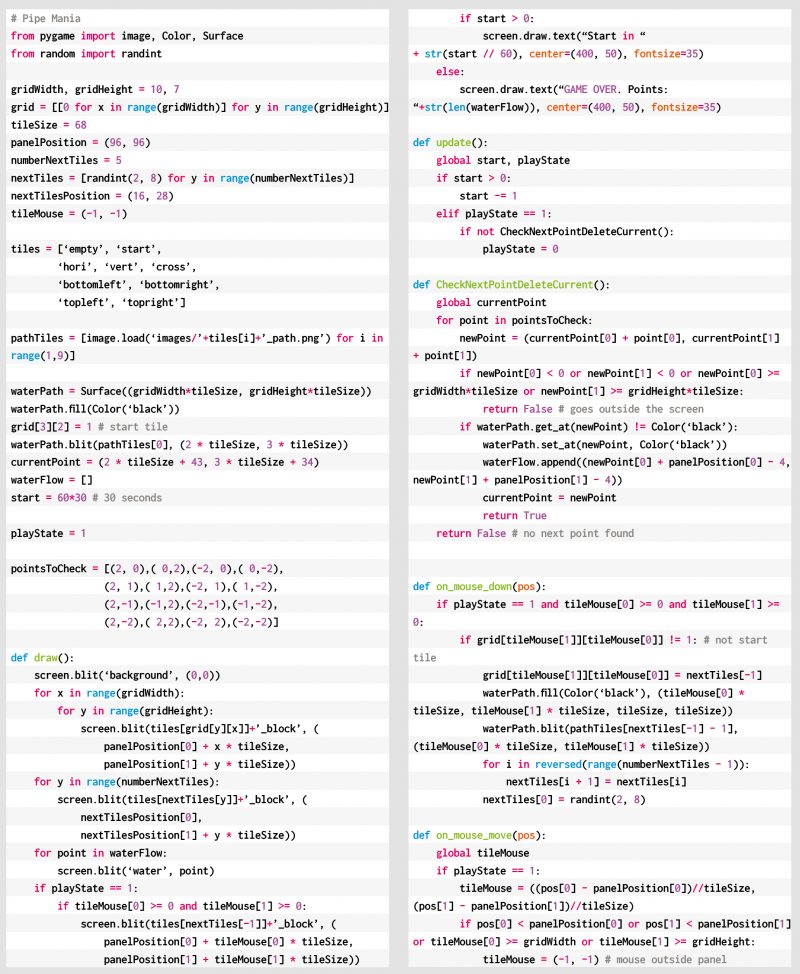
grid and nextTiles are lists of tile values, from 0 to 8, and are copied to the screen in the draw function with the screen.blit operation. grid is a two-dimensional list, with sizes gridWidth=10 and gridHeight=7. Every pipe piece is placed in grid with a mouse click. This is managed with the Pygame functions on_mouse_move and on_mouse_down, where the variable pos contains the mouse position in the window. panelPosition defines the position of the top-left corner of the grid in the window. To get the grid cell, panelPosition is subtracted from pos, and the result is divided by tileSize with the integer division //. tileMouse stores the resulting cell element, but it is set to (-1,-1) when the mouse lies outside the grid.

The images folder contains the PNGs with the tile images, two for every tile: the graphical image and the path image. The tiles list contains the name of every tile, and adding to it _block or _path obtains the name of the file. The values stored in nextTiles and grid are the indexes of the elements in tiles.

wfmag46code
Here’s Jordi’s code for a Pipemania-style puzzler. To get it working on your system, you’ll need to install Pygame Zero. And to download the full code and assets, head here.

The image waterPath isn’t shown to the user, but it stores the paths that the water is going to follow. The first point of the water path is located in the starting tile, and it’s stored in currentPoint. update calls the function CheckNextPointDeleteCurrent, when the water starts flowing. That function finds the next point in the water path, erases it, and adds a new point to the waterFlow list. waterFlow is shown to the user in the draw function.

pointsToCheck contains a list of relative positions, offsets, that define a step of two pixels from currentPoint in every direction to find the next point. Why two pixels? To be able to define the ‘cross’ tile, where two lines cross each other. In a ‘cross’ tile the water flow must follow a straight line, and this is how the only points found are the next points in the same direction. When no next point is found, the game ends and the score is shown: the number of points in the water path, playState is set to 0, and no more updates are done.

Get your copy of Wireframe issue 46

You can read more features like this one in Wireframe issue 46, available directly from Raspberry Pi Press — we deliver worldwide.

wfcover

And if you’d like a handy digital version of the magazine, you can also download issue 46 for free in PDF format.

The post Code your own Pipe Mania puzzler | Wireframe #46 appeared first on Raspberry Pi.

Let me subscribe – Zabbix masters IoT topics

Post Syndicated from Wolfgang Alper original https://blog.zabbix.com/let-me-subscribe-zabbix-masters-iot-topics/12710/

Zabbix 5.2 supports two important protocols used in the world of the Internet of Things — MQTT and Modbus. Now we can benefit from the newest Zabbix features and integrate Zabbix network monitoring in the world of IoT.

Contents

I. What is MQTT? (3:32:13)
II. MQTT and Zabbix integration (3:39:48)

1.MQTT setup (3:40:03)
2.Node-RED (3:42:12)
3.Splitting data (3:45:45)
4.Publishing data from Zabbix (3:52:23)

III. Questions & Answers (3:55:42)

What is MQTT?

MQTT — the Message Queuing Telemetry Transport was invented in 1999, and designed to be bandwidth-efficient and lightweight, thus battery efficient. Initially, it was developed to allow for monitoring oil pipelines.

It is a well-defined ISO standard — ISO/IEC 20922, and it is getting increasingly adopted due to its suitability for the Internet of Things (IoT), sensor networks, home automation, machine-to-machine (M2M), and mobile applications. MQTT usually uses TCP/IP as the transport protocol — over ports 1883, and can be encrypted using TLS transport mechanism with 8883 as the default port.

There is a variation of MQTT available — MQTT-SN (MQTT for Sensor Networks) used for non-TCP/IP networks, such as Zigbee (IEEE 80215.4 radio-based protocol) or other UDP / Bluetooth-based implementations.

There are 2 types of network entities available: ‘Message broker‘ and ‘Clients‘.

MQTT supports 3 Quality-of Service levels:

— 0: At most once – “Fire and forget” where you might or might not receive the message.
— 1: At least once – The message can be sent/delivered multiple times.
— 2: Exactly once – Safest and slowest service.

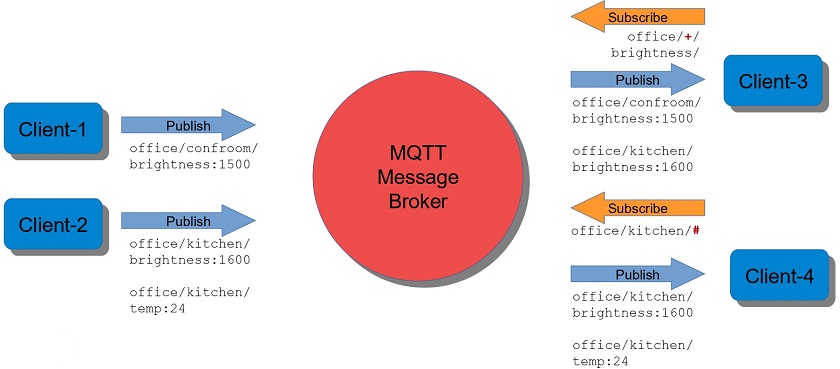
MQTT is based on a ‘publish’ / ‘subscribe-to-topic’ mechanism:

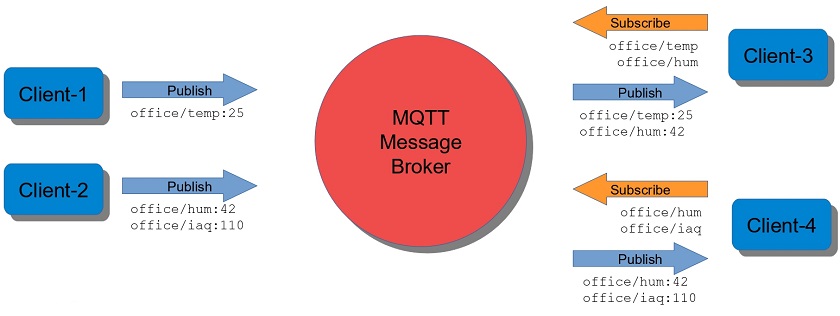
1. Publish/subscribe.

Publish/subscribe pattern

MQTT Message Broker consumes messages published by clients (on the left) using two-level ‘Topics‘ (such as, for instance, office temperature, office humidity, or indoor air quality). The clients on the rights side act as subscribers receiving any information published on a particular topic. Every time a message is published to the broker, the broker notifies all of the subscribers (Clients 3 and 4), and these clients get the sensor value.

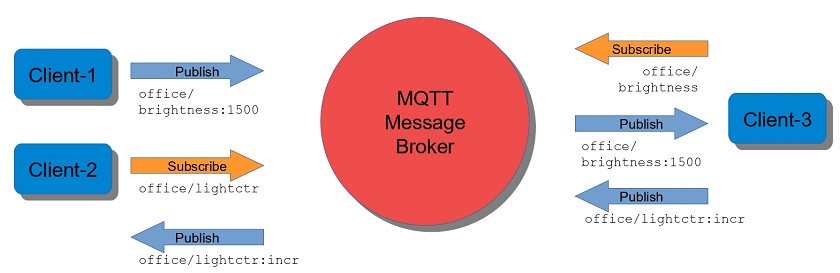
2. Combined publishing/subscribing

Combined pub/sub

A client can be a subscriber and a publisher at the same time. So, in this example, Client 1 is publishing a brightness value and Client 3 has a subscription for that brightness value. Client 3 may decide that the brightness, for instance, of 1,500 might be too low, so it can publish a new message to the topic ‘office’ to let the light controller know that it should increase the brightness, while Client 2, for instance, the light controller with a subscription, may change the brightness level on receipt of the message.

3. Wildcards subs

+ = single-level, # = multi-level

Wildcards in MQTT are easy. So, you can have, for instance, ‘office + brightness’ topic,  where the ‘+’ sign can be substituted by any topic name. If the ‘+’ sign substitutes just one level in our topic, then it is a single-level wildcard. While the pound sign works for a multi-level wildcard.

MQTT features:

  • Clients can publish and subscribe to one or more topics.
  • One client can publish and subscribe at the same time.
  • Clients can subscribe using single/multi-level wildcards.
  • Clients can choose between three different QoS levels.

MQTT advanced features:

  • Messages can be retained by the broker for new subscribers. So, if a new client subscribes to a particular topic, then the publisher can mark its messages as ‘Retained‘ so that the new subscriber gets the last retained message.
  • Clients can provide a “last will and testament” that will be published by the broker when the client “dies”.

MQTT and Zabbix integration

MQTT setup

Integrating Zabbix into the multiple-client mix

Integrated structure:

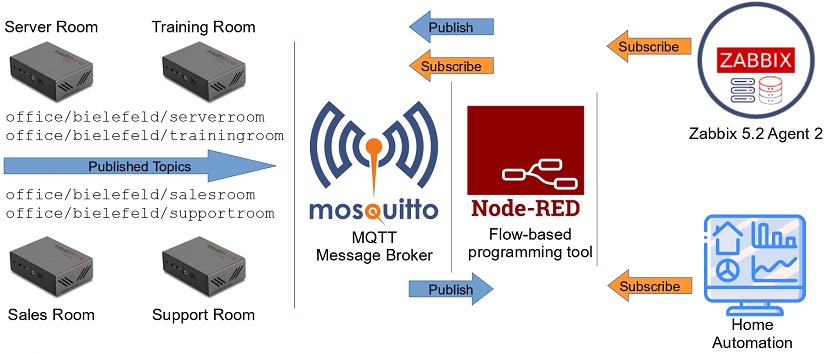
1. Four sensors:

    • Server room.
    • Training room.
    • Sales room.
    • Support room.

2. Four different topics:

    • office
    • bielefeld (home town)
    • serverroom
    • trainingroom

3. Mosquitto MQTT Message Broker, which is one of the well-known message brokers.

So, the sensors are publishing the data to the Mosquitto Message Broker, where any MQTT-enabled device or system can pick those values up. In our case, it’s the home automation system, which subscribes to the Message Broker and has access to all of the values published by the sensors.

Thanks to MQTT support in Zabbix 5.2, Zabbix can now subscribe to the Mosquitto Message Broker and immediately get access to all of the sensors publishing their values to the broker.

As we can have multiple subscribers, multiple clients can subscribe to one topic on the Message Broker. So the home automation system can subscribe to the same values published to the Message Broker, as well as Zabbix.

Node-RED

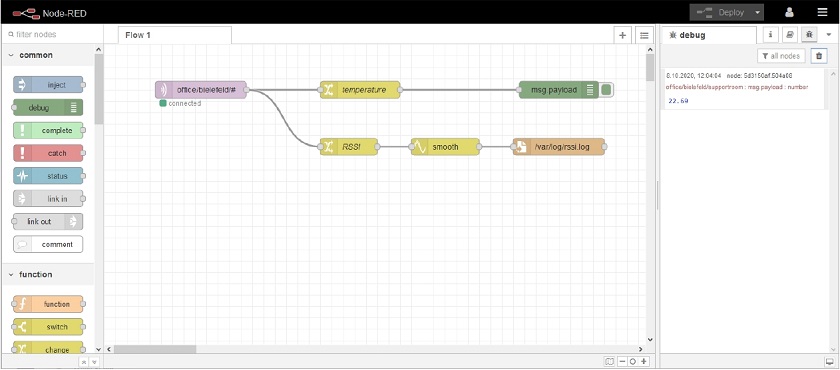
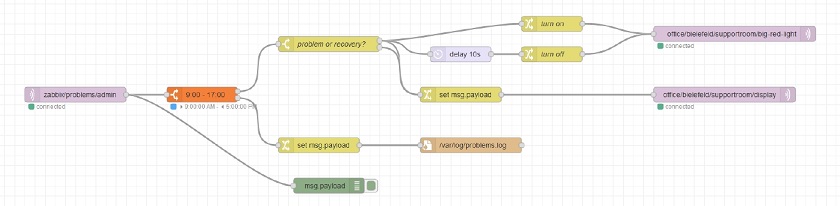
Sooner or later, you will need Node-RED, which is a flow-based programming tool allowing you to subscribe to the broker and to publish messages to the broker acting as the client, as well as to work with the data.

Data Processing in Node-RED

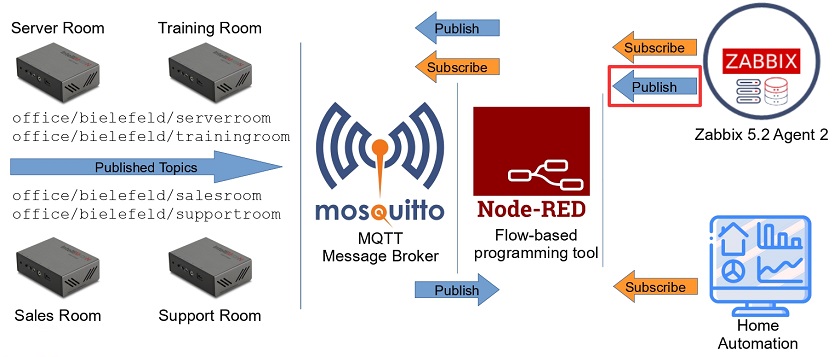
This setup might be useful, if, for instance, some Zabbix trigger fires and passes the information over to the MQTT to publish the outcome of the trigger to the Message Broker, which will be then picked up by the home automation system.

Zabbix publishes data to the broker

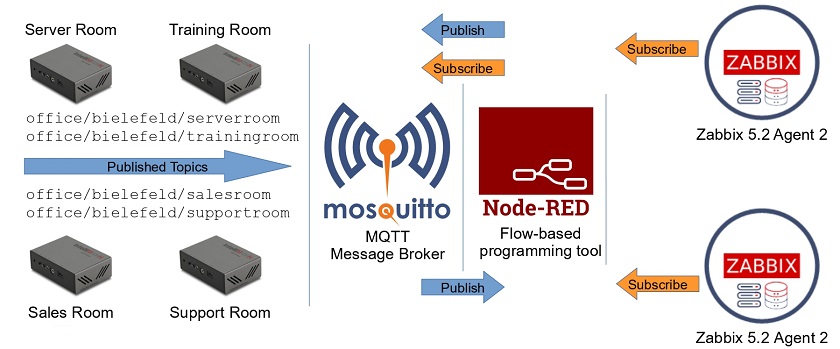
You can have two different Zabbix instances subscribing to the same Message Broker acting just as two different clients.

Multiple Zabbix servers sharing the same data

Node-RED:

    • Construction kit for the Internet of Things and home automation.
    • Acts as MQTT client able to publish and subscribe.
    • Flow-based tool for visual programming based on Node.js.
    • Graphical web editor.
    • Supports input, processing, and output nodes.
    • Extensible with plugins and custom function nodes.

Different types of nodes can be connected in the workspace. For instance, the nodes subscribing to a topic and transforming the data, or the nodes writing the data to a log file.

Node-RED

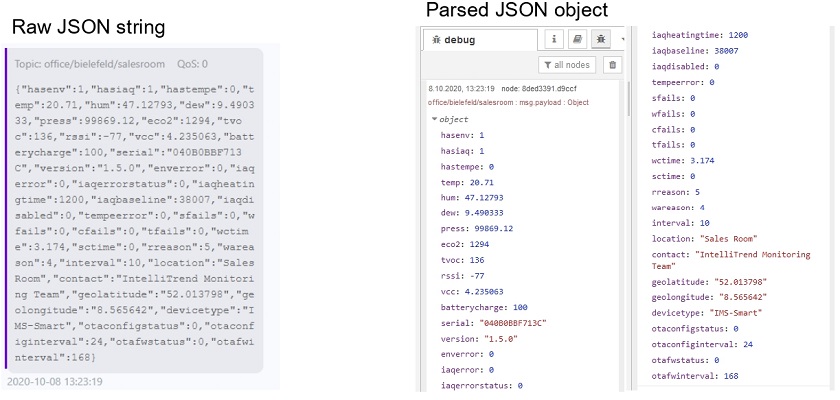
We can get the data from the sensors as the raw JSON string containing 20-30 metrics in a payload, and as a parsed JSON object in the Node-RED Debug node with easy-to-read metrics, such as, for instance, temperature, humidity, WiFi quality, indoor air quality, etc.

Multiple metrics in one message

Splitting data

We have different options for data splitting available:

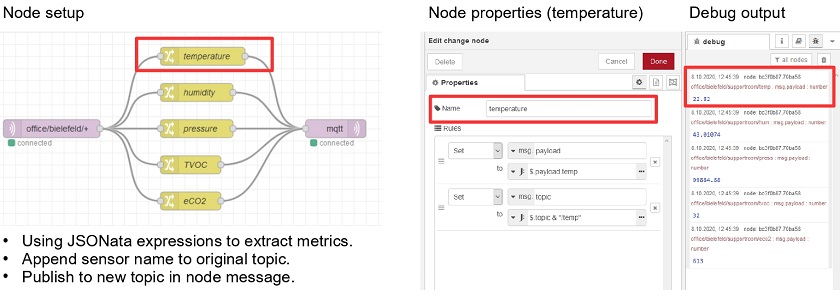
  • Split on MQTT level: use Node-RED to split metrics and then publish them in their own topics (it’s good to set up when other clients can handle only a single metric at a time).

Splitting data in Node-RED


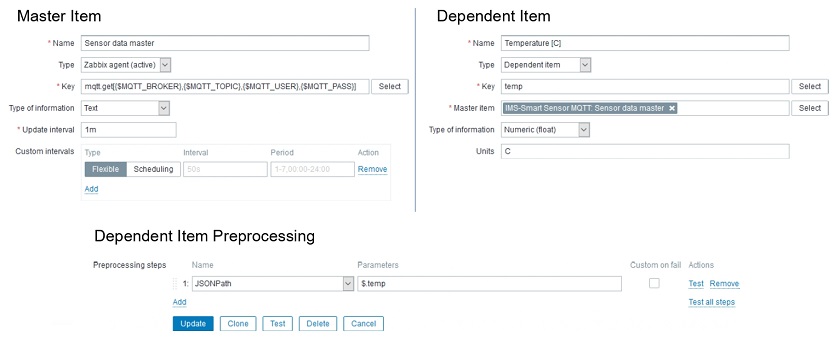
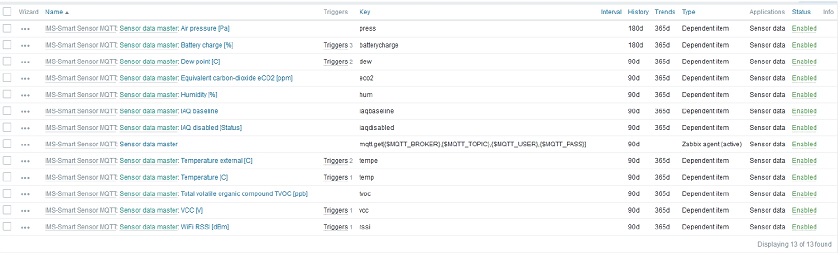
  • Split on Zabbix level: set up an MQTT item as a master item and use Zabbix JSON preprocessing with corresponding dependent items. Its more efficient because Zabbix would need only one subscription.

We can get the data with the brand-new mqtt.get item in Zabbix 5.2:

— Requires Agent 2.
— Requires active checks. As every time a client publishes a message to the topic, we need the broker to push that data to us, we need active checks, so mqtt.get must listen to the subscription and get notified when the new data comes in.
— Broker URL default is localhost.
— User name and password are optional.
— Uses Eclipse Paho Go client library.

One Zabbix agent in active mode sending data to multiple hosts

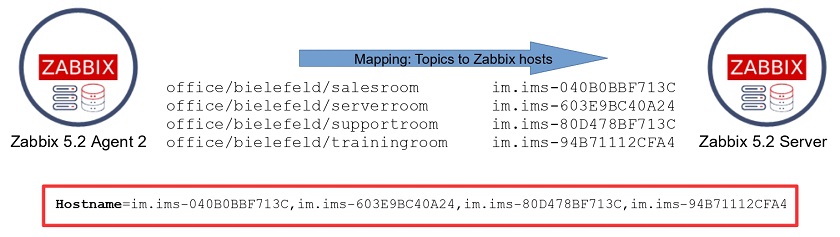
For our setup with four sensors: in Sales Room, Server Room, Support Room, and Training Room, we need four hosts in Zabbix. Traditionally, you need four different agents to handle them as each agent running as active needs to configure its own hostname. However in our setup, we need just one agent installed and handling different hosts by subscribing to multiple topics.

This is possible because of the the new feature  running active agent checks from multiple hosts which is now available in Zabbix 5.2. All we need is:

—  to set up hosts in Zabbix (as usual),
—  to define our MQTT items (as usual),
—  to set up just one agent with all of the hostnames the agent should be responsible for (the new feature),
—  to set up the master item, which is our mqtt.get item,
—  to define several dependent items and preprocessing for each of the dependent items, and
—  to start preprocessing with JSONPath.

NOTE. Every time the master item gets an update, so do all of the dependent items in Zabbix.

Master item and dependent items

  • Combine both methods: let other clients subscribe to a single metric using their specific topic, but publish all sensor data for Zabbix in one topic.

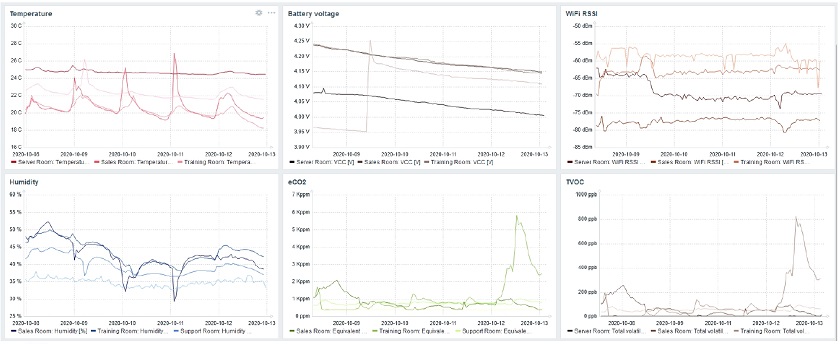
NOTEData received and displayed on the dashboard is based on the MQTT item, the payload, and the MQTT messages received from the Message Broker.

Sensor data dashboard

Publishing data from Zabbix

Now you want to publish the outcome of a Zabbix trigger, so it can be consumed by other MQTT-enabled devices. Any MQTT subscriber, like Node-RED, should receive the alert. To do that, you need:

  • to define a new media type to send problems to the topic, that is, to pass the data over to the Message Broker:
  • to use the command-line tool for Mosquitto — mosquitto_pub allowing us to publish the message.
#!/bin/sh
mosquitto_pub -h yourbroker.io -m "$1" -t "zabbix/problems/$2"

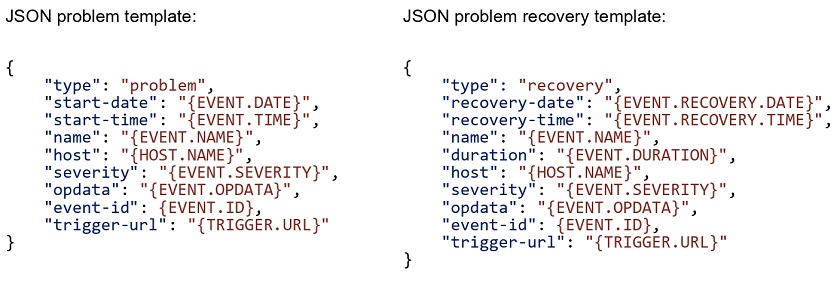
  • to make sure that the data is sent to the broker in the right format. In this case, we use JSON as transport and define a JSON problem template and a JSON problem recovery template.


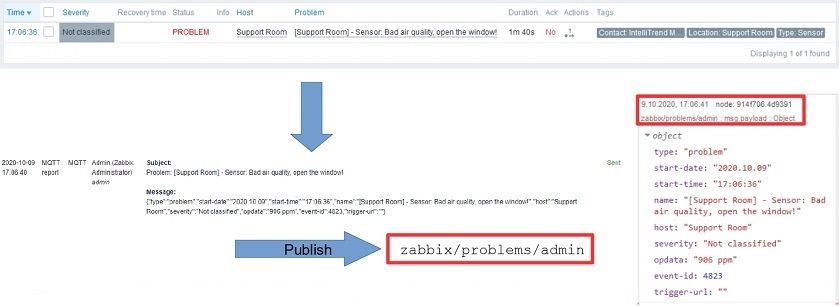
In Zabbix, you’ll see the problem, the actions, and the media type firing using the subscription, and in the Debug node of Note-RED, you’ll see that the data is received from Zabbix.

Zabbix problems  published via MQTT

This model with Node-RED can be used to create sophisticated setups. For instance, you can take the data from Zabbix, forward it by actions and media types, preprocess them in Node-RED, and transform the data in many different ways.

IoT devices and other subscribers can react to issues detected by Zabbix using Node-RED

NOTE. To try out the MQTT setup and new Zabbix features, you can use the Live broker available on IntelliTrend new GitHub account, getting data from Zabbix sensors every 10 minutes. You’ll also find templates,  access data, address of the broker, etc. —  everything you need to to get started.

Questions & Answers

Question. If the MQTT client gets overloaded due to high message frequency on subscribe topics, how will that affect Zabbix?

Answer. Here the broker might be overloaded or the Zabbix agent might not be able to follow up. If for the problem with the broker, the quality of service levels is defined in the MQTT protocol, more specifically — QoS level 2, which guarantees delivery. So if QoS2 is used as a QoS level, the messages won’t get lost but would be resent in case of failure.

Question. What else would you expect from the IoT side of Zabbix? What kind of protocols or things would get added? 

Answer. There’s always room for improvement. You can use third-party tools, custom scripts, or any tools to enhance Zabbix. I’m sure that using user script parameters was an excellent design decision. But the official support of MQTT is a quantum leap for Zabbix because it opens the door to most IoT infrastructures, as MQTT is the most important IoT protocol so far.

For instance, one of our customers is monitoring the infrastructure of electricity generators, production systems, etc. They use their own monitoring platform provided by vendors. The request was to integrate alerts or some metrics into Zabbix. The customer’s monitoring platform used MQTT protocol. So, all we had to do was to make their monitoring platform use external scripts and MQTT support.

Optimizing AWS Lambda cost and performance using AWS Compute Optimizer

Post Syndicated from Chad Schmutzer original https://aws.amazon.com/blogs/compute/optimizing-aws-lambda-cost-and-performance-using-aws-compute-optimizer/

This post is authored by Brooke Chen, Senior Product Manager for AWS Compute Optimizer, Letian Feng, Principal Product Manager for AWS Compute Optimizer, and Chad Schmutzer, Principal Developer Advocate for Amazon EC2

Optimizing compute resources is a critical component of any application architecture. Over-provisioning compute can lead to unnecessary infrastructure costs, while under-provisioning compute can lead to poor application performance.

Launched in December 2019, AWS Compute Optimizer is a recommendation service for optimizing the cost and performance of AWS compute resources. It generates actionable optimization recommendations tailored to your specific workloads. Over the last year, thousands of AWS customers reduced compute costs up to 25% by using Compute Optimizer to help choose the optimal Amazon EC2 instance types for their workloads.

One of the most frequent requests from customers is for AWS Lambda recommendations in Compute Optimizer. Today, we announce that Compute Optimizer now supports memory size recommendations for Lambda functions. This allows you to reduce costs and increase performance for your Lambda-based serverless workloads. To get started, opt in for Compute Optimizer to start finding recommendations.

Overview

With Lambda, there are no servers to manage, it scales automatically, and you only pay for what you use. However, choosing the right memory size settings for a Lambda function is still an important task. Computer Optimizer uses machine-learning based memory recommendations to help with this task.

These recommendations are available through the Compute Optimizer console, AWS CLI, AWS SDK, and the Lambda console. Compute Optimizer continuously monitors Lambda functions, using historical performance metrics to improve recommendations over time. In this blog post, we walk through an example to show how to use this feature.

Using Compute Optimizer for Lambda

This tutorial uses the AWS CLI v2 and the AWS Management Console.

In this tutorial, we setup two compute jobs that run every minute in AWS Region US East (N. Virginia). One job is more CPU intensive than the other. Initial tests show that the invocation times for both jobs typically last for less than 60 seconds. The goal is to either reduce cost without much increase in duration, or reduce the duration in a cost-efficient manner.

Based on these requirements, a serverless solution can help with this task. Amazon EventBridge can schedule the Lambda functions using rules. To ensure that the functions are optimized for cost and performance, you can use the memory recommendation support in Compute Optimizer.

In your AWS account, opt in to Compute Optimizer to start analyzing AWS resources. Ensure you have the appropriate IAM permissions configured – follow these steps for guidance. If you prefer to use the console to opt in, follow these steps. To opt in, enter the following command in a terminal window:

$ aws compute-optimizer update-enrollment-status --status Active

Once you enable Compute Optimizer, it starts to scan for functions that have been invoked for at least 50 times over the trailing 14 days. The next section shows two example scheduled Lambda functions for analysis.

Example Lambda functions

The code for the non-CPU intensive job is below. A Lambda function named lambda-recommendation-test-sleep is created with memory size configured as 1024 MB. An EventBridge rule is created to trigger the function on a recurring 1-minute schedule:

import json
import time

def lambda_handler(event, context):
  time.sleep(30)
  x=[0]*100000000
  return {
    'statusCode': 200,
    'body': json.dumps('Hello World!')
  }

The code for the CPU intensive job is below. A Lambda function named lambda-recommendation-test-busy is created with memory size configured as 128 MB. An EventBridge rule is created to trigger the function on a recurring 1-minute schedule:

import json
import random

def lambda_handler(event, context):
  random.seed(1)
  x=0
  for i in range(0, 20000000):
    x+=random.random()

  return {
    'statusCode': 200,
    'body': json.dumps('Sum:' + str(x))
  }

Understanding the Compute Optimizer recommendations

Compute Optimizer needs a history of at least 50 invocations of a Lambda function over the trailing 14 days to deliver recommendations. Recommendations are created by analyzing function metadata such as memory size, timeout, and runtime, in addition to CloudWatch metrics such as number of invocations, duration, error count, and success rate.

Compute Optimizer will gather the necessary information to provide memory recommendations for Lambda functions, and make them available within 48 hours. Afterwards, these recommendations will be refreshed daily.

These are recent invocations for the non-CPU intensive function:

Recent invocations for the non-CPU intensive function

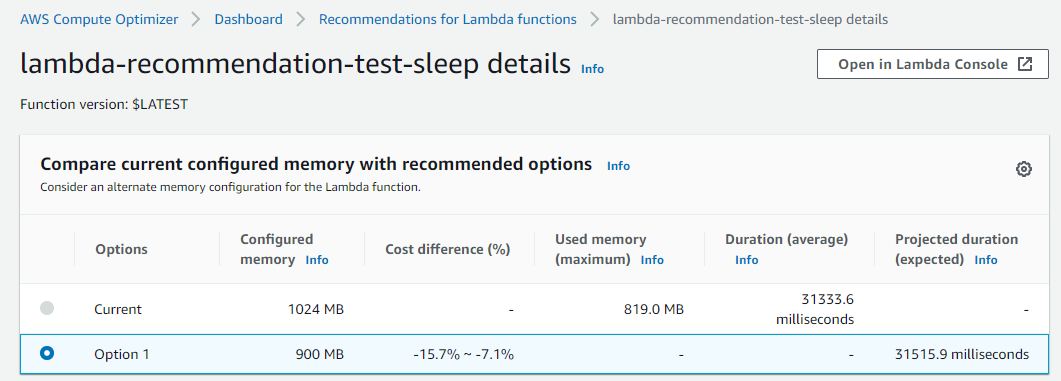
Function duration is approximately 31.3 seconds with a memory setting of 1024 MB, resulting in a duration cost of about $0.00052 per invocation. Here are the recommendations for this function in the Compute Optimizer console:

Recommendations for this function in the Compute Optimizer console

The function is Not optimized with a reason of Memory over-provisioned. You can also fetch the same recommendation information via the CLI:

$ aws compute-optimizer \
  get-lambda-function-recommendations \
  --function-arns arn:aws:lambda:us-east-1:123456789012:function:lambda-recommendation-test-sleep
{
    "lambdaFunctionRecommendations": [
        {
            "utilizationMetrics": [
                {
                    "name": "Duration",
                    "value": 31333.63587049883,
                    "statistic": "Average"
                },
                {
                    "name": "Duration",
                    "value": 32522.04,
                    "statistic": "Maximum"
                },
                {
                    "name": "Memory",
                    "value": 817.67049838188,
                    "statistic": "Average"
                },
                {
                    "name": "Memory",
                    "value": 819.0,
                    "statistic": "Maximum"
                }
            ],
            "currentMemorySize": 1024,
            "lastRefreshTimestamp": 1608735952.385,
            "numberOfInvocations": 3090,
            "functionArn": "arn:aws:lambda:us-east-1:123456789012:function:lambda-recommendation-test-sleep:$LATEST",
            "memorySizeRecommendationOptions": [
                {
                    "projectedUtilizationMetrics": [
                        {
                            "name": "Duration",
                            "value": 30015.113193697029,
                            "statistic": "LowerBound"
                        },
                        {
                            "name": "Duration",
                            "value": 31515.86878891883,
                            "statistic": "Expected"
                        },
                        {
                            "name": "Duration",
                            "value": 33091.662123300975,
                            "statistic": "UpperBound"
                        }
                    ],
                    "memorySize": 900,
                    "rank": 1
                }
            ],
            "functionVersion": "$LATEST",
            "finding": "NotOptimized",
            "findingReasonCodes": [
                "MemoryOverprovisioned"
            ],
            "lookbackPeriodInDays": 14.0,
            "accountId": "123456789012"
        }
    ]
}

The Compute Optimizer recommendation contains useful information about the function. Most importantly, it has determined that the function is over-provisioned for memory. The attribute findingReasonCodes shows the value MemoryOverprovisioned. In memorySizeRecommendationOptions, Compute Optimizer has found that using a memory size of 900 MB results in an expected invocation duration of approximately 31.5 seconds.

For non-CPU intensive jobs, reducing the memory setting of the function often doesn’t have a negative impact on function duration. The recommendation confirms that you can reduce the memory size from 1024 MB to 900 MB, saving cost without significantly impacting duration. The new duration cost per invocation saves approximately 12%.

The Compute Optimizer console validates these calculations:

Compute Optimizer console validates these calculations

These are recent invocations for the second function which is CPU-intensive:

Recent invocations for the second function which is CPU-intensive

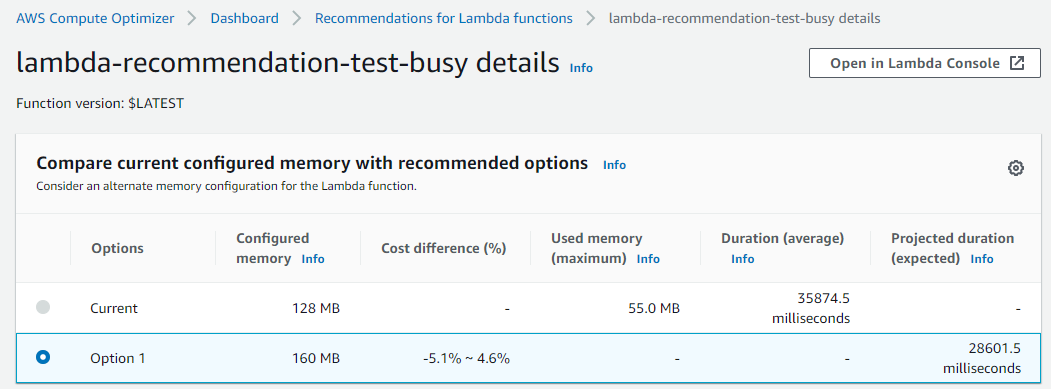
The function duration is about 37.5 seconds with a memory setting of 128 MB, resulting in a duration cost of about $0.000078 per invocation. The recommendations for this function appear in the Compute Optimizer console:

recommendations for this function appear in the Compute Optimizer console

The function is also Not optimized with a reason of Memory under-provisioned. The same recommendation information is available via the CLI:

$ aws compute-optimizer \
  get-lambda-function-recommendations \
  --function-arns arn:aws:lambda:us-east-1:123456789012:function:lambda-recommendation-test-busy
{
    "lambdaFunctionRecommendations": [
        {
            "utilizationMetrics": [
                {
                    "name": "Duration",
                    "value": 36006.85851551957,
                    "statistic": "Average"
                },
                {
                    "name": "Duration",
                    "value": 38540.43,
                    "statistic": "Maximum"
                },
                {
                    "name": "Memory",
                    "value": 53.75978407557355,
                    "statistic": "Average"
                },
                {
                    "name": "Memory",
                    "value": 55.0,
                    "statistic": "Maximum"
                }
            ],
            "currentMemorySize": 128,
            "lastRefreshTimestamp": 1608725151.752,
            "numberOfInvocations": 741,
            "functionArn": "arn:aws:lambda:us-east-1:123456789012:function:lambda-recommendation-test-busy:$LATEST",
            "memorySizeRecommendationOptions": [
                {
                    "projectedUtilizationMetrics": [
                        {
                            "name": "Duration",
                            "value": 27340.37604781184,
                            "statistic": "LowerBound"
                        },
                        {
                            "name": "Duration",
                            "value": 28707.394850202432,
                            "statistic": "Expected"
                        },
                        {
                            "name": "Duration",
                            "value": 30142.764592712556,
                            "statistic": "UpperBound"
                        }
                    ],
                    "memorySize": 160,
                    "rank": 1
                }
            ],
            "functionVersion": "$LATEST",
            "finding": "NotOptimized",
            "findingReasonCodes": [
                "MemoryUnderprovisioned"
            ],
            "lookbackPeriodInDays": 14.0,
            "accountId": "123456789012"
        }
    ]
}

For this function, Compute Optimizer has determined that the function’s memory is under-provisioned. The value of findingReasonCodes is MemoryUnderprovisioned. The recommendation is to increase the memory from 128 MB to 160 MB.

This recommendation may seem counter-intuitive, since the function only uses 55 MB of memory per invocation. However, Lambda allocates CPU and other resources linearly in proportion to the amount of memory configured. This means that increasing the memory allocation to 160 MB also reduces the expected duration to around 28.7 seconds. This is because a CPU-intensive task also benefits from the increased CPU performance that comes with the additional memory.

After applying this recommendation, the new expected duration cost per invocation is approximately $0.000075. This means that for almost no change in duration cost, the job latency is reduced from 37.5 seconds to 28.7 seconds.

The Compute Optimizer console validates these calculations:

Compute Optimizer console validates these calculations

Applying the Compute Optimizer recommendations

To optimize the Lambda functions using Compute Optimizer recommendations, use the following CLI command:

$ aws lambda update-function-configuration \
  --function-name lambda-recommendation-test-sleep \
  --memory-size 900

After invoking the function multiple times, we can see metrics of these invocations in the console. This shows that the function duration has not changed significantly after reducing the memory size from 1024 MB to 900 MB. The Lambda function has been successfully cost-optimized without increasing job duration:

Console shows the metrics from recent invocations

To apply the recommendation to the CPU-intensive function, use the following CLI command:

$ aws lambda update-function-configuration \
  --function-name lambda-recommendation-test-busy \
  --memory-size 160

After invoking the function multiple times, the console shows that the invocation duration is reduced to about 28 seconds. This matches the recommendation’s expected duration. This shows that the function is now performance-optimized without a significant cost increase:

Console shows that the invocation duration is reduced to about 28 seconds

Final notes

A couple of final notes:

  • Not every function will receive a recommendation. Compute optimizer only delivers recommendations when it has high confidence that these recommendations may help reduce cost or reduce execution duration.
  • As with any changes you make to an environment, we strongly advise that you test recommended memory size configurations before applying them into production.

Conclusion

You can now use Compute Optimizer for serverless workloads using Lambda functions. This can help identify the optimal Lambda function configuration options for your workloads. Compute Optimizer supports memory size recommendations for Lambda functions in all AWS Regions where Compute Optimizer is available. These recommendations are available to you at no additional cost. You can get started with Compute Optimizer from the console.

To learn more visit Getting started with AWS Compute Optimizer.


How to upgrade to Zabbix 5.2

Post Syndicated from Dmitry Lambert original https://blog.zabbix.com/how-to-upgrade-to-zabbix-5-2/12872/

Zabbix recently released the new 5.2 version with awesome new features overviewed in the video, such as hashicorp vault, IoT monitoring, improved performance, granular permission system, and much more. The upgrade to the latest Zabbix 5.2 is fast and easy.

Contents

I. Upgrade Zabbix on CentOS 8 (0:45)
II. New in Zabbix 5.2 (2:26)
III. Upgrade procedure (3:39)
IV. Conclusion (9:51)

Upgrade Zabbix on CentOS 8

To upgrade the existing Zabbix instance installed on CentOS 7, it is recommended to migrate to CentOS 8 first as currently there are no official packages available of CentOS 7 for Zabbix 5.2. Since there is no clean way to upgrade CentOS installation, it is recommended to create a new server on CentOS 8 and then migrate your database and spin up Zabbix Server there. CentOS 7 is old and has limited packages in the repositories, which are not updated anymore. Even if you use all the latest software and packages from the official repo, it will not be enough to successfully run all of the functionality of Zabbix 5.2. For instance, TLS 1.3 will not be available, as well as database encryption.

If you run the default frontend and default server from the packages, and if you don’t have any customization patches, any custom functionality, or edited PHP source code that you want to save, then the upgrade is straightforward.

New in Zabbix 5.2

To find out what we can expect after the upgrade, on the Zabbix documentation page for the 5.2 release, go to Installation > Upgrade notes for 5.2.0.

  • The minimum required PHP version has been upped from 7.2.0 to 7.2.5, which might be an issue on CentOS 7.
  • User roles. Now you can assign different roles to your existing users through your existing permission system will not be broken.
  • Time zone definition. If you are running your frontend with multiple virtual hosts, you can delete all of those and configure everything natively in the frontend.
  • Refreshing unsupported items setting has been removed from Administration > General > Other, with the item update interval now used for each unsupported item.
  • Template screens converted to dashboards with the screens to be set up in the dashboards now as widgets of template dashboards.
  • The session of the Zabbix frontend is now stored in a cookie.

If you upgrade, you will still have to log in to the frontend providing the username and password.

Upgrade procedure

In the Zabbix documentation page, open Upgrade procedure > Upgrade from packages > 1 Red Hat Enterprise Linux/CentOS, where the upgrade notes are available, which are helpful if you’re upgrading from the old version.

1. Stop Zabbix server.

# systemctl stop zabbix-server

2. Back up the existing Zabbix database. It is very important as there is no rollback functionality. If you can’t test the upgrade in the dev environment, it is recommended to backup the database.

3. Back up configuration files, PHP files, and Zabbix binaries.

Configuration files:

# mkdir /opt/zabbix-backup/
# cp /etc/zabbix/zabbix_server.conf /opt/zabbix-backup/
# cp /etc/httpd/conf.d/zabbix.conf  /opt/zabbix-backup/

PHP files and Zabbix binaries:

# cp -R /usr/share/zabbix/ /opt/zabbix-backup/
# cp -R /usr/share/doc/zabbix-* /opt/zabbix-backup/

This step is optional if you have an official frontend, official server, etc., without any patches or customizations. In this case, you can download the required official files for Zabbix 5.2 from the sources or install them from the repository as a package in case is something goes wrong.

4. Update repository configuration package. To proceed with the upgrade, you need to update your current repository package, especially if you don’t have packages for Zabbix 5.2 yet.

# rpm -Uvh https://repo.zabbix.com/zabbix/5.2/rhel/8/x86_64/zabbix-release-5.2-1.el8.noarch.rpm

Then you can run:

# yum clean all

and

# yum makecache

to make sure that the repository will be picked up. Then you’ll see the new packages of Zabbix 5.2.

Metadata cache created

These commands are not mandatory, but otherwise, you could upgrade your repository and then find out that the Zabbix 5.2.0 upgrade package is ‘not found’.

5. Upgrade Zabbix components. If you’re new to Zabbix and this is your first upgrade, you don’t need to do anything manually, run any database upgrade scripts, manually change or adjust the schema of the database, or do whatever else. All you have to do is upgrade your packages:

# yum upgrade zabbix-server-mysql zabbix-web-mysql zabbix-agent

NOTE. You can substitute the elements of this command depending on the software actually installed.

Type ‘-y‘ to automatically confirm everything. After the update is complete, you can check the installed version by running:

# zabbix_server -V


To upgrade the web frontend with Apache on RHEL 8 correctly, also run:

# yum install zabbix-apache-conf

NOTE. Type ‘y’ when asked for confirmation.

Now all you have to do to start the upgrade automatically is run:

# systemctl start zabbix-server

Then check the log file of the Zabbix server:

# tail -f /var/log/zabbix/zabbix_server.log

or

# less /var/log/zabbix/zabbix_server.log

After starting the new 5.2 binary, you will see in the log file that the current database version is 5.0, while the required mandatory version is 5.2. That’s why the Zabbix server package will start the automatic database upgrade.

Now we need to run:

# systemctl restart httpd php-fpm

as those were still running while we were upgrading the packages.

Then you need to log in as cookies are stored differently.

In the frontend, you’ll see the updated version and new features, such as new roles we can add in Administration > User roles.

User roles

6. Review component configuration parameters. Make sure to see the upgrade notes for details on mandatory changes.

7. Start Zabbix processes.

# systemctl start zabbix-server
# systemctl start zabbix-proxy
# systemctl start zabbix-agent
# systemctl start zabbix-agent2

Conclusion

This was everything required for the installation to run successfully. The process is straightforward if you don’t have any complicated customizations of your frontend, Zabbix server binaries, etc. Though in production, it is recommended to test installation out in the dev environment and make backups.

I definitely recommend you to try out the newest Zabbix 5.2.

Thanks for your attention! Like, comment, subscribe!


Lift and shift your Zabbix to Oracle Cloud with MySQL database service

Post Syndicated from Vittorio Cioe original https://blog.zabbix.com/lift-and-shift-your-zabbix-to-oracle-cloud-with-mysql-database-service/12792/


If you are tired of administering the infrastructure on your own and would prefer to gain time to focus on real monitoring activities rather than costly platform upgrades, you can easily lift and shift your MySQL-based Zabbix installation stack to Oracle Cloud.

Contents

I. Moving to the Cloud (1:46)
II. Moving Zabbix to Oracle Cloud (2:41)

1. Planning migration (3:22)
2. Migrating Zabbix to Oracle Cloud (6:17)
3. Migrating the database to MySQL Database Service (8:47)

III. Questions & Answers (15:12)

Moving to the Cloud

The data is increasingly moving to the cloud — the consumer data followed by the enterprise data, as enterprises are always a bit slower in adopting technologies.

Data moving to the cloud

Oracle Cloud Infrastructure, OCI, is the 4th cloud provider in the Cloud Infrastructure Ranking of the Gartner Magic Quadrant based on ‘Completeness of Vision’ and ‘Ability to Execute’.

OCI is available in 26 regions and has 26 data centers across the world with 12 more planned.

26 Regions Live, 12+ Planned

24+ Industry and Regional Certifications

Moving Zabbix to Oracle Cloud

With Zabbix in the Oracle Cloud you can:

  1. get the latest updates on the technology stack, minimizing downtime and service windows.
  2. convert the time you spend managing your monitoring platform into the time you spend monitoring your platforms.
  3. leverage the most secure and cost-effective cloud platform in the market, including security information and security updates made available by OCI.

Planning migration

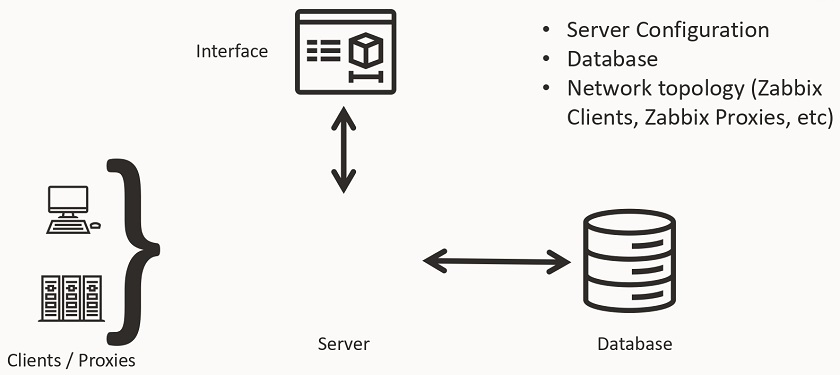
To plan effective migration of the on-premise Zabbix instance with clients, proxies, management server, interface, and database, we need to migrate the last three instance components. Basically, we need:

  • the server configuration;
  • on-premise network topology to understand what can communicate with the outside or what would eventually go over VPN, that is, the network topology of client and proxies; and
  • the database.

Migration requirements

We also need to set up the following in the OCI tenancy:

  • MySQL Database System,
  • Compute instance for the Zabbix Server,
  • storage for database and backup,
  • networking/load balancing.

The target architecture involves setting up the VPN from your data center to the Oracle cloud tenancy and deploying the load balancer, the Zabbix server in redundancy over availability domains, and the MySQL database in a separate subnet.

Required Components:
• Cloud Networking,
• Zabbix Cloud Image,
• MySQL Database Service,
• VPN Connection for client/proxies.

Oracle Cloud target architecture for Zabbix

You can also have a lighter setup, for instance, with proxies communicating over TLS connections over the Internet or communicating directly with the Zabbix Server in the Oracle Cloud, and the Zabbix server interfacing with the database. Here, you will need fewer elements: server, database, and VCN.

Oracle Cloud target architecture for Zabbix — a simpler solution

Migrating Zabbix to Oracle Cloud

Zabbix migration to the Oracle Cloud is straightforward.

1. Before you begin:

  • set up tenancy and compartments,
  • set up cloud networking — public and private VCN.

2. Zabbix deployment on the VM:

  • select one-click deployment or DIY — use the official Zabbix OCI Marketplace Image or deploy an OCI Compute Instance and install manually,
  • choose the desired Compute ‘shape’ during deployment.

3. Configuration:

  • start the instance,
  • edit the config file,
  • point to the database with the IP address, username, and password (to do that, you’ll need to open several ports in the cloud network via the GUI).

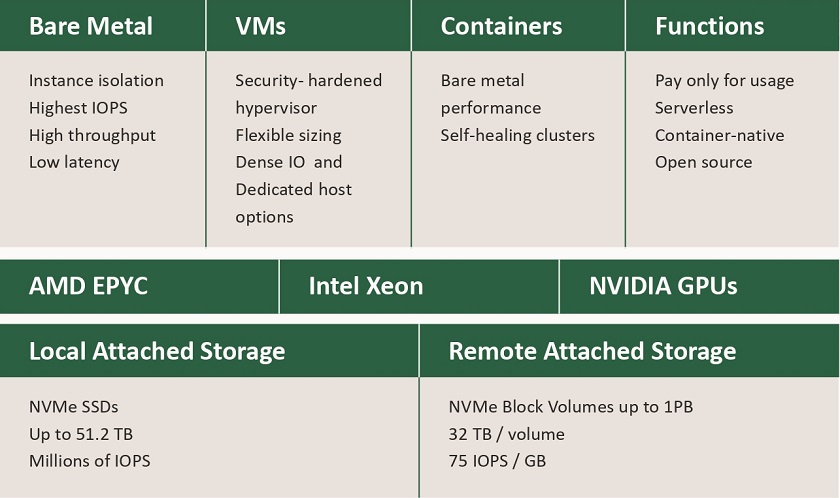
The OCI infrastructure allows for multiple choices. The Zabbix Server is lightweight software requiring resources. In the majority of cases, a powerful VM will be enough. Otherwise, you’ll have the Oracle Cloud available.

Compute services for any enterprise use case

In the Oracle Cloud you’ll have the bare metal option — the physical machines dedicated to a single customer, Kubernetes container engine, and a lot of fast storage possibilities, which end up being quite cheap.

Migrating the database to MySQL Database Service

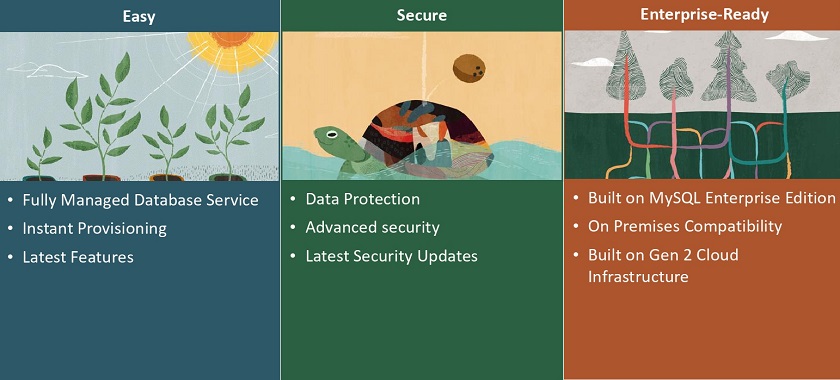
MySQL Database Service is the managed offer for MySQL in Oracle Cloud, fully developed, managed, and supported by the MySQL team. It is secure and provides the latest features as it leverages the Oracle Cloud, which has been rated by various sources as one of the most secure cloud platforms.

In addition, the platform is built on the MySQL Enterprise Edition binaries, so it is fully compatible with the platform you might be using. Finally, it costs way less on a yearly basis than a full-blown on-premise MySQL Enterprise subscription.

MySQL Database Service — 100% developed, managed, and supported by the MySQL team

Considerations before migration

Before you begin:

  • check your MySQL 8.0 compatibility,
  • check your database size (to assess the time needed to migrate), and
  • plan a service window.

High-level migration plan

  1. Set up cloud networking.
  2. Set up your (on-premise) networking secure connection (to communicate with the cloud).
  3. Create MySQL Database Service DB System with storage.
  4. Move the data using MySQL Shell Dump & Load utility.

Creating MySQL DB system with just a few clicks

  • Create a customized configuration.
  • Start the wizard to create DB system.
  • Select Virtual Cloud Network (VCN).
  • Select subnet to place your MySQL endpoint.
  • Select MySQL configuration (or create customized instances for your workload).
  • The shape for the DB System (CPU and RAM) will be set automatically.
  • Select the size of the storage for data and backup.
  • Create a backup policy or accept the default.

Creating MySQL instances

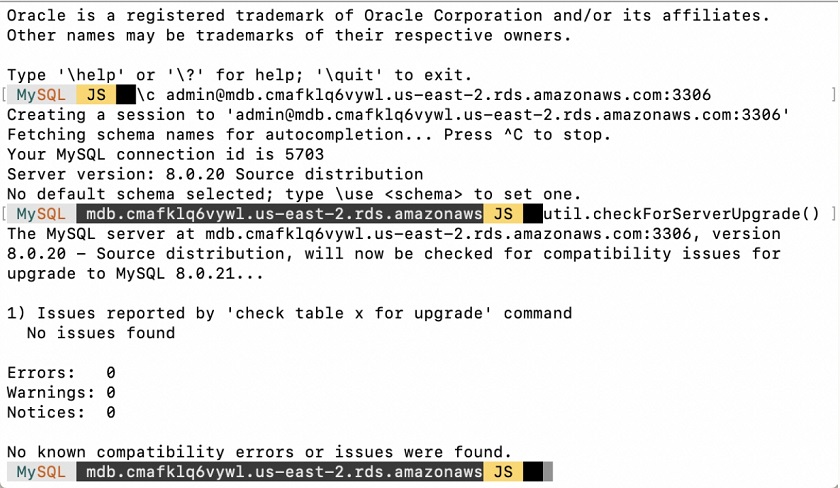
You can use MySQL Shell Upgrade Checker Utility to check the compatibility with MySQL8.0.

util.checkForServerUpgrade()

Loading the data

To move the data, you can use the MySQL Shell Dump & Load utility, which is capable of multi-threading and is callable with the JavaScript methods from MySQL Shell.

So, you can dump on what can be a bastion machine, and load your instance to the cloud. It will take several minutes to load the database of several gigabytes, so it is necessary to plan the service maintenance window accordingly.

In addition, the utility is easy to use. You just need to connect to an instance and dump.

MySQL Shell Dump & Load

The operation is pretty straightforward and the migration time will depend on the size of the database.

Free trial

You can have a test drive of the MySQL Database Service with $300 in cloud credits, which you can spend in the Oracle Cloud on MySQL Database Service or other cloud services.


Questions & Answers

Question. Do you help with migrating the databases from older versions to MySQL 8.0?

Answer. Yes, this is the thing we normally do for our customers — providing guidance, though data migration is normally straightforward.

Question. Does the database size matter? How efficient MySQL Shell Dump is? What if my database is terabytes in size?

Answer. MySQL Shell Dump & Load utility is much more efficient than what MySQL Dump used to be. The database size still matters. In that case, it will require more time, still way less than it used to take


Staying up to date when using official Zabbix packages

Post Syndicated from Jurijs Klopovskis original https://blog.zabbix.com/staying-up-to-date-when-using-official-zabbix-packages/12806/

It is not a secret that Zabbix maintains package repositories for multiple GNU/Linux distributions to make installing the software and staying up to date with the latest releases as easy as possible. To make use of the official Zabbix packages one should follow the instructions on https://www.zabbix.com/download. In this article, we would like to talk about some common points of confusion that people have when using Zabbix packages.

Being a Zabbix package maintainer, I often notice that people are confused about which packages are provided for which operating system. That’s why we have created a table that gives users info about package availability by operating system at-a-glance. Furthermore, we would like to clarify certain specific issues to eliminate any potentially remaining misunderstandings. In particular, let’s address the issue of packages no longer being provided for certain operating systems.

It is important to understand that Zabbix packages depend on other packages provided by the operating system. Whether those are web server and PHP packages needed for the frontend or OpenSSL required pretty much by all other Zabbix components, Zabbix is limited by the versions of these packages that are shipped with the operating system, or by how up to date these packages are.

Any professional system administrator is familiar with the need to install the latest security updates as one of the central measures to keep their systems secure. Unless the system provides the necessary security updates, that system should not be used. But there are also other aspects besides security that should be taken into consideration.

One specific case that we would like to discuss is Red Hat Enterprise Linux 7. In fact, RHEL/CentOS 7 constitutes a large chunk of Zabbix installations.

Heads Up! The same packages are used for RHEL, CentOS & Oracle Linux, thus when RHEL is mentioned, CentOS is also implied.

As many of you may have noticed, only zabbix-agent, zabbix-sender & zabbix-get packages have been provided for RHEL 7 when version 5.2 was released. What’s the deal?

Red Hat backports security fixes for older packages, and this is awesome. Despite that, the essential packages that Zabbix uses as dependencies are tremendously old.
Case in point, RHEL 7 ships with:

  • PHP 5.4.16
  • MariaDB 5.5.68 & PostgreSQL 9.2.24
  • OpenSSL 1.0.2k

Let’s talk about these in detail.

PHP 5.4

Starting with version 5.0, Zabbix frontend requires PHP version 7.2 or higher. Simply put, our frontend developers needed to make use of the new PHP features to improve the user experience. Also, 7.2 was the oldest supported version in the upstream.

Quite expectedly, this caused some problems when packaging Zabbix for RHEL 7, due to the distribution shipping PHP version 5.4. At first, the idea was to drop support for the 5.0 frontend on RHEL 7 altogether, but after consulting with the support team, it was decided to find a way around to keep providing these packages somehow.

Enter Red Hat Software Collections. Instead of being dropped completely, Zabbix 5.0 frontend packages were based on PHP 7.2 found in RH SCL. The day was saved, but in the end, this still was not the cleanest solution. A lot of things had to be altered from the way they are usually done. Changes had to be made to configuration files and user instructions. The repository structure was altered and frontend-related packages were renamed to include the “scl” suffix to reflect the changes. As a result, these changes made package maintenance pretty difficult for us. Furthermore, extra attention was required from the users when installing these packages and especially when updating from the previous versions.

As a side note, on Debian-based distros that have the same problem, the frontend package has been deprecated altogether.

Old Databases & OpenSSL

Secure connection to the database was introduced in 5.0, however, it does not work on RHEL 7.

Try for yourself. Put DBTLSConnect=required option into /etc/zabbix/zabbix_server.conf file and try to restart the Zabbix server. It will fail with the following error:

"DBTLSConnect" configuration parameter cannot be used: Zabbix server was compiled without PostgreSQL or MySQL library version that support TLS

This happens due to RHEL 7 shipping old database packages. Yes, using RH SCL is possible but implementation would be an even bigger mess than what was required for making the 5.0 frontend work. Considering that RHEL 7 is on its way out, it takes just too much effort to implement and support.

Another issue is the fact that old OpenSSL packages prevent the use of TLS 1.3 among other things.

For example, add TLSCipherPSK13=TLS_AES_128_GCM_SHA256 setting to /etc/zabbix/zabbix_proxy.conf and restart the server. You will get the following error in the proxy log file.

cannot set list of TLS 1.3 PSK ciphersuites: compiled with OpenSSL version older than 1.1.1. Consider not using parameters "TLSCipherPSK13" or "--tls-cipher13"

TLS 1.3 is fully supported in RHEL 8.

The usage of HashiCorp Vault can possibly be affected by the old OpenSSL version as well.

There are potentially other issues that haven’t been discovered yet. Because of the nature of the old packages on RHEL 7, it is hard to fully predict what can go wrong.

In conclusion

Taking into consideration all of the above, it was decided to not provide server and frontend packages for 5.2 on RHEL 7. We do understand that this is super-inconvenient for some people, but the truth is that this has to be done sooner or later. It could have been done in 5.4 or 6.0, but that is simply kicking the can further down the road. It is a painful, but necessary change.

Proxy packages for 5.2 will be provided to keep some backward compatibility, but keep in mind that a lot of the modern features will not work there, including:

  • No support for TLS 1.3
  • No support for encrypted database connections

And most importantly, support for proxy on RHEL 7 will be dropped in Zabbix 5.4!

Note
RHEL 7 support for existing Zabbix customers will still be provided.

In short upgrade to RHEL 8. This will have to be done sooner or later. Do that and forget about this type of problem in the foreseeable future.

Note
We are aware of recent change in CentOS 8 lifecycle and are investigating its impact on Zabbix packages.

Of course  the cost of upgrading RHEL may be prohibitive. So, if the upgrade is impossible for one reason or another, which options are available?

  • Use container images. Probably the most progressive option of all. Zabbix has great container images. Consider using them, if using 5.2 is an impediment.
  • Use 5.0 LTS instead. Indeed, 5.0 packages are available for RHEL 7 and will be supported for some time. Despite the known problems, described above, this can be a great option.
  • Build from source. Of course, there is always a hard way. Grab the sources and build away. If you choose to go this route, then you must take into account the potential problems caused by old packages on the system.

Ultimately, we suggest thinking of this as a motivation to make an upgrade. If you really need new features of Zabbix, consider using an up-to-date operating system.

Recreate Tiger-Heli’s bomb mechanic | Wireframe #45

Post Syndicated from Ryan Lambie original https://www.raspberrypi.org/blog/recreate-tiger-helis-bomb-mechanic-wireframe-45/

Code an explosive homage to Toaplan’s classic blaster. Mark Vanstone has the details

Tiger-Heli was developed by Toaplan and published in Japan by Taito and by Romstar in North America.

Released in 1985, Tiger-Heli was one of the earliest games from Japanese developer Toaplan: a top-down shoot-’em-up that pitted a lone helicopter against relentless waves of enemy tanks and military installations. Toaplan would go on to refine and evolve the genre through the eighties and nineties with such titles as Truxton and Fire Shark, so Tiger-Heli served as a kind of blueprint for the studio’s legendary blasters.

Tiger-Heli featured a powerful secondary weapon, too: as well as a regular shot, the game’s attack helicopter could also drop a deadly bomb capable of destroying everything within its blast radius. The mechanic was one that first appeared as far back as Atari’s Defender in 1981, but Toaplan quickly made it its own, with variations on the bomb becoming one of the signatures in the studio’s later games.

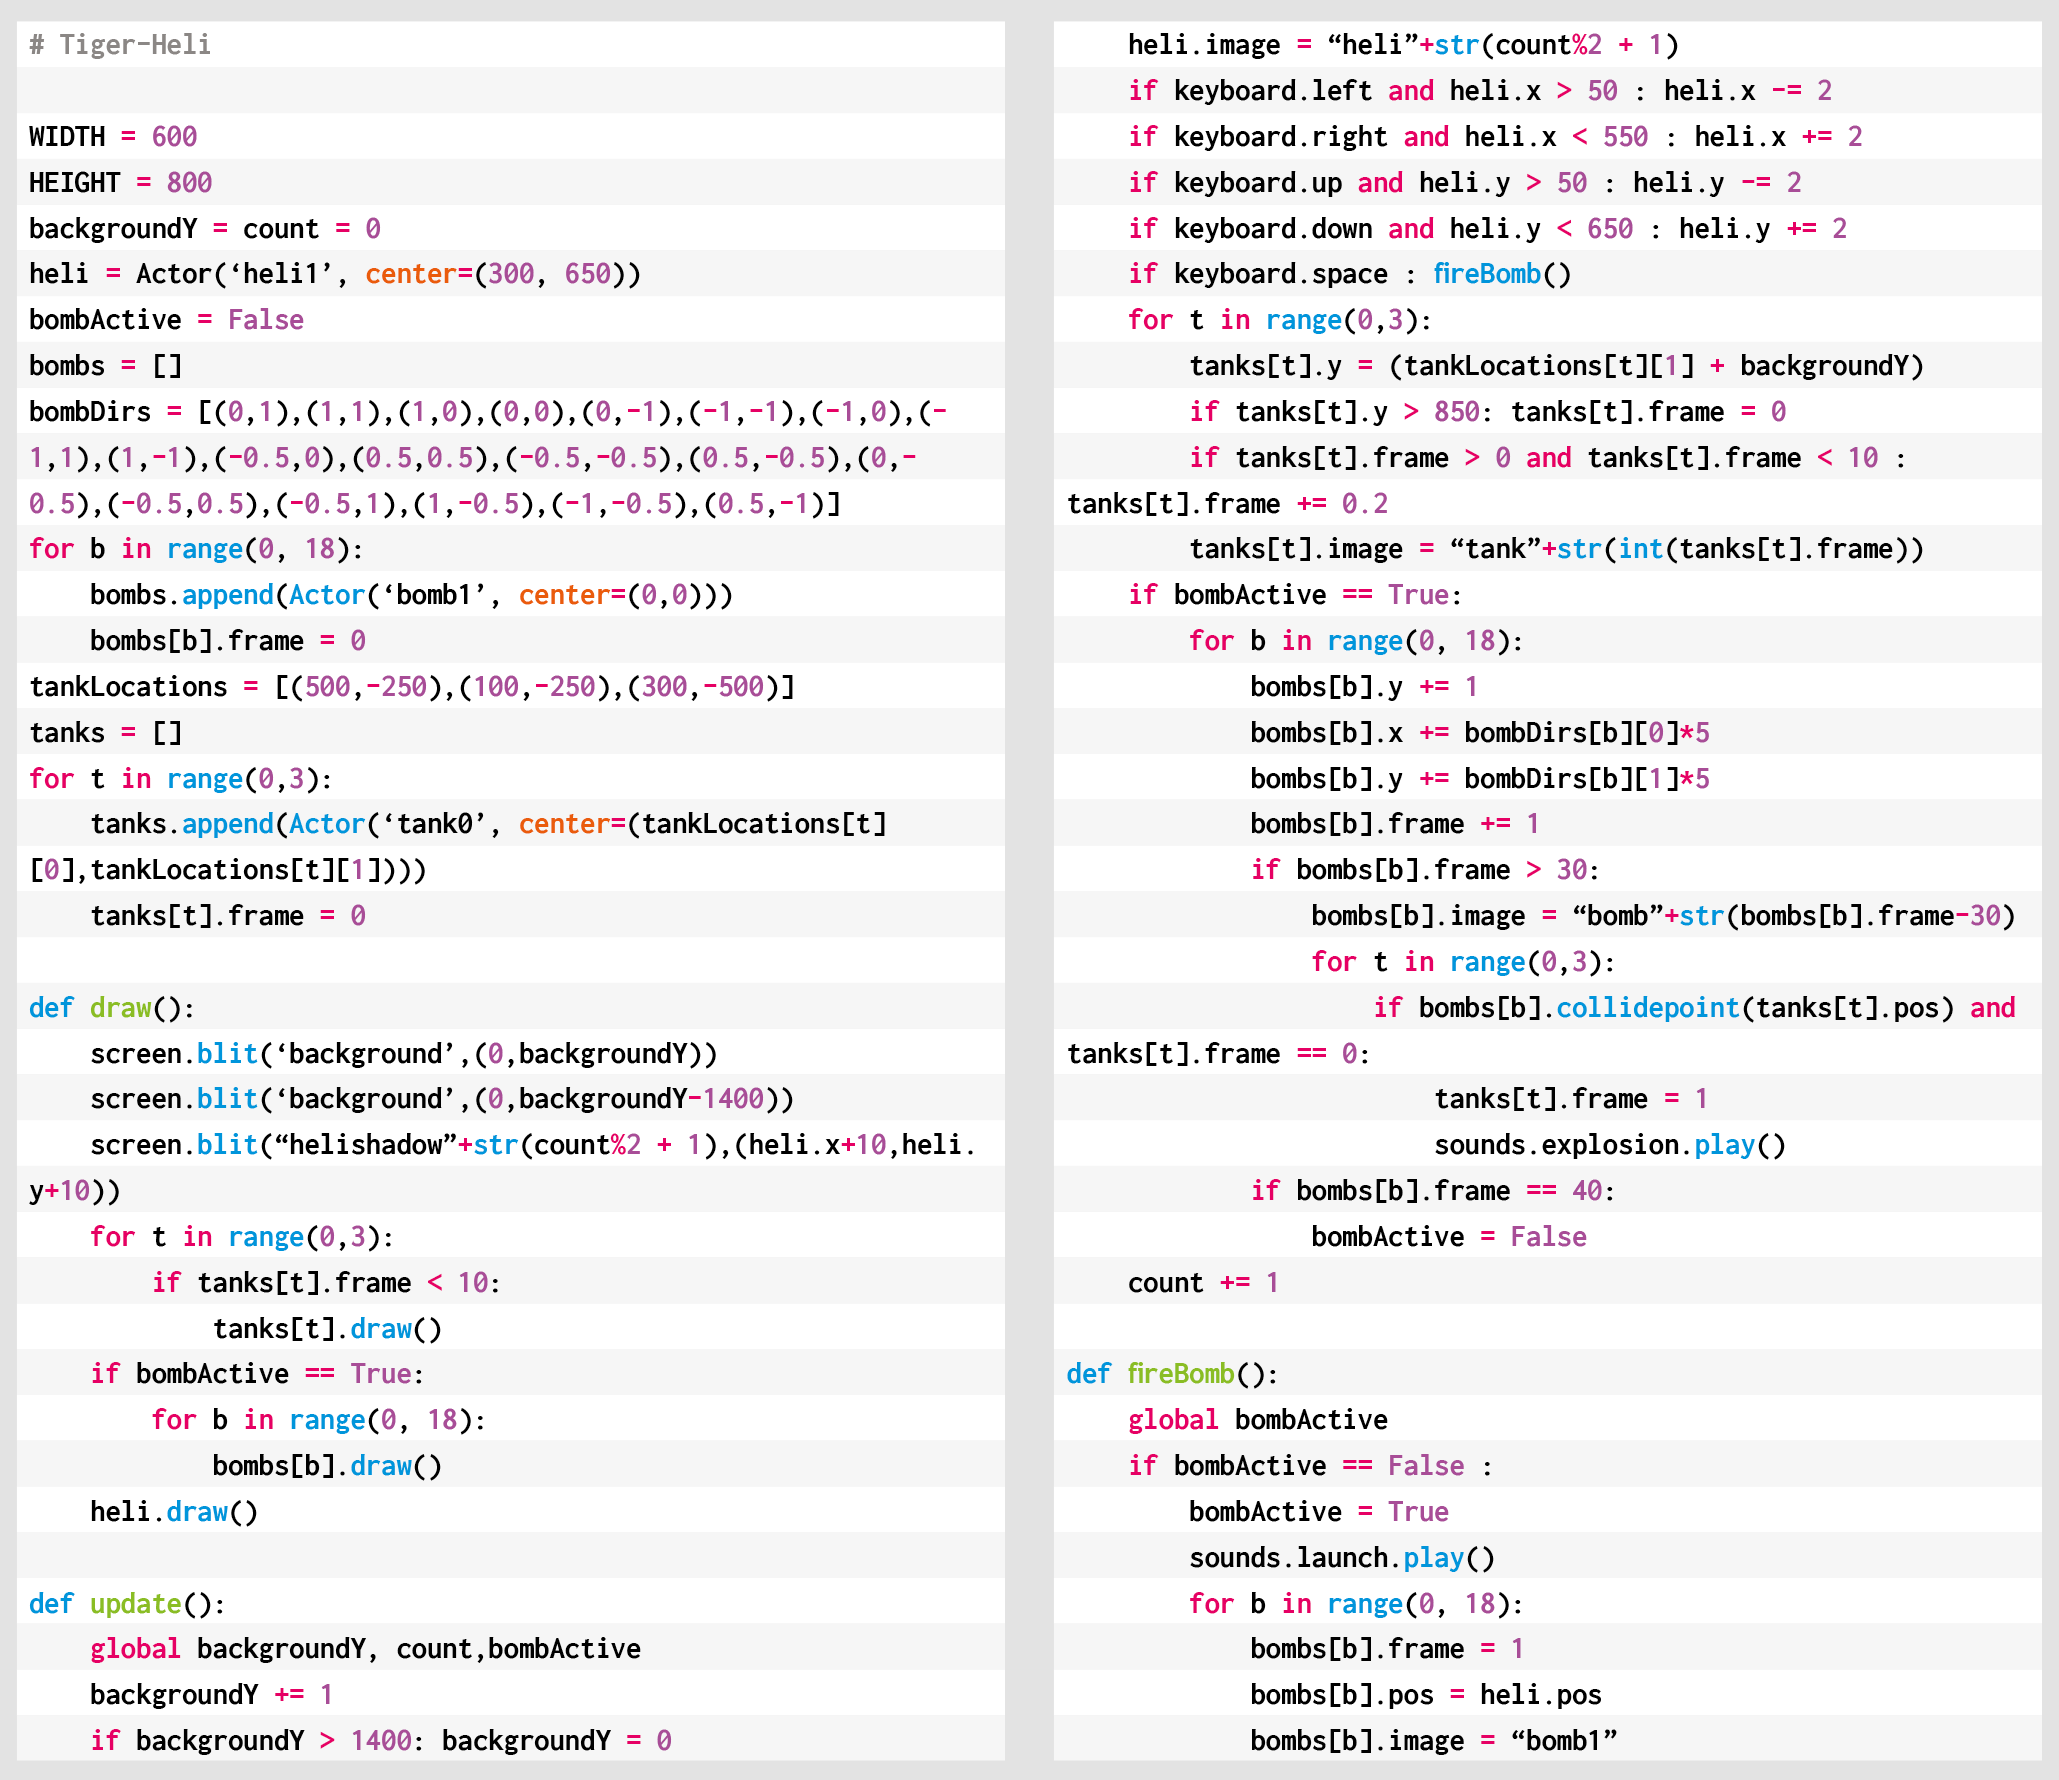
For our Tiger-Heli-style Pygame Zero code, we’ll concentrate on the unique bomb aspect, but first, we need to get the basic scrolling background and helicopter on the screen. In a game like this, we’d normally make the background out of tiles that can be used to create a varied but continuous scrolling image. For this example, though, we’ll keep things simple and have one long image that we scroll down the screen and then display a copy above it. When the first image goes off the screen, we just reset the co-ordinates to display it above the second image copy. In this way, we can have an infinitely scrolling background.

Our Tiger-Heli homage in Python. Fly over the military targets, firing missiles and dropping bombs.


The helicopter can be set up as an Actor with just two frames for the movement of the rotors. This should look like it’s hovering above the ground, so we blit a shadow bitmap to the bottom right of the helicopter. We can set up keyboard events to move the Actor left, right, up, and down, making sure we don’t allow it to go off the screen.

Now we can go ahead and set up the bombs. We can predefine a list of bomb Actors but only display them while the bombs are active. We’ll trigger a bomb drop with the SPACE bar and set all the bombs to the co-ordinates of the helicopter. Then, frame by frame, we move each bomb outwards in different directions so that they spread out in a pattern. You could try adjusting the number of bombs or their pattern to see what effects can be achieved. When the bombs get to frame 30, we start changing the image so that we get a flashing, expanding circle for each bomb.

Here’s Mark’s code for a Tiger-Heli-style shooter. To get it working on your system, you’ll need to install Pygame Zero. And to download the full code and assets, head here.

It’s all very well having bombs to fire, but we could really do with something to drop them on, so let’s make some tank Actors waiting on the ground for us to destroy. We can move them with the scrolling background so that they look like they’re static on the ground. Then if one of our bombs has a collision detected with one of the tanks, we can set an animation going by cycling through a set of explosion frames, ending with the tank disappearing.

We can also add in some sound effects as the bombs are dropped, and explosion sounds if the tanks are hit. And with that, there you have it: the beginnings of a Tiger-Heli-style blaster.

Get your copy of Wireframe issue 45

You can read more features like this one in Wireframe issue 45, available directly from Raspberry Pi Press — we deliver worldwide.

And if you’d like a handy digital version of the magazine, you can also download issue 45 for free in PDF format.

Baldur’s Gate III: our cover star for Wireframe #45.

Make sure to follow Wireframe on Twitter and Facebook for updates and exclusive offers and giveaways. Subscribe on the Wireframe website to save up to 72% compared to newsstand pricing!

The post Recreate Tiger-Heli’s bomb mechanic | Wireframe #45 appeared first on Raspberry Pi.

Using NuGet with AWS CodeArtifact

Post Syndicated from John Standish original https://aws.amazon.com/blogs/devops/using-nuget-with-aws-codeartifact/

Managing NuGet packages for .NET development can be a challenge. Tasks such as initial configuration, ongoing maintenance, and scaling inefficiencies are the biggest pain points for developers and organizations. With its addition of NuGet package support, AWS CodeArtifact now provides easy-to-configure and scalable package management for .NET developers. You can use NuGet packages stored in CodeArtifact in Visual Studio, allowing you to use the tools you already know.

In this post, we show how you can provision NuGet repositories in 5 minutes. Then we demonstrate how to consume packages from your new NuGet repositories, all while using .NET native tooling.

All relevant code for this post is available in the aws-codeartifact-samples GitHub repo.

Prerequisites

For this walkthrough, you should have the following prerequisites:

Architecture overview

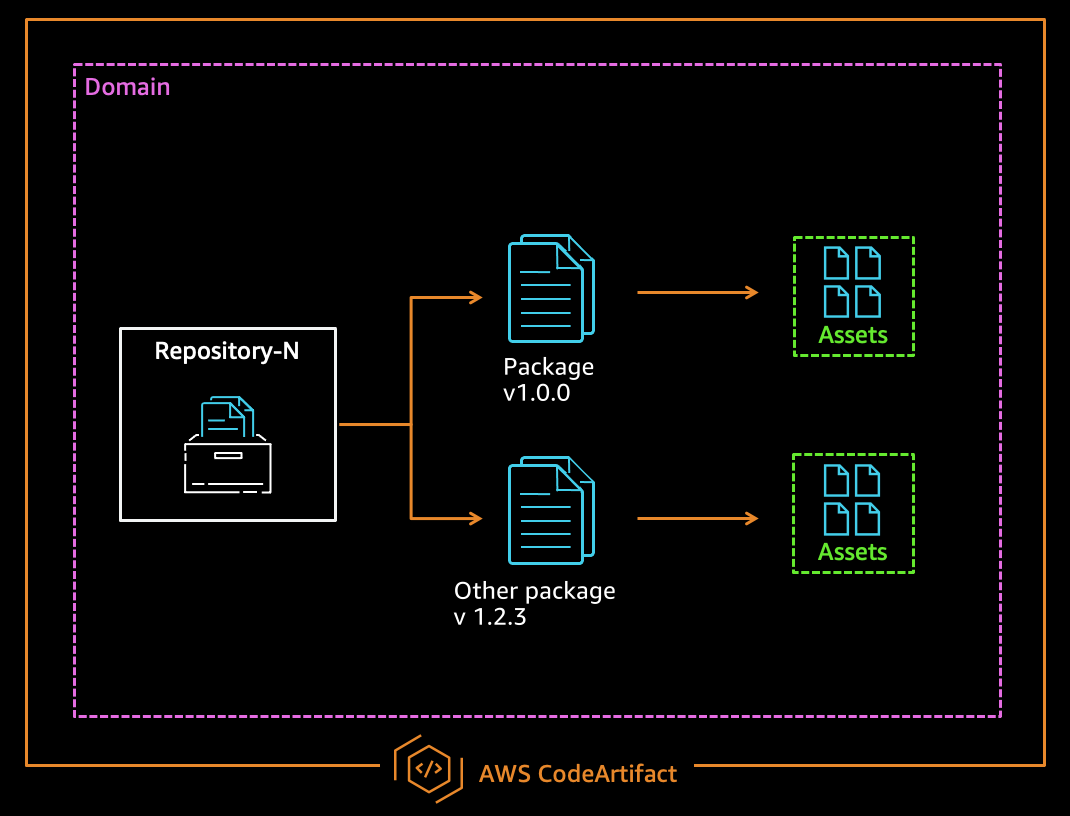
Two core resource types make up CodeArtifact: domains and repositories. Domains provide an easy way manage multiple repositories within an organization. Repositories store packages and their assets. You can connect repositories to other CodeArtifact repositories, or popular public package repositories such as nuget.org, using upstream and external connections. For more information about these concepts, see AWS CodeArtifact Concepts.

The following diagram illustrates this architecture.

AWS CodeArtifact core concepts

Figure: AWS CodeArtifact core concepts

Creating CodeArtifact resources with AWS CloudFormation

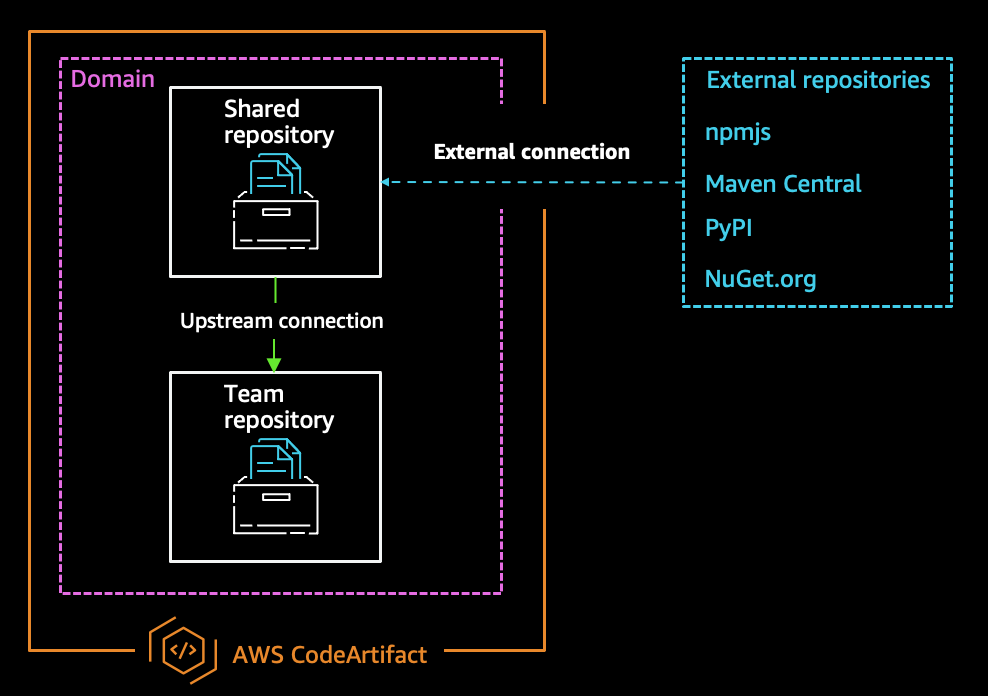
The AWS CloudFormation template provided in this post provisions three CodeArtifact resources: a domain, a team repository, and a shared repository. The team repository is configured to use the shared repository as an upstream repository, and the shared repository has an external connection to nuget.org.

The following diagram illustrates this architecture.

Example AWS CodeArtifact architecture

Figure: Example AWS CodeArtifact architecture

The following CloudFormation template used in this walkthrough:

AWSTemplateFormatVersion: '2010-09-09'
Description: AWS CodeArtifact resources for dotnet

Resources:
  # Create Domain
  ExampleDomain:
    Type: AWS::CodeArtifact::Domain
    Properties:
      DomainName: example-domain
      PermissionsPolicyDocument:
        Version: 2012-10-17
        Statement:
          - Effect: Allow
            Principal:
              AWS: 
              - !Sub arn:aws:iam::${AWS::AccountId}:root
            Resource: "*"
            Action:
              - codeartifact:CreateRepository
              - codeartifact:DescribeDomain
              - codeartifact:GetAuthorizationToken
              - codeartifact:GetDomainPermissionsPolicy
              - codeartifact:ListRepositoriesInDomain

  # Create External Repository
  MyExternalRepository:
    Type: AWS::CodeArtifact::Repository
    Condition: ProvisionNugetTeamAndUpstream
    Properties:
      DomainName: !GetAtt ExampleDomain.Name
      RepositoryName: my-external-repository       
      ExternalConnections:
        - public:nuget-org
      PermissionsPolicyDocument:
        Version: 2012-10-17
        Statement:
          - Effect: Allow
            Principal:
              AWS: 
              - !Sub arn:aws:iam::${AWS::AccountId}:root
            Resource: "*"
            Action:
              - codeartifact:DescribePackageVersion
              - codeartifact:DescribeRepository
              - codeartifact:GetPackageVersionReadme
              - codeartifact:GetRepositoryEndpoint
              - codeartifact:ListPackageVersionAssets
              - codeartifact:ListPackageVersionDependencies
              - codeartifact:ListPackageVersions
              - codeartifact:ListPackages
              - codeartifact:PublishPackageVersion
              - codeartifact:PutPackageMetadata
              - codeartifact:ReadFromRepository

  # Create Repository
  MyTeamRepository:
    Type: AWS::CodeArtifact::Repository
    Properties:
      DomainName: !GetAtt ExampleDomain.Name
      RepositoryName: my-team-repository
      Upstreams:
        - !GetAtt MyExternalRepository.Name
      PermissionsPolicyDocument:
        Version: 2012-10-17
        Statement:
          - Effect: Allow
            Principal:
              AWS: 
              - !Sub arn:aws:iam::${AWS::AccountId}:root
            Resource: "*"
            Action:
              - codeartifact:DescribePackageVersion
              - codeartifact:DescribeRepository
              - codeartifact:GetPackageVersionReadme
              - codeartifact:GetRepositoryEndpoint
              - codeartifact:ListPackageVersionAssets
              - codeartifact:ListPackageVersionDependencies
              - codeartifact:ListPackageVersions
              - codeartifact:ListPackages
              - codeartifact:PublishPackageVersion
              - codeartifact:PutPackageMetadata
              - codeartifact:ReadFromRepository

Getting the CloudFormation template

To use the CloudFormation stack, we recommend you clone the following GitHub repo so you also have access to the example projects. See the following code:

git clone https://github.com/aws-samples/aws-codeartifact-samples.git
cd aws-codeartifact-samples/getting-started/dotnet/cloudformation/

Alternatively, you can copy the previous template into a file on your local filesystem named deploy.yml.

Provisioning the CloudFormation stack

Now that you have a local copy of the template, you need to provision the resources using a CloudFormation stack. You can deploy the stack using the AWS CLI or on the AWS CloudFormation console.

To use the AWS CLI, enter the following code:

aws cloudformation deploy \
--template-file deploy.yml \
--region <YOUR_PREFERRED_REGION> \
--stack-name CodeArtifact-GettingStarted-DotNet

To use the AWS CloudFormation console, complete the following steps:

  1. On the AWS CloudFormation console, choose Create stack.
  2. Choose With new resources (standard).
  3. Select Upload a template file.
  4. Choose Choose file.
  5. Name the stack CodeArtifact-GettingStarted-DotNet.
  6. Continue to choose Next until prompted to create the stack.

Configuring your local development experience

We use the CodeArtifact credential provider to connect the Visual Studio IDE to a CodeArtifact repository. You need to download and install the AWS Toolkit for Visual Studio to configure the credential provider. The toolkit is an extension for Microsoft Visual Studio on Microsoft Windows that makes it easy to develop, debug, and deploy .NET applications to AWS. The credential provider automates fetching and refreshing the authentication token required to pull packages from CodeArtifact. For more information about the authentication process, see AWS CodeArtifact authentication and tokens.

To connect to a repository, you complete the following steps:

  1. Configure an account profile in the AWS Toolkit.
  2. Copy the source endpoint from the AWS Explorer.
  3. Set the NuGet package source as the source endpoint.
  4. Add packages for your project via your CodeArtifact repository.

Configuring an account profile in the AWS Toolkit

Before you can use the Toolkit for Visual Studio, you must provide a set of valid AWS credentials. In this step, we set up a profile that has access to interact with CodeArtifact. For instructions, see Providing AWS Credentials.

Visual Studio Toolkit for AWS Account Profile Setup

Figure: Visual Studio Toolkit for AWS Account Profile Setup

Copying the NuGet source endpoint

After you set up your profile, you can see your provisioned repositories.

  1. In the AWS Explorer pane, navigate to the repository you want to connect to.
  2. Choose your repository (right-click).
  3. Choose Copy NuGet Source Endpoint.
AWS CodeArtifact repositories shown in the AWS Explorer

Figure: AWS CodeArtifact repositories shown in the AWS Explorer


You use the source endpoint later to configure your NuGet package sources.

Setting the package source using the source endpoint

Now that you have your source endpoint, you can set up the NuGet package source.

  1. In Visual Studio, under Tools, choose Options.
  2. Choose NuGet Package Manager.
  3. Under Options, choose the + icon to add a package source.
  4. For Name , enter codeartifact.
  5. For Source, enter the source endpoint you copied from the previous step.
Configuring Nuget package sources for AWS CodeArtifact

Figure: Configuring NuGet package sources for AWS CodeArtifact


Adding packages via your CodeArtifact repository

After the package source is configured against your team repository, you can pull packages via the upstream connection to the shared repository.

  1. Choose Manage NuGet Packages for your project.
    • You can now see packages from nuget.org.
  2. Choose any package to add it to your project.
Exploring packages while connected to a AWS CodeArtifact repository

Exploring packages while connected to a AWS CodeArtifact repository

Viewing packages stored in your CodeArtifact team repository

Packages are stored in a repository you pull from, or referenced via the upstream connection. Because we’re pulling packages from nuget.org through an external connection, you can see cached copies of those packages in your repository. To view the packages, navigate to your repository on the CodeArtifact console.

Packages stored in a AWS CodeArtifact repository

Packages stored in a AWS CodeArtifact repository

Cleaning Up

When you’re finished with this walkthrough, you may want to remove any provisioned resources. To remove the resources that the CloudFormation template created, navigate to the stack on the AWS CloudFormation console and choose Delete Stack. It may take a few minutes to delete all provisioned resources.

After the resources are deleted, there are no more cleanup steps.

Conclusion

We have shown you how to set up CodeArtifact in minutes and easily integrate it with NuGet. You can build and push your package faster, from hours or days to minutes. You can also integrate CodeArtifact directly in your Visual Studio environment with four simple steps. With CodeArtifact repositories, you inherit the durability and security posture from the underlying storage of CodeArtifact for your packages.

As of November 2020, CodeArtifact is available in the following AWS Regions:

  • US: US East (Ohio), US East (N. Virginia), US West (Oregon)
  • AP: Asia Pacific (Mumbai), Asia Pacific (Singapore), Asia Pacific (Sydney), Asia Pacific (Tokyo)
  • EU: Europe (Frankfurt), Europe (Ireland), Europe (Stockholm)

For an up-to-date list of Regions where CodeArtifact is available, see AWS CodeArtifact FAQ.

About the Authors

John Standish

John Standish is a Solutions Architect at AWS and spent over 13 years as a Microsoft .Net developer. Outside of work, he enjoys playing video games, cooking, and watching hockey.

Nuatu Tseggai

Nuatu Tseggai is a Cloud Infrastructure Architect at Amazon Web Services. He enjoys working with customers to design and build event-driven distributed systems that span multiple services.

Neha Gupta

Neha Gupta is a Solutions Architect at AWS and have 16 years of experience as a Database architect/ DBA. Apart from work, she’s outdoorsy and loves to dance.

Elijah Batkoski

Elijah is a Technical Writer for Amazon Web Services. Elijah has produced technical documentation and blogs for a variety of tools and services, primarily focused around DevOps.

Close problem automatically via Zabbix API

Post Syndicated from Aigars Kadiķis original https://blog.zabbix.com/close-problem-automatically-via-zabbix-api/12461/

Today we are talking about a use case when it’s impossible to find a proper way to write a recovery expression for the Zabbix trigger. In other words, we know how to identify problems. But there is no good way to detect when the problem is gone.

This mostly relates to a huge environment, for example:

  • Got one log file. There are hundreds of patterns inside. We respect all of them. We need them
  • SNMP trap item (snmptrap.fallback) with different patterns being written inside

In these situations, the trigger is most likely configured to “Event generation mode: Multiple.” This practically means: when a “problematic metric” hits the instance, it will open +1 additional problem.

Goal:
I just need to receive an email about the record, then close the event.

As a workaround (let’s call it a solution here), we can define an action which will:

  1. contact an API endpoint
  2. manually acknowledge the event and close it

The biggest reason why this functionality is possible is that: when an event hits the action, the operation actually knows the event ID of the problem. The macro {EVENT.ID} saves the day.

To solve the problem, we need to install API characteristics at the global level:

     {$Z_API_PHP}=http://127.0.0.1/api_jsonrpc.php
    {$Z_API_USER}=api
{$Z_API_PASSWORD}=zabbix

NOTE
‘http://127.0.0.1/api_jsonrpc.php’ means the frontend server runs on the same server as systemd:zabbix-server. If it is not the case, we need to plot a front-end address of Zabbix GUI + add ‘api_jsonrpc.php’.

We will have 2 actions. The first one will deliver a notification to email:

After 1 minute, a second action will close the event:

This is a full bash snippet we must put inside. No need to change anything. It works with copy and paste:

url={$Z_API_PHP}
    user={$Z_API_USER}
password={$Z_API_PASSWORD}

# authorization
auth=$(curl -sk -X POST -H "Content-Type: application/json" -d "
{
	\"jsonrpc\": \"2.0\",
	\"method\": \"user.login\",
	\"params\": {
		\"user\": \"$user\",
		\"password\": \"$password\"
	},
	\"id\": 1,
	\"auth\": null
}
" $url | \
grep -E -o "([0-9a-f]{32,32})")

# acknowledge and close event
curl -sk -X POST -H "Content-Type: application/json" -d "
{
	\"jsonrpc\": \"2.0\",
	\"method\": \"event.acknowledge\",
	\"params\": {
		\"eventids\": \"{EVENT.ID}\",
		\"action\": 1,
		\"message\": \"Problem resolved.\"
	},
	\"auth\": \"$auth\",
	\"id\": 1
}" $url

# close api key
curl -sk -X POST -H "Content-Type: application/json" -d "
{
    \"jsonrpc\": \"2.0\",
    \"method\": \"user.logout\",
    \"params\": [],
    \"id\": 1,
    \"auth\": \"$auth\"
}
" $url

Zabbix API scripting via curl and jq

Post Syndicated from Aigars Kadiķis original https://blog.zabbix.com/zabbix-api-scripting-via-curl-and-jq/12434/

In this lab we will use a bash environment and utilities ‘curl’ and ‘jq’ to perform Zabbix API calls, do some scripting.

‘curl’ is a tool to exchange JSON messages over HTTP/HTTPS.
‘jq’ utility helps to locate and extract specific elements in output.

To follow the lab we need to install ‘jq’:

# On CentOS7/RHEL7:
yum install epel-release && yum install jq

# On CentOS8/RHEL8:
dnf install jq

# On Ubuntu/Debian:
apt install jq

# On any 64-bit Linux platform:
curl -skL "https://github.com/stedolan/jq/releases/download/jq1.5/jq-linux64" -o /usr/bin/jq && chmod +x /usr/bin/jq

Obtaining an authorization token

In order to operate with API calls we need to:

  • Define an API endpoint. this is an URL, a PHP file which is designed to accept requests
  • Obtain an authorization token

If you tend to execute API calls from frontend server then most likelly.

url=http://127.0.0.1/api_jsonrpc.php
# or:
url=http://127.0.0.1/zabbix/api_jsonrpc.php

It’s required to set the URL variable to jump to the next step. Test if you have it configured:

echo $url

Any API call needs to be used via authorization token. To put one token in variable use the command:

auth=$(curl -s -X POST -H 'Content-Type: application/json-rpc' \
-d '
{"jsonrpc":"2.0","method":"user.login","params":
{"user":"api","password":"zabbix"},
"id":1,"auth":null}
' $url | \
jq -r .result
)

Note
Notice there is user ‘api’ with password ‘zabbix’. This is a dedicated user for API calls.

Check if you have a session key. It should be 32 character HEX string:

echo $auth

Though process

1) visit the documentation page and pick an API flavor for example alert.get:

{
"jsonrpc": "2.0",
"method": "alert.get",
"params": {
	"output": "extend",
	"actionids": "3"
},
"auth": "038e1d7b1735c6a5436ee9eae095879e",
"id": 1
}

2) Let’s use our favorite text editor and build in Find&Replace functionality to escape all double quotes:

{
\"jsonrpc\": \"2.0\",
\"method\": \"alert.get\",
\"params\": {
	\"output\": \"extend\",
	\"actionids\": \"3\"
},
\"auth\": \"038e1d7b1735c6a5436ee9eae095879e\",
\"id\": 1
}

NOTE
Don’t ever think to do this process manually by hand!

3) Replace session key 038e1d7b1735c6a5436ee9eae095879e with our variable $auth

{
\"jsonrpc\": \"2.0\",
\"method\": \"alert.get\",
\"params\": {
	\"output\": \"extend\",
	\"actionids\": \"3\"
},
\"auth\": \"$auth\",
\"id\": 1
}

4) Now let’s encapsulate the API command with curl:

curl -s -X POST \
-H 'Content-Type: application/json-rpc' \
-d " \

{
\"jsonrpc\": \"2.0\",
\"method\": \"alert.get\",
\"params\": {
	\"output\": \"extend\",
	\"actionids\": \"3\"
},
\"auth\": \"$auth\",
\"id\": 1
}

" $url

By executing the previous command, it should already print a JSON content in response.
To make the output more beautiful we can pipe it to jq .:

curl -s -X POST \
-H 'Content-Type: application/json-rpc' \
-d " \

{
\"jsonrpc\": \"2.0\",
\"method\": \"alert.get\",
\"params\": {
	\"output\": \"extend\",
	\"actionids\": \"3\"
},
\"auth\": \"$auth\",
\"id\": 1
}

" $url | jq .

Wrap everything together in one file

This is ready to use the snippet:

#!/bin/bash

# 1. set connection details
url=http://127.0.0.1/api_jsonrpc.php
user=api
password=zabbix

# 2. get authorization token
auth=$(curl -s -X POST \
-H 'Content-Type: application/json-rpc' \
-d " \
{
 \"jsonrpc\": \"2.0\",
 \"method\": \"user.login\",
 \"params\": {
  \"user\": \"$user\",
  \"password\": \"$password\"
 },
 \"id\": 1,
 \"auth\": null
}
" $url | \
jq -r '.result'
)

# 3. show triggers in problem state
curl -s -X POST \
-H 'Content-Type: application/json-rpc' \
-d " \
{
 \"jsonrpc\": \"2.0\",
    \"method\": \"trigger.get\",
    \"params\": {
        \"output\": \"extend\",
        \"selectHosts\": \"extend\",
        \"filter\": {
            \"value\": 1
        },
        \"sortfield\": \"priority\",
        \"sortorder\": \"DESC\"
    },
    \"auth\": \"$auth\",
    \"id\": 1
}
" $url | \
jq -r '.result'

# 4. logout user
curl -s -X POST \
-H 'Content-Type: application/json-rpc' \
-d " \
{
    \"jsonrpc\": \"2.0\",
    \"method\": \"user.logout\",
    \"params\": [],
    \"id\": 1,
    \"auth\": \"$auth\"
}
" $url

Conveniences

We can use https://jsonpathfinder.com/ to identify what should be the path to extract an element.

For example, to list all Zabbix proxies we will use and API call:

curl -s -X POST \
-H 'Content-Type: application/json-rpc' \
-d " \
{
    \"jsonrpc\": \"2.0\",
    \"method\": \"proxy.get\",
    \"params\": {
        \"output\": [\"host\"]
    },
    \"auth\": \"$auth\",
    \"id\": 1
} 
" $url

It may print content like:

{"jsonrpc":"2.0","result":[{"host":"broceni","proxyid":"10387"},{"host":"mysql8mon","proxyid":"12066"},{"host":"riga","proxyid":"12585"}],"id":1}

Inside JSONPathFinder by using a mouse click at the right panel, we can locate a sample element what we need to extract:

It suggests a path ‘x.result[1].host’. This means to extract all elements we can remove the number and use ‘.result[].host’ like this:

curl -s -X POST \
-H 'Content-Type: application/json-rpc' \
-d " \
{
    \"jsonrpc\": \"2.0\",
    \"method\": \"proxy.get\",
    \"params\": {
        \"output\": [\"host\"]
    },
    \"auth\": \"$auth\",
    \"id\": 1
} 
" $url | jq -r '.result[].host'

Now it prints only the proxy titles:

broceni
mysql8mon
riga

That is it for today. Bye.

Zabbix API calls through Postman

Post Syndicated from Aigars Kadiķis original https://blog.zabbix.com/zabbix-api-calls-through-postman/12198/

Zabbix API calls can be used through the graphical user interface (GUI), no need to jump to scripting. An application to perform API calls is called Postman.

Benefits:

  • Available on Windows, Linux, or MAC
  • Save/synchronize your collection with Google account
  • Can copy and paste examples from the official documentation page

Let’s go to basic steps on how to perform API calls:

1st step – Grab API method user.login and use a dedicated username and password to obtain and session token:

{
    "jsonrpc": "2.0",
    "method": "user.login",
    "params": {
        "user": "api",
        "password": "zabbix"
    },
    "id": 1
}

This is how it looks in Postman:

NOTE
We recommend using a dedicated user for API calls. For example, a user called “api”. Make sure the user type has been chosen as “Zabbix Super Admin” so through this user we can access any type of information.

2nd step – Use API method trigger.get to list all triggers in the problem state:

{
    "jsonrpc": "2.0",
    "method": "trigger.get",
    "params": {
        "output": [
            "triggerid",
            "description",
            "priority"
        ],
        "filter": {
            "value": 1
        },
        "sortfield": "priority",
        "sortorder": "DESC"
    },
    "auth": "<session key>",
    "id": 1
}

Replace “<session key>” inside the API snippet to make it work. Then click “Send” button. It will list all triggers in the problem state on the right side:

Postman conveniences – Environments

Environments are “a must” if you:

  • Have a separate test, development, and production Zabbix instance
  • Plan to migrate Zabbix to next version (4.0 to 5.0) so it’s better to test all API calls beforehand

On the top right corner, there is a button Manage Environments. Let’s click it.

Now Create an environment:

Each environment must consist of url and auth key:

Now we have one definition prod. Can close window with [X]:

In order to work with your new environment, select a newly created profile prod. It’s required to substitute Zabbix API endpoint with {{url}} and plot {{auth}} to serve as a dynamic authorization key:

NOTE
Every time we notice an API procedure does not work anymore, all we need to do is to enter Manage environments section and install a new session tokken..

Topic in video format:
https://youtu.be/B14tsDUasG8?t=2513

Why Zabbix throttling preprocessing is a key point for high-frequency monitoring

Post Syndicated from Dmitry Lambert original https://blog.zabbix.com/why-zabbix-throttling-preprocessing-is-a-key-point-for-high-frequency-monitoring/12364/

Sometimes we need much more than collecting generic data from our servers or network devices. For high-frequency monitoring, we need functionality to offload сore components from the extensive load. Throttling is the exact thing that will allow you to drop repetitive values on a Pre-processing level and collect only changing values.

Contents

I. High-frequency monitoring (0:33)

1. High-frequency monitoring issues (2:25)
2. Throttling (5:55)

Throttling is available since Zabbix 4.2 and is highly effective for high-frequency monitoring.

High-frequency monitoring

We have to set update intervals for all of the items we create in Configuration > Host > Items > Create item.

Setting update interval

The smallest update interval for regular items in Zabbix is one second. If we want to monitor all items, including memory usage, network bandwidth, or CPU load once per second, this can be considered a high-frequency interval. However, in the case of industrial equipment or telemetry data, we’ll most likely need the data more often, for instance, every 1 millisecond.

The easiest way to send data every millisecond is to use Zabbix sender — a small utility to send values to the Zabbix server or the proxy. But first, these values should be gathered.

High-frequency monitoring issues

Selecting an update interval for different items

We have to think about performance, as the more data we have, the more performance issues will arise and the more powerful hardware we’ll have to buy.

If the data grabbed from a host is constantly changing, it makes sense to collect the data every 10 or 100 milliseconds, for instance. This means that we have to process this changing data with the triggers, store it in the database, visualize it in the Latest data, as every time we receive a new value.

There are values that does not have that trend to change very frequently, but without Throttling we would still collect a new value every milisecond and process it with all our triggers and internal processes, even if the value does not change over hours.

Throttling

The greatest way to solve this problem is through throttling.

To illustrate it, in Configuration > Hosts, let’s create a ‘Throttling‘ host and add it to a group.

Creating host

Then we’ll create an item to work as a Zabbix sender item.

Creating Zabbix sender item

NOTE. For a Zabbix sender item, the Type should always be ‘Zabbix trapper’.

Then open the CLI and reload the config cache:

zabbix_server -R config_cache_reload

Now we can send values to the Zabbix sender, specifying IP address of the Zabbix server, hostname, which is case-sensitive, the key, and then the value — 1:

zabbix_sender -z 127.0.0.1 -s Throttling -k youtube -o 1

If we send value “1” several times, they all will be displayed in Monitoring > Latest data.

Displaying the values grabbed from the host

NOTE. It’s possible to filter the Latest data to display only the needed host and set a sufficient range of the last values to be displayed.

Using this method we are spamming the Zabbix server. So, we can add throttling to the settings of our item in the Pre-processing tab in Configuration > Hosts.

NOTE. There are no other parameters to configure besides this Pre-processing step from the throttling menu.

Discard unchanged

Discard unchanged throttling option

With the ‘Discard unchanged‘ throttling option, only new values will be processed by the server, while identical values will be ignored.

Throttling ignores identical values

Discard unchanged with a heartbeat

If we change the pre-processing settings for our item in the Pre-processing tab in Configuration > Hosts to ‘Discard unchanged with a heartbeat‘, we have one additional Parameter to specify — the interval to send the values if they are identical.

Discard unchanged with a heartbeat

So, if we specify 120 seconds, then in Monitoring > Latest data, we’ll get the values once per 120 seconds even if they are identical.

Displaying identical values with an interval

This throttling option is useful when we have nodata() triggers. So, with the Discard unchanged throttling option, the nodata() triggers will fire as identical data will be dropped. If we use Discard unchanged with heartbeat even identical values will be grabbed, so the trigger won’t fire.

In simpler words, the ‘Discard unchanged‘ throttling option will drop all identical values, while ‘Discard unchanged with heartbeat‘ will send even the identical values with the specified interval.

Watch the video.


Code your own Artillery-style tank game | Wireframe #44

Post Syndicated from Ian Dransfield original https://www.raspberrypi.org/blog/code-your-own-artillery-style-tank-game-wireframe-44/

Fire artillery shells to blow up the enemy with Mark Vanstone’s take on a classic two-player artillery game

Artillery Duel was an early example of the genre, and appeared on such systems as the Bally Astrocade and Commodore 64 (pictured).

To pick just one artillery game is difficult since it’s a genre in its own right. Artillery simulations and games have been around for almost as long as computers, and most commonly see two players take turns to adjust the trajectory of their tank’s turret and fire a projectile at their opponent. The earliest versions for microcomputers appeared in the mid-seventies, and the genre continued to develop; increasingly complex scenarios appeared involving historical settings or, as we saw from the mid-90s on, even offbeat ideas like battles between factions of worms.

To code the basics of an artillery game, we’ll need two tanks with turrets, a landscape, and some code to work out who shot what, in which direction, and where said shot landed. Let’s start with the landscape. If we create a landscape in two parts – a backdrop and foreground – we can make the foreground destructible so that when a missile explodes it damages part of the landscape. This is a common effect used in artillery games, and sometimes makes the gameplay more complicated as the battle progresses. In our example, we have a grass foreground overlaid on a mountain scene. We then need a cannon for each player. In this case, we’ve used a two-part image, one for the base and one for the turret, which means the latter can be rotated using the up and down keys.

Our homage to the artillery game genre. Fire away at your opponent, and hope they don’t hit back first.

For this code example, we can use the Python dictionary to store several bits of data about the game objects, including the Actor objects. This makes the data handling tidy and is quite similar to the way that JSON is used in JavaScript. We can use this method for the two cannons, the projectile, and an explosion object. As this is a two-player game, we’ll alternate between the two guns, allowing the arrow keys to change the angle of the cannon. When the SPACE bar is pressed, we call the firing sequence, which places the projectile at the same position as the gun firing it. We then move the missile through the air, reducing the speed as it goes and allowing the effects of gravity to pull it towards the ground.

We can work out whether the bullet has hit anything with two checks. The first is to do a pixel check with the foreground. If this comes back as not transparent, then it has hit the ground, and we can start an explosion. To create a hole in the foreground, we can write transparent pixels randomly around the point of contact and then set off an explosion animation. If we test for a collision with a gun, we may find that the bullet has hit the other player and after blowing up the tank, the game ends. If the impact only hit the landscape, though, we can switch control over to the other player and let them have a go.

So that’s your basic artillery game. But rest assured there are plenty of things to add – for example, wind direction, power of the shot, variable damage depending on proximity, or making the tanks fall into holes left by the explosions. You could even change the guns into little wiggly creatures and make your own homage to Worms.

Here’s Mark’s code for an artillery-style tank game. To get it working on your system, you’ll need to install Pygame Zero. And to download the full code and assets, head here.

Get your copy of Wireframe issue 44

You can read more features like this one in Wireframe issue 44, available directly from Raspberry Pi Press — we deliver worldwide.

And if you’d like a handy digital version of the magazine, you can also download issue 44 for free in PDF format.

Wireframe #44, bringing the past and future of Worms to the fore.

Make sure to follow Wireframe on Twitter and Facebook for updates and exclusive offers and giveaways. Subscribe on the Wireframe website to save up to 72% compared to newsstand pricing!

The post Code your own Artillery-style tank game | Wireframe #44 appeared first on Raspberry Pi.

Building, bundling, and deploying applications with the AWS CDK

Post Syndicated from Cory Hall original https://aws.amazon.com/blogs/devops/building-apps-with-aws-cdk/

The AWS Cloud Development Kit (AWS CDK) is an open-source software development framework to model and provision your cloud application resources using familiar programming languages.

The post CDK Pipelines: Continuous delivery for AWS CDK applications showed how you can use CDK Pipelines to deploy a TypeScript-based AWS Lambda function. In that post, you learned how to add additional build commands to the pipeline to compile the TypeScript code to JavaScript, which is needed to create the Lambda deployment package.

In this post, we dive deeper into how you can perform these build commands as part of your AWS CDK build process by using the native AWS CDK bundling functionality.

If you’re working with Python, TypeScript, or JavaScript-based Lambda functions, you may already be familiar with the PythonFunction and NodejsFunction constructs, which use the bundling functionality. This post describes how to write your own bundling logic for instances where a higher-level construct either doesn’t already exist or doesn’t meet your needs. To illustrate this, I walk through two different examples: a Lambda function written in Golang and a static site created with Nuxt.js.

Concepts

A typical CI/CD pipeline contains steps to build and compile your source code, bundle it into a deployable artifact, push it to artifact stores, and deploy to an environment. In this post, we focus on the building, compiling, and bundling stages of the pipeline.

The AWS CDK has the concept of bundling source code into a deployable artifact. As of this writing, this works for two main types of assets: Docker images published to Amazon Elastic Container Registry (Amazon ECR) and files published to Amazon Simple Storage Service (Amazon S3). For files published to Amazon S3, this can be as simple as pointing to a local file or directory, which the AWS CDK uploads to Amazon S3 for you.

When you build an AWS CDK application (by running cdk synth), a cloud assembly is produced. The cloud assembly consists of a set of files and directories that define your deployable AWS CDK application. In the context of the AWS CDK, it might include the following:

  • AWS CloudFormation templates and instructions on where to deploy them
  • Dockerfiles, corresponding application source code, and information about where to build and push the images to
  • File assets and information about which S3 buckets to upload the files to

Use case

For this use case, our application consists of front-end and backend components. The example code is available in the GitHub repo. In the repository, I have split the example into two separate AWS CDK applications. The repo also contains the Golang Lambda example app and the Nuxt.js static site.

Golang Lambda function

To create a Golang-based Lambda function, you must first create a Lambda function deployment package. For Go, this consists of a .zip file containing a Go executable. Because we don’t commit the Go executable to our source repository, our CI/CD pipeline must perform the necessary steps to create it.

In the context of the AWS CDK, when we create a Lambda function, we have to tell the AWS CDK where to find the deployment package. See the following code:

new lambda.Function(this, 'MyGoFunction', {
  runtime: lambda.Runtime.GO_1_X,
  handler: 'main',
  code: lambda.Code.fromAsset(path.join(__dirname, 'folder-containing-go-executable')),
});

In the preceding code, the lambda.Code.fromAsset() method tells the AWS CDK where to find the Golang executable. When we run cdk synth, it stages this Go executable in the cloud assembly, which it zips and publishes to Amazon S3 as part of the PublishAssets stage.

If we’re running the AWS CDK as part of a CI/CD pipeline, this executable doesn’t exist yet, so how do we create it? One method is CDK bundling. The lambda.Code.fromAsset() method takes a second optional argument, AssetOptions, which contains the bundling parameter. With this bundling parameter, we can tell the AWS CDK to perform steps prior to staging the files in the cloud assembly.

Breaking down the BundlingOptions parameter further, we can perform the build inside a Docker container or locally.

Building inside a Docker container

For this to work, we need to make sure that we have Docker running on our build machine. In AWS CodeBuild, this means setting privileged: true. See the following code:

new lambda.Function(this, 'MyGoFunction', {
  code: lambda.Code.fromAsset(path.join(__dirname, 'folder-containing-source-code'), {
    bundling: {
      image: lambda.Runtime.GO_1_X.bundlingDockerImage,
      command: [
        'bash', '-c', [
          'go test -v',
          'GOOS=linux go build -o /asset-output/main',
      ].join(' && '),
    },
  })
  ...
});

We specify two parameters:

  • image (required) – The Docker image to perform the build commands in
  • command (optional) – The command to run within the container

The AWS CDK mounts the folder specified as the first argument to fromAsset at /asset-input inside the container, and mounts the asset output directory (where the cloud assembly is staged) at /asset-output inside the container.

After we perform the build commands, we need to make sure we copy the Golang executable to the /asset-output location (or specify it as the build output location like in the preceding example).

This is the equivalent of running something like the following code:

docker run \
  --rm \
  -v folder-containing-source-code:/asset-input \
  -v cdk.out/asset.1234a4b5/:/asset-output \
  lambci/lambda:build-go1.x \
  bash -c 'GOOS=linux go build -o /asset-output/main'

Building locally

To build locally (not in a Docker container), we have to provide the local parameter. See the following code:

new lambda.Function(this, 'MyGoFunction', {
  code: lambda.Code.fromAsset(path.join(__dirname, 'folder-containing-source-code'), {
    bundling: {
      image: lambda.Runtime.GO_1_X.bundlingDockerImage,
      command: [],
      local: {
        tryBundle(outputDir: string) {
          try {
            spawnSync('go version')
          } catch {
            return false
          }

          spawnSync(`GOOS=linux go build -o ${path.join(outputDir, 'main')}`);
          return true
        },
      },
    },
  })
  ...
});

The local parameter must implement the ILocalBundling interface. The tryBundle method is passed the asset output directory, and expects you to return a boolean (true or false). If you return true, the AWS CDK doesn’t try to perform Docker bundling. If you return false, it falls back to Docker bundling. Just like with Docker bundling, you must make sure that you place the Go executable in the outputDir.

Typically, you should perform some validation steps to ensure that you have the required dependencies installed locally to perform the build. This could be checking to see if you have go installed, or checking a specific version of go. This can be useful if you don’t have control over what type of build environment this might run in (for example, if you’re building a construct to be consumed by others).

If we run cdk synth on this, we see a new message telling us that the AWS CDK is bundling the asset. If we include additional commands like go test, we also see the output of those commands. This is especially useful if you wanted to fail a build if tests failed. See the following code:

$ cdk synth
Bundling asset GolangLambdaStack/MyGoFunction/Code/Stage...
✓  . (9ms)
✓  clients (5ms)

DONE 8 tests in 11.476s
✓  clients (5ms) (coverage: 84.6% of statements)
✓  . (6ms) (coverage: 78.4% of statements)

DONE 8 tests in 2.464s

Cloud Assembly

If we look at the cloud assembly that was generated (located at cdk.out), we see something like the following code:

$ cdk synth
Bundling asset GolangLambdaStack/MyGoFunction/Code/Stage...
✓  . (9ms)
✓  clients (5ms)

DONE 8 tests in 11.476s
✓  clients (5ms) (coverage: 84.6% of statements)
✓  . (6ms) (coverage: 78.4% of statements)

DONE 8 tests in 2.464s

It contains our GolangLambdaStack CloudFormation template that defines our Lambda function, as well as our Golang executable, bundled at asset.01cf34ff646d380829dc4f2f6fc93995b13277bde7db81c24ac8500a83a06952/main.

Let’s look at how the AWS CDK uses this information. The GolangLambdaStack.assets.json file contains all the information necessary for the AWS CDK to know where and how to publish our assets (in this use case, our Golang Lambda executable). See the following code:

{
  "version": "5.0.0",
  "files": {
    "01cf34ff646d380829dc4f2f6fc93995b13277bde7db81c24ac8500a83a06952": {
      "source": {
        "path": "asset.01cf34ff646d380829dc4f2f6fc93995b13277bde7db81c24ac8500a83a06952",
        "packaging": "zip"
      },
      "destinations": {
        "current_account-current_region": {
          "bucketName": "cdk-hnb659fds-assets-${AWS::AccountId}-${AWS::Region}",
          "objectKey": "01cf34ff646d380829dc4f2f6fc93995b13277bde7db81c24ac8500a83a06952.zip",
          "assumeRoleArn": "arn:${AWS::Partition}:iam::${AWS::AccountId}:role/cdk-hnb659fds-file-publishing-role-${AWS::AccountId}-${AWS::Region}"
        }
      }
    }
  }
}

The file contains information about where to find the source files (source.path) and what type of packaging (source.packaging). It also tells the AWS CDK where to publish this .zip file (bucketName and objectKey) and what AWS Identity and Access Management (IAM) role to use (assumeRoleArn). In this use case, we only deploy to a single account and Region, but if you have multiple accounts or Regions, you see multiple destinations in this file.

The GolangLambdaStack.template.json file that defines our Lambda resource looks something like the following code:

{
  "Resources": {
    "MyGoFunction0AB33E85": {
      "Type": "AWS::Lambda::Function",
      "Properties": {
        "Code": {
          "S3Bucket": {
            "Fn::Sub": "cdk-hnb659fds-assets-${AWS::AccountId}-${AWS::Region}"
          },
          "S3Key": "01cf34ff646d380829dc4f2f6fc93995b13277bde7db81c24ac8500a83a06952.zip"
        },
        "Handler": "main",
        ...
      }
    },
    ...
  }
}

The S3Bucket and S3Key match the bucketName and objectKey from the assets.json file. By default, the S3Key is generated by calculating a hash of the folder location that you pass to lambda.Code.fromAsset(), (for this post, folder-containing-source-code). This means that any time we update our source code, this calculated hash changes and a new Lambda function deployment is triggered.

Nuxt.js static site

In this section, I walk through building a static site using the Nuxt.js framework. You can apply the same logic to any static site framework that requires you to run a build step prior to deploying.

To deploy this static site, we use the BucketDeployment construct. This is a construct that allows you to populate an S3 bucket with the contents of .zip files from other S3 buckets or from a local disk.

Typically, we simply tell the BucketDeployment construct where to find the files that it needs to deploy to the S3 bucket. See the following code:

new s3_deployment.BucketDeployment(this, 'DeployMySite', {
  sources: [
    s3_deployment.Source.asset(path.join(__dirname, 'path-to-directory')),
  ],
  destinationBucket: myBucket
});

To deploy a static site built with a framework like Nuxt.js, we need to first run a build step to compile the site into something that can be deployed. For Nuxt.js, we run the following two commands:

  • yarn install – Installs all our dependencies
  • yarn generate – Builds the application and generates every route as an HTML file (used for static hosting)

This creates a dist directory, which you can deploy to Amazon S3.

Just like with the Golang Lambda example, we can perform these steps as part of the AWS CDK through either local or Docker bundling.

Building inside a Docker container

To build inside a Docker container, use the following code:

new s3_deployment.BucketDeployment(this, 'DeployMySite', {
  sources: [
    s3_deployment.Source.asset(path.join(__dirname, 'path-to-nuxtjs-project'), {
      bundling: {
        image: cdk.BundlingDockerImage.fromRegistry('node:lts'),
        command: [
          'bash', '-c', [
            'yarn install',
            'yarn generate',
            'cp -r /asset-input/dist/* /asset-output/',
          ].join(' && '),
        ],
      },
    }),
  ],
  ...
});

For this post, we build inside the publicly available node:lts image hosted on DockerHub. Inside the container, we run our build commands yarn install && yarn generate, and copy the generated dist directory to our output directory (the cloud assembly).

The parameters are the same as described in the Golang example we walked through earlier.

Building locally

To build locally, use the following code:

new s3_deployment.BucketDeployment(this, 'DeployMySite', {
  sources: [
    s3_deployment.Source.asset(path.join(__dirname, 'path-to-nuxtjs-project'), {
      bundling: {
        local: {
          tryBundle(outputDir: string) {
            try {
              spawnSync('yarn --version');
            } catch {
              return false
            }

            spawnSync('yarn install && yarn generate');

       fs.copySync(path.join(__dirname, ‘path-to-nuxtjs-project’, ‘dist’), outputDir);
            return true
          },
        },
        image: cdk.BundlingDockerImage.fromRegistry('node:lts'),
        command: [],
      },
    }),
  ],
  ...
});

Building locally works the same as the Golang example we walked through earlier, with one exception. We have one additional command to run that copies the generated dist folder to our output directory (cloud assembly).

Conclusion

This post showed how you can easily compile your backend and front-end applications using the AWS CDK. You can find the example code for this post in this GitHub repo. If you have any questions or comments, please comment on the GitHub repo. If you have any additional examples you want to add, we encourage you to create a Pull Request with your example!

Our code also contains examples of deploying the applications using CDK Pipelines, so if you’re interested in deploying the example yourself, check out the example repo.


About the author

Cory Hall

Cory is a Solutions Architect at Amazon Web Services with a passion for DevOps and is based in Charlotte, NC. Cory works with enterprise AWS customers to help them design, deploy, and scale applications to achieve their business goals.

Improving customer experience and reducing cost with CodeGuru Profiler

Post Syndicated from Rajesh original https://aws.amazon.com/blogs/devops/improving-customer-experience-and-reducing-cost-with-codeguru-profiler/

Amazon CodeGuru is a set of developer tools powered by machine learning that provides intelligent recommendations for improving code quality and identifying an application’s most expensive lines of code. Amazon CodeGuru Profiler allows you to profile your applications in a low impact, always on manner. It helps you improve your application’s performance, reduce cost and diagnose application issues through rich data visualization and proactive recommendations. CodeGuru Profiler has been a very successful and widely used service within Amazon, before it was offered as a public service. This post discusses a few ways in which internal Amazon teams have used and benefited from continuous profiling of their production applications. These uses cases can provide you with better insights on how to reap similar benefits for your applications using CodeGuru Profiler.

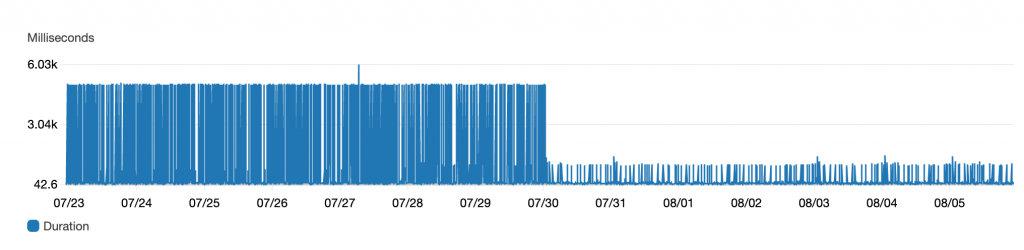
Inside Amazon, over 100,000 applications currently use CodeGuru Profiler across various environments globally. Over the last few years, CodeGuru Profiler has served as an indispensable tool for resolving issues in the following three categories:

  1. Performance bottlenecks, high latency and CPU utilization
  2. Cost and Infrastructure utilization
  3. Diagnosis of an application impacting event

API latency improvement for CodeGuru Profiler

What could be a better example than CodeGuru Profiler using itself to improve its own performance?
CodeGuru Profiler offers an API called BatchGetFrameMetricData, which allows you to fetch time series data for a set of frames or methods. We noticed that the 99th percentile latency (i.e. the slowest 1 percent of requests over a 5 minute period) metric for this API was approximately 5 seconds, higher than what we wanted for our customers.

Solution

CodeGuru Profiler is built on a micro service architecture, with the BatchGetFrameMetricData API implemented as set of AWS Lambda functions. It also leverages other AWS services such as Amazon DynamoDB to store data and Amazon CloudWatch to record performance metrics.

When investigating the latency issue, the team found that the 5-second latency spikes were happening during certain time intervals rather than continuously, which made it difficult to easily reproduce and determine the root cause of the issue in pre-production environment. The new Lambda profiling feature in CodeGuru came in handy, and so the team decided to enable profiling for all its Lambda functions. The low impact, continuous profiling capability of CodeGuru Profiler allowed the team to capture comprehensive profiles over a period of time, including when the latency spikes occurred, enabling the team to better understand the issue.
After capturing the profiles, the team went through the flame graphs of one of the Lambda functions (TimeSeriesMetricsGeneratorLambda) and learned that all of its CPU time was spent by the thread responsible to publish metrics to CloudWatch. The following screenshot shows a flame graph during one of these spikes.

TimeSeriesMetricsGeneratorLambda taking 100% CPU

As seen, there is a single call stack visible in the above flame graph, indicating all the CPU time was taken by the thread invoking above code. This helped the team immediately understand what was happening. Above code was related to the thread responsible for publishing the CloudWatch metrics. This thread was publishing these metrics in a synchronized block and as this thread took most of the CPU, it caused all other threads to wait and the latency to spike. To fix the issue, the team simply changed the TimeSeriesMetricsGeneratorLambda Lambda code, to publish CloudWatch metrics at the end of the function, which eliminated contention of this thread with all other threads.

Improvement

After the fix was deployed, the 5 second latency spikes were gone, as seen in the following graph.

Latency reduction for BatchGetFrameMetricData API

Cost, infrastructure and other improvements for CAGE

CAGE is an internal Amazon retail service that does royalty aggregation for digital products, such as Kindle eBooks, MP3 songs and albums and more. Like many other Amazon services, CAGE is also customer of CodeGuru Profiler.

CAGE was experiencing latency delays and growing infrastructure cost, and wanted to reduce them. Thanks to CodeGuru Profiler’s always-on profiling capabilities, rich visualization and recommendations, the team was able to successfully diagnose the issues, determine the root cause and fix them.

Solution

With the help of CodeGuru Profiler, the CAGE team identified several reasons for their degraded service performance and increased hardware utilization:

  • Excessive garbage collection activity – The team reviewed the service flame graphs (see the following screenshot) and identified that a lot of CPU time was spent getting garbage collection activities, 65.07% of the total service CPU.

Excessive garbage collection activities for CAGE

  • Metadata overhead – The team followed CodeGuru Profiler recommendation to identify that the service’s DynamoDB responses were consuming higher CPU, 2.86% of total CPU time. This was due to the response metadata caching in the AWS SDK v1.x HTTP client that was turned on by default. This was causing higher CPU overhead for high throughput applications such as CAGE. The following screenshot shows the relevant recommendation.

Response metadata recommendation for CAGE

  • Excessive logging – The team also identified excessive logging of its internal Amazon ION structures. The team initially added this logging for debugging purposes, but was unaware of its impact on the CPU cost, taking 2.28% of the overall service CPU. The following screenshot is part of the flame graph that helped identify the logging impact.

Excessive logging in CAGE service

The team used these flame graphs and CodeGuru Profiler provided recommendations to determine the root cause of the issues and systematically resolve them by doing the following:

  • Switching to a more efficient garbage collector
  • Removing excessive logging
  • Disabling metadata caching for Dynamo DB response

Improvements

After making these changes, the team was able to reduce their infrastructure cost by 25%, saving close to $2600 per month. Service latency also improved, with a reduction in service’s 99th percentile latency from approximately 2,500 milliseconds to 250 milliseconds in their North America (NA) region as shown below.

CAGE Latency Reduction

The team also realized a side benefit of having reduced log verbosity and saw a reduction in log size by 55%.

Event Analysis of increased checkout latency for Amazon.com

During one of the high traffic times, Amazon retail customers experienced higher than normal latency on their checkout page. The issue was due to one of the downstream service’s API experiencing high latency and CPU utilization. While the team quickly mitigated the issue by increasing the service’s servers, the always-on CodeGuru Profiler came to the rescue to help diagnose and fix the issue permanently.

Solution

The team analyzed the flame graphs from CodeGuru Profiler at the time of the event and noticed excessive CPU consumption (69.47%) when logging exceptions using Log4j2. See the following screenshot taken from an earlier version of CodeGuru Profiler user interface.

Excessive CPU consumption when logging exceptions using Log4j2

With CodeGuru Profiler flame graph and other metrics, the team quickly confirmed that the issue was due to excessive exception logging using Log4j2. This downstream service had recently upgraded to Log4j2 version 2.8, in which exception logging could be expensive, due to the way Log4j2 handles class-loading of certain stack frames. Log4j 2.x versions enabled class loading by default, which was disabled in 1.x versions, causing the increased latency and CPU utilization. The team was not able to detect this issue in pre-production environment, as the impact was observable only in high traffic situations.

Improvement

After they understood the issue, the team successfully rolled out the fix, removing the unnecessary exception trace logging to fix the issue. Such performance issues and many others are proactively offered as CodeGuru Profiler recommendations, to ensure you can proactively learn about such issues with your applications and quickly resolve them.

Conclusion

I hope this post provided a glimpse into various ways CodeGuru Profiler can benefit your business and applications. To get started using CodeGuru Profiler, see Setting up CodeGuru Profiler.
For more information about CodeGuru Profiler, see the following:

Investigating performance issues with Amazon CodeGuru Profiler

Optimizing application performance with Amazon CodeGuru Profiler

Find Your Application’s Most Expensive Lines of Code and Improve Code Quality with Amazon CodeGuru


Code a Rally-X-style mini-map | Wireframe #43

Post Syndicated from Ryan Lambie original https://www.raspberrypi.org/blog/code-a-rally-x-style-mini-map-wireframe-43/

Race around using a mini-map for navigation, just like the arcade classic, Rally-X. Mark Vanstone has the code

In Namco’s original arcade game, the red cars chased the player relentlessly around each level. Note the handy mini-map on the right.

The original Rally-X arcade game blasted onto the market in 1980, at the same time as Pac‑Man and Defender. This was the first year that developer Namco had exported its games outside Japan thanks to the deal it struck with Midway, an American game distributor. The aim of Rally-X is to race a car around a maze, avoiding enemy cars while collecting yellow flags – all before your fuel runs out.

The aspect of Rally-X that we’ll cover here is the mini-map. As the car moves around the maze, its position can be seen relative to the flags on the right of the screen. The main view of the maze only shows a section of the whole map, and scrolls as the car moves, whereas the mini-map shows the whole size of the map but without any of the maze walls – just dots where the car and flags are (and in the original, the enemy cars). In our example, the mini-map is five times smaller than the main map, so it’s easy to work out the calculation to translate large map co‑ordinates to mini-map co-ordinates.

To set up our Rally-X homage in Pygame Zero, we can stick with the default screen size of 800×600. If we use 200 pixels for the side panel, that leaves us with a 600×600 play area. Our player’s car will be drawn in the centre of this area at the co-ordinates 300,300. We can use the in-built rotation of the Actor object by setting the angle property of the car. The maze scrolls depending on which direction the car is pointing, and this can be done by having a lookup table in the form of a dictionary list (directionMap) where we define x and y increments for each angle the car can travel. When the cursor keys are pressed, the car stays central and the map moves.

A screenshot of our Rally-X homage running in Pygame Zero

Roam the maze and collect those flags in our Python homage to Rally-X.

To detect the car hitting a wall, we can use a collision map. This isn’t a particularly memory-efficient way of doing it, but it’s easy to code. We just use a bitmap the same size as the main map which has all the roads as black and all the walls as white. With this map, we can detect if there’s a wall in the direction in which the car’s moving by testing the pixels directly in front of it. If a wall is detected, we rotate the car rather than moving it. If we draw the side panel after the main map, we’ll then be able to see the full layout of the screen with the map scrolling as the car navigates through the maze.

We can add flags as a list of Actor objects. We could make these random, but for the sake of simplicity, our sample code has them defined in a list of x and y co-ordinates. We need to move the flags with the map, so in each update(), we loop through the list and add the same increments to the x and y co‑ordinates as the main map. If the car collides with any flags, we just take them off the list of items to draw by adding a collected variable. Having put all of this in place, we can draw the mini-map, which will show the car and the flags. All we need to do is divide the object co-ordinates by five and add an x and y offset so that the objects appear in the right place on the mini-map.

And those are the basics of Rally-X! All it needs now is a fuel gauge, some enemy cars, and obstacles – but we’ll leave those for you to sort out…

Here’s Mark’s code for a Rally-X-style driving game with mini-map. To get it running on your system, you’ll need to install Pygame Zero. And to download the full code and assets, head here.

Get your copy of Wireframe issue 43

You can read more features like this one in Wireframe issue 43, available directly from Raspberry Pi Press — we deliver worldwide.

And if you’d like a handy digital version of the magazine, you can also download issue 43 for free in PDF format.

Wireframe #43, with the gorgeous Sea of Stars on the cover.

Make sure to follow Wireframe on Twitter and Facebook for updates and exclusive offers and giveaways. Subscribe on the Wireframe website to save up to 49% compared to newsstand pricing!


The post Code a Rally-X-style mini-map | Wireframe #43 appeared first on Raspberry Pi.