Post Syndicated from Raghu Boppanna original https://aws.amazon.com/blogs/big-data/how-vanguard-made-their-technology-platform-resilient-and-efficient-by-building-cross-region-replication-for-amazon-kinesis-data-streams/
This is a guest post co-written with Raghu Boppanna from Vanguard.
At Vanguard, the Enterprise Advice line of business improves investor outcomes through digital access to superior, personalized, and affordable financial advice. They made it possible, in part, by driving economies of scale across the globe for investors with a highly resilient and efficient technical platform. Vanguard opted for a multi-Region architecture for this workload to help protect against impairments of Regional services. For high availability purposes, there is a need to make the data used by the workload available not just in the primary Region, but also in the secondary Region with minimal replication lag. In the event of a service impairment in the primary Region, the solution should be able to fail over to the secondary Region with as little data loss as possible and the ability to resume data ingestion.
Vanguard Cloud Technology Office and AWS partnered to build an infrastructure solution on AWS that met their resilience requirements. The multi-Region solution enables a robust fail-over mechanism, with built-in observability and recovery. The solution also supports streaming data from multiple sources to different Kinesis data streams. The solution is currently being rolled out to the different lines of business teams to improve the resilience posture of their workloads.
The use case discussed here requires Change Data Capture (CDC) to stream data from a remote data source (mainframe DB2) to Amazon Kinesis Data Streams, because the business capability depends on this data. Kinesis Data Streams is a fully managed, massively scalable, durable, and low-cost streaming service that can continuously capture and stream large amounts of data from multiple sources, and makes the data available for consumption within milliseconds. The service is built to be highly resilient and uses multiple Availability Zones to process and store data.
The solution discussed in this post explains how AWS and Vanguard innovated to build a resilient architecture to meet their high availability goals.
Solution overview
The solution uses AWS Lambda to replicate data from Kinesis data streams in the primary Region to a secondary Region. In the event of any service impairment impacting the CDC pipeline, the failover process promotes the secondary Region to primary for the producers and consumers. We use Amazon DynamoDB global tables for replication checkpoints that allows to resume data streaming from the checkpoint and also maintains a primary Region configuration flag that prevents an infinite replication loop of the same data back and forth.
The solution also provides the flexibility for Kinesis Data Streams consumers to use the primary or any secondary Region within the same AWS account.
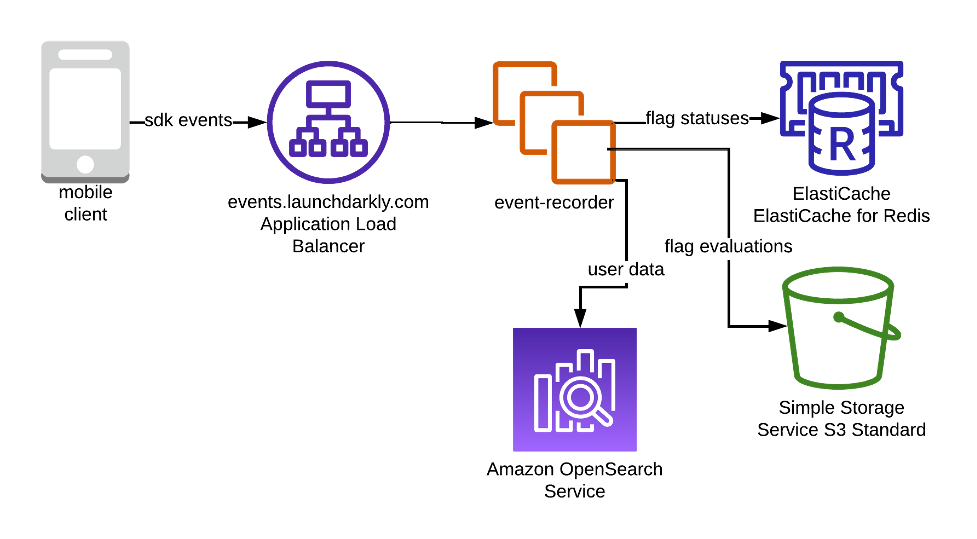
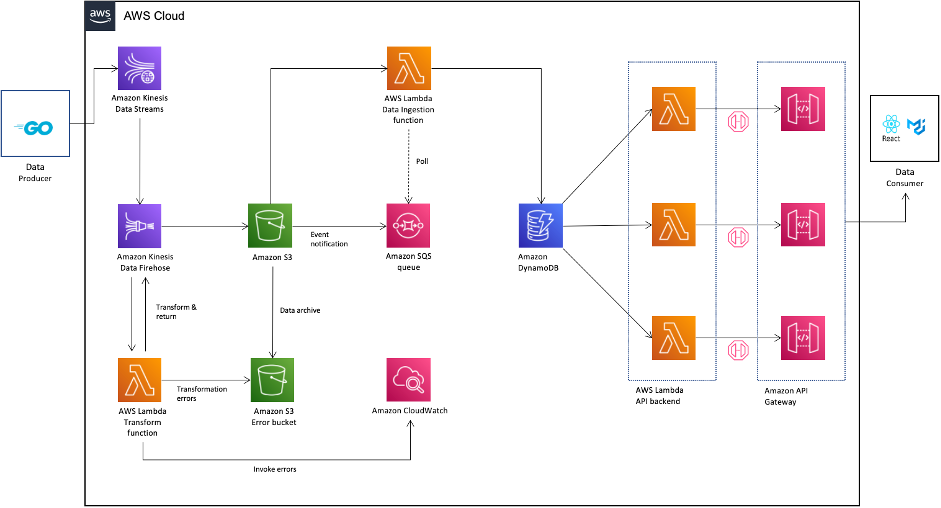
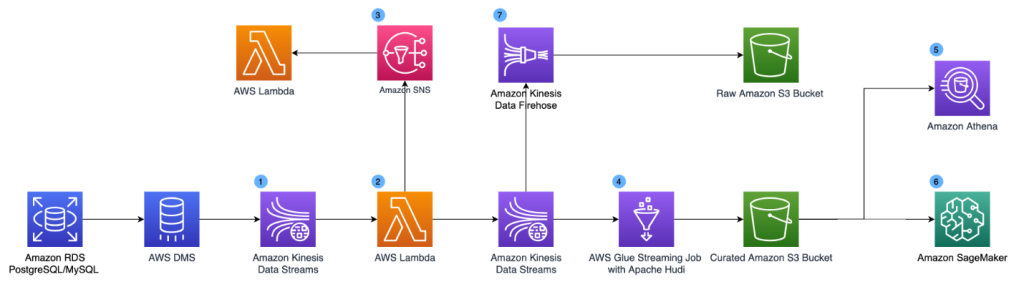
The following diagram illustrates the reference architecture.

Let’s look at each component in detail:
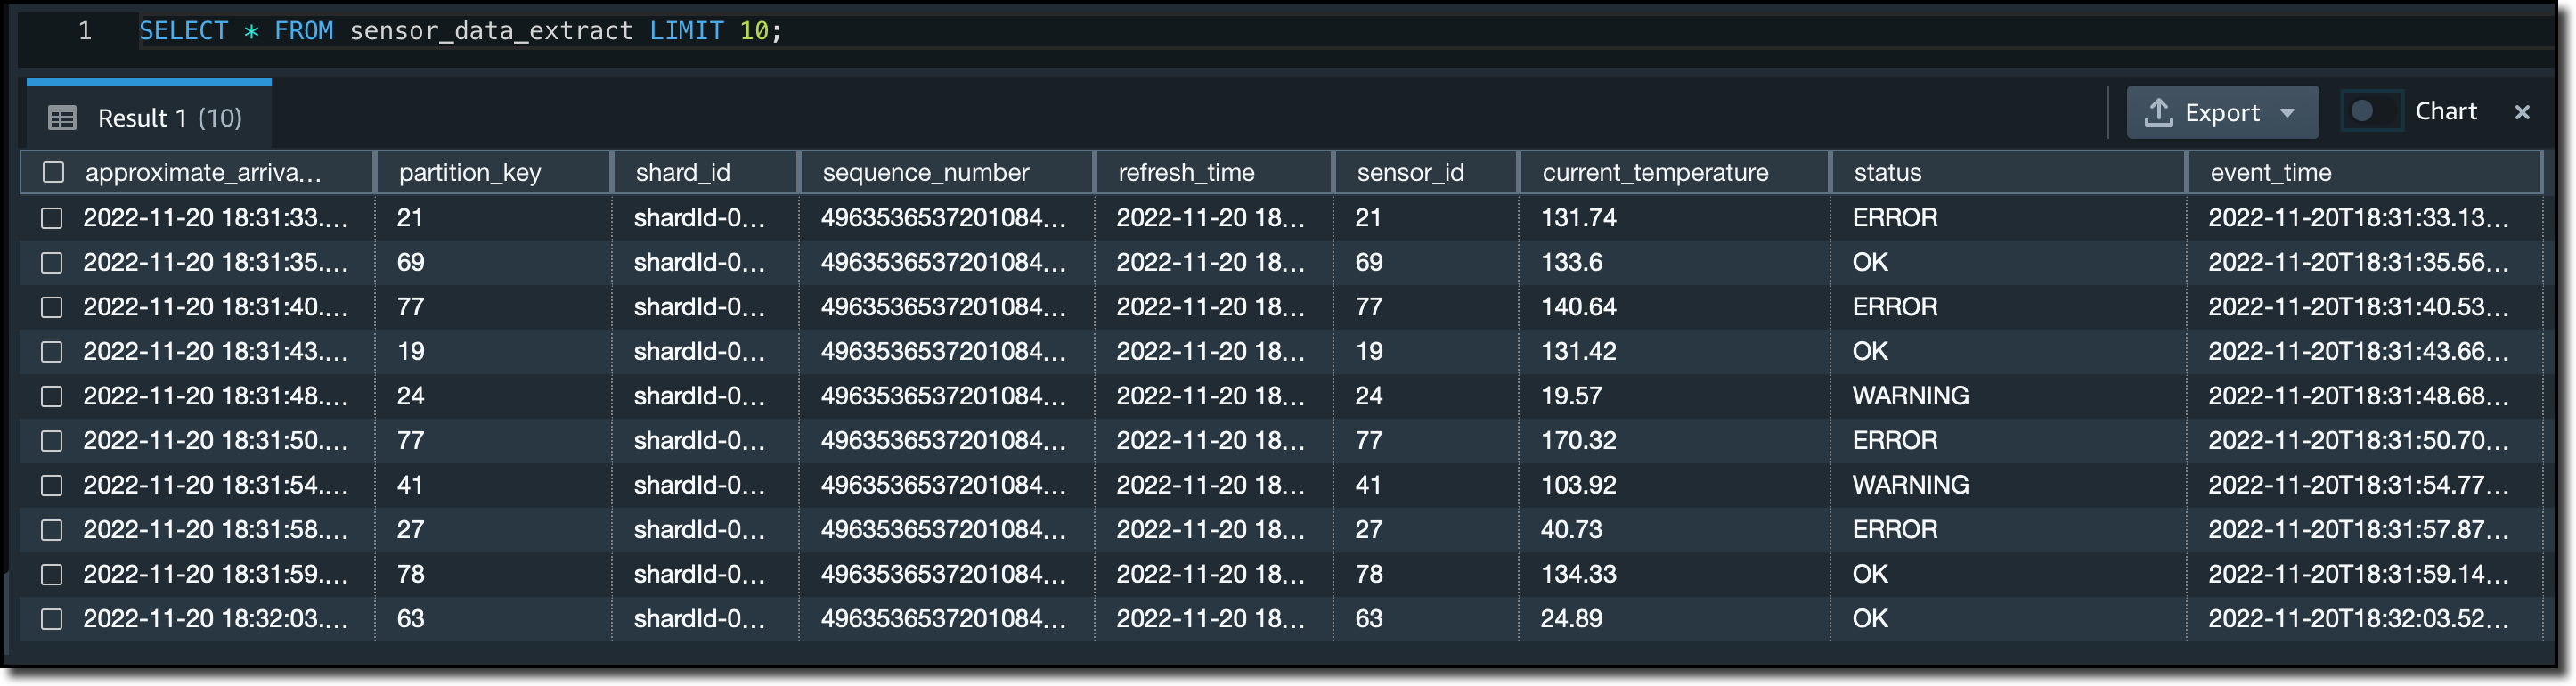
- CDC processor (producer) – In this reference architecture, the producer is deployed on Amazon Elastic Compute Cloud (Amazon EC2) in both the primary and secondary Regions, and is active in the primary Region and on standby mode in the secondary Region. It captures CDC data from the external data source (like a DB2 database as shown in the architecture above), and streams to Kinesis Data Streams in the primary Region. Vanguard uses a 3rd party tool Qlik Replicate as their CDC Processor. It produces a well-formed payload including the DB2 commit timestamp to the Kinesis data stream, in addition to the actual row data from the remote data source. (
example-stream-1in this example). The following code is a sample payload containing only the primary key of the record that changed and the commit timestamp (for simplicity, the rest of the table row data is not shown below):{ "eventSource": "aws:kinesis", "kinesis": { "ApproximateArrivalTimestamp": "Mon July 18 20:00:00 UTC 2022", "SequenceNumber": "49544985256907370027570885864065577703022652638596431874", "PartitionKey": "12349999", "KinesisSchemaVersion": "1.0", "Data": "eyJLZXkiOiAxMjM0OTk5OSwiQ29tbWl0VGltZXN0YW1wIjogIjIwMjItMDctMThUMjA6MDA6MDAifQ==" }, "eventId": "shardId-000000000000:49629136582982516722891309362785181370337771525377097730", "invokeIdentityArn": "arn:aws:iam::6243876582:role/kds-crr-LambdaRole-1GZWP67437SD", "eventName": "aws:kinesis:record", "eventVersion": "1.0", "eventSourceARN": "arn:aws:kinesis:us-east-1:6243876582:stream/kds-stream-1/consumer/kds-crr:6243876582", "awsRegion": "us-east-1" }The Base64 decoded value of
Datais as follows. The actual Kinesis record would contain the entire row data of the table row that changed, in addition to the primary key and the commit timestamp.{"Key": 12349999,"CommitTimestamp": "2022-07-18T20:00:00"}The
CommitTimestampin theDatafield is used in the replication checkpoint and is critical to accurately track how much of the stream data has been replicated to the secondary Region. The checkpoint can then be used to facilitate a CDC processor (producer) failover and accurately resume producing data from the replication checkpoint timestamp onwards.The alternative to using a remote data source
CommitTimestamp(if unavailable) is to use theApproximateArrivalTimestamp(which is the timestamp when the record is actually written to the data stream). - Cross-Region replication Lambda function – The function is deployed to both primary and secondary Regions. It’s set up with an event source mapping to the data stream containing CDC data. The same function can be used to replicate data of multiple streams. It’s invoked with a batch of records from Kinesis Data Streams and replicates the batch to a target replication Region (which is provided via the Lambda configuration environment). For cost considerations, if the CDC data is actively produced into the primary Region only, the reserved concurrency of the function in the secondary Region can be set to zero, and modified during regional failover. The function has AWS Identity and Access Management (IAM) role permissions to do the following:
- Read and write to the DynamoDB global tables used in this solution, within the same account.
- Read and write to Kinesis Data Streams in both Regions within the same account.
- Publish custom metrics to Amazon CloudWatch in both Regions within the same account.
- Replication checkpoint – The replication checkpoint uses the DynamoDB global table in both the primary and secondary Regions. It’s used by the cross-Region replication Lambda function to persist the commit timestamp of the last replication record as the replication checkpoint for every stream that is configured for replication. For this post, we create and use a global table called
kdsReplicationCheckpoint. - Active Region config – The active Region uses the DynamoDB global table in both primary and secondary Regions. It uses the native cross-Region replication capability of the global table to replicate the configuration. It’s pre-populated with data about which is the primary Region for a stream, to prevent replication back to the primary Region by the Lambda function in the standby Region. This configuration may not be required if the Lambda function in the standby Region has a reserved concurrency set to zero, but can serve as a safety check to avoid infinite replication loop of the data. For this post, we create a global table called
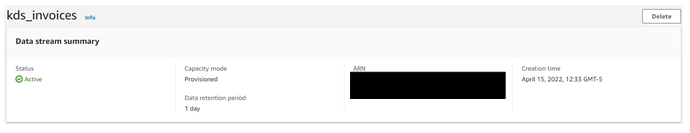
kdsActiveRegionConfigand put an item with the following data:{ "stream-name": "example-stream-1", "active-region" : "us-east-1" } - Kinesis Data Streams – The stream to which the CDC processor produces the data. For this post, we use a stream called
example-stream-1in both the Regions, with the same shard configuration and access policies.
Sequence of steps in cross-Region replication
Let’s briefly look at how the architecture is exercised using the following sequence diagram.

The sequence consists of the following steps:
- The CDC processor (in
us-east-1) reads the CDC data from the remote data source. - The CDC processor (in
us-east-1) streams the CDC data to Kinesis Data Streams (inus-east-1). - The cross-Region replication Lambda function (in us-east-1) consumes the data from the data stream (in
us-east-1). The enhanced fan-out pattern is recommended for dedicated and increased throughput for cross-Region replication. - The replicator Lambda function (in
us-east-1) validates its current Region with the active Region configuration for the stream being consumed, with the help of thekdsActiveRegionConfigDynamoDB global tableThe following sample code (in Java) can help illustrate the condition being evaluated:// Fetch the current AWS Region from the Lambda function’s environment String currentAWSRegion = System.getenv(“AWS_REGION”); // Read the stream name from the first Kinesis Record once for the entire batch being processed. This is done because we are reusing the same Lambda function for replicating multiple streams. String currentStreamNameConsumed = kinesisRecord.getEventSourceARN().split(“:”)[5].split(“/”)[1]; // Build the DynamoDB query condition using the stream name Map<String, Condition> keyConditions = singletonMap(“streamName”, Condition.builder().comparisonOperator(EQ).attributeValueList(AttributeValue.builder().s(currentStreamNameConsumed).build()).build()); // Query the DynamoDB Global Table QueryResponse queryResponse = ddbClient.query(QueryRequest.builder().tableName("kdsActiveRegionConfig").keyConditions(keyConditions).attributesToGet(“ActiveRegion”).build()); - The function evaluates the response from DynamoDB with the following code:
// Evaluate the response if (queryResponse.hasItems()) { AttributeValue activeRegionForStream = queryResponse.items().get(0).get(“ActiveRegion”); return currentAWSRegion.equalsIgnoreCase(activeRegionForStream.s()); } - Depending on the response, the function takes the following actions:
- If the response is
true, the replicator function produces the records to Kinesis Data Streams inus-east-2in a sequential manner.- If there is a failure, the sequence number of the record is tracked and the iteration is broken. The function returns the list of failed sequence numbers. By returning the failed sequence number, the solution uses the feature of Lambda checkpointing to be able to resume processing of a batch of records with partial failures. This is useful when handling any service impairments, where the function tries to replicate the data across Regions to ensure stream parity and no data loss.
- If there are no failures, an empty list is returned, which indicates the batch was successful.
- If the response is
false, the replicator function returns without performing any replication. To reduce the cost of the Lambda invocations, you can set the reserved concurrency of the function in the DR Region (us-east-2) to zero. This will prevent the function from being invoked. When you failover, you can update this value to an appropriate number based on the CDC throughput and set the reserved concurrency of the function inus-east-1to zero to prevent it from executing unnecessarily.
- If the response is
- After all the records are produced to Kinesis Data Streams in
us-east-2, the replicator function checkpoints to thekdsReplicationCheckpointDynamoDB global table (inus-east-1) with the following data:{ "streamName": "example-stream-1", "lastReplicatedTimestamp": "2022-07-18T20:00:00" } - The function returns after successfully processing the batch of records.
Performance considerations
The performance expectations of the solution should be understood with respect to the following factors:
- Region selection – The replication latency is directly proportional to the distance being traveled by the data, so understand your Region selection
- Velocity – The incoming velocity of the data or the volume of data being replicated
- Payload size – The size of the payload being replicated
Monitor the Cross-Region replication
It’s recommended to track and observe the replication as it happens. You can tailor the Lambda function to publish custom metrics to CloudWatch with the following metrics at the end of every invocation. Publishing these metrics to both the primary and secondary Regions helps protect yourself from impairments affecting observability in the primary Region.
- Throughput – The current Lambda invocation batch size
- ReplicationLagSeconds – The difference between the current timestamp (after processing all the records) and the
ApproximateArrivalTimestampof the last record that was replicated
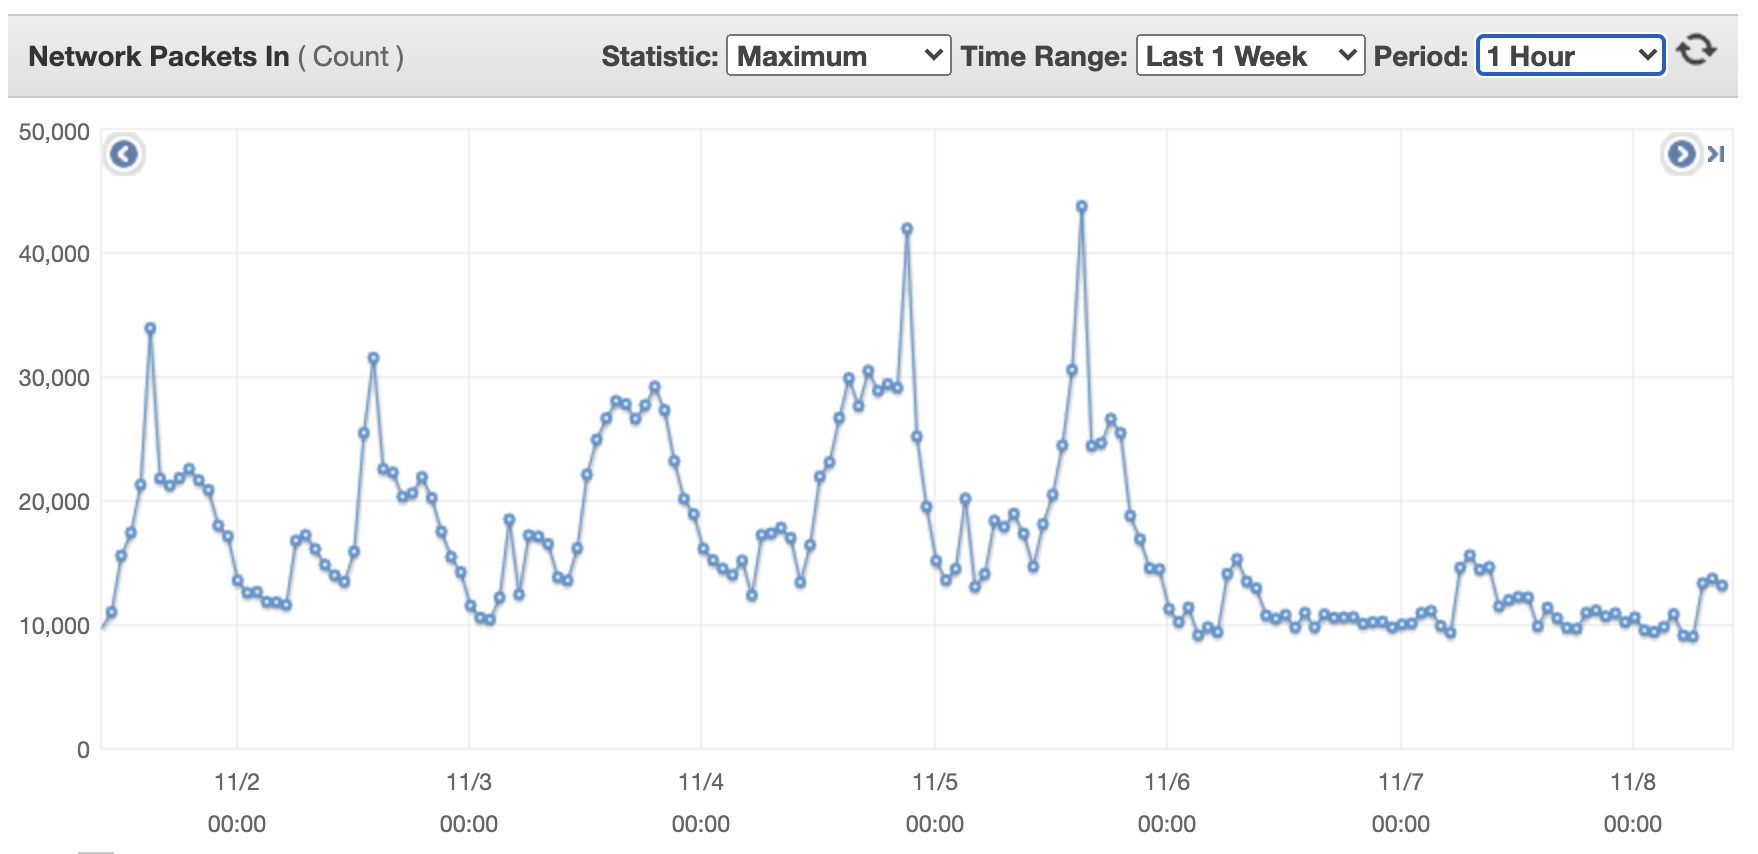
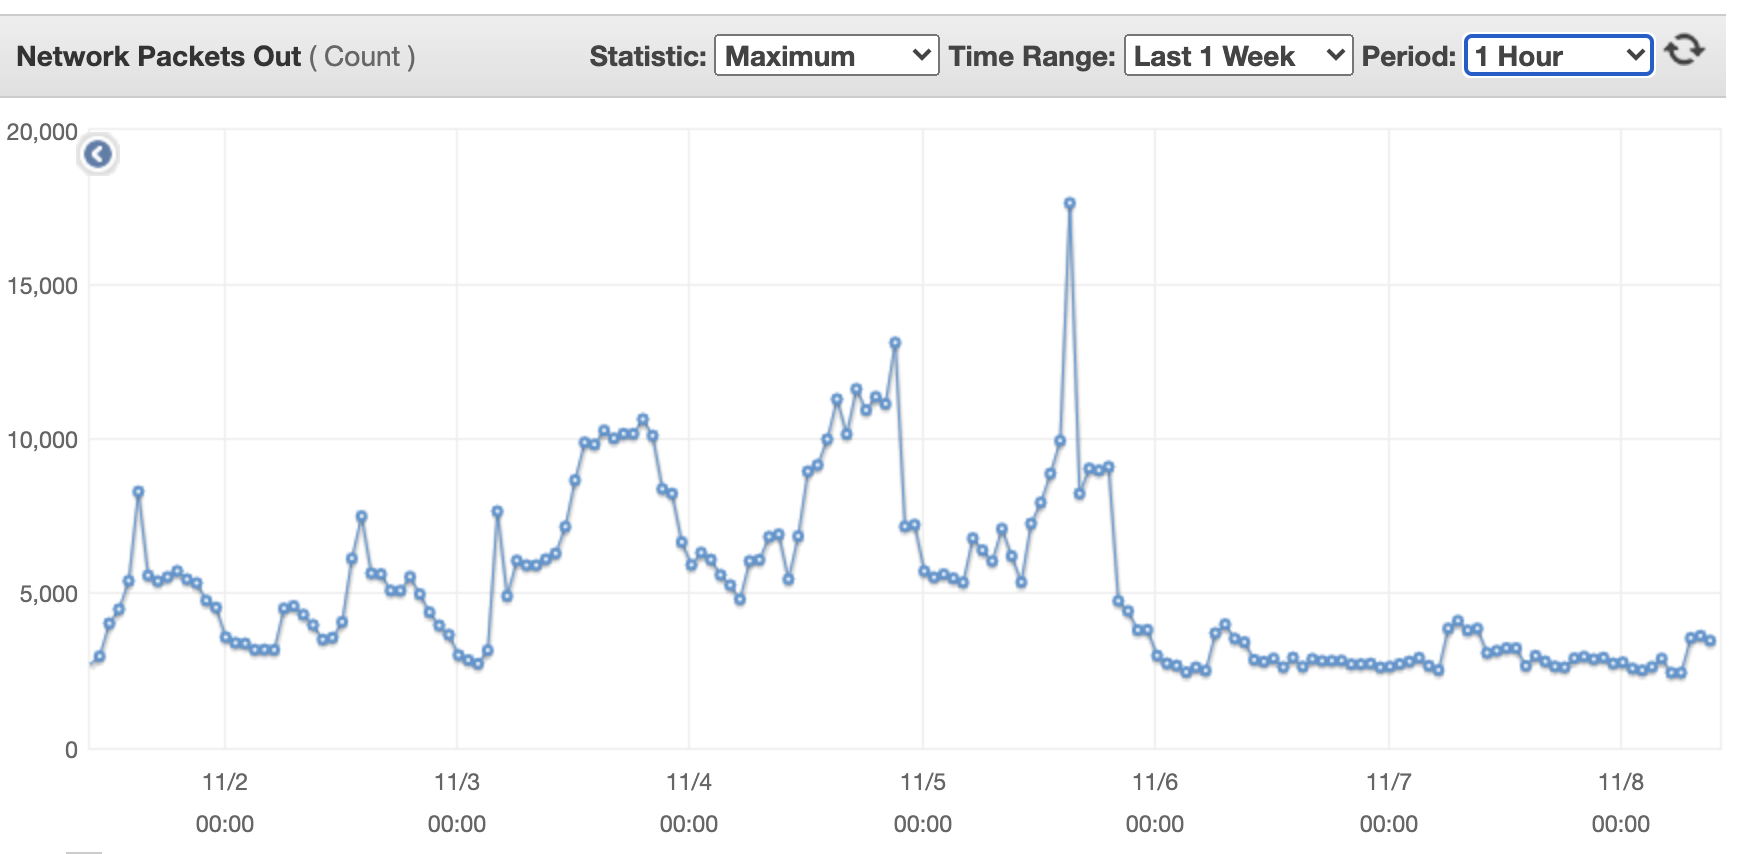
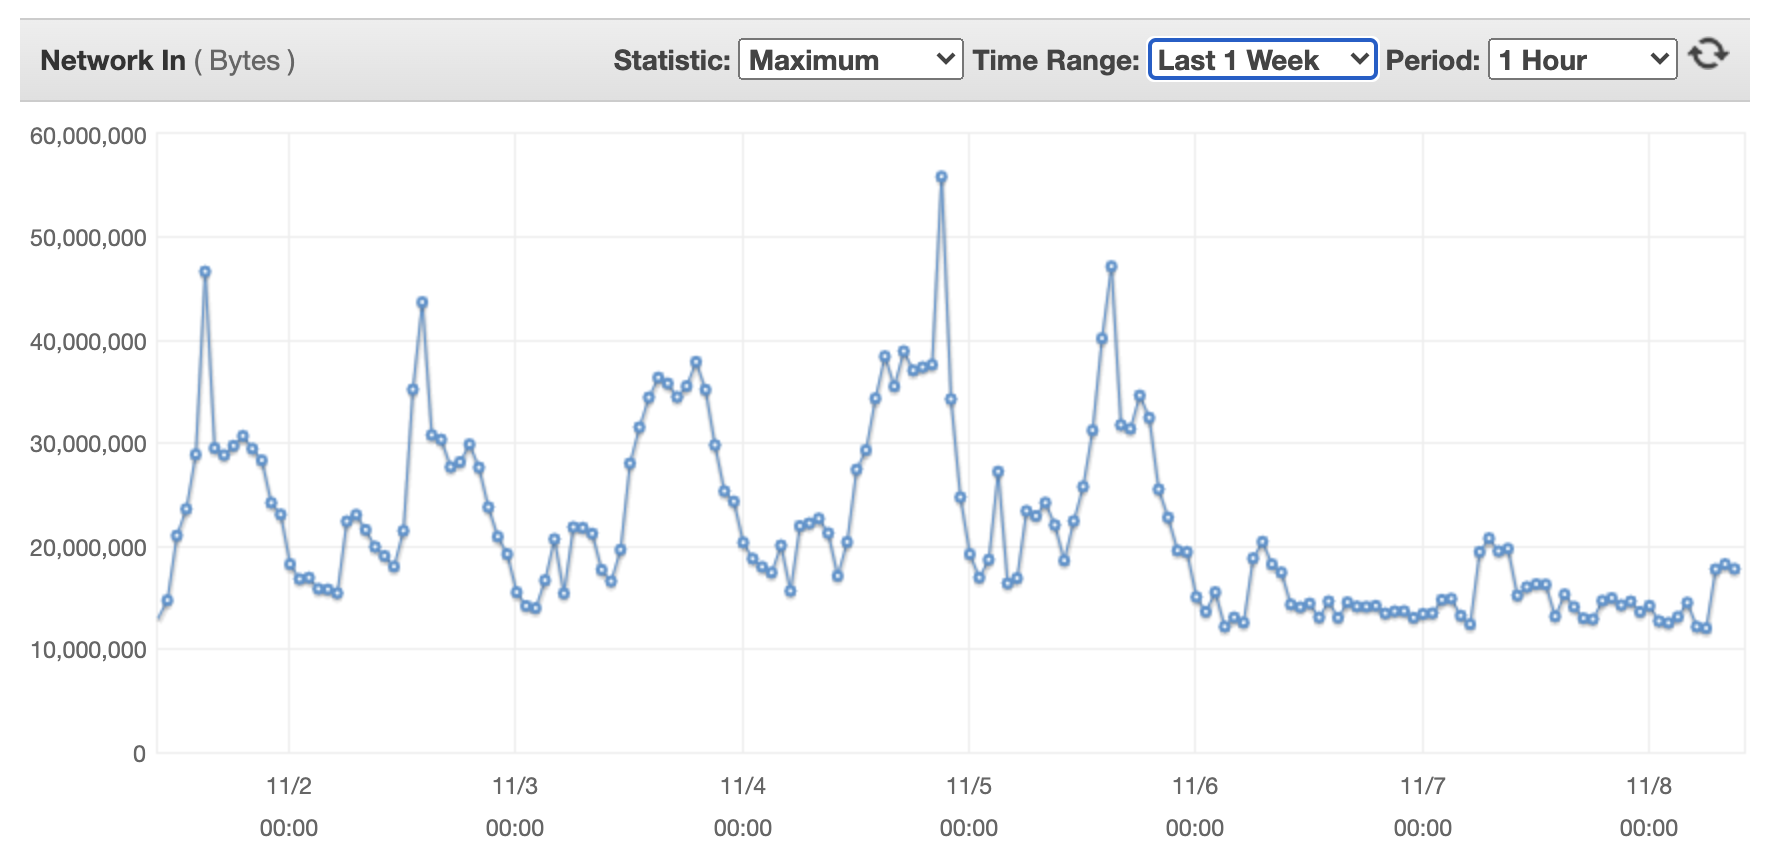
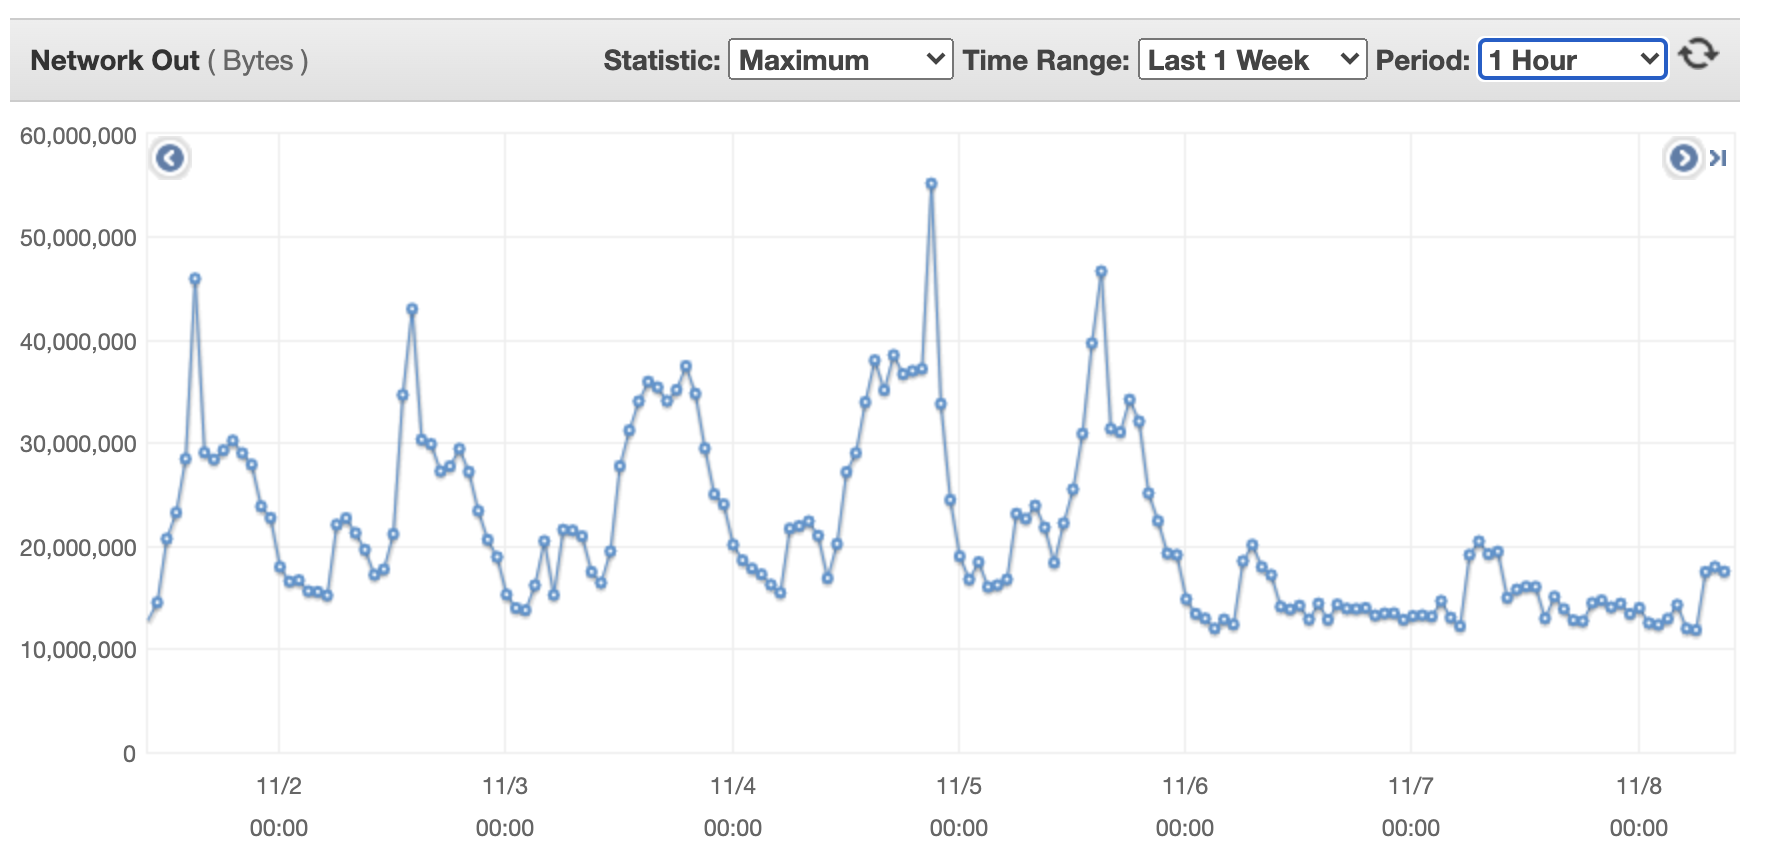
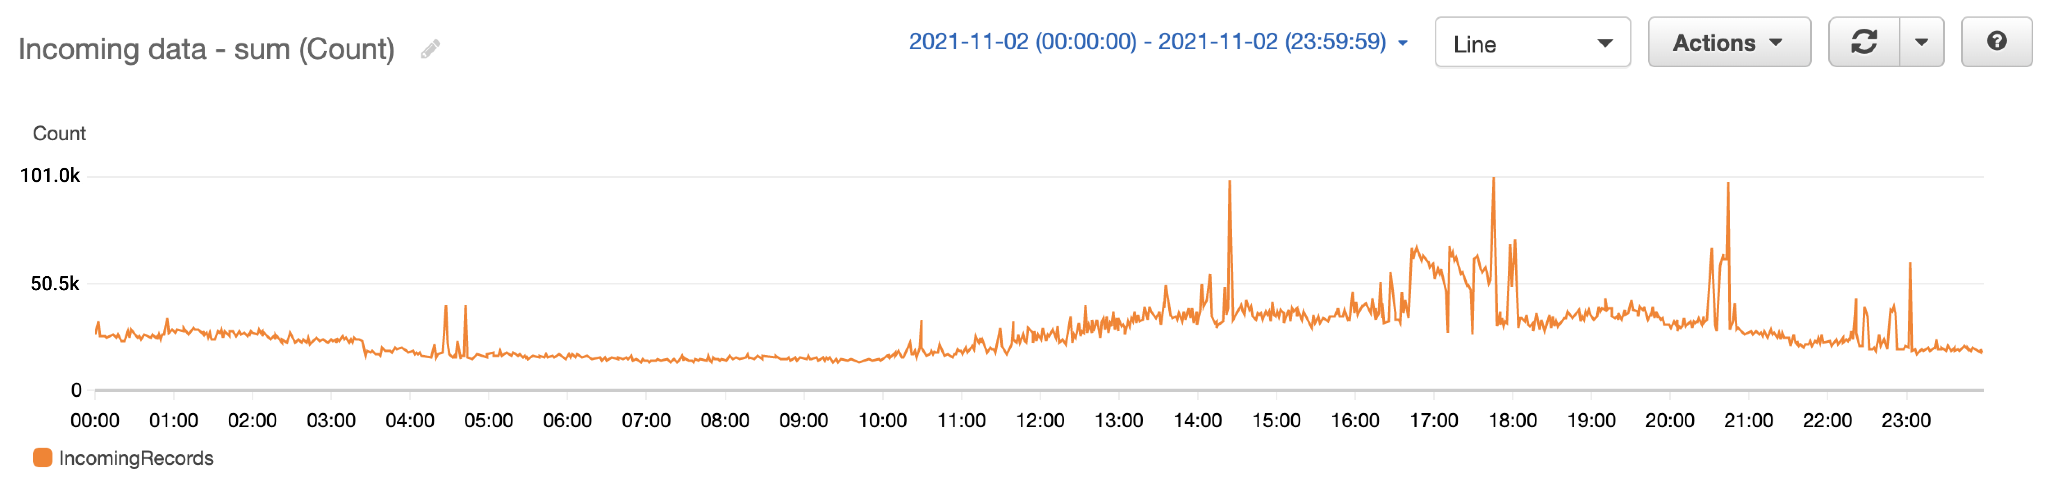
The following example CloudWatch metric graph shows the average replication lag was 2 seconds with a throughput of 100 records replicated from us-east-1 to us-east-2.

Common failover strategy
During any impairments impacting the CDC pipeline in the primary Region, business continuity or disaster recovery needs may dictate a pipeline failover to the secondary (standby) Region. This means a couple of things need to be done as part of this failover process:
- If possible, stop all the CDC tasks in the CDC processor tool in
us-east-1. - The CDC processor must be failed over to the secondary Region, so that it can read the CDC data from the remote data source while operating out of the standby Region.
- The
kdsActiveRegionConfigDynamoDB global table needs to be updated. For instance, for the streamexample-stream-1used in our example, the active Region is changed tous-east-2:
{
"stream-name": "example-stream-1",
"active-Region" : "us-east-2"
}- All the stream checkpoints need to be read from the
kdsReplicationCheckpointDynamoDB global table (inus-east-2), and the timestamps from each of the checkpoints are used to start the CDC tasks in the producer tool inus-east-2Region. This minimizes the chances of data loss and accurately resumes streaming the CDC data from the remote data source from the checkpoint timestamp onwards. - If using reserved concurrency to control Lambda invocations, set the value to zero in the primary Region(
us-east-1) and to a suitable non-zero value in the secondary Region(us-east-2).
Vanguard’s multi-step failover strategy
Some of the third-party tools that Vanguard uses have a two-step CDC process of streaming data from a remote data source to a destination. Vanguard’s tool of choice for their CDC processor follows this two-step approach:
- The first step involves setting up a log stream task that reads the data from the remote data source and persists in a staging location.
- The second step involves setting up individual consumer tasks that read data from the staging location—which could be on Amazon Elastic File System (Amazon EFS) or Amazon FSx, for example—and stream it to the destination. The flexibility here is that each of these consumer tasks can be triggered to stream from different commit timestamps. The log stream task usually starts reading data from the minimum of all the commit timestamps used by the consumer tasks.
Let’s look at an example to explain the scenario:
- Consumer task A is streaming data from a commit timestamp 2022-07-19T20:00:00 onwards to
example-stream-1. - Consumer task B is streaming data from a commit timestamp 2022-07-19T21:00:00 onwards to
example-stream-2. - In this situation, the log stream should read data from the remote data source from the minimum of the timestamps used by the consumer tasks, which is 2022-07-19T20:00:00.
The following sequence diagram demonstrates the exact steps to run during a failover to us-east-2 (the standby Region).

The steps are as follows:
- The failover process is triggered in the standby Region (
us-east-2in this example) when required. Note that the trigger can be automated using comprehensive health checks of the pipeline in the primary Region. - The failover process updates the kdsActiveRegionConfig DynamoDB global table with the new value for the Region as
us-east-2for all the stream names. - The next step is to fetch all the stream checkpoints from the
kdsReplicationCheckpointDynamoDB global table (inus-east-2). - After the checkpoint information is read, the failover process finds the minimum of all the
lastReplicatedTimestamp. - The log stream task in the CDC processor tool is started in
us-east-2with the timestamp found in Step 4. It begins reading CDC data from the remote data source from this timestamp onwards and persists them in the staging location on AWS. - The next step is to start all the consumer tasks to read data from the staging location and stream to the destination data stream. This is where each consumer task is supplied with the appropriate timestamp from the
kdsReplicationCheckpointtable according to thestreamNameto which the task streams the data.
After all the consumer tasks are started, data is produced to the Kinesis data streams in us-east-2. From there on, the process of cross-Region replication is the same as described earlier – the replication Lambda function in us-east-2 starts replicating data to the data stream in us-east-1.
The consumer applications reading data from the streams are expected to be idempotent to be able to handle duplicates. Duplicates can be introduced in the stream due to many reasons, some of which are called out below.
- The Producer or the CDC Processor introduces duplicates into the stream while replaying the CDC data during a failover
- DynamoDB Global Table uses asynchronous replication of data across Regions and if the
kdsReplicationCheckpointtable data has a replication lag, the failover process may potentially use an older checkpoint timestamp to replay the CDC data.
Also, consumer applications should checkpoint the CommitTimestamp of the last record that was consumed. This is to facilitate better monitoring and recovery.
Path to maturity: Automated recovery
The ideal state is to fully automate the failover process, reducing time to recover and meeting the resilience Service Level Objective (SLO). However, in most organizations, the decision to fail over, fail back, and trigger the failover requires manual intervention in assessing the situation and deciding the outcome. Creating scripted automation to perform the failover that can be run by a human is a good place to start.
Vanguard has automated all of the steps of failover, but still have humans make the decision on when to invoke it. You can customize the solution to meet your needs and depending on the CDC processor tool you use in your environment.
Conclusion
In this post, we described how Vanguard innovated and built a solution for replicating data across Regions in Kinesis Data Streams to make the data highly available. We also demonstrated a robust checkpoint strategy to facilitate a Regional failover of the replication process when needed. The solution also illustrated how to use DynamoDB global tables for tracking the replication checkpoints and configuration. With this architecture, Vanguard was able to deploy workloads depending on the CDC data to multiple Regions to meet business needs of high availability in the face of service impairments impacting CDC pipelines in the primary Region.
If you have any feedback please leave a comment in the Comments section below.
About the authors
 Raghu Boppanna works as an Enterprise Architect at Vanguard’s Chief Technology Office. Raghu specializes in Data Analytics, Data Migration/Replication including CDC Pipelines, Disaster Recovery and Databases. He has earned several AWS Certifications including AWS Certified Security – Specialty & AWS Certified Data Analytics – Specialty.
 Parameswaran V Vaidyanathan is a Senior Cloud Resilience Architect with Amazon Web Services. He helps large enterprises achieve the business goals by architecting and building scalable and resilient solutions on the AWS Cloud.
 Richa Kaul is a Senior Leader in Customer Solutions serving Financial Services customers. She is based out of New York. She has extensive experience in large scale cloud transformation, employee excellence, and next generation digital solutions. She and her team focus on optimizing value of cloud by building performant, resilient and agile solutions. Richa enjoys multi sports like triathlons, music, and learning about new technologies.
 Mithil Prasad is a Principal Customer Solutions Manager with Amazon Web Services. In his role, Mithil works with Customers to drive cloud value realization, provide thought leadership to help businesses achieve speed, agility, and innovation.


 Jeremy Ber has been working in the telemetry data space for the past 7 years as a Software Engineer, Machine Learning Engineer, and most recently a Data Engineer. In the past, Jeremy has supported and built systems that stream in terabytes of data per day, and process complex machine learning algorithms in real time. At AWS, he is a Senior Streaming Specialist Solutions Architect supporting both Amazon MSK and Amazon Kinesis.
 Pratik Patel is a Sr Technical Account Manager and streaming analytics specialist. He works with AWS customers and provides ongoing support and technical guidance to help plan and build solutions using best practices, and proactively helps keep customer’s AWS environments operationally healthy.


 Paul Villena is an Analytics Solutions Architect in AWS with expertise in building modern data and analytics solutions to drive business value. He works with customers to help them harness the power of the cloud. His areas of interests are infrastructure-as-code, serverless technologies and coding in Python.
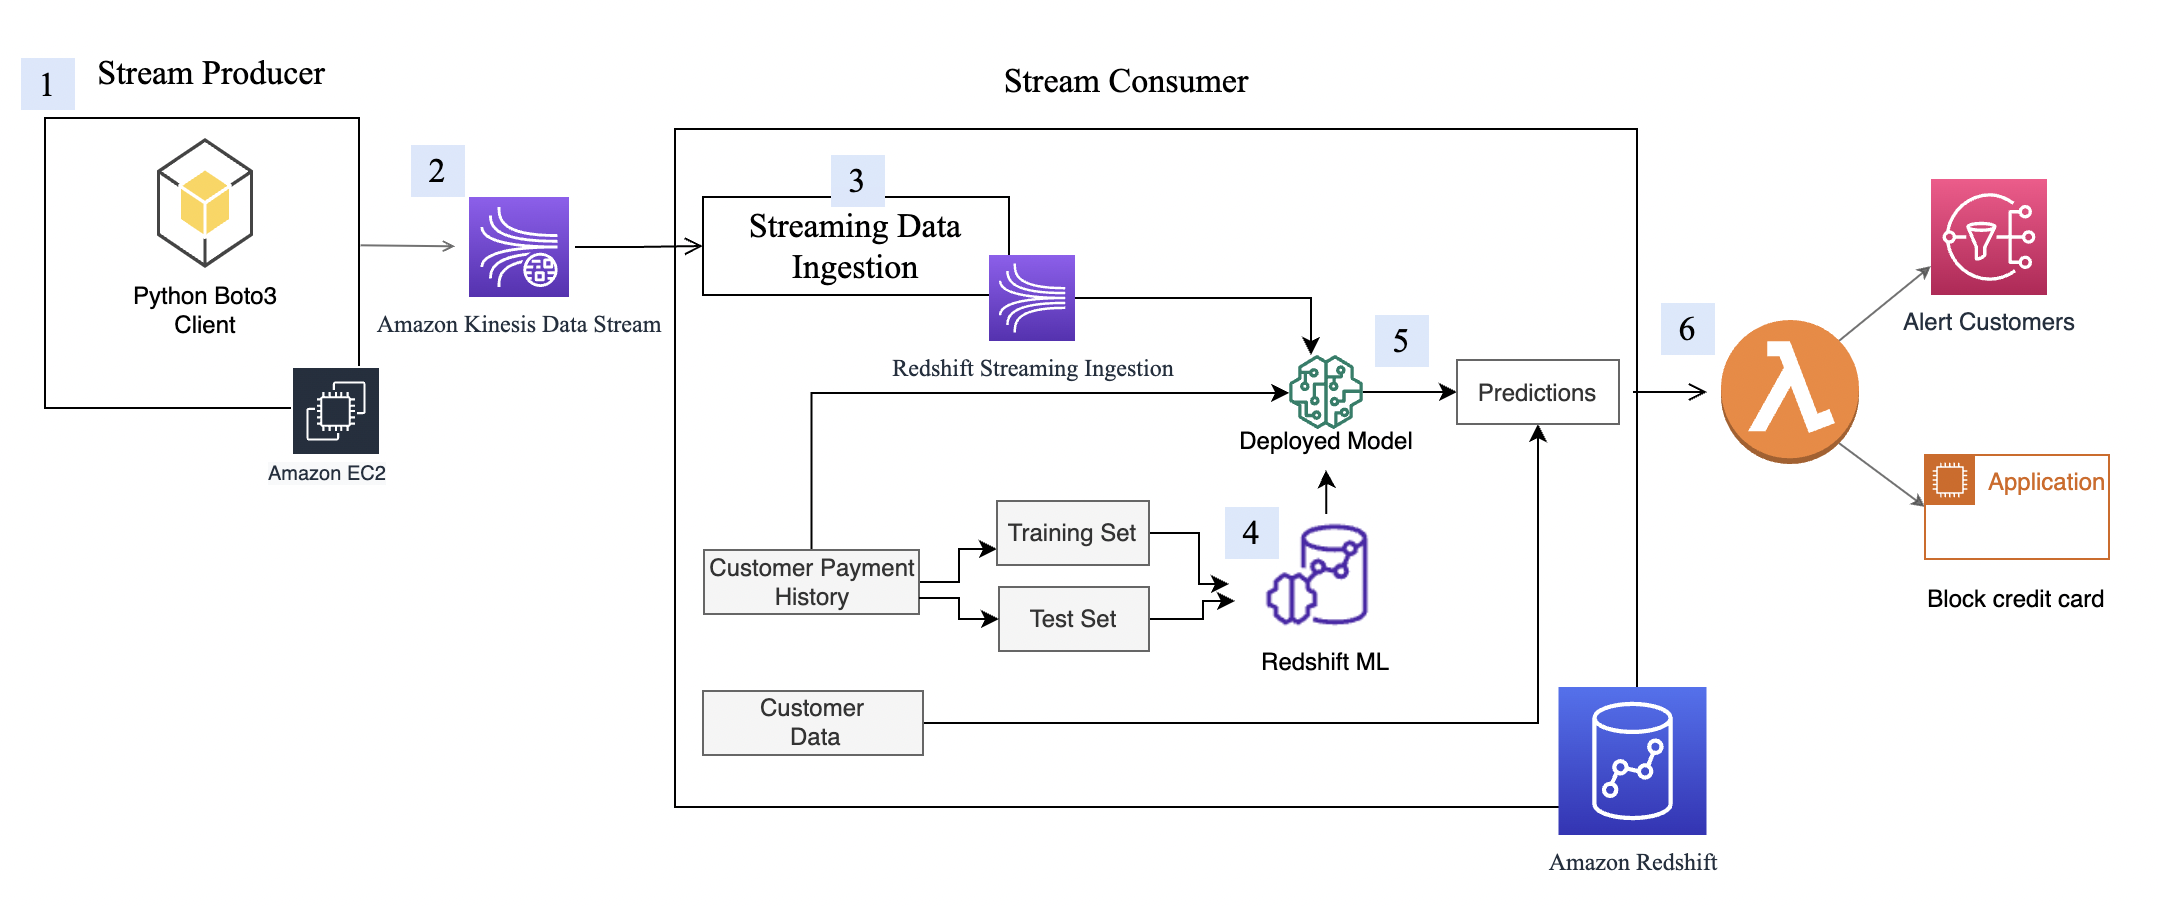


 Dylan Qu is a Specialist Solutions Architect focused on big data and analytics with Amazon Web Services. He helps customers architect and build highly scalable, performant, and secure cloud-based solutions on AWS.


 Roy Hasson is the Head of Product at Upsolver. He works with customers globally to simplify how they build, manage and deploy data pipelines to deliver high quality data as a product. Previously, Roy was a Product Manager for AWS Glue and AWS Lake Formation.
 Mei Long is a Product Manager at Upsolver. She is on a mission to make data accessible, usable and manageable in the cloud. Previously, Mei played an instrumental role working with the teams that contributed to the Apache Hadoop, Spark, Zeppelin, Kafka, and Kubernetes projects.
 Maneesh Sharma is a Senior Database Engineer at AWS with more than a decade of experience designing and implementing large-scale data warehouse and analytics solutions. He collaborates with various Amazon Redshift Partners and customers to drive better integration.