Tag Archives: Kinesis Data Streams

Introducing Amazon Kinesis Data Analytics Studio – Quickly Interact with Streaming Data Using SQL, Python, or Scala

Post Syndicated from Danilo Poccia original https://aws.amazon.com/blogs/aws/introducing-amazon-kinesis-data-analytics-studio-quickly-interact-with-streaming-data-using-sql-python-or-scala/

The best way to get timely insights and react quickly to new information you receive from your business and your applications is to analyze streaming data. This is data that must usually be processed sequentially and incrementally on a record-by-record basis or over sliding time windows, and can be used for a variety of analytics including correlations, aggregations, filtering, and sampling.

To make it easier to analyze streaming data, today we are pleased to introduce Amazon Kinesis Data Analytics Studio.

Now, from the Amazon Kinesis console you can select a Kinesis data stream and with a single click start a Kinesis Data Analytics Studio notebook powered by Apache Zeppelin and Apache Flink to interactively analyze data in the stream. Similarly, you can select a cluster in the Amazon Managed Streaming for Apache Kafka console to start a notebook to analyze data in Apache Kafka streams. You can also start a notebook from the Kinesis Data Analytics Studio console and connect to custom sources.

Architectural diagram.

In the notebook, you can interact with streaming data and get results in seconds using SQL queries and Python or Scala programs. When you are satisfied with your results, with a few clicks you can promote your code to a production stream processing application that runs reliably at scale with no additional development effort.

For new projects, we recommend that you use the new Kinesis Data Analytics Studio over Kinesis Data Analytics for SQL Applications. Kinesis Data Analytics Studio combines ease of use with advanced analytical capabilities, which makes it possible to build sophisticated stream processing applications in minutes. Let’s see how that works in practice.

Using Kinesis Data Analytics Studio to Analyze Streaming Data
I want to get a better understanding of the data sent by some sensors to a Kinesis data stream.

To simulate the workload, I use this random_data_generator.py Python script. You don’t need to know Python to use Kinesis Data Analytics Studio. In fact, I am going to use SQL in the following steps. Also, you can avoid any coding and use the Amazon Kinesis Data Generator user interface (UI) to send test data to Kinesis Data Streams or Kinesis Data Firehose. I am using a Python script to have finer control over the data that is being sent.

import datetime
import json
import random
import boto3

STREAM_NAME = "my-input-stream"


def get_random_data():
    current_temperature = round(10 + random.random() * 170, 2)
    if current_temperature > 160:
        status = "ERROR"
    elif current_temperature > 140 or random.randrange(1, 100) > 80:
        status = random.choice(["WARNING","ERROR"])
    else:
        status = "OK"
    return {
        'sensor_id': random.randrange(1, 100),
        'current_temperature': current_temperature,
        'status': status,
        'event_time': datetime.datetime.now().isoformat()
    }


def send_data(stream_name, kinesis_client):
    while True:
        data = get_random_data()
        partition_key = str(data["sensor_id"])
        print(data)
        kinesis_client.put_record(
            StreamName=stream_name,
            Data=json.dumps(data),
            PartitionKey=partition_key)


if __name__ == '__main__':
    kinesis_client = boto3.client('kinesis')
    send_data(STREAM_NAME, kinesis_client)

This script sends random records to my Kinesis data stream using JSON syntax. For example:

{'sensor_id': 77, 'current_temperature': 93.11, 'status': 'OK', 'event_time': '2021-05-19T11:20:00.978328'}
{'sensor_id': 47, 'current_temperature': 168.32, 'status': 'ERROR', 'event_time': '2021-05-19T11:20:01.110236'}
{'sensor_id': 9, 'current_temperature': 140.93, 'status': 'WARNING', 'event_time': '2021-05-19T11:20:01.243881'}
{'sensor_id': 27, 'current_temperature': 130.41, 'status': 'OK', 'event_time': '2021-05-19T11:20:01.371191'}

From the Kinesis console, I select a Kinesis data stream (my-input-stream) and choose Process data in real time from the Process drop-down. In this way, the stream is configured as a source for the notebook.

Console screenshot.

Then, in the following dialog box, I create an Apache Flink – Studio notebook.

I enter a name (my-notebook) and a description for the notebook. The AWS Identity and Access Management (IAM) permissions to read from the Kinesis data stream I selected earlier (my-input-stream) are automatically attached to the IAM role assumed by the notebook.

Console screenshot.

I choose Create to open the AWS Glue console and create an empty database. Back in the Kinesis Data Analytics Studio console, I refresh the list and select the new database. It will define the metadata for my sources and destinations. From here, I can also review the default Studio notebook settings. Then, I choose Create Studio notebook.

Console screenshot.

Now that the notebook has been created, I choose Run.

Console screenshot.

When the notebook is running, I choose Open in Apache Zeppelin to get access to the notebook and write code in SQL, Python, or Scala to interact with my streaming data and get insights in real time.

In the notebook, I create a new note and call it Sensors. Then, I create a sensor_data table describing the format of the data in the stream:

%flink.ssql

CREATE TABLE sensor_data (
    sensor_id INTEGER,
    current_temperature DOUBLE,
    status VARCHAR(6),
    event_time TIMESTAMP(3),
    WATERMARK FOR event_time AS event_time - INTERVAL '5' SECOND
)
PARTITIONED BY (sensor_id)
WITH (
    'connector' = 'kinesis',
    'stream' = 'my-input-stream',
    'aws.region' = 'us-east-1',
    'scan.stream.initpos' = 'LATEST',
    'format' = 'json',
    'json.timestamp-format.standard' = 'ISO-8601'
)

The first line in the previous command tells to Apache Zeppelin to provide a stream SQL environment (%flink.ssql) for the Apache Flink interpreter. I can also interact with the streaming data using a batch SQL environment (%flink.bsql), or Python (%flink.pyflink) or Scala (%flink) code.

The first part of the CREATE TABLE statement is familiar to anyone who has used SQL with a database. A table is created to store the sensor data in the stream. The WATERMARK option is used to measure progress in the event time, as described in the Event Time and Watermarks section of the Apache Flink documentation.

The second part of the CREATE TABLE statement describes the connector used to receive data in the table (for example, kinesis or kafka), the name of the stream, the AWS Region, the overall data format of the stream (such as json or csv), and the syntax used for timestamps (in this case, ISO 8601). I can also choose the starting position to process the stream, I am using LATEST to read the most recent data first.

When the table is ready, I find it in the AWS Glue Data Catalog database I selected when I created the notebook:

Console screenshot.

Now I can run SQL queries on the sensor_data table and use sliding or tumbling windows to get a better understanding of what is happening with my sensors.

For an overview of the data in the stream, I start with a simple SELECT to get all the content of the sensor_data table:

%flink.ssql(type=update)

SELECT * FROM sensor_data;

This time the first line of the command has a parameter (type=update) so that the output of the SELECT, which is more than one row, is continuously updated when new data arrives.

On the terminal of my laptop, I start the random_data_generator.py script:

$ python3 random_data_generator.py

At first I see a table that contains the data as it comes. To get a better understanding, I select a bar graph view. Then, I group the results by status to see their average current_temperature, as shown here:

Notebook screenshot.

As expected by the way I am generating these results, I have different average temperatures depending on the status (OK, WARNING, or ERROR). The higher the temperature, the greater the probability that something is not working correctly with my sensors.

I can run the aggregated query explicitly using a SQL syntax. This time, I want the result computed on a sliding window of 1 minute with results updated every 10 seconds. To do so, I am using the HOP function in the GROUP BY section of the SELECT statement. To add the time to the output of the select, I use the HOP_ROWTIME function. For more information, see how group window aggregations work in the Apache Flink documentation.

%flink.ssql(type=update)

SELECT sensor_data.status,
       COUNT(*) AS num,
       AVG(sensor_data.current_temperature) AS avg_current_temperature,
       HOP_ROWTIME(event_time, INTERVAL '10' second, INTERVAL '1' minute) as hop_time
  FROM sensor_data
 GROUP BY HOP(event_time, INTERVAL '10' second, INTERVAL '1' minute), sensor_data.status;

This time, I look at the results in table format:

Notebook screenshot.

To send the result of the query to a destination stream, I create a table and connect the table to the stream. First, I need to give permissions to the notebook to write into the stream.

In the Kinesis Data Analytics Studio console, I select my-notebook. Then, in the Studio notebooks details section, I choose Edit IAM permissions. Here, I can configure the sources and destinations used by the notebook and the IAM role permissions are updated automatically.

Console screenshot.

In the Included destinations in IAM policy section, I choose the destination and select my-output-stream. I save changes and wait for the notebook to be updated. I am now ready to use the destination stream.

In the notebook, I create a sensor_state table connected to my-output-stream.

%flink.ssql

CREATE TABLE sensor_state (
    status VARCHAR(6),
    num INTEGER,
    avg_current_temperature DOUBLE,
    hop_time TIMESTAMP(3)
)
WITH (
'connector' = 'kinesis',
'stream' = 'my-output-stream',
'aws.region' = 'us-east-1',
'scan.stream.initpos' = 'LATEST',
'format' = 'json',
'json.timestamp-format.standard' = 'ISO-8601');

I now use this INSERT INTO statement to continuously insert the result of the select into the sensor_state table.

%flink.ssql(type=update)

INSERT INTO sensor_state
SELECT sensor_data.status,
    COUNT(*) AS num,
    AVG(sensor_data.current_temperature) AS avg_current_temperature,
    HOP_ROWTIME(event_time, INTERVAL '10' second, INTERVAL '1' minute) as hop_time
FROM sensor_data
GROUP BY HOP(event_time, INTERVAL '10' second, INTERVAL '1' minute), sensor_data.status;

The data is also sent to the destination Kinesis data stream (my-output-stream) so that it can be used by other applications. For example, the data in the destination stream can be used to update a real-time dashboard, or to monitor the behavior of my sensors after a software update.

I am satisfied with the result. I want to deploy this query and its output as a Kinesis Analytics application. To do so, I need to provide an S3 location to store the application executable.

In the configuration section of the console, I edit the Deploy as application configuration settings. There, I choose a destination bucket in the same region and save changes.

Console screenshot.

I wait for the notebook to be ready after the update. Then, I create a SensorsApp note in my notebook and copy the statements that I want to execute as part of the application. The tables have already been created, so I just copy the INSERT INTO statement above.

From the menu at the top right of my notebook, I choose Build SensorsApp and export to Amazon S3 and confirm the application name.

Notebook screenshot.

When the export is ready, I choose Deploy SensorsApp as Kinesis Analytics application in the same menu. After that, I fine-tune the configuration of the application. I set parallelism to 1 because I have only one shard in my input Kinesis data stream and not a lot of traffic. Then, I run the application, without having to write any code.

From the Kinesis Data Analytics applications console, I choose Open Apache Flink dashboard to get more information about the execution of my application.

Apache Flink console screenshot.

Availability and Pricing
You can use Amazon Kinesis Data Analytics Studio today in all AWS Regions where Kinesis Data Analytics is generally available. For more information, see the AWS Regional Services List.

In Kinesis Data Analytics Studio, we run the open-source versions of Apache Zeppelin and Apache Flink, and we contribute changes upstream. For example, we have contributed bug fixes for Apache Zeppelin, and we have contributed to AWS connectors for Apache Flink, such as those for Kinesis Data Streams and Kinesis Data Firehose. Also, we are working with the Apache Flink community to contribute availability improvements, including automatic classification of errors at runtime to understand whether errors are in user code or in application infrastructure.

With Kinesis Data Analytics Studio, you pay based on the average number of Kinesis Processing Units (KPU) per hour, including those used by your running notebooks. One KPU comprises 1 vCPU of compute, 4 GB of memory, and associated networking. You also pay for running application storage and durable application storage. For more information, see the Kinesis Data Analytics pricing page.

Start using Kinesis Data Analytics Studio today to get better insights from your streaming data.

Danilo

Build a data lake using Amazon Kinesis Data Streams for Amazon DynamoDB and Apache Hudi

Post Syndicated from Dhiraj Thakur original https://aws.amazon.com/blogs/big-data/build-a-data-lake-using-amazon-kinesis-data-streams-for-amazon-dynamodb-and-apache-hudi/

Amazon DynamoDB helps you capture high-velocity data such as clickstream data to form customized user profiles and online order transaction data to develop customer order fulfillment applications, improve customer satisfaction, and get insights into sales revenue to create a promotional offer for the customer. It’s essential to store these data points in a centralized data lake, which can be transformed, analyzed, and combined with diverse organizational datasets to derive meaningful insights and make predictions.

A popular use case in order management is receiving, tracking, and fulfilling customer orders. The order management process begins when an order is placed and ends when the customer receives their package. When storing high-velocity order transaction data in DynamoDB, you can use Amazon Kinesis streaming to extract data and store it in a centralized data lake built on Amazon Simple Storage Service (Amazon S3).

Amazon Kinesis Data Streams for DynamoDB helps you to publish item-level changes in any DynamoDB table to a Kinesis data stream of your choice. Additionally, you can take advantage of this feature for use cases that require longer data retention on the stream and fan out to multiple concurrent stream readers. You also can integrate with Amazon Kinesis Data Analytics or Amazon Kinesis Data Firehose to publish data to downstream destinations such as Amazon Elasticsearch Service (Amazon ES), Amazon Redshift, or Amazon S3.

In this post, you use Kinesis Data Streams for DynamoDB and take advantage of managed streaming delivery of DynamoDB data to other Kinesis Data Stream by simply enabling Kinesis streaming connection from Amazon DynamoDB console. To process DynamoDB events from Kinesis, you have multiple options: Amazon Kinesis Client Library (KCL) applications, Lambda, Kinesis Data Analytics for Apache Flink, and Kinesis Data Firehose. In this post, you use Kinesis Data Firehose to save the raw data in the S3 data lake and Apache Hudi to batch process the data.

Architecture

The following diagram illustrates the order processing system architecture.

In this architecture, users buy products in online retail shops and internally create an order transaction stored in DynamoDB. The order transaction data is ingested to the data lake and stored in the raw data layer. To achieve this, you enable Kinesis Data Streams for DynamoDB and use Kinesis Data Firehose to store data in Amazon S3. You use Lambda to transform the data from the delivery stream to remove unwanted data and finally store it in Parquet format. Next, you batch process the raw data and store it back in the Hudi dataset in the S3 data lake. You can then use Amazon Athena to do sales analysis. You build this entire data pipeline in a serverless manner.

Prerequisites

Complete the following steps to create AWS resources to build a data pipeline as mentioned in the architecture. For this post, we use the AWS Region us-west-1.

  1. On the Amazon Elastic Compute Cloud (Amazon EC2) console, create a keypair.
  2. Download the data files, Amazon EMR cluster, and Athena DDL code from GitHub.
  3. Deploy the necessary Amazon resources using the provided AWS CloudFormation template.
  4. For Stack name, enter a stack name of your choice.
  5. For Keypair name, choose a key pair.

A key pair is required to connect to the EMR cluster nodes. For more information, see Use an Amazon EC2 Key Pair for SSH Credentials.

  1. Keep the remaining default parameters.
  2. Acknowledge that AWS CloudFormation might create AWS Identity and Access Management (IAM) resources.

For more information about IAM, see Resources to learn more about IAM.

  1. Choose Create stack.

You can check the Resources tab for the stack after the stack is created.

The following table summarizes the resources that you created, which you use to build the data pipeline and analysis.

Logical ID Physical ID Type
DeliveryPolicy kines-Deli-* AWS::IAM::Policy
DeliveryRole kinesis-hudi-DeliveryRole-* AWS::IAM::Role
Deliverystream kinesis-hudi-Deliverystream-* AWS::KinesisFirehose::DeliveryStream
DynamoDBTable order_transaction_* AWS::DynamoDB::Table
EMRClusterServiceRole kinesis-hudi-EMRClusterServiceRole-* AWS::IAM::Role
EmrInstanceProfile kinesis-hudi-EmrInstanceProfile-* AWS::IAM::InstanceProfile
EmrInstanceRole kinesis-hudi-EmrInstanceRole-* AWS::IAM::Role
GlueDatabase gluedatabase-* AWS::Glue::Database
GlueTable gluetable-* AWS::Glue::Table
InputKinesisStream order-data-stream-* AWS::Kinesis::Stream
InternetGateway igw-* AWS::EC2::InternetGateway
InternetGatewayAttachment kines-Inter-* AWS::EC2::VPCGatewayAttachment
MyEmrCluster AWS::EMR::Cluster
ProcessLambdaExecutionRole kinesis-hudi-ProcessLambdaExecutionRole-* AWS::IAM::Role
ProcessLambdaFunction kinesis-hudi-ProcessLambdaFunction-* AWS::Lambda::Function
ProcessedS3Bucket kinesis-hudi-processeds3bucket-* AWS::S3::Bucket
PublicRouteTable AWS::EC2::RouteTable
PublicSubnet1 AWS::EC2::Subnet
PublicSubnet1RouteTableAssociation AWS::EC2::SubnetRouteTableAssociation
PublicSubnet2 AWS::EC2::Subnet
PublicSubnet2RouteTableAssociation AWS::EC2::SubnetRouteTableAssociation
RawS3Bucket kinesis-hudi-raws3bucket-* AWS::S3::Bucket
S3Bucket kinesis-hudi-s3bucket-* AWS::S3::Bucket
SourceS3Bucket kinesis-hudi-sources3bucket-* AWS::S3::Bucket
VPC vpc-* AWS::EC2::VPC

Enable Kinesis streaming for DynamoDB

AWS recently launched Kinesis Data Streams for DynamoDB so you can send data from DynamoDB to Kinesis data streams. You can use the AWS Command Line Interface (AWS CLI) or the AWS Management Console to enable this feature.

To enable this feature from the console, complete the following steps:

  1. On the DynamoDB console, choose the table you created in the CloudFormation stack earlier (it begins with the prefix order_transaction_).
  2. On the Overview tab, choose Manage streaming to Kinesis.
  3. Choose your input stream (it starts with order-data-stream-).
  4. Choose Enable.
  5. Choose Close.
  6. Make sure that stream enabled is set to Yes.

Populate the sales order transaction dataset

To replicate a real-life use case, you need an online retail application. For this post, you upload raw data files in the S3 bucket and use a Lambda function to upload the data in DynamoDB. You can download the order data CSV files from the AWS Sample GitHub repository. Complete the following steps to upload the data in DynamoDB:

  1. On the Amazon S3 console, choose the bucket <stack-name>-sourcess3bucket-*.
  2. Choose Upload.
  3. Choose Add files.
  4. Choose the order_data_09_02_2020.csv and order_data_10_02_2020.csv files.
  5. Choose Upload.
  6. On the Lambda console, choose the function <stack-name>-CsvToDDBLambdaFunction-*.
  7. Choose Test.
  8. For Event template, enter an event name.
  9. Choose Create.
  10. Choose Test.

This runs the Lambda function and loads the CSV file order_data_09_02_2020.csv to the DynamoDB table.

  1. Wait until the message appears that the function ran successfully.

You can now view the data on the DynamoDB console, in the details page for your table.

Because you enabled the Kinesis data stream in the DynamoDB table, it starts streaming the data to Amazon S3. You can check the data by viewing the bucket on the Amazon S3 console. The following screenshot shows that a Parquet file is under the prefix in the bucket.

Use Apache Hudi with Amazon EMR

Now it’s time to process the streaming data using Hudi.

  1. Log in to the Amazon EMR leader node.

You can use the key pair you chose in the security options to SSH into the leader node.

  1. Use the following bash command to start the Spark shell to use it with Apache Hudi:
spark-shell --conf "spark.serializer=org.apache.spark.serializer.KryoSerializer" --conf "spark.sql.hive.convertMetastoreParquet=false" --jars /usr/lib/hudi/hudi-spark-bundle.jar,/usr/lib/spark/external/lib/spark-avro.jar

The Amazon EMR instance looks like the following screenshot.

  1. You can use the following Scala code to import the order transaction data from the S3 data lake to a Hudi dataset using the copy-on-write storage type. Change inputDataPath as per file path in <stack-name>-raws3bucket-* in your environment, and replace the bucket name in hudiTablePath as <stack-name>- processeds3bucket-*.
import org.apache.spark.sql.SaveMode
import org.apache.spark.sql.functions._
import org.apache.hudi.DataSourceWriteOptions
import org.apache.hudi.config.HoodieWriteConfig
import org.apache.hudi.hive.MultiPartKeysValueExtractor

//Set up various input values as variables
val inputDataPath = "s3://kinesis-hudi-raws3bucket-1p6nszvqd9awz/2021/02/01/15/"
val hudiTableName = "order_hudi_cow"
val hudiTablePath = "s3://kinesis-hudi-processeds3bucket-yfc6843vmq1o/" + hudiTableName

// Set up our Hudi Data Source Options
val hudiOptions = Map[String,String](
    DataSourceWriteOptions.RECORDKEY_FIELD_OPT_KEY -> "order_id",
	DataSourceWriteOptions.RECORDKEY_FIELD_OPT_KEY -> "time_stamp",
    DataSourceWriteOptions.PARTITIONPATH_FIELD_OPT_KEY -> "transaction_date", 
    HoodieWriteConfig.TABLE_NAME -> hudiTableName, 
    DataSourceWriteOptions.OPERATION_OPT_KEY ->
        DataSourceWriteOptions.INSERT_OPERATION_OPT_VAL, 
    DataSourceWriteOptions.PRECOMBINE_FIELD_OPT_KEY -> "time_stamp", 
    DataSourceWriteOptions.HIVE_SYNC_ENABLED_OPT_KEY -> "true", 
    DataSourceWriteOptions.HIVE_TABLE_OPT_KEY -> hudiTableName, 
    DataSourceWriteOptions.HIVE_PARTITION_FIELDS_OPT_KEY -> "transaction_date", 
    DataSourceWriteOptions.HIVE_PARTITION_EXTRACTOR_CLASS_OPT_KEY ->
        classOf[MultiPartKeysValueExtractor].getName)

// Read data from S3 and create a DataFrame with Partition and Record Key
val inputDF = spark.read.format("parquet").load(inputDataPath)

// Write data into the Hudi dataset
inputDF.write.format("org.apache.hudi").options(hudiOptions).mode(SaveMode.Append).save(hudiTablePath)

For more information about DataSourceWriteOptions, see Work with a Hudi Dataset.

  1. In the Spark shell, you can now count the total number of records in the Apache Hudi dataset:
scala> inputDF.count()
res1: Long = 1000

You can check the processed Apache Hudi dataset in the S3 data lake via the Amazon S3 console. The following screenshot shows the prefix order_hudi_cow is in <stack-name>- processeds3bucket-*.

When navigating into the order_hudi_cow prefix, you can find a list of Hudi datasets that are partitioned using the transaction_date key—one for each date in our dataset.

Let’s analyze the data stored in Amazon S3 using Athena.

Analyze the data with Athena

To analyze your data, complete the following steps:

  1. On the Athena console, create the database order_db using the following command:
create database order_db;

You use this database to create all the Athena tables.

  1. Create your table using the following command (replace the S3 bucket name with <stack-name>- processeds3bucket* created in your environment):
    CREATE EXTERNAL TABLE order_transaction_cow (
      `_hoodie_commit_time` string,
      `_hoodie_commit_seqno` string,
      `_hoodie_record_key` string,
      `_hoodie_partition_path` string,
      `_hoodie_file_name` string,
      `order_id` string,
      `item_id` string,
      `customer_id` string,
      `product` string,
      `amount` decimal(3,1),
      `currency` string,
      `time_stamp` string
      )
      PARTITIONED BY ( 
      `transaction_date` string)
    ROW FORMAT SERDE
      'org.apache.hadoop.hive.ql.io.parquet.serde.ParquetHiveSerDe'
    STORED AS INPUTFORMAT
      'org.apache.hudi.hadoop.HoodieParquetInputFormat'
    OUTPUTFORMAT
      'org.apache.hadoop.hive.ql.io.parquet.MapredParquetOutputFormat'
    LOCATION
      's3://kinesis-hudi-processeds3bucket-yfc6843vmq1o/order_hudi_cow'

  2. Add partitions by running the following query on the Athena console:
    ALTER TABLE order_transaction_cow ADD
    PARTITION (transaction_date = '2020-09-02') LOCATION 's3://kinesis-hudi-processeds3bucket-yfc6843vmq1o/order_hudi_cow/2020-09-02/';

  3. Check the total number of records in the Hudi dataset with the following query:
    SELECT count(*) FROM "order_db"."order_transaction_cow";

It should return a single row with a count of 1,000.

Now check the record that you want to update.


  1. Run the following query on the Athena console:
SELECT * FROM "order_db"."order_transaction_cow"
where order_id ='3801'
and item_id ='23'
and transaction_date ='2020-09-02';

The output should look like the following screenshot. Note down the value of product and amount.

Analyze the change data capture

Now let’s test the change data capture (CDC) in streaming. Let’s take an example where the customer changed an existing order. We load the order_data_10_02_2020.csv file, where order_id 3801 has a different product and amount.

To test the CDC feature, complete the following steps:

  1. On the Lambda console, choose the stack <stack-name>-CsvToDDBLambdaFunction-*.
  2. In the Environment variables section, choose Edit.
  3. For key, enter order_data_10_02_2020.csv.
  4. Choose Save.

You can see another prefix has been created in <stack-name>-raws3bucket-*.

  1. In Amazon EMR, run the following code in the Scala shell prompt to update the data (change inputDataPath to the file path in <stack-name>-raws3bucket-* and hudiTablePath to <stack-name>- processeds3bucket-*):
    import org.apache.spark.sql.SaveMode
    import org.apache.spark.sql.functions._
    import org.apache.hudi.DataSourceWriteOptions
    import org.apache.hudi.config.HoodieWriteConfig
    import org.apache.hudi.hive.MultiPartKeysValueExtractor
    
    //Set up various input values as variables
    val inputDataPath = "s3://kinesis-hudi-raws3bucket-1p6nszvqd9awz/2021/02/01/18/"
    val hudiTableName = "order_hudi_cow"
    val hudiTablePath = "s3://kinesis-hudi-processeds3bucket-yfc6843vmq1o/" + hudiTableName
    
    // Set up our Hudi Data Source Options
    val hudiOptions = Map[String,String](
        DataSourceWriteOptions.RECORDKEY_FIELD_OPT_KEY -> "order_id",
    	DataSourceWriteOptions.RECORDKEY_FIELD_OPT_KEY -> "time_stamp",
        DataSourceWriteOptions.PARTITIONPATH_FIELD_OPT_KEY -> "transaction_date", 
        HoodieWriteConfig.TABLE_NAME -> hudiTableName, 
        DataSourceWriteOptions.OPERATION_OPT_KEY ->
            DataSourceWriteOptions.INSERT_OPERATION_OPT_VAL, 
        DataSourceWriteOptions.PRECOMBINE_FIELD_OPT_KEY -> "time_stamp", 
        DataSourceWriteOptions.HIVE_SYNC_ENABLED_OPT_KEY -> "true", 
        DataSourceWriteOptions.HIVE_TABLE_OPT_KEY -> hudiTableName, 
        DataSourceWriteOptions.HIVE_PARTITION_FIELDS_OPT_KEY -> "transaction_date", 
        DataSourceWriteOptions.HIVE_PARTITION_EXTRACTOR_CLASS_OPT_KEY ->
            classOf[MultiPartKeysValueExtractor].getName)
    
    // Read data from S3 and create a DataFrame with Partition and Record Key
    val inputDF = spark.read.format("parquet").load(inputDataPath)
    
    // Write data into the Hudi dataset
    inputDF.write.format("org.apache.hudi").options(hudiOptions).mode(SaveMode.Append).save(hudiTablePath
    

  2. Run the following query on the Athena console to check for the change to the total number of records as 1,000:
    SELECT count(*) FROM "order_db"."order_transaction_cow";

  3. Run the following query on the Athena console to test for the update:
SELECT * FROM "order_db"."order_transaction_cow"
where order_id ='3801'
and item_id ='23'
and transaction_date ='2020-09-02';

The following screenshot shows that the product and amount values for the same order are updated.

In a production workload, you can trigger the updates on a schedule or by S3 modification events. A fully automated data lake makes sure your business analysts are always viewing the latest available data.

Clean up the resources

To avoid incurring future charges, follow these steps to remove the example resources:

  1. Delete the resources you created earlier in the pre-requisite section by deleting the stack instances from your stack set, if you created the EMR cluster with the CloudFormation template,.
  2. Stop the cluster via the Amazon EMR console, if you launched the EMR cluster manually.
  3. Empty all the relevant buckets via the Amazon S3 console.

Conclusion

You can build an end-to-end serverless data lake to get real-time insights from DynamoDB by using Kinesis Data Streams—all without writing any complex code. It allows your team to focus on solving business problems by getting useful insights immediately. Application developers have various use cases for moving data quickly through an analytics pipeline, and you can make this happen by enabling Kinesis Data Streams for DynamoDB.

If this post helps you or inspires you to solve a problem, we would love to hear about it! The code for this solution is available in the GitHub repository for you to use and extend. Contributions are always welcome!


About the Authors

Dhiraj Thakur is a Solutions Architect with Amazon Web Services. He works with AWS customers and partners to guide enterprise cloud adoption, migration, and strategy. He is passionate about technology and enjoys building and experimenting in the analytics and AI/ML space.


Saurabh Shrivastava is a solutions architect leader and analytics/ML specialist working with global systems integrators. He works with AWS Partners and customers to provide them with architectural guidance for building scalable architecture in hybrid and AWS environments. He enjoys spending time with his family outdoors and traveling to new destinations to discover new cultures.


Dylan Qu is an AWS solutions architect responsible for providing architectural guidance across the full AWS stack with a focus on data analytics, AI/ML, and DevOps.
 

Retaining data streams up to one year with Amazon Kinesis Data Streams

Post Syndicated from Nihar Sheth original https://aws.amazon.com/blogs/big-data/retaining-data-streams-up-to-one-year-with-amazon-kinesis-data-streams/

Streaming data is used extensively for use cases like sharing data between applications, streaming ETL (extract, transform, and load), real-time analytics, processing data from internet of things (IoT) devices, application monitoring, fraud detection, live leaderboards, and more. Typically, data streams are stored for short durations of time before being loaded into a permanent data store like a data lake or analytics service.

Additional use cases are becoming more prevalent that may require you retain data in streams for longer periods of time. For example, compliance programs like HIPAA and FedRAMP may require you to store raw data for more than a few days or weeks, or you may want to backtest machine learning (ML) algorithms with historical data that may be several months old.

A challenge arises when you want to process historical data and newly arriving data streams. This requires complex logic to access your data lake and your data stream store, or two sets of code—one to process data from your data lake and one to process your new data streams.

Amazon Kinesis Data Streams solves this challenge by storing your data streams up to 1 year with long-term retention. You can use the same Kinesis Data Streams code base to process both historical and newly arriving data streams, and continue to use features like enhanced fan-out to read large data volumes at very high throughput.

In this post, we describe how long-term retention enables new use cases by bridging real-time and historical data processing. We also demonstrate how you can reduce the time to retrieve 30 days of data from a data stream by an order of magnitude using Kinesis Data Streams enhanced fan-out.

Simple setup, no resource provisioning

Kinesis Data Streams durably stores all data stream records in a shard, an append-only log ordered by arrival time. The time period from when a record is added to when it’s no longer accessible is called the retention period. A Kinesis data stream stores records for 24 hours by default, up to 365 days (8,760 hours). Applications can start reading data at any point in the retention period in the exact order in which the data stream is stored. Shards enable these applications to process data in parallel and at low-latency.

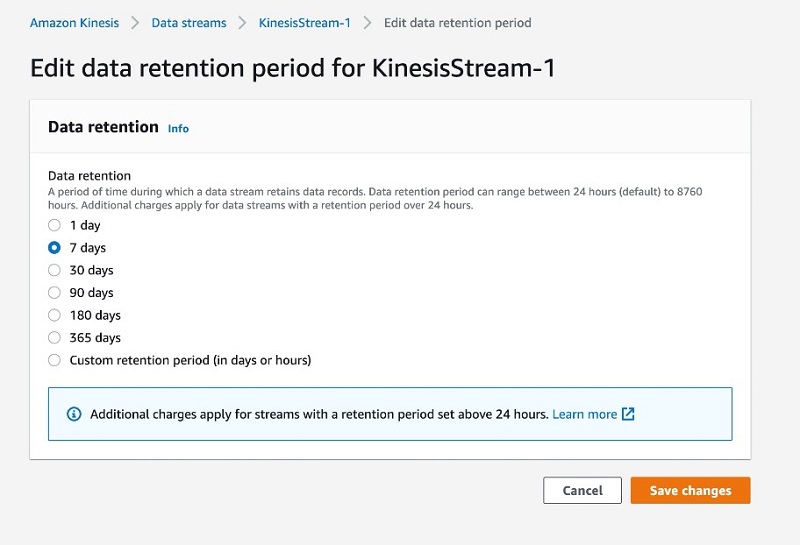
You can select a preset retention period or define a custom retention period in days or hours using the Kinesis Data Streams console, as in the following screenshot.

You can select a preset retention period or define a custom retention period in days or hours using the Kinesis Data Streams console, as in the following screenshot.

The default retention period is 24 hours and covers scenarios where intermittent lags in processing need to catch up with the real-time data. You can extend retention up to 7 days to reprocess slightly aged data to resolve potential downstream data losses. You can also use long-term retention to store data for more than 7 days and up to 365 days to reprocess historical data for use cases like algorithm backtesting, data store backfills, and auditing. For more information, see Changing the Data Retention Period.

Similarly, you can use the following AWS Command Line Interface (AWS CLI) command to set the retention period in hours (the following code sets it to 9 days, or 216 hours):

aws kinesis increase-stream-retention-period \
    --stream-name samplestream \
    --retention-period-hours 216

Read new and historical data, no code changes necessary

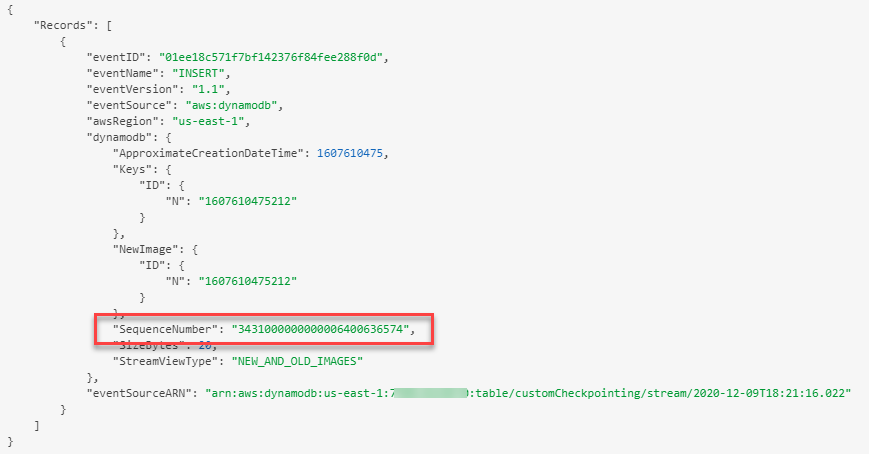
All the data captured in the stream is stored in a durable, encrypted, and secure manner for the specified retention period up to a maximum of 1 year. You can store any amount of data, retrieve it by specifying a start position, and read sequentially using the familiar getRecords and SubscribeToShard APIs. The start position can be the sequence number of a data record in a shard or a timestamp. This enables you to use the same code to process older data. You can set up multiple consuming applications to start processing data at different points in the data stream.

Speed up data reads using enhanced fan-out consumers

Kinesis Data Streams provides two types of models to consume data: shared throughput consumer and enhanced fan-out (EFO) consumer. In the shared throughput consumer model, all the consuming applications share 2 MB/s per shard read throughput and a 5 transactions per second (TPS) quota. In the enhanced fan-out model, each consumer gets a dedicated read throughput of 2MB/s per shard. Because it uses an HTTP/2 data retrieval API, there is no longer a limit of 5 TPS. You can attach up to 20 EFO consumers to a single stream and read data at a total rate of 40MB/s per shard. Because each consumer gets dedicated read throughput, processing one doesn’t impact another. So you can attach new consumers to process old data without worrying about the performance of the existing consumer processing real-time data. For example, you can retrain an ML model in an ad hoc fashion without impacting real-time workflows.

You can add and remove EFO consumers at any time and avoid paying for over-provisioned resources. For example, when backtesting, you can register EFO consumers before the test and remove them after completion. You’re only charged for resources used during the test. Also, you can use EFO consumers to accelerate the speed of processing. Each consuming application can process different parts of streams across the retention period to process all the data in parallel, thereby dramatically reducing the total processing time.

Clickstream pipeline use case

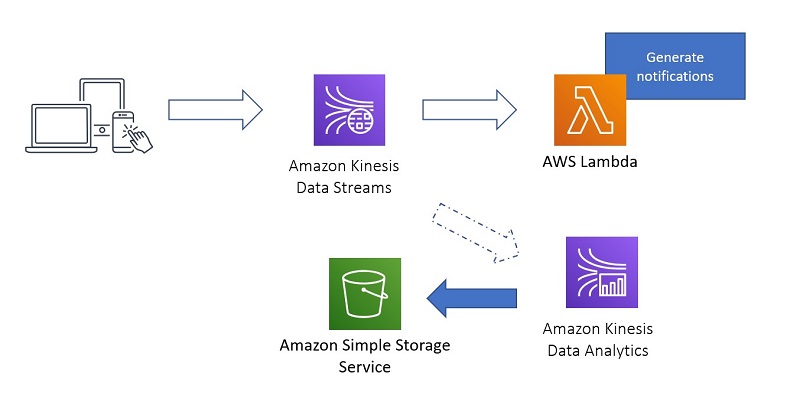
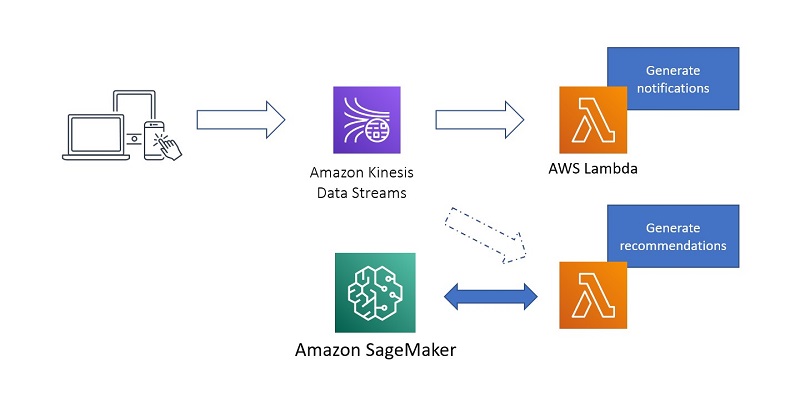
Let’s look at a clickstream use case to see how this works for an existing streaming pipeline like the one in the following diagram.

Let’s look at a clickstream use case to see how this works for an existing streaming pipeline like the one in the following diagram.

This pipeline takes clickstream data and creates an alert every time a user leaves your ecommerce site without purchasing the items in their cart. A simple pipeline like this is a great way to start with stream processing, but soon you may want to implement a recommendation system based on user activity on your website and mobile app. To do this, you need to gather historical data in your existing data stream and send it to Amazon Simple Storage Service (Amazon S3) so it can be used for training a recommendation ML model. This scenario illustrates a key benefit of enabling long-term retention: it gives you the flexibility to “go back in time” and replay the existing data in your stream to generate new analytics that you may not have considered when you initially set up the streaming pipeline.

Let’s say you enabled 30 days of retention on your Kinesis data stream. After you train your ML model, you can set up a new streaming pipeline that generates recommendations by calling an inference endpoint hosted on Amazon SageMaker based on the trained ML model. The following diagram illustrates the final state of this architecture.

The following diagram illustrates the final state of this architecture.

You can efficiently and quickly consume the existing data in the stream and write it to Amazon S3 so it can be used for training your ML model. The following diagram illustrates the architecture of this intermediate pipeline to generate training data.

The following diagram illustrates the architecture of this intermediate pipeline to generate training data.

You may wonder, why read from Kinesis Data Streams and write to Amazon S3? Why not write to Amazon S3 directly without enabling long-term retention? First, ingesting into Kinesis Data Streams with long-term retention enabled gives you the flexibility to generate additional streaming analytics as time passes. Second, this gives you the flexibility to filter and transform the data being read from Kinesis Data Streams before generating analytics or writing to Amazon S3. Lastly, you can use this approach to render analytics onto other systems besides Amazon S3, such as Amazon Elasticsearch Service (Amazon ES) using the Elasticsearch sink for Apache Flink.

Keep in mind that we only use this pipeline to bootstrap our second, long-lived pipeline that does recommendations, but this is an important step and we need a way to do this efficiently. Although there are multiple options for consuming data from Kinesis Data Streams, Amazon Kinesis Data Analytics for Apache Flink provides an elegant way to attach multiple EFO consumers in the same consuming application.

You can find more information at the official Apache Flink website, and about Kinesis Data Analytics for Apache Flink in the Kinesis Data Analytics developer guide. Apache Flink has a number of connectors, like the recently released FlinkKinesisConsumer, which supports enhanced fan-out for consuming from Kinesis Data Streams, or the Streaming File Sink to write to Amazon S3 from your Apache Flink application.

Accelerating data consumption

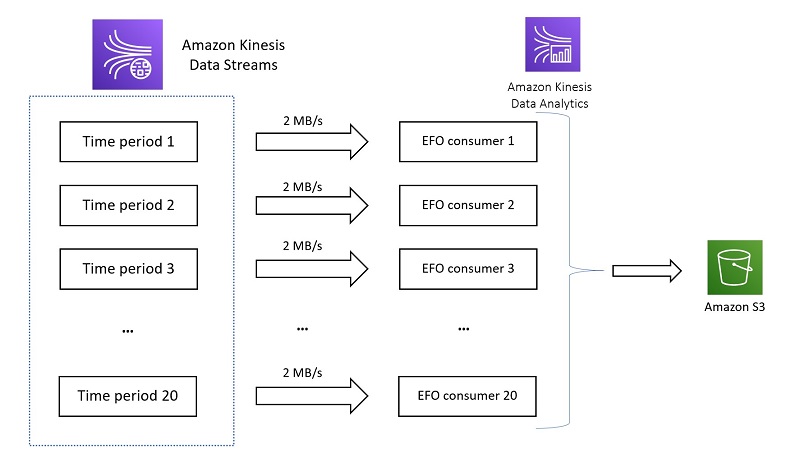
For the sake of simplicity, let’s use just one shard in our data stream, ingest data at the maximum rate of 1MB/s, and specify a retention period of 30 days. To bootstrap our new analytics, reading the full amount of data over 30 days with one EFO consumer at 2MB/s could potentially take up to 15 days to load this data into Amazon S3. However, you can accelerate this to 20 times faster using 20 EFO consumers at the same time, each reading from different points in the stream at 2 MB/s. The following diagram illustrates the architecture of multiple EFO consumers reading from multiple time slices.

The following diagram illustrates the architecture of multiple EFO consumers reading from multiple time slices.

This gives us a total of 40MB/s in consumption capacity as opposed to 2MB/s per shard with just one EFO consumer, reducing the overall time by 95%. In most use cases, this combination of Kinesis Data Analytics and EFO allows you to process 30 days of data in hours, instead of days.

A point of clarification regarding our approach: When all 20 consumers are finished reading past their respective endpoints in the stream, we stop the Apache Flink application. You can do this by raising an exception when all 20 consumers finish reading their respective time slices—effectively stopping the application. The following diagram illustrates the time savings we get from using 20 EFO consumers.

The following diagram illustrates the time savings we get from using 20 EFO consumers.

For more information about implementing this approach, see the GitHub repo.

Pricing

An additional cost is associated with long-term retention (from 7–365 days) and EFO consumers. For more information, see Amazon Kinesis Data Streams pricing. Because you can register EFO consumers on demand, you pay only for the limited time you used all 20 consumers to load data, resulting in faster loads. It’s important to point out that you pay roughly the same amount to consume a fixed volume of data from the stream with 20 EFO consumers as you do with 1 EFO consumer because of the shorter duration required when using 20 consumers. 

Summary

In this post, we discussed long-term retention use cases of Kinesis Data Streams, how to increase the retention of a data stream, and related feature enhancements with Kinesis Data Streams APIs and KCL. We took a deep dive into the Apache Flink-based enhanced-fan out consumer approach to replay long-term data quickly. We shared open-source code based on this approach so you can easily implement your use cases using Kinesis Data Streams long-term retention. 

You should use long-term retention if you’re planning to develop ML systems, generate customer behavior insights, or have compliance requirements for retaining raw data for more than 7 days. We would love to hear about your use cases with the long-term retention feature. Please submit your feedback to [email protected].


About the Authors

Nihar ShethNihar Sheth is a Senior Product Manager on the Amazon Kinesis Data Streams team at Amazon Web Services. He is passionate about developing intuitive product experiences that solve complex customer problems and enables customers to achieve their business goals. Outside of work, he is focusing on hiking 200 miles of beautiful PNW trails with his son in 2021.


Karthi Thyagarajan is a Solutions Architect on the Amazon Kinesis Team focusing on all things streaming and he enjoys helping customers tackle distributed systems challenges.


Sai Maddali is a Sr. Product Manager – Tech at Amazon Web Services where he works on Amazon Kinesis Data Streams . He is passionate about understanding customer needs, and using technology to deliver services that empowers customers to build innovative applications. Besides work, he enjoys traveling, cooking, and running.


Larry Heathcote is a Senior Product Marketing Manager at Amazon Web Services for data streaming and analytics. Larry is passionate about seeing the results of data-driven insights on business outcomes. He enjoys walking his Samoyed Sasha in the mornings so she can look for squirrels to bark at.

Updating opt-in status for Amazon Pinpoint channels

Post Syndicated from Varinder Dhanota original https://aws.amazon.com/blogs/messaging-and-targeting/updating-opt-in-status-for-amazon-pinpoint-channels/

In many real-world scenarios, customers are using home-grown or 3rd party systems to manage their campaign related information. This includes user preferences, segmentation, targeting, interactions, and more. To create customer-centric engagement experiences with such existing systems, migrating or integrating into Amazon Pinpoint is needed. Luckily, many AWS services and mechanisms can help to streamline this integration in a resilient and cost-effective way.

In this blog post, we demonstrate a sample solution that captures changes from an on-premises application’s database by utilizing AWS Integration and Transfer Services and updates Amazon Pinpoint in real-time.

If you are looking for a serverless, mobile-optimized preference center allowing end users to manage their Pinpoint communication preferences and attributes, you can also check the Amazon Pinpoint Preference Center.

Architecture

Architecture

In this scenario, users’ SMS opt-in/opt-out preferences are managed by a home-grown customer application. Users interact with the application over its web interface. The application, saves the customer preferences on a MySQL database.

This solution’s flow of events is triggered with a change (insert / update / delete) happening in the database. The change event is then captured by AWS Database Migration Service (DMS) that is configured with an ongoing replication task. This task continuously monitors a specified database and forwards the change event to an Amazon Kinesis Data Streams stream. Raw events that are buffered in this stream are polled by an AWS Lambda function. This function transforms the event, and makes it ready to be passed to Amazon Pinpoint API. This API call will in turn, change the opt-in/opt-out subscription status of the channel for that user.

Ongoing replication tasks are created against multiple types of database engines, including Oracle, MS-SQL, Postgres, and more. In this blog post, we use a MySQL based RDS instance to demonstrate this architecture. The instance will have a database we name pinpoint_demo and one table we name optin_status. In this sample, we assume the table is holding details about a user and their opt-in preference for SMS messages.

userid phone optin lastupdate
user1 +12341111111 1 1593867404
user2 +12341111112 1 1593867404
user2 +12341111113 1 1593867404

Prerequisites

  1. AWS CLI is configured with an active AWS account and appropriate access.
  2. You have an understanding of Amazon Pinpoint concepts. You will be using Amazon Pinpoint to create a segment, populate endpoints, and validate phone numbers. For more details, see the Amazon Pinpoint product page and documentation.

Setup

First, you clone the repository that contains a stack of templates to your local environment. Make sure you have configured your AWS CLI with AWS credentials. Follow the steps below to deploy the CloudFormation stack:

  1. Clone the git repository containing the CloudFormation templates:
    git clone https://github.com/aws-samples/amazon-pinpoint-rds-integration.git
    cd amazon-pinpoint-rds-integration
  2. You need an S3 Bucket to hold the template:
    aws s3 create-bucket –bucket <YOUR-BUCKET-NAME>
  3. Run the following command to package the CloudFormation templates:
    aws cloudformation package --template-file template_stack.yaml --output-template-file template_out.yaml --s3-bucket <YOUR-BUCKET-NAME>
  4. Deploy the stack with the following command:
    aws cloudformation deploy --template-file template_out.yaml --stack-name pinpointblogstack --capabilities CAPABILITY_AUTO_EXPAND CAPABILITY_NAMED_IAM

The AWS CloudFormation stack will create and configure resources for you. Some of the resources it will create are:

  • Amazon RDS instance with MySQL
  • AWS Database Migration Service replication instance
  • AWS Database Migration Service source endpoint for MySQL
  • AWS Database Migration Service target endpoint for Amazon Kinesis Data Streams
  • Amazon Kinesis Data Streams stream
  • AWS Lambda Function
  • Amazon Pinpoint Application
  • A Cloud9 environment as a bastion host

The deployment can take up to 15 minutes. You can track its progress in the CloudFormation console’s Events tab.

Populate RDS data

A CloudFormation stack will output the DNS address of an RDS endpoint and Cloud9 environment upon completion. The Cloud9 environment acts as a bastion host and allows you to reach the RDS instance endpoint deployed into the private subnet by CloudFormation.

  1. Open the AWS Console and navigate to the Cloud9 service.
    Cloud9Console
  2. Click on the Open IDE button to reach your IDE environment.
    Cloud9Env
  3. At the console pane of your IDE, type the following to login to your RDS instance. You can find the RDS Endpoint address at the outputs section of the CloudFormation stack. It is under the key name RDSInstanceEndpoint.
    mysql -h <YOUR_RDS_ENDPOINT> -uadmin -pmypassword
    use blog_db;
  4. Issue the following command to create a table that holds the user’s opt-in status:
    create table optin_status (
      userid varchar(50) not null,
      phone varchar(50) not null,
      optin tinyint default 1,
      lastupdate TIMESTAMP NOT NULL DEFAULT CURRENT_TIMESTAMP
    );
  5. Next, load sample data into the table. The following inserts nine users for this demo:
    
    INSERT INTO optin_status (userid, phone, optin) VALUES ('user1', '+12341111111', 1);
    INSERT INTO optin_status (userid, phone, optin) VALUES ('user2', '+12341111112', 1);
    INSERT INTO optin_status (userid, phone, optin) VALUES ('user3', '+12341111113', 1);
    INSERT INTO optin_status (userid, phone, optin) VALUES ('user4', '+12341111114', 1);
    INSERT INTO optin_status (userid, phone, optin) VALUES ('user5', '+12341111115', 1);
    INSERT INTO optin_status (userid, phone, optin) VALUES ('user6', '+12341111116', 1);
    INSERT INTO optin_status (userid, phone, optin) VALUES ('user7', '+12341111117', 1);
    INSERT INTO optin_status (userid, phone, optin) VALUES ('user8', '+12341111118', 1);
    INSERT INTO optin_status (userid, phone, optin) VALUES ('user9', '+12341111119', 1);
  6. The table’s opt-in column holds the SMS opt-in status and phone number for a specific user.

Start the DMS Replication Task

Now that the environment is ready, you can start the DMS replication task and start watching the changes in this table.

  1. From the AWS DMS Console, go to the Database Migration Tasks section.
    DMSMigTask
  2. Select the Migration task named blogreplicationtask.
  3. From the Actions menu, click on Restart/Resume to start the migration task. Wait until the task’s Status transitions from Ready to Starting and Replication ongoing.
  4. At this point, all the changes on the source database are replicated into a Kinesis stream. Before introducing the AWS Lambda function that will be polling this stream, configure the Amazon Pinpoint application.

Inspect the AWS Lambda Function

An AWS Lambda function has been created to receive the events. The Lambda function uses Python and Boto3 to read the records delivered by Kinesis Data Streams. It then performs the update_endpoint API calls in order to add, update, or delete endpoints in the Amazon Pinpoint application.

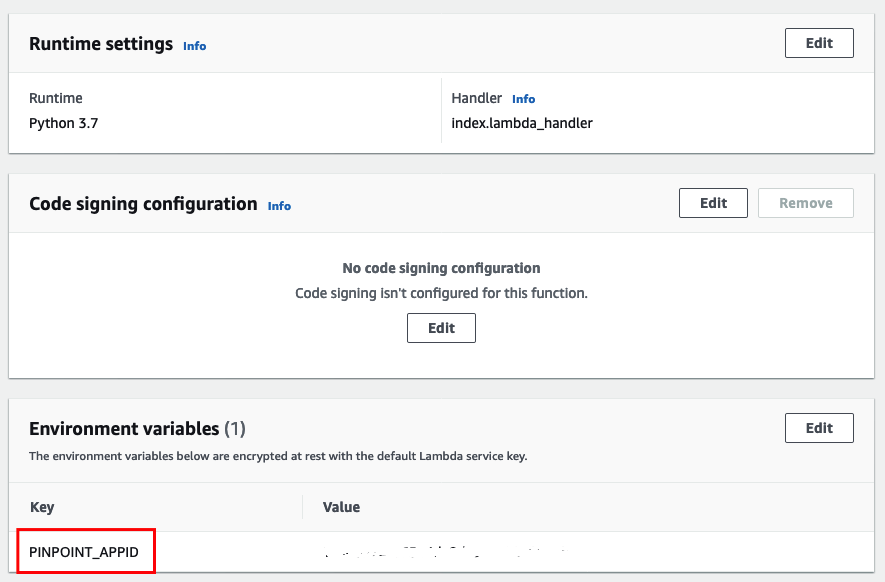
Lambda code and configuration is accessible through the Lambda Functions Console. In order to inspect the Python code, click the Functions item on the left side. Select the function starting with pinpointblogstack-MainStack by clicking on the function name.

Note: The PINPOINT_APPID under the Environment variables section. This variable provides the Lambda function with the Amazon Pinpoint application ID to make the API call.

LambdaPPAPPID

Inspect Amazon Pinpoint Application in Amazon Pinpoint Console

A Pinpoint application is needed by the Lambda Function to update the endpoints. This application has been created with an SMS Channel by the CloudFormation template. Once the data from the RDS database has been imported into Pinpoint as SMS endpoints, you can validate this import by creating a segment in Pinpoint.

PinpointProject

Testing

With the Lambda function ready, you now test the whole solution.

  1. To initiate the end-to-end test, go to the Cloud9 terminal. Perform the following SQL statement on the optin_table:
    UPDATE optin_status SET optin=0 WHERE userid='user1';
    UPDATE optin_status SET optin=0 WHERE userid='user2';
    UPDATE optin_status SET optin=0 WHERE userid='user3';
    UPDATE optin_status SET optin=0 WHERE userid='user4';
  2. This statement will cause four changes in the database which is collected by DMS and passed to Kinesis Data Streams stream.
  3. This triggers the Lambda function that construct an update_endpoint API call to the Amazon Pinpoint application.
  4. The update_endpoint operation is an upsert operation. Therefore, if the endpoint does not exist on the Amazon Pinpoint application, it creates one. Otherwise, it updates the current endpoint.
  5. In the initial dataset, all the opt-in values are 1. Therefore, these endpoints will be created with an OptOut value of NONE in Amazon Pinpoint.
  6. All OptOut=NONE typed endpoints are considered as active endpoints. Therefore, they are available to be used within segments.

Create Amazon Pinpoint Segment

  1. In order to see these changes, go to the Pinpoint console. Click on PinpointBlogApp.
    PinpointConsole
  2. Click on Segments on the left side. Then click Create a segment.
    PinpointSegment
  3. For the segment name, enter US-Segment.
  4. Select Endpoint from the Filter dropdown.
  5. Under the Choose an endpoint attribute dropdown, select Country.
  6. For Choose values enter US.
    Note: As you do this, the right panel Segment estimate will refresh to show the number of endpoints eligible for this segment filter.
  7. Click Create segment at the bottom of the page.
    PinpointSegDetails
  8. Once the new segment is created, you are directed to the newly created segment with configuration details. You should see five eligible endpoints corresponding to database table rows.
    PinpointSegUpdate
  9. Now, change one row by issuing the following SQL statement. This simulates a user opting out from SMS communication for one of their numbers.
    UPDATE optin_status SET optin=0 WHERE userid='user5';
  10. After the update, go to the Amazon Pinpoint console. Check the eligible endpoints again. You should only see four eligible endpoints.

PinpointSegUpdate

Cleanup

If you no longer want to incur further charge, delete the Cloudformation stack named pinpointblogstack. Select it and click Delete.

PinpointCleanup

Conclusion

This solution walks you through how opt-in change events are delivered from Amazon RDS to Amazon Pinpoint. You can use this solution in other use cases as well. Some examples are importing segments from a 3rd party application like Salesforce and importing other types of channels like e-mail, push, and voice. To learn more about Amazon Pinpoint, visit our website.

Validate, evolve, and control schemas in Amazon MSK and Amazon Kinesis Data Streams with AWS Glue Schema Registry

Post Syndicated from Brian Likosar original https://aws.amazon.com/blogs/big-data/validate-evolve-and-control-schemas-in-amazon-msk-and-amazon-kinesis-data-streams-with-aws-glue-schema-registry/

Data streaming technologies like Apache Kafka and Amazon Kinesis Data Streams capture and distribute data generated by thousands or millions of applications, websites, or machines. These technologies serve as a highly available transport layer that decouples the data-producing applications from data processors. However, the sheer number of applications producing, processing, routing, and consuming data can make it hard to coordinate and evolve data schemas, like adding or removing a data field, without introducing data quality issues and downstream application failures. Developers often build complex tools, write custom code, or rely on documentation, change management, and Wikis to protect against schema changes. This is quite error prone because it relies too heavily on human oversight. A common solution with data streaming technologies is a schema registry that provides for validation of schema changes to allow for safe evolution as business needs adjust over time.

AWS Glue Schema Registry, a serverless feature of AWS Glue, enables you to validate and reliably evolve streaming data against Apache Avro schemas at no additional charge. Through Apache-licensed serializers and deserializers, the Glue Schema Registry integrates with Java applications developed for Apache Kafka, Amazon Managed Streaming for Apache Kafka (Amazon MSK), Kinesis Data Streams, Apache Flink, Amazon Kinesis Data Analytics for Apache Flink, and AWS Lambda.

This post explains the benefits of using the Glue Schema Registry and provides examples of how to use it with both Apache Kafka and Kinesis Data Streams.

With the Glue Schema Registry, you can eliminate defensive coding and cross-team coordination, improve data quality, reduce downstream application failures, and use a registry that is integrated across multiple AWS services. Each schema can be versioned within the guardrails of a compatibility mode, providing developers the flexibility to reliably evolve schemas. Additionally, the Glue Schema Registry can serialize data into a compressed format, helping you save on data transfer and storage costs.

Although there are many ways to leverage the Glue Schema Registry (including using the API to build your own integrations), in this post, we show two use cases. The Schema Registry is a free feature that can significantly improve data quality and developer productivity. If you use Avro schemas, you should be using the Schema Registry to supplement your solutions built on Apache Kafka (including Amazon MSK) or Kinesis Data Streams. The following diagram illustrates this architecture.

AWS Glue Schema Registry features

Glue Schema Registry has the following features:

  • Schema discovery – When a producer registers a schema change, metadata can be applied as a key-value pair to provide searchable information for administrators or developers. This metadata can indicate the original source of the data (source=MSK_west), the team name to contact (owner=DataEngineering), or AWS tags (environment=Production). You could potentially encrypt a field in your data on the producing client and use metadata to specify to potential consumer clients which public key fingerprint to use for decryption.
  • Schema compatibility – The versioning of each schema is governed by a compatibility mode. If a new version of a schema is requested to be registered that breaks the specified compatibility mode, the request fails and an exception is thrown. Compatibility checks enable developers building downstream applications to have a bounded set of scenarios to build applications against, which helps to prepare for the changes without issue. Commonly used modes are FORWARD, BACKWARD, and FULL. For more information about mode definitions, see Schema Versioning and Compatibility.
  • Schema validation – Glue Schema Registry serializers work to validate that the schema used during data production is compatible. If it isn’t, the data producer receives an exception from the serializer. This ensures that potentially breaking changes are found earlier in development cycles, and can also help prevent unintentional schema changes due to human error.
  • Auto-registration of schemas – If configured to do so, the producer of data can auto-register schema changes as they flow in the data stream. This is especially useful for use cases where the source of the data is change data capture from a database.
  • IAM support – Thanks to integrated AWS Identity and Access Management (IAM) support, only authorized producers can change certain schemas. Furthermore, only those consumers authorized to read the schema can do so. Schema changes are typically performed deliberately and with care, so it’s important to use IAM to control who performs these changes. Additionally, access control to schemas is important in situations where you might have sensitive information included in the schema definition itself. In the examples that follow, IAM roles are inferred via the AWS SDK for Java, so they are inherited from the Amazon Elastic Compute Cloud (Amazon EC2) instance’s role that the application runs in. IAM roles can also be applied to any other AWS service that could contain this code, such as containers or Lambda functions.
  • Integrations and other support – The provided serializers and deserializers are currently for Java clients using Apache Avro for data serialization. The GitHub repo also contains support for Apache Kafka Streams, Apache Kafka Connect, and Apache Flink—all licensed using the Apache License 2.0. We’re already working on additional language and data serialization support, but we need your feedback on what you’d like to see next.
  • Secondary deserializer – If you have already registered schemas in another schema registry, there’s an option for specifying a secondary deserializer when performing schema lookups. This allows for migrations from other schema registries without having to start anew. If the schema ID being used isn’t known to the Glue Schema Registry, it’s looked for in the secondary deserializer.
  • Compression – Using the Avro format already reduces message size due to its compact, binary format. Using a schema registry can further reduce data payload by no longer needing to send and receive schemas with each message. Glue Schema Registry libraries also provide an option for zlib compression, which can reduce data requirements even further by compressing the payload of the message. This varies by use case, but compression can reduce the size of the message significantly.

Example schema

For this post, we use the following schema to begin each of our use cases:

{
 "namespace": "Customer.avro",
 "type": "record",
 "name": "Customer",
 "fields": [
 {"name": "first_name", "type": "string"},
 {"name": "last_name", "type": "string"}
 ]
}

Using AWS Glue Schema Registry with Amazon MSK and Apache Kafka

You can use the following Apache Kafka producer code to produce Apache Avro formatted messages to a topic with the preceding schema:

package com.amazon.gsrkafka;
import org.apache.kafka.clients.producer.KafkaProducer;
import org.apache.kafka.clients.producer.ProducerConfig;
import org.apache.kafka.clients.producer.ProducerRecord;
import org.apache.kafka.common.serialization.StringSerializer;
import com.amazonaws.services.schemaregistry.serializers.avro.AWSKafkaAvroSerializer;
import com.amazonaws.services.schemaregistry.serializers.avro.AWSAvroSerializer;
import com.amazonaws.services.schemaregistry.utils.AvroRecordType;
import com.amazonaws.services.schemaregistry.utils.AWSSchemaRegistryConstants;
import org.apache.kafka.common.errors.SerializationException;
import org.apache.avro.generic.GenericData;
import org.apache.avro.generic.GenericRecord;
import org.apache.avro.Schema;
import org.apache.avro.Schema.Parser;
import java.util.Properties;
import java.io.IOException;
import java.io.FileInputStream;
import java.io.InputStream;
import java.io.File;

public class gsrkafka {
private static final Properties properties = new Properties();
private static final String topic = "test";
public static void main(final String[] args) throws IOException {
// Set the default synchronous HTTP client to UrlConnectionHttpClient
System.setProperty("software.amazon.awssdk.http.service.impl", "software.amazon.awssdk.http.urlconnection.UrlConnectionSdkHttpService");
properties.put(ProducerConfig.BOOTSTRAP_SERVERS_CONFIG, "localhost:9092");
properties.put(ProducerConfig.KEY_SERIALIZER_CLASS_CONFIG, AWSKafkaAvroSerializer.class.getName());
properties.put(ProducerConfig.VALUE_SERIALIZER_CLASS_CONFIG, AWSKafkaAvroSerializer.class.getName());
properties.put(AWSSchemaRegistryConstants.AWS_REGION, "us-east-2");
properties.put(AWSSchemaRegistryConstants.REGISTRY_NAME, "liko-schema-registry");
properties.put(AWSSchemaRegistryConstants.SCHEMA_NAME, "customer");
properties.put(AWSSchemaRegistryConstants.COMPATIBILITY_SETTING, Compatibility.FULL);
properties.put(AWSSchemaRegistryConstants.SCHEMA_AUTO_REGISTRATION_SETTING, true);
Schema schema_customer = new Parser().parse(new File("Customer.avsc"));
GenericRecord customer = new GenericData.Record(schema_customer);

try (KafkaProducer<String, GenericRecord> producer = new KafkaProducer<String, GenericRecord>(properties)) {
final ProducerRecord<String, GenericRecord> record = new ProducerRecord<String, GenericRecord>(topic, customer);
customer.put("first_name", "Ada");
customer.put("last_name", "Lovelace");
customer.put("full_name", "Ada Lovelace");
producer.send(record);
System.out.println("Sent message");
Thread.sleep(1000L);

customer.put("first_name", "Sue");
customer.put("last_name", "Black");
customer.put("full_name", "Sue Black");
producer.send(record);
System.out.println("Sent message");
Thread.sleep(1000L);

customer.put("first_name", "Anita");
customer.put("last_name", "Borg");
customer.put("full_name", "Anita Borg");
producer.send(record);
System.out.println("Sent message");
Thread.sleep(1000L);

customer.put("first_name", "Grace");
customer.put("last_name", "Hopper");
customer.put("full_name", "Grace Hopper");
producer.send(record);
System.out.println("Sent message");
Thread.sleep(1000L);

customer.put("first_name", "Neha");
customer.put("last_name", "Narkhede");
customer.put("full_name", "Neha Narkhede");
producer.send(record);
System.out.println("Sent message");
Thread.sleep(1000L);
producer.flush();
System.out.println("Successfully produced 5 messages to a topic called " + topic);
} catch (final InterruptedException | SerializationException e) {
e.printStackTrace();
}
}
}

Use the following Apache Kafka consumer code to look up the schema information while consuming from a topic to learn the schema details:

package com.amazon.gsrkafka;
import org.apache.kafka.clients.consumer.KafkaConsumer;
import org.apache.kafka.clients.consumer.ConsumerRecords;
import org.apache.kafka.clients.consumer.ConsumerConfig;
import org.apache.kafka.clients.consumer.ConsumerRecord;
import org.apache.kafka.common.serialization.StringDeserializer;
import com.amazonaws.services.schemaregistry.deserializers.avro.AWSKafkaAvroDeserializer;
import com.amazonaws.services.schemaregistry.deserializers.avro.AWSAvroDeserializer;
import com.amazonaws.services.schemaregistry.utils.AvroRecordType;
import com.amazonaws.services.schemaregistry.utils.AWSSchemaRegistryConstants;
import org.apache.kafka.common.errors.SerializationException;
import org.apache.avro.generic.GenericData;
import org.apache.avro.generic.GenericRecord;
import java.util.Collections;
import java.util.Properties;
import java.io.IOException;
import java.io.FileInputStream;
import java.io.InputStream;
import java.io.File;


public class gsrkafka {
private static final Properties properties = new Properties();
private static final String topic = "test";
public static void main(final String[] args) throws IOException {
// Set the default synchronous HTTP client to UrlConnectionHttpClient
System.setProperty("software.amazon.awssdk.http.service.impl", "software.amazon.awssdk.http.urlconnection.UrlConnectionSdkHttpService");
properties.put(ConsumerConfig.BOOTSTRAP_SERVERS_CONFIG, "localhost:9092");
properties.put(ConsumerConfig.GROUP_ID_CONFIG, "gsr-client");
properties.put(ConsumerConfig.AUTO_OFFSET_RESET_CONFIG, "earliest");
properties.put(ConsumerConfig.KEY_DESERIALIZER_CLASS_CONFIG, AWSKafkaAvroDeserializer.class.getName());
properties.put(ConsumerConfig.VALUE_DESERIALIZER_CLASS_CONFIG, AWSKafkaAvroDeserializer.class.getName());
properties.put(AWSSchemaRegistryConstants.AWS_REGION, "us-east-2");
properties.put(AWSSchemaRegistryConstants.REGISTRY_NAME, "liko-schema-registry");
properties.put(AWSSchemaRegistryConstants.AVRO_RECORD_TYPE, AvroRecordType.GENERIC_RECORD.getName());

try (final KafkaConsumer<String, GenericRecord> consumer = new KafkaConsumer<String, GenericRecord>(properties)) {
consumer.subscribe(Collections.singletonList(topic));
while (true) {
final ConsumerRecords<String, GenericRecord> records = consumer.poll(1000);
for (final ConsumerRecord<String, GenericRecord> record : records) {
final GenericRecord value = record.value();
System.out.println("Received message: value = " + value);
}
			}
} catch (final SerializationException e) {
e.printStackTrace();
}
}
}

Using AWS Glue Schema Registry with Kinesis Data Streams

You can use the following Kinesis Producer Library (KPL) code to publish messages in Apache Avro format to a Kinesis data stream with the preceding schema:

private static final String SCHEMA_DEFINITION = "{"namespace": "Customer.avro",\n"
+ " "type": "record",\n"
+ " "name": "Customer",\n"
+ " "fields": [\n"
+ " {"name": "first_name", "type": "string"},\n"
+ " {"name": "last_name", "type": "string"}\n"
+ " ]\n"
+ "}";

KinesisProducerConfiguration config = new KinesisProducerConfiguration();
config.setRegion("us-west-1")

//[Optional] configuration for Schema Registry.

GlueSchemaRegistryConfiguration schemaRegistryConfig = 
new GlueSchemaRegistryConfiguration("us-west-1");

schemaRegistryConfig.setCompression(true);

config.setGlueSchemaRegistryConfiguration(schemaRegistryConfig);

///Optional configuration ends.

final KinesisProducer producer = 
new KinesisProducer(config);

final ByteBuffer data = getDataToSend();

com.amazonaws.services.schemaregistry.common.Schema gsrSchema = 
new Schema(SCHEMA_DEFINITION, DataFormat.AVRO.toString(), "demoSchema");

ListenableFuture<UserRecordResult> f = producer.addUserRecord(
config.getStreamName(), TIMESTAMP, Utils.randomExplicitHashKey(), data, gsrSchema);

private static ByteBuffer getDataToSend() {
org.apache.avro.Schema avroSchema = 
new org.apache.avro.Schema.Parser().parse(SCHEMA_DEFINITION);

GenericRecord user = new GenericData.Record(avroSchema);
user.put("name", "Emily");
user.put("favorite_number", 32);
user.put("favorite_color", "green");

ByteArrayOutputStream outBytes = new ByteArrayOutputStream();
Encoder encoder = EncoderFactory.get().directBinaryEncoder(outBytes, null);
new GenericDatumWriter<>(avroSchema).write(user, encoder);
encoder.flush();
return ByteBuffer.wrap(outBytes.toByteArray());
}

On the consumer side, you can use the Kinesis Client Library (KCL) (v2.3 or later) to look up schema information while retrieving messages from a Kinesis data stream:

GlueSchemaRegistryConfiguration schemaRegistryConfig = 
new GlueSchemaRegistryConfiguration(this.region.toString());

 GlueSchemaRegistryDeserializer glueSchemaRegistryDeserializer = 
new GlueSchemaRegistryDeserializerImpl(DefaultCredentialsProvider.builder().build(), schemaRegistryConfig);

 RetrievalConfig retrievalConfig = configsBuilder.retrievalConfig().retrievalSpecificConfig(new PollingConfig(streamName, kinesisClient));
 retrievalConfig.glueSchemaRegistryDeserializer(glueSchemaRegistryDeserializer);
 
Scheduler scheduler = new Scheduler(
configsBuilder.checkpointConfig(),
configsBuilder.coordinatorConfig(),
configsBuilder.leaseManagementConfig(),
configsBuilder.lifecycleConfig(),
configsBuilder.metricsConfig(),
configsBuilder.processorConfig(),
retrievalConfig
);

 public void processRecords(ProcessRecordsInput processRecordsInput) {
MDC.put(SHARD_ID_MDC_KEY, shardId);
try {
log.info("Processing {} record(s)", 
processRecordsInput.records().size());
processRecordsInput.records()
.forEach(
r -> 
log.info("Processed record pk: {} -- Seq: {} : data {} with schema: {}", 
r.partitionKey(), r.sequenceNumber(), recordToAvroObj(r).toString(), r.getSchema()));
} catch (Throwable t) {
log.error("Caught throwable while processing records. Aborting.");
Runtime.getRuntime().halt(1);
} finally {
MDC.remove(SHARD_ID_MDC_KEY);
}
 }
 
 private GenericRecord recordToAvroObj(KinesisClientRecord r) {
byte[] data = new byte[r.data().remaining()];
r.data().get(data, 0, data.length);
org.apache.avro.Schema schema = new org.apache.avro.Schema.Parser().parse(r.schema().getSchemaDefinition());
DatumReader datumReader = new GenericDatumReader<>(schema);

BinaryDecoder binaryDecoder = DecoderFactory.get().binaryDecoder(data, 0, data.length, null);
return (GenericRecord) datumReader.read(null, binaryDecoder);
 }

Example of schema evolution

As a producer, let’s say you want to add an additional field to our schema:

{
 "namespace": "Customer.avro",
 "type": "record",
 "name": "Customer",
 "fields": [
 {"name": "first_name", "type": "string"},
 {"name": "last_name", "type": "string"},
 {"name": "full_name", "type": ["string", “null”], “default”: null}
]
}

Regardless of whether you’re following the Apache Kafka or Kinesis Data Streams example, you can use the previously provided producer code to publish new messages using this new schema version with the full_name field. This is simply a concatenation of first_name and last_name.

This schema change added an optional field (full_name), which is indicated by the type field having an option of null in addition to string with a default of null. In adding this optional field, we’ve created a schema evolution. This qualifies as a FORWARD compatible change because the producer has modified the schema and the consumer can read without updating its version of the schema. It’s a good practice to provide a default for a given field. This allows for its eventual removal if necessary. If it’s removed by the producer, the consumer uses the default that it knew for that field from before the removal.

This change is also a BACKWARD compatible change, because if the consumer changes the schema it expects to receive, it can use that default to fill in the value for the field it isn’t receiving. By being both FORWARD and BACKWARD compatible, it is therefore a FULL compatible change. The Glue Schema Registry serializers default to BACKWARD compatible, so we have to add a line declaring it as FULL.

In looking at the full option set, you may find FORWARD_ALL, BACKWARD_ALL, and FULL_ALL. These typically only come into play when you want to change data types for a field whose name you don’t change. The most common observed compatibility mode is BACKWARD, which is why it’s the default.

As a consumer application, however, you don’t want to have to recompile your application to handle the addition of a new field. If you want to reference the customer by full name, that’s your choice in your app instead of being forced to consume the new field and use it. When you consume the new messages you’ve just produced, your application doesn’t crash or have problems, because it’s still using the prior version of the schema, and that schema change is compatible with your application. To experience this in action, run the consumer code in one window and don’t interrupt it. As you run the producer application again, this time with messages following the new schema, you can still see output without issue, thanks to the Glue Schema Registry.

Conclusion

In this post, we discussed the benefits of using the Glue Schema Registry to register, validate, and evolve schemas for data streams as business needs change. We also provided examples of how to use Glue Schema Registry with Apache Kafka and Kinesis Data Streams.

For more information and to get started, see AWS Glue Schema Registry.


About the Authors

Brian Likosar is a Senior Streaming Specialist Solutions Architect at Amazon Web Services. Brian loves helping customers capture value from real-time streaming architectures, because he knows life doesn’t happen in batch. He’s a big fan of open-source collaboration, theme parks, and live music.


Larry Heathcote is a Senior Product Marketing Manager at Amazon Web Services for data streaming and analytics. Larry is passionate about seeing the results of data-driven insights on business outcomes. He enjoys walking his Samoyed Sasha in the mornings so she can look for squirrels to bark at.

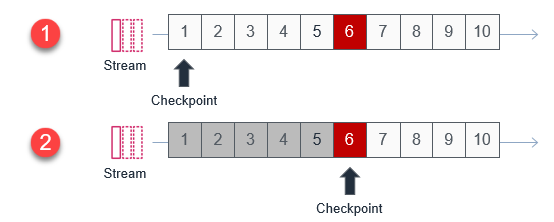


Optimizing batch processing with custom checkpoints in AWS Lambda

Post Syndicated from James Beswick original https://aws.amazon.com/blogs/compute/optimizing-batch-processing-with-custom-checkpoints-in-aws-lambda/

AWS Lambda can process batches of messages from sources like Amazon Kinesis Data Streams or Amazon DynamoDB Streams. In normal operation, the processing function moves from one batch to the next to consume messages from the stream.

However, when an error occurs in one of the items in the batch, this can result in reprocessing some of the same messages in that batch. With the new custom checkpoint feature, there is now much greater control over how you choose to process batches containing failed messages.

This blog post explains the default behavior of batch failures and options available to developers to handle this error state. I also cover how to use this new checkpoint capability and show the benefits of using this feature in your stream processing functions.

Overview

When using a Lambda function to consume messages from a stream, the batch size property controls the maximum number of messages passed in each event.

The stream manages two internal pointers: a checkpoint and a current iterator. The checkpoint is the last known item position that was successfully processed. The current iterator is the position in the stream for the next read operation. In a successful operation, here are two batches processed from a stream with a batch size of 10:

Checkpoints and current iterators

  1. The first batch delivered to the Lambda function contains items 1–10. The function processes these items without error.
  2. The checkpoint moves to item 11. The next batch delivered to the Lambda function contains items 11–20.

In default operation, the processing of the entire batch must succeed or fail. If a single item fails processing and the function returns an error, the batch fails. The entire batch is then retried until the maximum retries is reached. This can result in the same failure occurring multiple times and unnecessary processing of individual messages.

You can also enable the BisectBatchOnFunctonError property in the event source mapping. If there is a batch failure, the calling service splits the failed batch into two and retries the half-batches separately. The process continues recursively until there is a single item in a batch or messages are processed successfully. For example, in a batch of 10 messages, where item number 5 is failing, the processing occurs as follows:

Bisect batch on error processing

  1. Batch 1 fails. It’s split into batches 2 and 3.
  2. Batch 2 fails, and batch 3 succeeds. Batch 2 is split into batches 4 and 5.
  3. Batch 4 fails and batch 5 succeeds. Batch 4 is split into batches 6 and 7.
  4. Batch 6 fails and batch 7 succeeds.

While this provides a way to process messages in a batch with one failing message, it results in multiple invocations of the function. In this example, message number 4 is processed four times before succeeding.

With the new custom checkpoint feature, you can return the sequence identifier for the failed messages. This provides more precise control over how to choose to continue processing the stream. For example, in a batch of 10 messages where the sixth message fails:

Custom checkpoint behavior

  1. Lambda processes the batch of messages, items 1–10. The sixth message fails and the function returns the failed sequence identifier.
  2. The checkpoint in the stream is moved to the position of the failed message. The batch is retried for only messages 6–10.

Existing stream processing behaviors

In the following examples, I use a DynamoDB table with a Lambda function that is invoked by the stream for the table. You can also use a Kinesis data stream if preferred, as the behavior is the same. The event source mapping is set to a batch size of 10 items so all the stream messages are passed in the event to a single Lambda invocation.

Architecture diagram

I use the following Node.js script to generate batches of 10 items in the table.

const AWS = require('aws-sdk')
AWS.config.update({ region: 'us-east-1' })
const docClient = new AWS.DynamoDB.DocumentClient()

const ddbTable = 'ddbTableName'
const BATCH_SIZE = 10

const createRecords = async () => {
  // Create envelope
  const params = {
    RequestItems: {}
  }
  params.RequestItems[ddbTable] = []

  // Add items to batch and write to DDB
  for (let i = 0; i < BATCH_SIZE; i++) {
    params.RequestItems[ddbTable].push({
      PutRequest: {
        Item: {
          ID: Date.now() + i
        }
      }
    })
  }
  await docClient.batchWrite(params).promise()
}

const main = async() => await createRecords()
main()

After running this script, there are 10 items in the DynamoDB table, which are then put into the DynamoDB stream for processing.

10 items in DynamoDB table

The processing Lambda function uses the following code. This contains a constant called FAILED_MESSAGE_NUM to force an error on the message with the corresponding index in the event batch:

exports.handler = async (event) => {
  console.log(JSON.stringify(event, null, 2))
  console.log('Records: ', event.Records.length)
  const FAILED_MESSAGE_NUM = 6
  
  let recordNum = 1
  let batchItemFailures = []

  event.Records.map((record) => {
    const sequenceNumber = record.dynamodb.SequenceNumber
    
    if ( recordNum === FAILED_MESSAGE_NUM ) {
      console.log('Error! ', sequenceNumber)
      throw new Error('kaboom')
    }
    console.log('Success: ', sequenceNumber)
    recordNum++
  })
}

The code uses the DynamoDB item’s sequence number, which is provided in each record of the stream event:

Item sequence number in event

In the default configuration of the event source mapping, the failure of message 6 causes the whole batch to fail. The entire batch is then retried multiple times. This appears in the CloudWatch Logs for the function:

Logs with retried batches

Next, I enable the bisect-on-error feature in the function’s event trigger. The first invocation fails as before but this causes two subsequent invocations with batches of five messages. The original batch is bisected. These batches complete processing successfully.

Logs with bisected batches

Configuring a custom checkpoint

Finally, I enable the custom checkpoint feature. This is configured in the Lambda function console by selecting the “Report batch item failures” check box in the DynamoDB trigger:

Add trigger settings

I update the processing Lambda function with the following code:

exports.handler = async (event) => {
  console.log(JSON.stringify(event, null, 2))
  console.log('Records: ', event.Records.length)
  const FAILED_MESSAGE_NUM = 4
  
  let recordNum = 1
  let sequenceNumber = 0
    
  try {
    event.Records.map((record) => {
      sequenceNumber = record.dynamodb.SequenceNumber
  
      if ( recordNum === FAILED_MESSAGE_NUM ) {
        throw new Error('kaboom')
      }
      console.log('Success: ', sequenceNumber)
      recordNum++
    })
  } catch (err) {
    // Return failed sequence number to the caller
    console.log('Failure: ', sequenceNumber)
    return { "batchItemFailures": [ {"itemIdentifier": sequenceNumber} ]  }
  }
}

In this version of the code, the processing of each message is wrapped in a try…catch block. When processing fails, the function stops processing any remaining messages. It returns the sequence number of the failed message in a JSON object:

{ 
  "batchItemFailures": [ 
    {
      "itemIdentifier": sequenceNumber
    }
  ]
}

The calling service then updates the checkpoint value with the sequence number provided. If the batchItemFailures array is empty, the caller assumes all messages have been processed correctly. If the batchItemFailures array contains multiple items, the lowest sequence number is used as the checkpoint.

In this example, I also modify the FAILED_MESSAGE_NUM constant to 4 in the Lambda function. This causes the fourth message in every batch to throw an error. After adding 10 items to the DynamoDB table, the CloudWatch log for the processing function shows:

Lambda function logs

This is how the stream of 10 messages has been processed using the custom checkpoint:

Custom checkpointing walkthrough

  1. In the first invocation, all 10 messages are in the batch. The fourth message throws an error. The function returns this position as the checkpoint.
  2. In the second invocation, messages 4–10 are in the batch. Message 7 throws an error and its sequence number is returned as the checkpoint.
  3. In the third invocation, the batch contains messages 7–10. Message 10 throws an error and its sequence number is now the returned checkpoint.
  4. The final invocation contains only message 10, which is successfully processed.

Using this approach, subsequent invocations do not receive messages that have been successfully processed previously.

Conclusion

The default behavior for stream processing in Lambda functions enables entire batches of messages to succeed or fail. You can also use batch bisecting functionality to retry batches iteratively if a single message fails. Now with custom checkpoints, you have more control over handling failed messages.

This post explains the three different processing modes and shows example code for handling failed messages. Depending upon your use-case, you can choose the appropriate mode for your workload. This can help reduce unnecessary Lambda invocations and prevent reprocessing of the same messages in batches containing failures.

To learn more about how to use this feature, read the developer documentation. To learn more about building with serverless technology, visit Serverless Land.

Using AWS Lambda for streaming analytics

Post Syndicated from James Beswick original https://aws.amazon.com/blogs/compute/using-aws-lambda-for-streaming-analytics/

AWS Lambda now supports streaming analytics calculations for Amazon Kinesis and Amazon DynamoDB. This allows developers to calculate aggregates in near-real time and pass state across multiple Lambda invocations. This feature provides an alternative way to build analytics in addition to services like Amazon Kinesis Data Analytics.

In this blog post, I explain how this feature works with Kinesis Data Streams and DynamoDB Streams, together with example use-cases.

Overview

For workloads using streaming data, data arrives continuously, often from different sources, and is processed incrementally. Discrete data processing tasks, such as operating on files, have a known beginning and end boundary for the data. For applications with streaming data, the processing function does not know when the data stream starts or ends. Consequently, this type of data is commonly processed in batches or windows.

Before this feature, Lambda-based stream processing was limited to working on the incoming batch of data. For example, in Amazon Kinesis Data Firehose, a Lambda function transforms the current batch of records with no information or state from previous batches. This is also the same for processing DynamoDB streams using Lambda functions. This existing approach works well for MapReduce or tasks focused exclusively on the date in the current batch.

Comparing DynamoDB and Kinesis streams

  1. DynamoDB streams invoke a processing Lambda function asynchronously. After processing, the function may then store the results in a downstream service, such as Amazon S3.
  2. Kinesis Data Firehose invokes a transformation Lambda function synchronously, which returns the transformed data back to the service.

This new feature introduces the concept of a tumbling window, which is a fixed-size, non-overlapping time interval of up to 15 minutes. To use this, you specify a tumbling window duration in the event-source mapping between the stream and the Lambda function. When you apply a tumbling window to a stream, items in the stream are grouped by window and sent to the processing Lambda function. The function returns a state value that is passed to the next tumbling window.

You can use this to calculate aggregates over multiple windows. For example, you can calculate the total value of a data item in a stream using 30-second tumbling windows:

Tumbling windows

  1. Integer data arrives in the stream at irregular time intervals.
  2. The first tumbling window consists of data in the 0–30 second range, passed to the Lambda function. It adds the items and returns the total of 6 as a state value.
  3. The second tumbling window invokes the Lambda function with the state value of 6 and the 30–60 second batch of stream data. This adds the items to the existing total, returning 18.
  4. The third tumbling window invokes the Lambda function with a state value of 18 and the next window of values. The running total is now 28 and returned as the state value.
  5. The fourth tumbling window invokes the Lambda function with a state value of 28 and the 90–120 second batch of data. The final total is 32.

This feature is useful in workloads where you need to calculate aggregates continuously. For example, for a retailer streaming order information from point-of-sale systems, it can generate near-live sales data for downstream reporting. Using Lambda to generate aggregates only requires minimal code, and the function can access other AWS services as needed.

Using tumbling windows with Lambda functions

When you configure an event source mapping between Kinesis or DynamoDB and a Lambda function, use the new setting, Tumbling window duration. This appears in the trigger configuration in the Lambda console:

Trigger configuration

You can also set this value in AWS CloudFormation and AWS SAM templates. After the event source mapping is created, events delivered to the Lambda function have several new attributes:

New attributes in events

These include:

  • Window start and end: the beginning and ending timestamps for the current tumbling window.
  • State: an object containing the state returned from the previous window, which is initially empty. The state object can contain up to 1 MB of data.
  • isFinalInvokeForWindow: indicates if this is the last invocation for the tumbling window. This only occurs once per window period.
  • isWindowTerminatedEarly: a window ends early only if the state exceeds the maximum allowed size of 1 MB.

In any tumbling window, there is a series of Lambda invocations following this pattern:

Tumbling window process in Lambda

  1. The first invocation contains an empty state object in the event. The function returns a state object containing custom attributes that are specific to the custom logic in the aggregation.
  2. The second invocation contains the state object provided by the first Lambda invocation. This function returns an updated state object with new aggregated values. Subsequent invocations follow this same sequence.
  3. The final invocation in the tumbling window has the isFinalInvokeForWindow flag set to the true. This contains the state returned by the most recent Lambda invocation. This invocation is responsible for storing the result in S3 or in another data store, such as a DynamoDB table. There is no state returned in this final invocation.

Using tumbling windows with DynamoDB

DynamoDB streams can invoke Lambda function using tumbling windows, enabling you to generate aggregates per shard. In this example, an ecommerce workload saves orders in a DynamoDB table and uses a tumbling window to calculate the near-real time sales total.

First, I create a DynamoDB table to capture the order data and a second DynamoDB table to store the aggregate calculation. I create a Lambda function with a trigger from the first orders table. The event source mapping is created with a Tumbling window duration of 30 seconds:

DynamoDB trigger configuration

I use the following code in the Lambda function:

const AWS = require('aws-sdk')
AWS.config.update({ region: process.env.AWS_REGION })
const docClient = new AWS.DynamoDB.DocumentClient()
const TableName = 'tumblingWindowsAggregation'

function isEmpty(obj) { return Object.keys(obj).length === 0 }

exports.handler = async (event) => {
    // Save aggregation result in the final invocation
    if (event.isFinalInvokeForWindow) {
        console.log('Final: ', event)
        
        const params = {
          TableName,
          Item: {
            windowEnd: event.window.end,
            windowStart: event.window.start,
            sales: event.state.sales,
            shardId: event.shardId
          }
        }
        return await docClient.put(params).promise()
    }
    console.log(event)
    
    // Create the state object on first invocation or use state passed in
    let state = event.state

    if (isEmpty (state)) {
        state = {
            sales: 0
        }
    }
    console.log('Existing: ', state)

    // Process records with custom aggregation logic

    event.Records.map((item) => {
        // Only processing INSERTs
        if (item.eventName != "INSERT") return
        
        // Add sales to total
        let value = parseFloat(item.dynamodb.NewImage.sales.N)
        console.log('Adding: ', value)
        state.sales += value
    })

    // Return the state for the next invocation
    console.log('Returning state: ', state)
    return { state: state }
}

This function code processes the incoming event to aggregate a sales attribute, and return this aggregated result in a state object. In the final invocation, it stores the aggregated value in another DynamoDB table.

I then use this Node.js script to generate random sample order data:

const AWS = require('aws-sdk')
AWS.config.update({ region: 'us-east-1' })
const docClient = new AWS.DynamoDB.DocumentClient()

const TableName = 'tumblingWindows'
const ITERATIONS = 100
const SLEEP_MS = 100

let totalSales = 0

function sleep(ms) { 
  return new Promise(resolve => setTimeout(resolve, ms));
}

const createSales = async () => {
  for (let i = 0; i < ITERATIONS; i++) {

    let sales = Math.round (parseFloat(100 * Math.random()))
    totalSales += sales
    console.log ({i, sales, totalSales})

    await docClient.put ({
      TableName,
      Item: {
        ID: Date.now().toString(),
        sales,
        ITERATIONStamp: new Date().toString()
      }
    }).promise()
    await sleep(SLEEP_MS)
  }
}

const main = async() => {
  await createSales()
  console.log('Total Sales: ', totalSales)
}

main()

Once the script is complete, the console shows the individual order transactions and the total sales:

Script output

After the tumbling window duration is finished, the second DynamoDB table shows the aggregate values calculated and stored by the Lambda function:

Aggregate values in second DynamoDB table

Since aggregation for each shard is independent, the totals are stored by shardId. If I continue to run the test data script, the aggregation function continues to calculate and store more totals per tumbling window period.

Using tumbling windows with Kinesis

Kinesis data streams can also invoke a Lambda function using a tumbling window in a similar way. The biggest difference is that you control how many shards are used in the data stream. Since aggregation occurs per shard, this controls the total number aggregate results per tumbling window.

Using the same sales example, first I create a Kinesis data stream with one shard. I use the same DynamoDB tables from the previous example, then create a Lambda function with a trigger from the first orders table. The event source mapping is created with a Tumbling window duration of 30 seconds:

Kinesis trigger configuration

I use the following code in the Lambda function, modified to process the incoming Kinesis data event:

const AWS = require('aws-sdk')
AWS.config.update({ region: process.env.AWS_REGION })
const docClient = new AWS.DynamoDB.DocumentClient()
const TableName = 'tumblingWindowsAggregation'

function isEmpty(obj) {
    return Object.keys(obj).length === 0
}

exports.handler = async (event) => {

    // Save aggregation result in the final invocation
    if (event.isFinalInvokeForWindow) {
        console.log('Final: ', event)
        
        const params = {
          TableName,
          Item: {
            windowEnd: event.window.end,
            windowStart: event.window.start,
            sales: event.state.sales,
            shardId: event.shardId
          }
        }
        console.log({ params })
        await docClient.put(params).promise()

    }
    console.log(JSON.stringify(event, null, 2))
    
    // Create the state object on first invocation or use state passed in
    let state = event.state

    if (isEmpty (state)) {
        state = {
            sales: 0
        }
    }
    console.log('Existing: ', state)

    // Process records with custom aggregation logic

    event.Records.map((record) => {
        const payload = Buffer.from(record.kinesis.data, 'base64').toString('ascii')
        const item = JSON.parse(payload).Item

        // // Add sales to total
        let value = parseFloat(item.sales)
        console.log('Adding: ', value)
        state.sales += value
    })

    // Return the state for the next invocation
    console.log('Returning state: ', state)
    return { state: state }
}

This function code processes the incoming event in the same way as the previous example. I then use this Node.js script to generate random sample order data, modified to put the data on the Kinesis stream:

const AWS = require('aws-sdk')
AWS.config.update({ region: 'us-east-1' })
const kinesis = new AWS.Kinesis()

const StreamName = 'testStream'
const ITERATIONS = 100
const SLEEP_MS = 10

let totalSales = 0

function sleep(ms) { 
  return new Promise(resolve => setTimeout(resolve, ms));
}

const createSales = async() => {

  for (let i = 0; i < ITERATIONS; i++) {

    let sales = Math.round (parseFloat(100 * Math.random()))
    totalSales += sales
    console.log ({i, sales, totalSales})

    const data = {
      Item: {
        ID: Date.now().toString(),
        sales,
        timeStamp: new Date().toString()
      }
    }

    await kinesis.putRecord({
      Data: Buffer.from(JSON.stringify(data)),
      PartitionKey: 'PK1',
      StreamName
    }).promise()
    await sleep(SLEEP_MS)
  }
}

const main = async() => {
  await createSales()
}

main()

Once the script is complete, the console shows the individual order transactions and the total sales:

Console output

After the tumbling window duration is finished, the second DynamoDB table shows the aggregate values calculated and stored by the Lambda function:

Aggregate values in second DynamoDB table

As there is only one shard in this Kinesis stream, there is only one aggregation value for all the data items in the test.

Conclusion

With tumbling windows, you can calculate aggregate values in near-real time for Kinesis data streams and DynamoDB streams. Unlike existing stream-based invocations, state can be passed forward by Lambda invocations. This makes it easier to calculate sums, averages, and counts on values across multiple batches of data.

In this post, I walk through an example that aggregates sales data stored in Kinesis and DynamoDB. In each case, I create an aggregation function with an event source mapping that uses the new tumbling window duration attribute. I show how state is passed between invocations and how to persist the aggregated value at the end of the tumbling window.

To learn more about how to use this feature, read the developer documentation. To learn more about building with serverless technology, visit Serverless Land.

Building an ad-to-order conversion engine with Amazon Kinesis, AWS Glue, and Amazon QuickSight

Post Syndicated from Gandhi Raketla original https://aws.amazon.com/blogs/big-data/building-an-ad-to-order-conversion-engine-with-aws-glue-amazon-kinesis-data-streams-and-amazon-quicksight/

Businesses in ecommerce have the challenge of measuring their ad-to-order conversion ratio for ads or promotional campaigns displayed on a webpage. Tracking the number of users that clicked on a particular promotional ad and the number of users who actually added items to their cart or placed an order helps measure the ad’s effectiveness. Utilizing promotional ads that have higher conversion rates enables you to effectively utilize limited space on your ecommerce websites and applications.

This post demonstrates how to sessionize and aggregate clickstream and order data, compute the conversion ratio in real time, and generate data visualizations. We use Amazon Kinesis Data Streams to ingest and send data to Amazon Simple Storage Service (Amazon S3), and AWS Glue, Amazon Athena, and Amazon QuickSight to catalog, analyze, and visualize the data, respectively.

Solution overview

To measure ad-to-order conversion, you need two important pieces of data: user clicks and orders. Clickstream data is captured as users navigate through the site, each time users click on the webpage, and the metadata associated with those clicks. Depending on the user base and number of active users at any moment, clickstream data can be a large amount of data generated per second. Typically, every ecommerce system has a centralized order management system that captures orders created from different channels like a web portal or mobile app. To compute an ad-to-order conversion rate, you join clickstream data and order data over time: (total number of orders/total number of clicks) *100.

The following diagram illustrates the architecture of our solution.

The solution has six main categories.

  • Data generators – Clickstream and order data is generated with the help of an AWS Lambda function. The function is triggered by a scheduled Amazon CloudWatch Events event every minute and generates random clicks for ingestion into a Kinesis data stream. Similarly, another function triggered by a CloudWatch event generates random orders for ingestion into a second data stream. In a production environment, this data comes from clickstream generators and a centralized order management system.
  • Data ingestion – Kinesis data streams ingest clickstream and order data as they are generated.
  • Data sessionization – Data sessionization helps group related data. For clickstream data, we can group clicks on an ad by different users or time periods. For order data, we can group orders by different ads. We use Amazon Kinesis Data Analytics for SQL to analyze streaming data in real time with standard SQL. Sessionized clickstream and order data is ingested into another in-application stream.
  • Data processing and storage – The sessionization stream from Kinesis Data Analytics for SQL is ingested into an Amazon Kinesis Data Firehose delivery stream, which delivers the data to a pre-configured S3 bucket.
  • Data Catalog – You use AWS Glue to crawl the clickstream and orders data in their respective S3 buckets, as well as build metadata definitions and tables in Athena. AWS Glue crawlers run every hour to update table definitions, and Athena views are built to compute the ad-to-order conversion.
  • Data visualization – You use QuickSight to generate visualizations.

Prerequisites

Before getting started, you must provision your resources with AWS CloudFormation. 

  1. Choose Launch Stack.
  1. Choose Next.
  2. For Stack name, enter a name for the stack.
  3. For Bucket Name for Clicks, enter the name of the S3 bucket that holds clickstream data (for this post, click-stream).
  4. For Bucket Name for Orders, enter the name of the S3 bucket that holds order data (order-stream).
  5. Enter any tags you wish to assign to the stack.
  6. Choose Next.
  7. Verify that the stack has been created successfully.

If you have never used QuickSight in this account before, sign up for QuickSight before moving on to the next step. Keep in mind that admin access to the Enterprise Edition QuickSight instance is needed to complete setup. 

Generating and ingesting clickstream data

On the Lambda console, view your function ingest-clickstream for ingesting clickstream data. The clickstream data attributes include UserId, Device, Event, EventType, and Timestamp. The event contains promotional ad information on the webpage clicked by the user. This function generates random clickstreams and ingests it into the data stream ClickStream. The following screenshot shows your function details on the console.

A CloudWatch Events rule invokes this function every minute. The following screenshot shows sample data that was ingested into the data stream. The Event column represents the portion of the webpage the user clicked; every click on the webpage has a unique ID and type assigned (for example, P601 has the event type Promotion, C301 has the event type Checkout).

Generating and ingesting order data

On the AWS Lambda console, view your function ingest-order for ingesting order data. This function ingests random orders.

Each order has order lines, which contain the attributes ItemId, Promotion, UnitPrice, and Quantity (see the following screenshot). The promotion attribute indicates the ad the user clicked before adding the item to their shopping cart. This function generates random orders and ingests it into OrderStream. The Promotion attribute joins clickstream data and order data.

Sessionizing the data

To sessionize the data, complete the following steps:

  1. On the Kinesis Data Analytics console, select <Stack Name>-ClickStreamApplication.
  2. Choose Run.
  3. Repeat the same step for <Stack Name>-OrderAnalysisApp.
  4. When the status changes to Running, choose the application name.
  5. Under Real time analytics, choose Go to SQL results.
  6. Choose the Real-time analytics

The application groups clicks in 1-minute intervals. Let’s take the ad P701 as an example. If this ad is clicked by multiple users, this SQL function adds all the clicks by different users in the last minute. If five users clicked on P701 in the last minute, the function outputs a ClickCount of 5. A stagger window is used because it’s well-suited for analyzing groups of data that arrive at inconsistent times.

  1. On the Kinesis Data Analytics console, choose OrderAnalysisApp.
  2. Choose Go to SQL results.
    This application groups orders by Promotion, as shown in the following screenshot.

Processing and storing the data

In the data processing and storage stage, aggregated clickstream and order data is delivered to a Kinesis Data Firehose delivery stream. Kinesis Data Firehose delivers clickstream aggregated records and orders to the click-stream and order-stream buckets, respectively. The data is partitioned by year, month, and day. The following screenshot shows the delivery streams on the console.

Analyzing the data

To analyze your data, complete the following steps:

  1. Verify that the S3 bucket was created for clickstream and orders.

The data in the bucket is partitioned by year, month, date, and hour.

  1. On the AWS Glue console, view the clickstream and orders crawlers.

These two crawlers crawl the click-stream and order-stream buckets every 15 minutes and create tables.

  1. To run the crawlers on demand, choose Run crawler.

When the crawler is finished, the Tables added column displays 1.

  1. In the navigation pane, choose Tables.
  2. Verify that the crawlers created the tables.
  3. On the Athena console, choose Saved queries.

You can see three queries have been created.

  1. Select view_clicks_aggregate to load it in the query editor.
  2. Select ad_to_order_conversion and choose Run Query.

If the Amazon S3 bucket name has -, the crawler replaces - with _ while creating the table.

  1. Replace - with _ in the table name when creating the view.
  2. Repeat the same process for view_orders_aggregate and view_conversion_ratio.

Make sure you run view_clicks_aggregate and view_orders_aggregate before running view_conversion_ratio.

  1. Choose view_conversion_ratio and choose Preview.

Orders and clicks for each promotion and the corresponding conversion ratio are displayed.

Visualizing the data

To visualize your data, you first load it into QuickSight. You can then create visualizations. In this section, we also configure a scheduled data refresh.

Loading the data

To visualize your data, you must first load your data into QuickSight.

  1. On the QuickSight console, from the Admin drop-down menu, choose Manage QuickSight.
  2. In the navigation pane, choose Security & Permissions.
  3. Choose Add or remove.
  4. Select Amazon Athena.
  5. Select Amazon S3 to edit QuickSight access to your S3 buckets.
  6. Choose the Details link next to Amazon S3.
  7. Choose Select S3 buckets.
  8. Select the bucket names you provided for clicks and orders.
  9. Choose Finish.
  10. Choose Update.
  11. Choose the QuickSight icon on the top left of the admin panel to proceed back to the home screen.
  12. In the navigation pane, choose Datasets.
  13. Choose New dataset.
  14. Choose Athena.
  15. For Data source name, enter Ad-To-Order-Conversion.
  16. Choose Validate Connection.
  17. After your connection is validated, choose Create data source.
  18. For Database, choose ad-to-order-conversion.
  19. For Tables, select view_conversion_ratio.
  20. Choose Select.
  21. Choose Visualize.

Creating visualizations

In this section, we create two visualizations of our data. We first make a horizontal bar chart.

  1. From the Add menu, choose Add Calculated Field.
  2. Enter Clicks_to_Orders.
  3. Enter the formula sum(orders)/sum(clicks).
  4. Choose Save.
  5. Choose next to Click to orders.
  6. For Show as, choose Percent.
  7. For Visual type, choose Horizontal bar chart.
  8. Drag promotion to Y-axis.
  9. Drag clicks_to_orders to Value.
  10.  Drag date to Group/Color.

The following screenshot shows our visualization.

We now make our second visualization, a vertical bar chart.

  1. Choose the + icon next to Sheet1.
  2. For Visual types, choose Vertical bar chart.
  3. Drag promotions to Y-axis.
  4. Drag clicks and orders to Value.

This graph displays clicks and orders for each promotion.

  1. Choose Insights on the left panel to see a summary of your insights.

Refreshing the data

We can also set up a scheduled refresh for our data.

  1. Choose Manage Data.
  2. Choose view_conversion_ratio.
  3. Choose Schedule refresh.
  4. Choose Create.
  5. For Repeats, choose Hourly.
  6. Choose Create.

You see a confirmation message that you configured a refresh one time per hour.

Conclusion

In this post, we showed you how to use AWS analytics and storage services to address business challenges that require handling large volumes of data. Kinesis Data Streams and Kinesis Data Analytics let you ingest large volumes of data and sessionize the data. We also showed you how to analyze and visualize the clickstream and order data using AWS Glue, Athena, and QuickSight.


About the Authors

Gandhi Raketla is a Senior Solutions Architect for AWS. He works with AWS customers and partners on cloud adoption, architecting solutions that help customers foster agility and innovation.


Nick Sack is a DevOps Consultant for AWS Professional Services. He is passionate about working with customers and building automated solutions to help customers on their cloud journeys. When not working, Nick enjoys hiking, playing soccer, reading, and learning about technology.

Building a scalable streaming data processor with Amazon Kinesis Data Streams on AWS Fargate

Post Syndicated from Florian Mair original https://aws.amazon.com/blogs/big-data/building-a-scalable-streaming-data-processor-with-amazon-kinesis-data-streams-on-aws-fargate/

Data is ubiquitous in businesses today, and the volume and speed of incoming data are constantly increasing. To derive insights from data, it’s essential to deliver it to a data lake or a data store and analyze it. Real-time or near-real-time data delivery can be cost prohibitive, therefore an efficient architecture is key for processing, and becomes more essential with growing data volume and velocity.

In this post, we show you how to build a scalable producer and consumer application for Amazon Kinesis Data Streams running on AWS Fargate. Kinesis Data Streams is a fully managed and scalable data stream that enables you to ingest, buffer, and process data in real time. AWS Fargate is a serverless compute engine for containers that works with AWS container orchestration services like Amazon Elastic Container Service (Amazon ECS), which allows us to easily run, scale, and secure containerized applications.

This solution also uses the Amazon Kinesis Producer Library (KPL) and Amazon Kinesis Client Library (KCL) to ingest data into the stream and to process it. KPL helps you optimize shard utilization in your data stream by specifying settings for aggregation and batching as data is being produced into your data stream. KCL helps you write robust and scalable consumers that can keep up with fluctuating data volumes being sent to your data stream.

The sample code for this post is available in a GitHub repo, which also includes an AWS CloudFormation template to get you started.

What is data streaming?

Before we look into the details of data streaming architectures, let’s get started with a brief overview of data streaming. Streaming data is data that is generated continuously by a large number of sources that transmit the data records simultaneously in small packages. You can use data streaming for many use cases, such as log processing, clickstream analysis, device geo-location, social media data processing, and financial trading.

A data streaming application consists of two layers: the storage layer and the processing layer. As stream storage, AWS offers the managed services Kinesis Data Streams and Amazon Managed Streaming for Apache Kafka (Amazon MSK), but you can also run stream storages like Apache Kafka or Apache Flume on Amazon Elastic Compute Cloud (Amazon EC2) or Amazon EMR. The processing layer consumes the data from the storage layer and runs computations on that data. This could be an Apache Flink application running fully managed on Amazon Kinesis Analytics for Apache Flink, an application running stream processing frameworks like Apache Spark Streaming and Apache Storm or a custom application using the Kinesis API or KCL. For this post, we use Kinesis Data Streams as the storage layer and the containerized KCL application on AWS Fargate as the processing layer.

Streaming data processing architecture

This section gives a brief introduction to the solution’s architecture, as shown in the following diagram.

The architecture consists of four components:

  • Producer group (data ingestion)
  • Stream storage
  • Consumer group (stream processing)
  • Kinesis Data Streams auto scaling

Data ingestion

For ingesting data into the data stream, you use the KPL, which aggregates, compresses, and batches data records to make the ingestion more efficient. In this architecture, the KPL increased the per-shard throughput up to 100 times, compared to ingesting the records with the PutRecord API (more on this in the Monitoring your stream and applications section). This is because the records are smaller than 1 KB each and the example code uses the KPL to buffer and send a collection of records in one HTTP request.

The record buffering can consume enough memory to crash itself; therefore, we recommend handling back-pressure. A sample on handling back-pressure is available in the KPL GitHub repo.

Not every use case is suited for using the KPL for ingestion. Due to batching and aggregation, the KPL has to buffer records, and therefore introduces some additional per-record latency. For a large number of small producers (such as mobile applications), you should use the PutRecords API to batch records or implement a proxy that handles aggregation and batching.

In this post, you set up a simple HTTP endpoint that receives data records and processes them using the KPL. The producer application runs in a Docker container, which is orchestrated by Amazon ECS on AWS Fargate. A target tracking scaling policy manages the number of parallel running data ingestion containers. It adjusts the number of running containers so you maintain an average CPU utilization of 65%.

Stream storage: Kinesis Data Streams

As mentioned earlier, you can run a variety of streaming platforms on AWS. However, for the data processor in this post, you use Kinesis Data Streams. Kinesis Data Streams is a data store where the data is held for 24 hours and configurable up to 1 year. Kinesis Data Streams is designed to be highly available and redundant by storing data across three Availability Zones in the specified Region.

The stream consists of one or more shards, which are uniquely identified sequences of data records in a stream. One shard has a maximum of 2 MB/s in reads (up to five transactions) and 1 MB/s writes per second (up to 1,000 records per second). Consumers with Dedicated Throughput (Enhanced Fan-Out) support up to 2 MB/s data egress per consumer and shard.

Each record written to Kinesis Data Streams has a partition key, which is used to group data by shard. In this example, the data stream starts with five shards. You use random generated partition keys for the records because records don’t have to be in a specific shard. Kinesis Data Streams assigns a sequence number to each data record, which is unique within the partition key. Sequence numbers generally increase over time so you can identify which record was written to the stream before or after another.

Stream processing: KCL application on AWS Fargate

This post shows you how to use custom consumers—specifically, enhanced fan-out consumers—using the KCL. Enhanced fan-out consumers have a dedicated throughput of 2 MB/s and use a push model instead of pull to get data. Records are pushed to the consumer from the Kinesis Data Streams shards using HTTP/2 Server Push, which also reduces the latency for record processing. If you have more than one instance of a consumer, each instance has a 2 MB/s fan-out pipe to each shard independent from any other consumers. You can use enhanced fan-out consumers with the AWS SDK or the KCL.

For the producer application, this example uses the KPL, which aggregates and batches records. For the consumer to be able to process these records, the application needs to deaggregate the records. To do this, you can use the KCL or the Kinesis Producer Library Deaggeragtion Modules for AWS Lambda (support for Java, Node.js, Python, and Go). The KCL is a Java library but also supports other languages via a MultiLangDaemon. The MultiLangDaemon uses STDIN and STDOUT to communicate with the record processor, so be aware of logging limitations. For this sample application, you use enhanced fan-out consumers with the KCL for Python 2.0.1.

Due to the STDOUT limitation, the record processor logs data records to a file that is written to the container logs and published to Amazon CloudWatch. If you create your own record processor, make sure it handles exceptions, otherwise records may be skipped.

The KCL creates an Amazon DynamoDB table to keep track of consumer progress. For example, if your stream has four shards and you have one producer instance, your instance runs a separate record processor for each shard. If the consumer scales to two instances, the KCL rebalances the record processor and runs two record processors on each instance. For more information, see Using the Kinesis Client Library.

A target tracking scaling policy manages the number of parallel running data processor containers. It adjusts the number of running containers to maintain an average CPU utilization of 65%.

Container configuration

The base layer of the container is Amazon Linux 2 with Python 3 and Java 8. Although you use KCL for Python, you need Java because the record processor communicates with the MultiLangDaemon of the KCL.

During the Docker image build, the Python library for the KCL (version 2.0.1 of amazon_kclpy) is installed, and the sample application (release 2.0.1) from the KCL for Python GitHub repo is cloned. This allows you to use helper tools (samples/amazon_kclpy_helper.py) so you can focus on developing the record processor. The KCL is configured via a properties file (record_processor.properties).

For logging, you have to distinguish between logging of the MultiLangDaemon and the record processor. The logging configuration for the MultiLangDaemon is specified in logback.xml, whereas the record processor has its own logger. The record processor logs to a file and not to STDOUT, because the MultiLangDaemon uses STDOUT for communication, therefore the Daemon would throw an unrecognized messages error.

Logs written to a file (app/logs/record_processor.log) are attached to container logs by a subprocess that runs in the container entry point script (run.sh). The starting script also runs set_properties_py, which uses environment variables to set the AWS Region, stream name, and application name dynamically. If you want to also change other properties, you can extend this script.

The container gets its permissions (such as to read from Kinesis Data Streams and write to DynamoDB) by assuming the role ECSTaskConsumerRole01. This sample deployment uses 2 vCPU and 4 GB memory to run the container.

Kinesis capacity management

When changes in the rate of data flow occur, you may have to increase or decrease the capacity. With Kinesis Data Streams, you can have one or more hot shards as a result of unevenly distributed partition keys, very similar to a hot key in a database. This means that a certain shard receives more traffic than others, and if it’s overloaded, it produces a ProvisionedThroughputExceededException (enable detailed monitoring to see that metric on shard level).

You need to split these hot shards to increase throughput, and merge cold shards to increase efficiency. For this post, you use random partition keys (and therefore random shard assignment) for the records, so we don’t dive deeper into splitting and merging specific shards. Instead, we show how to increase and decrease throughput capacity for the whole stream. For more information about scaling on a shard level, see Strategies for Resharding.

You can build your own scaling application utilizing the UpdateShardCount, SplitShard, and MergeShards APIs or use the custom resource scaling solution as described in Scale Amazon Kinesis Data Streams with AWS Application Auto Scaling or Amazon Kineis Scaling Utils. The Application Auto Scaling is an event-driven scaling architecture based on CloudWatch alarms, and the Scaling Utils is a Docker container that constantly monitors your data stream. The Application Auto Scaling manages the number of shards for scaling, whereas the Kinesis Scaling Utils additionally handles shard keyspace allocations, hot shard splitting, and cold shard merging. For this solution, you use the Kinesis Scaling Utils and deploy it on Amazon ECS. You can also deploy it on AWS Elastic Beanstalk as a container or on an Apache Tomcat platform.

Prerequisites

For this walkthrough, you must have an AWS account.

Solution overview

In this post, we walk through the following steps:

  1. Deploying the CloudFormation template.
  2. Sending records to Kinesis Data Streams.
  3. Monitoring your stream and applications.

Deploying the CloudFormation template

Deploy the CloudFormation stack by choosing Launch Stack:

The template launches in the US East (N. Virginia) Region by default. To launch it in a different Region, use the Region selector in the console navigation bar. The following Regions are supported:

  • US East (Ohio)
  • US West (N. California)
  • US West (Oregon)
  • Asia Pacific (Singapore)
  • Asia Pacific (Sydney)
  • Europe (Frankfurt)
  • Europe (Ireland)

Alternatively, you can download the CloudFormation template and deploy it manually. When asked to provide an IPv4 CIDR range, enter the CIDR range that can send records to your application. You can change it later on by adapting the security groups inbound rule for the Application Load Balancer.

Sending records to Kinesis Data Streams

You have several options to send records to Kinesis Data Streams. You can do it from the CLI or any API client that can send REST requests, or use a load testing solution like Distributed Load Testing on AWS or Artillery. With load testing, additional charges for requests occur; as a guideline, 10,000 requests per second for 10 minutes generate an AWS bill of less than $5.00. To do a POST request via curl, run the following command and replace ALB_ENDPOINT with the DNS record of your Application Load Balancer. You can find it on the CloudFormation stack’s Outputs tab. Ensure you have a JSON element “data”. Otherwise, the application can’t process the record.

curl --location --request POST '&lt;ALB_ENDPOINT&gt;' --header 'Content-Type: application/json' --data-raw '{"data":" This is a testing record"}'

Your Application Load Balancer is the entry point for your data records, so all traffic has to pass through it. Application Load Balancers automatically scale to the appropriate size based on traffic by adding or removing different sized load balancer nodes.

Monitoring your stream and applications

The CloudFormation template creates a CloudWatch dashboard. You can find it on the CloudWatch console or by choosing the link on the stack’s Outputs tab on the CloudFormation console. The following screenshot shows the dashboard.

This dashboard shows metrics for the producer, consumer, and stream. The metric Consumer Behind Latest gives you the offset between current time and when the last record was written to the stream. An increase in this metric means that your consumer application can’t keep up with the rate records are ingested. For more information, see Consumer Record Processing Falling Behind.

The dashboard also shows you the average CPU utilization for the consumer and producer applications, the number of PutRecords API calls to ingest data into Kinesis Data Streams, and how many user records are ingested.

Without using the KPL, you would see one PutRecord equals one user record, but in our architecture, you should see a significantly higher number of user records than PutRecords. The ratio between UserRecords and PutRecords operations strongly depends on KPL configuration parameters. For example, if you increase the value of RecordMaxBufferedTime, data records are buffered longer at the producer, more records can be aggregated, but the latency for ingestion is increased.

All three applications (including the Kinesis Data Streams scaler) publish logs to their respective log group (for example, ecs/kinesis-data-processor-producer) in CloudWatch. You can either check the CloudWatch logs of the Auto Scaling Application or the data stream metrics to see the scaling behavior of Kinesis Data Streams.

Cleaning up

To avoid additional cost, ensure that the provisioned resources are decommissioned. To do that, delete the images in the Amazon Elastic Container Registry (Amazon ECR) repository, the CloudFormation stack, and any remaining resources that the CloudFormation stack didn’t automatically delete. Additionally, delete the DynamoDB table DataProcessorConsumer, which the KCL created.

Conclusion

In this post, you saw how to run the KCL for Python on AWS Fargate to consume data from Kinesis Data Streams. The post also showed you how to scale the data production layer (KPL), data storage layer (Kinesis Data Streams), and the stream processing layer (KCL). You can build your own data streaming solution by deploying the sample code from the GitHub repo. To get started with Kinesis Data Streams, see Getting Started with Amazon Kinesis Data Streams.


About the Author

Florian Mair is a Solutions Architect at AWS.He is a t echnologist that helps customers in Germany succeed and innovate by solving business challenges using AWS Cloud services. Besides working as a Solutions Architect, Florian is a passionate mountaineer, and has climbed some of the highest mountains across Europe.

Real-Time In-Stream Inference with AWS Kinesis, SageMaker & Apache Flink

Post Syndicated from Shawn Sachdev original https://aws.amazon.com/blogs/architecture/realtime-in-stream-inference-kinesis-sagemaker-flink/

As businesses race to digitally transform, the challenge is to cope with the amount of data, and the value of that data diminishes over time. The challenge is to analyze, learn, and infer from real-time data to predict future states, as well as to detect anomalies and get accurate results. In this blog post, we’ll explain the architecture for a solution that can achieve real-time inference on streaming data. We’ll also cover the integration of Amazon Kinesis Data Analytics (KDA) with Apache Flink to asynchronously invoke any underlying services (or databases).

Managed real-time in-stream data inference is quite a mouthful; let’s break it up:

  • In-stream data refers to the capability of processing a data stream that collects, processes, and analyzes data.
  • Real-time inference refers to the ability to use data from the feed to project future state for the underlying data.

Consider a streaming application that captures credit card transactions along with the other parameters (such as source IP to capture the geographic details of the transaction as well as the  amount). This data can then be used to be used to infer fraudulent transactions instantaneously. Compare that to a traditional batch-oriented approach that identifies fraudulent transactions at the end of every business day and generates a report when it’s too late, after bad actors have already committed fraud.

Architecture overview

In this post, we discuss how you can use Amazon Kinesis Data Analytics for Apache Flink (KDA), Amazon SageMaker, Apache Flink, and Amazon API Gateway to address the challenges such as real-time fraud detection on a stream of credit card transaction data. We explore how to build a managed, reliable, scalable, and highly available streaming architecture based on managed services that substantially reduce the operational overhead compared to a self-managed environment. Our particular focus is on how to prepare and run Flink applications with KDA for Apache Flink applications.

The following diagram illustrates this architecture:

Run Apache Flink applications with KDA for Apache Flink applications

In above architecture, data is ingested in AWS Kinesis Data Streams (KDS) using Amazon Kinesis Producer Library (KPL), and you can use any ingestion patterns supported by KDS. KDS then streams the data to an Apache Flink-based KDA application. KDA manages the required infrastructure for Flink, scales the application in response to changing traffic patterns, and automatically recovers from underlying failures. The Flink application is configured to call an API Gateway endpoint using Asynchronous I/O. Residing behind the API Gateway is an AWS SageMaker endpoint, but any endpoints can be used based on your data enrichment needs. Flink distributes the data across one or more stream partitions, and user-defined operators can transform the data stream.

Let’s talk about some of the key pieces of this architecture.

What is Apache Flink?

Apache Flink is an open source distributed processing framework that is tailored to stateful computations over unbounded and bounded datasets. The architecture uses KDA with Apache Flink to run in-stream analytics and uses Asynchronous I/O operator to interact with external systems.

KDA and Apache Flink

KDA for Apache Flink is a fully managed AWS service that enables you to use an Apache Flink application to process streaming data. With KDA for Apache Flink, you can use Java or Scala to process and analyze streaming data. The service enables you to author and run code against streaming sources. KDA provides the underlying infrastructure for your Flink applications. It handles core capabilities like provisioning compute resources, parallel computation, automatic scaling, and application backups (implemented as checkpoints and snapshots).

Flink Asynchronous I/O Operator

Flink Asynchronous I/O Operator

Flink’s Asynchronous I/O operator allows you to use asynchronous request clients for external systems to enrich stream events or perform computation. Asynchronous interaction with the external system means that a single parallel function instance can handle multiple requests and receive the responses concurrently. In most cases this leads to higher streaming throughput. Asynchronous I/O API integrates well with data streams, and handles order, event time, fault tolerance, etc. You can configure this operator to call external sources like databases and APIs. The architecture pattern explained in this post is configured to call API Gateway integrated with SageMaker endpoints.

Please refer code at kda-flink-ml, a sample Flink application with implementation of Asynchronous I/O operator to call an external Sagemaker endpoint via API Gateway. Below is the snippet of code of StreamingJob.java from sample Flink application.

DataStream<HttpResponse<RideRequest>> predictFareResponse =
            // Asynchronously call predictFare Endpoint
            AsyncDataStream.unorderedWait(
                predictFareRequests,
                new Sig4SignedHttpRequestAsyncFunction<>(predictFareEndpoint, apiKeyHeader),
                30, TimeUnit.SECONDS, 20
            )
            .returns(newTypeHint<HttpResponse<RideRequest>() {});

The operator code above requires following inputs:

  1. An input data stream
  2. An implementation of AsyncFunction that dispatches the requests to the external system
  3. Timeout, which defines how long an asynchronous request may take before it considered failed
  4. Capacity, which defines how many asynchronous requests may be in progress at the same time

How Amazon SageMaker fits into this puzzle

In our architecture we are proposing a SageMaker endpoint for inferencing that is invoked via API Gateway, which can detect fraudulent transactions.

Amazon SageMaker is a fully managed service that provides every developer and data scientist with the ability to build, train, and deploy machine learning (ML) models quickly. SageMaker removes the heavy lifting from each step of the machine learning process to make it easier to build and develop high quality models. You can use these trained models in an ingestion pipeline to make real-time inferences.

You can set up persistent endpoints to get predictions from your models that are deployed on SageMaker hosting services. For an overview on deploying a single model or multiple models with SageMaker hosting services, see Deploy a Model on SageMaker Hosting Services.

Ready for a test drive

To help you get started, we would like to introduce an AWS Solution: AWS Streaming Data Solution for Amazon Kinesis (Option 4) that is available as a single-click cloud formation template to assist you in quickly provisioning resources to get your real-time in-stream inference pipeline up and running in a few minutes. In this solution we leverage AWS Lambda, but that can be switched with a SageMaker endpoint to achieve the architecture discussed earlier in this post. You can also leverage the pre-built AWS Solutions Construct, which implements an Amazon API Gateway connected to an Amazon SageMaker endpoint pattern that can replace AWS Lambda in the below solution. See the implementation guide for this solution.

The following diagram illustrates the architecture for the solution:

architecture for the solution

Conclusion

In this post we explained the architecture to build a managed, reliable, scalable, and highly available application that is capable of real-time inferencing on a data stream. The architecture was built using KDS, KDA for Apache Flink, Apache Flink, and Amazon SageMaker. The architecture also illustrates how you can use managed services so that you don’t need to spend time provisioning, configuring, and managing the underlying infrastructure. Instead, you can spend your time creating insights and inference from your data.

We also talked about the AWS Streaming Data Solution for Amazon Kinesis, which is an AWS vetted solution that provides implementations for applications you can automatically deploy directly into your AWS account. The solution automatically configures the AWS services necessary to easily capture, store, process, and infer from streaming data.

Migrating from Vertica to Amazon Redshift

Post Syndicated from Seetha Sarma original https://aws.amazon.com/blogs/big-data/migrating-from-vertica-to-amazon-redshift/

Amazon Redshift powers analytical workloads for Fortune 500 companies, startups, and everything in between. With Amazon Redshift, you can query petabytes of structured and semi-structured data across your data warehouse, operational database, and your data lake using standard SQL.

When you use Vertica, you have to install and upgrade Vertica database software and manage the cluster OS and hardware. Amazon Redshift is a fully managed cloud solution; you don’t have to install and upgrade database software and manage the OS and the hardware. In this post, we discuss the best practices for migrating from a self-managed Vertica cluster to the fully managed Amazon Redshift solution. We discuss how to plan for the migration, including sizing your Amazon Redshift cluster and strategies for data placement. We look at the tools for schema conversion and see how to choose the right keys for distributing and sorting your data. We also see how to speed up the data migration to Amazon Redshift based on your data size and network connectivity. Finally, we cover how cluster management on Amazon Redshift differs from Vertica.

Migration planning

When planning your migration, start with where you want to place the data. Your business use case drives what data gets loaded to Amazon Redshift and what data remains on the data lake. In this section, we discuss how to size the Amazon Redshift cluster based on the size of the Vertica dataset that you’re moving to Amazon Redshift. We also look at the Vertica schema and decide the best data distribution and sorting strategies to use for Amazon Redshift, if you choose to do it manually.

Data placement

Amazon Redshift powers the lake house architecture, which enables you to query data across your data warehouse, data lake, and operational databases to gain faster and deeper insights not possible otherwise. In a Vertica data warehouse, you plan the capacity for all your data, whereas with Amazon Redshift, you can plan your data warehouse capacity much more efficiently. If you have a huge historical dataset being shared by multiple compute platforms, then it’s a good candidate to keep on Amazon Simple Storage Service (Amazon S3) and utilize Amazon Redshift Spectrum. Also, streaming data coming from Kafka and Amazon Kinesis Data Streams can add new files to an existing external table by writing to Amazon S3 with no resource impact to Amazon Redshift. This has a positive impact on concurrency. Amazon Redshift Spectrum is good for heavy scan and aggregate work. For tables that are frequently accessed from a business intelligence (BI) reporting or dashboarding interface and for tables frequently joined with other Amazon Redshift tables, it’s optimal to have tables loaded in Amazon Redshift.

Vertica has Flex tables to handle JSON data. You don’t need to load the JSON data to Amazon Redshift. You can use external tables to query JSON data stored on Amazon S3 directly from Amazon Redshift. You create external tables in Amazon Redshift within an external schema.

Vertica users typically create a projection on a Vertica table to optimize for a particular query. If necessary, use materialized views in Amazon Redshift. Vertica also has aggregate projection, which acts like a synchronized materialized view. With materialized views in Amazon Redshift, you can store the pre-computed results of queries and efficiently maintain them by incrementally processing the latest changes made to the source tables. Subsequent queries referencing the materialized views use the pre-computed results to run much faster. You can create materialized views based on one or more source tables using filters, inner joins, aggregations, grouping, functions, and other SQL constructs.

Cluster sizing

When you create a cluster on the Amazon Redshift console, you can get a recommendation of your cluster configuration based on the size of your data and query characteristics (see the following screenshot).

Amazon Redshift offers different node types to accommodate your workloads. We recommend using RA3 nodes so you can size compute and storage independently to achieve improved price and performance. Amazon Redshift takes advantage of optimizations such as data block temperature, data block age, and workload patterns to optimize performance and manage automatic data placement across tiers of storage in the RA3 clusters.

ETL pipelines and BI reports typically use temporary tables that are only valid for a session. Vertica has local and global temporary tables. If you’re using Vertica local temporary tables, no change is required during migration. Vertica local tables and Amazon Redshift temporary tables have similar behavior. They’re visible only to the session and get dropped when the session ends. Vertica global tables persist across sessions until they are explicitly dropped. If you use them now, you have to change them to permanent tables in Amazon Redshift and drop them when they’re no longer needed.

Data distribution, sorting, and compression

Amazon Redshift optimizes for performance by distributing the data across compute nodes and sorting the data. Make sure to set the sort key, distribution style, and compression encoding of the tables to take full advantage of the massively parallel processing (MPP) capabilities. The choice of distribution style and sort keys vary based on data model and access patterns. Use the data distribution and column order of the Vertica tables to help choose the distribution keys and sort keys on Amazon Redshift.

Distribution keys

Choose a column with high cardinality of evenly spread out values as the distribution key. Profile the data for the columns used for distribution keys. Vertica has segmentation that specifies how to distribute data for superprojections of a table, where the data to be hashed consists of one or more column values. The columns used in segmentation are most likely good candidates for distribution keys on Amazon Redshift. If you have multiple columns in segmentation, pick the column that provides the highest cardinality to reduce the possibility of high data skew.

Besides supporting data distribution by key, Amazon Redshift also supports other distribution styles: ALL, EVEN, and AUTO. Use ALL distribution for small dimension tables and EVEN distribution for larger tables, or use AUTO distribution, where Amazon Redshift changes the distribution style from ALL to EVEN as the table size reaches a threshold.

Sort keys

Amazon Redshift stores your data on disk in sorted order using the sort key. The Amazon Redshift query optimizer uses the sort order for optimal query plans. Review if one of raw columns used in the Vertica table’s Order By clause is the best column to use as the sort key in the Amazon Redshift table.

The order by fields in Vertica superprojections are good candidates for a sort key in Amazon Redshift, but the design criteria of sort order in Amazon Redshift is different from what you use in Vertica. In Vertica projections Order By clause, you use the low-cardinality columns with high probability of having RLE encoding before the high-cardinality columns. In Amazon Redshift, you can set the SORTKEY to AUTO, or choose a column as SORTKEY or define a compound sort key. You define compound sort keys using multiple columns, starting with the most frequently used column first. All the columns in the compound sort key are used, in the order in which they are listed, to sort the data. You can use a compound sort key when query predicates use a subset of the sort key columns in order. Amazon Redshift stores the table rows on disk in sorted order and uses metadata to track the minimum and maximum values for each 1 MB block, called a zone map. Amazon Redshift uses the zone map and the sort key for filtering the block, thereby reducing the scanning cost to efficiently handle range-restricted predicates.

Profile the data for the columns used for sort keys. Make sure the first column of the sort key is not encoded. Choose timestamp columns or columns used in frequent range filtering, equality filtering, or joins as sort keys in Amazon Redshift.

Encoding

You don’t always have to select compression encodings; Amazon Redshift automatically assigns RAW compression for columns that are defined as sort keys, AZ64 compression for the numeric and timestamp columns, and LZO compression for the VARCHAR columns. When you select compression encodings manually, choose AZ64 for numeric and date/time data stored in Amazon Redshift. AZ64 encoding has consistently better performance and compression than LZO. It has comparable compression with ZSTD but greatly better performance.

Tooling

After we decide the data placement, cluster size, partition keys, and sort keys, the next step is to look at the tooling for schema conversion and data migration.

You can use AWS Schema Conversion Tool (AWS SCT) to convert your schema, which can automate about 80% of the conversion, including the conversion of DISTKEY and SORTKEY, or you can choose to convert the Vertica DDLs to Amazon Redshift manually.

To efficiently migrate your data, you want to choose the right tools depending on the data size. If you have a dataset that is smaller than a couple of terabytes, you can migrate your data using AWS Data Migration Service (AWS DMS) or AWS SCT data extraction agents. When you have more than a few terabytes of data, your tool choice depends on your network connectivity. When there is no dedicated network connection, you can run the AWS SCT data extraction agents to copy the data to AWS Snowball Edge and ship the device back to AWS to complete the data export to Amazon S3. If you have a dedicated network connection to AWS, you can run the S3EXPORT or S3EXPORT_PARTITION commands available in Vertica 9.x directly from the Vertica nodes to copy the data in parallel to the S3 bucket.

The following diagram visualizes the migration process.

Schema conversion

AWS SCT uses extension pack schema to implement system functions of the source database that are required when writing your converted schema to your target database instance. Review the database migration assessment report for compatibility. AWS SCT can use source metadata and statistical information to determine the distribution key and sort key. AWS SCT adds a sort key in the Amazon Redshift table for the raw column used in the Vertica table’s Order By clause.

The following code is an example of Vertica CREATE TABLE and CREATE PROJECTION statements:

CREATE TABLE My_Schema.My_Table
(
    Product_id int,
    Product_name varchar(50),
    Product_type varchar(50),
    Product_category varchar(50),
    Quantity int,
    Created_at timestamp DEFAULT "sysdate"()
)
PARTITION BY (date_trunc('day', My_Table.Created_at));


CREATE PROJECTION My_Schema.My_Table_Projected
(
 Product_id ENCODING COMMONDELTA_COMP,
 Product_name,
 Product_type ENCODING RLE,
 Product_category ENCODING RLE,
 Quantity,
 Created_at ENCODING GCDDELTA
)
AS
 SELECT Product_id,
        Product_name,
        Product_type,
        Product_category,
        Quantity,
        Created_at
 FROM My_Schema.My_Table 
 ORDER BY Product_type,
          Product_category,
          Product_id,
          Product_name
SEGMENTED BY hash(Product_id) ALL NODES KSAFE 1;

The following code is the corresponding Amazon Redshift CREATE TABLE statement:

CREATE TABLE My_Schema.My_Table
(
    Product_id integer,
    Product_name varchar(50),
    Product_type varchar(50),
    Product_category varchar(50),
    Quantity integer,
    Created_at timestamp DEFAULT sysdate
)
DISTKEY (Product_id) 
SORTKEY (Created_at);

Data migration

To significantly reduce the data migration time from large Vertica clusters (if you have a dedicated network connection from your premises to AWS with good bandwidth), run the S3EXPORT or S3EXPORT_PARTITION function in Vertica 9.x, which exports the data in parallel from the Vertica nodes directly to Amazon S3.

The Parquet files generated by S3EXPORT don’t have any partition key on them, because partitioning consumes time and resources on the database where the S3EXPORT runs, which is typically the Vertica production database. The following code is one command you can use:

SELECT S3EXPORT( * USING PARAMETERS url='s3://myBucket/myTable') OVER(PARTITION BEST) FROM 
myTable;

The following code is another command option:

SELECT S3EXPORT_PARTITION(* USING PARAMETERS url='s3://mytable/bystate.date', multipart=false)
OVER (PARTITION by state, year) from myTable;

Performance

In this section, we look at best practices for ETL performance while copying the data from Amazon S3 to Amazon Redshift. We also discuss how to handle Vertica partition swapping and partition dropping scenarios in Amazon Redshift.

Copying using an Amazon S3 prefix

Make sure the ETL process is running from Amazon Elastic Compute Cloud (Amazon EC2) servers or other managed services within AWS. Exporting your data from Vertica as multiple files to Amazon S3 gives you the option to load your data in parallel to Amazon Redshift. While converting the Vertica ETL scripts, use the COPY command with an Amazon S3 object prefix to load an Amazon Redshift table in parallel from data files stored under that prefix on Amazon S3. See the following code:

copy mytable
from 's3://mybucket/data/mytable/' 
iam_role 'arn:aws:iam::<myaccount>:role/MyRedshiftRole';

Loading data using Amazon Redshift Spectrum queries

When you want to transform the exported Vertica data before loading to Amazon Redshift, or when you want to load only a subset of data into Amazon Redshift, use an Amazon Redshift Spectrum query. Create an external table in Amazon Redshift pointing to the exported Vertica data stored in Amazon S3 within an external schema. Put your transformation logic in a SELECT query, and ingest the result into Amazon Redshift using a CREATE TABLE or SELECT INTO statement:

CREATE TABLE mytable AS SELECT … FROM s3_external_schema.xxx WHERE …;

SELECT … INTO mytable FROM s3_external_schema.xxx WHERE …;

Handling Vertica partitions

Vertica has partitions, and the data loads use partition swapping and partition dropping. In Amazon Redshift, we can use the sort key, staging table, and alter table append to achieve similar results. First, the Amazon Redshift ETL job should use the sort key as filter conditions to insert the incremental data into a staging table or a temporary table in Amazon Redshift, for example the date from the MyTimeStamp column between yesterday and today. The ETL job should then delete data from the primary table that matches the filter conditions. The delete operation is very efficient in Amazon Redshift because of the sort key on the source partition column. The Amazon Redshift ETL jobs can then use alter table append to move the new data to the primary table. See the following code:

INSERT INTO stage_table select * from source_table WHERE date_trunc('day', table.MyTimestamp) BETWEEN <yesterday> AND <today>

DELETE FROM target_table_name select * from stage_table WHERE <target_table.key> = <stage_table.key>

ALTER TABLE target_table_name APPEND FROM stage_table_name 
[ IGNOREEXTRA | FILLTARGET ]

Cluster management

When a Vertica node fails, Vertica remains queryable but the performance is degraded until all the data is restored to the recovered node. When an Amazon Redshift node fails, Amazon Redshift automatically detects and replaces a failed node in your data warehouse cluster and replays the ReadOnly queries. Amazon Redshift makes your replacement node available immediately and loads your most frequently accessed data from the S3 bucket first to allow you to resume querying your data as quickly as possible.

Vertica cluster resize, similar to Amazon Redshift classic resize, takes a few hours depending on data volume to rebalance the data when nodes are added or removed. With Amazon Redshift elastic resize, the cluster resize completes within minutes. We recommend elastic resize for most use cases to shorten the cluster downtime and schedule resizes to handle seasonal spikes in your workload.

Conclusion

This post shared some best practices for migrating your data warehouse from Vertica to Amazon Redshift. It also pointed out the differences between Amazon Redshift and Vertica in handling queries, data management, cluster management, and temporary tables. Create your cluster on the Amazon Redshift console and convert your schema using AWS SCT to start your migration to Amazon Redshift. If you have any questions or comments, please share your thoughts in the comments section.


About the Authors

Seetha Sarma is a Senior Database Solutions Architect with Amazon Web Services.


Veerendra Nayak is a Senior Database Solutions Architect with Amazon Web Services.
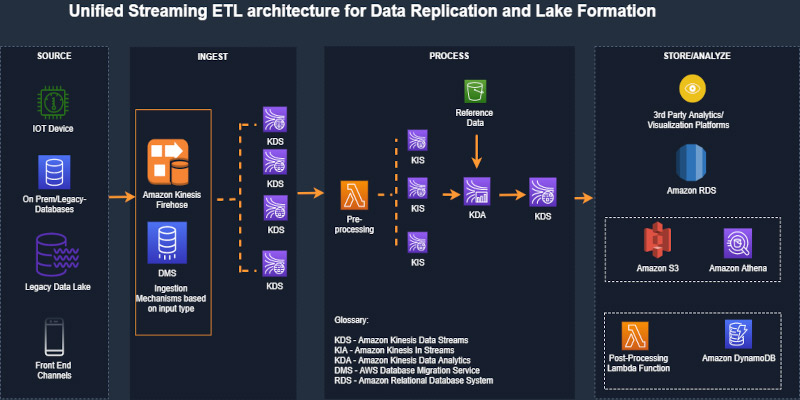
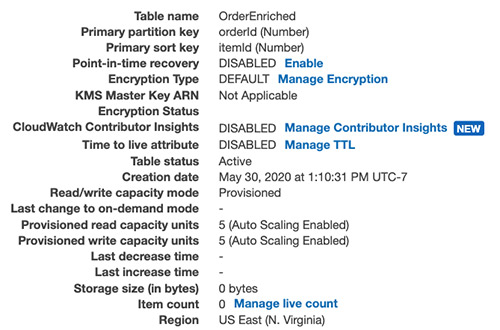
Unified serverless streaming ETL architecture with Amazon Kinesis Data Analytics

Post Syndicated from Ram Vittal original https://aws.amazon.com/blogs/big-data/unified-serverless-streaming-etl-architecture-with-amazon-kinesis-data-analytics/

Businesses across the world are seeing a massive influx of data at an enormous pace through multiple channels. With the advent of cloud computing, many companies are realizing the benefits of getting their data into the cloud to gain meaningful insights and save costs on data processing and storage. As businesses embark on their journey towards cloud solutions, they often come across challenges involving building serverless, streaming, real-time ETL (extract, transform, load) architecture that enables them to extract events from multiple streaming sources, correlate those streaming events, perform enrichments, run streaming analytics, and build data lakes from streaming events.

In this post, we discuss the concept of unified streaming ETL architecture using a generic serverless streaming architecture with Amazon Kinesis Data Analytics at the heart of the architecture for event correlation and enrichments. This solution can address a variety of streaming use cases with various input sources and output destinations. We then walk through a specific implementation of the generic serverless unified streaming architecture that you can deploy into your own AWS account for experimenting and evolving this architecture to address your business challenges.

Overview of solution

As data sources grow in volume, variety, and velocity, the management of data and event correlation become more challenging. Most of the challenges stem from data silos, in which different teams and applications manage data and events using their own tools and processes.

Modern businesses need a single, unified view of the data environment to get meaningful insights through streaming multi-joins, such as the correlation of sensory events and time-series data. Event correlation plays a vital role in automatically reducing noise and allowing the team to focus on those issues that really matter to the business objectives.

To realize this outcome, the solution proposes creating a three-stage architecture:

  • Ingestion
  • Processing
  • Analysis and visualization

The source can be a varied set of inputs comprising structured datasets like databases or raw data feeds like sensor data that can be ingested as single or multiple parallel streams. The solution envisions multiple hybrid data sources as well. After it’s ingested, the data is divided into single or multiple data streams depending on the use case and passed through a preprocessor (via an AWS Lambda function). This highly customizable processor transforms and cleanses data to be processed through analytics application. Furthermore, the architecture allows you to enrich data or validate it against standard sets of reference data, for example validating against postal codes for address data received from the source to verify its accuracy. After the data is processed, it’s sent to various sink platforms depending on your preferences, which could range from storage solutions to visualization solutions, or even stored as a dataset in a high-performance database.

The solution is designed with flexibility as a key tenant to address multiple, real-world use cases. The following diagram illustrates the solution architecture.

The architecture has the following workflow:

  1. We use AWS Database Migration Service (AWS DMS) to push records from the data source into AWS in real time or batch. For our use case, we use AWS DMS to fetch records from an on-premises relational database.
  2. AWS DMS writes records to Amazon Kinesis Data Streams. The data is split into multiple streams as necessitated through the channels.
  3. A Lambda function picks up the data stream records and preprocesses them (adding the record type). This is an optional step, depending on your use case.
  4. Processed records are sent to the Kinesis Data Analytics application for querying and correlating in-application streams, taking into account Amazon Simple Storage Service (Amazon S3) reference data for enrichment.

Solution walkthrough

For this post, we demonstrate an implementation of the unified streaming ETL architecture using Amazon RDS for MySQL as the data source and Amazon DynamoDB as the target. We use a simple order service data model that comprises orders, items, and products, where an order can have multiple items and the product is linked to an item in a reference relationship that provides detail about the item, such as description and price.

We implement a streaming serverless data pipeline that ingests orders and items as they are recorded in the source system into Kinesis Data Streams via AWS DMS. We build a Kinesis Data Analytics application that correlates orders and items along with reference product information and creates a unified and enriched record. Kinesis Data Analytics outputs output this unified and enriched data to Kinesis Data Streams. A Lambda function consumer processes the data stream and writes the unified and enriched data to DynamoDB.

To launch this solution in your AWS account, use the GitHub repo.

Prerequisites

Before you get started, make sure you have the following prerequisites:

Setting up AWS resources in your account

To set up your resources for this walkthrough, complete the following steps:

  1. Set up the AWS CDK for Java on your local workstation. For instructions, see Getting Started with the AWS CDK.
  2. Install Maven binaries for Java if you don’t have Maven installed already.
  3. If this is the first installation of the AWS CDK, make sure to run cdk bootstrap.
  4. Clone the following GitHub repo.
  5. Navigate to the project root folder and run the following commands to build and deploy:
    1. mvn compile
    2. cdk deploy UnifiedStreamETLCommonStack UnifiedStreamETLDataStack UnifiedStreamETLProcessStack

Setting up the orders data model for CDC

In this next step, you set up the orders data model for change data capture (CDC).

  1. On the Amazon Relational Database Service (Amazon RDS) console, choose Databases.
  2. Choose your database and make sure that you can connect to it securely for testing using bastion host or other mechanisms (not detailed in scope of this post).
  3. Start MySQL Workbench and connect to your database using your DB endpoint and credentials.
  4. To create the data model in your Amazon RDS for MySQL database, run orderdb-setup.sql.
  5. On the AWS DMS console, test the connections to your source and target endpoints.
  6. Choose Database migration tasks.
  7. Choose your AWS DMS task and choose Table statistics.
  8. To update your table statistics, restart the migration task (with full load) for replication.
  9. From your MySQL Workbench session, run orders-data-setup.sql to create orders and items.
  10. Verify that CDC is working by checking the Table statistics

Setting up your Kinesis Data Analytics application

To set up your Kinesis Data Analytics application, complete the following steps:

  1. Upload the product reference products.json to your S3 bucket with the logical ID prefix unifiedBucketId (which was previously created by cdk deploy).

You can now create a Kinesis Data Analytics application and map the resources to the data fields.

  1. On the Amazon Kinesis console, choose Analytics Application.
  2. Choose Create application.
  3. For Runtime, choose SQL.
  4. Connect the streaming data created using the AWS CDK as a unified order stream.
  5. Choose Discover schema and wait for it to discover the schema for the unified order stream. If discovery fails, update the records on the source Amazon RDS tables and send streaming CDC records.
  6. Save and move to the next step.
  7. Connect the reference S3 bucket you created with the AWS CDK and uploaded with the reference data.
  8. Input the following:
    1. “products.json” on the path to the S3 object
    2. Products on the in-application reference table name
  9. Discover the schema, then save and close.
  10. Choose SQL Editor and start the Kinesis Data Analytics application.
  11. Edit the schema for SOURCE_SQL_STREAM_001 and map the data resources as follows:
Column Name Column Type Row Path
orderId INTEGER $.data.orderId
itemId INTEGER $.data.orderId
itemQuantity INTEGER $.data.itemQuantity
itemAmount REAL $.data.itemAmount
itemStatus VARCHAR $.data.itemStatus
COL_timestamp VARCHAR $.metadata.timestamp
recordType VARCHAR $.metadata.table-name
operation VARCHAR $.metadata.operation
partitionkeytype VARCHAR $.metadata.partition-key-type
schemaname VARCHAR $.metadata.schema-name
tablename VARCHAR $.metadata.table-name
transactionid BIGINT $.metadata.transaction-id
orderAmount DOUBLE $.data.orderAmount
orderStatus VARCHAR $.data.orderStatus
orderDateTime TIMESTAMP $.data.orderDateTime
shipToName VARCHAR $.data.shipToName
shipToAddress VARCHAR $.data.shipToAddress
shipToCity VARCHAR $.data.shipToCity
shipToState VARCHAR $.data.shipToState
shipToZip VARCHAR $.data.shipToZip


  1. Choose Save schema and update stream samples.

When it’s complete, verify for 1 minute that nothing is in the error stream. If an error occurs, check that you defined the schema correctly.

  1. On your Kinesis Data Analytics application, choose your application and choose Real-time analytics.
  2. Go to the SQL results and run kda-orders-setup.sql to create in-application streams.
  3. From the application, choose Connect to destination.
  4. For Kinesis data stream, choose unifiedOrderEnrichedStream.
  5. For In-application stream, choose ORDER_ITEM_ENRICHED_STREAM.
  6. Choose Save and Continue.

Testing the unified streaming ETL architecture

You’re now ready to test your architecture.

  1. Navigate to your Kinesis Data Analytics application.
  2. Choose your app and choose Real-time analytics.
  3. Go to the SQL results and choose Real-time analytics.
  4. Choose the in-application stream ORDER_ITEM_ENRCIHED_STREAM to see the results of the real-time join of records from the order and order item streaming Kinesis events.
  5. On the Lambda console, search for UnifiedStreamETLProcess.
  6. Choose the function and choose Monitoring, Recent invocations.
  7. Verify the Lambda function run results.
  8. On the DynamoDB console, choose the OrderEnriched table.
  9. Verify the unified and enriched records that combine order, item, and product records.

The following screenshot shows the OrderEnriched table.

Operational aspects

When you’re ready to operationalize this architecture for your workloads, you need to consider several aspects:

  • Monitoring metrics for Kinesis Data Streams: GetRecords.IteratorAgeMilliseconds, ReadProvisionedThroughputExceeded, and WriteProvisionedThroughputExceeded
  • Monitoring metrics available for the Lambda function, including but not limited to Duration, IteratorAge, Error count and success rate (%), Concurrent executions, and Throttles
  • Monitoring metrics for Kinesis Data Analytics (millisBehindLatest)
  • Monitoring DynamoDB provisioned read and write capacity units
  • Using the DynamoDB automatic scaling feature to automatically manage throughput

We used the solution architecture with the following configuration settings to evaluate the operational performance:

  • Kinesis OrdersStream with two shards and Kinesis OrdersEnrichedStream with two shards
  • The Lambda function code does asynchronous processing with Kinesis OrdersEnrichedStream records in concurrent batches of five, with batch size as 500
  • DynamoDB provisioned WCU is 3000, RCU is 300

We observed the following results:

  • 100,000 order items are enriched with order event data and product reference data and persisted to DynamoDB
  • An average of 900 milliseconds latency from the time of event ingestion to the Kinesis pipeline to when the record landed in DynamoDB

The following screenshot shows the visualizations of these metrics.

Cleaning up

To avoid incurring future charges, delete the resources you created as part of this post (the AWS CDK provisioned AWS CloudFormation stacks).

Conclusion

In this post, we designed a unified streaming architecture that extracts events from multiple streaming sources, correlates and performs enrichments on events, and persists those events to destinations. We then reviewed a use case and walked through the code for ingesting, correlating, and consuming real-time streaming data with Amazon Kinesis, using Amazon RDS for MySQL as the source and DynamoDB as the target.

Managing an ETL pipeline through Kinesis Data Analytics provides a cost-effective unified solution to real-time and batch database migrations using common technical knowledge skills like SQL querying.


About the Authors

Ram Vittal is an enterprise solutions architect at AWS. His current focus is to help enterprise customers with their cloud adoption and optimization journey to improve their business outcomes. In his spare time, he enjoys tennis, photography, and movies.


Akash Bhatia is a Sr. solutions architect at AWS. His current focus is helping customers achieve their business outcomes through architecting and implementing innovative and resilient solutions at scale.

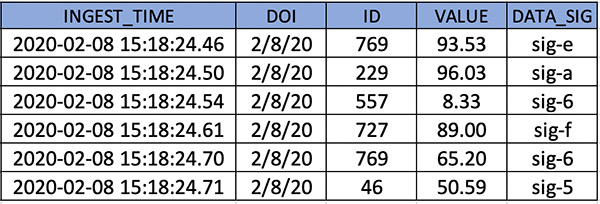


Streaming data from Amazon S3 to Amazon Kinesis Data Streams using AWS DMS

Post Syndicated from Mahesh Goyal original https://aws.amazon.com/blogs/big-data/streaming-data-from-amazon-s3-to-amazon-kinesis-data-streams-using-aws-dms/

Stream processing is very useful in use cases where we need to detect a problem quickly and improve the outcome based on data, for example production line monitoring or supply chain optimizations.

This blog post walks you through process of streaming existing data files and ongoing changes from Amazon Simple Storage Service (Amazon S3) to Amazon Kinesis. You achieve this by using AWS Database Migration Service (AWS DMS). AWS DMS enables you to seamlessly migrate data from supported sources to relational databases, data warehouses, streaming platforms, and other data stores in AWS cloud.

Many SaaS, third-party applications already integrate with Amazon S3 and can deliver records to S3 buckets. In certain use cases, you need to further process this data in near-real-time to generate alerts. Use cases like threat detection and application monitoring require generating insights in seconds. Waiting for batch processes often leads to a delay in data analysis and reduces the ability of systems to respond quickly to critical situations. For such use cases, you need a way to convert batch to stream processing by expanding the existing integrations of your applications with Amazon S3.

You can use AWS DMS for such data-processing requirements. AWS DMS lets to expand your existing application into Amazon S3 to produce data in Amazon Kinesis Data Streams for real-time analytics without writing and maintaining new code. AWS DMS supports specifying Amazon S3 as the source and streaming services like Kinesis and Amazon Managed Streaming of Kafka (Amazon MSK) as the target. AWS DMS allows migration of full and change data capture (CDC) files to these services. AWS DMS performs this task out of box without any complex configuration or code development. You can also configure an AWS DMS replication instance to scale up or down depending on the workload.

For this post, we focus on streaming data to Kinesis. We deploy an AWS CloudFormation template to get started in minutes and explore the streaming pipeline.

Architecture overview

Third-party applications such as web, API, and data-integration services produce data and log files in S3 buckets. Data lakes built on AWS process and store data in Amazon S3 at different stages. AWS DMS supports Amazon S3 as the source and Kinesis as the target, so data stored in an S3 bucket is streamed to Kinesis. Several consumers, such as AWS Lambda, Amazon Kinesis Data Firehose, Amazon Kinesis Data Analytics, and the Kinesis Consumer Library (KCL), can consume the data concurrently to perform real-time analytics on the dataset. Each AWS service in this architecture can scale independently as needed.

The following diagram shows the architecture of this solution.

Deploying AWS CloudFormation

To get started, you first deploy the CloudFormation template to create the core components of the architecture. AWS CloudFormation automates the deployment of technology and infrastructure in a safe and repeatable manner across multiple Regions and accounts with the least amount of effort and time. To create these resources, complete the following steps:

  1. Sign in to the AWS Management Console and choose the us-west-2 Region.
  2. Choose Launch Stack:
  3. Choose Next.

 This automatically launches AWS CloudFormation in your AWS account with a template. It prompts you to sign in as needed. You can view the CloudFormation template on the console.

  1. For Stack name, enter a stack name.
  2. On the next screen, choose your VPC and subnet IDs.
  3. For Does DMS VPC and Cloudwatch role Exists?, enter Y if the managed AWS Identity and Access Management (IAM) roles dms-vpc-role and dms-cloudwatch-logs-role exist in your account. Otherwise, leave at the default N.

If you want to deploy the AWS DMS endpoint in a private subnet, enable the VPC endpoints for Kinesis and Amazon S3 before deploying the template.

  1. Choose Next.
  2. Acknowledge resource creation under Capabilities on the final screen and choose Create.

The stack takes 5–10 minutes to complete, during which it performs the following:

  • Creates a source S3 bucket and target Kinesis data stream with two shards.
  • Creates an AWS DMS replication instance, Amazon S3 source endpoint, and Kinesis target.
  • Maps the S3 bucket and data steam to their respective endpoints.
  • Configures a replication task with the required parameters.
  • Creates an AWS Lambda function with a trigger to consume records from Kinesis. For more information, see Using AWS Lambda with Amazon Kinesis.

The files required for this demo don’t come with the template. Download blog_sample_file.zip and upload it to the source bucket before starting the AWS DMS task.

Using Amazon S3 as the source

When you use Amazon S3 as the source, the data files (full load and CDC) must be in comma-separated value (CSV) format.

In addition to the data files, AWS DMS also requires an external table definition. An external table definition is a JSON document that describes how AWS DMS should interpret the data from Amazon S3.

Amazon S3 file paths for full load and CDC files are required for AWS DMS to run the task. Make sure that files names are sequentially numbered to replicate the data in the correct order. In addition, AWS DMS allows you to specify the column delimiter, row delimiter, and other parameters using extra connection attributes.

AWS DMS can identify the operation to perform for each load record in two ways: from the record’s keyword value INSERT or I.

For more information, see Using Amazon S3 as a source for AWS DMS.

Using Amazon Kinesis as the target

AWS publishes records to a Kinesis data stream as JSON. During conversion, AWS DMS serializes each record from the source Amazon S3 files into an attribute-value pair in JSON format.

AWS DMS publishes each record in the source Amazon S3 file as one JSON data record in a data stream regardless of the action specified in the source file.

Additionally, AWS DMS allows object mapping to migrate data from source files to a data stream. Object mapping determines the structure of data records in the stream.

AWS DMS also supports multi-threaded migration for full load and CDC with task settings. You can promote the performance by setting multiple threads, buffer size, and parallel queue.

For more information, see Using Amazon Kinesis Data Streams as a target for AWS Database Migration Service.

Walkthrough

The AWS CloudFormation deployment takes care of all the infrastructure. Now you need files to complete this use case.

  1. Download blog_sample_file.zip, which contains full and CDC load files in CSV format.

If your source files aren’t in CSV, convert the file format to CSV. One conversion method is by using AWS Glue. For more information, see Format Options for ETL Inputs and Outputs in AWS Glue.

The following screenshot shows the sample records of the full load files that you use for this use case.

CDC files require additional attributes for AWS DMS to identify the action, table, and schema.

  1. Reformat the files as follows:
  • Operation – The change operation to be performed: INSERT or I, UPDATE or U, or DELETE or D.
  • Table name – The name of the source table.
  • Schema name – The name of the source schema.
  • Data – One or more columns that represent the data to be changed.

The following screenshot shows sample records of the CDC file.

External table definition is required in the source endpoint configuration. For this post, the definition is embedded in AWS CloudFormation.

  1. Enter the following code for the table definition for the full and CDC files:
    {
    	“TableCount”: “1",
    	“Tables”: [{
    		“TableName”: “table01”,
    		“TablePath”: “schema01/table01/“,
    		“TableOwner”: “schema01",
    		“TableColumns”: [{
    			“ColumnName”: “ingest_time”,
    			“ColumnType”: “TIMESTAMP”,
    			“ColumnNullable”: “false”,
    			“ColumnIsPk”: “true”
    		}, {
    			“ColumnName”: “doi”,
    			“ColumnType”: “STRING”,
    			“ColumnLength”: “30”
    		}, {
    			“ColumnName”: “id”,
    			“ColumnType”: “INT8”
    		}, {
    			“ColumnName”: “value”,
    			“ColumnType”: “NUMERIC”,
    			“ColumnPrecision”: “5”,
    			“ColumnScale”: “2”
    		}, {
    			“ColumnName”: “data_sig”,
    			“ColumnType”: “STRING”,
    			“ColumnLength”: “10”
    		}],
    		“TableColumnsTotal”: “5”
    	}]
    }
    

  2. Create folder structures under the source S3 bucket created through the CloudFormation template.
    1. Create folders schema01/table01/ for full load and cdcfile/ for CDC data files.
    2. Also, file names should be in incremental, as listed in the following CLI output.
      $aws s3 ls s3://blog-xxxxxxxx/schema01/table01 --recursive --human-readable --summarize
      2020-08-03 22:05:57    5.0 MiB schema01/table01/full_000
      2020-08-03 22:05:51    5.0 MiB schema01/table01/full_001
      2020-08-03 22:06:00    5.0 MiB schema01/table01/full_002
      2020-08-03 22:05:56    5.0 MiB schema01/table01/full_003
      2020-08-03 22:05:59    3.1 MiB schema01/table01/full_004
      
      $aws s3 ls s3://blog-xxxxxxxx/cdcfile --recursive --human-readable --summarize
      2020-08-03 22:06:28    4.8 MiB cdc/cdc_000
      2020-08-03 22:06:28    4.8 MiB cdc/cdc_001
      2020-08-03 22:06:26    4.8 MiB cdc/cdc_002
      2020-08-03 22:06:19    4.8 MiB cdc/cdc_003
      

  3. After the files are copied, on the AWS DMS console, choose Replication.
  4. Validate the instance status and configuration.
  5. Choose Endpoints.
  6. Validate the status and configuration of the Amazon S3 source endpoint and make sure that the connection to the replication instance is successful.
  7. Similarly, validate the status and configuration of Kinesis target endpoint and make sure that the connection to the replication instance is successful.
  8. Choose Database migration task.
  9. Verify that the source and target are mapped correctly.
  10. After validating all the configurations, restart the AWS DMS task. Because the task has been created and never started, choose Restart/Resume to start full load and CDC.

After data migration starts, you can see it listed under Table statistics. For more information, see How do I use table statistics to monitor an AWS DMS task?

AWS DMS completes the full load first and migrates change data as files are uploaded to the bucket location specified in the cdcPath parameter.

  1. While the migration is in progress, on the Kinesis console, check the IncomingBytes metrics on the Monitoring tab to confirm the data is streaming to Kinesis Data Streams.
  2. To confirm that the data streamed is being consumed by the Lambda consumer, use the GetRecords.Bytes metric.

You’re now ready to validate the records in Lambda. Lambda is configured to read from Kinesis through a trigger.

The Lambda consumer for this post is a sample function that consumes the records from the Kinesis data stream, decodes the base64 encoded data, and prints the records to the Amazon CloudWatch log group.

  1. On the Monitoring tab, open the recent logstream under CloudWatch Log Insights to see the printed records.

For more information about monitoring, see Monitoring functions in the AWS Lambda console.

You can add processing logic to the Lambda function as per your requirements to aggregate or process the records. You can also configure a Lambda destination for further processing. Lambda asynchronous invocations can put an event or message on Amazon Simple Notification Service (Amazon SNS), Amazon Simple Queue Service (Amazon SQS), or Amazon EventBridge. For more information, see Introducing AWS Lambda Destinations.

Best practice considerations

When implementing this solution, consider the following best practices:

  • Full load allows to you stream existing data from an S3 bucket to Kinesis. You can use full load to migrate previously stored data before streaming CDC data. The full load data should already exist before the task starts. For new CDC files, the data is streamed to Kinesis on a file delivery event in real-time.
  • For loading multiple tables, you can specify the table count and table properties in an external table definition file. The CDC path remains the same and AWS DMS maps the records to tables based on the metadata fields.
  • During a heavy workload, the AWS DMS instance can be constrained to resources like CPU, memory, storage, and I/O. For optimal transfer speed, monitor the CloudWatch metrics and scale the replication instance.
  • For migrating a large number of tables, you can speed up the transfer by setting the multi-threading parameter to higher values.
  • The CloudFormation template creates a data stream with two shards. As the data flow rate to the stream increases, you can scale the number of shards in the stream to adapt to changes. Monitoring Kinesis with CloudWatch metrics for IncomingRecords and WriteProvisionedThroughputExceeded provides insights on how to scale the shards.
  • Object mapping in the AWS DMS task defines the partition key. This partition key is used to group data by shard within a stream. The default partition key AWS DMS uses is TableName. You can use attribute mapping to change the partition key to a value of one of the fields in the JSON, or the primary key of the table in the source database. You can also set the partition key to a constant value to stream all the data to a single shard in the stream.
  • By default, Lambda invokes the function as soon as records are available in the stream. To avoid invoking the function with a small number of records, configure the event source to buffer records for up to 5 minutes by configuring a batch window. For more information, see Using AWS Lambda with Amazon Kinesis.
  • When Kinesis is configured as a trigger for Lambda, you can increase the concurrency to process multiple batches from each shard in parallel. Lambda can process up to 10 batches in each shard simultaneously. For more information about concurrency, see New AWS Lambda scaling controls for Kinesis and DynamoDB event sources.

Cleaning up

After successful testing and validation, you should delete all the resources deployed through the CloudFormation template to avoid any unwanted costs. First empty the S3 bucket and stop the AWS DMS task. Then delete the appropriate stacks on the AWS CloudFormation console.

Summary

This post describes a solution for converting batch processing to near real-time using AWS DMS. This solution greatly simplifies the process of migrating records from Amazon S3 to Kinesis for analysis. Kinesis as an AWS DMS target allows multiple systems to consume data simultaneously. Having a near-steaming pipeline allows you to make sense of all the changes in near-real time, which ultimately expands your organization’s ability for better decision-making. All the resources used in this solution scale seamlessly and allow you to focus on analysis, alerting, reporting, and fraud detection instead of focusing on platform setup and maintenance. This promotes cost-effectiveness while reducing operational burden.


About the Author

Mahesh Goyal is a Data Architect in Big Data at AWS. He works with customers in their journey to the cloud with a focus on big data and data warehouses. In his spare time, Mahesh likes to listen to music and explore new food places with his family.


Charishma Makineni is a Technical Account Manager at AWS. She works with enterprise customers to help them build secure and scalable solutions on the AWS cloud. She is focused on Big data and Analytics technologies. Outside of work, Charishma enjoys being outdoors, gardening and experimenting with cooking.


Suresh Patnam is a Solutions Architect at AWS. He helps customers innovate on the AWS platform by building highly available, scalable, and secure architectures on Big Data and AI/ML. In his spare time, Suresh enjoys playing tennis and spending time with his family.
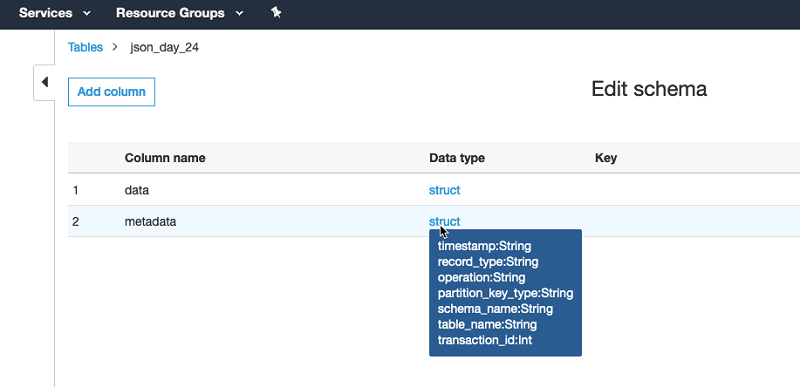
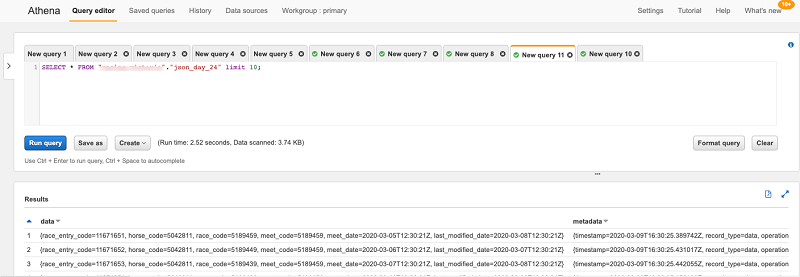
Stream CDC into an Amazon S3 data lake in Parquet format with AWS DMS

Post Syndicated from Viral Shah original https://aws.amazon.com/blogs/big-data/stream-cdc-into-an-amazon-s3-data-lake-in-parquet-format-with-aws-dms/

Most organizations generate data in real time and ever-increasing volumes. Data is captured from a variety of sources, such as transactional and reporting databases, application logs, customer-facing websites, and external feeds. Companies want to capture, transform, and analyze this time-sensitive data to improve customer experiences, increase efficiency, and drive innovations. With increased data volume and velocity, it’s imperative to capture the data from source systems as soon as they are generated and store them on a secure, scalable, and cost-efficient platform.

AWS Database Migration Service (AWS DMS) performs continuous data replication using change data capture (CDC). Using CDC, you can determine and track data that has changed and provide it as a stream of changes that a downstream application can consume and act on. Most database management systems manage a transaction log that records changes made to the database contents and metadata. AWS DMS reads the transaction log by using engine-specific API operations and functions and captures the changes made to the database in a nonintrusive manner.

Amazon Simple Storage Service (Amazon S3) is the largest and most performant object storage service for structured and unstructured data and the storage service of choice to build a data lake. With Amazon S3, you can cost-effectively build and scale a data lake of any size in a secure environment where data is protected by 99.999999999% of durability.

AWS DMS offers many options to capture data changes from relational databases and store the data in columnar format (Apache Parquet) into Amazon S3:

The second option helps you build a flexible data pipeline to ingest data into an Amazon S3 data lake from several relational and non-relational data sources, compared to just relational data sources support in the former option. Kinesis Data Firehose provides pre-built AWS Lambda blueprints for converting common data sources such as Apache logs and system logs to JSON and CSV formats or writing your own custom functions. It can also convert the format of incoming data from JSON to Parquet or Apache ORC before storing the data in Amazon S3. Data stored in columnar format gives you faster and lower-cost queries with downstream analytics services like Amazon Athena.

In this post, we focus on the technical challenges outlined in the second option and how to address them.

As shown in the following reference architecture, data is ingested from a database into Parquet format in Amazon S3 via AWS DMS integrating with Kinesis Data Streams and Kinesis Data Firehose.

Our solution provides flexibility to ingest data from several sources using Kinesis Data Streams and Kinesis Data Firehose with built-in data format conversion and integrated data transformation capabilities before storing data in a data lake. For more information about data ingestion into Kinesis Data Streams, see Writing Data into Amazon Kinesis Data Streams. You can then query Parquet data in Amazon S3 efficiently with Athena.

Implementing the architecture

AWS DMS can migrate data to and from most widely used commercial and open-source databases. You can migrate and replicate data directly to Amazon S3 in CSV and Parquet formats, and store data in Amazon S3 in Parquet because it offers efficient compression and encoding schemes. Parquet format allows compression schemes on a per-column level, and is future-proofed to allow adding more encodings as they are invented and implemented.

AWS DMS supports Kinesis Data Streams as a target. Kinesis Data Streams is a massively scalable and durable real-time data streaming service that can collect and process large streams of data records in real time. AWS DMS service publishes records to a data stream using JSON. For more information about configuration details, see Use the AWS Database Migration Service to Stream Change Data to Amazon Kinesis Data Streams.

Kinesis Data Firehose can pull data from Kinesis Data Streams. It’s a fully managed service that delivers real-time streaming data to destinations such as Amazon S3, Amazon Redshift, Amazon Elasticsearch Service (Amazon ES), and Splunk. Kinesis Data Firehose can convert the format of input data from JSON to Parquet or ORC before sending it to Amazon S3. It needs reference schema to interpret the AWS DMS streaming data in JSON and convert into Parquet. In this post, we use AWS Glue, a fully managed ETL service, to create a schema in the AWS Glue Data Catalog for Kinesis Data Firehose to reference.

When AWS DMS migrates records, it creates additional fields (metadata) for each migrated record. The metadata provides additional information about the record being migrated, such as source table name, schema name, and type of operation. Most metadata fields add – in their field names (for example, record-type, schema-name, table-name, transaction-id). See the following code:

{
        "data": {
            "MEET_CODE": 5189459,
            "MEET_DATE": "2020-02-21T19:20:04Z",
            "RACE_CODE": 5189459,
            "LAST_MODIFIED_DATE": "2020-02-24T19:20:04Z",
            "RACE_ENTRY_CODE": 11671651,
            "HORSE_CODE": 5042811
        },
        "metadata": {
            "transaction-id": 917505,
            "schema-name": "SH",
            "operation": "insert",
            "table-name": "RACE_ENTRY",
            "record-type": "data",
            "timestamp": "2020-02-26T00:20:07.482592Z",
            "partition-key-type": "schema-table"
        }
    }

Additional metadata added by AWS DMS leads to an error during the data format conversion phase in Kinesis Data Firehose. Kinesis Data Firehose follows Hive style formatting and therefore doesn’t recognize the – character in the metadata field names during data conversion from JSON into Parquet and returns an error message: expected at the position 30 of ‘struct’ but ‘-’ is found. For example, see the following code:

{
	"deliveryStreamARN": "arn:aws:firehose:us-east-1:1234567890:deliverystream/abc-def-KDF",
	"destination": "arn:aws:s3:::abc-streaming-bucket",
	"deliveryStreamVersionId": 13,
	"message": "The schema is invalid. Error parsing the schema:
	 Error: : expected at the position 30 of 'struct<timestamp:string,record-type:string,operation:string,partition-key-type:string,schema-name:string,table-name:string,transaction-id:int>' but '-' is found.",
	"errorCode": "DataFormatConversion.InvalidSchema"
}

You can resolve the issue by making the following changes: specifying JSON key mappings and creating a reference table in AWS Glue before configuring Kinesis Data Firehose.

Specifying JSON key mappings

In your Kinesis Data Firehose configuration, specify JSON key mappings for fields with – in their names. Mapping transforms these specific metadata fields names to _ (for example, record-type changes to record_type).

Use AWS Command Line Interface (AWS CLI) to create Kinesis Data Firehose with the JSON key mappings. Modify the parameters to meet your specific requirements.

Kinesis Data Firehose configuration mapping is only possible through the AWS CLI or API and not through the AWS Management Console.

The following code configures Kinesis Data Firehose with five columns with – in their field names mapped to new field names with _”:

"S3BackupMode": "Disabled",
                    "DataFormatConversionConfiguration": {
                        "SchemaConfiguration": {
                            "RoleARN": "arn:aws:iam::123456789012:role/sample-firehose-delivery-role",
                            "DatabaseName": "sample-db",
                            "TableName": "sample-table",
                            "Region": "us-east-1",
                            "VersionId": "LATEST"
                        },
                        "InputFormatConfiguration": {
                            "Deserializer": {
                                "OpenXJsonSerDe": {
                                "ColumnToJsonKeyMappings":
                                {
                                 "record_type": "record-type","partition_key_type": "partition-key-type","schema_name":"schema-name","table_name":"table-name","transaction_id":"transaction-id"
                                }
                                }

Creating a reference table in AWS Glue

Because Kinesis Data Firehose uses the Data Catalog to reference schema for Parquet format conversion, you must first create a reference table in AWS Glue before configuring Kinesis Data Firehose. Use Athena to create a Data Catalog table. For instructions, see CREATE TABLE. In the table, make sure that the column name uses _ in their names, and manually modify it in advance through the Edit schema option for the referenced table in AWS Glue, if needed.

Use Athena to query the results of data ingested by Kinesis Data Firehose into Amazon S3.

This solution is only applicable in the following use cases:

  • Capturing data changes from your source with AWS DMS
  • Converting data into Parquet with Kinesis Data Firehose

If you want to store data in non-Parquet format (such CSV or JSON) or ingest into Kinesis through other routes, then you don’t need to modify your Kinesis Data Firehose configuration.

Conclusion

This post demonstrated how to convert AWS DMS data into Parquet format and specific configurations to make sure metadata follows the expected format of Kinesis Data Streams and Kinesis Data Firehose. We encourage you to try this solution and take advantage of all the benefits of using AWS DMS with Kinesis Data Streams and Kinesis Data Firehose. For more information, see Getting started with AWS Database Migration Service and Setting up Amazon Kinesis Firehose.

If you have questions or suggestions, please leave a comment.


About the Author

Viral Shah is a Data Lab Architect with Amazon Web Services. Viral helps our customers architect and build data and analytics prototypes in just four days in the AWS Data Lab. He has over 20 years of experience working with enterprise customers and startups primarily in the Data and Database space.


Building storage-first serverless applications with HTTP APIs service integrations

Post Syndicated from Eric Johnson original https://aws.amazon.com/blogs/compute/building-storage-first-applications-with-http-apis-service-integrations/

Over the last year, I have been talking about “storage first” serverless patterns. With these patterns, data is stored persistently before any business logic is applied. The advantage of this pattern is increased application resiliency. By persisting the data before processing, the original data is still available, if or when errors occur.

Common pattern for serverless API backend

Common pattern for serverless API backend

Using Amazon API Gateway as a proxy to an AWS Lambda function is a common pattern in serverless applications. The Lambda function handles the business logic and communicates with other AWS or third-party services to route, modify, or store the processed data. One option is to place the data in an Amazon Simple Queue Service (SQS) queue for processing downstream. In this pattern, the developer is responsible for handling errors and retry logic within the Lambda function code.

The storage first pattern flips this around. It uses native error handling with retry logic or dead-letter queues (DLQ) at the SQS layer before any code is run. By directly integrating API Gateway to SQS, developers can increase application reliability while reducing lines of code.

Storage first pattern for serverless API backend

Storage first pattern for serverless API backend

Previously, direct integrations require REST APIs with transformation templates written in Velocity Template Language (VTL). However, developers tell us they would like to integrate directly with services in a simpler way without using VTL. As a result, HTTP APIs now offers the ability to directly integrate with five AWS services without needing a transformation template or code layer.

The first five service integrations

This release of HTTP APIs direct integrations includes Amazon EventBridge, Amazon Kinesis Data Streams, Simple Queue Service (SQS), AWS System Manager’s AppConfig, and AWS Step Functions. With these new integrations, customers can create APIs and webhooks for their business logic hosted in these AWS services. They can also take advantage of HTTP APIs features like authorizers, throttling, and enhanced observability for securing and monitoring these applications.

Amazon EventBridge

HTTP APIs service integration with Amazon EventBridge

HTTP APIs service integration with Amazon EventBridge

The HTTP APIs direct integration for EventBridge uses the PutEvents API to enable client applications to place events on an EventBridge bus. Once the events are on the bus, EventBridge routes the event to specific targets based upon EventBridge filtering rules.

This integration is a storage first pattern because data is written to the bus before any routing or logic is applied. If the downstream target service has issues, then EventBridge implements a retry strategy with incremental back-off for up to 24 hours. Additionally, the integration helps developers reduce code by filtering events at the bus. It routes to downstream targets without the need for a Lambda function as a transport layer.

Use this direct integration when:

  • Different tasks are required based upon incoming event details
  • Only data ingestion is required
  • Payload size is less than 256 kb
  • Expected requests per second are less than the Region quotas.

Amazon Kinesis Data Streams

HTTP APIs service integration with Amazon Kinesis Data Streams

HTTP APIs service integration with Amazon Kinesis Data Streams

The HTTP APIs direct integration for Kinesis Data Streams offers the PutRecord integration action, enabling client applications to place events on a Kinesis data stream. Kinesis Data Streams are designed to handle up to 1,000 writes per second per shard, with payloads up to 1 mb in size. Developers can increase throughput by increasing the number of shards in the data stream. You can route the incoming data to targets like an Amazon S3 bucket as part of a data lake or a Kinesis data analytics application for real-time analytics.

This integration is a storage first option because data is stored on the stream for up to seven days until it is processed and routed elsewhere. When processing stream events with a Lambda function, errors are handled at the Lambda layer through a configurable error handling strategy.

Use this direct integration when:

  • Ingesting large amounts of data
  • Ingesting large payload sizes
  • Order is important
  • Routing the same data to multiple targets

Amazon SQS

HTTP APIs service integration with Amazon SQS

HTTP APIs service integration with Amazon SQS

The HTTP APIs direct integration for Amazon SQS offers the SendMessage, ReceiveMessage, DeleteMessage, and PurgeQueue integration actions. This integration differs from the EventBridge and Kinesis integrations in that data flows both ways. Events can be created, read, and deleted from the SQS queue via REST calls through the HTTP API endpoint. Additionally, a full purge of the queue can be managed using the PurgeQueue action.

This pattern is a storage first pattern because the data remains on the queue for four days by default (configurable to 14 days), unless it is processed and removed. When the Lambda service polls the queue, the messages that are returned are hidden in the queue for a set amount of time. Once the calling service has processed these messages, it uses the DeleteMessage API to remove the messages permanently.

When triggering a Lambda function with an SQS queue, the Lambda service manages this process internally. However, HTTP APIs direct integration with SQS enables developers to move this process to client applications without the need for a Lambda function as a transport layer.

Use this direct integration when:

  • Data must be received as well as sent to the service
  • Downstream services need reduced concurrency
  • The queue requires custom management
  • Order is important (FIFO queues)

AWS AppConfig

HTTP APIs service integration with AWS Systems Manager AppConfig

HTTP APIs service integration with AWS Systems Manager AppConfig

The HTTP APIs direct integration for AWS AppConfig offers the GetConfiguration integration action and allows applications to check for application configuration updates. By exposing the systems parameter API through an HTTP APIs endpoint, developers can automate configuration changes for their applications. While this integration is not considered a storage first integration, it does enable direct communication from external services to AppConfig without the need for a Lambda function as a transport layer.

Use this direct integration when:

  • Access to AWS AppConfig is required.
  • Managing application configurations.

AWS Step Functions

HTTP APIs service integration with AWS Step Functions

HTTP APIs service integration with AWS Step Functions

The HTTP APIs direct integration for Step Functions offers the StartExecution and StopExecution integration actions. These actions allow for programmatic control of a Step Functions state machine via an API. When starting a Step Functions workflow, JSON data is passed in the request and mapped to the state machine. Error messages are also mapped to the state machine when stopping the execution.

This pattern provides a storage first integration because Step Functions maintains a persistent state during the life of the orchestrated workflow. Step Functions also supports service integrations that allow the workflows to send and receive data without needing a Lambda function as a transport layer.

Use this direct integration when:

  • Orchestrating multiple actions.
  • Order of action is required.

Building HTTP APIs direct integrations

HTTP APIs service integrations can be built using the AWS CLI, AWS SAM, or through the API Gateway console. The console walks through contextual choices to help you understand what is required for each integration. Each of the integrations also includes an Advanced section to provide additional information for the integration.

Creating an HTTP APIs service integration

Creating an HTTP APIs service integration

Once you build an integration, you can export it as an OpenAPI template that can be used with infrastructure as code (IaC) tools like AWS SAM. The exported template can also include the API Gateway extensions that define the specific integration information.

Exporting the HTTP APIs configuration to OpenAPI

Exporting the HTTP APIs configuration to OpenAPI

OpenAPI template

An example of a direct integration from HTTP APIs to SQS is located in the Sessions With SAM repository. This example includes the following architecture:

AWS SAM template resource architecture

AWS SAM template resource architecture

The AWS SAM template creates the HTTP APIs, SQS queue, Lambda function, and both Identity and Access Management (IAM) roles required. This is all generated in 58 lines of code and looks like this:

AWSTemplateFormatVersion: '2010-09-09'
Transform: AWS::Serverless-2016-10-31
Description: HTTP API direct integrations

Resources:
  MyQueue:
    Type: AWS::SQS::Queue
    
  MyHttpApi:
    Type: AWS::Serverless::HttpApi
    Properties:
      DefinitionBody:
        'Fn::Transform':
          Name: 'AWS::Include'
          Parameters:
            Location: './api.yaml'
          
  MyHttpApiRole:
    Type: "AWS::IAM::Role"
    Properties:
      AssumeRolePolicyDocument:
        Version: "2012-10-17"
        Statement:
          - Effect: "Allow"
            Principal:
              Service: "apigateway.amazonaws.com"
            Action: 
              - "sts:AssumeRole"
      Policies:
        - PolicyName: ApiDirectWriteToSQS
          PolicyDocument:
            Version: '2012-10-17'
            Statement:
              Action:
              - sqs:SendMessage
              Effect: Allow
              Resource:
                - !GetAtt MyQueue.Arn
                
  MyTriggeredLambda:
    Type: AWS::Serverless::Function
    Properties:
      CodeUri: src/
      Handler: app.lambdaHandler
      Runtime: nodejs12.x
      Policies:
        - SQSPollerPolicy:
            QueueName: !GetAtt MyQueue.QueueName
      Events:
        SQSTrigger:
          Type: SQS
          Properties:
            Queue: !GetAtt MyQueue.Arn

Outputs:
  ApiEndpoint:
    Description: "HTTP API endpoint URL"
    Value: !Sub "https://${MyHttpApi}.execute-api.${AWS::Region}.amazonaws.com"

The OpenAPI template handles the route definitions for the HTTP API configuration and configures the service integration. The template looks like this:

openapi: "3.0.1"
info:
  title: "my-sqs-api"
paths:
  /:
    post:
      responses:
        default:
          description: "Default response for POST /"
      x-amazon-apigateway-integration:
        integrationSubtype: "SQS-SendMessage"
        credentials:
          Fn::GetAtt: [MyHttpApiRole, Arn]
        requestParameters:
          MessageBody: "$request.body.MessageBody"
          QueueUrl:
            Ref: MyQueue
        payloadFormatVersion: "1.0"
        type: "aws_proxy”
        connectionType: "INTERNET"
x-amazon-apigateway-importexport-version: "1.0"

Because the OpenAPI template is included in the AWS SAM template via a transform, the API Gateway integration can reference the roles and services created within the AWS SAM template.

Conclusion

This post covers the concept of storage first integration patterns and how the new HTTP APIs direct integrations can help. I cover the five current integrations and possible use cases for each. Additionally, I demonstrate how to use AWS SAM to build and manage the integrated applications using infrastructure as code.

Using the storage first pattern with direct integrations can help developers build serverless applications that are more durable with fewer lines of code. A Lambda function is no longer required to transport data from the API endpoint to the desired service. Instead, use Lambda function invocations for differentiating business logic.

To learn more join us for the HTTP API service integrations session of Sessions With SAM! 

#ServerlessForEveryone