Tag Archives: Uncategorized

China Taking Control of Zero-Day Exploits

Post Syndicated from Bruce Schneier original https://www.schneier.com/blog/archives/2021/07/china-taking-control-of-zero-day-exploits.html

China is making sure that all newly discovered zero-day exploits are disclosed to the government.

Under the new rules, anyone in China who finds a vulnerability must tell the government, which will decide what repairs to make. No information can be given to “overseas organizations or individuals” other than the product’s manufacturer.

No one may “collect, sell or publish information on network product security vulnerabilities,” say the rules issued by the Cyberspace Administration of China and the police and industry ministries.

This just blocks the cyber-arms trade. It doesn’t prevent researchers from telling the products’ companies, even if they are outside of China.

Iranian State-Sponsored Hacking Attempts

Post Syndicated from Bruce Schneier original https://www.schneier.com/blog/archives/2021/07/iranian-state-sponsored-hacking-attempts.html

Interesting attack:

Masquerading as UK scholars with the University of London’s School of Oriental and African Studies (SOAS), the threat actor TA453 has been covertly approaching individuals since at least January 2021 to solicit sensitive information. The threat actor, an APT who we assess with high confidence supports Islamic Revolutionary Guard Corps (IRGC) intelligence collection efforts, established backstopping for their credential phishing infrastructure by compromising a legitimate site of a highly regarded academic institution to deliver personalized credential harvesting pages disguised as registration links. Identified targets included experts in Middle Eastern affairs from think tanks, senior professors from well-known academic institutions, and journalists specializing in Middle Eastern coverage.

These connection attempts were detailed and extensive, often including lengthy conversations prior to presenting the next stage in the attack chain. Once the conversation was established, TA453 delivered a “registration link” to a legitimate but compromised website belonging to the University of London’s SOAS radio. The compromised site was configured to capture a variety of credentials. Of note, TA453 also targeted the personal email accounts of at least one of their targets. In subsequent phishing emails, TA453 shifted their tactics and began delivering the registration link earlier in their engagement with the target without requiring extensive conversation. This operation, dubbed SpoofedScholars, represents one of the more sophisticated TA453 campaigns identified by Proofpoint.

The report details the tactics.

News article.

Enforcing AWS CloudFormation scanning in CI/CD Pipelines at scale using Trend Micro Cloud One Conformity

Post Syndicated from Chris Dorrington original https://aws.amazon.com/blogs/devops/cloudformation-scanning-cicd-pipeline-cloud-conformity/

Integrating AWS CloudFormation template scanning into CI/CD pipelines is a great way to catch security infringements before application deployment. However, implementing and enforcing this in a multi team, multi account environment can present some challenges, especially when the scanning tools used require external API access.

This blog will discuss those challenges and offer a solution using Trend Micro Cloud One Conformity (formerly Cloud Conformity) as the worked example. Accompanying this blog is the end to end sample solution and detailed install steps which can be found on GitHub here.

We will explore explore the following topics in detail:

  • When to detect security vulnerabilities
    • Where can template scanning be enforced?
  • Managing API Keys for accessing third party APIs
    • How can keys be obtained and distributed between teams?
    • How easy is it to rotate keys with multiple teams relying upon them?
  • Viewing the results easily
    • How do teams easily view the results of any scan performed?
  • Solution maintainability
    • How can a fix or update be rolled out?
    • How easy is it to change scanner provider? (i.e. from Cloud Conformity to in house tool)
  • Enforcing the template validation
    • How to prevent teams from circumventing the checks?
  • Managing exceptions to the rules
    • How can the teams proceed with deployment if there is a valid reason for a check to fail?


When to detect security vulnerabilities

During the DevOps life-cycle, there are multiple opportunities to test cloud applications for best practice violations when it comes to security. The Shift-left approach is to move testing to as far left in the life-cycle, so as to catch bugs as early as possible. It is much easier and less costly to fix on a local developer machine than it is to patch in production.

Diagram showing Shift-left approach

Figure 1 – depicting the stages that an app will pass through before being deployed into an AWS account

At the very left of the cycle is where developers perform the traditional software testing responsibilities (such as unit tests), With cloud applications, there is also a responsibility at this stage to ensure there are no AWS security, configuration, or compliance vulnerabilities. Developers and subsequent peer reviewers looking at the code can do this by eye, but in this way it is hard to catch every piece of bad code or misconfigured resource.

For example, you might define an AWS Lambda function that contains an access policy making it accessible from the world, but this can be hard to spot when coding or peer review. Once deployed, potential security risks are now live. Without proper monitoring, these misconfigurations can go undetected, with potentially dire consequences if exploited by a bad actor.

There are a number of tools and SaaS offerings on the market which can scan AWS CloudFormation templates and detect infringements against security best practices, such as Stelligent’s cfn_nag, AWS CloudFormation Guard, and Trend Micro Cloud One Conformity. These can all be run from the command line on a developer’s machine, inside the IDE or during a git commit hook. These options are discussed in detail in Using Shift-Left to Find Vulnerabilities Before Deployment with Trend Micro Template Scanner.

Whilst this is the most left the testing can be moved, it is hard to enforce it this early on in the development process. Mandating that scan commands be integrated into git commit hooks or IDE tools can significantly increase the commit time and quickly become frustrating for the developer. Because they are responsible for creating these hooks or installing IDE extensions, you cannot guarantee that a template scan is performed before deployment, because the developer could easily turn off the scans or not install the tools in the first place.

Another consideration for very-left testing of templates is that when applications are written using AWS CDK or AWS Serverless Application Model (SAM), the actual AWS CloudFormation template that is submitted to AWS isn’t available in source control; it’s created during the build or package stage. Therefore, moving template scanning as far to the left is just not possible in these situations. Developers have to run a command such as cdk synth or sam package to obtain the final AWS CloudFormation templates.

If we now look at the far right of Figure 1, when an application has been deployed, real time monitoring of the account can pick up security issues very quickly. Conformity performs excellently in this area by providing central visibility and real-time monitoring of your cloud infrastructure with a single dashboard. Accounts are checked against over 400 best practices, which allows you to find and remediate non-compliant resources. This real time alerting is fast – you can be assured of an email stating non-compliance in no time at all! However, remediation does takes time. Following the correct process, a fix to code will need to go through the CI/CD pipeline again before a patch is deployed. Relying on account scanning only at the far right is sub-optimal.

The best place to scan templates is at the most left of the enforceable part of the process – inside the CI/CD pipeline. Conformity provides their Template Scanner API for this exact purpose. Templates can be submitted to the API, and the same Conformity checks that are being performed in real time on the account are run against the submitted AWS CloudFormation template. When integrated programmatically into a build, failing checks can prevent a deployment from occurring.

Whilst it may seem a simple task to incorporate the Template Scanner API call into a CI/CD pipeline, there are many considerations for doing this successfully in an enterprise environment. The remainder of this blog will address each consideration in detail, and the accompanying GitHub repo provides a working sample solution to use as a base in your own organization.


View failing checks as AWS CodeBuild test reports

Treating failing Conformity checks the same as unit test failures within the build will make the process feel natural to the developers. A failing unit test will break the build, and so will a failing Conformity check.

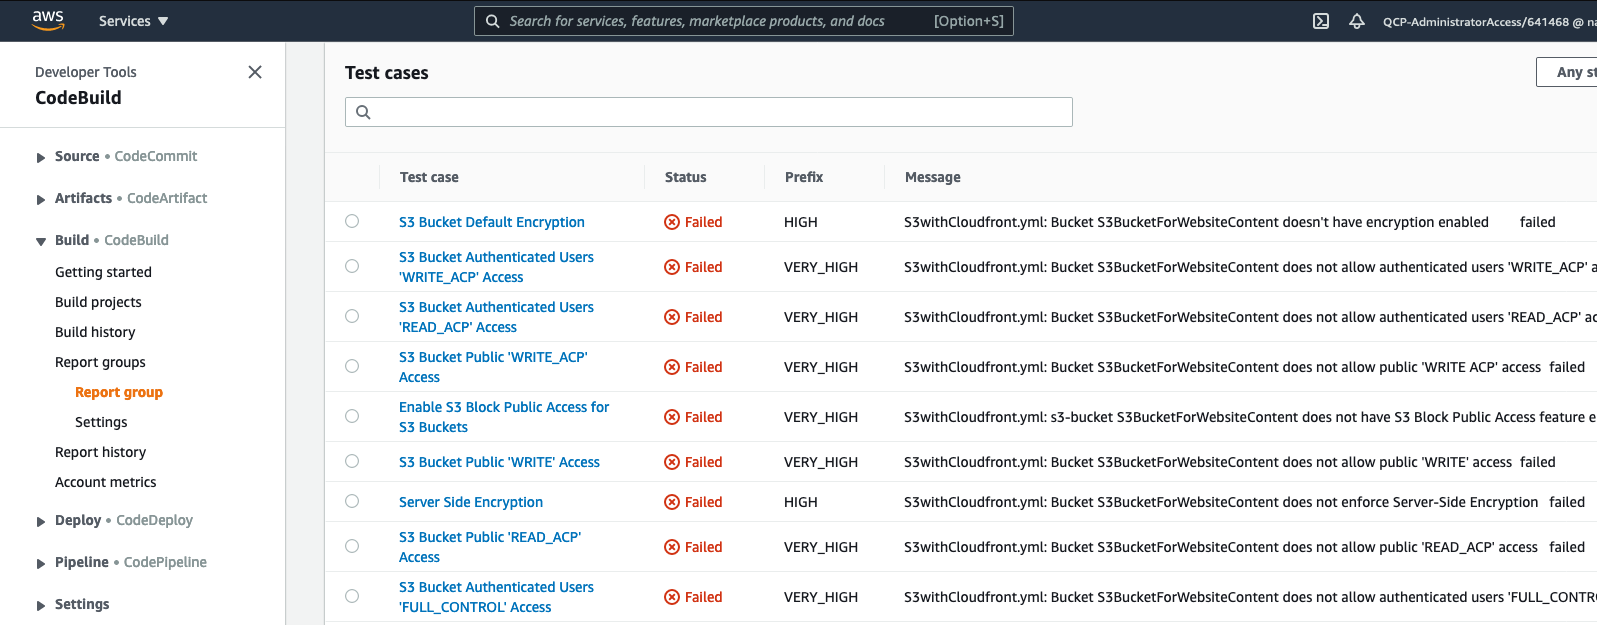
AWS CodeBuild provides test reporting for common unit test frameworks, such as NUnit, JUnit, and Cucumber. This allows developers to easily and very visually see what failing tests have occurred within their builds, allowing for quicker remediation than having to trawl through test log files. This same principle can be applied to failing Conformity checks—this allows developers to quickly see what checks have failed, rather than looking into AWS CodeBuild logs. However, the AWS CodeBuild test reporting feature doesn’t natively support the JSON schema that the Conformity Template Scanner API returns. Instead, you need custom code to turn the Conformity response into a usable format. Later in this blog we will explore how the conversion occurs.

Cloud conformity failed checks displayed as CodeBuild Reports

Figure 2 – Cloud Conformity failed checks appearing as failed test cases in AWS CodeBuild reports

Enterprise speed bumps

Teams wishing to use template scanning as part of their AWS CodePipeline currently need to create an AWS CodeBuild project that calls the external API, and then performs the custom translation code. If placed inside a buildspec file, it can easily become bloated with many lines of code, leading to maintainability issues arising as copies of the same buildspec file are distributed across teams and accounts. Additionally, third-party APIs such as Conformity are often authorized by an API key. In some enterprises, not all teams have access to the Conformity console, further compounding the problem for API key management.

Below are some factors to consider when implementing template scanning in the enterprise:

  • How can keys be obtained and distributed between teams?
  • How easy is it to rotate keys when multiple teams rely upon them?
  • How can a fix or update be rolled out?
  • How easy is it to change scanner provider? (i.e. From Cloud Conformity to in house tool)

Overcome scaling issues, use a centralized Validation API

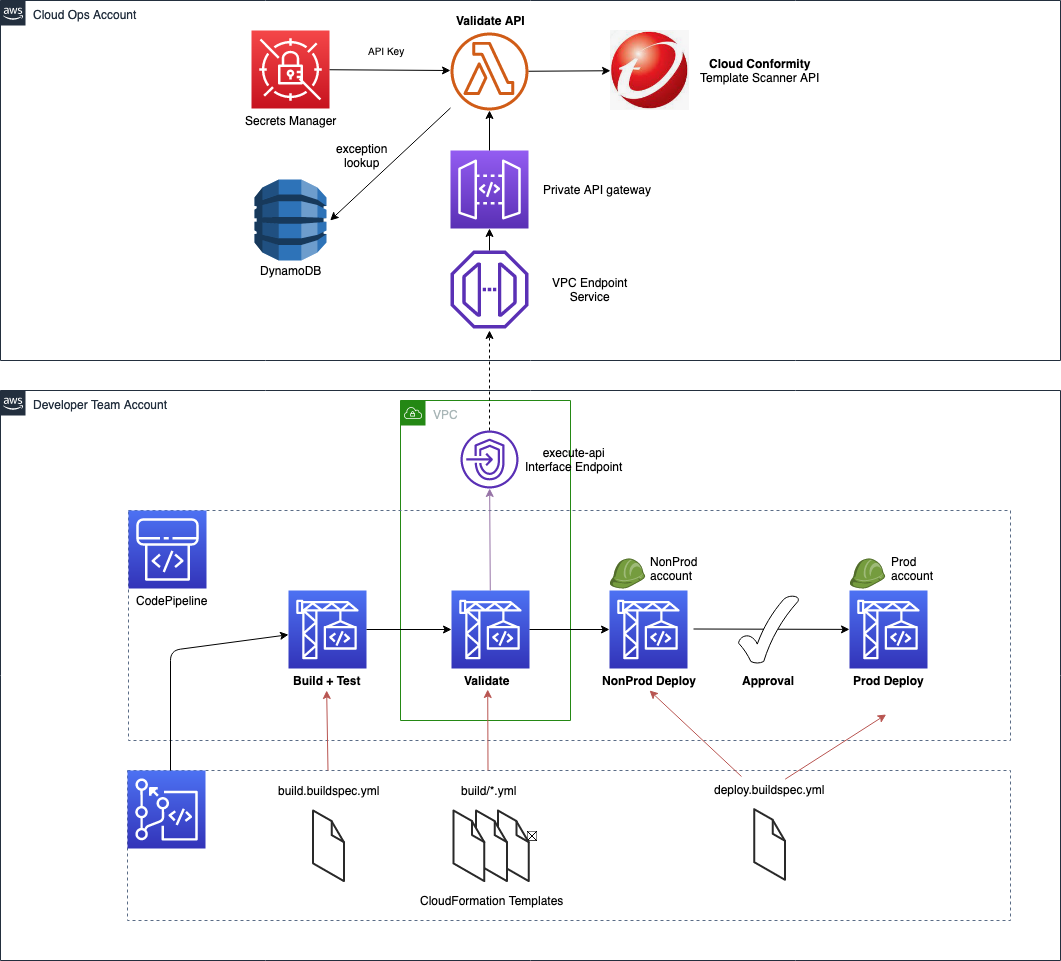
An approach to overcoming these issues is to create a single AWS Lambda function fronted by Amazon API Gateway within your organization that runs the call to the Template Scanner API, and performs the transform of results into a format usable by AWS CodeBuild reports. A good place to host this API is within the Cloud Ops team account or similar shared services account. This way, you only need to issue one API key (stored in AWS Secrets Manager) and it’s not available for viewing by any developers. Maintainability for the code performing the Template Scanner API calls is also very easy, because it resides in one location only. Key rotation is now simple (due to only one key in one location requiring an update) and can be automated through AWS Secrets Manager

The following diagram illustrates a typical setup of a multi-account, multi-dev team scenario in which a team’s AWS CodePipeline uses a centralized Validation API to call Conformity’s Template Scanner.

architecture diagram central api for cloud conformity template scanning

Figure 3 – Example of an AWS CodePipeline utilizing a centralized Validation API to call Conformity’s Template Scanner


Providing a wrapper API around the Conformity Template Scanner API encapsulates the code required to create the CodeBuild reports. Enabling template scanning within teams’ CI/CD pipelines now requires only a small piece of code within their CodeBuild buildspec file. It performs the following three actions:

  1. Post the AWS CloudFormation templates to the centralized Validation API
  2. Write the results to file (which are already in a format readable by CodeBuild test reports)
  3. Stop the build if it detects failed checks within the results

The centralized Validation API in the shared services account can be hosted with a private API in Amazon API Gateway, fronted by a VPC endpoint. Using a private API denies any public access but does allow access from any internal address allowed by the VPC endpoint security group and endpoint policy. The developer teams can run their AWS CodeBuild validation phase within a VPC, thereby giving it access to the VPC endpoint.

A working example of the code required, along with an AWS CodeBuild buildspec file, is provided in the GitHub repository


Converting 3rd party tool results to CodeBuild Report format

With a centralized API, there is now only one place where the conversion code needs to reside (as opposed to copies embedded in each teams’ CodePipeline). AWS CodeBuild Reports are primarily designed for test framework outputs and displaying test case results. In our case, we want to display Conformity checks – which are not unit test case results. The accompanying GitHub repository to convert from Conformity Template Scanner API results, but we will discuss mappings between the formats so that bespoke conversions for other 3rd party tools, such as cfn_nag can be created if required.

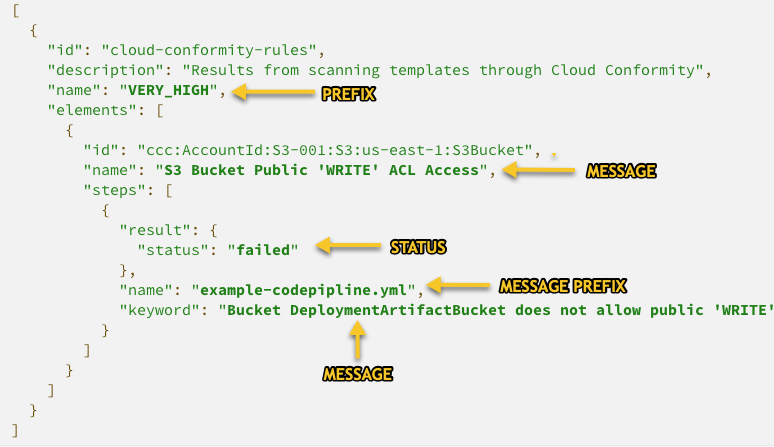
AWS CodeBuild provides out of the box compatibility for common unit test frameworks, such as NUnit, JUnit and Cucumber. Out of the supported formats, Cucumber JSON is the most readable format to read and manipulate due to native support in languages such as Python (all other formats being in XML).

Figure 4 depicts where the Cucumber JSON fields will appear in the AWS CodeBuild reports page and Figure 5 below shows a valid Cucumber snippet, with relevant fields highlighted in yellow.

CodeBuild Reports page with fields highlighted that correspond to cucumber JSON fields

Figure 4 – AWS CodeBuild report test case field mappings utilized by Cucumber JSON


Cucumber JSON snippet showing CodeBuild Report field mappings

Figure 5 – Cucumber JSON with mappings to AWS CodeBuild report table


Note that in Figure 5, there are additional fields (eg. id, description etc) that are required to make the file valid Cucumber JSON – even though this data is not displayed in CodeBuild Reports page. However, raw reports are still available as AWS CodeBuild artifacts, and therefore it is useful to still populate these fields with data that could be useful to aid deeper troubleshooting.

Conversion code for Conformity results is provided in the accompanying GitHub repo, within file app.py, line 376 onwards


Making the validation phase mandatory in AWS CodePipeline

The Shift-Left philosophy states that we should shift testing as much as possible to the left. The furthest left would be before any CI/CD pipeline is triggered. Developers could and should have the ability to perform template validation from their own machines. However, as discussed earlier this is rarely enforceable – a scan during a pipeline deployment is the only true way to know that templates have been validated. But how can we mandate this and truly secure the validation phase against circumvention?

Preventing updates to deployed CI/CD pipelines

Using a centralized API approach to make the call to the validation API means that this code is now only accessible by the Cloud Ops team, and not the developer teams. However, the code that calls this API has to reside within the developer teams’ CI/CD pipelines, so that it can stop the build if failures are found. With CI/CD pipelines defined as AWS CloudFormation, and without any preventative measures in place, a team could move to disable the phase and deploy code without any checks performed.

Fortunately, there are a number of approaches to prevent this from happening, and to enforce the validation phase. We shall now look at one of them from the AWS CloudFormation Best Practices.

IAM to control access

Use AWS IAM to control access to the stacks that define the pipeline, and then also to the AWS CodePipeline/AWS CodeBuild resources within them.

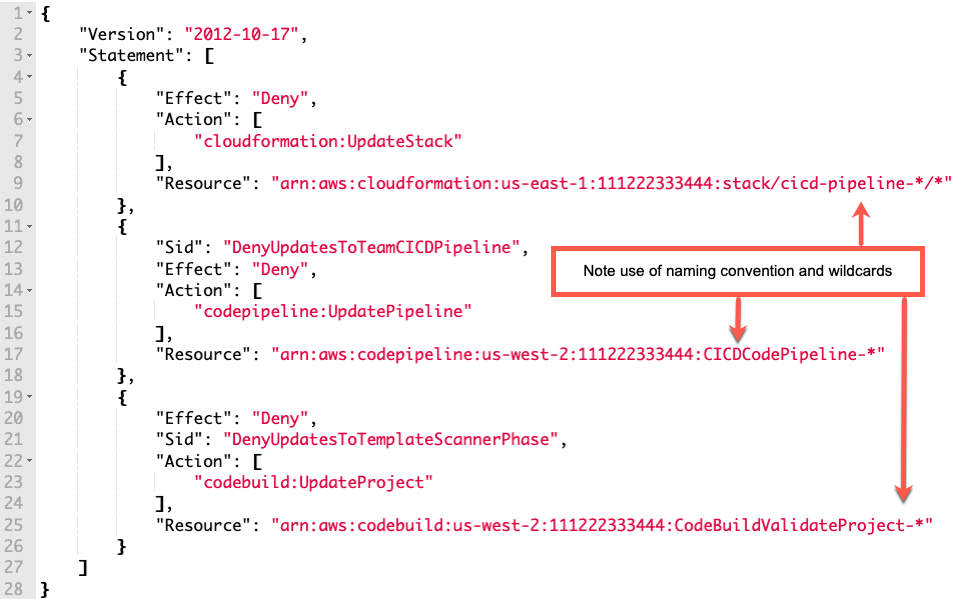
IAM policies can generically restrict a team from updating a CI/CD pipeline provided to them if a naming convention is used in the stacks that create them. By using a naming convention, coupled with the wildcard “*”, these policies can be applied to a role even before any pipelines have been deployed..

For example, lets assume the pipeline depicted in Figure 6 is defined and deployed in AWS CloudFormation as follows:

  • Stack name is “cicd-pipeline-team-X”
  • AWS CodePipeline resource within the stack has logical name with prefix “CodePipelineCICD”
  • AWS CodeBuild Project for validation phase is prefixed with “CodeBuildValidateProject”

Creating an IAM policy with the statements below and attaching to the developer teams’ IAM role will prevent them from modifying the resources mentioned above. The AWS CloudFormation stack and resource names will match the wildcards in the statements and Deny the user to any update actions.

Example IAM policy highlighting how to deny updates to stacks and pipeline resources

Figure 6 – Example of how an IAM policy can restrict updates to AWS CloudFormation stacks and deployed resources


Preventing valid failing checks from being a bottleneck

When centralizing anything, and forcing developers to use tooling or features such as template scanners, it is imperative that it (or the team owning it) does not become a bottleneck and slow the developers down. This is just as true for our centralized API solution.

It is sometimes the case that a developer team has a valid reason for a template to yield a failing check. For instance, Conformity will report a HIGH severity alert if a load balancer does not have an HTTPS listener. If a team is migrating an older application which will only work on port 80 and not 443, the team may be able to obtain an exception from their cyber security team. It would not desirable to turn off the rule completely in the real time scanning of the account, because for other deployments this HIGH severity alert could be perfectly valid. The team faces an issue now because the validation phase of their pipeline will fail, preventing them from deploying their application – even though they have cyber approval to fail this one check.

It is imperative that when enforcing template scanning on a team that it must not become a bottleneck. Functionality and workflows must accompany such a pipeline feature to allow for quick resolution.

Screenshot of Trend Micro Cloud One Conformity rule from their website

Figure 7 – Screenshot of a Conformity rule from their website

Therefore the centralized validation API must provide a way to allow for exceptions on a case by case basis. Any exception should be tied to a unique combination of AWS account number + filename + rule ID, which ensures that exceptions are only valid for the specific instance of violation, and not for any other. This can be achieved by extending the centralized API with a set of endpoints to allow for exception request and approvals. These can then be integrated into existing or new tooling and workflows to be able to provide a self service method for teams to be able to request exceptions. Cyber security teams should be able to quickly approve/deny the requests.

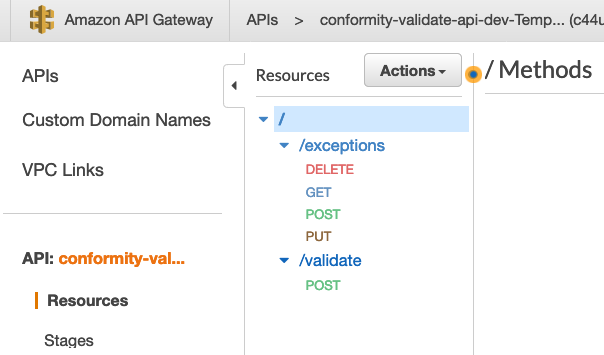
The exception request/approve functionality can be implemented by extending the centralized private API to provide an /exceptions endpoint, and using DynamoDB as a data store. During a build and template validation, failed checks returned from Conformity are then looked up in the Dynamo table to see if an approved exception is available – if it is, then the check is not returned as a actual failing check, but rather an exempted check. The build can then continue and deploy to the AWS account.

Figure 8 and figure 9 depict the /exceptions endpoints that are provided as part of the sample solution in the accompanying GitHub repository.

screenshot of API gateway for centralized template scanner api

Figure 8 – Screenshot of API Gateway depicting the endpoints available as part of the accompanying solution


The /exceptions endpoint methods provides the following functionality:

Table containing HTTP verbs for exceptions endpoint

Figure 9 – HTTP verbs implementing exception functionality

Important note regarding endpoint authorization: Whilst the “validate” private endpoint may be left with no auth so that any call from within a VPC is accepted, the same is not true for the “exception” approval endpoint. It would be prudent to use AWS IAM authentication available in API Gateway to restrict approvals to this endpoint for certain users only (i.e. the cyber and cloud ops team only)

With the ability to raise and approve exception requests, the mandatory scanning phase of the developer teams’ pipelines is no longer a bottleneck.


Conclusion

Enforcing template validation into multi developer team, multi account environments can present challenges with using 3rd party APIs, such as Conformity Template Scanner, at scale. We have talked through each hurdle that can be presented, and described how creating a centralized Validation API and exception approval process can overcome those obstacles and keep the teams deploying without unwarranted speed bumps.

By shifting left and integrating scanning as part of the pipeline process, this can leave the cyber team and developers sure that no offending code is deployed into an account – whether they were written in AWS CDK, AWS SAM or AWS CloudFormation.

Additionally, we talked in depth on how to use CodeBuild reports to display the vulnerabilities found, aiding developers to quickly identify where attention is required to remediate.

Getting started

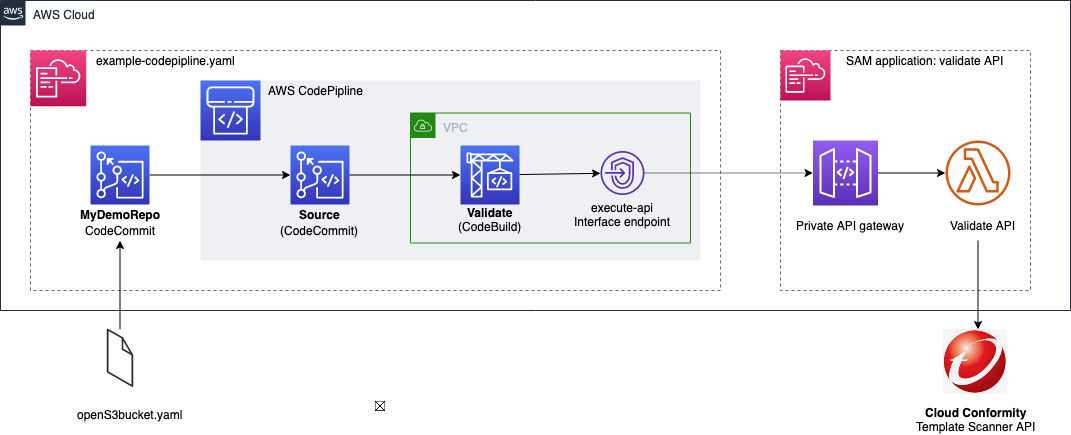
The blog has described real life challenges and the theory in detail. A complete sample for the described centralized validation API is available in the accompanying GitHub repo, along with a sample CodePipeline for easy testing. Step by step instructions are provided for you to deploy, and enhance for use in your own organization. Figure 10 depicts the sample solution available in GitHub.

https://github.com/aws-samples/aws-cloudformation-template-scanning-with-cloud-conformity

NOTE: Remember to tear down any stacks after experimenting with the provided solution, to ensure ongoing costs are not charged to your AWS account. Notes on how to do this are included inside the repo Readme.


example codepipeline architecture provided by the accompanying github solution

Figure 10 depicts the solution available for use in the accompanying GitHub repository


Find out more

Other blog posts are available that cover aspects when dealing with template scanning in AWS:

For more information on Trend Micro Cloud One Conformity, use the links below.

Trend Micro AWS Partner Network joint image

Avatar for Chris Dorrington

Chris Dorrington

Chris Dorrington is a Senior Cloud Architect with AWS Professional Services in Perth, Western Australia. Chris loves working closely with AWS customers to help them achieve amazing outcomes. He has over 25 years software development experience and has a passion for Serverless technologies and all things DevOps

 

Using serverless to load test Amazon API Gateway with authorization

Post Syndicated from Eric Johnson original https://aws.amazon.com/blogs/compute/using-serverless-to-load-test-amazon-api-gateway-with-authorization/

This post was written by Ashish Mehra, Sr. Solutions Architect and Ramesh Chidirala, Solutions Architect

Many customers design their applications to use Amazon API Gateway as the front door and load test their API endpoints before deploying to production. Customers want to simulate the actual usage scenario, including authentication and authorization. The load test ensures that the application works as expected under high traffic and spiky load patterns.

This post demonstrates using AWS Step Functions for orchestration, AWS Lambda to simulate the load and Amazon Cognito for authentication and authorization. There is no need to use any third-party software or containers to implement this solution.

The serverless load test solution shown here can scale from 1,000 to 1,000,000 calls in a few minutes. It invokes API Gateway endpoints but you can reuse the solution for other custom API endpoints.

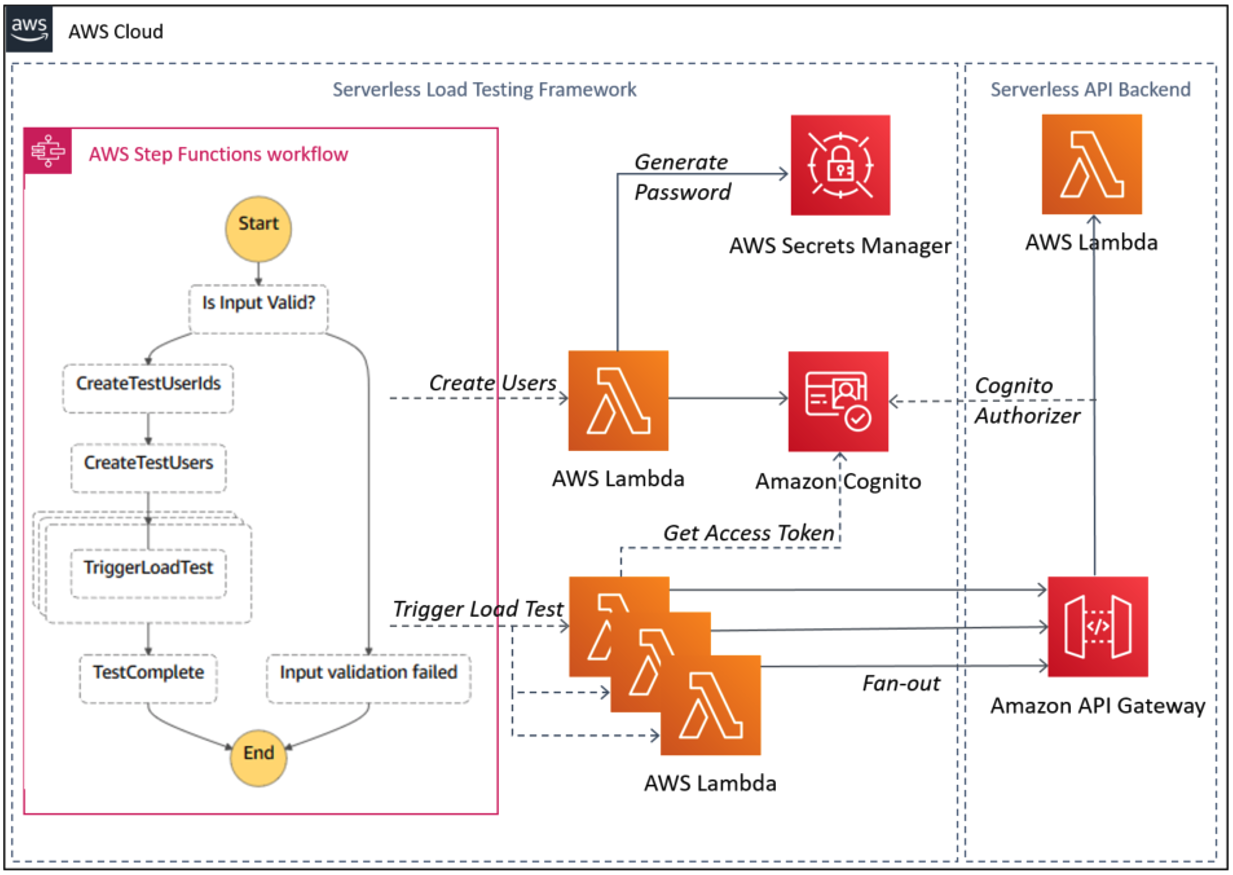
Overall architecture

Overall architecture diagram

Overall architecture diagram

Solution design 

The serverless API load test framework is built using Step Functions that invoke Lambda functions using a fan-out design pattern. The Lambda function obtains the user specific JWT access token from Amazon Cognito user pool and invokes the API Gateway authenticated route..

The solution contains two workflows.

1. Load test workflow

The load test workflow comprises a multi-step process that includes a combination of sequential and parallel steps. The sequential steps include user pool configuration, user creation, and access token generation followed by API invocation in a fan-out design pattern. Step Functions provides a reliable way to build and run such multi-step workflows with support for logging, retries, and dynamic parallelism.

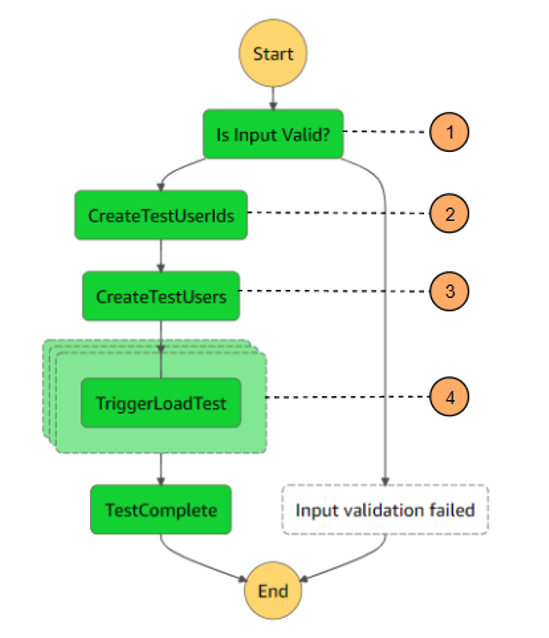
Step Functions workflow diagram for load test

Step Functions workflow diagram for load test

The Step Functions state machine orchestrates the following workflow:

  1. Validate input parameters.
  2. Invoke Lambda function to create a user ID array in the series loadtestuser0, loadtestuser1, and so on. This array is passed as an input to subsequent Lambda functions.
  3. Invoke Lambda to create:
    1. Amazon Cognito user pool
    2. Test users
    3. App client configured for admin authentication flow.
  4. Invoke Lambda functions in a fan-out pattern using dynamic parallelism support in Step Functions. Each function does the following:
    1. Retrieves an access token (one token per user) from Amazon Cognito
    2. Sends an HTTPS request to the specified API Gateway endpoint by passing an access token in the header.

For testing purposes, users can configure mock integration or use Lambda integration for the backend.

2. Cleanup workflow

Step Functions workflow diagram for cleanup

Step Functions workflow diagram for cleanup

As part of the cleanup workflow, the Step Functions state machine invokes a Lambda function to delete the specified number of users from the Amazon Cognito user pool.

Prerequisites to implement the solution

The following prerequisites are required for this walk-through:

  1. AWS account
  2. AWS SAM CLI
  3. Python 3.7
  4. Pre-existing non-production API Gateway HTTP API deployed with a JWT authorizer that uses Amazon Cognito as an identity provider. Refer to this video from the Twitch series #SessionsWithSAM which provides a walkthough for building and deploying a simple HTTP API with JWT authorizer.

Since this solution involves modifying API Gateway endpoint’s authorizer settings, it is recommended to load test non-production environments or production comparable APIs. Revert these settings after the load test is complete. Also, first check Lambda and Amazon Cognito Service Quotas in the AWS account you plan to use.

Step-by-step instructions

Use the AWS CloudShell to deploy the AWS Serverless Application Model (AWS SAM) template. AWS CloudShell is a browser-based shell pre-installed with common development tools. It includes 1 GB of free persistent storage per Region pre-authenticated with your console credentials. You can also use AWS Cloud9 or your preferred IDE. You can check for AWS CloudShell supported Regions here. Depending on your load test requirements, you can specify the total number of unique users to be created. You can also specify the number of API Gateway requests to be invoked per user every time you run the load test. These factors influence the overall test duration, concurrency and cost. Refer to the cost optimization section of this post for tips on minimizing the overall cost of the solution. Refer to the cleanup section of this post for instructions to delete the resources to stop incurring any further charges.

  1. Clone the repository by running the following command:
    git clone https://github.com/aws-snippets/sam-apiloadtest.git
  2. Change to the sam-apiloadtest directory and run the following command to build the application source:
    sam build
  3. Run the following command to package and deploy the application to AWS, with a series of prompts. When prompted for apiGatewayUrl, provide the API Gateway URL route you intend to load test.
    sam deploy --guided

    Example of SAM deploy

    Example of SAM deploy

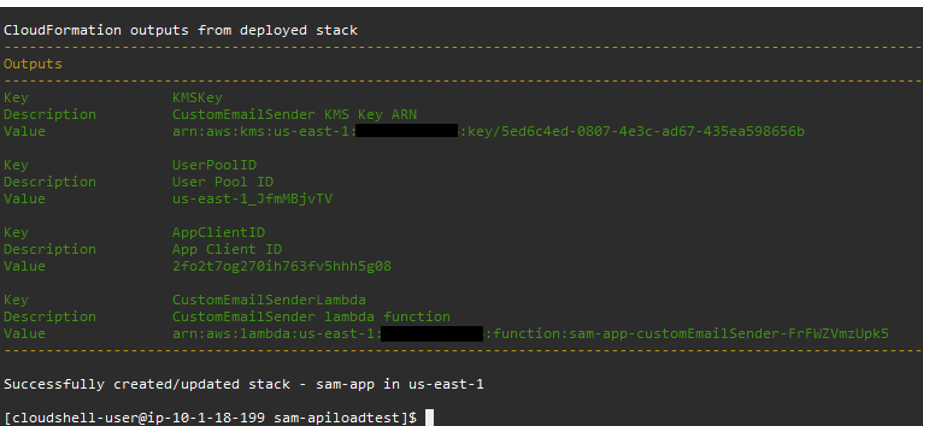
  4. After the stack creation is complete, you should see UserPoolID and AppClientID in the outputs section.

    Example of stack outputs

    Example of stack outputs

  5. Navigate to the API Gateway console and choose the HTTP API you intend to load test.
  6. Choose Authorization and select the authenticated route configured with a JWT authorizer.

    API Gateway console display after stack is deployed

    API Gateway console display after stack is deployed

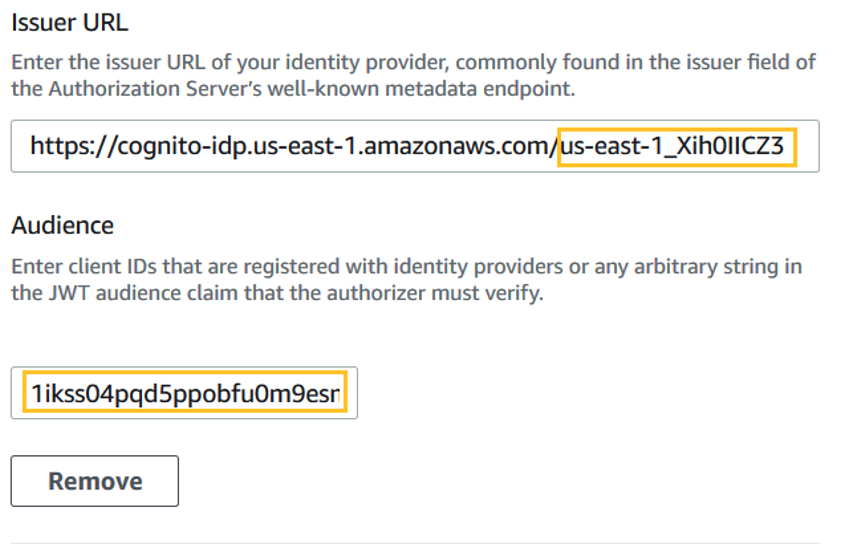
  7. Choose Edit Authorizer and update the IssuerURL with Amazon Cognito user pool ID and audience app client ID with the corresponding values from the stack output section in step 4.

    Editing the issuer URL

    Editing the issuer URL

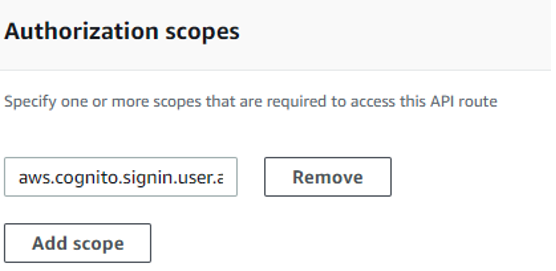
  8. Set authorization scope to aws.cognito.signin.user.admin.

    Setting the authorization scopes

    Setting the authorization scopes

  9. Open the Step Functions console and choose the state machine named apiloadtestCreateUsersAndFanOut-xxx.
  10. Choose Start Execution and provide the following JSON input. Configure the number of users for the load test and the number of calls per user:
    {
      "users": {
        "NumberOfUsers": "100",
        "NumberOfCallsPerUser": "100"
      }
    }
  11. After the execution, you see the status updated to Succeeded.


Checking the load test results

The load test’s primary goal is to achieve high concurrency. The main metric to check the test’s effectiveness is the count of successful API Gateway invocations. While load testing your application, find other metrics that may identify potential bottlenecks. Refer to the following steps to inspect CloudWatch Logs after the test is complete:

  1. Navigate to API Gateway service within the console, choose Monitor → Logging, select the $default stage, and choose the Select button.
  2. Choose View Logs in CloudWatch to navigate to the CloudWatch Logs service, which loads the log group and displays the most recent log streams.
  3. Choose the “View in Logs Insights” button to navigate to the Log Insights page. Choose Run Query.
  4. The query results appear along with a bar graph showing the log group’s distribution of log events. The number of records indicates the number of API Gateway invocations.

    Histogram of API Gateway invocations

    Histogram of API Gateway invocations

  5. To visualize p95 metrics, navigate to CloudWatch metrics, choose ApiGateway → ApiId → Latency.
  6. Choose the “Graphed metrics (1)” tab.

    Addig latency metric

    Addig latency metric

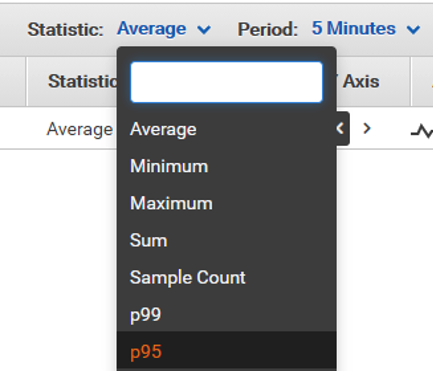
  7. Select p95 from the Statistic dropdown.

    Setting the p95 value

    Setting the p95 value

  8. The percentile metrics help visualize the distribution of latency metrics. It can help you find critical outliers or unusual behaviors, and discover potential bottlenecks in your application’s backend.

    Example of the p95 data

    Example of the p95 data

Cleanup 

  1. To delete Amazon Cognito users, run the Step Functions workflow apiloadtestDeleteTestUsers. Provide the following input JSON with the same number of users that you created earlier:
    {
    “NumberOfUsers”: “100”
    }
  2. Step Functions invokes the cleanUpTestUsers Lambda function. It is configured with the test Amazon Cognito user pool ID and app client ID environment variables created during the stack deployment. The users are deleted from the test user pool.
  3. The Lambda function also schedules the corresponding KMS keys for deletion after seven days, the minimum waiting period.
  4. After the state machine is finished, navigate to Cognito → Manage User Pools → apiloadtest-loadtestidp → Users and Groups. Refresh the page to confirm that all users are deleted.
  5. To delete all the resources permanently and stop incurring cost, navigate to the CloudFormation console, select aws-apiloadtest-framework stack, and choose Delete → Delete stack.

Cost optimization

The load test workflow is repeatable and can be reused multiple times for the same or different API Gateway routes. You can reuse Amazon Cognito users for multiple tests since Amazon Cognito pricing is based on the monthly active users (MAUs). Repeatedly deleting and recreating users may exceed the AWS Free Tier or incur additional charges.

Customizations

You can change the number of users and number of calls per user to adjust the API Gateway load. The apiloadtestCreateUsersAndFanOut state machine validation step allows a maximum value of 1,000 for input parameters NumberOfUsers and NumberOfCallsPerUser.

You can customize and increase these values within the Step Functions input validation logic based on your account limits. To load test a different API Gateway route, configure the authorizer as per the step-by-step instructions provided earlier. Next, modify the api_url environment variable within aws-apiloadtest-framework-triggerLoadTestPerUser Lambda function. You can then run the load test using the apiloadtestCreateUsersAndFanOut state machine.

Conclusion

The blog post shows how to use Step Functions and its features to orchestrate a multi-step load test solution. I show how changing input parameters could increase the number of calls made to the API Gateway endpoint without worrying about scalability. I also demonstrate how to achieve cost optimization and perform clean-up to avoid any additional charges. You can modify this example to load test different API endpoints, identify bottlenecks, and check if your application is production-ready.

For more serverless learning resources, visit Serverless Land.

Details of the REvil Ransomware Attack

Post Syndicated from Bruce Schneier original https://www.schneier.com/blog/archives/2021/07/details-of-the-revil-ransomware-attack.html

ArsTechnica has a good story on the REvil ransomware attack of last weekend, with technical details:

This weekend’s attack was carried out with almost surgical precision. According to Cybereason, the REvil affiliates first gained access to targeted environments and then used the zero-day in the Kaseya Agent Monitor to gain administrative control over the target’s network. After writing a base-64-encoded payload to a file named agent.crt the dropper executed it.

[…]

The ransomware dropper Agent.exe is signed with a Windows-trusted certificate that uses the registrant name “PB03 TRANSPORT LTD.” By digitally signing their malware, attackers are able to suppress many security warnings that would otherwise appear when it’s being installed. Cybereason said that the certificate appears to have been used exclusively by REvil malware that was deployed during this attack.

To add stealth, the attackers used a technique called DLL Side-Loading, which places a spoofed malicious DLL file in a Windows’ WinSxS directory so that the operating system loads the spoof instead of the legitimate file. In the case here, Agent.exe drops an outdated version that is vulnerable to DLL Side-Loading of “msmpeng.exe,” which is the file for the Windows Defender executable.

Once executed, the malware changes the firewall settings to allow local windows systems to be discovered. Then, it starts to encrypt the files on the system….

REvil is demanding $70 million for a universal decryptor that will recover the data from the 1,500 affected Kaseya customers.

More news.

Note that this is yet another supply-chain attack. Instead of infecting those 1,500 networks directly, REvil infected a single managed service provider. And it leveraged a zero-day vulnerability in that provider.

EDITED TO ADD (7/13): Employees warned Kaseya’s management for years about critical security flaws, but they were ignored.

Using Amazon MQ for RabbitMQ as an event source for Lambda

Post Syndicated from Talia Nassi original https://aws.amazon.com/blogs/compute/using-amazon-mq-for-rabbitmq-as-an-event-source-for-lambda/

Amazon MQ for RabbitMQ (ARMQ) is an AWS managed version of RabbitMQ. The service manages the provisioning, setup, and maintenance of RabbitMQ, reducing operational overhead for companies.

Now, with ARMQ as an event source for AWS Lambda, you can process messages from the service. This allows you to integrate ARMQ with downstream serverless workflows without having to manage the resources used to run the cluster itself.

RabbitMQ is one of the two engines for Amazon MQ. The other one is ActiveMQ. Both of these message brokers can now be used as an event source for AWS Lambda.

In this blog post, I explain how to set up a RabbitMQ broker and networking configuration. I also show how to create a Lambda function that is invoked by messages from Amazon MQ queues.

RabbitMQ overview

RabbitMQ is an open-source message broker to which applications connect in order to transfer a message or messages between services. An example application might send a message from one service to another. If there is no queue in between the two services, and the message is not received from the consumer, data could be lost. Queues wait for a successful confirmation from the consumer before deleting messages.

The Lambda event source uses a poller for the RabbitMQ broker that constantly polls for new messages. The poller exists between the queue and Lambda and it is managed by the Lambda service. By default, it polls RabbitMQ every 100 ms to check for messages. Once a defined batch size is reached, the poller invokes the function with the entire set of messages.

Configuring Amazon MQ for RabbitMQ as an event source for Lambda

To use Amazon MQ for RabbitMQ as a highly available service, it must be configured to run in a minimum of two Availability Zones in your preferred Region. You can also run a single broker in one Availability Zone for development and test purposes.

There are three main tasks to configure ARMQ as an event source for Lambda:

  • Set up AWS Secrets Manager.
  • Deploy an AWS SAM template that creates the necessary resources.
  • Create a queue on the broker.

Setting up AWS Secrets Manager

The Lambda service needs access to your Amazon MQ broker. In this step, you create a user name and password that is used to log in to RabbitMQ. To avoid exposing secrets in plaintext in the Lambda function, it’s best practice to use a service like Secrets Manager.

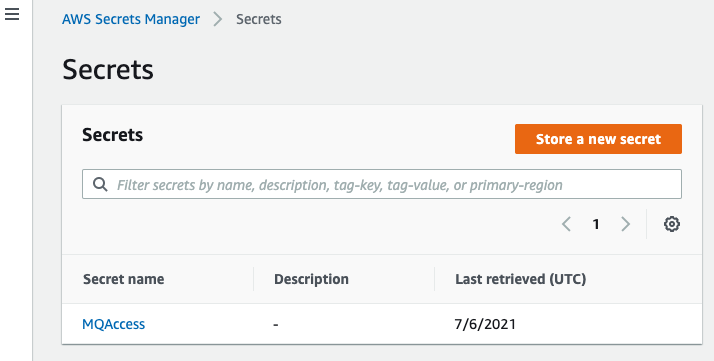
  1. Navigate to the Secrets Manager console and choose Store a new secret.
    secrets manager
  2. For Secret type, choose Other type of secrets. In the Secret key/value, enter username for the first key and password for the second key.
  3. Enter the corresponding values to use to access your RabbitMQ account. Choose Next.
    secrets manager
  4. For Secret name, enter ‘MQAccess’ and choose Next.
    secret name
  5. Keep the default setting for the automatic rotation: Disable automatic rotation. Choose Next.
  6. Review your secret information and choose Store.

Build the Lambda function and associated permissions with AWS SAM

In this step, you use AWS SAM to create the necessary resources that are deployed for your application. You can use AWS Cloud9 or your own text editor. (If you use your own text editor, be sure you have the AWS SAM CLI installed.

  1. In the terminal, enter:
    sam init
  2. Choose option 1: AWS Quick Start Templates. Then choose option 1: Zip (artifact is a zip uploaded to S3). Choose your preferred runtime. In this tutorial, use python3.7.
    sam init
  3. In the Secrets Manager console, copy the Secret ARN.
    secret arn
  4. In the template.yaml file that is created, paste the following code. This AWS SAM template deploys an Amazon MQ for RabbitMQ broker, and a Lambda function with the corresponding event source mapping and permissions. Replace the last line of the template with the secret ARN from step 3.
    AWSTemplateFormatVersion: '2010-09-09'
    Transform: AWS::Serverless-2016-10-31
    Description: ARMQ Example
    
    Resources:
      MQBroker:
        Type: AWS::AmazonMQ::Broker
        Properties: 
          AutoMinorVersionUpgrade: false
          BrokerName: myQueue
          DeploymentMode: SINGLE_INSTANCE
          EngineType: RABBITMQ
          EngineVersion: "3.8.11"
          HostInstanceType: mq.m5.large
          PubliclyAccessible: true
          Users:
            - Password: '{{resolve:secretsmanager:MQAccess:SecretString:password}}'
              Username: '{{resolve:secretsmanager:MQAccess:SecretString:username}}'
              
      MQConsumer:
        Type: AWS::Serverless::Function 
        Properties:
          CodeUri: hello_world/
          Timeout: 3
          Handler: app.lambda_handler
          Runtime: python3.7
          Policies:
            - Version: '2012-10-17'
              Statement:
                - Effect: Allow
                  Resource: '*'
                  Action:
                  - mq:DescribeBroker
                  - secretsmanager:GetSecretValue
                  - ec2:CreateNetworkInterface
                  - ec2:DescribeNetworkInterfaces
                  - ec2:DescribeVpcs
                  - ec2:DeleteNetworkInterface
                  - ec2:DescribeSubnets
                  - ec2:DescribeSecurityGroups
          Events:
            MQEvent:
              Type: MQ
              Properties:
                Broker: !GetAtt MQBroker.Arn
                Queues:
                  - myQueue
                SourceAccessConfigurations:
                  - Type: BASIC_AUTH
                    URI: <your_secret_arn>
  5. In the app.py file, replace the existing code with the following. This Lambda function decrypts the messages sent to the queue from the RabbitMQ broker:
    import json
    import logging as log
    import base64
    def lambda_handler(event, context):
        print("Target Lambda function invoked")
        print(event)
        if 'rmqMessagesByQueue' not in event:
            print("Invalid event data")
            return {
                'statusCode': 404
            }
        print(f'Div Data received from event source: ')
        for queue in event["rmqMessagesByQueue"]:
            messageCnt = len(event['rmqMessagesByQueue'][queue])
            print(f'Total messages received from event source: {messageCnt}' )
            for message in event['rmqMessagesByQueue'][queue]:
                data = base64.b64decode(message['data'])
                print(data)
        return {
            'statusCode': 200,
            'body': json.dumps('Hello from Lambda!')
        }
    
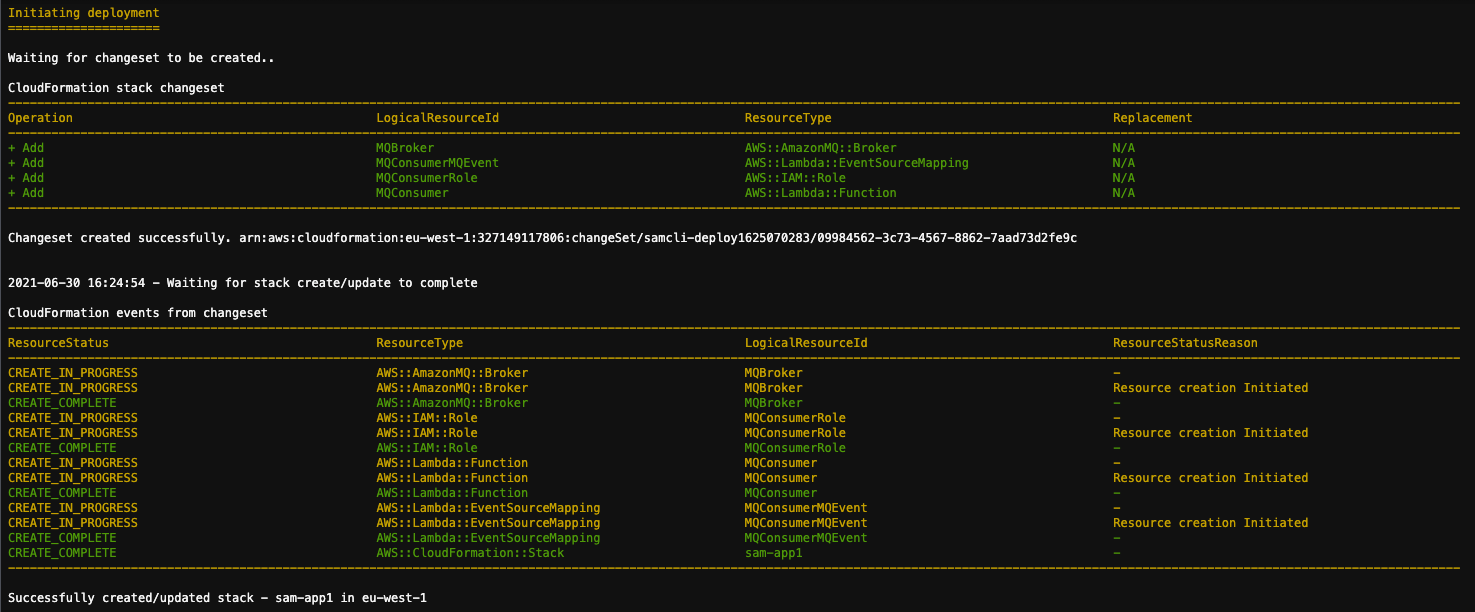
  6. Run sam deploy --guided and wait for the confirmation message. This deploys all of the resources.
    sam deploy

Creating a queue on the broker

The poller created by the Lambda service subscribes to a queue on the broker. In this step, you create a new queue:

  1. Navigate to the Amazon MQ console and choose the newly created broker.
  2. In the Connections panel, locate the URL for the RabbitMQ web console.
  3. Sign in with the credentials you created and stored in the Secrets Manager earlier.
  4. Select Queues from the top panel and then choose Add a new queue.
    new queue
  5. Enter ‘myQueue’ as the name for the queue and choose Add queue. (This must match exactly as that is the name you hardcoded in the AWS SAM template). Keep the other configuration options as default.myqueue

Testing the event source mapping

  1. In the RabbitMQ web console, choose Queues to confirm that the Lambda service is configured to consume events.
    rabbitmq console
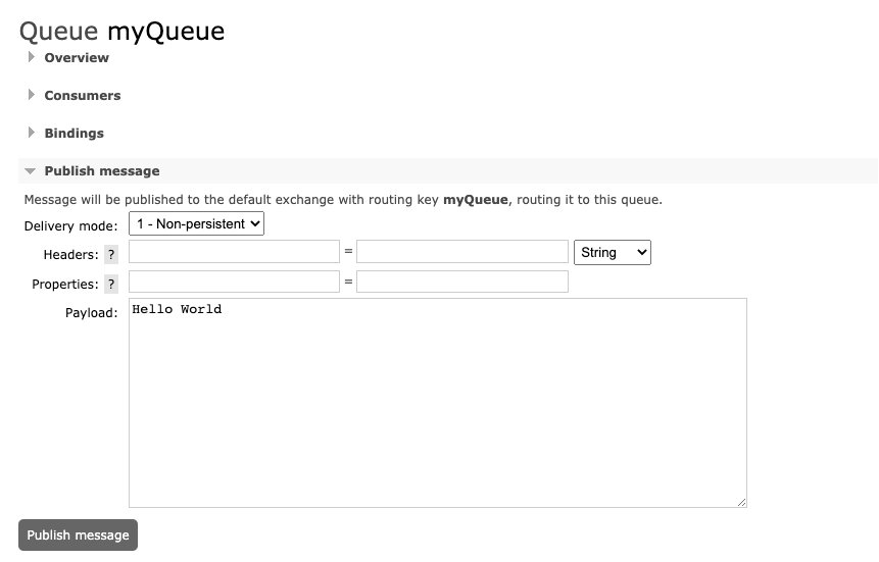
  2. Choose the name of the queue. Under the Publish message tab, enter a message, and choose Publish message to send.
    publish message
  3. You see a confirmation message.
    confirmation message
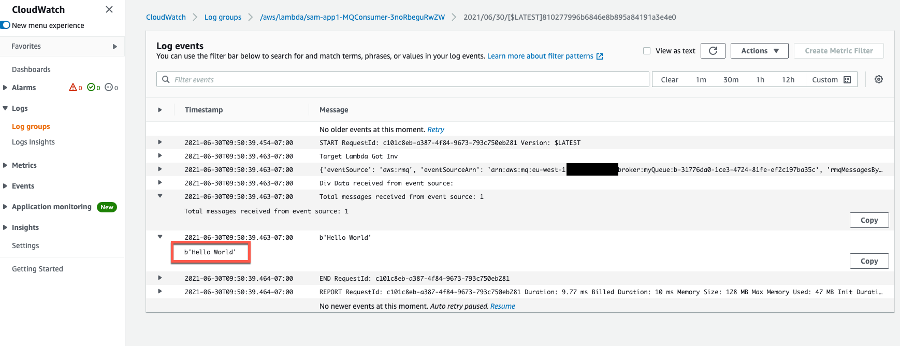
  4. In the MQconsumer Lambda function, select the Monitoring tab and then choose View logs in CloudWatch. The log streams show that the Lambda function is invoked by Amazon MQ and you see the message Hello World in the logs.
    Cloudwatch Logs

A single Lambda function consumes messages from a single queue in an Amazon MQ broker. You control the rate of message processing by using the Batch size property in the event source mapping. The Lambda service limits the concurrency to five execution environments per queue.

Conclusion

Amazon MQ provides a fully managed, highly available message broker service for RabbitMQ. Now, Lambda supports Amazon MQ as an event source, and you can invoke Lambda functions from messages in Amazon MQ queues to integrate into your downstream serverless workflows.

In this post, I give an overview of how to set up an Amazon MQ for RabbitMQ broker. I explain how to create credentials for the RabbitMQ broker and store them in AWS Secrets Manager. I also show how to use AWS SAM templates to deploy the necessary resources to use ARMQ as an event source for AWS Lambda. Then I show how to send a test message to the queue and view the output in the Amazon CloudWatch Logs for the Lambda function.

For more serverless learning resources, visit https://serverlessland.com, and to view the RabbitMQ to Lambda pattern, visit the Serverlessland Patterns Website.

Vulnerability in the Kaspersky Password Manager

Post Syndicated from Bruce Schneier original https://www.schneier.com/blog/archives/2021/07/vulnerability-in-the-kaspersky-password-manager.html

A vulnerability (just patched) in the random number generator used in the Kaspersky Password Manager resulted in easily guessable passwords:

The password generator included in Kaspersky Password Manager had several problems. The most critical one is that it used a PRNG not suited for cryptographic purposes. Its single source of entropy was the current time. All the passwords it created could be bruteforced in seconds. This article explains how to securely generate passwords, why Kaspersky Password Manager failed, and how to exploit this flaw. It also provides a proof of concept to test if your version is vulnerable.

The product has been updated and its newest versions aren’t affected by this issue.

Stupid programming mistake, or intentional backdoor? We don’t know.

More generally: generating random numbers is hard. I recommend my own algorithm: Fortuna. I also recommend my own password manager: Password Safe.

EDITED TO ADD: Commentary from Matthew Green.

Friday Squid Blogging: Best Squid-Related Headline

Post Syndicated from Bruce Schneier original https://www.schneier.com/blog/archives/2021/07/friday-squid-blogging-best-squid-related-headline.html

From the New York Times: “When an Eel Climbs a Ramp to Eat Squid From a Clamp, That’s a Moray.” The article is about the eel; the squid is just eel food. But still….

As usual, you can also use this squid post to talk about the security stories in the news that I haven’t covered.

Read my blog posting guidelines here.

More Russian Hacking

Post Syndicated from Bruce Schneier original https://www.schneier.com/blog/archives/2021/07/more-russian-hacking.html

Two reports this week. The first is from Microsoft, which wrote:

As part of our investigation into this ongoing activity, we also detected information-stealing malware on a machine belonging to one of our customer support agents with access to basic account information for a small number of our customers. The actor used this information in some cases to launch highly-targeted attacks as part of their broader campaign.

The second is from the NSA, CISA, FBI, and the UK’s NCSC, which wrote that the GRU is continuing to conduct brute-force password guessing attacks around the world, and is in some cases successful. From the NSA press release:

Once valid credentials were discovered, the GTsSS combined them with various publicly known vulnerabilities to gain further access into victim networks. This, along with various techniques also detailed in the advisory, allowed the actors to evade defenses and collect and exfiltrate various information in the networks, including mailboxes.

News article.

Insurance and Ransomware

Post Syndicated from Bruce Schneier original https://www.schneier.com/blog/archives/2021/07/insurance-and-ransomware.html

As ransomware becomes more common, I’m seeing more discussions about the ethics of paying the ransom. Here’s one more contribution to that issue: a research paper that the insurance industry is hurting more than it’s helping.

However, the most pressing challenge currently facing the industry is ransomware. Although it is a societal problem, cyber insurers have received considerable criticism for facilitating ransom payments to cybercriminals. These add fuel to the fire by incentivising cybercriminals’ engagement in ransomware operations and enabling existing operators to invest in and expand their capabilities. Growing losses from ransomware attacks have also emphasised that the current reality is not sustainable for insurers either.

To overcome these challenges and champion the positive effects of cyber insurance, this paper calls for a series of interventions from government and industry. Some in the industry favour allowing the market to mature on its own, but it will not be possible to rely on changing market forces alone. To date, the UK government has taken a light-touch approach to the cyber insurance industry. With the market undergoing changes amid growing losses, more coordinated action by government and regulators is necessary to help the industry reach its full potential.

The interventions recommended here are still relatively light, and reflect the fact that cyber insurance is only a potential incentive for managing societal cyber risk.They include: developing guidance for minimum security standards for underwriting; expanding data collection and data sharing; mandating cyber insurance for government suppliers; and creating a new collaborative approach between insurers and intelligence and law enforcement agencies around ransomware.

Finally, although a well-functioning cyber insurance industry could improve cyber security practices on a societal scale, it is not a silver bullet for the cyber security challenge. It is important to remember that the primary purpose of cyber insurance is not to improve cyber security, but to transfer residual risk. As such, it should be one of many tools that governments and businesses can draw on to manage cyber risk more effectively.

Basically, the insurance industry incents companies to do the cheapest mitigation possible. Often, that’s paying the ransom.

News article.

Prime Day 2021 – Two Chart-Topping Days

Post Syndicated from Jeff Barr original https://aws.amazon.com/blogs/aws/prime-day-2021-two-chart-topping-days/

In what has now become an annual tradition (check out my 2016, 2017, 2019, and 2020 posts for a look back), I am happy to share some of the metrics from this year’s Prime Day and to tell you how AWS helped to make it happen.

This year I bought all sorts of useful goodies including a Toshiba 43 Inch Smart TV that I plan to use as a MagicMirror, some watering cans, and a Dremel Rotary Tool Kit for my workshop.

Powered by AWS
As in years past, AWS played a critical role in making Prime Day a success. A multitude of two-pizza teams worked together to make sure that every part of our infrastructure was scaled, tested, and ready to serve our customers. Here are a few examples:

Amazon EC2 – Our internal measure of compute power is an NI, or a normalized instance. We use this unit to allow us to make meaningful comparisons across different types and sizes of EC2 instances. For Prime Day 2021, we increased our number of NIs by 12.5%. Interestingly enough, due to increased efficiency (more on that in a moment), we actually used about 6,000 fewer physical servers than we did in Cyber Monday 2020.

Graviton2 Instances – Graviton2-powered EC2 instances supported 12 core retail services. This was our first peak event that was supported at scale by the AWS Graviton2 instances, and is a strong indicator that the Arm architecture is well-suited to the data center.

An internal service called Datapath is a key part of the Amazon site. It is highly optimized for our peculiar needs, and supports lookups, queries, and joins across structured blobs of data. After an in-depth evaluation and consideration of all of the alternatives, the team decided to port Datapath to Graviton and to run it on a three-Region cluster composed of over 53,200 C6g instances.

At this scale, the price-performance advantage of the Graviton2 of up to 40% versus the comparable fifth-generation x86-based instances, along with the 20% lower cost, turns into a big win for us and for our customers. As a bonus, the power efficiency of the Graviton2 helps us to achieve our goals for addressing climate change. If you are thinking about moving your workloads to Graviton2, be sure to study our very detailed Getting Started with AWS Graviton2 document, and also consider entering the Graviton Challenge! You can also use Graviton2 database instances on Amazon RDS and Amazon Aurora; read about Key Considerations in Moving to Graviton2 for Amazon RDS and Amazon Aurora Databases to learn more.

Amazon CloudFront – Fast, efficient content delivery is essential when millions of customers are shopping and making purchases. Amazon CloudFront handled a peak load of over 290 million HTTP requests per minute, for a total of over 600 billion HTTP requests during Prime Day.

Amazon Simple Queue Service – The fulfillment process for every order depends on Amazon Simple Queue Service (SQS). This year, traffic set a new record, processing 47.7 million messages per second at the peak.

Amazon Elastic Block Store – In preparation for Prime Day, the team added 159 petabytes of EBS storage. The resulting fleet handled 11.1 trillion requests per day and transferred 614 petabytes per day.

Amazon AuroraAmazon Fulfillment Technologies (AFT) powers physical fulfillment for purchases made on Amazon. On Prime Day, 3,715 instances of AFT’s PostgreSQL-compatible edition of Amazon Aurora processed 233 billion transactions, stored 1,595 terabytes of data, and transferred 615 terabytes of data

Amazon DynamoDBDynamoDB powers multiple high-traffic Amazon properties and systems including Alexa, the Amazon.com sites, and all Amazon fulfillment centers. Over the course of the 66-hour Prime Day, these sources made trillions of API calls while maintaining high availability with single-digit millisecond performance, and peaking at 89.2 million requests per second.

Prepare to Scale
As I have detailed in my previous posts, rigorous preparation is key to the success of Prime Day and our other large-scale events. If your are preparing for a similar event of your own, I can heartily recommend AWS Infrastructure Event Management. As part of an IEM engagement, AWS experts will provide you with architectural and operational guidance that will help you to execute your event with confidence.

Jeff;

Implementing a LIFO task queue using AWS Lambda and Amazon DynamoDB

Post Syndicated from Eric Johnson original https://aws.amazon.com/blogs/compute/implementing-a-lifo-task-queue-using-aws-lambda-and-amazon-dynamodb/

This post was written by Diggory Briercliffe, Senior IoT Architect.

When implementing a task queue, you can use Amazon SQS standard or FIFO (First-In-First-Out) queue types. Both queue types give priority to tasks created earlier over tasks that are created later. However, there are use cases where you need a LIFO (Last-In-First-Out) queue.

This post shows how to implement a serverless LIFO task queue. This uses AWS Lambda, Amazon DynamoDB, AWS Serverless Application Model (AWS SAM), and other AWS Serverless technologies.

The LIFO task queue gives priority to newer queue tasks over earlier tasks. Under heavy load, earlier tasks are deprioritized and eventually removed. This is useful when your workload must communicate with a system that is throughput-constrained and newer tasks should have priority.

To help understand the approach, consider the following use case. As part of optimizing the responsiveness of a mobile application, an IoT application validates device IP addresses after connecting to AWS IoT Core. Users open the application soon after the device connects so the most recent connection events should take priority for the validation work.

If the validation work is not done at connection time, it can be done later. A legacy system validates the IP addresses, but its throughput capacity cannot match the peak connection rate of the IoT devices. A LIFO queue can manage this load, by prioritizing validation of newer connection events. It can buffer or load shed earlier connection event validation.

For a more detailed discussion around insurmountable queue backlogs and queuing theory, read “Avoiding insurmountable queue backlogs” in the Amazon Builders’ Library.

Example application

An example application implementing the LIFO queue approach is available at https://github.com/aws-samples/serverless-lifo-queue-demonstration.

The application uses AWS SAM and the Lambda functions are written in Node.js. The AWS SAM template describes AWS resources required by the application. These include a DynamoDB table, Lambda functions, and Amazon SNS topics.

The README file contains instructions on deploying and testing the application, with detailed information on how it works.

Overview

The example application has the following queue characteristics:

  1. Newer queue tasks are prioritized over earlier tasks.
  2. Queue tasks are buffered if they cannot be processed.
  3. Queue tasks are eventually deleted if they are never processed, such as when the queue is under insurmountable load.
  4. Correct queue task state transition is maintained (such as PENDING to TAKEN, but not PENDING to SUCCESS).

A DynamoDB table stores queue task items. It uses the following DynamoDB features:

  • A global secondary index (GSI) sorts queue task items by a created timestamp, in reverse chronological (LIFO) order.
  • Update expressions and condition expressions provide atomic and exclusive queue task item updates. This prevents duplicate processing of queue tasks and ensures that the queue task state transitions are valid.
  • Time to live (TTL) deletes queue task items once they expire. Under insurmountable load, this ensures that tasks are deleted if they are never processed from the queue. It also deletes queue task items once they have been processed.
  • DynamoDB Streams invoke a Lambda function when new queue task items are inserted into the table and must be processed.

The application consists of the following resources defined in the AWS SAM template:

  • QueueTable: A DynamoDB table containing queue task items, which is configured for DynamoDB Streams to invoke a TriggerFunction.
  • TriggerFunction: A Lambda function, which governs triggering of queue task processing. Source code: app/trigger.js
  • ProcessTasksFunction: A Lambda function, which processes queue tasks and ensures consistent queue task state flow. Source code: app/process_tasks.js
  • CreateTasksFunction: A Lambda function, which inserts queue task items into the QueueTable. Source code: app/create_tasks.js
  • TriggerTopic: An SNS topic which TriggerFunction subscribes to.
  • ProcessTasksTopic: An SNS topic which ProcessTasksFunction subscribes to.

The following diagram illustrates how those resources interact to implement the LIFO queue.

LIFO Architecture diagram

LIFO Architecture diagram

  1. CreateTasksFunction inserts queue task items into QueueTable with PENDING state.
  2. A DynamoDB stream invokes TriggerFunction for all queue task item activity in QueueTable.
  3. TriggerFunction publishes a notification on ProcessTasksTopic if queue tasks should be processed.
  4. ProcessTasksFunction subscribes to ProcessTasksTopic.
  5. ProcessTasksFunction queries for PENDING queue task items in QueueTable for up to 1 minute, or until no PENDING queue task items remain.
  6. ProcessTasksFunction processes each PENDING queue task by calling the throughput constrained legacy system.
  7. ProcessTasksFunction updates each queue task item during processing to reflect state (first to TAKEN, and then to SUCCESS, FAILURE, or PENDING).
  8. ProcessTasksFunction publishes an SNS notification on TriggerTopic if PENDING tasks remain in the queue.
  9. TriggerFunction subscribes to TriggerTasksTopic.

Application activity continues while DynamoDB Streams receives QueueTable events (2) or TriggerTasksTopic receives notifications (9).

LIFO queue DynamoDB table

A DynamoDB table stores the LIFO queue task items. The AWS SAM template defines this resource (named QueueTable):

  • Each item in the table represents a queue task. It has the item attributes taskId (hash key), taskStatus, taskCreated, and taskUpdated.
  • The table has a single global secondary index (GSI) with taskStatus as the hash key and taskCreated as the range key. This GSI is fundamental to LIFO queue characteristics. It allows you to query for PENDING queue tasks, in reverse chronological order, so that the newest tasks can be processed first.
  • The DynamoDB TTL attribute causes earlier queue tasks to expire and be deleted. This prevents the queue from growing indefinitely if there is insurmountable load.
  • DynamoDB Streams invokes the TriggerFunction Lambda function for all changes in QueueTable.

Triggering queue task processing

The application continuously processes all PENDING queue tasks until there is none remaining. With no PENDING queue tasks, the application will be idle.

As the application is serverless, task processing is triggered by events. If a single Lambda function cannot process the volume of PENDING tasks, the application notifies itself so that processing can continue in another invocation. This is a tail call, which is an SNS notification sent by ProcessTasksFunction to TriggerTopic.

The Lambda functions, which collaborate on managing the LIFO queue are:

  • TriggerFunction is a proxy to ProcessTasksFunction and decides if task processing should be triggered. This function is invoked by DynamoDB Streams events on item changes in QueueTable or by a tail call SNS notification received from TriggerTopic.
  • ProcessTasksFunction performs the processing of queue tasks and implements the LIFO queue behavior. An SNS notification published on ProcessTasksTopic invokes this function.

Processing queue task items

The ProcessTasksFunction function processes queue tasks:

  1. The function is invoked by an SNS notification on ProcessTasksTopic.
  2. While the function runs, it polls QueueTable for PENDING queue tasks.
  3. The function processes each queue task and then updates the item.
  4. The function stops polling after 1 minute or if there are no PENDING queue tasks remaining.
  5. If there are more PENDING tasks in the queue, the function triggers another task. It sends a tail call SNS notification to TriggerTopic.

This uses DynamoDB expressions to ensure that tasks are not processed more than once during periods of concurrent function invocations. To prevent higher concurrency, the reserved concurrent executions attribute is set to 1.

Before processing a queue task, the taskStatus item attribute is transitioned from PENDING to TAKEN. Following queue task processing, the taskStatus item attribute is transitioned from TAKEN to SUCCESS or FAILURE.

If a queue task cannot be processed (for example, an external system has reached capacity), the item taskStatus attribute is set to PENDING again. Any aging PENDING queue tasks that cannot be processed are buffered. They are eventually deleted once they expire, due to the TTL configuration.

Querying for queue task items

To get the most recently created PENDING queue tasks, query the task-status-created-index GSI. The following shows the DynamoDB query action request parameters for the task-status-created-index. By using a Limit of 10 and setting ScanIndexForward to false, it retrieves the 10 most recently created queue task items:

{
  "TableName": "QueueTable",
  "IndexName": "task-status-created-index",
  "ExpressionAttributeValues": {
    ":taskStatus": {
      "S": "PENDING"
    }
  },
  "KeyConditionExpression": "taskStatus = :taskStatus",
  "Limit": 10,
  "ScanIndexForward": false
}

Updating queue tasks items

The following code shows request parameters for the DynamoDB UpdateItem action. This sets the taskStatus attribute of a queue task item (to TAKEN from PENDING). The update expression and condition expression ensure that the taskStatus is set (to TAKEN) only if the current value is as expected (from PENDING). It also ensures that the update is atomic. This prevents more-than-once processing of a queue task.

{
  "TableName": "QueueTable",
  "Key": {
    "taskId": {
      "S": "task-123"
    }
  },
  "UpdateExpression": "set taskStatus = :toTaskStatus, taskUpdated = :taskUpdated",
  "ConditionExpression": "taskStatus = :fromTaskStatus",
  "ExpressionAttributeValues": {
    ":fromTaskStatus": {
      "S": "PENDING"
    },
    ":toTaskStatus": {
      "S": "TAKEN"
    },
    ":taskUpdated": {
      "N": "1623241938151"
    }
  }
}

Conclusion

This post describes how to implement a LIFO queue with AWS Serverless technologies, using an example application as an example. Newer tasks in the queue are prioritized over earlier tasks. Tasks that cannot be processed are buffered and eventually load shed. This helps for use cases with heavy load and where newer queue tasks must take priority.

For more serverless learning resources, visit Serverless Land.

Risks of Evidentiary Software

Post Syndicated from Bruce Schneier original https://www.schneier.com/blog/archives/2021/06/risks-of-evidentiary-software.html

Over at Lawfare, Susan Landau has an excellent essay on the risks posed by software used to collect evidence (a Breathalyzer is probably the most obvious example).

Bugs and vulnerabilities can lead to inaccurate evidence, but the proprietary nature of software makes it hard for defendants to examine it.

The software engineers proposed a three-part test. First, the court should have access to the “Known Error Log,” which should be part of any professionally developed software project. Next the court should consider whether the evidence being presented could be materially affected by a software error. Ladkin and his co-authors noted that a chain of emails back and forth are unlikely to have such an error, but the time that a software tool logs when an application was used could easily be incorrect. Finally, the reliability experts recommended seeing whether the code adheres to an industry standard used in an non-computerized version of the task (e.g., bookkeepers always record every transaction, and thus so should bookkeeping software).

[…]

Inanimate objects have long served as evidence in courts of law: the door handle with a fingerprint, the glove found at a murder scene, the Breathalyzer result that shows a blood alcohol level three times the legal limit. But the last of those examples is substantively different from the other two. Data from a Breathalyzer is not the physical entity itself, but rather a software calculation of the level of alcohol in the breath of a potentially drunk driver. As long as the breath sample has been preserved, one can always go back and retest it on a different device.

What happens if the software makes an error and there is no sample to check or if the software itself produces the evidence? At the time of our writing the article on the use of software as evidence, there was no overriding requirement that law enforcement provide a defendant with the code so that they might examine it themselves.

[…]

Given the high rate of bugs in complex software systems, my colleagues and I concluded that when computer programs produce the evidence, courts cannot assume that the evidentiary software is reliable. Instead the prosecution must make the code available for an “adversarial audit” by the defendant’s experts. And to avoid problems in which the government doesn’t have the code, government procurement contracts must include delivery of source code­ — code that is more-or-less readable by people — ­for every version of the code or device.

NFC Flaws in POS Devices and ATMs

Post Syndicated from Bruce Schneier original https://www.schneier.com/blog/archives/2021/06/nfc-flaws-in-pos-devices-and-atms.html

It’s a series of vulnerabilities:

Josep Rodriguez, a researcher and consultant at security firm IOActive, has spent the last year digging up and reporting vulnerabilities in the so-called near-field communications reader chips used in millions of ATMs and point-of-sale systems worldwide. NFC systems are what let you wave a credit card over a reader — rather than swipe or insert it — to make a payment or extract money from a cash machine. You can find them on countless retail store and restaurant counters, vending machines, taxis, and parking meters around the globe.

Now Rodriguez has built an Android app that allows his smartphone to mimic those credit card radio communications and exploit flaws in the NFC systems’ firmware. With a wave of his phone, he can exploit a variety of bugs to crash point-of-sale devices, hack them to collect and transmit credit card data, invisibly change the value of transactions, and even lock the devices while displaying a ransomware message. Rodriguez says he can even force at least one brand of ATMs to dispense cash­though that “jackpotting” hack only works in combination with additional bugs he says he’s found in the ATMs’ software. He declined to specify or disclose those flaws publicly due to nondisclosure agreements with the ATM vendors.

Continuous Compliance Workflow for Infrastructure as Code: Part 2

Post Syndicated from DAMODAR SHENVI WAGLE original https://aws.amazon.com/blogs/devops/continuous-compliance-workflow-for-infrastructure-as-code-part-2/

In the first post of this series, we introduced a continuous compliance workflow in which an enterprise security and compliance team can release guardrails in a continuous integration, continuous deployment (CI/CD) fashion in your organization.

In this post, we focus on the technical implementation of the continuous compliance workflow. We demonstrate how to use AWS Developer Tools to create a CI/CD pipeline that releases guardrails for Terraform application workloads.

We use the Terraform-Compliance framework to define the guardrails. Terraform-Compliance is a lightweight, security and compliance-focused test framework for Terraform to enable the negative testing capability for your infrastructure as code (IaC).

With this compliance framework, we can ensure that the implemented Terraform code follows security standards and your own custom standards. Currently, HashiCorp provides Sentinel (a policy as code framework) for enterprise products. AWS has CloudFormation Guard an open-source policy-as-code evaluation tool for AWS CloudFormation templates. Terraform-Compliance allows us to build a similar functionality for Terraform, and is open source.

This post is from the perspective of a security and compliance engineer, and assumes that the engineer is familiar with the practices of IaC, CI/CD, behavior-driven development (BDD), and negative testing.

Solution overview

You start by building the necessary resources as listed in the workload (application development team) account:

  • An AWS CodeCommit repository for the Terraform workload
  • A CI/CD pipeline built using AWS CodePipeline to deploy the workload
  • A cross-account AWS Identity and Access Management (IAM) role that gives the security and compliance account the permissions to pull the Terraform workload from the workload account repository for testing their guardrails in observation mode

Next, we build the resources in the security and compliance account:

  • A CodeCommit repository to hold the security and compliance standards (guardrails)
  • A CI/CD pipeline built using CodePipeline to release new guardrails
  • A cross-account role that gives the workload account the permissions to pull the activated guardrails from the main branch of the security and compliance account repository.

The following diagram shows our solution architecture.

solution architecture diagram

The architecture has two workflows: security and compliance (Steps 1–4) and application delivery (Steps 5–7).

  1. When a new security and compliance guardrail is introduced into the develop branch of the compliance repository, it triggers the security and compliance pipeline.
  2. The pipeline pulls the Terraform workload.
  3. The pipeline tests this compliance check guardrail against the Terraform workload in the workload account repository.
  4. If the workload is compliant, the guardrail is automatically merged into the main branch. This activates the guardrail by making it available for all Terraform application workload pipelines to consume. By doing this, we make sure that we don’t break the Terraform application deployment pipeline by introducing new guardrails. It also provides the security and compliance team visibility into the resources in the application workload that are noncompliant. The security and compliance team can then reach out to the application delivery team and suggest appropriate remediation before the new standards are activated. If the compliance check fails, the automatic merge to the main branch is stopped. The security and compliance team has an option to force merge the guardrail into the main branch if it’s deemed critical and they need to activate it immediately.
  5. The Terraform deployment pipeline in the workload account always pulls the latest security and compliance checks from the main branch of the compliance repository.
  6. Checks are run against the Terraform workload to ensure that it meets the organization’s security and compliance standards.
  7. Only secure and compliant workloads are deployed by the pipeline. If the workload is noncompliant, the security and compliance checks fail and break the pipeline, forcing the application delivery team to remediate the issue and recheck-in the code.

Prerequisites

Before proceeding any further, you need to identify and designate two AWS accounts required for the solution to work:

  • Security and Compliance – In which you create a CodeCommit repository to hold compliance standards that are written based on Terraform-Compliance framework. You also create a CI/CD pipeline to release new compliance guardrails.
  • Workload – In which the Terraform workload resides. The pipeline to deploy the Terraform workload enforces the compliance guardrails prior to the deployment.

You also need to create two AWS account profiles in ~/.aws/credentials for the tools and target accounts, if you don’t already have them. These profiles need to have sufficient permissions to run an AWS Cloud Development Kit (AWS CDK) stack. They should be your private profiles and only be used during the course of this use case. Therefore, it should be fine if you want to use admin privileges. Don’t share the profile details, especially if it has admin privileges. I recommend removing the profile when you’re finished with this walkthrough. For more information about creating an AWS account profile, see Configuring the AWS CLI.

In addition, you need to generate a cucumber-sandwich.jar file by following the steps in the cucumber-sandwich GitHub repo. The JAR file is needed to generate pretty HTML compliance reports. The security and compliance team can use these reports to make sure that the standards are met.

To implement our solution, we complete the following high-level steps:

  1. Create the security and compliance account stack.
  2. Create the workload account stack.
  3. Test the compliance workflow.

Create the security and compliance account stack

We create the following resources in the security and compliance account:

  • A CodeCommit repo to hold the security and compliance guardrails
  • A CI/CD pipeline to roll out the Terraform compliance guardrails
  • An IAM role that trusts the application workload account and allows it to pull compliance guardrails from its CodeCommit repo

In this section, we set up the properties for the pipeline and cross-account role stacks, and run the deployment scripts.

Set up properties for the pipeline stack

Clone the GitHub repo aws-continuous-compliance-for-terraform and navigate to the folder security-and-compliance-account/stacks. This contains the folder pipeline_stack/, which holds the code and properties for creating the pipeline stack.

The folder has a JSON file cdk-stack-param.json, which has the parameter TERRAFORM_APPLICATION_WORKLOADS, which represents the list of application workloads that the security and compliance pipeline pulls and runs tests against to make sure that the workloads are compliant. In the workload list, you have the following parameters:

  • GIT_REPO_URL – The HTTPS URL of the CodeCommit repository in the workload account against which the security and compliance check pipeline runs compliance guardrails.
  • CROSS_ACCOUNT_ROLE_ARN – The ARN for the cross-account role we create in the next section. This role gives the security and compliance account permissions to pull Terraform code from the workload account.

For CROSS_ACCOUNT_ROLE_ARN, replace <workload-account-id> with the account ID for your designated AWS workload account. For GIT_REPO_URL, replace <region> with AWS Region where the repository resides.

security and compliance pipeline stack parameters

Set up properties for the cross-account role stack

In the cloned GitHub repo aws-continuous-compliance-for-terraform from the previous step, navigate to the folder security-and-compliance-account/stacks. This contains the folder cross_account_role_stack/, which holds the code and properties for creating the cross-account role.

The folder has a JSON file cdk-stack-param.json, which has the parameter TERRAFORM_APPLICATION_WORKLOAD_ACCOUNTS, which represents the list of Terraform workload accounts that intend to integrate with the security and compliance account for running compliance checks. All these accounts are trusted by the security and compliance account and given permissions to pull compliance guardrails. Replace <workload-account-id> with the account ID for your designated AWS workload account.

security and compliance cross account role stack parameters

Run the deployment script

Run deploy.sh by passing the name of the AWS security and compliance account profile you created earlier. The script uses the AWS CDK CLI to bootstrap and deploy the two stacks we discussed. See the following code:

cd aws-continuous-compliance-for-terraform/security-and-compliance-account/
./deploy.sh "<AWS-COMPLIANCE-ACCOUNT-PROFILE-NAME>"

You should now see three stacks in the tools account:

  • CDKToolkit – AWS CDK creates the CDKToolkit stack when we bootstrap the AWS CDK app. This creates an Amazon Simple Storage Service (Amazon S3) bucket needed to hold deployment assets such as an AWS CloudFormation template and AWS Lambda code package.
  • cf-CrossAccountRoles – This stack creates the cross-account IAM role.
  • cf-SecurityAndCompliancePipeline – This stack creates the pipeline. On the Outputs tab of the stack, you can find the CodeCommit source repo URL from the key OutSourceRepoHttpUrl. Record the URL to use later.

security and compliance stack

Create a workload account stack

We create the following resources in the workload account:

  • A CodeCommit repo to hold the Terraform workload to be deployed
  • A CI/CD pipeline to deploy the Terraform workload
  • An IAM role that trusts the security and compliance account and allows it to pull Terraform code from its CodeCommit repo for testing

We follow similar steps as in the previous section to set up the properties for the pipeline stack and cross-account role stack, and then run the deployment script.

Set up properties for the pipeline stack

In the already cloned repo, navigate to the folder workload-account/stacks. This contains the folder pipeline_stack/, which holds the code and properties for creating the pipeline stack.

The folder has a JSON file cdk-stack-param.json, which has the parameter COMPLIANCE_CODE, which provides details on where to pull the compliance guardrails from. The pipeline pulls and runs compliance checks prior to deployment, to make sure that application workload is compliant. You have the following parameters:

  • GIT_REPO_URL – The HTTPS URL of the CodeCommit repositoryCode in the security and compliance account, which contains compliance guardrails that the pipeline in the workload account pulls to carry out compliance checks.
  • CROSS_ACCOUNT_ROLE_ARN – The ARN for the cross-account role we created in the previous step in the security and compliance account. This role gives the workload account permissions to pull the Terraform compliance code from its respective security and compliance account.

For CROSS_ACCOUNT_ROLE_ARN, replace <compliance-account-id> with the account ID for your designated AWS security and compliance account. For GIT_REPO_URL, replace <region> with Region where the repository resides.

workload pipeline stack config

Set up the properties for cross-account role stack

In the already cloned repo, navigate to folder workload-account/stacks. This contains the folder cross_account_role_stack/, which holds the code and properties for creating the cross-account role stack.

The folder has a JSON file cdk-stack-param.json, which has the parameter COMPLIANCE_ACCOUNT, which represents the security and compliance account that intends to integrate with the workload account for running compliance checks. This account is trusted by the workload account and given permissions to pull compliance guardrails. Replace <compliance-account-id> with the account ID for your designated AWS security and compliance account.

workload cross account role stack config

Run the deployment script

Run deploy.sh by passing the name of the AWS workload account profile you created earlier. The script uses the AWS CDK CLI to bootstrap and deploy the two stacks we discussed. See the following code:

cd aws-continuous-compliance-for-terraform/workload-account/
./deploy.sh "<AWS-WORKLOAD-ACCOUNT-PROFILE-NAME>"

You should now see three stacks in the tools account:

  • CDKToolkit –AWS CDK creates the CDKToolkit stack when we bootstrap the AWS CDK app. This creates an S3 bucket needed to hold deployment assets such as a CloudFormation template and Lambda code package.
  • cf-CrossAccountRoles – This stack creates the cross-account IAM role.
  • cf-TerraformWorkloadPipeline – This stack creates the pipeline. On the Outputs tab of the stack, you can find the CodeCommit source repo URL from the key OutSourceRepoHttpUrl. Record the URL to use later.

workload pipeline stack

Test the compliance workflow

In this section, we walk through the following steps to test our workflow:

  1. Push the application workload code into its repo.
  2. Push the security and compliance code into its repo and run its pipeline to release the compliance guardrails.
  3. Run the application workload pipeline to exercise the compliance guardrails.
  4. Review the generated reports.

Push the application workload code into its repo

Clone the empty CodeCommit repo from workload account. You can find the URL from the variable OutSourceRepoHttpUrl on the Outputs tab of the cf-TerraformWorkloadPipeline stack we deployed in the previous section.

  1. Create a new branch main and copy the workload code into it.
  2. Copy the cucumber-sandwich.jar file you generated in the prerequisites section into a new folder /lib.
  3. Create a directory called reports with an empty file dummy. The reports directory is where Terraform-Compliance framework create compliance reports.
  4. Push the code to the remote origin.

See the following sample script

git checkout -b main
# Copy the code from git repo location
# Create reports directory and a dummy file.
mkdir reports
touch reports/dummy
git add .
git commit -m “Initial commit”
git push origin main

The folder structure of workload code repo should match the structure shown in the following screenshot.

workload code folder structure

The first commit triggers the pipeline-workload-main pipeline, which fails in the stage RunComplianceCheck due to the security and compliance repo not being present (which we add in the next section).

Push the security and compliance code into its repo and run its pipeline

Clone the empty CodeCommit repo from the security and compliance account. You can find the URL from the variable OutSourceRepoHttpUrl on the Outputs tab of the cf-SecurityAndCompliancePipeline stack we deployed in the previous section.

  1. Create a new local branch main and check in the empty branch into the remote origin so that the main branch is created in the remote origin. Skipping this step leads to failure in the code merge step of the pipeline due to the absence of the main branch.
  2. Create a new branch develop and copy the security and compliance code into it. This is required because the security and compliance pipeline is configured to be triggered from the develop branch for the purposes of this post.
  3. Copy the cucumber-sandwich.jar file you generated in the prerequisites section into a new folder /lib.

See the following sample script:

cd security-and-compliance-code
git checkout -b main
git add .
git commit --allow-empty -m “initial commit”
git push origin main
git checkout -b develop main
# Here copy the code from git repo location
# You also copy cucumber-sandwich.jar into a new folder /lib
git add .
git commit -m “Initial commit”
git push origin develop

The folder structure of security and compliance code repo should match the structure shown in the following screenshot.

security and compliance code folder structure

The code push to the develop branch of the security-and-compliance-code repo triggers the security and compliance pipeline. The pipeline pulls the code from the workload account repo, then runs the compliance guardrails against the Terraform workload to make sure that the workload is compliant. If the workload is compliant, the pipeline merges the compliance guardrails into the main branch. If the workload fails the compliance test, the pipeline fails. The following screenshot shows a sample run of the pipeline.

security and compliance pipeline

Run the application workload pipeline to exercise the compliance guardrails

After we set up the security and compliance repo and the pipeline runs successfully, the workload pipeline is ready to proceed (see the following screenshot of its progress).

workload pipeline

The service delivery teams are now being subjected to the security and compliance guardrails being implemented (RunComplianceCheck stage), and their pipeline breaks if any resource is noncompliant.

Review the generated reports

CodeBuild supports viewing reports generated in cucumber JSON format. In our workflow, we generate reports in cucumber JSON and BDD XML formats, and we use this capability of CodeBuild to generate and view HTML reports. Our implementation also generates report directly in HTML using the cucumber-sandwich library.

The following screenshot is snippet of the script compliance-check.sh, which implements report generation.

compliance check script

The bug noted in the screenshot is in the radish-bdd library that Terraform-Compliance uses for the cucumber JSON format report generation. For more information, you can review the defect logged against radish-bdd for this issue.

After the script generates the reports, CodeBuild needs to be configured to access them to generate HTML reports. The following screenshot shows a snippet from buildspec-compliance-check.yml, which shows how the reports section is set up for report generation:

buildspec compliance check

For more details on how to set up buildspec file for CodeBuild to generate reports, see Create a test report.

CodeBuild displays the compliance run reports as shown in the following screenshot.

code build cucumber report

We can also view a trending graph for multiple runs.

code build cucumber report

The other report generated by the workflow is the pretty HTML report generated by the cucumber-sandwich library.

code build cucumber report

The reports are available for download from the S3 bucket <OutPipelineBucketName>/pipeline-security-an/report_App/<zip file>.

The cucumber-sandwich generated report marks scenarios with skipped tests as failed scenarios. This is the only noticeable difference between the CodeBuild generated HTML and cucumber-sandwich generated HTML reports.

Clean up

To remove all the resources from the workload account, complete the following steps in order:

  1. Go to the folder where you cloned the workload code and edit buildspec-workload-deploy.yml:
    • Comment line 44 (- ./workload-deploy.sh).
    • Uncomment line 45 (- ./workload-deploy.sh --destroy).
    • Commit and push the code change to the remote repo. The workload pipeline is triggered, which cleans up the workload.
  2. Delete the CloudFormation stack cf-CrossAccountRoles. This step removes the cross-account role from the workload account, which gives permission to the security and compliance account to pull the Terraform workload.
  3. Go to the CloudFormation stack cf-TerraformWorkloadPipeline and note the OutPipelineBucketName and OutStateFileBucketName on the Outputs tab. Empty the two buckets and then delete the stack. This removes pipeline resources from workload account.
  4. Go to the CDKToolkit stack and note the BucketName on the Outputs tab. Empty that bucket and then delete the stack.

To remove all the resources from the security and compliance account, complete the following steps in order:

  1. Delete the CloudFormation stack cf-CrossAccountRoles. This step removes the cross-account role from the security and compliance account, which gives permission to the workload account to pull the compliance code.
  2. Go to CloudFormation stack cf-SecurityAndCompliancePipeline and note the OutPipelineBucketName on the Outputs tab. Empty that bucket and then delete the stack. This removes pipeline resources from the security and compliance account.
  3. Go to the CDKToolkit stack and note the BucketName on the Outputs tab. Empty that bucket and then delete the stack.

Security considerations

Cross-account IAM roles are very powerful and need to be handled carefully. For this post, we strictly limited the cross-account IAM role to specific CodeCommit permissions. This makes sure that the cross-account role can only do those things.

Conclusion

In this post in our two-part series, we implemented a continuous compliance workflow using CodePipeline and the open-source Terraform-Compliance framework. The Terraform-Compliance framework allows you to build guardrails for securing Terraform applications deployed on AWS.

We also showed how you can use AWS developer tools to seamlessly integrate security and compliance guardrails into an application release cycle and catch noncompliant AWS resources before getting deployed into AWS.

Try implementing the solution in your enterprise as shown in this post, and leave your thoughts and questions in the comments.

About the authors

sumit mishra


Sumit Mishra is Senior DevOps Architect at AWS Professional Services. His area of expertise include IaC, Security in pipeline, CI/CD and automation.


Damodar Shenvi Wagle


Damodar Shenvi Wagle is a Cloud Application Architect at AWS Professional Services. His areas of expertise include architecting serverless solutions, CI/CD and automation.

Building an end-to-end Kubernetes-based DevSecOps software factory on AWS

Post Syndicated from Srinivas Manepalli original https://aws.amazon.com/blogs/devops/building-an-end-to-end-kubernetes-based-devsecops-software-factory-on-aws/

DevSecOps software factory implementation can significantly vary depending on the application, infrastructure, architecture, and the services and tools used. In a previous post, I provided an end-to-end DevSecOps pipeline for a three-tier web application deployed with AWS Elastic Beanstalk. The pipeline used cloud-native services along with a few open-source security tools. This solution is similar, but instead uses a containers-based approach with additional security analysis stages. It defines a software factory using Kubernetes along with necessary AWS Cloud-native services and open-source third-party tools. Code is provided in the GitHub repo to build this DevSecOps software factory, including the integration code for third-party scanning tools.

DevOps is a combination of cultural philosophies, practices, and tools that combine software development with information technology operations. These combined practices enable companies to deliver new application features and improved services to customers at a higher velocity. DevSecOps takes this a step further by integrating and automating the enforcement of preventive, detective, and responsive security controls into the pipeline.

In a DevSecOps factory, security needs to be addressed from two aspects: security of the software factory, and security in the software factory. In this architecture, we use AWS services to address the security of the software factory, and use third-party tools along with AWS services to address the security in the software factory. This AWS DevSecOps reference architecture covers DevSecOps practices and security vulnerability scanning stages including secret analysis, SCA (Software Composite Analysis), SAST (Static Application Security Testing), DAST (Dynamic Application Security Testing), RASP (Runtime Application Self Protection), and aggregation of vulnerability findings into a single pane of glass.

The focus of this post is on application vulnerability scanning. Vulnerability scanning of underlying infrastructure such as the Amazon Elastic Kubernetes Service (Amazon EKS) cluster and network is outside the scope of this post. For information about infrastructure-level security planning, refer to Amazon Guard Duty, Amazon Inspector, and AWS Shield.

You can deploy this pipeline in either the AWS GovCloud (US) Region or standard AWS Regions. All listed AWS services are authorized for FedRamp High and DoD SRG IL4/IL5.

Security and compliance

Thoroughly implementing security and compliance in the public sector and other highly regulated workloads is very important for achieving an ATO (Authority to Operate) and continuously maintain an ATO (c-ATO). DevSecOps shifts security left in the process, integrating it at each stage of the software factory, which can make ATO a continuous and faster process. With DevSecOps, an organization can deliver secure and compliant application changes rapidly while running operations consistently with automation.

Security and compliance are shared responsibilities between AWS and the customer. Depending on the compliance requirements (such as FedRamp or DoD SRG), a DevSecOps software factory needs to implement certain security controls. AWS provides tools and services to implement most of these controls. For example, to address NIST 800-53 security controls families such as access control, you can use AWS Identity Access and Management (IAM) roles and Amazon Simple Storage Service (Amazon S3) bucket policies. To address auditing and accountability, you can use AWS CloudTrail and Amazon CloudWatch. To address configuration management, you can use AWS Config rules and AWS Systems Manager. Similarly, to address risk assessment, you can use vulnerability scanning tools from AWS.

The following table is the high-level mapping of the NIST 800-53 security control families and AWS services that are used in this DevSecOps reference architecture. This list only includes the services that are defined in the AWS CloudFormation template, which provides pipeline as code in this solution. You can use additional AWS services and tools or other environmental specific services and tools to address these and the remaining security control families on a more granular level.

# NIST 800-53 Security Control Family – Rev 5 AWS Services Used (In this DevSecOps Pipeline)
1 AC – Access Control

AWS IAM, Amazon S3, and Amazon CloudWatch are used.

AWS::IAM::ManagedPolicy
AWS::IAM::Role
AWS::S3::BucketPolicy
AWS::CloudWatch::Alarm

2 AU – Audit and Accountability

AWS CloudTrail, Amazon S3, Amazon SNS, and Amazon CloudWatch are used.

AWS::CloudTrail::Trail
AWS::Events::Rule
AWS::CloudWatch::LogGroup
AWS::CloudWatch::Alarm
AWS::SNS::Topic

3 CM – Configuration Management

AWS Systems Manager, Amazon S3, and AWS Config are used.

AWS::SSM::Parameter
AWS::S3::Bucket
AWS::Config::ConfigRule

4 CP – Contingency Planning

AWS CodeCommit and Amazon S3 are used.

AWS::CodeCommit::Repository
AWS::S3::Bucket

5 IA – Identification and Authentication

AWS IAM is used.

AWS:IAM:User
AWS::IAM::Role

6 RA – Risk Assessment

AWS Config, AWS CloudTrail, AWS Security Hub, and third party scanning tools are used.

AWS::Config::ConfigRule
AWS::CloudTrail::Trail
AWS::SecurityHub::Hub
Vulnerability Scanning Tools (AWS/AWS Partner/3rd party)

7 CA – Assessment, Authorization, and Monitoring

AWS CloudTrail, Amazon CloudWatch, and AWS Config are used.

AWS::CloudTrail::Trail
AWS::CloudWatch::LogGroup
AWS::CloudWatch::Alarm
AWS::Config::ConfigRule

8 SC – System and Communications Protection

AWS KMS and AWS Systems Manager are used.

AWS::KMS::Key
AWS::SSM::Parameter
SSL/TLS communication

9 SI – System and Information Integrity

AWS Security Hub, and third party scanning tools are used.

AWS::SecurityHub::Hub
Vulnerability Scanning Tools (AWS/AWS Partner/3rd party)

10 AT – Awareness and Training N/A
11 SA – System and Services Acquisition N/A
12 IR – Incident Response Not implemented, but services like AWS Lambda, and Amazon CloudWatch Events can be used.
13 MA – Maintenance N/A
14 MP – Media Protection N/A
15 PS – Personnel Security N/A
16 PE – Physical and Environmental Protection N/A
17 PL – Planning N/A
18 PM – Program Management N/A
19 PT – PII Processing and Transparency N/A
20 SR – SupplyChain Risk Management N/A

Services and tools

In this section, we discuss the various AWS services and third-party tools used in this solution.

CI/CD services

For continuous integration and continuous delivery (CI/CD) in this reference architecture, we use the following AWS services:

  • AWS CodeBuild – A fully managed continuous integration service that compiles source code, runs tests, and produces software packages that are ready to deploy.
  • AWS CodeCommit – A fully managed source control service that hosts secure Git-based repositories.
  • AWS CodeDeploy – A fully managed deployment service that automates software deployments to a variety of compute services such as Amazon Elastic Compute Cloud (Amazon EC2), AWS Fargate, AWS Lambda, and your on-premises servers.
  • AWS CodePipeline – A fully managed continuous delivery service that helps you automate your release pipelines for fast and reliable application and infrastructure updates.
  • AWS Lambda – A service that lets you run code without provisioning or managing servers. You pay only for the compute time you consume.
  • Amazon Simple Notification Service – Amazon SNS is a fully managed messaging service for both application-to-application (A2A) and application-to-person (A2P) communication.
  • Amazon S3 – Amazon S3 is storage for the internet. You can use Amazon S3 to store and retrieve any amount of data at any time, from anywhere on the web.
  • AWS Systems Manager Parameter Store – Parameter Store provides secure, hierarchical storage for configuration data management and secrets management.

Continuous testing tools

The following are open-source scanning tools that are integrated in the pipeline for the purpose of this post, but you could integrate other tools that meet your specific requirements. You can use the static code review tool Amazon CodeGuru for static analysis, but at the time of this writing, it’s not yet available in AWS GovCloud and currently supports Java and Python.

  • Anchore (SCA and SAST) – Anchore Engine is an open-source software system that provides a centralized service for analyzing container images, scanning for security vulnerabilities, and enforcing deployment policies.
  • Amazon Elastic Container Registry image scanning – Amazon ECR image scanning helps in identifying software vulnerabilities in your container images. Amazon ECR uses the Common Vulnerabilities and Exposures (CVEs) database from the open-source Clair project and provides a list of scan findings.
  • Git-Secrets (Secrets Scanning) – Prevents you from committing sensitive information to Git repositories. It is an open-source tool from AWS Labs.
  • OWASP ZAP (DAST) – Helps you automatically find security vulnerabilities in your web applications while you’re developing and testing your applications.
  • Snyk (SCA and SAST) – Snyk is an open-source security platform designed to help software-driven businesses enhance developer security.
  • Sysdig Falco (RASP) – Falco is an open source cloud-native runtime security project that detects unexpected application behavior and alerts on threats at runtime. It is the first runtime security project to join CNCF as an incubation-level project.

You can integrate additional security stages like IAST (Interactive Application Security Testing) into the pipeline to get code insights while the application is running. You can use AWS partner tools like Contrast Security, Synopsys, and WhiteSource to integrate IAST scanning into the pipeline. Malware scanning tools, and image signing tools can also be integrated into the pipeline for additional security.

Continuous logging and monitoring services

The following are AWS services for continuous logging and monitoring used in this reference architecture:

Auditing and governance services

The following are AWS auditing and governance services used in this reference architecture:

  • AWS CloudTrail – Enables governance, compliance, operational auditing, and risk auditing of your AWS account.
  • AWS Config – Allows you to assess, audit, and evaluate the configurations of your AWS resources.
  • AWS Identity and Access Management – Enables you to manage access to AWS services and resources securely. With IAM, you can create and manage AWS users and groups, and use permissions to allow and deny their access to AWS resources.

Operations services

The following are the AWS operations services used in this reference architecture:

  • AWS CloudFormation – Gives you an easy way to model a collection of related AWS and third-party resources, provision them quickly and consistently, and manage them throughout their lifecycles, by treating infrastructure as code.
  • Amazon ECR – A fully managed container registry that makes it easy to store, manage, share, and deploy your container images and artifacts anywhere.
  • Amazon EKS – A managed service that you can use to run Kubernetes on AWS without needing to install, operate, and maintain your own Kubernetes control plane or nodes. Amazon EKS runs up-to-date versions of the open-source Kubernetes software, so you can use all of the existing plugins and tooling from the Kubernetes community.
  • AWS Security Hub – Gives you a comprehensive view of your security alerts and security posture across your AWS accounts. This post uses Security Hub to aggregate all the vulnerability findings as a single pane of glass.
  • AWS Systems Manager Parameter Store – Provides secure, hierarchical storage for configuration data management and secrets management. You can store data such as passwords, database strings, Amazon Machine Image (AMI) IDs, and license codes as parameter values.

Pipeline architecture

The following diagram shows the architecture of the solution. We use AWS CloudFormation to describe the pipeline as code.

Containers devsecops pipeline architecture

Kubernetes DevSecOps Pipeline Architecture

The main steps are as follows:

    1. When a user commits the code to CodeCommit repository, a CloudWatch event is generated, which triggers CodePipeline to orchestrate the events.
    2. CodeBuild packages the build and uploads the artifacts to an S3 bucket.
    3. CodeBuild scans the code with git-secrets. If there is any sensitive information in the code such as AWS access keys or secrets keys, CodeBuild fails the build.
    4. CodeBuild creates the container image and perform SCA and SAST by scanning the image with Snyk or Anchore. In the provided CloudFormation template, you can pick one of these tools during the deployment. Please note, CodeBuild is fully enabled for a “bring your own tool” approach.
      • (4a) If there are any vulnerabilities, CodeBuild invokes the Lambda function. The function parses the results into AWS Security Finding Format (ASFF) and posts them to Security Hub. Security Hub helps aggregate and view all the vulnerability findings in one place as a single pane of glass. The Lambda function also uploads the scanning results to an S3 bucket.
      • (4b) If there are no vulnerabilities, CodeBuild pushes the container image to Amazon ECR and triggers another scan using built-in Amazon ECR scanning.
    5. CodeBuild retrieves the scanning results.
      • (5a) If there are any vulnerabilities, CodeBuild invokes the Lambda function again and posts the findings to Security Hub. The Lambda function also uploads the scan results to an S3 bucket.
      • (5b) If there are no vulnerabilities, CodeBuild deploys the container image to an Amazon EKS staging environment.
    6. After the deployment succeeds, CodeBuild triggers the DAST scanning with the OWASP ZAP tool (again, this is fully enabled for a “bring your own tool” approach).
      • (6a) If there are any vulnerabilities, CodeBuild invokes the Lambda function, which parses the results into ASFF and posts it to Security Hub. The function also uploads the scan results to an S3 bucket (similar to step 4a).
    7. If there are no vulnerabilities, the approval stage is triggered, and an email is sent to the approver for action via Amazon SNS.
    8. After approval, CodeBuild deploys the code to the production Amazon EKS environment.
    9. During the pipeline run, CloudWatch Events captures the build state changes and sends email notifications to subscribed users through Amazon SNS.
    10. CloudTrail tracks the API calls and sends notifications on critical events on the pipeline and CodeBuild projects, such as UpdatePipeline, DeletePipeline, CreateProject, and DeleteProject, for auditing purposes.
    11. AWS Config tracks all the configuration changes of AWS services. The following AWS Config rules are added in this pipeline as security best practices:
      1. CODEBUILD_PROJECT_ENVVAR_AWSCRED_CHECK – Checks whether the project contains environment variables AWS_ACCESS_KEY_ID and AWS_SECRET_ACCESS_KEY. The rule is NON_COMPLIANT when the project environment variables contain plaintext credentials. This rule ensures that sensitive information isn’t stored in the CodeBuild project environment variables.
      2. CLOUD_TRAIL_LOG_FILE_VALIDATION_ENABLED – Checks whether CloudTrail creates a signed digest file with logs. AWS recommends that the file validation be enabled on all trails. The rule is noncompliant if the validation is not enabled. This rule ensures that pipeline resources such as the CodeBuild project aren’t altered to bypass critical vulnerability checks.

Security of the pipeline is implemented using IAM roles and S3 bucket policies to restrict access to pipeline resources. Pipeline data at rest and in transit is protected using encryption and SSL secure transport. We use Parameter Store to store sensitive information such as API tokens and passwords. To be fully compliant with frameworks such as FedRAMP, other things may be required, such as MFA.

Security in the pipeline is implemented by performing the Secret Analysis, SCA, SAST, DAST, and RASP security checks. Applicable AWS services provide encryption at rest and in transit by default. You can enable additional controls on top of these wherever required.

In the next section, I explain how to deploy and run the pipeline CloudFormation template used for this example. As a best practice, we recommend using linting tools like cfn-nag and cfn-guard to scan CloudFormation templates for security vulnerabilities. Refer to the provided service links to learn more about each of the services in the pipeline.

Prerequisites

Before getting started, make sure you have the following prerequisites:

  • An EKS cluster environment with your application deployed. In this post, we use PHP WordPress as a sample application, but you can use any other application.
  • Sysdig Falco installed on an EKS cluster. Sysdig Falco captures events on the EKS cluster and sends those events to CloudWatch using AWS FireLens. For implementation instructions, see Implementing Runtime security in Amazon EKS using CNCF Falco. This step is required only if you need to implement RASP in the software factory.
  • A CodeCommit repo with your application code and a Dockerfile. For more information, see Create an AWS CodeCommit repository.
  • An Amazon ECR repo to store container images and scan for vulnerabilities. Enable vulnerability scanning on image push in Amazon ECR. You can enable or disable the automatic scanning on image push via the Amazon ECR
  • The provided buildspec-*.yml files for git-secrets, Anchore, Snyk, Amazon ECR, OWASP ZAP, and your Kubernetes deployment .yml files uploaded to the root of the application code repository. Please update the Kubernetes (kubectl) commands in the buildspec files as needed.
  • A Snyk API key if you use Snyk as a SAST tool.
  • The Lambda function uploaded to an S3 bucket. We use this function to parse the scan reports and post the results to Security Hub.
  • An OWASP ZAP URL and generated API key for dynamic web scanning.
  • An application web URL to run the DAST testing.
  • An email address to receive approval notifications for deployment, pipeline change notifications, and CloudTrail events.
  • AWS Config and Security Hub services enabled. For instructions, see Managing the Configuration Recorder and Enabling Security Hub manually, respectively.

Deploying the pipeline

To deploy the pipeline, complete the following steps:

  1. Download the CloudFormation template and pipeline code from the GitHub repo.
  2. Sign in to your AWS account if you have not done so already.
  3. On the CloudFormation console, choose Create Stack.
  4. Choose the CloudFormation pipeline template.
  5. Choose Next.
  6. Under Code, provide the following information:
    1. Code details, such as repository name and the branch to trigger the pipeline.
    2. The Amazon ECR container image repository name.
  7. Under SAST, provide the following information:
    1. Choose the SAST tool (Anchore or Snyk) for code analysis.
    2. If you select Snyk, provide an API key for Snyk.
  8. Under DAST, choose the DAST tool (OWASP ZAP) for dynamic testing and enter the API token, DAST tool URL, and the application URL to run the scan.
  9. Under Lambda functions, enter the Lambda function S3 bucket name, filename, and the handler name.
  10. For STG EKS cluster, enter the staging EKS cluster name.
  11. For PRD EKS cluster, enter the production EKS cluster name to which this pipeline deploys the container image.
  12. Under General, enter the email addresses to receive notifications for approvals and pipeline status changes.
  13. Choose Next.
  14. Complete the stack.
  15. After the pipeline is deployed, confirm the subscription by choosing the provided link in the email to receive notifications.
Pipeline-CF-Parameters.png

Pipeline CloudFormation Parameters

The provided CloudFormation template in this post is formatted for AWS GovCloud. If you’re setting this up in a standard Region, you have to adjust the partition name in the CloudFormation template. For example, change ARN values from arn:aws-us-gov to arn:aws.

Running the pipeline

To trigger the pipeline, commit changes to your application repository files. That generates a CloudWatch event and triggers the pipeline. CodeBuild scans the code and if there are any vulnerabilities, it invokes the Lambda function to parse and post the results to Security Hub.

When posting the vulnerability finding information to Security Hub, we need to provide a vulnerability severity level. Based on the provided severity value, Security Hub assigns the label as follows. Adjust the severity levels in your code based on your organization’s requirements.

  • 0 – INFORMATIONAL
  • 1–39 – LOW
  • 40– 69 – MEDIUM
  • 70–89 – HIGH
  • 90–100 – CRITICAL

The following screenshot shows the progression of your pipeline.

DevSecOps-Pipeline.png

DevSecOps Kubernetes CI/CD Pipeline


Secrets analysis scanning

In this architecture, after the pipeline is initiated, CodeBuild triggers the Secret Analysis stage using git-secrets and the buildspec-gitsecrets.yml file. Git-Secrets looks for any sensitive information such as AWS access keys and secret access keys. Git-Secrets allows you to add custom strings to look for in your analysis. CodeBuild uses the provided buildspec-gitsecrets.yml file during the build stage.

SCA and SAST scanning

In this architecture, CodeBuild triggers the SCA and SAST scanning using Anchore, Snyk, and Amazon ECR. In this solution, we use the open-source versions of Anchore and Snyk. Amazon ECR uses open-source Clair under the hood, which comes with Amazon ECR for no additional cost. As mentioned earlier, you can choose Anchore or Snyk to do the initial image scanning.

Scanning with Anchore

If you choose Anchore as a SAST tool during the deployment, the build stage uses the buildspec-anchore.yml file to scan the container image. If there are any vulnerabilities, it fails the build and triggers the Lambda function to post those findings to Security Hub. If there are no vulnerabilities, it proceeds to next stage.

Anchore-lambda-codesnippet.png

Anchore Lambda Code Snippet

Scanning with Snyk

If you choose Snyk as a SAST tool during the deployment, the build stage uses the buildspec-snyk.yml file to scan the container image. If there are any vulnerabilities, it fails the build and triggers the Lambda function to post those findings to Security Hub. If there are no vulnerabilities, it proceeds to next stage.

Snyk-lambda-codesnippet.png

Snyk Lambda Code Snippet

Scanning with Amazon ECR

If there are no vulnerabilities from Anchore or Snyk scanning, the image is pushed to Amazon ECR, and the Amazon ECR scan is triggered automatically. Amazon ECR lists the vulnerability findings on the Amazon ECR console. To provide a single pane of glass view of all the vulnerability findings and for easy administration, we retrieve those findings and post them to Security Hub. If there are no vulnerabilities, the image is deployed to the EKS staging cluster and next stage (DAST scanning) is triggered.

ECR-lambda-codesnippet.png

ECR Lambda Code Snippet


DAST scanning with OWASP ZAP

In this architecture, CodeBuild triggers DAST scanning using the DAST tool OWASP ZAP.

After deployment is successful, CodeBuild initiates the DAST scanning. When scanning is complete, if there are any vulnerabilities, it invokes the Lambda function, similar to SAST analysis. The function parses and posts the results to Security Hub. The following is the code snippet of the Lambda function.

Zap-lambda-codesnippet.png

Zap Lambda Code Snippet

The following screenshot shows the results in Security Hub. The highlighted section shows the vulnerability findings from various scanning stages.

SecurityHub-vulnerabilities.png

Vulnerability Findings in Security Hub

We can drill down to individual resource IDs to get the list of vulnerability findings. For example, if we drill down to the resource ID of SASTBuildProject*, we can review all the findings from that resource ID.

Anchore-Vulnerability.png

SAST Vulnerabilities in Security Hub


If there are no vulnerabilities in the DAST scan, the pipeline proceeds to the manual approval stage and an email is sent to the approver. The approver can review and approve or reject the deployment. If approved, the pipeline moves to next stage and deploys the application to the production EKS cluster.

Aggregation of vulnerability findings in Security Hub provides opportunities to automate the remediation. For example, based on the vulnerability finding, you can trigger a Lambda function to take the needed remediation action. This also reduces the burden on operations and security teams because they can now address the vulnerabilities from a single pane of glass instead of logging into multiple tool dashboards.

Along with Security Hub, you can send vulnerability findings to your issue tracking systems such as JIRA, Systems Manager SysOps, or can automatically create an incident management ticket. This is outside the scope of this post, but is one of the possibilities you can consider when implementing DevSecOps software factories.

RASP scanning

Sysdig Falco is an open-source runtime security tool. Based on the configured rules, Falco can detect suspicious activity and alert on any behavior that involves making Linux system calls. You can use Falco rules to address security controls like NIST SP 800-53. Falco agents on each EKS node continuously scan the containers running in pods and send the events as STDOUT. These events can be then sent to CloudWatch or any third-party log aggregator to send alerts and respond. For more information, see Implementing Runtime security in Amazon EKS using CNCF Falco. You can also use Lambda to trigger and automatically remediate certain security events.

The following screenshot shows Falco events on the CloudWatch console. The highlighted text describes the Falco event that was triggered based on the default Falco rules on the EKS cluster. You can add additional custom rules to meet your security control requirements. You can also trigger responsive actions from these CloudWatch events using services like Lambda.

Falco alerts in CloudWatch

Falco alerts in CloudWatch

Cleanup

This section provides instructions to clean up the DevSecOps pipeline setup:

  1. Delete the EKS cluster.
  2. Delete the S3 bucket.
  3. Delete the CodeCommit repo.
  4. Delete the Amazon ECR repo.
  5. Disable Security Hub.
  6. Disable AWS Config.
  7. Delete the pipeline CloudFormation stack.

Conclusion

In this post, I presented an end-to-end Kubernetes-based DevSecOps software factory on AWS with continuous testing, continuous logging and monitoring, auditing and governance, and operations. I demonstrated how to integrate various open-source scanning tools, such as Git-Secrets, Anchore, Snyk, OWASP ZAP, and Sysdig Falco for Secret Analysis, SCA, SAST, DAST, and RASP analysis, respectively. To reduce operations overhead, I explained how to aggregate and manage vulnerability findings in Security Hub as a single pane of glass. This post also talked about how to implement security of the pipeline and in the pipeline using AWS Cloud-native services. Finally, I provided the DevSecOps software factory as code using AWS CloudFormation.

To get started with DevSecOps on AWS, see AWS DevOps and the DevOps blog.
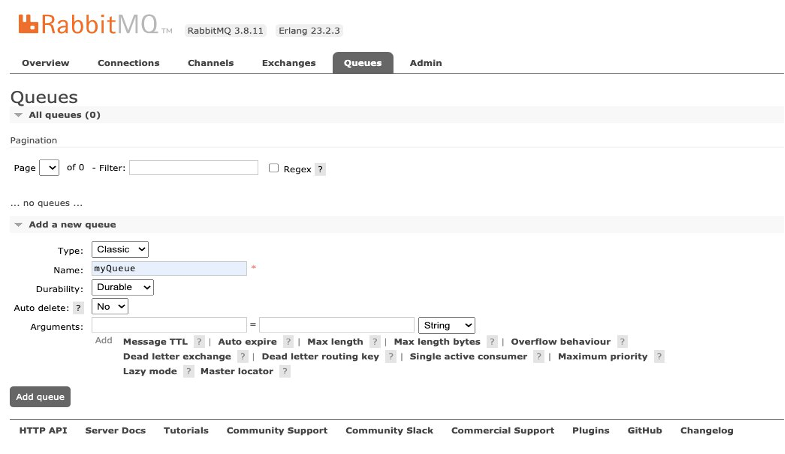
Srinivas Manepalli is a DevSecOps Solutions Architect in the U.S. Fed SI SA team at Amazon Web Services (AWS). He is passionate about helping customers, building and architecting DevSecOps and highly available software systems. Outside of work, he enjoys spending time with family, nature and good food.