Tag Archives: Amazon OpenSearch Service

Amazon OpenSearch Service now supports 99.99% availability using Multi-AZ with Standby

Post Syndicated from Prashant Agrawal original https://aws.amazon.com/blogs/big-data/amazon-opensearch-service-now-supports-99-99-availability-using-multi-az-with-standby/

Customers use Amazon OpenSearch Service for mission-critical applications and monitoring. But what happens when OpenSearch Service itself is unavailable? If your ecommerce search is down, for example, you’re losing revenue. If you’re monitoring your application with OpenSearch Service, and it becomes unavailable, your ability to detect, diagnose, and repair issues with your application is diminished. In these cases, you may suffer lost revenue, customer dissatisfaction, reduced productivity, or even damage to your organization’s reputation.

OpenSearch Service offers an SLA of three 9s (99.9%) availability when following best practices. However, following those practices is complicated, and can require knowledge of and experience with OpenSearch’s data deployment and management, along with an understanding of how OpenSearch Service interacts with AWS Availability Zones and networking, distributed systems, OpenSearch’s self-healing capabilities, and its recovery methods. Furthermore, when an issue arises, such as a node becoming unresponsive, OpenSearch Service recovers by recreating the missing shards (data), causing a potentially large movement of data in the domain. This data movement increases resource usage on the cluster, which can impact performance. If the cluster is not sized properly, it can experience degraded availability, which defeats the purpose of provisioning the cluster across three Availability Zones.

Today, AWS is announcing the new deployment option Multi-AZ with Standby for OpenSearch Service, which helps you offload some of that heavy lifting in terms of high frequency monitoring, fast failure detection, and quick recovery from failure, and keeps your domains available and performant even in the event of an infrastructure failure. With Multi-AZ with Standby, you get 99.99% availability with consistent performance for a domain.

In this post, we discuss the benefits of this new option and how to configure your OpenSearch cluster with Multi-AZ with Standby.

Solution overview

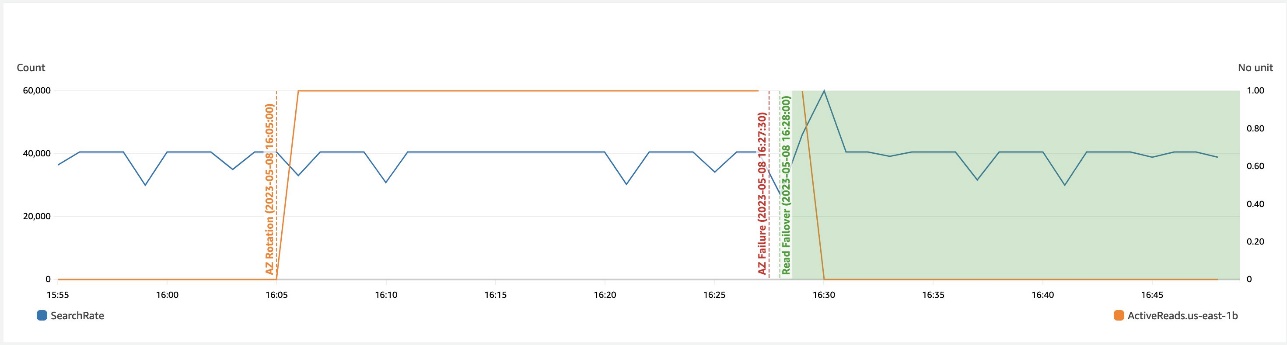
The OpenSearch Service team has incorporated years of experience running tens of thousands of domains for our customers into the Multi-AZ with Standby feature. When you adopt Multi-AZ with Standby, OpenSearch Service creates a cluster across three Availability Zones, with each Availability Zone containing a complete copy of data in the cluster. OpenSearch Service then puts one Availability Zone into standby mode, routing all queries to the other two Availability Zones. When it detects a hardware-related failure, OpenSearch Service promotes nodes from the standby pool to become active in less than a minute. When you use Multi-AZ with Standby, OpenSearch Service doesn’t need to redistribute or recreate data from missing nodes. As a result, cluster performance is unaffected, removing the risk of degraded availability.

Prerequisites

Multi-AZ with Standby requires the following prerequisites:

  • The domain needs to run on OpenSearch 1.3 or above
  • The domain is deployed across three Availability Zones
  • The domain has three (or a multiple of three) data notes
  • You must use three dedicated cluster manager (master) nodes

Refer to Sizing Amazon OpenSearch Service domains for guidance on sizing your domain and dedicated cluster manager nodes.

Configure your OpenSearch cluster using Multi-AZ with Standby

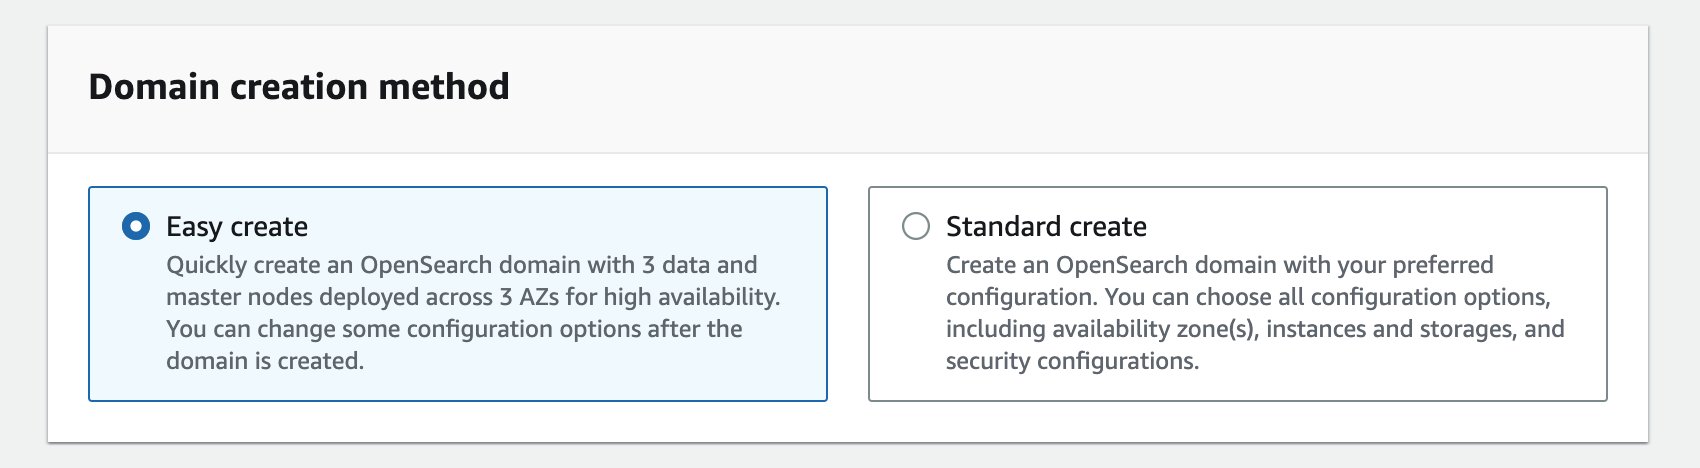
You can use Multi-AZ with Standby when you create a new domain, or you can add it to an existing domain. If you’re creating a new domain using the AWS Management Console, you can create it with Multi-AZ with Standby by either selecting the new Easy create option or the traditional Standard create option. You can update existing domains to use Multi-AZ with Standby by editing their domain configuration.

The Easy create option, as the name suggests, makes creating a domain easier by defaulting to best practice choices for most of the configuration (the majority of which can be altered later). The domain will be set up for high availability from the start and deployed as Multi-AZ with Standby.

While choosing the data nodes, you should choose three (or a multiple of three) data nodes so that they are equally distributed across each of the Availability Zones. The Data nodes table on the OpenSearch Service console provides a visual representation of the data notes, showing that one of the Availability Zones will be put on standby.

Similarly, while selecting the cluster manager (master) node, consider the number of data nodes, indexes, and shards that you plan to have before deciding the instance size.

After the domain is created, you can check its deployment type on the OpenSearch Service console under Cluster configuration, as shown in the following screenshot.

While creating an index, make sure that the number of copies (primary and replica) are multiples of three. If you don’t specify the number of replicas, the service will default to two. This is important so that there is at least one copy of the data in each Availability Zone. We recommend using an index template or similar for logs workloads.

OpenSearch Service distributes the nodes and data copies equally across the three Availability Zones. During normal operations, the standby nodes don’t receive any search requests. The two active Availability Zones respond to all the search requests. However, data is replicated to these standby nodes to ensure you have a full copy of the data in each Availability Zone at all times.

Response to infrastructure failure events

OpenSearch Service continuously monitors the domain for events like node failure, disk failure, or Availability Zone failure. In the event of an infrastructure failure like an Availability Zone failure, OpenSearch Services promotes the standby nodes to active while the impacted Availability Zone recovers. Impact (if any) is limited to the in-flight requests as traffic is weighed away from the impacted Availability Zone in less a minute.

You can check the status of the domain, data node metrics for both active and standby, and Availability Zone rotation metrics on the Cluster health tab. The following screenshots show the cluster health and metrics for data nodes such as CPU utilization, JVM memory pressure, and storage.

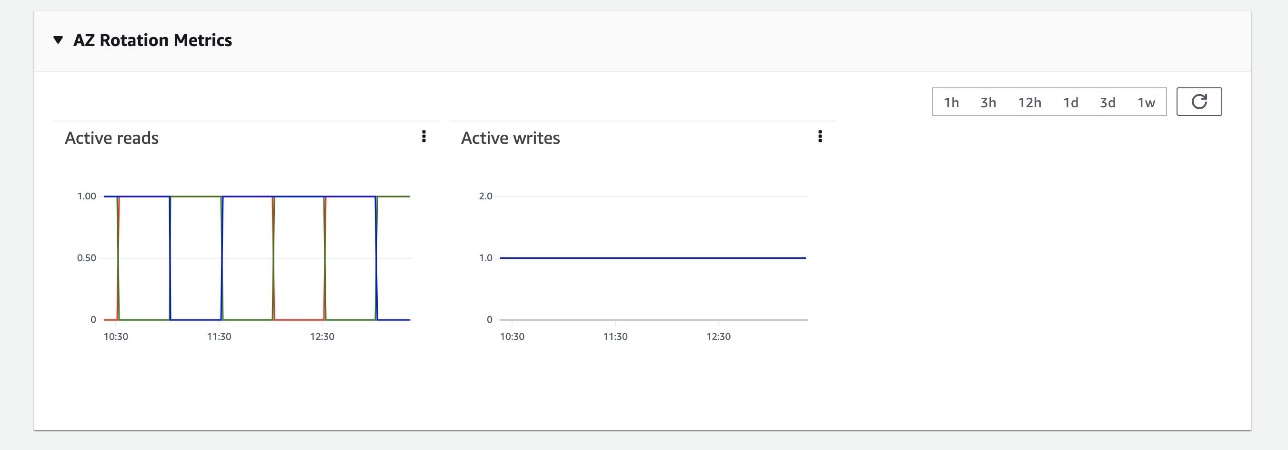
The following screenshot of the AZ Rotation Metrics section (you can find this under Cluster health tab) shows the read and write status of the Availability Zones. OpenSearch Service rotates the standby Availability Zone every 30 minutes to ensure the system is running and ready to respond to events. Availability Zones responding to traffic have a read value of 1, and the standby Availability Zone has a value of 0.

Considerations

Several improvements and guardrails have been made for this feature that offer higher availability and maintain performance. Some static limits have been applied that are specifically related to the number of shards per node, number of shards for a domain, and the size of a shard. OpenSearch Service also enables Auto-Tune by default. Multi-AZ with Standby restricts the storage to GP3- or SSD-backed instances for the most cost-effective and performant storage options. Additionally, we’re introducing an advanced traffic shaping mechanism that will detect rogue queries, which further enhances the reliability of the domain.

We recommend evaluating your domain infrastructure needs based on your workload to achieve high availability and performance.

Conclusion

Multi-AZ with Standby is now available on OpenSearch Service in all AWS Regions globally where OpenSearch service is available, except US West (N. California), and AWS GovCloud (US-Gov-East, US-Gov-West). Try it out and send your feedback to AWS re:Post for Amazon OpenSearch Service or through your usual AWS support contacts.


About the authors

Prashant Agrawal is a Sr. Search Specialist Solutions Architect with Amazon OpenSearch Service. He works closely with customers to help them migrate their workloads to the cloud and helps existing customers fine-tune their clusters to achieve better performance and save on cost. Before joining AWS, he helped various customers use OpenSearch and Elasticsearch for their search and log analytics use cases. When not working, you can find him traveling and exploring new places. In short, he likes doing Eat → Travel → Repeat.

Rohin Bhargava is a Sr. Product Manager with the Amazon OpenSearch Service team. His passion at AWS is to help customers find the correct mix of AWS services to achieve success for their business goals.
Top strategies for high volume tracing with Amazon OpenSearch Ingestion

Post Syndicated from Muthu Pitchaimani original https://aws.amazon.com/blogs/big-data/top-strategies-for-high-volume-tracing-with-amazon-opensearch-ingestion/

Amazon OpenSearch Ingestion is a serverless, auto-scaled, managed data collector that receives, transforms, and delivers data to Amazon OpenSearch Service domains or Amazon OpenSearch Serverless collections. OpenSearch Ingestion is powered by Data Prepper, an open-source, streaming ETL (extract, transform, and load) solution that’s part of the OpenSearch project. When you use OpenSearch Ingestion, you don’t need to maintain self-managed data pipelines to ingest logs, traces, metrics, and other data with OpenSearch Service. Amazon OpenSearch Ingestion responds to changing volumes of data, automatically scaling your ingest pipeline.

Distributed tracing is the leading way to locate, alert on, and remediate problems with your application and infrastructure. Distributed tracing is part of a broader observability solution, often combined with metrics and log data. OpenSearch Service gives you a native toolset to store and analyze large volumes of log, metric, and trace data. However, moving these large volumes of data is non-trivial to set up, monitor, and maintain.

In this post, we outline steps to set up a trace pipeline and strategies to deal with high volume tracing with Amazon OpenSearch Ingestion.

Solution overview

There is now a new option on the OpenSearch Service console called Pipelines under Ingestion in the navigation pane. We use this feature to create a trace pipeline.

You can also use the AWS Command Line Interface (AWS CLI), AWS CloudFormation, or AWS APIs to create a trace pipeline.

Prerequisites

Refer to Security in OpenSearch Ingestion to set up the permissions you need to create a pipeline and write to a pipeline, and the permissions the pipeline needs to write to a sink.

Create a trace pipeline

To create a trace pipeline, complete the following steps:

  1. On the OpenSearch Service console, choose Pipelines under Ingestion in the navigation pane.
  2. Choose Create pipeline.

Amazon OpenSearch Ingestion, powered by Data Prepper, uses pipelines as a mechanism to move the data from a source to a sink, with optional processors to mutate, route, sample, and detect anomalies for the data in the pipe. For more information, refer to Data Prepper. When you use Data Prepper, you build a YAML configuration file. When you use OpenSearch Ingestion, you upload your YAML configuration to the service. If you’re using the OpenSearch Service console, you can use one of the configuration blueprints that we provide. For distributed tracing, you will use an otel_trace_source and an OpenSearch Service domain as the sink.

  1. On the Configuration blueprints menu, choose AWS-TraceAnalyticsPipeline.

Choosing this blueprint will create a sample pipeline with otel_trace_source, an OpenSearch sink, along with span-pipeline and service-map-pipeline.

  1. Enter a name for this pipeline along with a minimum (1) and maximum (96) capacity value for Ingestion-OCUs.

Amazon OpenSearch Ingestion will scale automatically between these values to suit the volume of data you are ingesting.

  1. Edit the configuration’s hosts, aws.sts_role_arn, and region fields of the OpenSearch Service sink.
  2. Follow rest of the steps to complete the trace pipeline creation.

Sample trace pipeline

The following code shows the components of a sample trace pipeline:

version: "2"
entry-pipeline: 
  source:
    otel_trace_source:
      path: "/${pipelineName}/v1/traces"
  processor:
    - trace_peer_forwarder:
  sink:
    - pipeline:
        name: "span-pipeline"
    - pipeline:
        name: "service-map-pipeline"
span-pipeline:
  source:
    pipeline:
      name: "entry-pipeline"
  processor:
    - otel_trace_raw:
  sink:
    - opensearch:
        hosts: [ "https://search-mydomain-1a2a3a4a5a6a7a8a9a0a9a8a7a.us-east-1.es.amazonaws.com" ]
        aws:
          sts_role_arn: "arn:aws:iam::123456789012:role/Example-Role"
          region: "us-east-1"
        index_type: "trace-analytics-raw"
service-map-pipeline:
  source:
    pipeline:
      name: "entry-pipeline"
  processor:
    - service_map_stateful:
  sink:
    - opensearch:
        hosts: [ "https://search-mydomain-1a2a3a4a5a6a7a8a9a0a9a8a7a.us-east-1.es.amazonaws.com" ]
        aws:
          sts_role_arn: "arn:aws:iam::123456789012:role/Example-Role"
          region: "us-east-1"
        index_type: "trace-analytics-service-map"

The sample trace pipeline has three sub-pipelines in its configuration. These are entry-pipeline, span-pipeline, and service-map-pipeline. The following diagram illustrates the workflow.

entry-pipeline specifies the source of data as otel_trace_source, which creates an HTTP listener for receiving OpenTelemetry traces at the ingestion URL for the pipeline. You use a trace_peer_forwarder processor to eliminate duplicate HTTP requests and forward the data to the span-pipeline and service-map pipelines. span-pipeline gets the raw trace data from entry-pipeline and uses the otel_trace_raw processor to complete trace group-related fields for the incoming span records. You use the service_map_stateful processor to have Data Prepper create the distributed service map for visualization in OpenSearch Dashboards. After the sample trace pipeline is created, it’s ready to receive OpenTelemetry traces at its ingestion URL!

Reduce your storage footprint and optimize for cost

The volume of traces collected from instrumenting a modern production enterprise application can reach tens or hundreds of terabytes very quickly, especially when you store every trace from every request. The problem of managing the storage footprint becomes important. In this section, we discuss strategies for reducing your storage footprint and optimizing for cost.

Use storage tiering

OpenSearch Service has three storage tiers: hot, UltraWarm, and cold. You use the hot tier to store frequently accessed data for quick reading and writing, the UltraWarm tier for infrequently used, read-only data backed by Amazon Simple Storage Service (Amazon S3) for lower cost, and the cold tier to maintain re-attachable data at near-Amazon S3 cost. By adjusting relative retention periods between these tiers, you can store a high volume of traces. For example, instead of storing 1 weeks’ worth of traces in the hot tier, you can store 2 days of traces in the hot tier and 15 days in the UltraWarm tier.

Extract metrics without storing traces

You can also use Data Prepper’s aggregation process to extract metrics in the pipeline to avoid delivering all of your data to OpenSearch Service. For example, you may want to analyze request, error, and duration (RED) metrics of your traces to know the current state of your services. OpenSearch Ingestion can calculate these metrics in the pipeline, aggregating them and storing them in separate indexes for analysis, reducing the ingestion and storage footprint of your traces. The following pipeline configuration snippet shows how to use the aggregate processor to calculate a histogram of the duration metric:

...
  processor:
    - aggregate:
        identification_keys: ["serviceName", "traceId"]
        action:
          histogram:
            key: "durationInNanos"
            record_minmax: true
            units: "nanoseconds"
            buckets: [1000000000, 1500000000, 2000000000]
        group_duration: "20s"
   sink:
    - opensearch:
        hosts: ...
        aws_sts_role_arn: ...
        aws_region: ...
        aws_sigv4: true
        index: "red_metrics_from_traces"
  ...

Use sampling

When your application is running without issues, the proportion of error traces is just a small percentage of your overall trace volume. Storing all of the traces for successful requests increases the cost substantially, while offering low value. To reduce cost, you can sample your trace data, reducing the number of traces you store in OpenSearch Service. There are generally two techniques for sampling:

  • Head sampling – When you do head sampling, you ask OpenSearch Ingestion to make a sampling decision without looking at the whole trace. Head sampling is easy to configure and is efficient, but has a downside of possibly missing important traces.
  • Tail sampling – Tail sampling is where you analyze the entirety of the trace and then decide whether to sample the trace or not. This accurately captures all the needed traces at the cost of complexity in configuring and implementing.

The following configuration snippet shows an example of the percent_sampler, from the aggregate processor. In this example, you send only 25% of your traces to OpenSearch Service, based on head sampling:

  ...
  processor:
    - aggregate:
        identification_keys: ["serviceName"]
        action:
          percent_sampler:
            percent: 25
        group_duration: "30s"
  sink:
    - opensearch:
        hosts: ...
        aws_sts_role_arn: ...
        aws_region: ...
        aws_sigv4: true
        index: "sampled-traces"
  ...

Use conditional routing with sampling

Head sampling using the percentage_sampler is simple and straightforward, but is a blunt tool. A better way to sample would be to gather, for example, 10% of successful responses, and 100% of failed responses or 100% high duration traces. To solve this, use conditional routing. Routes define conditions that can be used within processors and sinks to direct the data flowing through different parts of pipeline. For example, the following configuration snippet routes traces whose status code indicates a failure to the error_trace pipeline. You forward 100% of the data in that pipe. You route traces whose duration metric is more than 1 second to the high_latency pipeline where you sample them at 80%. Other normal traces are only sampled at 20%.

  processor:
    - otel_trace_raw:
  route:
    - error_traces: "/traceGroupFields/statusCode == 2"
    - high_latency_traces: '/durationInNanos >= 1000000000'
    - normal_traces: '/traceGroupFields/statusCode!= 2 and /durationInNanos < 1000000000'
  sink:
    - pipeline:
        name: "trace-error-pipeline"
        routes:
          - error_traces
    - pipeline: 
        name: "trace-high-latency-metrics-pipeline"
        routes: 
          - high_latency_traces
    - pipeline: 
        name: "trace-normal-pipeline"
        routes: 
          - normal_traces
  ...

Conclusion

In this post, you learned how to configure an OpenSearch Ingestion pipeline and several strategies to keep in mind that help minimize cost while supporting a large-scale production system for distributed tracing. As next step, refer to the Amazon OpenSearch Developer Guide to explore logs and metric pipelines that you can use to build a scalable observability solution for your enterprise applications.


About the author

Muthu Pitchaimani is a Search Specialist with Amazon OpenSearch Service. He builds large-scale search applications and solutions. Muthu is interested in the topics of networking and security, and is based out of Austin, Texas.

Working with percolators in Amazon OpenSearch Service

Post Syndicated from Arun Lakshmanan original https://aws.amazon.com/blogs/big-data/working-with-percolators-in-amazon-opensearch-service/

Amazon OpenSearch Service is a managed service that makes it easy to secure, deploy, and operate OpenSearch and legacy Elasticsearch clusters at scale in the AWS Cloud. Amazon OpenSearch Service provisions all the resources for your cluster, launches it, and automatically detects and replaces failed nodes, reducing the overhead of self-managed infrastructures. The service makes it easy for you to perform interactive log analytics, real-time application monitoring, website searches, and more by offering the latest versions of OpenSearch, support for 19 versions of Elasticsearch (1.5 to 7.10 versions), and visualization capabilities powered by OpenSearch Dashboards and Kibana (1.5 to 7.10 versions). Amazon OpenSearch Service now offers a serverless deployment option (public preview) that makes it even easier to use OpenSearch in the AWS cloud.

A typical workflow for OpenSearch is to store documents (as JSON data) in an index, and execute searches (also JSON) to find those documents. Percolation reverses that. You store searches and query with documents. Let’s say I’m searching for a house in Chicago that costs < 500K. I could go to the website every day and run my query. A clever website would be able to store my requirements (a query) and notify me when something new (a document) comes up that matches my requirements. Percolation is an OpenSearch feature that enables the website to store these queries and run documents against them to find new matches.

In this post, We will explore how to use percolators to find matching homes from new listings.

Before getting into the details of percolators, let’s explore how search works. When you insert a document, OpenSearch maintains an internal data structure called the “inverted index” which speeds up the search.

Indexing and Searching:

Let’s take the above example of a real estate application having the simple schema of type of the house, city, and the price.

  1. First, let’s create an index with mappings as below
PUT realestate
{
     "mappings": {
        "properties": {
           "house_type": { "type": "keyword"},
           "city": { "type": "keyword" },
           "price": { "type": "long" }
         }
    }
}
  1. Let’s insert some documents into the index.
ID House_type City Price
1 townhouse Chicago 650000
2 house Washington 420000
3 condo Chicago 580000
POST realestate/_bulk 
{ "index" : { "_id": "1" } } 
{ "house_type" : "townhouse", "city" : "Chicago", "price": 650000 }
{ "index" : { "_id": "2" } }
{ "house_type" : "house", "city" : "Washington", "price": 420000 }
{ "index" : { "_id": "3"} }
{ "house_type" : "condo", "city" : "Chicago", "price": 580000 }
  1. As we don’t have any townhouses listed in Chicago for less than 500K, the below query returns no results.
GET realestate/_search
{
  "query": {
    "bool": {
      "filter": [ 
        { "term": { "city": "Chicago" } },
        { "term": { "house_type": "townhouse" } },
        { "range": { "price": { "lte": 500000 } } }
      ]
    }
  }
}

If you’re curious to know how search works under the hood at high level, you can refer to this article.

Percolation:

If one of your customers wants to get notified when a townhouse in Chicago is available, and listed at less than $500,000, you can store their requirements as a query in the percolator index. When a new listing becomes available, you can run that listing against the percolator index with a _percolate query. The query will return all matches (each match is a single set of requirements from one user) for that new listing. You can then notify each user that a new listing is available that fits their requirements. This process is called percolation in OpenSearch.

OpenSearch has a dedicated data type called “percolator” that allows you to store queries.

Let’s create a percolator index with the same mapping, with additional fields for query and optional metadata. Make sure you include all the necessary fields that are part of a stored query. In our case, along with the actual fields and query, we capture the customer_id and priority to send notifications.

PUT realestate-percolator-queries
{
  "mappings": {
    "properties": {
      "user": {
         "properties": {
            "query": { "type": "percolator" },
            "id": { "type": "keyword" },
            "priority":{ "type": "keyword" }
         }
      },
      "house_type": {"type": "keyword"},
      "city": {"type": "keyword"},
      "price": {"type": "long"}
    }
  }
}

After creating the index, insert a query as below

POST realestate-percolator-queries/_doc/chicago-house-alert-500k
{
  "user" : {
     "id": "CUST101",
     "priority": "high",
     "query": {
        "bool": {
           "filter": [ 
                { "term": { "city": "Chicago" } },
                { "term": { "house_type": "townhouse" } },
                { "range": { "price": { "lte": 500000 } } }
            ]
        }
      }
   }
}

The percolation begins when a new document gets run against the stored queries.

{"city": "Chicago", "house_type": "townhouse", "price": 350000}
{"city": "Dallas", "house_type": "house", "price": 500000}

Run the percolation query with document(s), and it matches the stored query

GET realestate-percolator-queries/_search
{
  "query": {
     "percolate": {
        "field": "user.query",
        "documents": [ 
           {"city": "Chicago", "house_type": "townhouse", "price": 350000 },
           {"city": "Dallas", "house_type": "house", "price": 500000}
        ]
      }
   }
}

The above query returns the queries along with the metadata we stored (customer_id in our case) that matches the documents

{
    "took" : 11,
    "timed_out" : false,
    "_shards" : {
        "total" : 5,
        "successful" : 5,
        "skipped" : 0,
        "failed" : 0
     },
     "hits" : {
        "total" : {
           "value" : 1,
           "relation" : "eq"
         },
         "max_score" : 0.0,
         "hits" : [ 
         {
              "_index" : "realestate-percolator-queries",
              "_id" : "chicago-house-alert-500k",
              "_score" : 0.0,
              "_source" : {
                   "user" : {
                       "id" : "CUST101",
                       "priority" : "high",
                       "query" : {
                            "bool" : {
                                 "filter" : [ 
                                      { "term" : { "city" : "Chicago" } },
                                      { "term" : { "house_type" : "townhouse" } },
                                      { "range" : { "price" : { "lte" : 500000 } } }
                                 ]
                              }
                        }
                  }
            },
            "fields" : {
                "_percolator_document_slot" : [0]
            }
        }
     ]
   }
}

Percolation at scale

When you have a high volume of queries stored in the percolator index, searching queries across the index might be inefficient. You can consider segmenting your queries and use them as filters to handle the high-volume queries effectively. As we already capture priority, you can now run percolation with filters on priority that reduces the scope of matching queries.

GET realestate-percolator-queries/_search
{
    "query": {
        "bool": {
            "must": [ 
             {
                  "percolate": {
                      "field": "user.query",
                      "documents": [ 
                          { "city": "Chicago", "house_type": "townhouse", "price": 35000 },
                          { "city": "Dallas", "house_type": "house", "price": 500000 }
                       ]
                  }
              }
          ],
          "filter": [ 
                  { "term": { "user.priority": "high" } }
            ]
       }
    }
}

Best practices

  1. Prefer the percolation index separate from the document index. Different index configurations, like number of shards on percolation index, can be tuned independently for performance.
  2. Prefer using query filters to reduce matching queries to percolate from percolation index.
  3. Consider using a buffer in your ingestion pipeline for reasons below,
    1. You can batch the ingestion and percolation independently to suit your workload and SLA
    2. You can prioritize the ingest and search traffic by running the percolation at off hours. Make sure that you have enough storage in the buffering layer.
      Percolation in independent cluster
  1. Consider using an independent cluster for percolation for the below reasons,
    1. The percolation process relies on memory and compute, your primary search will not be impacted.
    2. You have the flexibility of scaling the clusters independently.
      Percolation in a single cluster

Conclusion

In this post, we walked through how percolation in OpenSearch works, and how to use effectively, at scale. Percolation works in both managed and serverless versions of OpenSearch. You can follow the best practices to analyze and arrange data in an index, as it is important for a snappy search performance.

If you have feedback about this post, submit your comments in the comments section.


About the author

Arun Lakshmanan is a Search Specialist with Amazon OpenSearch Service based out of Chicago, IL. He has over 20 years of experience working with enterprise customers and startups. He loves to travel and spend quality time with his family.

Configure SAML federation for Amazon OpenSearch Serverless with AWS IAM Identity Center

Post Syndicated from Utkarsh Agarwal original https://aws.amazon.com/blogs/big-data/configure-saml-federation-for-amazon-opensearch-serverless-with-aws-iam-identity-center/

Amazon OpenSearch Serverless is a serverless option of Amazon OpenSearch Service that makes it easy for you to run large-scale search and analytics workloads without having to configure, manage, or scale OpenSearch clusters. It automatically provisions and scales the underlying resources to deliver fast data ingestion and query responses for even the most demanding and unpredictable workloads. With OpenSearch Serverless, you can configure SAML to enable users to access data through OpenSearch Dashboards using an external SAML identity provider (IdP).

AWS IAM Identity Center (Successor to AWS Single Sign-On) helps you securely create or connect your workforce identities and manage their access centrally across AWS accounts and applications, OpenSearch Dashboards being one of them.

In this post, we show you how to configure SAML authentication for OpenSearch Dashboards using IAM Identity Center as its IdP.

Solution overview

The following diagram illustrates how the solution allows users or groups to authenticate into OpenSearch Dashboards using single sign-on (SSO) with IAM Identity Center using its built-in directory as the identity source.

The workflow steps are as follows:

  1. A user accesses the OpenSearch Dashboard URL in their browser and chooses the SAML provider.
  2. OpenSearch Serverless redirects the login to the specified IdP.
  3. The IdP provides a login form for the user to specify the credentials for authentication.
  4. After the user is authenticated successfully, a SAML assertion is sent back to OpenSearch Serverless.

OpenSearch Serverless validates the SAML assertion, and the user logs in to OpenSearch Dashboards.

Prerequisites

To get started, you must have an active OpenSearch Serverless collection. Refer to Creating and managing Amazon OpenSearch Serverless collections to learn more about creating a collection. Furthermore, you must have the correct AWS Identity and Access Management (IAM) permissions for configuring SAML authentication along with relevant IAM permissions for configuring the data access policy.

IAM Identity Center should be enabled, and you should have the relevant IAM permissions to create an application in IAM Identity Center and create and manage users and groups.

Create and configure the application in IAM Identity Center

To set up your application in IAM Identity Center, complete the following steps:

  1. On the IAM Identity Center dashboard, choose Applications in the navigation pane.
  2. Choose Add application
  3. For Custom application, select Add custom SAML 2.0 application.
  4. Choose Next.
  5. Under Configure application, enter a name and description for the application.
  6. Under IAM Identity Center metadata, choose Download under IAM Identity Center SAML metadata file.

We use this metadata file to create a SAML provider under OpenSearch Serverless. It contains the public certificate used to verify the signature of the IAM Identity Center SAML assertions.

  1. Under Application properties, leave Application start URL and Relay state blank.
  2. For Session duration, choose 1 hour (the default value).

Note that the session duration you configure in this step takes precedence over the OpenSearch Dashboards timeout setting specified in the configuration of the SAML provider details on the OpenSearch Serverless end.

  1. Under Application metadata, select Manually type your metadata values.
  2. For Application ACS URL, enter your URL using the format https://collection.<REGION>.aoss.amazonaws.com/_saml/acs. For example, we enter https://collection.us-east-1.aoss.amazonaws.com/_saml/acs for this post.
  3. For Application SAML audience, enter your service provider in the format aws:opensearch:<aws account id>.
  4. Choose Submit.

Now you modify the attribute settings. The attribute mappings you configure here become part of the SAML assertion that is sent to the application.

  1. On the Actions menu, choose Edit attribute mappings.
  2. Configure Subject to map to ${user:email}, with the format unspecified.

Using ${user:email} here ensures that the email address for the user in IAM Identity Center is passed in the <NameId> tag of the SAML response.

  1. Choose Save changes.

Now we assign a user to the application.

  1. Create a user in IAM Identity Center to use to log in to OpenSearch Dashboards.

Alternatively, you can use an existing user.

  1. On the IAM Identity Center console, navigate to your application and choose Assign Users and select the user(s) you would like to assign.

You have now created a custom SAML application. Next, you will configure the SAML provider in OpenSearch Serverless.

Create a SAML provider

The SAML provider you create in this step can be assigned to any collection in the same Region. Complete the following steps:

  1. On the OpenSearch Service console, under Serverless in the navigation pane, choose SAML authentication under Security.
  2. Choose Create SAML provider.
  3. Enter a name and description for your SAML provider.
  4. Enter the metadata from your IdP that you downloaded earlier.
  5. Under Additional settings, you can optionally add custom user ID and group attributes. We leave these settings blank for now.
  6. Choose Create a SAML provider.

You have now configured a SAML provider for OpenSearch Serverless. Next, we walk you through configuring the data access policy for accessing collections.

Create the data access policy

In this section, you set up data access policies for OpenSearch Serverless and allow access to the users. Complete the following steps:

  1. On the OpenSearch Service console, under Serverless in the navigation pane, choose Data access policies under Security.
  2. Choose Create access policy.
  3. Enter a name and description for your access policy.
  4. For Policy definition method, select Visual Editor.
  5. In the Rules section, enter a rule name.
  6. Under Select principals, for Add principals, choose SAML users and groups.
  7. For SAML provider name, choose the SAML provider you created earlier.
  8. Specify the user in the format user/<email> (for example, user/[email protected]).

The value of the email address should match the email address in IAM Identity Center.

  1. Choose Save.
  2. Choose Grant and specify the permissions.

You can configure what access you want to provide for the specific user at the collection level and specific indexes at the index pattern level.

You should select the access the user needs based on the least privilege model. Refer to Supported policy permissions and Supported OpenSearch API operations and permissions to set up more granular access for your users.

  1. Choose Save and configure any additional rules, if required.

You can now review and edit your configuration if needed.

  1. Choose Create to create the data access policy.

Now you have the data access policy that will allow the users to perform the allowed actions on OpenSearch Dashboards.

Access OpenSearch Dashboards

To sign in to OpenSearch Dashboards, complete the following steps:

  1. On the OpenSearch Service dashboard, under Serverless in the navigation pane, choose Dashboard.
  2. Locate your dashboard and copy the OpenSearch Dashboards URL (in the format <collection-endpoint>/_dashboards).
  3. Enter this URL into a new browser tab.
  4. On the OpenSearch login page, choose your IdP and specify your SSO credentials.
  5. Choose Login.

Configure SAML authentication using groups in IAM Identity Center

Groups can help you organize your users and permissions in a coherent way. With groups, you can add multiple users from the IdP, and then use groupid as the identifier in the data access policy. For more information, refer to Add groups and Add users to groups.

To configure group access to OpenSearch Dashboards, complete the following steps:

  1. On the IAM Identity Center console, navigate to your application.
  2. In the Attribute mappings section, add an additional user as group and map it to ${user:groups}, with the format unspecified.
  3. Choose Save changes.
  4. For the SAML provider in OpenSearch Serverless, under Additional settings, for Group attribute, enter group.
  5. For the data access policy, create a new rule or add an additional principal in the previous rule.
  6. Choose the SAML provider name and enter group/<GroupId>.

You can fetch the value for the group ID by navigating to the Group section on the IAM Identity Center console.

Clean up

If you don’t want to continue using the solution, be sure to delete the resources you created:

  1. On the IAM Identity Center console, remove the application.
  2. On OpenSearch Dashboards, delete the following resources:
    1. Delete your collection.
    2. Delete the data access policy.
    3. Delete the SAML provider.

Conclusion

In this post, you learned how to set up IAM Identity Center as an IdP to access OpenSearch Dashboards using SAML as SSO. You also learned on how to set up users and groups within IAM Identity Center and control the access of users and groups for OpenSearch Dashboards. For more details, refer to SAML authentication for Amazon OpenSearch Serverless.

Stay tuned for a series of posts focusing on the various options available for you to build effective log analytics and search solutions using OpenSearch Serverless. You can also refer to the Getting started with Amazon OpenSearch Serverless workshop to know more about OpenSearch Serverless.

If you have feedback about this post, submit it in the comments section. If you have questions about this post, start a new thread on the OpenSearch Service forum or contact AWS Support.


About the Authors

Utkarsh Agarwal is a Cloud Support Engineer in the Support Engineering team at Amazon Web Services. He specializes in Amazon OpenSearch Service. He provides guidance and technical assistance to customers thus enabling them to build scalable, highly available and secure solutions in AWS Cloud. In his free time, he enjoys watching movies, TV series and of course cricket! Lately, he his also attempting to master the art of cooking in his free time – The taste buds are excited, but the kitchen might disagree.

Ravi Bhatane is a software engineer with Amazon OpenSearch Serverless Service. He is passionate about security, distributed systems, and building scalable services. When he’s not coding, Ravi enjoys photography and exploring new hiking trails with his friends.

Prashant Agrawal is a Sr. Search Specialist Solutions Architect with Amazon OpenSearch Service. He works closely with customers to help them migrate their workloads to the cloud and helps existing customers fine-tune their clusters to achieve better performance and save on cost. Before joining AWS, he helped various customers use OpenSearch and Elasticsearch for their search and log analytics use cases. When not working, you can find him traveling and exploring new places. In short, he likes doing Eat → Travel → Repeat.

Patterns for updating Amazon OpenSearch Service index settings and mappings

Post Syndicated from Mikhail Vaynshteyn original https://aws.amazon.com/blogs/big-data/patterns-for-updating-amazon-opensearch-service-index-settings-and-mappings/

Amazon OpenSearch Service is used for a broad set of use cases like real-time application monitoring, log analytics, and website search at scale. As your domain ages and you add additional consumers, you need to reevaluate and change the domain’s configuration to handle additional storage and compute needs. You want to minimize downtime and performance impact as you make these changes.

Customers have been seeking guidance on best practices and patterns for changing index settings without an index maintenance window or affecting overall performance of the OpenSearch Service domain. This is part one of a two-part series, in which we show how to make settings changes to OpenSearch Service indexes with little to no downtime while supporting active producers and consumers of the data.

Indexes in OpenSearch Service

In OpenSearch Service, data must be indexed before it can be queried. Indexing is the method by which search engines organize data for fast retrieval. The resulting structure is called, fittingly, an index. All operations performed on an index are done via index APIs. Also, each index contains index mappings, which define field names and data types in the index. Data producers can add new fields with data types to an index. Index mappings can’t change throughout the index lifecycle.

OpenSearch Service indexes have two types of settings that periodically need adjustments as the profile of your workload changes:

  • Dynamic – Settings that can be changed on the index at any time
  • Static – Settings that can only be defined at the index creation time and can’t be changed throughout the index lifecycle

Dynamic index settings can be changed at any time using the update settings API. While the OpenSearch Service domain is performing instructed operations on dynamic index settings, the index doesn’t require a downtime. Changes to most dynamic index settings won’t trigger background tasks that affect the overall utilization of domain resources; however, some settings such as increasing the number of replicas via index.number_of_replicas or index.auto_expand_replicas, and depending on the domain’s configuration, can cause a temporary increase in resource utilization while the domain adds replicas. We recommend maintaining at least one replica for redundancy reasons, and multiple replicas for high query throughput use cases.

Static index settings such as mapping and shard count are defined at index creation time and can’t be changed throughout the index lifecycle. In this post, we focus on patterns and best practices for working with static index settings, such as changing shard count and patterns for updating index mappings.

All operations and procedures that we cover in this post are issued directly to the OpenSearch REST API or via the Dev Tools in OpenSearch Dashboards.

As with any use case, there is a spectrum of solutions and constraints to be considered. We start with a few simple foundational patterns and build on them, accounting for use cases with more operational constraints and working with large datasets.

Solution overview

OpenSearch Service has a default sharding strategy of 5:1, where each index is divided into five primary shards. Within each index, each primary shard also has its own replica. OpenSearch Service automatically assigns primary shards and replica shards to separate data nodes.

It’s not possible to increase the primary shard number of an existing index, meaning an index must be recreated if you want to increase the primary shard count.

The _reindex operation is ideal for creating destination indexes with updated shards and mapping settings. The _reindex operation is resource intensive. We recommend disabling replicas in your destination index by setting number_of_replicas to 0 and re-enable replicas when the reindex process is complete. If you have your data in a second, durable store, the simplest thing to do is pause updates and reindex from the source. But that’s not always possible. In this post, we share several patterns that enable you to update even static index settings like shard count.

One the major advantages of using the _reindex operation is that it doesn’t require placing the source index in a read-only mode (data producers may continue to write the data while reindexing is in progress). Also, the _reindex operation enables reprocessing, transformation, and reindexing a subset of documents and even selectively combining documents from multiple indexes. With the _reindex operation, you can copy all or a subset of documents that you select through a query to another index. In its most basic form, the _reindex operation requires you to specify a source and a destination index and configuration parameters.

The following are the some of the use cases supported by the reindex API:

  • Reindexing all documents
  • Reindexing from a remote cluster when transferring data between clusters
  • Reindexing a subset of documents that match a search query
  • Combining one or more indexes
  • Transforming documents during reindexing

To increase the shard count, you create a new index, set number_of_shards to your desired primary shard count, set number_of_replicas to 0, update the new index mapping based on your requirement, and run the reindex API operation. After the _reindex operation is complete, we recommend updating number_of_replicas in the destination index settings to achieve your desired level of replica shards.

In the following sections, we provide a walkthrough of the reindex API operation. Note that the patterns and procedures presented in this post have been validated on Amazon OpenSearch Service version 1.3.

Prerequisites

The source of the documents must be stored in the index (the “_source” setting at the index mappings level must be set to “enabled”:true, which is the default). The _reindex operation can’t be used without source documents.

Create the destination index with your desired mapping (field or data type). For demonstration purposes, our source index has a field ratings defined as long, and we want the same field to use the float data type in the destination index:

GET /source_index_name/mappings
{  
  "source_index_name": {
    "mappings" : {
      "properties" : {
        "ratings " : {
          "type" : "long"
        },
…
      }
    }
  }
}

PUT /destination_index_name
{
  "settings": {
    "index": {
      "number_of_shards": <DESIRED_NUMBER_OF_PRIMARY_SHARDS>,
      "number_of_replicas": 0
    }
  },
  "mappings": {
    "properties" : {
      "ratings" : {
          "type" : "float"
        },
…
    }
  }
}

Ensure that you have sufficient disk space on each hot tier data node to house the new index primary shards and, depending on your configuration, replica shards. If disk space is insufficient, perform an update operation on the OpenSearch Service domain to add the required storage capacity. Depending on storage requirements, you may need to migrate the OpenSearch Service domain to a different instance type, because nodes have constraints on the EBS volume size that can be mounted to each instance type. Issue the following operation to validate available disk space:

GET _cat/allocation?v

The following screenshot shows the output.

Check the disk.avail metric for hot storage tier nodes to validate your available disk space.

Use the reindex API operation

The _reindex operation snapshots the index at the beginning of its run and performs processing on a snapshot to minimize impact on the source index. The source index can still be used for querying and processing the data. Although the _reindex operation can run both synchronously and asynchronously, we recommend using an asynchronous run. You can monitor the progress of the _reindex operation, cancel its run, or throttle its run using the _task, _cancel, and _rethrottle operations, respectively.

Because the _reindex operation doesn’t require the source index placed in a read-only mode, query and index update operations are free to continue.

Use the reindex API with the following command:

POST _reindex?wait_for_completion=false
{
  "source": {
	"index": "source_index_name"
  },
  "dest": {
	"index": "destination_index_name",
	"op_type" : "index"
  }
}

The source indexes as part of the _reindex API operation can be supplemented with a query for reindexing a subset of documents and storing them in the destination index. Progress of the re-indexing operation can be monitored via tasks API operation:

GET _tasks

Note that the _reindex operation can be throttled via a _rethrottle API or settings passed as a parameter. You can cancel the task with the _cancel operation:

POST _tasks/TASK_ID/_cancel

The following screenshot shows the output of the _reindex operation for reindexing from source_index_name to destination_index_name.

When the operation is complete, both consumers and producers of the source indexes or aliases need to re-point to the destination index and the same _reindex operation needs to run again to catch up on any create, update, or delete operations performed on the source indexes while the initial _reindex operation was running. This step is required because the _reindex operation is running on a snapshot of the index. At this time, the _reindex operation needs to run with “op_type”:”create” to realign missing and out-of-version documents. See the following API command:

POST _reindex?wait_for_completion=false
{
"conflicts":"proceed",
  "source": {
	"index": "source_index_name"
  },
  "dest": {
	"index": "destination_index_name",
	"op_type" : "create"
  }
}

After the operation is complete and data integrity in the destination index is confirmed, you can delete the source index to reclaim disk space.

Increase index shard count using the split index API

The split index API and shrink index API cover a large array of use cases and present with low resource utilization in the domain. However, these APIs require closing the index for write operations and don’t address use cases that require changes to the mapping settings.

In OpenSearch Service, the number_of_shards index setting is immutable and defined at the time when the index is created. However, although this setting is immutable, there are several patterns to increase or decrease index shard count without needing to explicitly reindex the data. You can alternatively use the split index API to increase index shard count in the environments that can suspend write operations. The split index API provides a simplified way of creating a new index with a different shard setting and without reindexing your data. The split index API operation creates a new index based off of a read-only index with a desired number of primary shards.

In OpenSearch Service, an index alias is a virtual index name that can point to one or more indexes. Referencing to indexes using aliases in your applications allows you to avoid index name changes. Index aliases are used to point consumers and producers to a new index after the split index API operation is complete.

Although the majority of use cases focus on increasing a number of shards on an existing index due to data growth, there are also instances where you need to reduce the number of shards on an existing index. Such cases occasionally happen when an actual index size is less than what was anticipated when the index was created, and you want to align with a shard strategy for operational best practices for OpenSearch Service. In cases where you need to reduce a number of shards on an index, you can use the shrink index API to achieve this task.

Conclusion

In this post, we reviewed best practices when reindexing data for making changes in OpenSearch Service static index settings and mappings that require little or no index downtime. We also covered use of the split index and shrink index APIs for changing the primary index shard count for use cases where the index can be placed in a read-only state.

In our next post, we’ll explore patterns for remote indexing to alleviate load and resource utilization on the source OpenSearch Service domain.


About the Authors

Mikhail Vaynshteyn is a Solutions Architect with Amazon Web Services. Mikhail works with healthcare and life sciences customers to build solutions that help improve patients’ outcomes. Mikhail specializes in data analytics services.

Sukhomoy Basak is a Solutions Architect at Amazon Web Services, with a passion for data and analytics solutions. Sukhomoy works with enterprise customers to help them architect, build, and scale applications to achieve their business outcomes.

Perform accent-insensitive search using OpenSearch

Post Syndicated from Aruna Govindaraju original https://aws.amazon.com/blogs/big-data/perform-accent-insensitive-search-using-opensearch/

We often need our text search to be agnostic of accent marks. Accent-insensitive search, also called diacritics-agnostic search, is where search results are the same for queries that may or may not contain Latin characters such as à, è, Ê, ñ, and ç. Diacritics are English letters with an accent to mark a difference in pronunciation. In recent years, words with diacritics have trickled into the mainstream English language, such as café or protégé. Well, touché! OpenSearch has the answer!

OpenSearch is a scalable, flexible, and extensible open-source software suite for your search workload. OpenSearch can be deployed in three different modes: the self-managed open-source OpenSearch, the managed Amazon OpenSearch Service, and Amazon OpenSearch Serverless. All three deployment modes are powered by Apache Lucene, and offer text analytics using the Lucene analyzers.

In this post, we demonstrate how to perform accent-insensitive search using OpenSearch to handle diacritics.

Solution overview

Lucene Analyzers are Java libraries that are used to analyze text while indexing and searching documents. These analyzers consist of tokenizers and filters. The tokenizers split the incoming text into one or more tokens, and the filters are used to transform the tokens by modifying or removing the unnecessary characters.

OpenSearch supports custom analyzers, which enable you to configure different combinations of tokenizers and filters. It can consist of character filters, tokenizers, and token filters. In order to enable our diacritic-insensitive search, we configure custom analyzers that use the ASCII folding token filter.

ASCIIFolding is a method used to covert alphabetic, numeric, and symbolic Unicode characters that aren’t in the first 127 ASCII characters (the Basic Latin Unicode block) into their ASCII equivalents, if one exists. For example, the filter changes “à” to “a”. This allows search engines to return results agnostic of the accent.

In this post, we configure accent-insensitive search using the ASCIIFolding filter supported in OpenSearch Service. We ingest a set of European movie names with diacritics and verify search results with and without the diacritics.

Create an index with a custom analyzer

We first create the index asciifold_movies with custom analyzer custom_asciifolding:

PUT /asciifold_movies
{
  "settings": {
    "analysis": {
      "analyzer": {
        "custom_asciifolding": {
          "tokenizer": "standard",
          "filter": [
            "my_ascii_folding"
          ]
        }
      },
      "filter": {
        "my_ascii_folding": {
          "type": "asciifolding",
          "preserve_original": true
        }
      }
    }
  },
  "mappings": {
    "properties": {
      "title": {
        "type": "text",
        "analyzer": "custom_asciifolding",
        "fields": {
          "keyword": {
            "type": "keyword",
            "ignore_above": 256
          }
        }
      }
    }
  }
}

Ingest sample data

Next, we ingest sample data with Latin characters into the index asciifold_movies:

POST _bulk
{ "index" : { "_index" : "asciifold_movies", "_id":"1"} }
{  "title" : "Jour de fête"}
{ "index" : { "_index" : "asciifold_movies", "_id":"2"} }
{  "title" : "La gloire de mon père" }
{ "index" : { "_index" : "asciifold_movies", "_id":"3"} }
{  "title" : "Le roi et l’oiseau" }
{ "index" : { "_index" : "asciifold_movies", "_id":"4"} }
{  "title" : "Être et avoir" }
{ "index" : { "_index" : "asciifold_movies", "_id":"5"} }
{  "title" : "Kirikou et la sorcière"}
{ "index" : { "_index" : "asciifold_movies", "_id":"6"} }
{  "title" : "Señora Acero"}
{ "index" : { "_index" : "asciifold_movies", "_id":"7"} }
{  "title" : "Señora garçon"}
{ "index" : { "_index" : "asciifold_movies", "_id":"8"} }
{  "title" : "Jour de fete"}

Query the index

Now we query the asciifold_movies index for words with and without Latin characters.

Our first query uses an accented character:

GET asciifold_movies/_search
{
  "query": {
    "match": {
      "title": "fête"
    }
  }
}

Our second query uses a spelling of the same word without the accent mark:

GET asciifold_movies/_search
{
  "query": {
    "match": {
      "title": "fete"
    }
  }
}

In the preceding queries, the search terms “fête” and “fete” return the same results:

{
  "took": 10,
  "timed_out": false,
  "_shards": {
    "total": 5,
    "successful": 5,
    "skipped": 0,
    "failed": 0
  },
  "hits": {
    "total": {
      "value": 2,
      "relation": "eq"
    },
    "max_score": 0.7361701,
    "hits": [
      {
        "_index": "asciifold_movies",
        "_id": "8",
        "_score": 0.7361701,
        "_source": {
          "title": "Jour de fete"
        }
      },
      {
        "_index": "asciifold_movies",
        "_id": "1",
        "_score": 0.42547938,
        "_source": {
          "title": "Jour de fête"
        }
      }
    ]
  }
}

Similarly, try comparing results for “señora” and “senora” or “sorcière” and “sorciere.” The accent-insensitive results are due to the ASCIIFolding filter used with the custom analyzers.

Enable aggregations for fields with accents

Now that we have enabled accent-insensitive search, let’s look at how we can make aggregations work with accents.

Try the following query on the index:

GET asciifold_movies/_search
{
  "size": 0,
  "aggs": {
    "test": {
      "terms": {
        "field": "title.keyword"
      }
    }
  }
}

We get the following response:

"aggregations" : {
    "test" : {
      "doc_count_error_upper_bound" : 0,
      "sum_other_doc_count" : 0,
      "buckets" : [
        {
          "key" : "Jour de fete",
          "doc_count" : 1
        },
        {
          "key" : "Jour de fête",
          "doc_count" : 1
        },
        {
          "key" : "Kirikou et la sorcière",
          "doc_count" : 1
        },
        {
          "key" : "La gloire de mon père",
          "doc_count" : 1
        },
        {
          "key" : "Le roi et l’oiseau",
          "doc_count" : 1
        },
        {
          "key" : "Señora Acero",
          "doc_count" : 1
        },
        {
          "key" : "Señora garçon",
          "doc_count" : 1
        },
        {
          "key" : "Être et avoir",
          "doc_count" : 1
        }
      ]
    }
  }

Create accent-insensitive aggregations using a normalizer

In the previous example, the aggregation returns two different buckets, one for “Jour de fête” and one for “Jour de fete.” We can enable aggregations to create one bucket for the field, regardless of the diacritics. This is achieved using the normalizer filter.

The normalizer supports a subset of character and token filters. Using just the defaults, the normalizer filter is a simple way to standardize Unicode text in a language-independent way for search, thereby standardizing different forms of the same character in Unicode and allowing diacritic-agnostic aggregations.

Let’s modify the index mapping to include the normalizer. Delete the previous index, then create a new index with the following mapping and ingest the same dataset:

PUT /asciifold_movies
{
  "settings": {
    "analysis": {
      "analyzer": {
        "custom_asciifolding": {
          "tokenizer": "standard",
          "filter": [
            "my_ascii_folding"
          ]
        }
      },
      "filter": {
        "my_ascii_folding": {
          "type": "asciifolding",
          "preserve_original": true
        }
      },
      "normalizer": {
        "custom_normalizer": {
          "type": "custom",
          "filter": "asciifolding"
        }
      }
    }
  },
  "mappings": {
    "properties": {
      "title": {
        "type": "text",
        "analyzer": "custom_asciifolding",
        "fields": {
          "keyword": {
            "type": "keyword",
            "ignore_above": 256,
            "normalizer": "custom_normalizer"
          }
        }
      }
    }
  }
}

After you ingest the same dataset, try the following query:

GET asciifold_movies/_search
{
  "size": 0,
  "aggs": {
    "test": {
      "terms": {
        "field": "title.keyword"
      }
    }
  }
}

We get the following results:

"aggregations" : {
    "test" : {
      "doc_count_error_upper_bound" : 0,
      "sum_other_doc_count" : 0,
      "buckets" : [
        {
          "key" : "Jour de fete",
          "doc_count" : 2
        },
        {
          "key" : "Etre et avoir",
          "doc_count" : 1
        },
        {
          "key" : "Kirikou et la sorciere",
          "doc_count" : 1
        },
        {
          "key" : "La gloire de mon pere",
          "doc_count" : 1
        },
        {
          "key" : "Le roi et l'oiseau",
          "doc_count" : 1
        },
        {
          "key" : "Senora Acero",
          "doc_count" : 1
        },
        {
          "key" : "Senora garcon",
          "doc_count" : 1
        }
      ]
    }
  }

Now we compare the results, and we can see the aggregations with term “Jour de fête” and “Jour de fete” are rolled up into one bucket with doc_count=2.

Summary

In this post, we showed how to enable accent-insensitive search and aggregations by designing the index mapping to do ASCII folding for search tokens and normalize the keyword field for aggregations. You can use the OpenSearch query DSL to implement a range of search features, providing a flexible foundation for structured and unstructured search applications. The Open Source OpenSearch community has also extended the product to enable support for natural language processing, machine learning algorithms, custom dictionaries, and a wide variety of other plugins.

If you have feedback about this post, submit it in the comments section. If you have questions about this post, start a new thread on the Amazon OpenSearch Service forum or contact AWS Support.


About the Author

Aruna Govindaraju is an Amazon OpenSearch Specialist Solutions Architect and has worked with many commercial and open-source search engines. She is passionate about search, relevancy, and user experience. Her expertise with correlating end-user signals with search engine behavior has helped many customers improve their search experience. Her favorite pastime is hiking the New England trails and mountains.

AWS Week in Review – March 20, 2023

Post Syndicated from Danilo Poccia original https://aws.amazon.com/blogs/aws/aws-week-in-review-march-20-2023/

This post is part of our Week in Review series. Check back each week for a quick roundup of interesting news and announcements from AWS!

A new week starts, and Spring is almost here! If you’re curious about AWS news from the previous seven days, I got you covered.

Last Week’s Launches
Here are the launches that got my attention last week:

Picture of an S3 bucket and AWS CEO Adam Selipsky.Amazon S3 – Last week there was AWS Pi Day 2023 celebrating 17 years of innovation since Amazon S3 was introduced on March 14, 2006. For the occasion, the team released many new capabilities:

Amazon Linux 2023 – Our new Linux-based operating system is now generally available. Sébastien’s post is full of tips and info.

Application Auto Scaling – Now can use arithmetic operations and mathematical functions to customize the metrics used with Target Tracking policies. You can use it to scale based on your own application-specific metrics. Read how it works with Amazon ECS services.

AWS Data Exchange for Amazon S3 is now generally available – You can now share and find data files directly from S3 buckets, without the need to create or manage copies of the data.

Amazon Neptune – Now offers a graph summary API to help understand important metadata about property graphs (PG) and resource description framework (RDF) graphs. Neptune added support for Slow Query Logs to help identify queries that need performance tuning.

Amazon OpenSearch Service – The team introduced security analytics that provides new threat monitoring, detection, and alerting features. The service now supports OpenSearch version 2.5 that adds several new features such as support for Point in Time Search and improvements to observability and geospatial functionality.

AWS Lake Formation and Apache Hive on Amazon EMR – Introduced fine-grained access controls that allow data administrators to define and enforce fine-grained table and column level security for customers accessing data via Apache Hive running on Amazon EMR.

Amazon EC2 M1 Mac Instances – You can now update guest environments to a specific or the latest macOS version without having to tear down and recreate the existing macOS environments.

AWS Chatbot – Now Integrates With Microsoft Teams to simplify the way you troubleshoot and operate your AWS resources.

Amazon GuardDuty RDS Protection for Amazon Aurora – Now generally available to help profile and monitor access activity to Aurora databases in your AWS account without impacting database performance

AWS Database Migration Service – Now supports validation to ensure that data is migrated accurately to S3 and can now generate an AWS Glue Data Catalog when migrating to S3.

AWS Backup – You can now back up and restore virtual machines running on VMware vSphere 8 and with multiple vNICs.

Amazon Kendra – There are new connectors to index documents and search for information across these new content: Confluence Server, Confluence Cloud, Microsoft SharePoint OnPrem, Microsoft SharePoint Cloud. This post shows how to use the Amazon Kendra connector for Microsoft Teams.

For a full list of AWS announcements, be sure to keep an eye on the What’s New at AWS page.

Other AWS News
A few more blog posts you might have missed:

Example of a geospatial query.Women founders Q&A – We’re talking to six women founders and leaders about how they’re making impacts in their communities, industries, and beyond.

What you missed at that 2023 IMAGINE: Nonprofit conference – Where hundreds of nonprofit leaders, technologists, and innovators gathered to learn and share how AWS can drive a positive impact for people and the planet.

Monitoring load balancers using Amazon CloudWatch anomaly detection alarms – The metrics emitted by load balancers provide crucial and unique insight into service health, service performance, and end-to-end network performance.

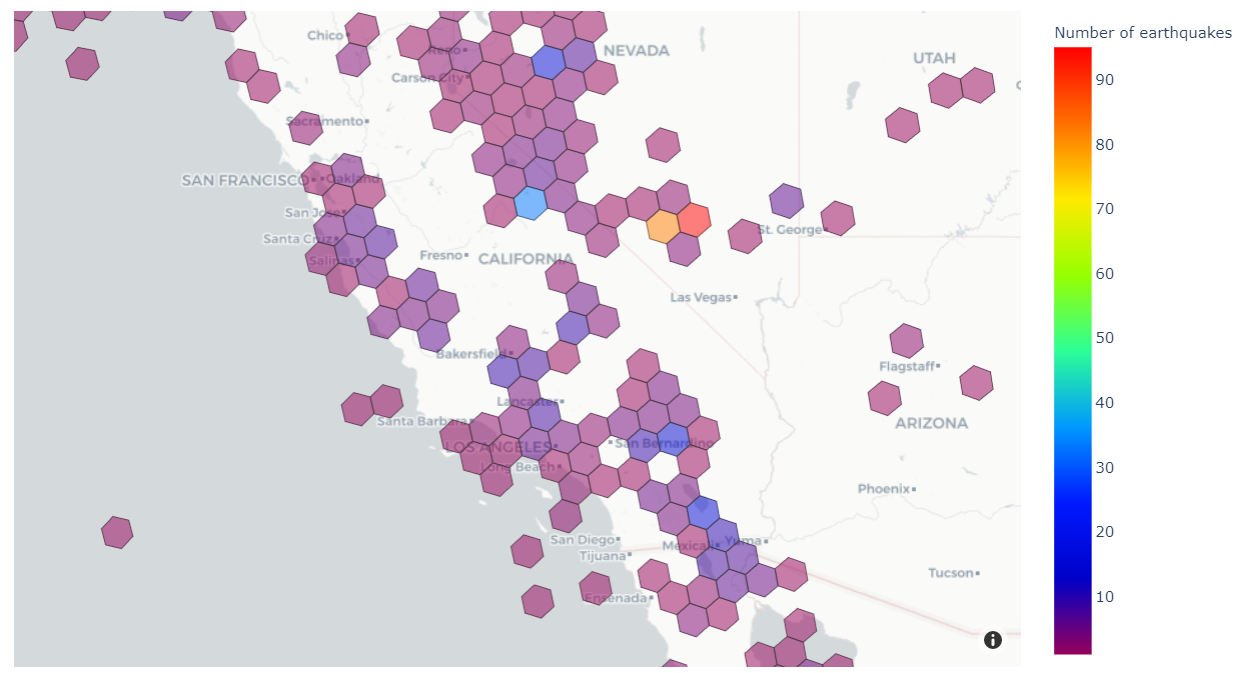
Extend geospatial queries in Amazon Athena with user-defined functions (UDFs) and AWS Lambda – Using a solution based on Uber’s Hexagonal Hierarchical Spatial Index (H3) to divide the globe into equally-sized hexagons.

How cities can use transport data to reduce pollution and increase safety – A guest post by Rikesh Shah, outgoing head of open innovation at Transport for London.

For AWS open-source news and updates, here’s the latest newsletter curated by Ricardo to bring you the most recent updates on open-source projects, posts, events, and more.

Upcoming AWS Events
Here are some opportunities to meet:

AWS Public Sector Day 2023 (March 21, London, UK) – An event dedicated to helping public sector organizations use technology to achieve more with less through the current challenging conditions.

Women in Tech at Skills Center Arlington (March 23, VA, USA) – Let’s celebrate the history and legacy of women in tech.

The AWS Summits season is warming up! You can sign up here to know when registration opens in your area.

That’s all from me for this week. Come back next Monday for another Week in Review!

Danilo

Role-based access control in Amazon OpenSearch Service via SAML integration with AWS IAM Identity Center

Post Syndicated from Scott Chang original https://aws.amazon.com/blogs/big-data/role-based-access-control-in-amazon-opensearch-service-via-saml-integration-with-aws-iam-identity-center/

Amazon OpenSearch Service is a managed service that makes it simple to secure, deploy, and operate OpenSearch clusters at scale in the AWS Cloud. AWS IAM Identity Center (successor to AWS Single Sign-On) helps you securely create or connect your workforce identities and manage their access centrally across AWS accounts and applications. To build a strong least-privilege security posture, customers also wanted fine-grained access control to manage dashboard permission by user role. In this post, we demonstrate a step-by-step procedure to implement IAM Identity Center to OpenSearch Service via native SAML integration, and configure role-based access control in OpenSearch Dashboards by using group attributes in IAM Identity Center. You can follow the steps in this post to achieve both authentication and authorization for OpenSearch Service based on the groups configured in IAM Identity Center.

Solution overview

Let’s review how to map users and groups in IAM Identity Center to OpenSearch Service security roles. Backend roles in OpenSearch Service are used to map external identities or attributes of workgroups to pre-defined OpenSearch Service security roles.

The following diagram shows the solution architecture. Create two groups, assign a user to each group and edit attribute mappings in IAM Identity Center. If you have integrated IAM Identity Center with your Identity Provider (IdP), you can use existing users and groups mapped to your IdP for this test. The solution uses two roles: all_access for administrators, and alerting_full_access for developers who are only allowed to manage OpenSearch Service alerts. You can set up backend role mapping in OpenSearch Dashboards by group ID. Based on the following diagram, you can map the role all_access to the group Admin, and alerting_full_access to Developer. User janedoe is in the group Admin, and user johnstiles is in the group Developer.

Then you will log in as each user to verify the access control by looking at the different dashboard views.

Let’s get started!

Prerequisites

Complete the following prerequisite steps:

  1. Have an AWS account.
  2. Have an Amazon OpenSearch Service domain.
  3. Enable IAM Identity Center in the same Region as the OpenSearch Service domain.
  4. Test your users in IAM Identity Center (to create users, refer to Add users).

Enable SAML in Amazon OpenSearch Service and copy SAML parameters

To configure SAML in OpenSearch Service, complete the following steps:

  1. On the OpenSearch Service console, choose Domains in the navigation pane.
  2. Choose your domain.
  3. On the Security configuration tab, confirm that Fine-grained access control is enabled.
  4. On the Actions menu, choose Edit security configuration.
  5. Select Enable SAML authentication.

You can also configure SAML during domain creation if you are creating a new OpenSearch domain. For more information, refer to SAML authentication for OpenSearch Dashboards.

  1. Copy the values for Service provider entity ID and IdP-Initiated SSO URL.

Create a SAML application in IAM Identity Center

To create a SAML application in IAM Identity Center, complete the following steps:

  1. On the IAM Identity Center console, choose Applications in the navigation pane.
  2. Choose Add application.
  3. Select Add customer SAML 2.0 application, then choose Next.
  4. Enter your application name for Display name.
  5. Under IAM Identity Center metadata, choose Download to download the SAML metadata file.
  6. Under Application metadata, select Manually type your metadata values.
  7. For Application ACS URL, enter the IdP-initiated URL you copied earlier.
  8. For Application SAML audience, enter the service provider entity ID you copied earlier.
  9. Choose Submit.
  10. On the Actions menu, choose Edit attribute mappings.
  11. Create attributes and map the following values:
    1. Subject map to ${user:email}, the format is emailAddress.
    2. Role map to ${user:groups}, the format is unspecified.
  12. Choose Save changes.
  13. On the IAM Identity Center console, choose Groups in the navigation pane.
  14. Create two groups: Developer and Admin.
  15. Assign user janedoe to the group Admin.
  16. Assign user johnstiles to the group Developer.
  17. Open the Admin group and copy the group ID.

Finish SAML configuration and map the SAML primary backend role

To complete your SAML configuration and map the SAML primary backend role, complete the following steps:

  1. On the OpenSearch Service console, choose Domains in the navigation pane.
  2. Open your domain and choose Edit security configuration.
  3. Under SAML authentication for OpenSearch Dashboards/Kibana, for Import IdP metadata, choose Import from XML file.
  4. Upload the IdP metadata downloaded from the IAM Identity Center metadata file.

The IdP entity ID will be auto populated.

  1. Under SAML master backend role, enter the group ID of the Admin group you copied earlier.
  2. For Roles key, enter Role for the SAML assertion.

This is because we defined and mapped Role to ${user:groups} as a SAML attribute in IAM Identity Center.

  1. Choose Save changes.

Configure backend role mapping for the Developer group

You have completely integrated IAM Identity Center with OpenSearch Service and mapped the Admin group as the primary role (all_access) in OpenSearch Service. Now you will log in to OpenSearch Dashboards as Admin and configure mapping for the Developer group.

There are two ways to log in to OpenSearch Dashboards:

  • OpenSearch Dashboards URL – On the OpenSearch Service console, navigate to your domain and choose the Dashboards URL under General Information. (For example, https://opensearch-domain-name-random-keys.us-west-2.es.amazonaws.com/_dashboards)
  • AWS access portal URL – On the IAM Identity Center console, choose Dashboard in the navigation pane and choose the access portal URL under Settings summary. (For example, https://d-1234567abc.awsapps.com/start)

Complete the following steps:

  1. Log in as the user in the Admin group (janedoe).
  2. Choose the tile for your OpenSearch Service application to be redirected to OpenSearch Dashboards.
  3. Choose the menu icon, then choose Security, Roles.
  4. Choose the alerting_full_access role and on the Mapped users tab, choose Manage mapping.
  5. For Backend roles, enter the group ID of Developer.
  6. Choose Map to apply the change.

Now you have successfully mapped the Developer group to the alerting_full_access role in OpenSearch Service.

Verify permissions

To verify permissions, complete the following steps:

  1. Log out of the Admin account in OpenSearch Service as log in as a Developer user.
  2. Choose the OpenSearch Service application tile to be redirected to OpenSearch Dashboards.

You can see there are only alerting related features available on the drop-down menu. This Developer user can’t see all of the Admin features, such as Security.

Clean up

After you test the solution, remember to delete all of the resources you created to avoid incurring future charges:

  1. Delete your Amazon OpenSearch Service domain.
  2. Delete the SAML application, users, and groups in IAM Identity Center.

Conclusion

In the post, we walked through a solution of how to map roles in Amazon OpenSearch Service to groups in IAM Identity Center by using SAML attributes to achieve role-based access control for accessing OpenSearch Dashboards. We connected IAM Identity Center users to OpenSearch Dashboards, and also mapped predefined OpenSearch Service security roles to IAM Identity Center groups based on group attributes. This makes it easier to manage permissions without updating the mapping when new users belonging to the same workgroup want to log in to OpenSearch Dashboards. You can follow the same procedure to provide fine-grained access to workgroups based on team functions or compliance requirements.


About the Authors

Scott Chang is a Solution Architecture at AWS based in San Francisco. He has over 14 years of hands-on experience in Networking also familiar with Security and Site Reliability Engineering. He works with one of major strategic customers in west region to design highly scalable, innovative and secure cloud solutions.

Muthu Pitchaimani is a Search Specialist with Amazon OpenSearch service. He builds large scale search applications and solutions. Muthu is interested in the topics of networking and security and is based out of Austin, Texas

Identify and remediate security threats to your business using security analytics with Amazon OpenSearch Service

Post Syndicated from Kevin Fallis original https://aws.amazon.com/blogs/big-data/identify-and-remediate-security-threats-to-your-business-using-security-analytics-with-amazon-opensearch-service/

Recently, one of the largest wireless carriers in North America revealed that hackers compromised a database of its customer information through unauthorized use of an API and acquired the personal details of millions of individuals, including names, addresses, phone numbers, and account numbers. Once identified, the company halted the malicious activity. However, investigations indicated that the data breach likely occurred months prior to being detected.

With the ever-increasing volume of data that organizations store in the cloud, malicious threats to their business sensitive data and resources will continue to grow alongside their online activity. Adversaries, also known as attackers, continue to use a variety of techniques to breach an organization’s security and compromise their systems, which can cause significant financial losses or damage to reputation or have legal consequences for the affected organization. To mitigate the damage caused, it is critically important for organizations to protect themselves by implementing various security measures and deploying tools to detect and respond to security threats. By being proactive, organizations can significantly reduce the risk of being victimized by cyber adversaries.

Amazon OpenSearch Service is a fully managed and scalable log analytics framework that you can use to ingest, store, and visualize data. You can use OpenSearch Service for a diverse set of data workloads including healthcare data, financial transactions information, application performance data, observability data, and much more. This managed service is valued for its ingest performance, scalability, low query latency, and its ability to analyze large datasets.

Security analytics with OpenSearch Service

Today, OpenSearch Service announces OpenSearch-powered security analytics, which includes features to monitor, analyze, and respond to potential security threats to your critical infrastructure. In this post, we discuss these new features and how to identify and remediate security threats.

Security analytics provide real-time visibility into potential threats across your infrastructure, enabling you to respond to security incidents quickly, thereby reducing the impact of any security breaches. It can also help you meet regulatory compliance requirements and improve your overall security posture.

Security analytics with OpenSearch is designed to gain visibility into a company’s infrastructure, monitor for anomalous activity, help detect potential security threats in real time, and trigger alerts to pre-configured destinations. You can monitor for malicious activity from your security event logs by continuously evaluating out-of-the-box security rules, and review auto generated security findings to aid your investigation. In addition, security analytics can generate automated alerts and send to a preconfigured destination of your choice such as Slack or email.

Security analytics is powered by the open-source OpenSearch project and deployed on OpenSearch Service with OpenSearch version 2.5 or higher. It includes the following key features:

  • Out-of-the-box support for over 2,200 open-source Sigma security rules
  • Support for log sources such as Windows, NetFlow, AWS CloudTrail, DNS, AD/LDAP, and more
  • Detectors that auto generate findings based on the Sigma rules
  • Automated alerts sent to preconfigured destinations
  • A rules editor to create new custom rules or modify existing rules
  • Visualizations to summarize findings and alerts trends

Sigma rules

Sigma is a generic signature format, expressed using YAML (yet another markup language), to describe significant events that occur in your logs in a simple and straightforward way. The format is portable across different SIEM implementations and fosters a community of threat hunters, so that you don’t have to reinvent the wheel if you change your SIEM implementation.

An example of a simple rule to detect the run of C:\Windows\System32\rundll32.exe, one of the most commonly used methods for launching malicious code on a Windows platform, could be the following YAML configuration:

title: Rundll32 execution
description: Detects a rundll32.exe execution
references:
      - https://attack.mitre.org/techniques/T1218/011/
author: Captain Threathunter
date: 2023/03/05
logsource:
    category: process_creation
    product: windows
detection:
    selection:
        winlog-event_data-ProcessName: 'C:\Windows\System32\rundll32.exe'
    condition: selection
level: high
status: test

After you import this rule into the security analytics rules repository and enable it with your detector, it auto generates a security finding when the preceding condition matches an incoming event log.

Security analytics components and concepts

The security analytics offering includes a number of tools and features elemental to its operation. The major components that comprise the plugin are summarized in the following sections.

Log types

OpenSearch supports several types of logs and provides out-of-the-box mappings for each. The log type is specified during the creation of a detector and includes the ability to customize field mappings for that detector. For a log type selected in a detector, security analytics automatically enables a relevant set of rules that run at the configured interval.

Detectors

Detectors are core components that you configure to identify a range of cybersecurity threats for a log type, across your data indexes. Detectors use custom rules and pre-packaged Sigma rules to evaluate events occurring in the system, automatically generating security findings from these events.

Rules

Rules, or threat detection rules, define the conditions applied to ingested log data to identify a security event. Security analytics provides prepackaged, open-source Sigma rules to detect common threats from your logs. Security analytics also supports importing, creating, and customizing rules to meet your requirements. Many rules are also mapped to an ever-growing knowledge base of adversary tactics and techniques maintained by the MITRE ATT&CK organization. You can take advantage of these options using either OpenSearch Dashboards or the APIs.

Findings

Findings are generated every time a detector matches a rule with a log event. Findings don’t necessarily point to imminent threats within the system, but they isolate an event of interest. Because they represent the result of a specific matched condition in a detector rule, findings include a unique combination of select rules, a log type, and a rule severity.

Alerts

When defining a detector, you can specify one or more conditions that trigger an alert. When an event triggers an alert, the system sends a notification to a preferred channel, such as Slack or email. The alert can be triggered when the detector matches one or multiple rules. You can also create a notification message with a customized subject line and message body.

Taking the tool for a test drive

With an understanding of these fundamental concepts, let’s navigate to the security analytics interface in OpenSearch Dashboards. Security analytics also provides a robust set of configuration APIs.

Overview page

After you have logged in to OpenSearch Dashboards and navigate to the security analytics overview page, you’re presented with the current state of the detectors you are monitoring. You can see a summary view comprised of multiple visualizations. The following chart, for example, shows the findings and alerts trend for various log types over a given period of time.

As you scroll down on the summary page, you can review your most recent findings and alerts.

Additionally, you can see a distribution of the most frequently triggered rules across all the active detectors. This can help you detect and investigate different types of malicious activities across log types.

Finally, you can view the status of configured detectors. From this panel, you can also navigate to the create detector workflow.

Creating a detector

In the previous section, we reviewed the overview page. Now, let’s walkthrough the create detector workflow. One of the best things about security analytics are the prepackaged rules. You don’t have to write your own. You can use the prepackaged rules to get up and running quickly! In the following example, we show you how to create a detector with prepackaged rules for your Windows logs.

  1. In the Dashboards navigation pane, under Security Analytics, choose Detectors.
  2. Choose Create Detector to create a new detector.
    1. First, give it a name and a data source to query. The data source can be a pattern or specific index.
    2. When you select a Log type, all matching rules are automatically loaded and enabled by default. In this example, we select Windows logs to help narrow the set of rules applied to this detector. As an optional step, you can choose to selectively enable or disable one or more rules. See an example rules selection panel below.
    3. Specify a schedule to run the rules and select Next.
    4. Configure any necessary field mappings per your rule.
      You have two field mapping sections to optionally review. Default mapped fields provide pre-configured field mappings for the specific log type and enabled rules; you can skip this section unless you need to change the mappings. Additional mappings can be configured in the Pending field mappings section.
  3. Configure the alerts.
    The final step of setting up a detector is to configure the alerts and review your configuration. Note that each detector can generate multiple findings or alerts, and you have the option to customize the alert destination based on a rule match criterion such as severity, tags etc. In this example, we show you how to match a single rule that monitors a password dump to a host file system (QuarksPwDumps Dump File) and send the alert to a destination of your choice.

    1. First, define the name of the alert.
    2. Set up the criticality based on configurations in the rule and select the tags.
    3. Give the alert a severity and select a channel.
      If you need to create a new channel, there is a breadcrumb that sends you to the Notifications feature. You can create additional channels needed.
    4. Review the configuration and Create the detector. Once the detector is active, any time a rule is matched for your incoming logs, it will automatically generate a security finding and alert (if configured).

Configuring custom rules

One of the key capabilities of security analytics is defining custom rules and being able to import rules created by others such as a community of threat hunters.  As mentioned before, security analytics includes over 2200 rules out of the box.  In some cases, you may want to create your own rules.  If you navigate to the Rules page, you have the option to create your own rule.

The rules editor allows you to provide a custom rule that it will automatically validate. Once created, the rule is included in the rules library, helping you to customize your threat hunting needs.

Conclusion

Many organizations struggle with the high cost of commercial alternatives and are required to duplicate their data across multiple systems that generate specific insights. OpenSearch Service security analytics provides an open-source alternative to businesses that seek to reduce the cost of their security products. There is no additional charge for security analytics, and you can customize it to meet the security requirements of your organization. With simple workflows and prepackaged security content, security analytics enables your security teams to detect potential threats quickly while providing the tools to help with security investigations.

To get started, create or upgrade your existing Amazon OpenSearch Service domain to OpenSearch version 2.5. To learn more about security analytics, see documentation.


About the Authors

Kevin Fallis (@AWSCodeWarrior) is an Principal AWS Specialist Search Solutions Architect.  His passion at AWS is to help customers leverage the correct mix of AWS services to achieve success for their business goals. His after-work activities include family, DIY projects, carpentry, playing drums, and all things music.

Jimish Shah is a Senior Product Manager at AWS with 15+ years of experience bringing products to market in log analytics, cybersecurity, and IP video streaming. He’s passionate about launching products that offer delightful customer experiences, and solve complex customer problems. In his free time, he enjoys exploring cafes, hiking, and taking long walks

Disaster Recovery Solutions with AWS-Managed Services, Part 3: Multi-Site Active/Passive

Post Syndicated from Brent Kim original https://aws.amazon.com/blogs/architecture/disaster-recovery-solutions-with-aws-managed-services-part-3-multi-site-active-passive/

Welcome to the third post of a multi-part series that addresses disaster recovery (DR) strategies with the use of AWS-managed services to align with customer requirements of performance, cost, and compliance. In part two of this series, we introduced a DR concept that utilizes managed services through a backup and restore strategy with multiple Regions. The post also introduces a multi-site active/passive approach.

The multi-site active/passive approach is best for customers who have business-critical workloads with higher availability requirements over other active/passive environments. A warm-standby strategy (as in Figure 1) is more costly than other active/passive strategies, but provides good protection from downtime and data loss outside of an active/active (A/A) environment.

Warm standby

Figure 1. Warm standby

Implementing the multi-site active/passive strategy

By replicating across multiple Availability Zones in same Region, your workloads become resilient to the failure of an entire data center. Using multiple Regions provides the most resilient option to deploy workloads, which safeguards against the risk of failure of multiple data centers.

Let’s explore an application that processes payment transactions and is modernized to utilize managed services in the AWS Cloud, as in Figure 2.

Warm standby with managed services

Figure 2. Warm standby with managed services

Let’s cover each of the components of this application, as well as how managed services behave in a multisite environment.

1. Amazon Route53 – Active/Passive Failover: This configuration consists of primary resources to be available, and secondary resources on standby in the case of failure of the primary environment. You would just need to create the records and specify failover for the routing policy. When responding to queries, Amazon Route 53 includes only the healthy primary resources. If the primary record configured in the Route 53 health check shows as unhealthy, Route 53 responds to DNS queries using the secondary record.

2. Amazon EKS control plane: Amazon Elastic Kubernetes Service (Amazon EKS) control plane nodes run in an account managed by AWS. Each EKS cluster control plane is single-tenant and unique, and runs on its own set of Amazon Elastic Compute Cloud (Amazon EC2) instances. Amazon EKS is also a Regional service, so each cluster is confined to the Region where it is deployed, with each cluster being a standalone entity.

3. Amazon EKS data plane: Operating highly available and resilient applications requires a highly available and resilient data plane. It’s best practice to create worker nodes using Amazon EC2 Auto Scaling groups instead of creating individual Amazon EC2 instances and joining them to the cluster.

Figure 2 shows three nodes in the primary Region while there will only be a single node in the secondary. In case of failover, the data plane scales up to meet the workload requirements. This strategy deploys a functional stack to the secondary Region to test Region readiness before failover. You can use Velero with Portworx to manage snapshots of persistent volumes. These snapshots can be stored in an Amazon Simple Storage Service (Amazon S3) bucket in the primary Region, which is replicated to an Amazon S3 bucket in another Region using Amazon S3 cross-Region replication.

During an outage in the primary Region, Velero restores volumes from the latest snapshots in the standby cluster.

4. Amazon OpenSearch Service: With cross-cluster replication in Amazon OpenSearch Service, you can replicate indexes, mappings, and metadata from one OpenSearch Service domain to another. The domain follows an active-passive replication model where the follower index (where the data is replicated) pulls data from the leader index. Using cross-cluster replication helps to ensure recovery from disaster events and allows you to replicate data across geographically distant data centers to reduce latency.

Cross-cluster replication is available on domains running Elasticsearch 7.10 or OpenSearch 1.1 or later. Full documentation for cross-cluster replication is available in the OpenSearch documentation.

If you are using any versions prior to Elasticsearch 7.10 or OpenSearch 1.1, refer to part two of our blog series for guidance on using APIs for cross-Region replication.

5. Amazon RDS for PostgreSQL: One of the managed service offerings of Amazon Relational Database Service (Amazon RDS) for PostgreSQL is cross-Region read replicas. Cross-Region read replicas enable you to have a DR solution scaling read database workloads, and cross-Region migration.

Amazon RDS for PostgreSQL supports the ability to create read replicas of a source database (DB). Amazon RDS uses an asynchronous replication method of the DB engine to update the read replica whenever there is a change made on the source DB instance. Although read replicas operate as a DB instance that allows only read-only connections, they can be used to implement a DR solution for your production DB environment. If the source DB instance fails, you can promote your Read Replica to a standalone source server.

Using a cross-Region read replica helps ensure that you get back up and running if you experience a Regional availability issue. For more information on PostgreSQL cross-Region read replicas, visit the Best Practices for Amazon RDS for PostgreSQL Cross-Region Read Replicas blog post.

6. Amazon ElastiCache: AWS provides a native solution called Global Datastore that enables cross-Region replication. By using the Global Datastore for Redis feature, you can work with fully managed, fast, reliable, and secure replication across AWS Regions. This feature helps create cross-Region read replica clusters for ElastiCache for Redis to enable low-latency reads and DR across AWS Regions. Each global datastore is a collection of one or more clusters that replicate to one another. When you create a global datastore in Amazon ElastiCache, ElastiCache for Redis automatically replicates your data from the primary cluster to the secondary cluster. ElastiCache then sets up and manages automatic, asynchronous replication of data between the two clusters.

7. Amazon Redshift: With Amazon Redshift, there are only two ways of deploying a true DR approach: backup and restore, and an (A/A) solution. We’ll use the A/A solution as this provides a better recovery time objective (RTO) for the overall approach. The recovery point objective (RPO) is dependent upon the configured schedule of AWS Lambda functions. The application within the primary Region sends data to both Amazon Simple Notification Service (Amazon SNS) and Amazon S3, and the data is distributed to the Redshift clusters in both Regions through Lambda functions.

Amazon EKS uploads data to an Amazon S3 bucket and publishes a message to an Amazon SNS topic with a reference to the stored S3 object. S3 acts as an intermediate data store for messages beyond the maximum output limit of Amazon SNS. Amazon SNS is configured with primary and secondary Region Amazon Simple Queue Service (Amazon SQS) endpoint subscriptions. Amazon SNS supports the cross-Region delivery of notifications to Amazon SQS queues. Lambda functions deployed in the primary and secondary Region are used to poll the Amazon SQS queue in respective Regions to read the message. The Lambda functions then use the Amazon SQS Extended Client Library for Java to retrieve the Amazon S3 object referenced in the message. Once the Amazon S3 object is retrieved, the Lambda functions upload the data into Amazon Redshift.

For more on how to coordinate large messages across accounts and Regions with Amazon SNS and Amazon SQS, explore the Coordinating Large Messages Across Accounts and Regions with Amazon SNS and SQS blog post.

Conclusion

This active/passive approach covers how you can build a creative DR solution using a mix of native and non-native cross-Region replication methods. By using managed services, this strategy becomes simpler through automation of service updates, deployment using Infrastructure as a Code (IaaC), and general management of the two environments.

Related information

Want to learn more? Explore the following resources within this series and beyond!

Boosting Resiliency with an ML-based Telemetry Analytics Architecture

Post Syndicated from Shibu Nair original https://aws.amazon.com/blogs/architecture/boosting-resiliency-with-an-ml-based-telemetry-analytics-architecture/

Data proliferation has become a norm and as organizations become more data driven, automating data pipelines that enable data ingestion, curation, and processing is vital. Since many organizations have thousands of time-bound, automated, complex pipelines, monitoring their telemetry information is critical. Keeping track of telemetry data helps businesses monitor and recover their pipelines faster which results in better customer experiences.

In our blog post, we explain how you can collect telemetry from your data pipeline jobs and use machine learning (ML) to build a lower- and upper-bound threshold to help operators identify anomalies in near-real time.

The applications of anomaly detection on telemetry data from job pipelines are wide-ranging, including these and more:

  • Detecting abnormal runtimes
  • Detecting jobs running slower than expected
  • Proactive monitoring
  • Notifications

Key tenets of telemetry analytics

There are five key tenets of telemetry analytics, as in Figure 1.

Key tenets of telemetry analytics

Figure 1. Key tenets of telemetry analytics

The key tenets for near real-time telemetry analytics for data pipelines are:

  1. Collecting the metrics
  2. Aggregating the metrics
  3. Identify anomaly
  4. Notify and resolve issues
  5. Persist for compliance reasons, historical trend analysis, and to visualize

This blog post describes how customers can easily implement these steps by using AWS native no-code, low-code (AWS LCNC) solutions.

ML-based telemetry analytics solution architecture

The architecture defined here helps customers incrementally enable features with AWS LCNC solutions by leveraging AWS managed services to avoid the overhead of infrastructure provisioning. Most of the steps are configurations of the features provided by AWS services. This enables customers to make their applications resilient by tracking and resolving anomalies in near real time, as in Figure 2.

ML-based telemetry analytics solution architecture

Figure 2. ML-based telemetry analytics solution architecture

Let’s explore each of the architecture steps in detail.

1. Indicative AWS data analytics services: Choose from a broad range of AWS analytics services, including data movement, data storage, data lakes, big data analytics, log analytics, and streaming analytics to business intelligence, ML, and beyond. This diagram shows a subset of these data analytics services. You may use one or a combination of many, depending on your use case.

2. Amazon CloudWatch metrics for telemetry analytics: Collecting and visualizing real-time logs, metrics, and event data is a key step in any process. CloudWatch helps you accomplish these tasks without any infrastructure provisioning. Almost every AWS data analytics service is integrated with CloudWatch to enable automatic capturing of the detailed metrics needed for telemetry analytics.

3. Near real-time use case examples: Step three presents practical, near real-time use cases that represent a range of real-world applications, one or more of which may apply to your own business needs.

Use case 1: Anomaly detection

CloudWatch provides the functionality to apply anomaly detection for a metric. The key business use case of this feature is to apply statistical and ML algorithms on a per-metrics basis of business critical applications to proactively identify issues and raise alarms.

The focus is on a single set of metrics that will be important for the application’s functioning—for example, AWS Lambda metrics of a 24/7 credit card company’s fraud monitoring application.

Use case 2: Unified metrics using Amazon Managed Grafana

For proper insights into telemetry data, it is important to unify metrics and collaboratively identify and troubleshoot issues in analytical systems. Amazon Managed Grafana helps to visualize, query, and corelate metrics from CloudWatch in near real-time.

For example, Amazon Managed Grafana can be used to monitor container metrics for Amazon EMR running on Amazon Elastic Kubernetes Service (Amazon EKS), which supports processing high-volume data from business critical Internet of Things (IoT) applications like connected factories, offsite refineries, wind farms, and more.

Use case 3: Combined business and metrics data using Amazon OpenSearch Service

Amazon OpenSearch Service provides the capability to perform near real-time, ML-based interactive log analytics, application monitoring, and search by combining business and telemetry data.

As an example, customers can combine AWS CloudTrail logs for AWS logins, Amazon Athena, and Amazon RedShift query access times with employee reference data to detect insider threats.

This log analytics use case architecture integrates into OpenSearch, as in Figure 3.

Log analytics use case architecture overview with OpenSearch

Figure 3. Log analytics use case architecture overview with OpenSearch

Use case 4: ML-based advanced analytics

Using Amazon Simple Storage Service (Amazon S3) as data storage, data lake customers can tap into AWS analytics services such as the AWS Glue Catalog, AWS Glue DataBrew, and Athena for preparing and transforming data, as well as build trend analysis using ML models in Amazon SageMaker. This mechanism helps with performing ML-based advanced analytics to identify and resolve recurring issues.

4. Anomaly resolution: When an alert is generated either by CloudWatch alarm, OpenSearch, or Amazon Managed Grafana, you have the option to act on the alert in near-real time. Amazon Simple Notification Service (Amazon SNS) and Lambda can help build workflows. Lambda also helps integrate with ServiceNow ticket creation, Slack channel notifications, or other ticketing systems.

Simple data pipeline example

Let’s explore another practical example using an architecture that demonstrates how AWS Step Functions orchestrates Lambda, AWS Glue jobs, and crawlers.

To report an anomaly on AWS Glue jobs based on total number of records processed, you can leverage the glue.driver.aggregate.recordsRead CloudWatch metric and set up a CloudWatch alarm based on anomaly detection, Amazon SNS topic for notifications, and Lambda for resolution, as in Figure 4.

AWS Step Functions orchestrating Lamba, AWS Glue jobs, and crawlers

Figure 4. AWS Step Functions orchestrating Lamba, AWS Glue jobs, and crawlers

Here are the steps involved in the architecture proposed:

  • CloudWatch automatically captures the metric glue.driver.aggregate.recordsRead from AWS Glue jobs.
  • Customers set a CloudWatch alarm based on the anomaly detection of glue.driver.aggregate.recordsRead metric and set a notification to Amazon SNS topic.
  • CloudWatch applies a ML algorithm to the metric’s past data and creates a model of metric’s expected values.
  • When the number of records increases significantly, the metric from the CloudWatch anomaly detection model notifies the Amazon SNS topic.
  • Customers can notify an email group and trigger a Lambda function to resolve the issue, or create tickets in their operational monitoring system.
  • Customers can also unify all the AWS Glue metrics using Amazon Managed Grafana. Using Amazon S3, data lake customers can crawl and catalog the data in the AWS Glue catalog and make it available for ad-hoc querying. Amazon SageMaker can be used for custom model training and inferencing.

Conclusion

In this blog post, we covered a recommended architecture to enable near-real time telemetry analytics for data pipelines, anomaly detection, notification, and resolution. This provides resiliency to the customer applications by proactively identifying and resolving issues.

Build a semantic search engine for tabular columns with Transformers and Amazon OpenSearch Service

Post Syndicated from Kachi Odoemene original https://aws.amazon.com/blogs/big-data/build-a-semantic-search-engine-for-tabular-columns-with-transformers-and-amazon-opensearch-service/

Finding similar columns in a data lake has important applications in data cleaning and annotation, schema matching, data discovery, and analytics across multiple data sources. The inability to accurately find and analyze data from disparate sources represents a potential efficiency killer for everyone from data scientists, medical researchers, academics, to financial and government analysts.

Conventional solutions involve lexical keyword search or regular expression matching, which are susceptible to data quality issues such as absent column names or different column naming conventions across diverse datasets (for example, zip_code, zcode, postalcode).

In this post, we demonstrate a solution for searching for similar columns based on column name, column content, or both. The solution uses approximate nearest neighbors algorithms available in Amazon OpenSearch Service to search for semantically similar columns. To facilitate the search, we create features representations (embeddings) for individual columns in the data lake using pre-trained Transformer models from the sentence-transformers library in Amazon SageMaker. Finally, to interact with and visualize results from our solution, we build an interactive Streamlit web application running on AWS Fargate.

We include a code tutorial for you to deploy the resources to run the solution on sample data or your own data.

Solution overview

The following architecture diagram illustrates the two-stage workflow for finding semantically similar columns. The first stage runs an AWS Step Functions workflow that creates embeddings from tabular columns and builds the OpenSearch Service search index. The second stage, or the online inference stage, runs a Streamlit application through Fargate. The web application collects input search queries and retrieves from the OpenSearch Service index the approximate k-most-similar columns to the query.

Solution architecture

Figure 1. Solution architecture

The automated workflow proceeds in the following steps:

  1. The user uploads tabular datasets into an Amazon Simple Storage Service (Amazon S3) bucket, which invokes an AWS Lambda function that initiates the Step Functions workflow.
  2. The workflow begins with an AWS Glue job that converts the CSV files into Apache Parquet data format.
  3. A SageMaker Processing job creates embeddings for each column using pre-trained models or custom column embedding models. The SageMaker Processing job saves the column embeddings for each table in Amazon S3.
  4. A Lambda function creates the OpenSearch Service domain and cluster to index the column embeddings produced in the previous step.
  5. Finally, an interactive Streamlit web application is deployed with Fargate. The web application provides an interface for the user to input queries to search the OpenSearch Service domain for similar columns.

You can download the code tutorial from GitHub to try this solution on sample data or your own data. Instructions on the how to deploy the required resources for this tutorial are available on Github.

Prerequistes

To implement this solution, you need the following:

  • An AWS account.
  • Basic familiarity with AWS services such as the AWS Cloud Development Kit (AWS CDK), Lambda, OpenSearch Service, and SageMaker Processing.
  • A tabular dataset to create the search index. You can bring your own tabular data or download the sample datasets on GitHub.

Build a search index

The first stage builds the column search engine index. The following figure illustrates the Step Functions workflow that runs this stage.

Step functions workflow

Figure 2 – Step functions workflow – multiple embedding models

Datasets

In this post, we build a search index to include over 400 columns from over 25 tabular datasets. The datasets originate from the following public sources:

For the the full list of the tables included in the index, see the code tutorial on GitHub.

You can bring your own tabular dataset to augment the sample data or build your own search index. We include two Lambda functions that initiate the Step Functions workflow to build the search index for individual CSV files or a batch of CSV files, respectively.

Transform CSV to Parquet

Raw CSV files are converted to Parquet data format with AWS Glue. Parquet is a column-oriented format file format preferred in big data analytics that provides efficient compression and encoding. In our experiments, the Parquet data format offered significant reduction in storage size compared to raw CSV files. We also used Parquet as a common data format to convert other data formats (for example JSON and NDJSON) because it supports advanced nested data structures.

Create tabular column embeddings

To extract embeddings for individual table columns in the sample tabular datasets in this post, we use the following pre-trained models from the sentence-transformers library. For additional models, see Pretrained Models.

Model name Dimension Size (MB)
all-MiniLM-L6-v2 384 80
all-distilroberta-v1 768 290
average_word_embeddings_glove.6B.300d 300 420

The SageMaker Processing job runs create_embeddings.py(code) for a single model. For extracting embeddings from multiple models, the workflow runs parallel SageMaker Processing jobs as shown in the Step Functions workflow. We use the model to create two sets of embeddings:

  • column_name_embeddings – Embeddings of column names (headers)
  • column_content_embeddings – Average embedding of all the rows in the column

For more information about the column embedding process, see the code tutorial on GitHub.

An alternative to the SageMaker Processing step is to create a SageMaker batch transform to get column embeddings on large datasets. This would require deploying the model to a SageMaker endpoint. For more information, see Use Batch Transform.

Index embeddings with OpenSearch Service

In the final step of this stage, a Lambda function adds the column embeddings to a OpenSearch Service approximate k-Nearest-Neighbor (kNN) search index. Each model is assigned its own search index. For more information about the approximate kNN search index parameters, see k-NN.

Online inference and semantic search with a web app

The second stage of the workflow runs a Streamlit web application where you can provide inputs and search for semantically similar columns indexed in OpenSearch Service. The application layer uses an Application Load Balancer, Fargate, and Lambda. The application infrastructure is automatically deployed as part of the solution.

The application allows you to provide an input and search for semantically similar column names, column content, or both. Additionally, you can select the embedding model and number of nearest neighbors to return from the search. The application receives inputs, embeds the input with the specified model, and uses kNN search in OpenSearch Service to search indexed column embeddings and find the most similar columns to the given input. The search results displayed include the table names, column names, and similarity scores for the columns identified, as well as the locations of the data in Amazon S3 for further exploration.

The following figure shows an example of the web application. In this example, we searched for columns in our data lake that have similar Column Names (payload type) to district (payload). The application used all-MiniLM-L6-v2 as the embedding model and returned 10 (k) nearest neighbors from our OpenSearch Service index.

The application returned transit_district, city, borough, and location as the four most similar columns based on the data indexed in OpenSearch Service. This example demonstrates the ability of the search approach to identify semantically similar columns across datasets.

Web application user interface

Figure 3: Web application user interface

Clean up

To delete the resources created by the AWS CDK in this tutorial, run the following command:

cdk destroy --all

Conclusion

In this post, we presented an end-to-end workflow for building a semantic search engine for tabular columns.

Get started today on your own data with our code tutorial available on GitHub. If you’d like help accelerating your use of ML in your products and processes, please contact the Amazon Machine Learning Solutions Lab.


About the Authors

Kachi Odoemene is an Applied Scientist at AWS AI. He builds AI/ML solutions to solve business problems for AWS customers.

Taylor McNally is a Deep Learning Architect at Amazon Machine Learning Solutions Lab. He helps customers from various industries build solutions leveraging AI/ML on AWS. He enjoys a good cup of coffee, the outdoors, and time with his family and energetic dog.

Austin Welch is a Data Scientist in the Amazon ML Solutions Lab. He develops custom deep learning models to help AWS public sector customers accelerate their AI and cloud adoption. In his spare time, he enjoys reading, traveling, and jiu-jitsu.

Control access to Amazon OpenSearch Service Dashboards with attribute-based role mappings

Post Syndicated from Stefan Appel original https://aws.amazon.com/blogs/big-data/control-access-to-amazon-opensearch-service-dashboards-with-attribute-based-role-mappings/

Federated users of Amazon OpenSearch Service often need access to OpenSearch Dashboards with roles based on their user profiles. OpenSearch Service fine-grained access control maps authenticated users to OpenSearch Search roles and then evaluates permissions to determine how to handle the user’s actions. However, when an enterprise-wide identity provider (IdP) manages the users, the mapping of users to OpenSearch Service roles often needs to happen dynamically based on IdP user attributes. One option to map users is to use OpenSearch Service SAML integration and pass user group information to OpenSearch Service. Another option is Amazon Cognito role-based access control, which supports rule-based or token-based mappings. But neither approach supports arbitrary role mapping logic. For example, when you need to interpret multivalued user attributes to identify a target role.

This post shows how you can implement custom role mappings with an Amazon Cognito pre-token generation AWS Lambda trigger. For our example, we use a multivalued attribute provided over OpenID Connect (OIDC) to Amazon Cognito. We show how you are in full control of the mapping logic and process of such a multivalued attribute for AWS Identity and Access Management (IAM) role lookups. Our approach is generic for OIDC-compatible IdPs. To make this post self-contained, we use the Okta IdP as an example to walk through the setup.

Overview of solution

The provided solution intercepts the OICD-based login process to OpenSearch Dashboards with a pre-token generation Lambda function. The login to OpenSearch Dashboards with a third-party IdP and Amazon Cognito as an intermediary consists of several steps:

  1. First, the initial user request to OpenSearch Dashboard is redirected to Amazon Cognito.
  2. Amazon Cognito redirects the request to the IdP for authentication.
  3. After the user authenticates, the IdP sends the identity token (ID token) back to Amazon Cognito.
  4. Amazon Cognito invokes a Lambda function that modifies the obtained token. We use an Amazon DynamoDB table to perform role mapping lookups. The modified token now contains the IAM role mapping information.
  5. Amazon Cognito uses this role mapping information to map the user to the specified IAM role and provides the role credentials.
  6. OpenSearch Service maps the IAM role credentials to OpenSearch roles and applies fine-grained permission checks.

The following architecture outlines the login flow from a user’s perspective.

Scope of solution

On the backend, OpenSearch Dashboards integrates with an Amazon Cognito user pool and an Amazon Cognito identity pool during the authentication flow. The steps are as follows:

  1. Authenticate and get tokens.
  2. Look up the token attribute and IAM role mapping and overwrite the Amazon Cognito attribute.
  3. Exchange tokens for AWS credentials used by OpenSearch dashboards.

The following architecture shows this backend perspective to the authentication process.

Backend authentication flow

In the remainder of this post, we walk through the configurations necessary for an authentication flow in which a Lambda function implements custom role mapping logic. We provide sample Lambda code for the mapping of multivalued OIDC attributes to IAM roles based on a DynamoDB lookup table with the following structure.

OIDC Attribute Value IAM Role
["attribute_a","attribute_b"] arn:aws:iam::<aws-account-id>:role/<role-name-01>
["attribute_a","attribute_x"] arn:aws:iam::<aws-account-id>:role/<role-name-02>

The high-level steps of the solution presented in this post are as follows:

  1. Configure Amazon Cognito authentication for OpenSearch Dashboards.
  2. Add IAM roles for mappings to OpenSearch Service roles.
  3. Configure the Okta IdP.
  4. Add a third-party OIDC IdP to the Amazon Cognito user pool.
  5. Map IAM roles to OpenSearch Service roles.
  6. Create the DynamoDB attribute-role mapping table.
  7. Deploy and configure the pre-token generation Lambda function.
  8. Configure the pre-token generation Lambda trigger.
  9. Test the login to OpenSearch Dashboards.

Prerequisites

For this walkthrough, you should have the following prerequisites:

  • An AWS account with an OpenSearch Service domain.
  • A third-party IdP that supports OpenID Connect and adds a multivalued attribute in the authorization token. For this post, we use attributes_array as this attribute’s name and Okta as an IdP provider. You can create an Okta Developer Edition free account to test the setup.

Configure Amazon Cognito authentication for OpenSearch Dashboards

The modification of authentication tokens requires you to configure the OpenSearch Service domain to use Amazon Cognito for authentication. For instructions, refer to Configuring Amazon Cognito authentication for OpenSearch Dashboards.

The Lambda function implements custom role mappings by setting the cognito:preferred_role claim (for more information, refer to Role-based access control). For the correct interpretation of this claim, set the Amazon Cognito identity pool to Choose role from token. The Amazon Cognito identity pool then uses the value of the cognito:preferred_role claim to select the correct IAM role. The following screenshot shows the required settings in the Amazon Cognito identity pool that is created during the configuration of Amazon Cognito authentication for OpenSearch Service.

Cognito role mapping configuration

Add IAM roles for mappings to OpenSearch roles

IAM roles used for mappings to OpenSearch roles require a trust policy so that authenticated users can assume them. The trust policy needs to reference the Amazon Cognito identity pool created during the configuration of Amazon Cognito authentication for OpenSearch Service. Create at least one IAM role with a custom trust policy. For instructions, refer to Creating a role using custom trust policies. The IAM role doesn’t require the attachment of a permission policy. For a sample trust policy, refer to Role-based access control.

Configure the Okta IdP

In this section, we describe the configuration steps to include a multivalued attribute_array attribute in the token provided by Okta. For more information, refer to Customize tokens returned from Okta with custom claims. We use the Okta UI to perform the configurations. Okta also provides an API that you can use to script and automate the setup.

The first step is adding the attributes_array attribute to the Okta user profile.

  1. Use Okta’s Profile Editor under Directory, Profile Editor.
  2. Select User (default) and then choose Add Attribute.
  3. Add an attribute with a display name and variable name attributes_array of type string array.

The following screenshot shows the Okta default user profile after the custom attribute has been added.

Okta user profile editor

  1. Next, add attributes_array attribute values to users using Okta’s user management interface under Directory, People.
  2. Select a user and choose Profile.
  3. Choose Edit and enter attribute values.

The following screenshot shows an example of attributes_array attribute values within a user profile.

Okta user attributes array

The next step is adding the attributes_array attribute to the ID token that is generated during the authentication process.

  1. On the Okta console, choose Security, API and select the default authorization server.
  2. Choose Claims and choose Add Claim to add the attributes_array attribute as part of the ID token.
  3. As the scope, enter openid and as the attribute value, enter user.attributes_array.

This references the previously created attribute in a user’s profile.

Add claim to ID token

  1. Next, create an application for the federation with Amazon Cognito. For instructions, refer to How do I set up Okta as an OpenID Connect identity provider in an Amazon Cognito user pool.

The last step assigns the Okta application to Okta users.

  1. Navigate to Directory, People, select a user, and choose Assign Applications.
  2. Select the application you created in the previous step.

Add a third-party OIDC IdP to the Amazon Cognito user pool

We are implementing the role mapping based on the information provided in a multivalued OIDC attribute. The authentication token needs to include this attribute. If you followed the previously described Okta configuration, the attribute is automatically added to the ID token of a user. If you used another IdP, you might have to request the attribute explicitly. For this, add the attribute name to the Authorized scopes list of the IdP in Amazon Cognito.

For instructions on how to set up the federation between a third-party IdP and an Amazon Cognito user pool and how to request additional attributes, refer to Adding OIDC identity providers to a user pool. For a detailed walkthrough for Okta, refer to How do I set up Okta as an OpenID Connect identity provider in an Amazon Cognito user pool.

After requesting the token via OIDC, you need to map the attribute to an Amazon Cognito user pool attribute. For instructions, refer to Specifying identity provider attribute mappings for your user pool. The following screenshot shows the resulting configuration on the Amazon Cognito console.

Amazon Cognito user pool attribute mapping

Map IAM roles to OpenSearch Service roles

Upon login, OpenSearch Service maps users to an OpenSearch Service role based on the IAM role ARN set in the cognito:preferred_role claim by the pre-token generation Lambda trigger. This requires a role mapping in OpenSearch Service. To add such role mappings to IAM backend roles, refer to Mapping roles to users. The following screenshot shows a role mapping on the OpenSearch Dashboards console.

Amazon OpenSearch Service role mappings

Create the attribute-role mapping table

For this solution, we use DynamoDB to store mappings of users to IAM roles. For instructions, refer to Create a table and define a partition key named Key of type String. You need the table name in the subsequent step to configure the Lambda function.

The next step is writing the mapping information into the table. A mapping entry consists of the following attributes:

  • Key – A string that contains attribute values in comma-separated alphabetical order
  • RoleArn – A string with the IAM role ARN to which the attribute value combination should be mapped

For details on how to add data to a DynamoDB table, refer to Write data to a table using the console or AWS CLI.

For example, if the previously configured OIDC attribute attributes_array contains three values, attribute_a, attribute_b, and attribute_c, the entry in the mapping table looks like table line 1 in the following screenshot.

Amazon DynamoDB table with attribute-role mappings

Deploy and configure the pre-token generation Lambda function

A Lambda function implements the custom role mapping logic. The Lambda function receives an Amazon Cognito event as input and extracts attribute information out of it. It uses the attribute information for a lookup in a DynamoDB table and retrieves the value for cognito:preferred_role. Follow the steps in Getting started with Lambda to create a Node.js Lambda function and insert the following source code:

const AWS = require("aws-sdk");
const tableName = process.env.TABLE_NAME;
const unauthorizedRoleArn = process.env.UNAUTHORIZED_ROLE;
const userAttributeArrayName = process.env.USER_POOL_ATTRIBUTE;
const dynamodbClient = new AWS.DynamoDB({apiVersion: "2012-08-10"});
exports.lambdaHandler = handlePreTokenGenerationEvent

async function handlePreTokenGenerationEvent (event, context) {
    var sortedAttributeList = getSortedAttributeList(event);
    var lookupKey = sortedAttributeList.join(',');
    var roleArn = await lookupIAMRoleArn(lookupKey);
    appendResponseWithPreferredRole(event, roleArn);
    return event;
}

function getSortedAttributeList(event) {
    return JSON.parse(event['request']['userAttributes'][userAttributeArrayName]).sort();
}

async function lookupIAMRoleArn(key) {
    var params = {
        TableName: tableName,
        Key: {
          'Key': {S: key}
        },
        ProjectionExpression: 'RoleArn'
      };
    try {
        let item = await dynamodbClient.getItem(params).promise();
        return item['Item']['RoleArn']['S'];
    } catch (e){
        console.log(e);
        return unauthorizedRoleArn; 
    }
}

function appendResponseWithPreferredRole(event, roleArn){
    event.response = {
        'claimsOverrideDetails': {
            'groupOverrideDetails': {
                'preferredRole': roleArn
            }
        }
    };
}

The Lambda function expects three environment variables. Refer to Using AWS Lambda environment variables for instructions to add the following entries:

  • TABLE_NAME – The name of the previously created DynamoDB table. This table is used for the lookups.
  • UNAUTHORIZED_ROLE – The ARN of the IAM role that is used when no mapping is found in the lookup table.
  • USER_POOL_ATTRIBUTE – The Amazon Cognito user pool attribute used for the IAM role lookup. In our example, this attribute is named custom:attributes_array.

The following screenshot shows the final configuration.

AWS Lamba function configuration

The Lambda function needs permissions to access the DynamoDB lookup table. Set permissions as follows: attach the following policy to the Lambda execution role (for instructions, refer to Lambda execution role) and provide the Region, AWS account number, and DynamoDB table name:

{
    "Statement": [
        {
            "Action": [
                "dynamodb:GetItem",
                "dynamodb:Scan",
                "dynamodb:Query",
                "dynamodb:BatchGetItem",
                "dynamodb:DescribeTable"
            ],
            "Resource": [
                "arn:aws:dynamodb:<region>:<accountid>:table/<table>",
                "arn:aws:dynamodb:<region>:<accountid>:table/<table>/index/*"
            ],
            "Effect": "Allow"
        }
    ]
}

The configuration of the Lambda function is now complete.

Configure the pre-token generation Lambda trigger

As final step, add a pre-token generation trigger to the Amazon Cognito user pool and reference the newly created Lambda function. For details, refer to Customizing user pool workflows with Lambda triggers. The following screenshot shows the configuration.

Amazon Cognito pre-token generation trigger configuration

This step completes the setup; Amazon Cognito now maps users to OpenSearch Service roles based on the values provided in an OIDC attribute.

Test the login to OpenSearch Dashboards

The following diagram shows an exemplary login flow and the corresponding screenshots for an Okta user user1 with a user profile attribute attribute_array and value: ["attribute_a", "attribute_b", "attribute_c"].

Testing of solution

Clean up

To avoid incurring future charges, delete the OpenSearch Service domain, Amazon Cognito user pool and identity pool, Lambda function, and DynamoDB table created as part of this post.

Conclusion

In this post, we demonstrated how to set up a custom mapping to OpenSearch Service roles using values provided via an OIDC attribute. We dynamically set the cognito:preferred_role claim using an Amazon Cognito pre-token generation Lambda trigger and a DynamoDB table for lookup. The solution is capable of handling dynamic multivalued user attributes, but you can extend it with further application logic that goes beyond a simple lookup. The steps in this post are a proof of concept. If you plan to develop this into a productive solution, we recommend implementing Okta and AWS security best practices.

The post highlights just one use case of how you can use Amazon Cognito support for Lambda triggers to implement custom authentication needs. If you’re interested in further details, refer to How to Use Cognito Pre-Token Generation trigger to Customize Claims In ID Tokens.


About the Authors

Portrait StefanStefan Appel is a Senior Solutions Architect at AWS. For 10+ years, he supports enterprise customers adopt cloud technologies. Before joining AWS, Stefan held positions in software architecture, product management, and IT operations departments. He began his career in research on event-based systems. In his spare time, he enjoys hiking and has walked the length of New Zealand following Te Araroa.

Portrait ModoodModood Alvi is Senior Solutions Architect at Amazon Web Services (AWS). Modood is passionate about digital transformation and is committed helping large enterprise customers across the globe accelerate their adoption of and migration to the cloud. Modood brings more than a decade of experience in software development, having held various technical roles within companies like SAP and Porsche Digital. Modood earned his Diploma in Computer Science from the University of Stuttgart.

Building an event-driven solution for AvalonBay property leasing and search

Post Syndicated from Kausik Dey original https://aws.amazon.com/blogs/architecture/building-an-event-driven-solution-for-avalonbay-property-leasing-and-search/

In this blog post, we show you how to build an event-driven and serverless solution for property leasing and search that is scalable and resilient. This solution was created for AvalonBay Communities, Inc.—a leading residential Real Estate Investment Trusts (REITs). It enables:

  • More than 150,000 multi-parameter searches per day
  • The processing of more than 3,500 lease applications and 85,000 individual rent payments per month

Introduction

AvalonBay is an equity REIT. The company has a long track record of developing, redeveloping, acquiring, and managing apartment homes in top U.S. markets. AvalonBay builds long-term value for customers using innovative technology solutions.

The company understands that data-driven insights contribute to targeted business growth. But AvalonBay found that managing the complex interdependencies between multiple data sets—from real estate and property management systems to financial and payment systems—required a new solution.

The challenge

AvalonBay owned or held a direct or indirect ownership interest in 293 apartment communities containing 88,405 apartment homes in 12 states and Washington, D.C., as of September 30, 2022.

Of these, 18 communities were under development and one was under redevelopment. This presented a unique challenge to both internal and external users looking to search and lease apartment units based on multi-parameter selection criteria in geographically dispersed regions. For example, finding units in buildings with specific amenities, lease terms, furnishings and availability dates.

Overview of solution

AvalonBay’s fully managed leasing solution for applicants and residents is hosted by Amazon Web Services (AWS). The solution is secure, autoscaling, and multi-region, ensuring resiliency and performance with efficient resource usage.

In this event-driven solution, AvalonBay’s leasing service is hosted in multiple AWS Regions to provide low latency response to users across various geolocations. This blog post focuses on showing use case implementation in only one region—Region East— as shown in Figure 1.

AvalonBay lease processing platform

Figure 1. AvalonBay lease processing platform

Several AWS services come together in this solution to meet key company objectives. Let’s explore each one and its purpose within the architecture.

    1. Amazon Route 53: For AvalonBay’s Lease Processing solution, any non-transient service failure is unacceptable. In addition to providing a high degree of resiliency through a Multi-AZ architecture, Lease Processing also provides regional-level high availability through its multi-Region active-active architecture. Route 53 with latency-based routing allows dynamic rerouting of requests within seconds to alternate Regions.
    2. Amazon API Gateway: Route 53 latency-based routing is configured across multiple AWS Regions as Route 53 to route traffic to an API Gateway endpoint. API Gateway authorizers were added to control access to APIs using an Amazon Cognito user pool.
    3. AWS Lambda with provisioned concurrency: The Lambda services are set up for automatic scaling, secured through a private subnet, and span across Availability Zones. This provides horizontal scaling capability, self-healing capacity, and resiliency across Availability Zones. Provisioned concurrency minimizes the estimate of cold starts by generating execution environments. It also greatly reduces time spent on APIs invocations.
    4. Amazon Aurora V2 for Amazon Relational Database Service (Amazon RDS) PostgreSQL-Compatible Edition: Aurora Serverless V2 is an on-demand, autoscaling configuration for Aurora. Serverless Aurora V2 PostgreSQL-Compatible is used for the Lease Processing solution. The global database was configured with two Regions; us-east-1 as the primary cluster and us-west-2 as the secondary cluster. Automated Aurora global database endpoint management for planned and unplanned failover is configured through a Route 53 private hosted zone, Amazon EventBridge, and Lambda.
    5. Amazon RDS Proxy for Aurora: Amazon RDS Proxy allows the leasing application to pool and share database connections to improve its ability to scale. It also makes the leasing solution more resilient to database failures by automatically connecting to a standby database instance while preserving application connections.
    6. Amazon EventBridge: EventBridge supports the solution through two primary purposes:
      1. Oversees lease flow events – During the lease application process, the solution generates various events which are consumed by AvalonBay and external applications such as property management, finance portals, administration, and more. Leasing events are sent to EventBridge and various event rules are configured for multiple destinations including Lambda, Amazon Simple Notification Service (Amazon SNS), and external API endpoints.
      2. Handles global Aurora V2 failover – Aurora generates events when certain actions are taken or events occur, including any type of global database activity.
        • When a managed planned failover is initiated—either via the AWS Command Line Interface (AWS CLI), API, or console—the global database failover process starts and generates an event.
        • When an Aurora cluster is removed from a global cluster through the AWS CLI, API, or console, the Aurora cluster is promoted as a single primary cluster. Once this process is completed, it generates an event.

An EventBridge rule is created to match an event pattern any time a global database managed planned failover completes successfully in a Region. When a failover is completed, the completion event is detected, and this rule is triggered. The event rule is configured to invoke a Lambda function that is triggered on global database failover and updates the Amazon CloudFront CNAME record to the correct value.

Scalable search solution

Leasing professionals need to easily scan a huge amount of property information using AvalonBay’s Search Solution to obtain required information.

Using the Amazon OpenSearch Service, agents can generate property profiles and other asset data to identify matching units and quickly respond to end customers. OpenSearch is a fully open-source search and analytics engine that securely unlocks real-time search, monitoring, and analysis of business and operational data. It is employed for use cases such as application monitoring, log analytics, observability, and website search.

The AvalonBay Search Service solution architecture featuring OpenSearch is shown in Figure 2.

AvalonBay Search Service solution architecture

Figure 2: AvalonBay Search Service solution architecture

AvalonBay search requires search criteria including keyword and Universal Resource Identifier (URI) search, SQL-based search, and custom package search, all of which are detailed in the Amazon OpenSearch Service Developer Guide.

OpenSearch automatically detects and replaces failed OpenSearch Service nodes, reducing the overhead associated with self-managed infrastructures.

Let’s explore this architecture further by step.

  1. Amazon Kinesis event stream – The AvalonBay community requires near real-time updates to search attributes such as amenities, features, promotion, and pricing. Events created through various producers are streamed through Kinesis and inserted or updated through OpenSearch.
  2. Amazon OpenSearch – OpenSearch is used for end-to-end community search—a managed service making it easy to deploy, operate, and scale OpenSearch clusters in the AWS Cloud. As community search data is read-only, UltraWarm and cold storage are also used based on usage frequency.
  3. Amazon Simple Storage Service (S3): Various community documents, policies, and image or video files are key search elements. They must be maintained securely and reliably for years due to contractual obligations. Amazon S3 simplifies this task with high durabilitylifecycle rules, and varied controls for retention.

Conclusion

This post showed how AvalonBay has built and deployed custom leasing and search solutions on AWS serverless platforms without compromising resiliency, performance, and capacity requirements. This is a 24/7, fully managed solution with no additional equipment on-premises.

Choosing AWS for leasing and search solutions gives AvalonBay the ability to dynamically scale and meet future growth demands while introducing cost advantages. In addition, the global availability of AWS services makes it possible to deploy services across geographic locations to meet performance requirements.

Migrate your indexes to Amazon OpenSearch Serverless with Logstash

Post Syndicated from Prashant Agrawal original https://aws.amazon.com/blogs/big-data/migrate-your-indexes-to-amazon-opensearch-serverless-with-logstash/

We recently announced the general availability of Amazon OpenSearch Serverless , a new option for Amazon OpenSearch Service that makes it easy run large-scale search and analytics workloads without having to configure, manage, or scale OpenSearch clusters. With OpenSearch Serverless, you get the same interactive millisecond response times as OpenSearch Service with the simplicity of a serverless environment.

In this post, you’ll learn how to migrate your existing indices from an OpenSearch Service managed cluster domain to a serverless collection using Logstash.

With OpenSearch domains, you get dedicated, secure clusters configured and optimized for your workloads in minutes. You have full control over the configuration of compute, memory, and storage resources in clusters to optimize cost and performance for your applications. OpenSearch Serverless provides an even simpler way to run search and analytics workloads—without ever having to think about clusters. You simply create a collection and a group of indexes, and can start ingesting and querying the data.

Solution overview

Logstash is open-source software that provides ETL (extract, transform, and load) for your data. You can configure Logstash to connect to a source and a destination via input and output plugins. In between, you configure filters that can transform your data. This post walks you through the steps you need to set up Logstash to connect an OpenSearch Service domain (input) to an OpenSearch Serverless collection (output).

You set the source and destination plugins in Logstash’s config file. The config file has sections for Input, Filter, and Output. Once configured, Logstash will send a request to the OpenSearch Service domain and read the data according to the query you put in the input section. After data is read from OpenSearch Service, you can optionally send it to the next stage Filter for transformations such as adding or removing a field from the input data or updating a field with different values. In this example, you won’t use the Filter plugin. Next is the Output plugin. The open-source version of Logstash (Logstash OSS) provides a convenient way to use the bulk API to upload data to your collections. OpenSearch Serverless supports the logstash-output-opensearch output plugin, which supports AWS Identity and Access Management (IAM) credentials for data access control.

The following diagram illustrates our solution workflow.

Prerequisites

Before getting started, make sure you have completed the following prerequisites:

  1. Note down your OpenSearch Service domain’s ARN, user name, and password.
  2. Create an OpenSearch Serverless collection. If you’re new to OpenSearch Serverless, refer to Log analytics the easy way with Amazon OpenSearch Serverless for details on how to set up your collection.

Set up Logstash and the input and output plugins for OpenSearch

Complete the following steps to set up Logstash and your plugins:

  1. Download logstash-oss-with-opensearch-output-plugin. (This example uses the distro for macos-x64. For other distros, refer to the artifacts.)
    wget https://artifacts.opensearch.org/logstash/logstash-oss-with-opensearch-output-plugin-8.4.0-macos-x64.tar.gz

  2. Extract the downloaded tarball:
    tar -zxvf logstash-oss-with-opensearch-output-plugin-8.4.0-macos-x64.tar.gz
    cd logstash-8.4.0/

  3. Update the logstash-output-opensearch plugin to the latest version:
    <path/to/your/logstash/root/directory>/bin/logstash-plugin update logstash-output-opensearch

  4. Install the logstash-input-opensearch plugin:
    <path/to/your/logstash/root/directory>/bin/logstash-plugin install logstash-input-opensearch

Test the plugin

Let’s get into action and see how the plugin works. The following config file retrieves data from the movies index in your OpenSearch Service domain and indexes that data in your OpenSearch Serverless collection with same index name, movies.

Create a new file and add the following content, then save the file as opensearch-serverless-migration.conf. Provide the values for the OpenSearch Service domain endpoint under HOST, USERNAME, and PASSWORD in the input section, and the OpenSearch Serverless collection endpoint details under HOST along with REGION, AWS_ACCESS_KEY_ID, and AWS_SECRET_ACCESS_KEY in the output section.

input {
    opensearch {
        hosts =>  ["https://<HOST>:443"]
        user  =>  "<USERNAME>"
        password  =>  "<PASSWORD>"
        index =>  "movies"
        query =>  '{ "query": { "match_all": {}} }'
    }
}
output {
    opensearch {
        ecs_compatibility => disabled
        index => "movies"
        hosts => "<HOST>:443"
        auth_type => {
            type => 'aws_iam'
            aws_access_key_id => '<AWS_ACCESS_KEY_ID>'
            aws_secret_access_key => '<AWS_SECRET_ACCESS_KEY>'
            region => '<REGION>'
            service_name => 'aoss'
            }
        legacy_template => false
        default_server_major_version => 2
    }
}

You can specify a query in the input section of the preceding config. The match_all query matches all data in the movies index. You can change the query if you want to select a subset of the data. You can also use the query to parallelize the data transfer by running multiple Logstash processes with configs that specify different data slices. You can also parallelize by running Logstash processes against multiple indexes if you have them.

Start Logstash

Use the following command to start Logstash:

<path/to/your/logstash/root/directory>/bin/logstash -f <path/to/your/config/file>

After you run the command, Logstash will retrieve the data from the source index from your OpenSearch Service domain, and write to the destination index in your OpenSearch Serverless collection. When the data transfer is complete, Logstash shuts down. See the following code:

[2023-01-24T20:14:28,965][INFO][logstash.agent] Successfully
started Logstash API endpoint {:port=>9600, :ssl_enabled=>false}
…
…
[2023-01-24T20:14:38,852][INFO][logstash.javapipeline][main] Pipeline terminated {"pipeline.id"=>"main"}
[2023-01-24T20:14:39,374][INFO][logstash.pipelinesregistry] Removed pipeline from registry successfully {:pipeline_id=>:main}
[2023-01-24T20:14:39,399][INFO][logstash.runner] Logstash shut down.

Verify the data in OpenSearch Serverless

You can verify that Logstash copied all your data by comparing the document count in your domain and your collection. Run the following query either from the Dev tools tab, or with curl, postman, or a similar HTTP client. The following query helps you search all documents from the movies index and returns the top documents along with the count. By default, OpenSearch will return the document count up to a maximum of 10,000. Adding the track_total_hits flag helps you get the exact count of documents if the document count exceeds 10,000.

GET movies/_search
{
  "query": {
    "match_all": {}
  },
  "track_total_hits" : true
}

Conclusion

In this post, you migrated data from your OpenSearch Service domain to your OpenSearch Serverless collection using Logstash’s OpenSearch input and output plugins.

Stay tuned for a series of posts focusing on the various options available for you to build effective log analytics and search solutions using OpenSearch Serverless. You can also refer the Getting started with Amazon OpenSearch Serverless workshop to know more about OpenSearch Serverless.

If you have feedback about this post, submit it in the comments section. If you have questions about this post, start a new thread on the Amazon OpenSearch Service forum or contact AWS Support.


About the authors

Prashant Agrawal is a Sr. Search Specialist Solutions Architect with Amazon OpenSearch Service. He works closely with customers to help them migrate their workloads to the cloud and helps existing customers fine-tune their clusters to achieve better performance and save on cost. Before joining AWS, he helped various customers use OpenSearch and Elasticsearch for their search and log analytics use cases. When not working, you can find him traveling and exploring new places. In short, he likes doing Eat → Travel → Repeat.

Jon Handler (@_searchgeek) is a Sr. Principal Solutions Architect at Amazon Web Services based in Palo Alto, CA. Jon works closely with the CloudSearch and Elasticsearch teams, providing help and guidance to a broad range of customers who have search workloads that they want to move to the AWS Cloud. Prior to joining AWS, Jon’s career as a software developer included four years of coding a large-scale, eCommerce search engine.

Serverless logging with Amazon OpenSearch Service and Amazon Kinesis Data Firehose

Post Syndicated from Jon Handler original https://aws.amazon.com/blogs/big-data/serverless-logging-with-amazon-opensearch-service-and-amazon-kinesis-data-firehose/

In this post, you will learn how you can use Amazon Kinesis Data Firehose to build a log ingestion pipeline to send VPC flow logs to Amazon OpenSearch Serverless. First, you create the OpenSearch Serverless collection you use to store VPC flow logs, then you create a Kinesis Data Firehose delivery pipeline that forwards the flow logs to OpenSearch Serverless. Finally, you enable delivery of VPC flow logs to your Firehose delivery stream. The following diagram illustrates the solution workflow.

OpenSearch Serverless is a new serverless option offered by Amazon OpenSearch Service. OpenSearch Serverless makes it simple to run petabyte-scale search and analytics workloads without having to configure, manage, or scale OpenSearch clusters. OpenSearch Serverless automatically provisions and scales the underlying resources to deliver fast data ingestion and query responses for even the most demanding and unpredictable workloads.

Kinesis Data Firehose is a popular service that delivers streaming data from over 20 AWS services to over 15 analytical and observability tools such as OpenSearch Serverless. Kinesis Data Firehose is great for those looking for a fast and easy way to send your VPC flow logs data to your OpenSearch Serverless collection in minutes without a single line of code and without building or managing your own data ingestion and delivery infrastructure.

VPC flow logs capture the traffic information going to and from your network interfaces in your VPC. With the launch of Kinesis Data Firehose support to OpenSearch Serverless, it makes an easy solution to analyze your VPC flow logs with just a few clicks. Kinesis Data Firehose provides a true end-to-end serverless mechanism to deliver your flow logs to OpenSearch Serverless, where you can use OpenSearch Dashboards to search through those logs, create dashboards, detect anomalies, and send alerts. VPC flow logs helps you to answer questions like:

  • What percentage of your traffic is getting dropped?
  • How much traffic is getting generated for specific sources and destinations?

Create your OpenSearch Serverless collection

To get started, you first create a collection. An OpenSearch Serverless collection is a logical grouping of one or more indexes that represent an analytics workload. Complete the following steps:

  1. On the OpenSearch Service console, choose Collections under Serverless in the navigation pane.
  2. Choose Create a collection.
  3. For Collection name, enter a name (for example, vpc-flow-logs).
  4. For Collection type¸ choose Time series.
  5. For Encryption, choose your preferred encryption setting:
    1. Choose Use AWS owned key to use an AWS managed key.
    2. Choose a different AWS KMS key to use your own AWS Key Management Service (AWS KMS) key.
  6. For Network access settings, choose your preferred setting:
    1. Choose VPC to use a VPC endpoint.
    2. Choose Public to use a public endpoint.

AWS recommends that you use a VPC endpoint for all production workloads. For this walkthrough, select Public.

  1. Choose Create.

It should take couple of minutes to create the collection.

The following graphic gives a quick demonstration of creating the OpenSearch Serverless collection via the preceding steps.

At this point, you have successfully created a collection for OpenSearch Serverless. Next, you create a delivery pipeline for Kinesis Data Firehose.

Create a Kinesis Data Firehose delivery stream

To set up a delivery stream for Kinesis Data Firehose, complete the following steps:

  1. On the Kinesis Data Firehose console, choose Create delivery stream.
  2. For Source, specify Direct PUT.

Check out Source, Destination, and Name to learn more about different sources supported by Kinesis Data Firehose.

  1. For Destination, choose Amazon OpenSearch Serverless.
  2. For Delivery stream name, enter a name (for example, vpc-flow-logs).
  3. Under Destination settings, in the OpenSearch Serverless collection settings, choose Browse.
  4. Select vpc-flow-logs.
  5. Choose Choose.

If your collection is still creating, wait a few minutes and try again.

  1. For Index, specify vpc-flow-logs.
  2. In the Backup settings section, select Failed data only for the Source record backup in Amazon S3.

Kinesis Data Firehose uses Amazon Simple Storage Service (Amazon S3) to back up failed data that it attempts to deliver to your chosen destination. If you want to keep all data, select All data.

  1. For S3 Backup Bucket, choose Browse to select an existing S3 bucket, or choose Create to create a new bucket.
  2. Choose Create delivery stream.

The following graphic gives a quick demonstration of creating the Kinesis Data Firehose delivery stream via the preceding steps.

At this point, you have successfully created a delivery stream for Kinesis Data Firehose, which you will use to stream data from your VPC flow logs and send it to your OpenSearch Serverless collection.

Set up the data access policy for your OpenSearch Serverless collection

Before you send any logs to OpenSearch Serverless, you need to create a data access policy within OpenSearch Serverless that allows Kinesis Data Firehose to write to the vpc-flow-logs index in your collection. Complete the following steps:

  1. On the Kinesis Data Firehose console, choose the Configuration tab on the details page for the vpc-flow-logs delivery stream you just created.
  2. In the Permissions section, note down the AWS Identity and Access Management (IAM) role.
  3. Navigate to the vpc-flow-logs collection details page on the OpenSearch Serverless dashboard.
  4. Under Data access, choose Manage data access.
  5. Choose Create access policy.
  6. In the Name and description section, specify an access policy name, add a description, and select JSON as the policy definition method.
  7. Add the following policy in the JSON editor. Provide the collection name and index you specified during the delivery stream creation in the policy. Provide the IAM role name that you got from the permissions page of the Firehose delivery stream, and the account ID for your AWS account.
    [
      {
        "Rules": [
          {
            "ResourceType": "index",
            "Resource": [
              "index/<collection-name>/<index-name>"
            ],
            "Permission": [
              "aoss:WriteDocument",
              "aoss:CreateIndex",
              "aoss:UpdateIndex"
            ]
          }
        ],
        "Principal": [
          "arn:aws:sts::<aws-account-id>:assumed-role/<IAM-role-name>/*"
        ]
      }
    ]

  8. Choose Create.

The following graphic gives a quick demonstration of creating the data access policy via the preceding steps.

Set up VPC flow logs

In the final step of this post, you enable flow logs for your VPC with the destination as Kinesis Data Firehose, which sends the data to OpenSearch Serverless.

  1. Navigate to the AWS Management Console.
  2. Search for “VPC” and then choose Your VPCs in the search result (hover over the VPC rectangle to reveal the link).
  3. Choose the VPC ID link for one of your VPCs.
  4. On the Flow Logs tab, choose Create flow log.
  5. For Name, enter a name.
  6. Leave the Filter set to All. You can limit the traffic by selecting Accept or Reject.
  7. Under Destination, select Send to Kinesis Firehose in the same account.
  8. For Kinesis Firehose delivery stream name, choose vpc-flow-logs.
  9. Choose Create flow log.

The following graphic gives a quick demonstration of creating a flow log for your VPC following the preceding steps.

Examine the VPC flow logs data in your collection using OpenSearch Dashboards

You won’t be able to access your collection data until you configure data access. Data access policies allow users to access the actual data within a collection.

To create a data access policy for OpenSearch Dashboards, complete the following steps:

  1. Navigate to the vpc-flow-logs collection details page on the OpenSearch Serverless dashboard.
  2. Under Data access, choose Manage data access.
  3. Choose Create access policy.
  4. In the Name and description section, specify an access policy name, add a description, and select JSON as the policy definition method.
  5. Add the following policy in the JSON editor. Provide the collection name and index you specified during the delivery stream creation in the policy. Additionally, provide the IAM user and the account ID for your AWS account. You need to make sure that you have the AWS access and secret keys for the principal that you specified as an IAM user.
    [
      {
        "Rules": [
          {
            "Resource": [
              "index/<collection-name>/<index-name>"
            ],
            "Permission": [
              "aoss:ReadDocument"
            ],
            "ResourceType": "index"
          }
        ],
        "Principal": [
          "arn:aws:iam::<aws-account-id>:user/<IAM-user-name>"
        ]
      }
    ]

  6. Choose Create.
  7. Navigate to OpenSearch Serverless and choose the collection you created (vpc-flow-logs).
  8. Choose the OpenSearch Dashboards URL and log in with your IAM access key and secret key for the user you specified under Principal.
  9. Navigate to dev tools within OpenSearch Dashboards and run the following query to retrieve the VPC flow logs for your VPC:
    GET <index-name>/_search
    {
      "query": {
        "match_all": {}
      }
    }

The query returns the data as shown in the following screenshot, which contains information such as account ID, interface ID, source IP address, destination IP address, and more.

Create dashboards

After the data is flowing into OpenSearch Serverless, you can easily create dashboards to monitor the activity in your VPC. The following example dashboard shows overall traffic, accepted and rejected traffic, bytes transmitted, and some charts with the top sources and destinations.

Clean up

If you don’t want to continue using the solution, be sure to delete the resources you created:

  1. Return to the AWS console and in the VPCs section, disable the flow logs for your VPC.
  2. In the OpenSearch Serverless dashboard, delete your vpc-flow-logs collection.
  3. On the Kinesis Data Firehose console, delete your vpc-flow-logs delivery stream.

Conclusion

In this post, you created an end-to-end serverless pipeline to deliver your VPC flow logs to OpenSearch Serverless using Kinesis Data Firehose. In this example, you built a delivery pipeline for your VPC flow logs, but you can also use Kinesis Data Firehose to send logs from Amazon Kinesis Data Streams and Amazon CloudWatch, which in turn can be sent to OpenSearch Serverless collections for running analytics on those logs. With serverless solutions on AWS, you can focus on your application development rather than worrying about the ingestion pipeline and tools to visualize your logs.

Get hands-on with OpenSearch Serverless by taking the Getting Started with Amazon OpenSearch Serverless workshop and check out other pipelines for analyzing your logs.

If you have feedback about this post, share it in the comments section. If you have questions about this post, start a new thread on the Amazon OpenSearch Service forum or contact AWS Support.


About the authors

Jon Handler (@_searchgeek) is a Principal Solutions Architect at Amazon Web Services based in Palo Alto, CA. Jon works closely with the CloudSearch and Elasticsearch teams, providing help and guidance to a broad range of customers who have search workloads that they want to move to the AWS Cloud. Prior to joining AWS, Jon’s career as a software developer included four years of coding a large-scale, eCommerce search engine.

Prashant Agrawal is a Sr. Search Specialist Solutions Architect with Amazon OpenSearch Service. He works closely with customers to help them migrate their workloads to the cloud and helps existing customers fine-tune their clusters to achieve better performance and save on cost. Before joining AWS, he helped various customers use OpenSearch and Elasticsearch for their search and log analytics use cases. When not working, you can find him traveling and exploring new places. In short, he likes doing Eat → Travel → Repeat.
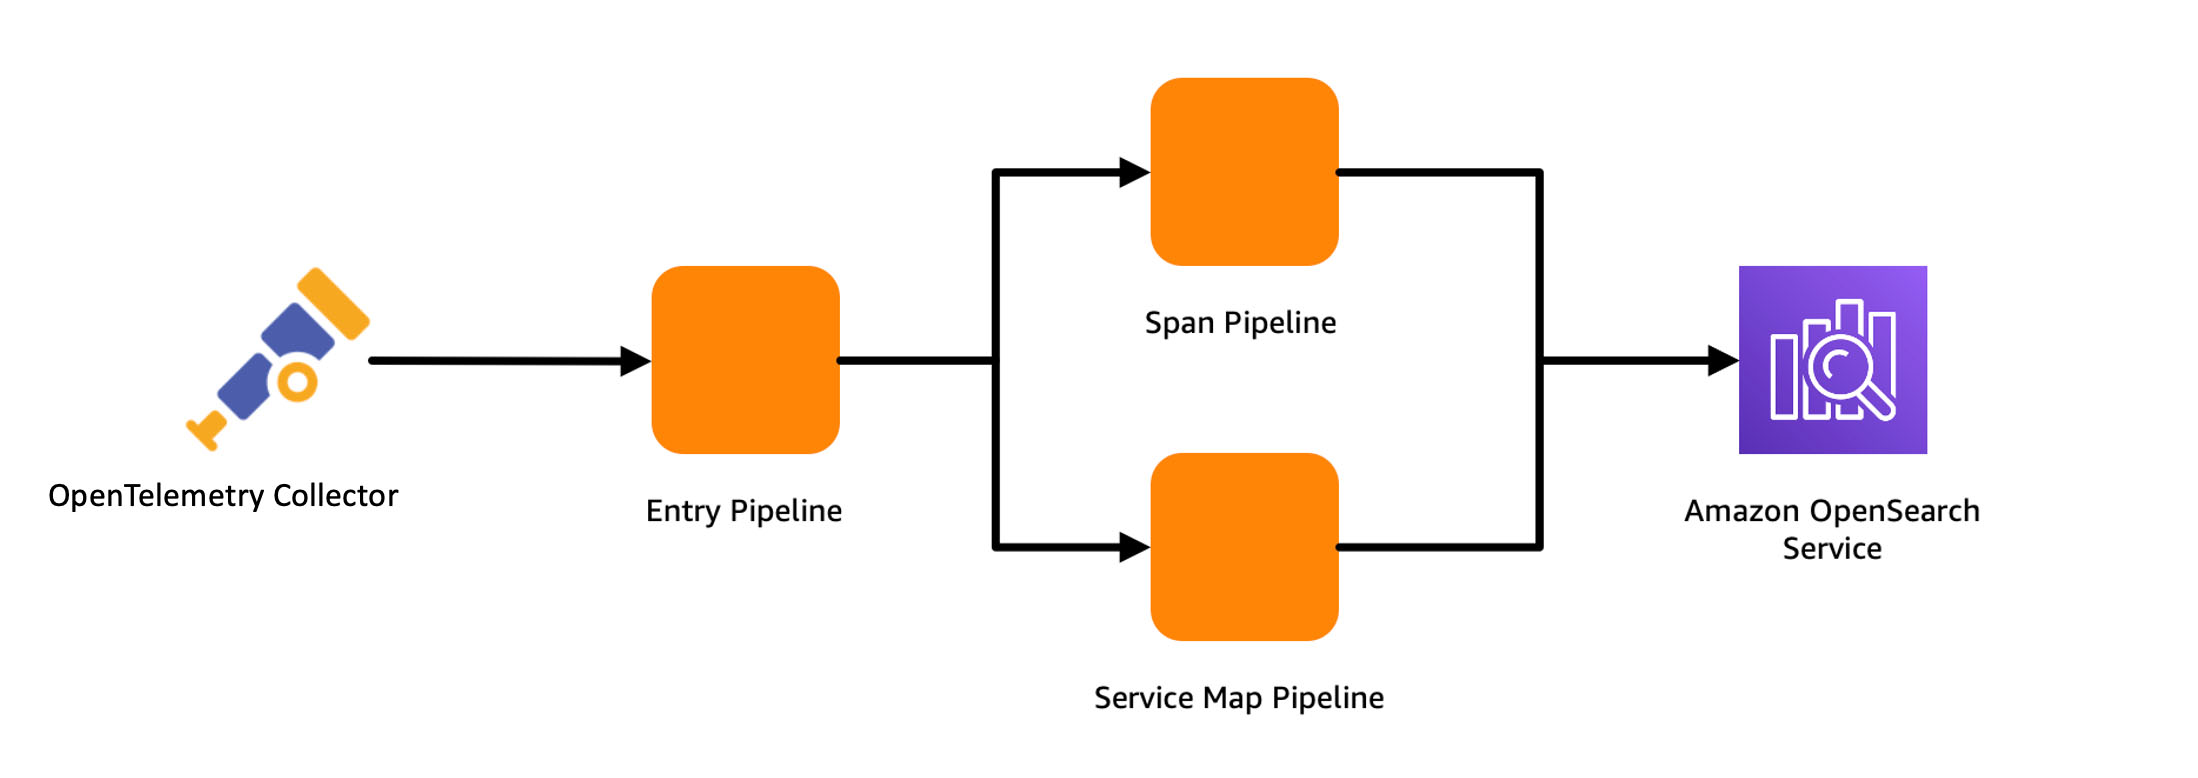
Amazon OpenSearch Serverless is now generally available!

Post Syndicated from Pavani Baddepudi original https://aws.amazon.com/blogs/big-data/amazon-opensearch-serverless-is-now-generally-available/

We ended 2022 on a high note with the preview release of Amazon OpenSearch Serverless at re:Invent. Today, we are happy to announce the general availability of Amazon OpenSearch Serverless, the serverless option for Amazon OpenSearch Service that makes it easier to run search and analytics workloads without even having to think about infrastructure management. In this post, we share our approach and high-level architecture of OpenSearch Serverless.

Background

Self-managed OpenSearch and managed OpenSearch Service are widely used to search and analyze petabytes of data. Both options give you full control over the configuration of compute, memory, and storage resources in clusters, which allows you to optimize cost and performance for their applications.

However, you might often run applications that could be highly variable, where the usage is not always known. Such applications may experience sudden bursts in ingestion data or irregular and unpredictable query requests. To maintain consistent performance, you must constantly tune and resize clusters or over-provision for peak demand, which results in excess costs. Many customers wanted an even simpler experience to run search and analytics workloads that allows you to focus on your business applications without having to worry about the backend infrastructure and data management.

What does simpler mean? It means you don’t want to worry about these tasks:

  • Choose and provision instances
  • Manage the shard or the index size
  • Index and data management for sizing and operational purposes
  • Monitor or tune the settings continuously to meet workload demands
  • Plan for system failures and resource threshold breaches
  • Security updates and service software updates

We translated this checklist into requirements and goals under the following product themes:

  • Simple and secure
  • Auto scaling, fault tolerance, and durability
  • Cost efficiency
  • Ecosystem integrations

Before we delve into how OpenSearch Serverless addresses these needs, let’s review the target use cases for OpenSearch Serverless, as their distinctive characteristics heavily influenced our design approach and architecture.

Target use cases

The target use cases for OpenSearch Serverless are the same as OpenSearch:

  • Time series analytics (also popularly known as log analytics) focuses on analyzing large volumes of semi-structured machine-generated data in real time for operational, security, and user behavior insights
  • Search powers customer applications in their internal networks (application search, content management systems, legal documents) and internet-facing applications such as ecommerce website search and content search

Let’s understand the differences between the typical time series and search workloads (exceptions may vary):

  • Time series workloads are write-heavy, whereas search workloads are read-heavy
  • Search workloads have a smaller data corpus compared to time series
  • Search workloads are more sensitive to latencies and require faster response times than time series workloads
  • Queries for time series are run on recent data, whereas search queries scan the entire corpus

These characteristics heavily influenced our approach to handling and managing shards, indexes, and data for the workloads. In the next section, we review the broad themes of how OpenSearch Serverless meets customer challenges while efficiently catering to these distinctive workload traits.

Simple and secure

To get started with OpenSearch Serverless, you create a collection. Collections are a logical grouping of indexed data that works together to support a workload, while the physical resources are automatically managed in the backend. You don’t have to declare how much compute or storage is needed, or monitor the system to make sure it’s running well. To adeptly handle the two predominant workloads, OpenSearch Serverless applies different sharding and indexing strategies. Therefore, in the workflow to create a collection, you must define the collection type—time series or search. You don’t have to worry about re-indexing or rollover of indexes to support your growing data sizes, because it’s handled automatically by the system.

Next, you make the configuration choices about the encryption key to use, network access to your collections (public endpoint or VPC), and who should access your collection. OpenSearch Serverless has an easy-to-use and highly effective security model that supports hierarchical policies for your collections and indexes. You can create granular collection-level and account-level security policies for all your collections and indexes. The centralized account-level policy provides you with comprehensive visibility and control, and makes it operationally simple to secure collections at scale. For encryption policies, you can specify an AWS Key Management Service (AWS KMS) key for a single collection, all collections, or a subset of collections using a wildcard matching pattern. If rules from multiple policies match a collection, the rule closest to the fully qualified name takes precedence. You can also specify wildcard matching patterns in network and data access policies. Multiple network and data access policies can apply to a single collection, and the permissions are additive. You can update the network and data access policies for your collection at any time.

OpenSearch Dashboards can now be accessed using your SAML and AWS Identity and Access Management (IAM) credentials. OpenSearch Serverless also supports fine-grained IAM permissions so that you can define who can create, update, and delete encryption, network, and data access policies, thereby enabling organizational alignment. All the data in OpenSearch Serverless is encrypted in transit and at rest by default.

Auto scaling, fault-tolerance, and durability

OpenSearch Serverless decouples storage and compute, which allows for every layer to scale independently based on workload demands. This decoupling also allows for the isolation of indexing and query compute nodes so the fleets can run concurrently without any resource contention. The compute resources like CPU, disk utilization, memory, and hot shard state are monitored and managed by the service. When these system thresholds are breached, the service adjusts capacity so you don’t have to worry about scaling resources. For example, when an application monitoring workload receives a sudden burst of logging activities during an availability event, OpenSearch Serverless will scale out the indexing compute nodes. When these logging activities decrease and the resource consumption in the compute nodes falls below a certain threshold, OpenSearch Serverless scales the nodes back in. Similarly, when a website search engine receives a sudden spike of queries after a news event, OpenSearch Serverless automatically scales the query compute nodes to process the queries without impacting the data ingestion performance.

The following diagram illustrates this high-level architecture.

OpenSearch Serverless is designed for production workloads with redundancy for Availability Zone outages and infrastructure failures. By default, OpenSearch Serverless will replicate indexes across Availability Zones. The indexing compute nodes run in an active-standby mode. The service control plane is also built with redundancy and automatic failure recovery. All the indexed data is stored in Amazon Simple Storage Service (Amazon S3) to provide the same data durability as Amazon S3 (11 nines). The query compute instances download the indexed data directly from Amazon S3, run search operations, and perform aggregations. Redundant query compute is deployed across Availability Zones in an active-active mode to maintain availability during failures. The refresh interval (the time from when a document is ingested by OpenSearch Serverless to when it is available to search) is currently under 15 seconds.

Cost and cost efficiency

With OpenSearch Serverless, you don’t have to size or provision resources upfront, nor do you have to over-provision for peak load in production environments. You only pay for the compute and storage resources consumed by your workloads. The compute capacity used for data ingestion, and search and query is measured in OpenSearch Compute Units (OCUs). The number of OCUs corresponds directly to the CPU, memory, Amazon Elastic Block Store (Amazon EBS) storage, and the I/O resources required to ingest data or run queries. One OCU comprises 6 GB of RAM, corresponding vCPU, 120 GB of GP3 storage (used to provide fast access to the most frequently accessed data), and data transfers to Amazon S3. After data is ingested, the indexed data is stored in Amazon S3. You have the ability to control retention and delete data using the APIs.

When you create the first collection endpoint in an account, OpenSearch Serverless provisions 4 OCUs (2 ingest that include primary and standby, and 2 search that include two copies for high availability). These OCUs are instantiated even though there is no activity on the serverless endpoint to avoid any cold start latencies. All subsequent collections in that account using the same KMS key share those OCUs. During auto scaling, OpenSearch Serverless will add more OCUs to support the compute needed by your collections. These OCUs copy the indexed data from Amazon S3 before they can start responding to the indexing or query requests. Similarly, the OpenSearch Serverless control plane continuously monitors the OCUs’ resource consumption. When the indexing or search request rate decreases and the OCU consumption falls below a certain threshold, OpenSearch Serverless will reduce the OCU count to the minimum capacity required for your workload. The minimum OCUs prevent cold start delays.

OpenSearch Serverless also provides a built-in caching tier for time series workloads to provide better price-performance. OpenSearch Serverless caches the most recent log data, typically the first 24 hours, on ephemeral disk. For data older than 24 hours, OpenSearch Serverless only caches metadata and fetches the necessary data blocks from Amazon S3 based on query access. This model also helps pack more data while controlling the costs. For search collections, the query compute node caches the entire data corpus locally on ephemeral disks to provide fast, millisecond query responses.

Ecosystem integrations

Most tools that work with OpenSearch also work with OpenSearch Serverless. You don’t have to rewrite existing pipelines and applications. OpenSearch Serverless has the same logical data model and query engine of OpenSearch, so you can use the same ingest and query APIs you are familiar with, and use serverless OpenSearch Dashboards for interactive data analysis and visualization. Because of its compatible interface, OpenSearch Serverless also supports the existing rich OpenSearch ecosystem of high-level clients and streaming ingestion pipelines—Amazon Kinesis Data Firehose, FluentD, FluentBit, Logstash, Apache Kafka, and Amazon Managed Streaming for Apache Kafka (Amazon MSK). For more information, see Ingesting data into Amazon OpenSearch Serverless collections. You can also automate the process of collection creation using AWS CloudFormation and the AWS CDK. With Amazon CloudWatch integration, you can monitor key OpenSearch Serverless metrics and set alarms to notify you of any threshold breaches.

Choosing between managed clusters and OpenSearch Serverless

Both managed clusters and OpenSearch Serverless are deployment options under OpenSearch Service, and powered by the open-source OpenSearch project. OpenSearch Serverless makes it easier to run cyclical, intermittent, or unpredictable workloads without having to think about sizing, monitoring, and tuning OpenSearch clusters. You may, however, prefer to use managed clusters in scenarios where you need tight control over cluster configuration or specific customizations. With managed clusters, you can choose your preferred instances and versions, and have more control on configuration such as lower refresh intervals or data sharding strategies, which may be critical for use cases that fall outside of the typical patterns supported by OpenSearch Serverless. Also, OpenSearch Serverless currently doesn’t support all advanced OpenSearch features and plugins such as alerting, anomaly detection, and k-NN. You can use the managed clusters for these features until OpenSearch Serverless adds support for them.

Updates since the preview

With the general availability release, OpenSearch Serverless will now scale out and scale in to the minimum resources required to support your workloads. The maximum OCU limit per account has been increased from 20 to 50 for both indexing and query. Additionally, you can now use the high-level OpenSearch clients to ingest and query your data, and also migrate data from your OpenSearch clusters using Logstash. Also, we added support for three more Regions. OpenSearch Serverless is now available in eight Regions globally: US East (Ohio), US East (N. Virginia), US West (Oregon), Asia Pacific (Singapore), Asia Pacific (Sydney), Asia Pacific (Tokyo), Europe (Frankfurt), and Europe (Ireland).

Summary

The serverless journey has just begun. Most of the initial efforts were spent defining and building the right service architecture that can efficiently support the growing performance and scale demands. OpenSearch Serverless separates storage and compute components, and indexing and query compute, so they can be managed and scaled independently. OpenSearch Serverless uses Amazon S3 as the primary data storage for indexes, so you don’t need to worry about durability. We have decoupled your configuration choices from the proper provisioning of resources, so configuration mistakes won’t cause outages. OpenSearch Serverless will also apply security and software updates in the future with no disruption to your workloads. This flexible, microservices-based architecture will enable us to keep pushing out new features regularly, raising the bar on scale and performance, and driving down the costs further, for example, spinning down the compute nodes completely when there is no activity.

We encourage you to try out OpenSearch Serverless and provide your feedback in the comments section with your use cases and questions. We have a number of resources to get you started:


About the author

Pavani Baddepudi is a senior product manager working in search services at AWS. Her interests include distributed systems, networking, and security.

Text analytics on AWS: implementing a data lake architecture with OpenSearch

Post Syndicated from Francisco Losada original https://aws.amazon.com/blogs/architecture/text-analytics-on-aws-implementing-a-data-lake-architecture-with-opensearch/

Text data is a common type of unstructured data found in analytics. It is often stored without a predefined format and can be hard to obtain and process.

For example, web pages contain text data that data analysts collect through web scraping and pre-process using lowercasing, stemming, and lemmatization. After pre-processing, the cleaned text is analyzed by data scientists and analysts to extract relevant insights.

This blog post covers how to effectively handle text data using a data lake architecture on Amazon Web Services (AWS). We explain how data teams can independently extract insights from text documents using OpenSearch as the central search and analytics service. We also discuss how to index and update text data in OpenSearch and evolve the architecture towards automation.

Architecture overview

This architecture outlines the use of AWS services to create an end-to-end text analytics solution, starting from the data collection and ingestion up to the data consumption in OpenSearch (Figure 1).

Data lake architecture with OpenSearch

Figure 1. Data lake architecture with OpenSearch

  1. Collect data from various sources, such as SaaS applications, edge devices, logs, streaming media, and social networks.
  2. Use tools like AWS Database Migration Service (AWS DMS), AWS DataSync, Amazon Kinesis, Amazon Managed Streaming for Apache Kafka (Amazon MSK), AWS IoT Core, and Amazon AppFlow to ingest the data into the AWS data lake, depending on the data source type.
  3. Store the ingested data in the raw zone of the Amazon Simple Storage Service (Amazon S3) data lake—a temporary area where data is kept in its original form.
  4. Validate, clean, normalize, transform, and enrich the data through a series of pre-processing steps using AWS Glue or Amazon EMR.
  5. Place the data that is ready to be indexed in the indexing zone.
  6. Use AWS Lambda to index the documents into OpenSearch and store them back in the data lake with a unique identifier.
  7. Use the clean zone as the source of truth for teams to consume the data and calculate additional metrics.
  8. Develop, train, and generate new metrics using machine learning (ML) models with Amazon SageMaker or artificial intelligence (AI) services like Amazon Comprehend.
  9. Store the new metrics in the enriching zone along with the identifier of the OpenSearch document.
  10. Use the identifier column from the initial indexing phase to identify the correct documents and update them in OpenSearch with the newly calculated metrics using AWS Lambda.
  11. Use OpenSearch to search through the documents and visualize them with metrics using OpenSearch Dashboards.

Considerations

Data lake orchestration among teams

This architecture allows data teams to work independently on text documents at different stages of their lifecycles. The data engineering team manages the raw and indexing zones, who also handle data ingestion and preprocessing for indexing in OpenSearch.

The cleaned data is stored in the clean zone, where data analysts and data scientists generate insights and calculate new metrics. These metrics are stored in the enrich zone and indexed as new fields in the OpenSearch documents by the data engineering team (Figure 2).

Data lake orchestration among teams

Figure 2. Data lake orchestration among teams

Let’s explore an example. Consider a company that periodically retrieves blog site comments and performs sentiment analysis using Amazon Comprehend. In this case:

  1. The comments are ingested into the raw zone of the data lake.
  2. The data engineering team processes the comments and stores them in the indexing zone.
  3. A Lambda function indexes the comments into OpenSearch, enriches the comments with the OpenSearch document ID, and saves it in the clean zone.
  4. The data science team consumes the comments and performs sentiment analysis using Amazon Comprehend.
  5. The sentiment analysis metrics are stored in the metrics zone of the data lake. A second Lambda function updates the comments in OpenSearch with the new metrics.

If the raw data does not require any preprocessing steps, the indexing and clean zones can be combined. You can explore this specific example, along with code implementation, in the AWS samples repository.

Schema evolution

As your data progresses through data lake stages, the schema changes and gets enriched accordingly. Continuing with our previous example, Figure 3 explains how the schema evolves.

Schema evolution through the data lake stages

Figure 3. Schema evolution through the data lake stages

  1. In the raw zone, there is a raw text field received directly from the ingestion phase. It’s best practice to keep a raw version of the data as a backup, or in case the processing steps need to be repeated later.
  2. In the indexing zone, the clean text field replaces the raw text field after being processed.
  3. In the clean zone, we add a new ID field that is generated during indexing and identifies the OpenSearch document of the text field.
  4. In the enrich zone, the ID field is required. Other fields with metric names are optional and represent new metrics calculated by other teams that will be added to OpenSearch.

Consumption layer with OpenSearch

In OpenSearch, data is organized into indices, which can be thought of as tables in a relational database. Each index consists of documents—similar to table rows—and multiple fields, similar to table columns. You can add documents to an index by indexing and updating them using various client APIs for popular programming languages.

Now, let’s explore how our architecture integrates with OpenSearch in the indexing and updating stage.

Indexing and updating documents using Python

The index document API operation allows you to index a document with a custom ID, or assigns one if none is provided. To speed up indexing, we can use the bulk index API to index multiple documents in one call.

We need to store the IDs back from the index operation to later identify the documents we’ll update with new metrics. Let’s explore two ways of doing this:

  • Use the requests library to call the REST Bulk Index API (preferred): the response returns the auto-generated IDs we need.
  • Use the Python Low-Level Client for OpenSearch: The IDs are not returned and need to be pre-assigned to later store them. We can use an atomic counter in Amazon DynamoDB to do so. This allows multiple Lambda functions to index documents in parallel without ID collisions.

As in Figure 4, the Lambda function:

  1. Increases the atomic counter by the number of documents that will index into OpenSearch.
  2. Gets the value of the counter back from the API call.
  3. Indexes the documents using the range that goes between [current counter value, current counter value – number of documents].
Storing the IDs back from the bulk index operation using the Python Low-Level Client for OpenSearch

Figure 4. Storing the IDs back from the bulk index operation using the Python Low-Level Client for OpenSearch

Data flow automation

As architectures evolve towards automation, the data flow between data lake stages becomes event-driven. Following our previous example, we can automate the processing steps of the data when moving from the raw to the indexing zone (Figure 5).

Event-driven automation for data flow

Figure 5. Event-driven automation for data flow

With Amazon EventBridge and AWS Step Functions, we can automatically trigger our pre-processing AWS Glue jobs so our data gets pre-processed without manual intervention.

The same approach can be applied to the other data lake stages to achieve a fully automated architecture. Explore this implementation for an automated language use case.

Conclusion

In this blog post, we covered designing an architecture to effectively handle text data using a data lake on AWS. We explained how different data teams can work independently to extract insights from text documents at different lifecycle stages using OpenSearch as the search and analytics service.

How NETSCOUT built a global DDoS awareness platform with Amazon OpenSearch Service

Post Syndicated from Hardik Modi original https://aws.amazon.com/blogs/big-data/how-netscout-built-a-global-ddos-awareness-platform-with-amazon-opensearch-service/

This post was co-written with Hardik Modi, AVP, Threat and Migitation Products at NETSCOUT.

NETSCOUT Omnis Threat Horizon is a global cybersecurity awareness platform providing users with highly contextualized visibility into “over the horizon” threat activity on the global DDoS (Distributed Denial of Service) landscape—threats that could be impacting their industry, their customers, or their suppliers. It allows visitors to create custom profiles and understand DDoS activity that is being observed in near-real time through NETSCOUT’s ATLAS visibility platform. Users can create free accounts to create customized profiles that lead to a map-based visualization (as in the following screenshot) as well as tailored summary reporting. DDoS attacks can be impactful to services delivered over the internet. Visibility of this nature is key to anyone who wishes to understand what is happening on the threat landscape. Omnis Threat Horizon has been generally available since August 2019.

NETSCOUT Omnis Threat Horizon: Real-Time DDoS Attack Map

To provide continuous visibility at a low per-user cost (to enable a free service), the NETSCOUT development team chose a series of AWS technologies to power the collection, storage, analysis, warehousing, user authentication, and delivery of the application. In particular, they chose Amazon OpenSearch Service as the core analytics engine. They store all processed attack records in OpenSearch Service.

This post discusses the challenges and design patterns NETSCOUT used on its path to representing the details of roughly 10 million annual DDoS attacks in near-real time.

Background

NETSCOUT, through its Arbor product line, is a long-time provider of solutions for network visibility and DDoS mitigation for service providers and enterprises. Since 2007, NETSCOUT has operated a program called ATLAS, in which customers can opt to share anonymized data about the DDoS attacks they are observing on their network. As this program has matured, NETSCOUT has comprehensive visibility into the DDoS attack landscape—both the number and nature of attacks. This visibility informs and improves their products, allowing them to share analysis findings in the form of papers, blog posts, and a biannual threat report. Since NETSCOUT started collecting and analyzing data in the current form in September 2012, they have observed 96 million attacks, allowing them to perform considerable analysis of trends across regions and verticals, as well as understand the vectors used and sizes of attacks.

Omnis Threat Horizon is a solution to display this information to a broader audience—essentially anyone interested in the threat landscape, and specifically the DDoS attack trends at any given time. In addition to providing real-time maps, the solution allows the user to go back in time to observe visually or in summary form what might have been happening at a given time.

They wanted to make sure that the visual elements and application was responsive globally, both in terms of representing real-time data as well as showing historical information. Furthermore, they wanted to keep the incremental cost per user as low as possible, in order to be able to provide this service for free globally.

Solution overview

The following diagram illustrates the solution architecture.

One of the objectives behind the chosen solution was to utilize native AWS services in every instance possible. Furthermore, they chose to break component functionality into their own microservices, and make consistent use of this through the solution.

Individual monitoring sensors deliver data to Amazon Simple Storage Service (Amazon S3) on an hourly basis. As new entries are received, Amazon Simple Notification Service (Amazon SNS) notifications are delivered, resulting in processing of the data. Successive microservices are responsible for:

  • Parsing
  • Running algorithms to identify and separate spurious entries
  • Deduplication
  • Scoring
  • Confidence

After this processing, each attack is represented as a separate document in the OpenSearch Service domain. As of writing this post, NETSCOUT has approximately 96 million attacks in the cluster, all of which can be represented in some form in the maps and reports in Omnis Threat Horizon.

The data is organized in hourly bin files, and served to the application via Amazon CloudFront.

Lessons learned related to Elasticsearch

On previous projects, NETSCOUT tried Apache Cassandra, a popular NoSQL open-source database, and considered it inadequate for aggregation queries. While developing Horizon, they chose Elasticsearch to get access to more powerful aggregation query capabilities with significantly less developer time.

They started with a self-managed instance, but faced the following issues:

  • Considerable expenditure of person hours simply to manage the infrastructure
  • Each version upgrade was an involved process, requiring a lot of planning and still posing technical challenges along the way
  • No auto scaling and big aggregation queries could break Elasticsearch

After a few cycles of powering through this, they moved to OpenSearch Service to overcome these challenges.

Outcome

NETSCOUT saw the following benefits from this architecture:

  • Fast processing of attack data – The time from when attack data is received to when it is available in the data store is of the order of seconds, allowing them to provide near-real-time visibility in the solution.
  • Lower management overhead – The data store grows consistently, and by using a managed service, teams avoid having to perform tasks related to cluster management. This was a big pain point with previous solutions adopted involving the same technology.
  • Scalable architecture – It’s possible to add new capabilities into the pipeline as requirements emerge, without rearchitecting other components.

Conclusion

With OpenSearch Service, NETSCOUT has been able to build a resilient data store for the attack data they capture. As a result of architectural choices made and the underlying AWS services, they’re able to provide visibility into their data at small incremental costs, allowing them to provide a global visibility platform at no cost to the end-user.

With the most experience, the most reliable, scalable, and secure cloud, and the most comprehensive set of services and solutions, AWS is the best place to unlock value from your data and turn it into insight.


About the Authors

Hardik-Modi
Hardik Modi is AVP, Threat and Migitation Products at NETSCOUT. In this role, he oversees the teams responsible for mitigation products as well as the creation of security content for NETSCOUTs products, enabling best-in-class protection for users, as well as the continuous delivery and publication of impactful research across the DDoS and Intrusion landscapes.

Sujatha-Kuppuraju
Sujatha Kuppuraju is a Principal Solutions Architect at Amazon Web Services (AWS). She engages with customers to create innovative solutions that address customer business problems and accelerate the adoption of AWS services.

Mike-Arruda
Mike Arruda is a Senior Technical Account Manager at AWS, based in the New England area. He works with AWS Enterprise customers, supporting their success in adopting best practices and helping them achieve their desired business outcomes with AWS.

Build a search application with Amazon OpenSearch Serverless

Post Syndicated from Aish Gunasekar original https://aws.amazon.com/blogs/big-data/build-a-search-application-with-amazon-opensearch-serverless/

In this post, we demonstrate how to build a simple web-based search application using the recently announced Amazon OpenSearch Serverless, a serverless option for Amazon OpenSearch Service that makes it easy to run petabyte-scale search and analytics workloads without having to think about clusters. The benefit of using OpenSearch Serverless as a backend for your search application is that it automatically provisions and scales the underlying resources based on the search traffic demands, so you don’t have to worry about infrastructure management. You can simply focus on building your search application and analyzing the results. OpenSearch Serverless is powered by the open-source OpenSearch project, which consists of a search engine, and OpenSearch Dashboards, a visualization tool to analyze your search results.

Solution overview

There are many ways to build a search application. In our example, we create a simple Java script front end and call Amazon API Gateway, which triggers an AWS Lambda function upon receiving user queries. As shown in the following diagram, API Gateway acts as a broker between the front end and the OpenSearch Serverless collection. When the user queries the front-end webpage, API Gateway passes requests to the Python Lambda function, which runs the queries on the OpenSearch Serverless collection and returns the search results.

To get started with the search application, you must first upload the relevant dataset, a movie catalog in this case, to the OpenSearch collection and index them to make them searchable.

Create a collection in OpenSearch Serverless

A collection in OpenSearch Serverless is a logical grouping of one or more indexes that represent a workload. You can create a collection using the AWS Management Console or AWS Software Development Kit (AWS SDK). Follow the steps in Preview: Amazon OpenSearch Serverless – Run Search and Analytics Workloads without Managing Clusters to create and configure a collection in OpenSearch Serverless.

Create an index and ingest data

After your collection is created and active, you can upload the movie data to an index in this collection. Indexes hold documents, and each document in this example represents a movie record. Documents are comparable to rows in the database table. Each document (the movie record) consists of 10 fields that are typically searched for in a movie catalog, like the director, actor, release date, genre, title, or plot of the movie. The following is a sample movie JSON document:

{
"directors": ["David Yates"],
"release_date": "2011-07-07T00:00:00Z",
"rating": 8.1,
"genres": ["Adventure", "Family", "Fantasy", "Mystery"],
"plot": "Harry, Ron and Hermione search for Voldemort's remaining Horcruxes in their effort to destroy the Dark Lord.",
"title": "Harry Potter and the Deathly Hallows: Part 2",
"rank": 131,
"running_time_secs": 7800,
"actors": ["Daniel Radcliffe", "Emma Watson", "Rupert Grint"],
"year": 2011
}

For the search catalog, you can upload the sample-movies.bulk dataset sourced from the Internet Movies Database (IMDb). OpenSearch Serverless offers the same ingestion pipeline and clients to ingest the data as OpenSearch Service, such as Fluentd, Logstash, and Postman. Alternatively, you can use the OpenSearch Dashboards Dev Tools to ingest and search the data without configuring any additional pipelines. To do so, log in to OpenSearch Dashboards using your SAML credentials and choose Dev tools.

To create a new index, use the PUT command followed by the index name:

PUT movies-index

A confirmation message is displayed upon successful creation of your index.

After the index is created, you can ingest documents into the index. OpenSearch provides the option to ingest multiple documents in one request using the _bulk request. Enter POST /_bulk in the left pane as shown in the following screenshot, then copy and paste the contents of the sample-movies.bulk file you downloaded earlier.

You have successfully created the movies index and uploaded 1,500 records into the catalog! Now let’s integrate the movie catalog with your search application.

Integrate the Lambda function with an OpenSearch Serverless endpoint

In this step, you create a Lambda function that queries the movie catalog in OpenSearch Serverless and returns the result. For more information, see our tutorial on creating a Lambda function for connecting to and querying an OpenSearch Service domain. You can reuse the same code by replacing the parameters to align to OpenSearch Serverless’s requirements. Replace <my-region> with your corresponding region (for example, us-west-2), use aoss instead of es for service, replace <hostname> with the OpenSearch collection endpoint, and <index-name> with your index (in this case, movies-index).

The following is a snippet of the Lambda code. You can find the complete code in the tutorial.

import boto3
import json
import requests
from requests_aws4auth import AWS4Auth

region = '<my-region>'
service = 'aoss'
credentials = boto3.Session().get_credentials()
awsauth = AWS4Auth(credentials.access_key, credentials.secret_key, region, service, session_token=credentials.token)

host = '<hostname>' 
# The OpenSearch collection endpoint 
index = '<index-name>'
url = host + '/' + index + '/_search'

# Lambda execution starts here
def Lambda_handler(event, context):

This Lambda function returns a list of movies based on a search string (such as movie title, director, or actor) provided by the user.

Next, you need to configure the permissions in OpenSearch Serverless’s data access policy to let the Lambda function access the collection.

  1. On the Lambda console, navigate to your function.
  2. On the Configuration tab, in the Permissions section, under Execution role, copy the value for Role name.
  3. Add this role name as one of the principals of your movie-search collection’s data access policy.

Principals can be AWS Identity and Access Management (IAM) users, role ARNs, or SAML identities. These principals must be within the current AWS account.

After you add the role name as a principal, you can see the role ARN updated in your rule, as show in the following screenshot.

Now you can grant collection and index permissions to this principal.

For more details about data access policies, refer to Data access control for Amazon OpenSearch Serverless. Skipping this step or not running it correctly will result in permission errors, and your Lambda code won’t be able to query the movie catalog.

Configure API Gateway

API Gateway acts as a front door for applications to access the code running on Lambda. To create, configure, and deploy the API for the GET method, refer to the steps in the tutorial. For API Gateway to pass the requests to the Lambda function, configure it as a trigger to invoke the Lambda function.

The next step is to integrate it with the front end.

Test the web application

To build the front-end UI, you can download the following sample JavaScript web service. Open the scripts/search.js file and update the apigatewayendpoint variable to point to your API Gateway endpoint:

var apigatewayendpoint = 'https://kxxxxxxzzz.execute-api.us-west-2.amazonaws.com/opensearch-api-test/';
// Update this variable to point to your API Gateway endpoint.

You can access the front-end application by opening index.html in your browser. When the user runs a query on the front-end application, it calls API Gateway and Lambda to serve up the content hosted in the OpenSearch Serverless collection.

When you search the movie catalog, the Lambda function runs the following query:

    # Put the user query into the query DSL for more accurate search results.
    # Note that certain fields are boosted (^).
    query = {
        "size": 25,
        "query": {
            "multi_match": {
                "query": event['queryStringParameters']['q'],
                "fields": ["title", "plot", "actors"]
            }
        }
    }

The query returns documents based on a provided query string. Let’s look at the parameters used in the query:

  • size – The size parameter is the maximum number of documents to return. In this case, a maximum of 25 results is returned.
  • multi_match – You use a match query when matching larger pieces of text, especially when you’re using OpenSearch’s relevance to sort your results. With a multi_match query, you can query across multiple fields specified in the query.
  • fields – The list of fields you are querying.

In a search for “Harry Potter,” the document with the matching term both in the title and plot fields appears higher than other documents with the matching term only in the title field.

Congratulations! You have configured and deployed a search application fronted by API Gateway, running Lambda functions for the queries served by OpenSearch Serverless.

Clean up

To avoid unwanted charges, delete the OpenSearch Service collection, Lambda function, and API Gateway that you created.

Conclusion

In this post, you learned how to build a simple search application using OpenSearch Serverless. With OpenSearch Serverless, you don’t have to worry about managing the underlying infrastructure. OpenSearch Serverless supports the same ingestion and query APIs as the OpenSearch Project. You can quickly get started by ingesting the data into your OpenSearch Service collection, and then perform searches on the data using your web interface.

In subsequent posts, we dive deeper into many other search queries and features that you can use to make your search application even more effective.

We would love to hear how you are building your search applications today. If you’re just getting started with OpenSearch Serverless, we recommend getting hands-on with the Getting started with Amazon OpenSearch Serverless workshop.


About the authors

Aish Gunasekar is a Specialist Solutions architect with a focus on Amazon OpenSearch Service. Her passion at AWS is to help customers design highly scalable architectures and help them in their cloud adoption journey. Outside of work, she enjoys hiking and baking.

Pavani Baddepudi is a senior product manager working in search services at AWS. Her interests include distributed systems, networking, and security.