Tag Archives: Amazon VPC

Integrating AWS WAF with your Amazon Lightsail instance

Post Syndicated from Macey Neff original https://aws.amazon.com/blogs/compute/integrating-aws-waf-with-your-amazon-lightsail-instance/

This blog post is written by Riaz Panjwani, Solutions Architect, Canada CSC and Dylan Souvage, Solutions Architect, Canada CSC.

Security is the top priority at AWS. This post shows how you can level up your application security posture on your Amazon Lightsail instances with an AWS Web Application Firewall (AWS WAF) integration. Amazon Lightsail offers easy-to-use virtual private server (VPS) instances and more at a cost-effective monthly price.

Lightsail provides security functionality built-in with every instance through the Lightsail Firewall. Lightsail Firewall is a network-level firewall that enables you to define rules for incoming traffic based on IP addresses, ports, and protocols. Developers looking to help protect against attacks such as SQL injection, cross-site scripting (XSS), and distributed denial of service (DDoS) can leverage AWS WAF on top of the Lightsail Firewall.

As of this post’s publishing, AWS WAF can only be deployed on Amazon CloudFront, Application Load Balancer (ALB), Amazon API Gateway, and AWS AppSync. However, Lightsail can’t directly act as a target for these services because Lightsail instances run within an AWS managed Amazon Virtual Private Cloud (Amazon VPC). By leveraging VPC peering, you can deploy the aforementioned services in front of your Lightsail instance, allowing you to integrate AWS WAF with your Lightsail instance.

Solution Overview

This post shows you two solutions to integrate AWS WAF with your Lightsail instance(s). The first uses AWS WAF attached to an Internet-facing ALB. The second uses AWS WAF attached to CloudFront. By following one of these two solutions, you can utilize rule sets provided in AWS WAF to secure your application running on Lightsail.

Solution 1: ALB and AWS WAF

This first solution uses VPC peering and ALB to allow you to use AWS WAF to secure your Lightsail instances. This section guides you through the steps of creating a Lightsail instance, configuring VPC peering, creating a security group, setting up a target group for your load balancer, and integrating AWS WAF with your load balancer.

AWS architecture diagram showing Amazon Lightsail integration with WAF using VPC peering across two separate VPCs. The Lightsail application is in a private subnet inside the managed VPC(vpc-b), with peering connection to your VPC(vpc-a) which has an ALB in a public subnet with WAF attached to it.

Creating the Lightsail Instance

For this walkthrough, you can utilize an AWS Free Tier Linux-based WordPress blueprint.

1. Navigate to the Lightsail console and create the instance.

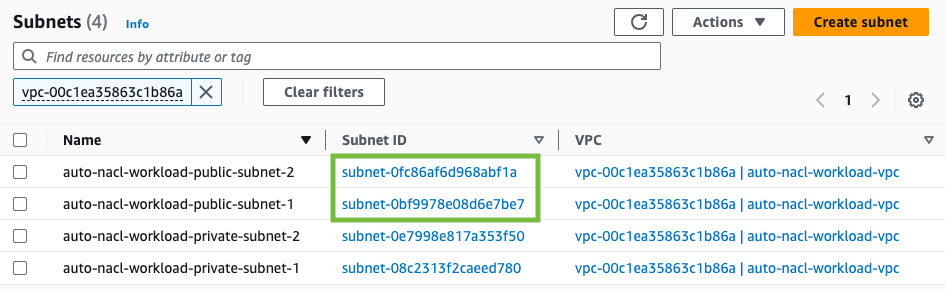
2. Verify that your Lightsail instance is online and obtain its private IP, which you will need when configuring the Target Group later.

Screenshot of Lightsail console with a WordPress application set up showcasing the networking tab.

Attaching an ALB to your Lightsail instance

You must enable VPC peering as you will be utilizing an ALB in a separate VPC.

1. To enable VPC peering, navigate to your account in the top-right corner, select the Account dropdown, select Account, then select Advanced, and select Enable VPC Peering. Note the AWS Region being selected, as it is necessary later. For this example, select “us-east-2”. Screenshot of Lightsail console in the settings menu under the advanced section showcasing VPC peering.2. In the AWS Management Console, navigate to the VPC service in the search bar, select VPC Peering Connections and verify the created peering connection.

Screenshot of the AWS Console showing the VPC Peering Connections menu with an active peering connection.

3. In the left navigation pane, select Security groups, and create a Security group that allows HTTP traffic (port 80). This is used later to allow public HTTP traffic to the ALB.

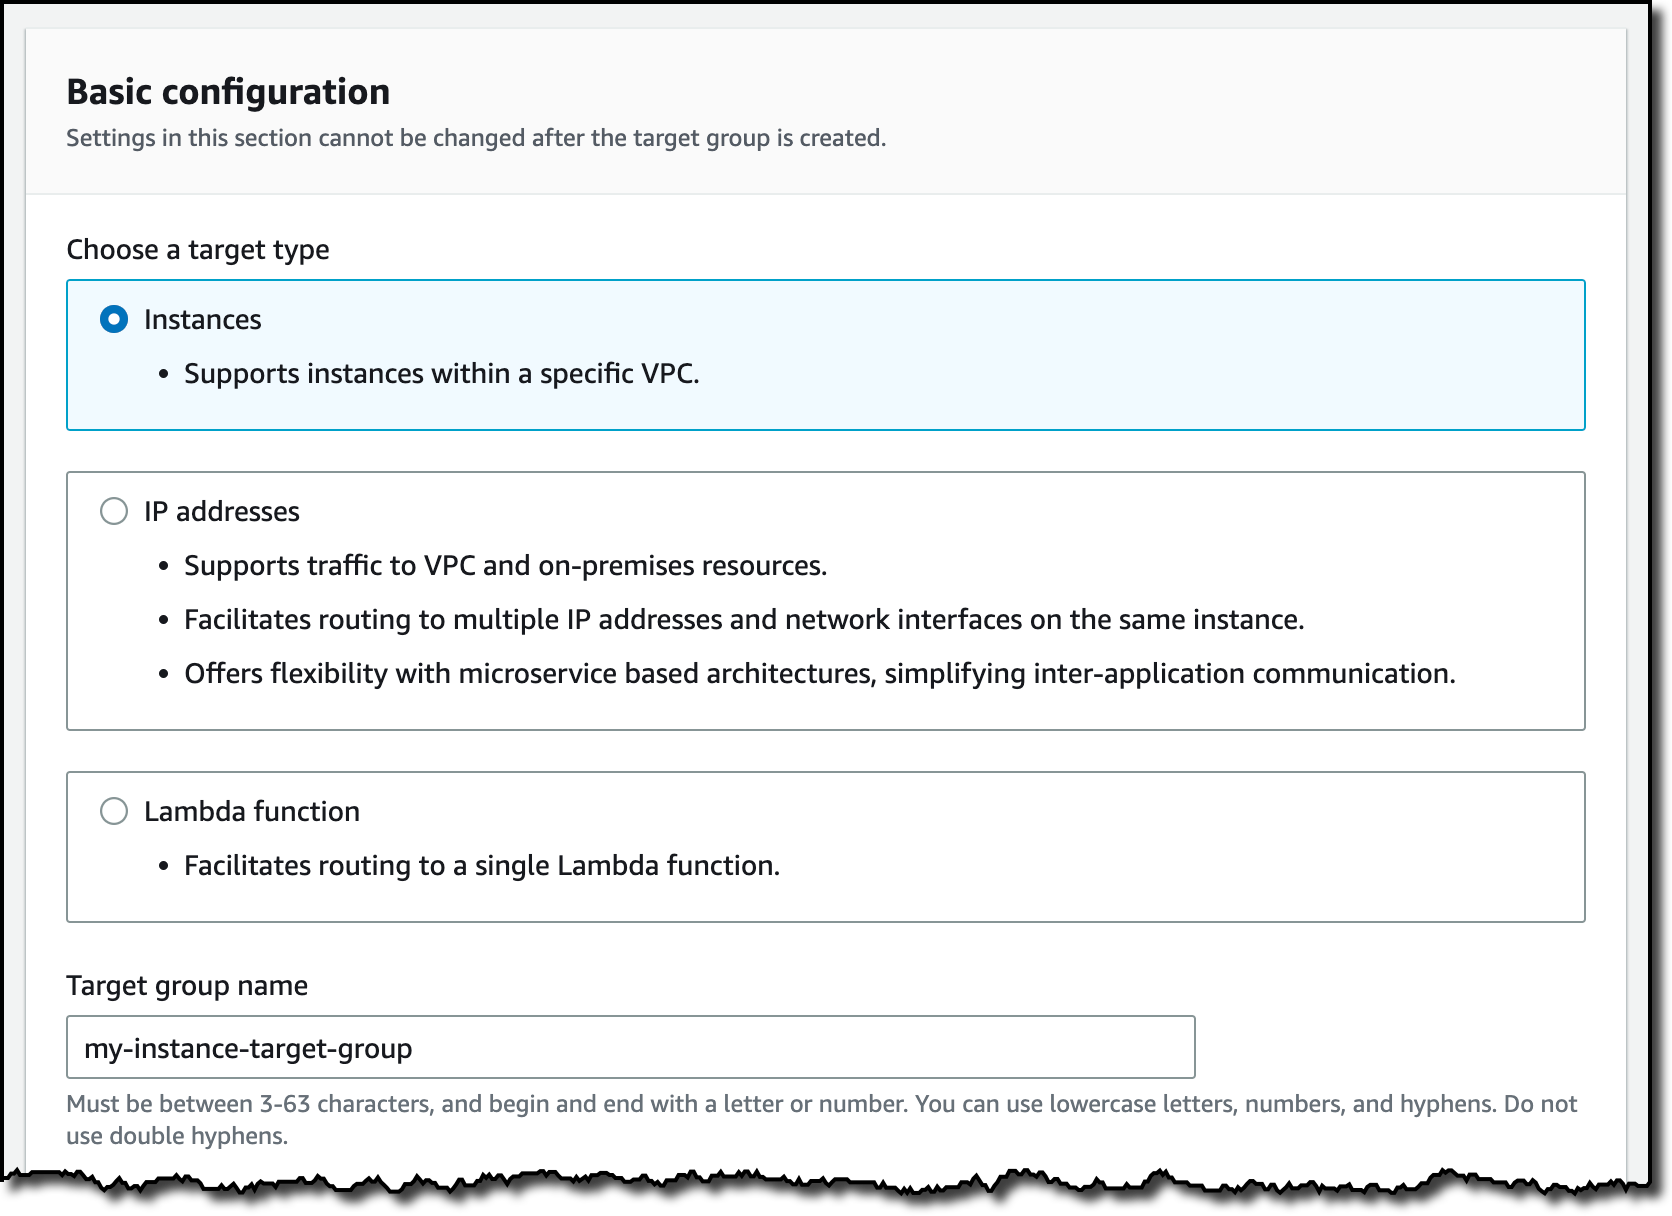
4. Navigate to the Amazon Elastic Compute Cloud (Amazon EC2) service, and in the left pane under Load Balancing select Target Groups. Proceed to create a Target Group, choosing IP addresses as the target type.Screenshot of the AWS console setting up target groups with the IP address target type selected.

5. Proceed to the Register targets section, and select Other private IP address. Add the private IP address of the Lightsail instance that you created before. Select Include as Pending below and then Create target group (note that if your Lightsail instance is re-launched the target group must be updated as the private IP address may change).

6. In the left pane, select Load Balancers, select Create load balancers and choose Application Load Balancer. Ensure that you select the “Internet-facing” scheme, otherwise, you will not be able to connect to your instance over the internet.Screenshot of the AWS console setting up target groups with the IP address target type selected.

7. Select the VPC in which you want your ALB to reside. In this example, select the default VPC and all the Availability Zones (AZs) to make sure of the high availability of the load balancer.

8. Select the Security Group created in Step 3 to make sure that public Internet traffic can pass through the load balancer.

9. Select the target group under Listeners and routing to the target group you created earlier (in Step 5). Proceed to Create load balancer.Screenshot of the AWS console creating an ALB with the target group created earlier in the blog, selected as the listener.

10. Retrieve the DNS name from your load balancer again by navigating to the Load Balancers menu under the EC2 service.Screenshot of the AWS console with load balancer created.

11. Verify that you can access your Lightsail instance using the Load Balancer’s DNS by copying the DNS name into your browser.

Screenshot of basic WordPress app launched accessed via a web browser.

Integrating AWS WAF with your ALB

Now that you have ALB successfully routing to the Lightsail instance, you can restrict the instance to only accept traffic from the load balancer, and then create an AWS WAF web Access Control List (ACL).

1. Navigate back to the Lightsail service, select the Lightsail instance previously created, and select Networking. Delete all firewall rules that allow public access, and under IPv4 Firewall add a rule that restricts traffic to the IP CIDR range of the VPC of the previously created ALB.

Screenshot of the Lightsail console showing the IPv4 firewall.

2. Now you can integrate the AWS WAF to the ALB. In the Console, navigate to the AWS WAF console, or simply navigate to your load balancer’s integrations section, and select Create web ACL.

Screenshot of the AWS console showing the WAF configuration in the integrations tab of the ALB.

3. Choose Create a web ACL, and then select Add AWS resources to add the previously created ALB.Screenshot of creating and assigning a web ACL to the ALB.

4. Add any rules you want to your ACL, these rules will govern the traffic allowed or denied to your resources. In this example, you can add the WordPress application managed rules.Screenshot of adding the AWS WAF managed rule for WordPress applications.

5. Leave all other configurations as default and create the AWS WAF.

6. You can verify your firewall is attached to the ALB in the load balancer Integrations section.Screenshot of the AWS console showing the WAF integration detected in the integrations tab of the ALB.

Solution 2: CloudFront and AWS WAF

Now that you have set up ALB and VPC peering to your Lightsail instance, you can optionally choose to add CloudFront to the solution. This can be done by setting up a custom HTTP header rule in the Listener of your ALB, setting up the CloudFront distribution to use the ALB as an origin, and setting up an AWS WAF web ACL for your new CloudFront distribution. This configuration makes traffic limited to only accessing your application through CloudFront, and is still protected by WAF.AWS architecture diagram showing Amazon Lightsail integration with WAF using VPC peering across two separate VPCs. The Lightsail application is in a public subnet inside VPC-B, with peering connection to VPC-A which has an ALB in a private subnet fronted with CloudFront that has WAF attached.

1. Navigate to the CloudFront service, and click Create distribution.

2. Under Origin domain, select the load balancer that you had created previously.Screenshot of creating a distribution in CloudFront.

3. Scroll down to the Add custom header field, and click Add header.

4. Create your header name and value. Note the header name and value as you will need it later in the walkthrough.Screenshot of adding the custom header to your CloudFront distribution.

5. Scroll down to the Cache key and origin requests section. Under Cache policy, choose CachingDisabled.Screenshot of selecting the CachingDisabled cache policy inside the creation of the CloudFront distribution.

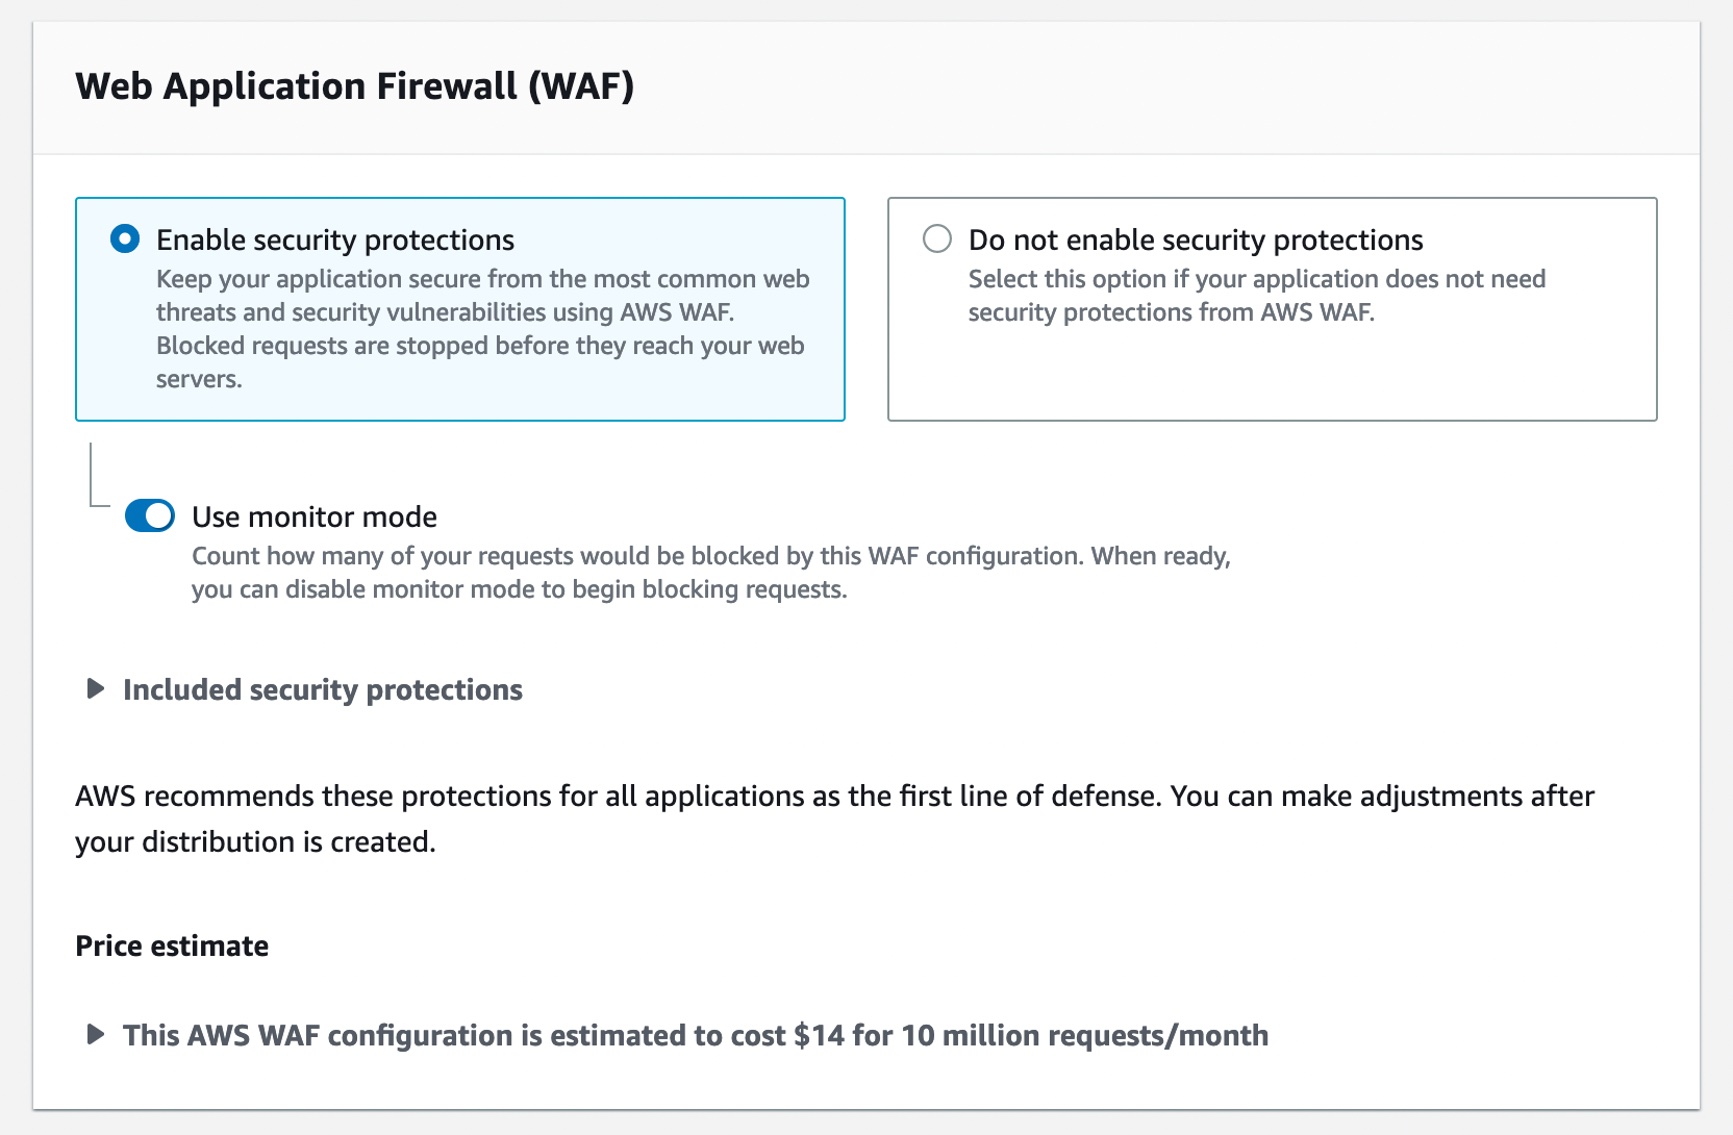
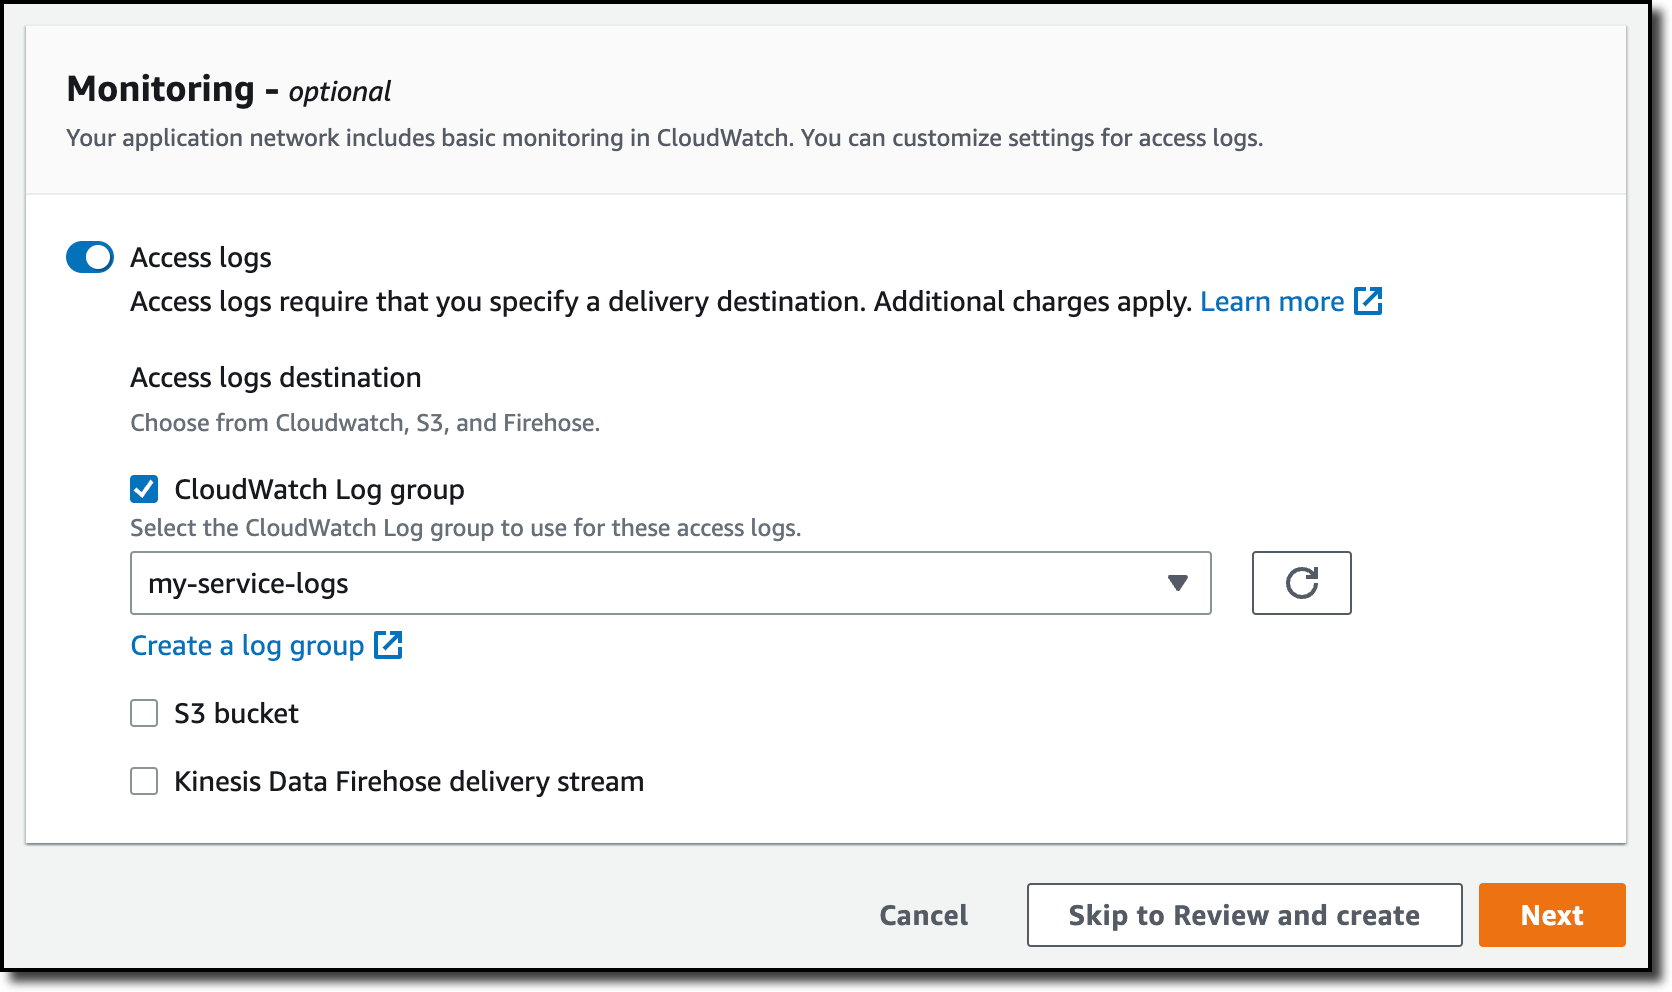
6. Scroll to the Web Application Firewall (WAF) section, and select Enable security protections.Screenshot of selecting “Enable security protections” inside the creation of the CloudFront distribution.

7. Leave all other configurations as default, and click Create distribution.

8. Wait until your CloudFront distribution has been deployed, and verify that you can access your Lightsail application using the DNS under Domain name.

Screenshot of the CloudFront distribution created with the status as enabled and the deployment finished.

9. Navigate to the EC2 service, and in the left pane under Load Balancing, select Load Balancers.

10. Select the load balancer you created previously, and under the Listeners tab, select the Listener you had created previously. Select Actions in the top right and then select Manage rules.Screenshot of the Listener section of the ALB with the Manage rules being selected.

11. Select the edit icon at the top, and then select the edit icon beside the Default rule.

Screenshot of the edit section inside managed rules.

12. Select the delete icon to delete the Default Action.

Screenshot of highlighting the delete button inside the edit rules section.

13. Choose Add action and then select Return fixed response.

Screenshot of adding a new rule “Return fixed response…”.

14. For Response code, enter 403, this will restrict access to CloudFront.

15. For Response body, enter “Access Denied”.

16. Select Update in the top right corner to update the Default rule.

Screenshot of the rule being successfully updated.

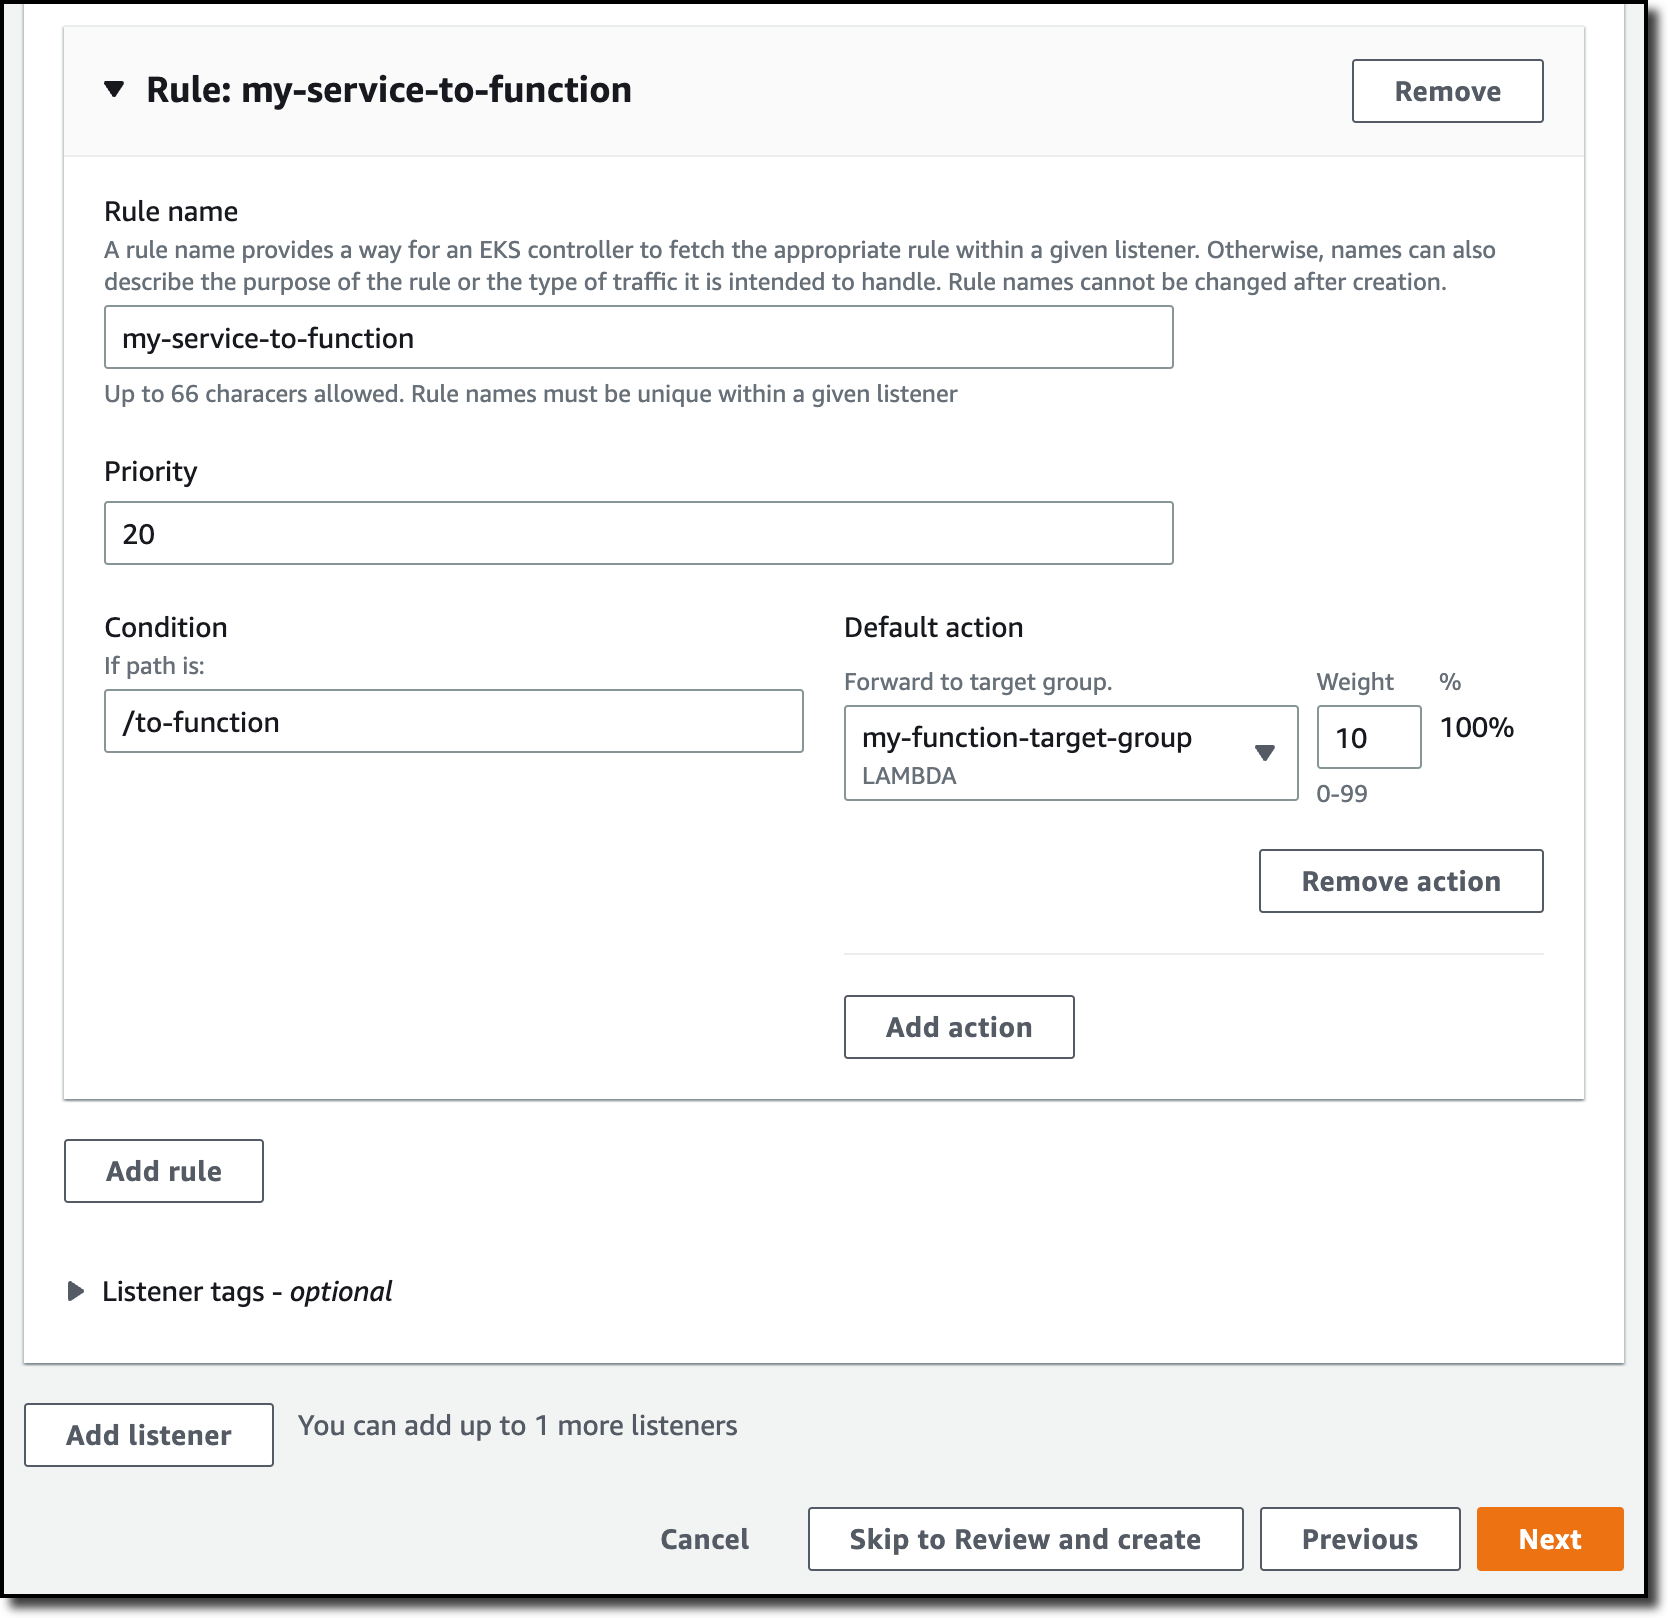
17. Select the insert icon at the top, then select Insert Rule.

Screenshot of inserting a new rule to the Listener.

18. Choose Add Condition, then select Http header. For Header type, enter the Header name, and then for Value enter the Header Value chosen previously.

19. Choose Add Action, then select Forward to and select the target group you had created in the previous section.

20. Choose Save at the top right corner to create the rule.

Screenshot of adding a new rule to the Listener, with the Http header selected as the custom-header and custom-value from the previous creation of the CloudFront distribution, with the Load Balancer selected as the target group.

21. Retrieve the DNS name from your load balancer again by navigating to the Load Balancers menu under the EC2 service.

22. Verify that you can no longer access your Lightsail application using the Load Balancer’s DNS.

Screenshot of the Lightsail application being accessed through the Load Balancer via a web browser with Access Denied being shown..

23. Navigate back to the CloudFront service and select the Distribution you had created. Under the General tab, select the Web ACL link under the AWS WAF section. Modify the Web ACL to leverage any managed or custom rule sets.

Screenshot of the CloudFront distribution focusing on the AWS WAF integration under the General tab Settings.

You have successfully integrated AWS WAF to your Lightsail instance! You can access your Lightsail instance via your CloudFront distribution domain name!

Clean Up Lightsail console resources

To start, you will delete your Lightsail instance.

  1. Sign in to the Lightsail console.
  2. For the instance you want to delete, choose the actions menu icon (⋮), then choose Delete.
  3. Choose Yes to confirm the deletion.

Next you will delete your provisioned static IP.

  1. Sign in to the Lightsail console.
  2. On the Lightsail home page, choose the Networking tab.
  3. On the Networking page choose the vertical ellipsis icon next to the static IP address that you want to delete, and then choose Delete.

Finally you will disable VPC peering.

  1. In the Lightsail console, choose Account on the navigation bar.
  2. Choose Advanced.
  3. In the VPC peering section, clear Enable VPC peering for all AWS Regions.

Clean Up AWS console resources

To start, you will delete your Load balancer.

  1. Navigate to the EC2 console, choose Load balancers on the navigation bar.
  2. Select the load balancer you created previously.
  3. Under Actions, select Delete load balancer.

Next, you will delete your target group.

  1. Navigate to the EC2 console, choose Target Groups on the navigation bar.
  2. Select the target group you created previously.
  3. Under Actions, select Delete.

Now you will delete your CloudFront distribution.

  1. Navigate to the CloudFront console, choose Distributions on the navigation bar.
  2. Select the distribution you created earlier and select Disable.
  3. Wait for the distribution to finish deploying.
  4. Select the same distribution after it is finished deploying and select Delete.

Finally, you will delete your WAF ACL.

  1. Navigate to the WAF console, and select Web ACLS on the navigation bar.
  2. Select the web ACL you created previously, and select Delete.

Conclusion

Adding AWS WAF to your Lightsail instance enhances the security of your application by providing a robust layer of protection against common web exploits and vulnerabilities. In this post, you learned how to add AWS WAF to your Lightsail instance through two methods: Using AWS WAF attached to an Internet-facing ALB and using AWS WAF attached to CloudFront.

Security is top priority at AWS and security is an ongoing effort. AWS strives to help you build and operate architectures that protect information, systems, and assets while delivering business value. To learn more about Lightsail security, check out the AWS documentation for Security in Amazon Lightsail.

Automatically detect and block low-volume network floods

Post Syndicated from Bryan Van Hook original https://aws.amazon.com/blogs/security/automatically-detect-and-block-low-volume-network-floods/

In this blog post, I show you how to deploy a solution that uses AWS Lambda to automatically manage the lifecycle of Amazon VPC Network Access Control List (ACL) rules to mitigate network floods detected using Amazon CloudWatch Logs Insights and Amazon Timestream.

Application teams should consider the impact unexpected traffic floods can have on an application’s availability. Internet-facing applications can be susceptible to traffic that some distributed denial of service (DDoS) mitigation systems can’t detect. For example, hit-and-run events are a popular approach that use short-lived floods that reoccur at random intervals. Each burst is small enough to go unnoticed by mitigation systems, but still occur often enough and are large enough to be disruptive. Automatically detecting and blocking temporary sources of invalid traffic, combined with other best practices, can strengthen the resiliency of your applications and maintain customer trust.

Use resilient architectures

AWS customers can use prescriptive guidance to improve DDoS resiliency by reviewing the AWS Best Practices for DDoS Resiliency. It describes a DDoS-resilient reference architecture as a guide to help you protect your application’s availability.

The best practices above address the needs of most AWS customers; however, in this blog we cover a few outlier examples that fall outside normal guidance. Here are a few examples that might describe your situation:

  • You need to operate functionality that isn’t yet fully supported by an AWS managed service that takes on the responsibility of DDoS mitigation.
  • Migrating to an AWS managed service such as Amazon Route 53 isn’t immediately possible and you need an interim solution that mitigates risks.
  • Network ingress must be allowed from a wide public IP space that can’t be restricted.
  • You’re using public IP addresses assigned from the Amazon pool of public IPv4 addresses (which can’t be protected by AWS Shield) rather than Elastic IP addresses.
  • The application’s technology stack has limited or no support for horizontal scaling to absorb traffic floods.
  • Your HTTP workload sits behind a Network Load Balancer and can’t be protected by AWS WAF.
  • Network floods are disruptive but not significant enough (too infrequent or too low volume) to be detected by your managed DDoS mitigation systems.

For these situations, VPC network ACLs can be used to deny invalid traffic. Normally, the limit on rules per network ACL makes them unsuitable for handling truly distributed network floods. However, they can be effective at mitigating network floods that aren’t distributed enough or large enough to be detected by DDoS mitigation systems.

Given the dynamic nature of network traffic and the limited size of network ACLs, it helps to automate the lifecycle of network ACL rules. In the following sections, I show you a solution that uses network ACL rules to automatically detect and block infrastructure layer traffic within 2–5 minutes and automatically removes the rules when they’re no longer needed.

Detecting anomalies in network traffic

You need a way to block disruptive traffic while not impacting legitimate traffic. Anomaly detection can isolate the right traffic to block. Every workload is unique, so you need a way to automatically detect anomalies in the workload’s traffic pattern. You can determine what is normal (a baseline) and then detect statistical anomalies that deviate from the baseline. This baseline can change over time, so it needs to be calculated based on a rolling window of recent activity.

Z-scores are a common way to detect anomalies in time-series data. The process for creating a Z-score is to first calculate the average and standard deviation (a measure of how much the values are spread out) across all values over a span of time. Then for each value in the time window calculate the Z-score as follows:

Z-score = (value – average) / standard deviation

A Z-score exceeding 3.0 indicates the value is an outlier that is greater than 99.7 percent of all other values.

To calculate the Z-score for detecting network anomalies, you need to establish a time series for network traffic. This solution uses VPC flow logs to capture information about the IP traffic in your VPC. Each VPC flow log record provides a packet count that’s aggregated over a time interval. Each flow log record aggregates the number of packets over an interval of 60 seconds or less. There isn’t a consistent time boundary for each log record. This means raw flow log records aren’t a predictable way to build a time series. To address this, the solution processes flow logs into packet bins for time series values. A packet bin is the number of packets sent by a unique source IP address within a specific time window. A source IP address is considered an anomaly if any of its packet bins over the past hour exceed the Z-score threshold (default is 3.0).

When overall traffic levels are low, there might be source IP addresses with a high Z-score that aren’t a risk. To mitigate against false positives, source IP addresses are only considered to be an anomaly if the packet bin exceeds a minimum threshold (default is 12,000 packets).

Let’s review the overall solution architecture.

Solution overview

This solution, shown in Figure 1, uses VPC flow logs to capture information about the traffic reaching the network interfaces in your public subnets. CloudWatch Logs Insights queries are used to summarize the most recent IP traffic into packet bins that are stored in Timestream. The time series table is queried to identify source IP addresses responsible for traffic that meets the anomaly threshold. Anomalous source IP addresses are published to an Amazon Simple Notification Service (Amazon SNS) topic. A Lambda function receives the SNS message and decides how to update the network ACL.

Figure 1: Automating the detection and mitigation of traffic floods using network ACLs

Figure 1: Automating the detection and mitigation of traffic floods using network ACLs

How it works

The numbered steps that follow correspond to the numbers in Figure 1.

  1. Capture VPC flow logs. Your VPC is configured to stream flow logs to CloudWatch Logs. To minimize cost, the flow logs are limited to particular subnets and only include log fields required by the CloudWatch query. When protecting an endpoint that spans multiple subnets (such as a Network Load Balancer using multiple availability zones), each subnet shares the same network ACL and is configured with a flow log that shares the same CloudWatch log group.
  2. Scheduled flow log analysis. Amazon EventBridge starts an AWS Step Functions state machine on a time interval (60 seconds by default). The state machine starts a Lambda function immediately, and then again after 30 seconds. The Lambda function performs steps 3–6.
  3. Summarize recent network traffic. The Lambda function runs a CloudWatch Logs Insights query. The query scans the most recent flow logs (5-minute window) to summarize packet frequency grouped by source IP. These groupings are called packet bins, where each bin represents the number of packets sent by a source IP within a given minute of time.
  4. Update time series database. A time series database in Timestream is updated with the most recent packet bins.
  5. Use statistical analysis to detect abusive source IPs. A Timestream query is used to perform several calculations. The query calculates the average bin size over the past hour, along with the standard deviation. These two values are then used to calculate the maximum Z-score for all source IPs over the past hour. This means an abusive IP will remain flagged for one hour even if it stopped sending traffic. Z-scores are sorted so that the most abusive source IPs are prioritized. If a source IP meets these two criteria, it is considered abusive.
    1. Maximum Z-score exceeds a threshold (defaults to 3.0).
    2. Packet bin exceeds a threshold (defaults to 12,000). This avoids flagging source IPs during periods of overall low traffic when there is no need to block traffic.
  6. Publish anomalous source IPs. Publish a message to an Amazon SNS topic with a list of anomalous source IPs. The function also publishes CloudWatch metrics to help you track the number of unique and abusive source IPs over time. At this point, the flow log summarizer function has finished its job until the next time it’s invoked from EventBridge.
  7. Receive anomalous source IPs. The network ACL updater function is subscribed to the SNS topic. It receives the list of anomalous source IPs.
  8. Update the network ACL. The network ACL updater function uses two network ACLs called blue and green. This verifies that the active rules remain in place while updating the rules in the inactive network ACL. When the inactive network ACL rules are updated, the function swaps network ACLs on each subnet. By default, each network ACL has a limit of 20 rules. If the number of anomalous source IPs exceeds the network ACL limit, the source IPs with the highest Z-score are prioritized. CloudWatch metrics are provided to help you track the number of source IPs blocked, and how many source IPs couldn’t be blocked due to network ACL limits.

Prerequisites

This solution assumes you have one or more public subnets used to operate an internet-facing endpoint.

Deploy the solution

Follow these steps to deploy and validate the solution.

  1. Download the latest release from GitHub.
  2. Upload the AWS CloudFormation templates and Python code to an S3 bucket.
  3. Gather the information needed for the CloudFormation template parameters.
  4. Create the CloudFormation stack.
  5. Monitor traffic mitigation activity using the CloudWatch dashboard.

Let’s review the steps I followed in my environment.

Step 1. Download the latest release

I create a new directory on my computer named auto-nacl-deploy. I review the releases on GitHub and choose the latest version. I download auto-nacl.zip into the auto-nacl-deploy directory. Now it’s time to stage this code in Amazon Simple Storage Service (Amazon S3).

Figure 2: Save auto-nacl.zip to the auto-nacl-deploy directory

Figure 2: Save auto-nacl.zip to the auto-nacl-deploy directory

Step 2. Upload the CloudFormation templates and Python code to an S3 bucket

I extract the auto-nacl.zip file into my auto-nacl-deploy directory.

Figure 3: Expand auto-nacl.zip into the auto-nacl-deploy directory

Figure 3: Expand auto-nacl.zip into the auto-nacl-deploy directory

The template.yaml file is used to create a CloudFormation stack with four nested stacks. You copy all files to an S3 bucket prior to creating the stacks.

To stage these files in Amazon S3, use an existing bucket or create a new one. For this example, I used an existing S3 bucket named auto-nacl-us-east-1. Using the Amazon S3 console, I created a folder named artifacts and then uploaded the extracted files to it. My bucket now looks like Figure 4.

Figure 4: Upload the extracted files to Amazon S3

Figure 4: Upload the extracted files to Amazon S3

Step 3. Gather information needed for the CloudFormation template parameters

There are six parameters required by the CloudFormation template.

Template parameter Parameter description
VpcId The ID of the VPC that runs your application.
SubnetIds A comma-delimited list of public subnet IDs used by your endpoint.
ListenerPort The IP port number for your endpoint’s listener.
ListenerProtocol The Internet Protocol (TCP or UDP) used by your endpoint.
SourceCodeS3Bucket The S3 bucket that contains the files you uploaded in Step 2. This bucket must be in the same AWS Region as the CloudFormation stack.
SourceCodeS3Prefix The S3 prefix (folder) of the files you uploaded in Step 2.

For the VpcId parameter, I use the VPC console to find the VPC ID for my application.

Figure 5: Find the VPC ID

Figure 5: Find the VPC ID

For the SubnetIds parameter, I use the VPC console to find the subnet IDs for my application. My VPC has public and private subnets. For this solution, you only need the public subnets.

Figure 6: Find the subnet IDs

Figure 6: Find the subnet IDs

My application uses a Network Load Balancer that listens on port 80 to handle TCP traffic. I use 80 for ListenerPort and TCP for ListenerProtocol.

The next two parameters are based on the Amazon S3 location I used earlier. I use auto-nacl-us-east-1 for SourceCodeS3Bucket and artifacts for SourceCodeS3Prefix.

Step 4. Create the CloudFormation stack

I use the CloudFormation console to create a stack. The Amazon S3 URL format is https://<bucket>.s3.<region>.amazonaws.com/<prefix>/template.yaml. I enter the Amazon S3 URL for my environment, then choose Next.

Figure 7: Specify the CloudFormation template

Figure 7: Specify the CloudFormation template

I enter a name for my stack (for example, auto-nacl-1) along with the parameter values I gathered in Step 3. I leave all optional parameters as they are, then choose Next.

Figure 8: Provide the required parameters

Figure 8: Provide the required parameters

I review the stack options, then scroll to the bottom and choose Next.

Figure 9: Review the default stack options

Figure 9: Review the default stack options

I scroll down to the Capabilities section and acknowledge the capabilities required by CloudFormation, then choose Submit.

Figure 10: Acknowledge the capabilities required by CloudFormation

Figure 10: Acknowledge the capabilities required by CloudFormation

I wait for the stack to reach CREATE_COMPLETE status. It takes 10–15 minutes to create all of the nested stacks.

Figure 11: Wait for the stacks to complete

Figure 11: Wait for the stacks to complete

Step 5. Monitor traffic mitigation activity using the CloudWatch dashboard

After the CloudFormation stacks are complete, I navigate to the CloudWatch console to open the dashboard. In my environment, the dashboard is named auto-nacl-1-MitigationDashboard-YS697LIEHKGJ.

Figure 12: Find the CloudWatch dashboard

Figure 12: Find the CloudWatch dashboard

Initially, the dashboard, shown in Figure 13, has little information to display. After an hour, I can see the following metrics from my sample environment:

  • The Network Traffic graph shows how many packets are allowed and rejected by network ACL rules. No anomalies have been detected yet, so this only shows allowed traffic.
  • The All Source IPs graph shows how many total unique source IP addresses are sending traffic.
  • The Anomalous Source Networks graph shows how many anomalous source networks are being blocked by network ACL rules (or not blocked due to network ACL rule limit). This graph is blank unless anomalies have been detected in the last hour.
  • The Anomalous Source IPs graph shows how many anomalous source IP addresses are being blocked (or not blocked) by network ACL rules. This graph is blank unless anomalies have been detected in the last hour.
  • The Packet Statistics graph can help you determine if the sensitivity should be adjusted. This graph shows the average packets-per-minute and the associated standard deviation over the past hour. It also shows the anomaly threshold, which represents the minimum number of packets-per-minute for a source IP address to be considered an anomaly. The anomaly threshold is calculated based on the CloudFormation parameter MinZScore.

    anomaly threshold = (MinZScore * standard deviation) + average

    Increasing the MinZScore parameter raises the threshold and reduces sensitivity. You can also adjust the CloudFormation parameter MinPacketsPerBin to mitigate against blocking traffic during periods of low volume, even if a source IP address exceeds the minimum Z-score.

  • The Blocked IPs grid shows which source IP addresses are being blocked during each hour, along with the corresponding packet bin size and Z-score. This grid is blank unless anomalies have been detected in the last hour.
     
Figure 13: Observe the dashboard after one hour

Figure 13: Observe the dashboard after one hour

Let’s review a scenario to see what happens when my endpoint sees two waves of anomalous traffic.

By default, my network ACL allows a maximum of 20 inbound rules. The two default rules count toward this limit, so I only have room for 18 more inbound rules. My application sees a spike of network traffic from 20 unique source IP addresses. When the traffic spike begins, the anomaly is detected in less than five minutes. Network ACL rules are created to block the top 18 source IP addresses (sorted by Z-score). Traffic is blocked for about 5 minutes until the flood subsides. The rules remain in place for 1 hour by default. When the same 20 source IP addresses send another traffic flood a few minutes later, most traffic is immediately blocked. Some traffic is still allowed from two source IP addresses that can’t be blocked due to the limit of 18 rules.

Figure 14: Observe traffic blocked from anomalous source IP addresses

Figure 14: Observe traffic blocked from anomalous source IP addresses

Customize the solution

You can customize the behavior of this solution to fit your use case.

  • Block many IP addresses per network ACL rule. To enable blocking more source IP addresses than your network ACL rule limit, change the CloudFormation parameter NaclRuleNetworkMask (default is 32). This sets the network mask used in network ACL rules and lets you block IP address ranges instead of individual IP addresses. By default, the IP address 192.0.2.1 is blocked by a network ACL rule for 192.0.2.1/32. Setting this parameter to 24 results in a network ACL rule that blocks 192.0.2.0/24. As a reminder, address ranges that are too wide might result in blocking legitimate traffic.
  • Only block source IPs that exceed a packet volume threshold. Use the CloudFormation parameter MinPacketsPerBin (default is 12,000) to set the minimum packets per minute. This mitigates against blocking source IPs (even if their Z-score is high) during periods of overall low traffic when there is no need to block traffic.
  • Adjust the sensitivity of anomaly detection. Use the CloudFormation parameter MinZScore to set the minimum Z-score for a source IP to be considered an anomaly. The default is 3.0, which only blocks source IPs with packet volume that exceeds 99.7 percent of all other source IPs.
  • Exclude trusted source IPs from anomaly detection. Specify an allow list object in Amazon S3 that contains a list of IP addresses or CIDRs that you want to exclude from network ACL rules. The network ACL updater function reads the allow list every time it handles an SNS message.

Limitations

As covered in the preceding sections, this solution has a few limitations to be aware of:

  • CloudWatch Logs queries can only return up to 10,000 records. This means the traffic baseline can only be calculated based on the observation of 10,000 unique source IP addresses per minute.
  • The traffic baseline is based on a rolling 1-hour window. You might need to increase this if a 1-hour window results in a baseline that allows false positives. For example, you might need a longer baseline window if your service normally handles abrupt spikes that occur hourly or daily.
  • By default, a network ACL can only hold 20 inbound rules. This includes the default allow and deny rules, so there’s room for 18 deny rules. You can increase this limit from 20 to 40 with a support case; however, it means that a maximum of 18 (or 38) source IP addresses can be blocked at one time.
  • The speed of anomaly detection is dependent on how quickly VPC flow logs are delivered to CloudWatch. This usually takes 2–4 minutes but can take over 6 minutes.

Cost considerations

CloudWatch Logs Insights queries are the main element of cost for this solution. See CloudWatch pricing for more information. The cost is about 7.70 USD per GB of flow logs generated per month.

To optimize the cost of CloudWatch queries, the VPC flow log record format only includes the fields required for anomaly detection. The CloudWatch log group is configured with a retention of 1 day. You can tune your cost by adjusting the anomaly detector function to run less frequently (the default is twice per minute). The tradeoff is that the network ACL rules won’t be updated as frequently. This can lead to the solution taking longer to mitigate a traffic flood.

Conclusion

Maintaining high availability and responsiveness is important to keeping the trust of your customers. The solution described above can help you automatically mitigate a variety of network floods that can impact the availability of your application even if you’ve followed all the applicable best practices for DDoS resiliency. There are limitations to this solution, but it can quickly detect and mitigate disruptive sources of traffic in a cost-effective manner. Your feedback is important. You can share comments below and report issues on GitHub.

 
If you have feedback about this post, submit comments in the Comments section below.

Want more AWS Security news? Follow us on Twitter.

Bryan Van Hook

Bryan Van Hook

Bryan is a Senior Security Solutions Architect at AWS. He has over 25 years of experience in software engineering, cloud operations, and internet security. He spends most of his time helping customers gain the most value from native AWS security services. Outside of his day job, Bryan can be found playing tabletop games and acoustic guitar.

Reduce costs and enable integrated SMS tracking with Braze URL shortening

Post Syndicated from Umesh Kalaspurkar original https://aws.amazon.com/blogs/architecture/reduce-costs-and-enable-integrated-sms-tracking-with-braze-url-shortening/

As competition grows fiercer, marketers need ways to ensure they reach each user with personalized content on their most critical channels. Short message/messaging service (SMS) is a key part of that effort, touching more than 5 billion people worldwide, with an impressive 82% open rate. However, SMS lacks the built-in engagement metrics supported by other channels.

To bridge this gap, leading customer engagement platform, Braze, recently built an in-house SMS link shortening solution using Amazon DynamoDB and Amazon DynamoDB Accelerator (DAX). It’s designed to handle up to 27 billion redirects per month, allowing marketers to automatically shorten SMS-related URLs. Alongside the Braze Intelligence Suite, you can use SMS click data in reporting functions and retargeting actions. Read on to learn how Braze created this feature and the impact it’s having on marketers and consumers alike.

SMS link shortening approach

Many Braze customers have used third-party SMS link shortening solutions in the past. However, this approach complicates the SMS composition process and isolates click metrics from Braze analytics. This makes it difficult to get a full picture of SMS performance.

Multiple approaches for shortening URLs, SMS, 3rd party, and Braze. Includes SMS links

Figure 1. Multiple approaches for shortening URLs

The following table compares all 3 approaches for their pros and cons.

Scenario #1 – Unshortened URL in SMS #2 – 3rd Party Shortener #3 – Braze Link Shortening & Click Tracking
Low Character Count X
Total Clicks X
Ability to Retarget Users X X
Ability to Trigger Subsequent Messages X X

With link shortening built in-house and more tightly integrated into the Braze platform, Braze can maintain more control over their roadmap priority. By developing the tool internally, Braze achieved a 90% reduction in ongoing expenses compared with the $400,000 annual expense associated with using an outside solution.

Braze SMS link shortening: Flow and architecture

SMS link shortening architecture diagram

Figure 2. SMS link shortening architecture

The following steps explain the link shortening architecture:

  1. First, customers initiate campaigns via the Braze Dashboard. Using this interface, they can also make requests to shorten URLs.
  2. The URL registration process is managed by a Kubernetes-deployed Go-based service. This service not only shortens the provided URL but also maintains reference data in Amazon DynamoDB.
  3. After processing, the dashboard receives the generated campaign details alongside the shortened URL.
  4. The fully refined campaign can be efficiently distributed to intended recipients through SMS channels.
  5. Upon a user’s interaction with the shortened URL, the message gets directed to the URL redirect service. This redirection occurs through an Application Load Balancer.
  6. The redirect service processes links in messages, calls the service, and replaces links before sending to carriers.
  7. Asynchronous calls feed data to a Kafka queue for metrics, using the HTTP sink connector integrated with Braze systems.

The registration and redirect services are decoupled from the Braze platform to enable independent deployment and scaling due to different requirements. Both the services are running the same code, but with different endpoints exposed, depending on the functionality of a given Kubernetes pod. This restricts internal access to the registration endpoint and permits independent scaling of the services, while still maintaining a fast response time.

Braze SMS link shortening: Scale

Right now, our customers use the Braze platform to send about 200 million SMS messages each month, with peak speeds of around 2,000 messages per second. Many of these messages contain one or more URLs that need to be shortened. In order to support the scalability of the link shortening feature and give us room to grow, we designed the service to handle 33 million URLs sent per month, and 3.25 million redirects per month. We assumed that we’d see up to 65 million database writes per month and 3.25 million reads per month in connection with the redirect service. This would require storage of 65 GB per month, with peaks of ~2,000 writes and 100 reads per second.

With these needs in mind, we carried out testing and determined that Amazon DynamoDB made the most sense as the backend database for the redirect service. To determine this, we tested read and write performance and found that it exceeded our needs. Additionally, it was fully managed, thus requiring less maintenance expertise, and included DAX out of the box. Most clicks happen close to send, so leveraging DAX helps us smooth out the read and write load associated with the SMS link shortener.

Because we know how long we must keep the relevant written elements at write time, we’re able to use DynamoDB Time to Live (TTL) to effectively manage their lifecycle. Finally, we’re careful to evenly distribute partition keys to avoid hot partitions, and DynamoDB’s autoscaling capabilities make it possible for us to respond more efficiently to spikes in demand.

Braze SMS link shortening: Flow

Braze SMS link shortening flow, including Registration and Redirect service

Figure 3. Braze SMS link shortening flow

  1. When the marketer initiates an SMS send, Braze checks its primary datastore (a MongoDB collection) to see if the link has already been shortened (see Figure 3). If it has, Braze re-uses that shortened link and continues the send. If it hasn’t, the registration process is initiated to generate a new site identifier that encodes the generation date and saves campaign information in DynamoDB via DAX.
    1. The response from the registration service is used to generate a short link (1a) for the SMS.
  2. A recipient gets an SMS containing a short link (2).
  3. Recipient decides to tap it (3). Braze smoothly redirects them to the destination URL, and updates the campaign statistics to show that the link was tapped.
    1. Using Amazon Route 53’s latency-based routing, Braze directs the recipient to the nearest endpoint (Braze currently has North America and EU deployments), then inspects the link to ensure validity and that it hasn’t expired. If it passes those checks, the redirect service queries DynamoDB via DAX for information about the redirect (3a). Initial redirects are cached at send time, while later requests query the DAX cache.
    2. The user is redirected with a P99 redirect latency of less than 10 milliseconds (3b).
  4. Emit campaign-level metrics on redirects.

Braze generates URL identifiers, which serve as the partition key to the DynamoDB collection, by generating a random number. We concatenate the generation date timestamp to the number, then Base66 encode the value. This results in a generated URL that looks like https://brz.ai/5xRmz, with “5xRmz” being the encoded URL identifier. The use of randomized partition keys helps avoid hot, overloaded partitions. Embedding the generation date lets us see when a given link was generated without querying the database. This helps us maintain performance and reduce costs by removing old links from the database. Other cost control measures include autoscaling and the use of DAX to avoid repeat reads of the same data. We also query DynamoDB directly against a hash key, avoiding scatter-gather queries.

Braze link shortening feature results

Since its launch, SMS link shortening has been used by over 300 Braze customer companies in more than 700 million SMS messages. This includes 50% of the total SMS volume sent by Braze during last year’s Black Friday period. There has been a tangible reduction in the time it takes to build and send SMS. “The Motley Fool”, a financial media company, saved up to four hours of work per month while driving click rates of up to 15%. Another Braze client utilized multimedia messaging service (MMS) and link shortening to encourage users to shop during their “Smart Investment” campaign, rewarding users with additional store credit. Using the engagement data collected with Braze link shortening, they were able to offer engaged users unique messaging and follow-up offers. They retargeted users who did not interact with the message via other Braze messaging channels.

Conclusion

The Braze platform is designed to be both accessible to marketers and capable of supporting best-in-class cross-channel customer engagement. Our SMS link shortening feature, supported by AWS, enables marketers to provide an exceptional user experience and save time and money.

Further reading:

AWS Cloud service considerations for designing multi-tenant SaaS solutions

Post Syndicated from Dennis Greene original https://aws.amazon.com/blogs/architecture/aws-cloud-service-considerations-for-designing-multi-tenant-saas-solutions/

An increasing number of software as a service (SaaS) providers are considering the move from single to multi-tenant to utilize resources more efficiently and reduce operational costs. This blog aims to inform customers of considerations when evaluating a transformation to multi-tenancy in the Amazon Web Services (AWS) Cloud. You’ll find valuable information on how to optimize your cloud-based SaaS design to reduce operating expenses, increase resiliency, and offer a high-performing experience for your customers.

Single versus multi-tenancy

In a multi-tenant architecture, resources like compute, storage, and databases can be shared among independent tenants. In contrast, a single-tenant architecture allocates exclusive resources to each tenant.

Let’s consider a SaaS product that needs to support many customers, each with their own independent deployed website. Using a single-tenant model (see Figure 1), the SaaS provider may opt to utilize a dedicated AWS account to host each tenant’s workloads. To contain their respective workloads, each tenant would have their own Amazon Elastic Compute Cloud (Amazon EC2) instances organized within an Auto Scaling group. Access to the applications running in these EC2 instances would be done via an Application Load Balancer (ALB). Each tenant would be allocated their own database environment using Amazon Relational Database Service (RDS). The website’s storage (consisting of PHP, JavaScript, CSS, and HTML files) would be provided by Amazon Elastic Block Store (EBS) volumes attached to the EC2 instances. The SaaS provider would have a control plane AWS account used to create and modify these tenant-specific accounts.

Single-tenant configuration

Figure 1. Single-tenant configuration

To transition to a multi-tenant pattern, the SaaS provider can use containerization to package each website, and a container orchestrator to deploy the websites across shared compute nodes (EC2 instances). Kubernetes can be employed as a container orchestrator, and a website would then be represented by a Kubernetes deployment and its associated pods. A Kubernetes namespace would serve as the logical encapsulation of the tenant-specific resources, as each tenant would be mapped to one Kubernetes namespace. The Kubernetes HorizontalPodAutoscaler can be utilized for autoscaling purposes, dynamically adjusting the number of replicas in the deployment on a given namespace based on workload demands.

When additional compute resources are required, tools such as the Cluster Autoscaler, or Karpenter, can dynamically add more EC2 instances to the shared Kubernetes Cluster. An ALB can be reused by multiple tenants to route traffic to the appropriate pods. For RDS, SaaS providers can use tenant-specific database schemas to separate tenant data. For static data, Amazon Elastic File System (EFS) and tenant-specific directories can be employed. The SaaS provider would still have a control plane AWS account that would now interact with the Kubernetes and AWS APIs to create and update tenant-specific resources.

This transition to a multi-tenant design utilizing Kubernetes, Amazon Elastic Kubernetes Service (EKS), and other managed services offers numerous advantages. It enables efficient resource utilization by leveraging containerization and auto-scaling capabilities, reducing costs, and optimizing performance (see Figure 2).

Multi-tenant configuration

Figure 2. Multi-tenant configuration

EKS cluster sizing and customer segmentation considerations in multi-tenancy designs

A high concentration of SaaS tenants hosted within the same system results in a large “blast radius.” This means a failure within the system has the potential to impact all resident tenants. This situation can lead to downtime for multiple tenants at once. To address this problem, SaaS providers are encouraged to partition their customers amongst multiple AWS accounts, each with their own deployments of this multi-tenant architecture. The number of tenants that can be present in a single cluster is a determination that can only be made by the SaaS provider after weighing the risks. Compare the shared fate of some subset of their customers, against the possible efficiency benefits of a multi-tenant architecture.

EKS security

SaaS providers must evaluate whether it’s appropriate for them to make use of containers as a workload isolation boundary. This is of particular importance in multi-tenant Kubernetes architectures, given that containers running on a single Amazon EC2 instance will share the underlying Linux kernel. Security vulnerabilities place this shared resource (the EC2 instance) at risk from attack vectors from the host Linux instance. Risk is elevated when any container running in a Kubernetes Pod cluster initiates untrusted code. This risk is heightened if SaaS providers permit tenants to “bring their code”. Kubernetes is a single tenant orchestrator, but with a multi-tenant approach to SaaS architectures, a single instance of the Amazon EKS control plane will be shared among all the workloads running within a cluster. Amazon EKS considers the cluster as the hard isolation security boundary. Every Amazon EKS managed Kubernetes cluster is isolated in a dedicated single-tenant Amazon VPC. At present, hard multi-tenancy can only be implemented by provisioning a unique cluster for each tenant.

EFS considerations

A SaaS provider may consider EFS as the storage solution for the static content of the multiple tenants. This provides them with a straightforward, serverless, and elastic file system. Directories may be used to separate the content for each tenant. While this approach of creating tenant-specific directories in EFS provides many benefits, there may be challenges harvesting per-tenant utilization and performance metrics. This can result in operational challenges for providers that need to granularly meter per-tenant usage of resources. Consequently, noisy neighbors will be difficult to identify and remediate. To resolve this, SaaS providers should consider building a custom solution to monitor the individual tenants in the multi-tenant file system by leveraging storage and throughput/IOPS metrics.

RDS considerations

Multi-tenant workloads, where data for multiple customers or end users is consolidated in the same RDS database cluster, can present operational challenges regarding per-tenant observability. Both MySQL Community Edition and open-source PostgreSQL have limited ability to provide per-tenant observability and resource governance. AWS customers operating multi-tenant workloads often use a combination of ‘database’ or ‘schema’ and ‘database user’ accounts as substitutes. AWS customers should use alternate mechanisms to establish a mapping between a tenant and these substitutes. This will give you the ability to process raw observability data from the database engine externally. You can then map these substitutes back to tenants, and distinguish tenants in the observability data.

Conclusion

In this blog, we’ve shown what to consider when moving to a multi-tenancy SaaS solution in the AWS Cloud, how to optimize your cloud-based SaaS design, and some challenges and remediations. Invest effort early in your SaaS design strategy to explore your customer requirements for tenancy. Work backwards from your SaaS tenants end goals. What level of computing performance do they require? What are the required cyber security features? How will you, as the SaaS provider, monitor and operate your platform with the target tenancy configuration? Your respective AWS account team is highly qualified to advise on these design decisions. Take advantage of reviewing and improving your design using the AWS Well-Architected Framework. The tenancy design process should be followed by extensive prototyping to validate functionality before production rollout.

Related information

Configure fine-grained access to your resources shared using AWS Resource Access Manager

Post Syndicated from Fabian Labat original https://aws.amazon.com/blogs/security/configure-fine-grained-access-to-your-resources-shared-using-aws-resource-access-manager/

You can use AWS Resource Access Manager (AWS RAM) to securely, simply, and consistently share supported resource types within your organization or organizational units (OUs) and across AWS accounts. This means you can provision your resources once and use AWS RAM to share them with accounts. With AWS RAM, the accounts that receive the shared resources can list those resources alongside the resources they own.

When you share your resources by using AWS RAM, you can specify the actions that an account can perform and the access conditions on the shared resource. AWS RAM provides AWS managed permissions, which are created and maintained by AWS and which grant permissions for common customer scenarios. Now, you can further tailor resource access by authoring and applying fine-grained customer managed permissions in AWS RAM. A customer managed permission is a managed permission that you create to precisely specify who can do what under which conditions for the resource types included in your resource share.

This blog post walks you through how to use customer managed permissions to tailor your resource access to meet your business and security needs. Customer managed permissions help you follow the best practice of least privilege for your resources that are shared using AWS RAM.

Considerations

Before you start, review the considerations for using customer managed permissions for supported resource types in the AWS RAM User Guide.

Solution overview

Many AWS customers share infrastructure services to accounts in an organization from a centralized infrastructure OU. The networking account in the infrastructure OU follows the best practice of least privilege and grants only the permissions that accounts receiving these resources, such as development accounts, require to perform a specific task. The solution in this post demonstrates how you can share an Amazon Virtual Private Cloud (Amazon VPC) IP Address Manager (IPAM) pool with the accounts in a Development OU. IPAM makes it simpler for you to plan, track, and monitor IP addresses for your AWS workloads.

You’ll use a networking account that owns an IPAM pool to share the pool with the accounts in a Development OU. You’ll do this by creating a resource share and a customer managed permission through AWS RAM. In this example, shown in Figure 1, both the networking account and the Development OU are in the same organization. The accounts in the Development OU only need the permissions that are required to allocate a classless inter-domain routing (CIDR) range and not to view the IPAM pool details. You’ll further refine access to the shared IPAM pool so that only AWS Identity and Access Management (IAM) users or roles tagged with team = networking can perform actions on the IPAM pool that’s shared using AWS RAM.

Figure 1: Multi-account diagram for sharing your IPAM pool from a networking account in the Infrastructure OU to accounts in the Development OU

Figure 1: Multi-account diagram for sharing your IPAM pool from a networking account in the Infrastructure OU to accounts in the Development OU

Prerequisites

For this walkthrough, you must have the following prerequisites:

  • An AWS account (the networking account) with an IPAM pool already provisioned. For this example, create an IPAM pool in a networking account named ipam-vpc-pool-use1-dev. Because you share resources across accounts in the same AWS Region using AWS RAM, provision the IPAM pool in the same Region where your development accounts will access the pool.
  • An AWS OU with the associated development accounts to share the IPAM pool with. In this example, these accounts are in your Development OU.
  • An IAM role or user with permissions to perform IPAM and AWS RAM operations in the networking account and the development accounts.

Share your IPAM pool with your Development OU with least privilege permissions

In this section, you share an IPAM pool from your networking account to the accounts in your Development OU and grant least-privilege permissions. To do that, you create a resource share that contains your IPAM pool, your customer managed permission for the IPAM pool, and the OU principal you want to share the IPAM pool with. A resource share contains resources you want to share, the principals you want to share the resources with, and the managed permissions that grant resource access to the account receiving the resources. You can add the IPAM pool to an existing resource share, or you can create a new resource share. Depending on your workflow, you can start creating a resource share either in the Amazon VPC IPAM or in the AWS RAM console.

To initiate a new resource share from the Amazon VPC IPAM console

  1. Sign in to the AWS Management Console as your networking account. For Features, select Amazon VPC IP Address Manager console.
  2. Select ipam-vpc-pool-use1-dev, which was provisioned as part of the prerequisites.
  3. On the IPAM pool detail page, choose the Resource sharing tab.
  4. Choose Create resource share.
     
Figure 2: Create resource share to share your IPAM pool

Figure 2: Create resource share to share your IPAM pool

Alternatively, you can initiate a new resource share from the AWS RAM console.

To initiate a new resource share from the AWS RAM console

  1. Sign in to the AWS Management Console as your networking account. For Services, select Resource Access Manager console.
  2. Choose Create resource share.

Next, specify the resource share details, including the name, the resource type, and the specific resource you want to share. Note that the steps of the resource share creation process are located on the left side of the AWS RAM console.

To specify the resource share details

  1. For Name, enter ipam-shared-dev-pool.
  2. For Select resource type, choose IPAM pools.
  3. For Resources, select the Amazon Resource Name (ARN) of the IPAM pool you want to share from a list of the IPAM pool ARNs you own.
  4. Choose Next.
     
Figure 3: Specify the resources to share in your resource share

Figure 3: Specify the resources to share in your resource share

Configure customer managed permissions

In this example, the accounts in the Development OU need the permissions required to allocate a CIDR range, but not the permissions to view the IPAM pool details. The existing AWS managed permission grants both read and write permissions. Therefore, you need to create a customer managed permission to refine the resource access permissions for your accounts in the Development OU. With a customer managed permission, you can select and tailor the actions that the development accounts can perform on the IPAM pool, such as write-only actions.

In this section, you create a customer managed permission, configure the managed permission name, select the resource type, and choose the actions that are allowed with the shared resource.

To create and author a customer managed permission

  1. On the Associate managed permissions page, choose Create customer managed permission. This will bring up a new browser tab with a Create a customer managed permission page.
  2. On the Create a customer managed permission page, enter my-ipam-cmp for the Customer managed permission name.
  3. Confirm the Resource type as ec2:IpamPool.
  4. On the Visual editor tab of the Policy template section, select the Write checkbox only. This will automatically check all the available write actions.
  5. Choose Create customer managed permission.
     
Figure 4: Create a customer managed permission with only write actions

Figure 4: Create a customer managed permission with only write actions

Now that you’ve created your customer managed permission, you must associate it to your resource share.

To associate your customer managed permission

  1. Go back to the previous Associate managed permissions page. This is most likely located in a separate browser tab.
  2. Choose the refresh icon .
  3. Select my-ipam-cmp from the dropdown menu.
  4. Review the policy template, and then choose Next.

Next, select the IAM roles, IAM users, AWS accounts, AWS OUs, or organization you want to share your IPAM pool with. In this example, you share the IPAM pool with an OU in your account.

To grant access to principals

  1. On the Grant access to principals page, select Allow sharing only with your organization.
  2. For Select principal type, choose Organizational unit (OU).
  3. Enter the Development OU’s ID.
  4. Select Add, and then choose Next.
  5. Choose Create resource share to complete creation of your resource share.
     
Figure 5: Grant access to principals in your resource share

Figure 5: Grant access to principals in your resource share

Verify the customer managed permissions

Now let’s verify that the customer managed permission is working as expected. In this section, you verify that the development account cannot view the details of the IPAM pool and that you can use that same account to create a VPC with the IPAM pool.

To verify that an account in your Development OU can’t view the IPAM pool details

  1. Sign in to the AWS Management Console as an account in your Development OU. For Features, select Amazon VPC IP Address Manager console.
  2. In the left navigation pane, choose Pools.
  3. Select ipam-shared-dev-pool. You won’t be able to view the IPAM pool details.

To verify that an account in your Development OU can create a new VPC with the IPAM pool

  1. Sign in to the AWS Management Console as an account in your Development OU. For Services, select VPC console.
  2. On the VPC dashboard, choose Create VPC.
  3. On the Create VPC page, select VPC only.
  4. For name, enter my-dev-vpc.
  5. Select IPAM-allocated IPv4 CIDR block.
  6. Choose the ARN of the IPAM pool that’s shared with your development account.
  7. For Netmask, select /24 256 IPs.
  8. Choose Create VPC. You’ve successfully created a VPC with the IPAM pool shared with your account in your Development OU.
     
Figure 6: Create a VPC

Figure 6: Create a VPC

Update customer managed permissions

You can create a new version of your customer managed permission to rescope and update the access granularity of your resources that are shared using AWS RAM. For example, you can add a condition in your customer managed permissions so that only IAM users or roles tagged with a particular principal tag can access and perform the actions allowed on resources shared using AWS RAM. If you need to update your customer managed permission — for example, after testing or as your business and security needs evolve — you can create and save a new version of the same customer managed permission rather than creating an entirely new customer management permission. For example, you might want to adjust your access configurations to read-only actions for your development accounts and to rescope to read-write actions for your testing accounts. The new version of the permission won’t apply automatically to your existing resource shares, and you must explicitly apply it to those shares for it to take effect.

To create a version of your customer managed permission

  1. Sign in to the AWS Management Console as your networking account. For Services, select Resource Access Manager console.
  2. In the left navigation pane, choose Managed permissions library.
  3. For Filter by text, enter my-ipam-cmp and select my-ipam-cmp. You can also select the Any type dropdown menu and then select Customer managed to narrow the list of managed permissions to only your customer managed permissions.
  4. On the my-ipam-cmp page, choose Create version.
  5. You can make the customer managed permission more fine-grained by adding a condition. On the Create a customer managed permission for my-ipam-cmp page, under the Policy template section, choose JSON editor.
  6. Add a condition with aws:PrincipalTag that allows only the users or roles tagged with team = networking to access the shared IPAM pool.
    "Condition": {
                    "StringEquals": {
                        "aws:PrincipalTag/team": "networking"
                    }
                }

  7. Choose Create version. This new version will be automatically set as the default version of your customer managed permission. As a result, new resource shares that use the customer managed permission will use the new version.
     
Figure 7: Update your customer managed permissions and add a condition statement with aws:PrincipalTag

Figure 7: Update your customer managed permissions and add a condition statement with aws:PrincipalTag

Note: Now that you have the new version of your customer managed permission, you must explicitly apply it to your existing resource shares for it to take effect.

To apply the new version of the customer managed permission to existing resource shares

  1. On the my-ipam-cmp page, under the Managed permission versions, select Version 1.
  2. Choose the Associated resource shares tab.
  3. Find ipam-shared-dev-pool and next to the current version number, select Update to default version. This will update your ipam-shared-dev-pool resource share with the new version of your my-ipam-cmp customer managed permission.

To verify your updated customer managed permission, see the Verify the customer managed permissions section earlier in this post. Make sure that you sign in with an IAM role or user tagged with team = networking, and then repeat the steps of that section to verify your updated customer managed permission. If you use an IAM role or user that is not tagged with team = networking, you won’t be able to allocate a CIDR from the IPAM pool and you won’t be able to create the VPC.

Cleanup

To remove the resources created by the preceding example:

  1. Delete the resource share from the AWS RAM console.
  2. Deprovision the CIDR from the IPAM pool.
  3. Delete the IPAM pool you created.

Summary

This blog post presented an example of using customer managed permissions in AWS RAM. AWS RAM brings simplicity, consistency, and confidence when sharing your resources across accounts. In the example, you used AWS RAM to share an IPAM pool to accounts in a Development OU, configured fine-grained resource access controls, and followed the best practice of least privilege by granting only the permissions required for the accounts in the Development OU to perform a specific task with the shared IPAM pool. In the example, you also created a new version of your customer managed permission to rescope the access granularity of your resources that are shared using AWS RAM.

To learn more about AWS RAM and customer managed permissions, see the AWS RAM documentation and watch the AWS RAM Introduces Customer Managed Permissions demo.

 
If you have feedback about this post, submit comments in the Comments section below. If you have questions about this post, contact AWS Support.

Want more AWS Security news? Follow us on Twitter.

Fabian Labat

Fabian Labat

Fabian is a principal solutions architect based in New York, where he guides global financial services customers to build highly secure, scalable, reliable, and cost-efficient applications on the cloud. He brings over 25 years of technology experience in system design and IT infrastructure.

Nini Ren

Nini Ren

Nini is the product manager for AWS Resource Access Manager (RAM). He enjoys working closely with customers to develop solutions that not only meet their needs, but also create value for their businesses. Nini holds an MBA from The Wharton School, a masters of computer and information technology from the University of Pennsylvania, and an AB in chemistry and physics from Harvard College.

Microservices discovery using Amazon EC2 and HashiCorp Consul

Post Syndicated from Marine Haddad original https://aws.amazon.com/blogs/architecture/microservices-discovery-using-amazon-ec2-and-hashicorp-consul/

These days, large organizations typically have microservices environments that span across cloud platforms, on-premises data centers, and colocation facilities. The reasons for this vary but frequently include latency, local support structures, and historic architectural decisions. However, due to the complex nature of these environments, efficient mechanisms for service discovery and configuration management must be implemented to support operations at scale. This is an issue also faced by Nomura.

Nomura is a global financial services group with an integrated network spanning over 30 countries and regions. By connecting markets East & West, Nomura services the needs of individuals, institutions, corporates, and governments through its three business divisions: Retail, Investment Management, and Wholesale (Global Markets and Investment Banking). E-Trading Strategy Foreign Exchange sits within Global Markets, and focuses on all quantitative analysis and technical aspects of electronic FX flows. The team builds out a number of innovative solutions for clients, all of which are needed to operate in an ultra-low latency environment to be competitive. The focus is to build high-quality engineered platforms that can handle all aspects of Nomura’s growing 24 hours a day, 5-and-a-half days a week FX business.

In this blog post, we share the solution we developed for Nomura and how you can build a service discovery mechanism that uses a hierarchical rule-based algorithm. We use the flexibility of Amazon Elastic Compute Cloud (Amazon EC2) and third-party software, such as SpringBoot and Consul. The algorithm supports features such as service discovery by service name, Domain Name System (DNS) latency, and custom provided tags. This can activate customers with automated deployments, since services are able to auto-discover and connect with other services. Based on provided tags, customers can implement environment boundaries so that a service doesn’t connect to an unintended service. Finally, we built a failover mechanism, so that if a service becomes unavailable, an alternative service would be provided (based on given criteria).

After reading this post, you can use the provided assets in the open source repository to deploy the solution in their sandbox environment. The Terraform and Java code that accompanies this post can be amended as needed to suit individual requirements.

Overview of solution

The solution is composed of a microservices platform that is spread over two different data centers, and a Consul cluster per data center. We use two Amazon Virtual Private Clouds (VPCs) to model geographically distributed Consul “data centers”. These VPCs are then connected via an AWS Transit Gateway. By permitting communication across the different data centers, the Consul clusters can form a wide-area network (WAN) and have visibility of service instances deployed to either. The SpringBoot microservices use the Spring Cloud Consul plugin to connect to the Consul cluster. We have built a custom configuration provider that uses Amazon EC2 instance metadata service to retrieve the configuration. The configuration provider mechanism is highly extensible, so anyone can build their own configuration provider.

The major components of this solution are:

    • Sample microservices built using Java and SpringBoot, and deployed in Amazon EC2 with one microservice instance per EC2 instance
    • A Consul cluster per Region with one Consul agent per EC2 instance
    • A custom service discovery algorithm
Multi-VPC infrastructure architecture

Figure 1. Multi-VPC infrastructure architecture

A typical flow for a microservice would be to 1/ boot up, 2/ retrieve relevant information from the EC2 Metadata Service (such as tags), and, 3/ use it to register itself with Consul. Once a service is registered with Consul it can discover services to integrate with, and it can be discovered by other services.

An important component of this service discovery mechanism is a custom algorithm that performs service discovery based on the tags created when registering the service with Consul.

Service discovery flow

Figure 2. Service discovery flow

The service flow shown in Figure 2 is as follows:

  1. The Consul agent deployed on the instance registers to the local Consul cluster, and the service registers to its Consul agent.
  2. The Trading service looks up for available Pricer services via API calls.
  3. The Consul agent returns the list of available Pricer services, so that the Trading service can query a Pricer service.

Walkthrough

Following are the steps required to deploy this solution:

  • Provision the infrastructure using Terraform. The application .jar file and the Consul configuration are deployed as part of it.
  • Test the solution.
  • Clean up AWS resources.

The steps are detailed in the next section, and the code can be found in this GitHub repository.

Prerequisites

Deployment steps

Note: The default AWS Region used in this deployment is ap-southeast-1. If you’re working in a different AWS Region, make sure to update it.

Clone the repository

First, clone the repository that contains all the deployment assets:

git clone https://github.com/aws-samples/geographical-hierarchical-service-lookup-with-consul-on-aws

Build Amazon Machine Images (AMIs)

1. Build the Consul Server AMI in AWS

Go to the ~/deployment/scripts/amis/consul-server/ directory and build the AMI by running:

packer build .

The output should look like this:

==>  Builds finished. The artifacts of successful builds are:

-->  amazon-ebs.ubuntu20-ami: AMIs were created:

ap-southeast-1: ami-12345678910

Make a note of the AMI ID. This will be used as part of the Terraform deployment.

2. Build the Consul Client AMI in AWS

Go to ~/deployment/scripts/amis/consul-client/ directory and build the AMI by running:

packer build .

The output should look like this:

==> Builds finished. The artifacts of successful builds are:

--> amazon-ebs.ubuntu20-ami: AMIs were created:

ap-southeast-1: ami-12345678910

Make a note of the AMI ID. This will be used as part of the Terraform deployment.

Prepare the deployment

There are a few steps that must be accomplished before applying the Terraform configuration.

1. Update deployment variables

    • In a text editor, go to directory ~/deployment/
    • Edit the variable file template.var.tfvars.json by adding the variables values, including the AMI IDs previously built for the Consul Server and Client

Note: The key pair name should be entered without the “.pem” extension.

2. Place the application file .jar in the root folder ~/deployment/

Deploy the solution

To deploy the solution, run the following commands from the terminal:

export  VAR_FILE=template.var.tfvars.json

terraform init && terraform plan --var-file=$VAR_FILE -out plan.out

terraform apply plan.out

Validate the deployment

All the EC2 instances have been deployed with AWS Systems Manager access, so you can connect privately to the terminal using the AWS Systems Manager Session Manager feature.

To connect to an instance:

1. Select an instance

2. Click Connect

3. Go to Session Manager tab

Using Session Manager, connect to one of the Consul servers and run the following commands:

consul members

This command shows you the list of all Consul servers and clients connected to this cluster.

consul members -wan

This command shows you the list of all Consul servers connected to this WAN environment.

To see the Consul User Interface:

1. Open your terminal and run:

aws ssm start-session --target <instanceID> --document-name AWS-StartPortForwardingSession --parameters '{"portNumber":["8500"],"localPortNumber":["8500"]}' --region <region>

Where instanceID is the AWS Instance ID of one of the Consul servers, and Region is the AWS Region.

Using System Manager Port Forwarding allows you to connect privately to the instance via a browser.

2. Open a browser and go to http://localhost:8500/ui

3. Find the Management Token ID in AWS Secrets Manager in the AWS Management Console

4. Login to the Consul UI using the Management Token ID

Test the solution

Connect to the trading instance and query the different services:

curl http://localhost:9090/v1/discover/service/pricer

curl http://localhost:9090/v1/discover/service/static-data

This deployment assumes that the Trading service queries the Pricer and Static-Data services, and that services are returned based on an order of precedence (see Table 1 following):

Service Precedence Customer Cluster Location Environment
TRADING 1 ACME ALPHA DC1 DEV
PRICER 1 ACME ALPHA DC1 DEV
PRICER 2 ACME ALPHA DC2 DEV
PRICER 3 ACME BETA DC1 DEV
PRICER 4 ACME BETA DC2 DEV
PRICER 5 SHARED ALPHA DC1 DEV
PRICER 6 SHARED ALPHA DC2 DEV
STATIC-DATA 1 SHARED SHARED DC1 DEV
STATIC-DATA 2 SHARED SHARED DC2 DEV
STATIC-DATA 2 SHARED BETA DC2 DEV
STATIC-DATA 2 SHARED GAMMA DC2 DEV
STATIC-DATA -1 STARK ALPHA DC1 DEV
STATIC-DATA -1 ACME BETA DC2 PROD

Table 1. Service order of precedence

To test the solution, switch on and off services in the AWS Management Console and repeat Trading queries to look at where the traffic is being redirected.

Cleaning up

To avoid incurring future charges, delete the solution from ~/deployment/ in the terminal:

terraform destroy --var-file=$VAR_FILE

Conclusion

In this post, we outlined the prevalent challenge of complex globally distributed microservice architectures. We demonstrated how customers can build a hierarchical service discovery mechanism to support such an environment using a combination of Amazon EC2 service and third-party software such as SpringBoot and Consul. Use this to test this solution into your sandbox environment and to see if it could bring the answer to your current challenge.

Additional resources:

Stream VPC Flow Logs to Datadog via Amazon Kinesis Data Firehose

Post Syndicated from Chaitanya Shah original https://aws.amazon.com/blogs/big-data/stream-vpc-flow-logs-to-datadog-via-amazon-kinesis-data-firehose/

It’s common to store the logs generated by customer’s applications and services in various tools. These logs are important for compliance, audits, troubleshooting, security incident responses, meeting security policies, and many other purposes. You can perform log analysis on these logs to understand users’ application behavior and patterns to make informed decisions.

When running workloads on Amazon Web Services (AWS), you need to analyze Amazon Virtual Private Cloud (Amazon VPC) Flow Logs to track the IP traffic going to and from the network interfaces for the workloads in their VPC. Analyzing VPC flow logs helps you understand how your applications are communicating over the VPC network and acts as a main source of information to the network in your VPC.

You can easily deliver data to supported destinations using the Amazon Kinesis Data Firehose integration with VPC flow logs. Kinesis Data Firehose is a fully managed service for delivering near-real-time streaming data to various destinations for storage and performing near-real-time analytics. With its extensible data transformation capabilities, you can also streamline log processing and log delivery pipelines into a single Kinesis Data Firehose delivery stream. You can perform analytics on VPC flow logs delivered from your VPC using the Kinesis Data Firehose integration with Datadog as a destination.

Datadog is a monitoring and security platform and AWS Partner Network (APN) Advanced Technology Partner with AWS Competencies in AWS Cloud Operations, DevOps, Migration, Security, Networking, Containers, and Microsoft Workloads, along with many others.

Datadog enables you to easily explore and analyze logs to gain deeper insights into the state of your applications and AWS infrastructure. You can analyze all your AWS service logs while storing only the ones you need, generate metrics from aggregated logs to uncover, and send alerts about trends in your AWS services.

In this post, you learn how to integrate VPC flow logs with Kinesis Data Firehose and deliver it to Datadog.

Solution overview

This solution uses native integration of VPC flow logs streaming to Kinesis Data Firehose. We use a Kinesis Data Firehose delivery stream to buffer the streamed VPC flow logs to a Datadog destination endpoint in your Datadog account. You can use these logs with Datadog Log Management and Datadog Cloud SIEM to analyze the health, performance, and security of your cloud resources.

The following diagram illustrates the solution architecture.

We walk you through the following high-level steps:

  1. Link your AWS account with your Datadog account.
  2. Create the Kinesis Data Firehose stream where VPC service streams the flow logs.
  3. Create the VPC flow log subscription to Kinesis Data Firehose.
  4. Visualize VPC flow logs in the Datadog dashboard.

The account ID 123456781234 used in this post is a dummy account. It is used only for demonstration purposes.

Prerequisites

You should have the following prerequisites:

Link your AWS account with your Datadog account for AWS integration

Follow the instructions provided on the Datadog website for AWS Integration. To configure log archiving and enrich the log data sent from your AWS account with useful context, link the accounts. When you complete the linking setup, proceed to the following step.

Create a Kinesis Data Firehose stream

Now that your Datadog integration with AWS is complete, you can create a Kinesis Data Firehose delivery stream where VPC Flow Logs are streamed by following these steps:

  1. On the Amazon Kinesis console, choose Kinesis Data Firehose in the navigation pane.
  2. Choose Create delivery stream.
  3. Choose Direct PUT as the source.
  4. Set Destination as Datadog.
    Create delivery stream
  1. For Delivery stream name, enter PUT-DATADOG-DEMO.
  2. Keep Data transformation set to Disabled under Transform records.
  3. In Destination settings, for HTTP endpoint URL, choose the desired log’s HTTP endpoint based on your Region and Datadog account configuration.
    Kinesis delivery stream configuration
  4. For API key, enter your Datadog API key.

This allows your delivery stream to publish VPC Flow logs to the Datadog endpoint. API keys are unique to your organization. An API key is required by the Datadog Agent to submit metrics and events to Datadog.

  1. Set Content encoding to GZIP to reduce the size of data transferred.
  2. Set the Retry duration to 60.You can change the Retry duration value if you need to. This depends on the request handling capacity of the Datadog endpoint.
    Kinesis destination settings
    Under Buffer hints, Buffer size and Buffer interval are set with default values for Datadog integration.
    Kinesis buffer settings
  1. Under Backup settings, as mentioned in the prerequisites, choose the S3 bucket that you created to store failed logs and backup with specific prefix.
  2. Under S3 buffer hints section, set Buffer size to 5 and Buffer interval to 300.

You can change the S3 buffer size and interval based on your requirements.

  1. Under S3 compression and encryption, select GZIP for Compression for data records or another compression method of your choice.

Compressing data reduces the required storage space.

  1. Select Disabled for Encryption of the data records. You can enable encryption of the data records to secure access to your logs.
    Kinesis stream backup settings
  1. Optionally, in Advanced settings, select Enable server-side encryption for source records in delivery stream.
    You can use AWS managed keys or a CMK managed by you for the encryption type.
  1. Enable CloudWatch error logging.
  2. Choose Create or update IAM role, which is created by Kinesis Data Firehose as part of this stream.
    Kinesis stream Advanced settings
  1. Choose Next.
  2. Review your settings.
  3. Choose Create delivery stream.

Create a VPC flow logs subscription

Create a VPC flow logs subscription for the Kinesis Data Firehose delivery stream you created in the previous step:

  1. On the Amazon VPC console, choose Your VPCs.
  2. Select the VPC that you to create the flow log for.
  3. On the Actions menu, choose Create flow log.
    AWS VPCs
  1. Select All to send all flow log records to the Firehose destination.

If you want to filter the flow logs, you could alternatively select Accept or Reject.

  1. For Maximum aggregation interval, select 10 minutes or the minimum setting of 1 minute if you need the flow log data to be available for near-real-time analysis in Datadog.
  2. For Destination, select Send to Kinesis Data Firehose in the same account if the delivery stream is set up on the same account where you create the VPC flow logs.

If you want to send the data to a different account, refer to Publish flow logs to Kinesis Data Firehose.

  1. Choose an option for Log record format:
  2. If you leave Log record format as the AWS default format, the flow logs are sent as version 2 format.
  3. Alternatively, you can specify the custom fields for flow logs to capture and send it to Datadog.

For more information on log format and available fields, refer to Flow log records.

  1. Choose Create flow log.
    Create VPC Flow log

Now let’s explore the VPC flow logs in Datadog.

Visualize VPC flow logs in the Datadog dashboard

In the Logs Search option in the navigation pane, filter to source:vpc. The VPC flow logs from your VPC are in the Datadog Log Explorer and are automatically parsed so you can analyze your logs by source, destination, action, or other attributes.

Datadog Logs Dashboard

Clean up

After you test this solution, delete all the resources you created to avoid incurring future charges. Refer to the following links for instructions for deleting the resources:

Conclusion

In this post, we walked through a solution of how to integrate VPC flow logs with a Kinesis Data Firehose delivery stream, deliver it to a Datadog destination with no code, and visualize it in a Datadog dashboard. With Datadog, you can easily explore and analyze logs to gain deeper insights into the state of your applications and AWS infrastructure.

Try this new, quick, and hassle-free way of sending your VPC flow logs to a Datadog destination using Kinesis Data Firehose.


About the Author

Chaitanya Shah - AWS Chaitanya Shah is a Sr. Technical Account Manager(TAM) with AWS, based out of New York. He has over 22 years of experience working with enterprise customers. He loves to code and actively contributes to the AWS solutions labs to help customers solve complex problems. He provides guidance to AWS customers on best practices for their AWS Cloud migrations. He is also specialized in AWS data transfer and the data and analytics domain.

Secure Connectivity from Public to Private: Introducing EC2 Instance Connect Endpoint

Post Syndicated from Sheila Busser original https://aws.amazon.com/blogs/compute/secure-connectivity-from-public-to-private-introducing-ec2-instance-connect-endpoint-june-13-2023/

This blog post is written by Ariana Rahgozar, Solutions Architect, and Kenneth Kitts, Sr. Technical Account Manager, AWS.

Imagine trying to connect to an Amazon Elastic Compute Cloud (Amazon EC2) instance within your Amazon Virtual Private Cloud (Amazon VPC) over the Internet. Typically, you’d first have to connect to a bastion host with a public IP address that your administrator set up over an Internet Gateway (IGW) in your VPC, and then use port forwarding to reach your destination.

Today we launched Amazon EC2 Instance Connect (EIC) Endpoint, a new feature that allows you to connect securely to your instances and other VPC resources from the Internet. With EIC Endpoint, you no longer need an IGW in your VPC, a public IP address on your resource, a bastion host, or any agent to connect to your resources. EIC Endpoint combines identity-based and network-based access controls, providing the isolation, control, and logging needed to meet your organization’s security requirements. As a bonus, your organization administrator is also relieved of the operational overhead of maintaining and patching bastion hosts for connectivity. EIC Endpoint works with the AWS Management Console and AWS Command Line Interface (AWS CLI). Furthermore, it gives you the flexibility to continue using your favorite tools, such as PuTTY and OpenSSH.

In this post, we provide an overview of how the EIC Endpoint works and its security controls, guide you through your first EIC Endpoint creation, and demonstrate how to SSH to an instance from the Internet over the EIC Endpoint.

EIC Endpoint product overview

EIC Endpoint is an identity-aware TCP proxy. It has two modes: first, AWS CLI client is used to create a secure, WebSocket tunnel from your workstation to the endpoint with your AWS Identity and Access Management (IAM) credentials. Once you’ve established a tunnel, you point your preferred client at your loopback address (127.0.0.1 or localhost) and connect as usual. Second, when not using the AWS CLI, the Console gives you secure and seamless access to resources inside your VPC. Authentication and authorization is evaluated before traffic reaches the VPC. The following figure shows an illustration of a user connecting via an EIC Endpoint:

Figure 1 shows a user connecting to private EC2 instances within a VPC through an EIC Endpoint

Figure 1. User connecting to private EC2 instances through an EIC Endpoint

EIC Endpoints provide a high degree of flexibility. First, they don’t require your VPC to have direct Internet connectivity using an IGW or NAT Gateway. Second, no agent is needed on the resource you wish to connect to, allowing for easy remote administration of resources which may not support agents, like third-party appliances. Third, they preserve existing workflows, enabling you to continue using your preferred client software on your local workstation to connect and manage your resources. And finally, IAM and Security Groups can be used to control access, which we discuss in more detail in the next section.

Prior to the launch of EIC Endpoints, AWS offered two key services to help manage access from public address space into a VPC more carefully. First is EC2 Instance Connect, which provides a mechanism that uses IAM credentials to push ephemeral SSH keys to an instance, making long-lived keys unnecessary. However, until now EC2 Instance Connect required a public IP address on your instance when connecting over the Internet. With this launch, you can use EC2 Instance Connect with EIC Endpoints, combining the two capabilities to give you ephemeral-key-based SSH to your instances without exposure to the public Internet. As an alternative to EC2 Instance Connect and EIC Endpoint based connectivity, AWS also offers Systems Manager Session Manager (SSM), which provides agent-based connectivity to instances. SSM uses IAM for authentication and authorization, and is ideal for environments where an agent can be configured to run.

Given that EIC Endpoint enables access to private resources from public IP space, let’s review the security controls and capabilities in more detail before discussing creating your first EIC Endpoint.

Security capabilities and controls

Many AWS customers remotely managing resources inside their VPCs from the Internet still use either public IP addresses on the relevant resources, or at best a bastion host approach combined with long-lived SSH keys. Using public IPs can be locked down somewhat using IGW routes and/or security groups. However, in a dynamic environment those controls can be hard to manage. As a result, careful management of long-lived SSH keys remains the only layer of defense, which isn’t great since we all know that these controls sometimes fail, and so defense-in-depth is important. Although bastion hosts can help, they increase the operational overhead of managing, patching, and maintaining infrastructure significantly.

IAM authorization is required to create the EIC Endpoint and also to establish a connection via the endpoint’s secure tunneling technology. Along with identity-based access controls governing who, how, when, and how long users can connect, more traditional network access controls like security groups can also be used. Security groups associated with your VPC resources can be used to grant/deny access. Whether it’s IAM policies or security groups, the default behavior is to deny traffic unless it is explicitly allowed.

EIC Endpoint meets important security requirements in terms of separation of privileges for the control plane and data plane. An administrator with full EC2 IAM privileges can create and control EIC Endpoints (the control plane). However, they cannot use those endpoints without also having EC2 Instance Connect IAM privileges (the data plane). Conversely, DevOps engineers who may need to use EIC Endpoint to tunnel into VPC resources do not require control-plane privileges to do so. In all cases, IAM principals using an EIC Endpoint must be part of the same AWS account (either directly or by cross-account role assumption). Security administrators and auditors have a centralized view of endpoint activity as all API calls for configuring and connecting via the EIC Endpoint API are recorded in AWS CloudTrail. Records of data-plane connections include the IAM principal making the request, their source IP address, the requested destination IP address, and the destination port. See the following figure for an example CloudTrail entry.

Figure 2 shows a sample cloud trail entry for SSH data-plane connection for an IAMUser. Specific entry:  Figure 2. Partial CloudTrail entry for an SSH data-plane connection

EIC Endpoint supports the optional use of Client IP Preservation (a.k.a Source IP Preservation), which is an important security consideration for certain organizations. For example, suppose the resource you are connecting to has network access controls that are scoped to your specific public IP address, or your instance access logs must contain the client’s “true” IP address. Although you may choose to enable this feature when you create an endpoint, the default setting is off. When off, connections proxied through the endpoint use the endpoint’s private IP address in the network packets’ source IP field. This default behavior allows connections proxied through the endpoint to reach as far as your route tables permit. Remember, no matter how you configure this setting, CloudTrail records the client’s true IP address.

EIC Endpoints strengthen security by combining identity-based authentication and authorization with traditional network-perimeter controls and provides for fine-grained access control, logging, monitoring, and more defense in depth. Moreover, it does all this without requiring Internet-enabling infrastructure in your VPC, minimizing the possibility of unintended access to private VPC resources.

Getting started

Creating your EIC Endpoint

Only one endpoint is required per VPC. To create or modify an endpoint and connect to a resource, a user must have the required IAM permissions, and any security groups associated with your VPC resources must have a rule to allow connectivity. Refer to the following resources for more details on configuring security groups and sample IAM permissions.

The AWS CLI or Console can be used to create an EIC Endpoint, and we demonstrate the AWS CLI in the following. To create an EIC Endpoint using the Console, refer to the documentation.

Creating an EIC Endpoint with the AWS CLI

To create an EIC Endpoint with the AWS CLI, run the following command, replacing [SUBNET] with your subnet ID and [SG-ID] with your security group ID:

aws ec2 create-instance-connect-endpoint \
    --subnet-id [SUBNET] \
    --security-group-id [SG-ID]

After creating an EIC Endpoint using the AWS CLI or Console, and granting the user IAM permission to create a tunnel, a connection can be established. Now we discuss how to connect to Linux instances using SSH. However, note that you can also use the OpenTunnel API to connect to instances via RDP.

Connecting to your Linux Instance using SSH

With your EIC Endpoint set up in your VPC subnet, you can connect using SSH. Traditionally, access to an EC2 instance using SSH was controlled by key pairs and network access controls. With EIC Endpoint, an additional layer of control is enabled through IAM policy, leading to an enhanced security posture for remote access. We describe two methods to connect via SSH in the following.

One-click command

To further reduce the operational burden of creating and rotating SSH keys, you can use the new ec2-instance-connect ssh command from the AWS CLI. With this new command, we generate ephemeral keys for you to connect to your instance. Note that this command requires use of the OpenSSH client. To use this command and connect, you need IAM permissions as detailed here.

Once configured, you can connect using the new AWS CLI command, shown in the following figure:
Figure 3 shows the AWS CLI view if successfully connecting to your instance using the one-click command. When running the command, you are prompted to connect and can access your instance.

Figure 3. AWS CLI view upon successful SSH connection to your instance

To test connecting to your instance from the AWS CLI, you can run the following command where [INSTANCE] is the instance ID of your EC2 instance:

aws ec2-instance-connect ssh --instance-id [INSTANCE]

Note that you can still use long-lived SSH credentials to connect if you must maintain existing workflows, which we will show in the following. However, note that dynamic, frequently rotated credentials are generally safer.

Open-tunnel command

You can also connect using SSH with standard tooling or using the proxy command. To establish a private tunnel (TCP proxy) to the instance, you must run one AWS CLI command, which you can see in the following figure:

Figure 4 shows the AWS CLI view after running the aws ec2-instance-connect open-tunnel command and connecting to your instance.Figure 4. AWS CLI view after running new SSH open-tunnel command, creating a private tunnel to connect to our EC2 instance

You can run the following command to test connectivity, where [INSTANCE] is the instance ID of your EC2 instance and [SSH-KEY] is the location and name of your SSH key. For guidance on the use of SSH keys, refer to our documentation on Amazon EC2 key pairs and Linux instances.

ssh ec2-user@[INSTANCE] \
    -i [SSH-KEY] \
    -o ProxyCommand='aws ec2-instance-connect open-tunnel \
    --instance-id %h'

Once we have our EIC Endpoint configured, we can SSH into our EC2 instances without a public IP or IGW using the AWS CLI.

Conclusion

EIC Endpoint provides a secure solution to connect to your instances via SSH or RDP in private subnets without IGWs, public IPs, agents, and bastion hosts. By configuring an EIC Endpoint for your VPC, you can securely connect using your existing client tools or the Console/AWS CLI. To learn more, visit the EIC Endpoint documentation.

AWS Week in Review – New Open-Source Updates for Snapchange, Cedar, and Jupyter Community Contributions – May 15, 2023

Post Syndicated from Channy Yun original https://aws.amazon.com/blogs/aws/aws-week-in-review-new-open-source-updates-for-snapchange-cedar-and-jupyter-community-contributions-may-15-2023/

A new week has begun. Last week, there was a lot of news related to AWS. I have compiled a few announcements you need to know. Let’s get started right away!

Last Week’s Launches
Let’s take a look at some launches from the last week that I want to remind you of:

New Amazon EC2 I4g Instances – Powered by AWS Graviton2 processors, Amazon Elastic Compute Cloud (Amazon EC2) I4g instances improve real-time storage performance up to 2x compared to prior generation storage-optimized instances. Based on AWS Nitro SSDs that are custom-built by AWS and reduce both latency and latency variability, I4g instances are optimized for workloads that perform a high mix of random read/write and require very low I/O latency, such as transactional databases and real-time analytics. To learn more, see Jeff’s post.

Amazon Aurora I/O-Optimized – You can now choose between two storage configurations for Amazon Aurora DB clusters: Aurora Standard or Aurora I/O-Optimized. For applications with low-to-moderate I/Os, Aurora Standard is a cost-effective option.

For applications with high I/Os, Aurora I/O-Optimized provides improved price performance, predictable pricing, and up to 40 percent costs savings. To learn more, see my full blog post.

AWS Management Console Private Access – This is a new security feature that allows you to limit access to the AWS Management Console from your Virtual Private Cloud (VPC) or connected networks to a set of trusted AWS accounts and organizations. It is built on VPC endpoints, which use AWS PrivateLink to establish a private connection between your VPC and the console.

https://docs.aws.amazon.com/images/awsconsolehelpdocs/latest/gsg/images/console-private-access-verify.png

AWS Management Console Private Access is useful when you want to prevent users from signing in to unexpected AWS accounts from within your network. To learn more, see the AWS Management Console getting started guide.

One-Click Security Protection on the Amazon CloudFront Console – You can now secure your web applications and APIs with AWS WAF with a single click on the Amazon CloudFront console. CloudFront handles creating and configuring AWS WAF for you with out-of-the-box protections recommended by AWS and this simple and convenient way to protect applications at the time you create or edit your distribution.

You may continue to select a preconfigured AWS WAF web access control list (ACL) when you prefer to use an existing web ACL. To learn more, see Using AWS WAF to control access to your content in the AWS documentation.

Tracing AWS Lambda SnapStart Functions with AWS X-Ray – You can use AWS X-Ray traces to gain deeper visibility into your function’s performance and execution lifecycle, helping you identify errors and performance bottlenecks for your latency-sensitive Java applications built using SnapStart-enabled functions.

With X-Ray support for SnapStart-enabled functions, you can now see trace data about the restoration of the execution environment and execution of your function code. You can enable X-Ray for Java-based SnapStart-enabled Lambda functions running on Amazon Corretto 11 or 17. To learn more about X-Ray for SnapStart-enabled functions, visit the Lambda Developer Guide or read Marcia’s blog post.

For a full list of AWS announcements, be sure to keep an eye on the What’s New at AWS page.

Open Source Updates
Last week, we introduced new open-source projects and significant roadmap contributions to the Jupyter community.

Snapchange – Snapchange is a new open-source project to make fuzzing of a memory snapshot easier using KVM written by Rust. Snapchange enables a target binary to be fuzzed with minimal modifications, providing useful introspection that aids in fuzzing. Snapchange utilizes the features of the Linux kernel’s built-in virtual machine manager known as kernel virtual machine or KVM. To learn more, see the announcement post and GitHub repository.

Cedar – Cedar is a new open-source language for defining permissions as policies, which describes who should have access to what, and evaluating those policies. You can use Cedar to control access to resources such as photos in a photo-sharing app, compute nodes in a microservices cluster, or components in a workflow automation system. Cedar is also authorization-policy language used by the Amazon Verified Permissions, a scalable, fine-grained permissions management and authorization service for custom applications and AWS Verified Access managed services to validate each application request before granting access. To learn more, see the announcement post , Amazon Science blog post and Cedar playground to test sample policies.

Jupyter Community Contributions – We announced new contributions to Jupyter community to democratize generative artificial intelligence (AI) and scale machine learning (ML) workloads. We contributed two Jupyter extensions – Jupyter AI to bring generative AI to Jupyter notebooks and Amazon CodeWhisperer Jupyter extension to generate code suggestions for Python notebooks in JupyterLab. We also contributed three new capabilities to help you scale ML development faster: notebooks scheduling, SageMaker open-source distribution, and Amazon CodeGuru Jupyter extension. To learn more, see the announcement post and Jupyter on AWS.

To learn about weekly updates for open source at AWS, check out the latest AWS open source newsletter by Ricardo.

Upcoming AWS Events
Check your calendars and sign up for these AWS-led events:

AWS Serverless Innovation Day on May 17 – Join us for a free full-day virtual event to learn about AWS Serverless technologies and event-driven architectures from customers, experts, and leaders. Marcia outlined the agenda and main topics of this event in her post. You can register on the event page.

AWS Data Insights Day on May 24 – Join us for another virtual event to discover ways to innovate faster and more cost-effectively with data. Whether your data is stored in operational data stores, data lakes, streaming engines, or within your data warehouse, Amazon Redshift helps you achieve the best performance with the lowest spend. This event focuses on customer voices, deep-dive sessions, and best practices of Amazon Redshift. You can register on the event page.

AWS Silicon Innovation Day on June 21 – Join AWS leaders and experts showcasing AWS innovations in custom-designed EC2 chips built for high performance and scale in the cloud. AWS has designed and developed purpose-built silicon specifically for the cloud. You can understand AWS Silicons and how they can use AWS’s unique EC2 chip offerings to their benefit. You can register on the event page.

AWS re:Inforce 2023 – You can still register for AWS re:Inforce, in Anaheim, California, June 13–14.

AWS Global Summits – Sign up for the AWS Summit closest to your city: Hong Kong (May 23), India (May 25), Amsterdam (June 1), London (June 7), Washington DC (June 7-8), Toronto (June 14), Madrid (June 15), and Milano (June 22).

AWS Community Day – Join community-led conferences driven by AWS user group leaders closest to your city: Chicago (June 15), and Philippines (June 29–30).

You can browse all upcoming AWS-led in-person and virtual events, and developer-focused events such as AWS DevDay.

That’s all for this week. Check back next Monday for another Week in Review!

Channy

This post is part of our Week in Review series. Check back each week for a quick roundup of interesting news and announcements from AWS!

A walk through AWS Verified Access policies

Post Syndicated from Riggs Goodman III original https://aws.amazon.com/blogs/security/a-walk-through-aws-verified-access-policies/

AWS Verified Access helps improve your organization’s security posture by using security trust providers to grant access to applications. This service grants access to applications only when the user’s identity and the user’s device meet configured security requirements. In this blog post, we will provide an overview of trust providers and policies, then walk through a Verified Access policy for securing your corporate applications.

Understanding trust data and policies

Verified Access policies enable you to use trust data from trust providers and help protect access to corporate applications that are hosted on Amazon Web Services (AWS). When you create a Verified Access group or a Verified Access endpoint, you create a Verified Access policy, which is applied to the group or both the group and endpoint. Policies are written in Cedar, an AWS policy language. With Verified Access, you can express policies that use the trust data from the trust providers that you configure, such as corporate identity providers and device security state providers.

Verified Access receives trust data or claims from different trust providers. Currently, Verified Access supports two types of trust providers. The first type is an identity trust provider. Identity trust providers manage the identities of digital users, including the user’s email address, groups, and profile information. The second type of trust provider is a device trust provider. Device trust providers manage the device posture for users, including the OS version of the device, risk scores, and other metrics that reflect device posture. When a user makes a request to Verified Access, the request includes claims from the configured trust providers. Verified Access customers permit or forbid access to applications by evaluating the claims in Cedar policies. We will walk through the types of claims that are included from trust providers and the options for custom trust data.

End-to-end Cedar policy use cases

Let’s look at how to use policies with your applications. In general, you use Verified Access to control access to an application for purposes of authentication and initial authorization. This means that you use Verified Access to authenticate the user when they log in and to confirm that the device posture of the end device meets minimum criteria. For authorization logic to control access to actions and resources inside the application, you pass the identity claims to the application. The application uses the information to authorize users within the application after authentication. In other words, not every identity claim needs to be passed or checked in Verified Access to allow traffic to pass to the application. You can and should put additional logic in place to make decisions for users when they gain access to the backend application after initial authentication and authorization by Verified Access. From an identity perspective, this additional criteria might be an email address, a group, and possibly some additional claims. From a device perspective, Verified Access does not at this time pass device trust data to the end application. This means that you should use Verified Access to perform checks involving device posture.

We will explore the evolution of a policy by walking you through four use cases for Cedar policy. You can test the claim data and policies in the Verified Access Cedar Playground. For more information about Verified Access, see Verified Access policies and types of trust providers.

Use case 1: Basic policy

For many applications, you only need a simple policy to provide access to your users. This can include the identity information only. For example, let’s say that you want to write a policy that uses the user’s email address and matches a certain group that the user is part of. Within the Verified Access trust provider configuration, you can include “openid email groups” as the scope, and your OpenID Connect (OIDC) provider will include each claim associated with the scopes that you have configured with the OIDC provider. When the user John in this example uses case logs in to the OIDC provider, he receives the following claims from the OIDC provider. For this provider, the Verified Access Trust Provider is configured for “identity” to be the policy reference name.

{
  "identity": {
    "email": "[email protected]",
    "groups": [
      "finance",
      "employees"
    ]
  }
}

With these claims, you can write a policy that matches the email domain and the group, to allow access to the application, as follows.

permit(principal, action, resource)
when {
    // Returns true if the email ends in "@example.com"
    context.identity.email like "*@example.com" &&
    // Returns true if the user is part of the "finance" group
    context.identity.groups.contains("finance")
};

Use case 2: Custom claims within a policy

Many times, you are also interested in company-specific or custom claims from the identity provider. The claims that exist with the user endpoint are dependent on how you configure the identity provider. For OIDC providers, this is determined by the scopes that you define when you set up the identity provider. Verified Access uses OIDC scopes to authorize access to details of the user. This includes attributes such as the name, email address, email verification, and custom attributes. Each scope that you configure for the identity provider returns a set of user attributes, which we call claims. Depending on which claims you want to match on in your policy, you configure the scopes and claims in the OIDC provider, which the OIDC provider adds to the user endpoint. For a list of standard claims, including profile, email, name, and others, see the Standard Claims OIDC specification.

In this example use case, as your policy evolves from the basic policy, you decide to add additional company-specific claims to Verified Access. This includes both the business unit and the level of each employee. Within the Verified Access trust provider configuration, you can include “openid email groups profile” as the scope, and your OIDC provider will include each claim associated with the scopes that you have configured with the OIDC provider. Now, when the user John logs in to the OIDC provider, he receives the following claims from the OIDC provider, with both the business unit and role as claims from the “profile” scope in OIDC.

{
  "identity": {
    "email": "[email protected]",
    "groups": [
      "finance",
      "employees"
    ],
    "business_unit": "corp",
    "level": 8
  }
}

With these claims, the company can write a policy that matches the claims to allow access to the application, as follows.

permit(principal, action, resource)
when {
    // Returns true if the email ends in "@example.com"
    context.identity.email like "*@example.com" &&
    // Returns true if the user is part of the "finance" group
    context.identity.groups.contains("finance") &&
    // Returns true if the business unit is "corp"
    context.identity.business_unit == "corp" &&
    // Returns true if the level is greater than 6
    context.identity.level >= 6
};

Use case 3: Add a device trust provider to a policy

The other type of trust provider is a device trust provider. Verified Access supports two device trust providers today: CrowdStrike and Jamf. As detailed in the AWS Verified Access Request Verification Flow, for HTTP/HTTPS traffic, the extension in the web browser receives device posture information from the device agent on the user’s device. Each device trust provider determines what risk information and device information to include in the claims and how that information is formatted. Depending on the device trust provider, the claims are static or configurable.

In our example use case, with the evolution of the policy, you now add device trust provider checks to the policy. After you install the Verified Access browser extension on John’s computer, Verified Access receives the following claims from both the identity trust provider and the device trust provider, which uses the policy reference name “crwd”.

{
  "identity": {
    "email": "[email protected]",
    "groups": [
      "finance",
      "employees"
    ],
    "business_unit": "corp",
    "level": 8
  },
  "crwd": {
    "assessment": {
      "overall": 90,
      "os": 100,
      "sensor_config": 80,
      "version": "3.4.0"
    }
  }
}

With these claims, you can write a policy that matches the claims to allow access to the application, as follows.

permit(principal, action, resource)
when {
    // Returns true if the email ends in "@example.com"
    context.identity.email like "*@example.com" &&
    // Returns true if the user is part of the "finance" group
    context.identity.groups.contains("finance") &&
    // Returns true if the business unit is "corp"
    context.identity.business_unit == "corp" &&
    // Returns true if the level is greater than 6
    context.identity.level >= 6 &&
    // If the CrowdStrike agent is present
    ( context has "crwd" &&
      // The overall device score is greater or equal to 80 
      context.crwd.assessment.overall >= 80 )
};

For more information about these scores, see Third-party trust providers.

Use case 4: Multiple device trust providers

The final update to your policy comes in the form of multiple device trust providers. Verified Access provides the ability to match on multiple device trust providers in the same policy. This provides flexibility for your company, which in this example use case has different device trust providers installed on different types of users’ devices. For information about many of the claims that each device trust provider provides to AWS, see Third-party trust providers. However, for this updated policy, John’s claims do not change, but the new policy can match on either CrowdStrike’s or Jamf’s trust data. For Jamf, the policy reference name is “jamf”.

permit(principal, action, resource)
when {
    // Returns true if the email ends in "@example.com"
    context.identity.email like "*@example.com" &&
    // Returns true if the user is part of the "finance" group
    context.identity.groups.contains("finance") &&
    // Returns true if the business unit is "corp"
    context.identity.business_unit == "corp" &&
    // Returns true if the level is greater than 6
    context.identity.level >= 6 &&
    // If the CrowdStrike agent is present
    (( context has "crwd" &&
      // The overall device score is greater or equal to 80 
      context.crwd.assessment.overall >= 80 ) ||
    // If the Jamf agent is present
    ( context has "jamf" &&
      // The risk level is either LOW or SECURE
      ["LOW","SECURE"].contains(context.jamf.risk) ))
};

For more information about using Jamf with Verified Access, see Integrating AWS Verified Access with Jamf Device Identity.

Conclusion

In this blog post, we covered an overview of Cedar policy for AWS Verified Access, discussed the types of trust providers available for Verified Access, and walked through different use cases as you evolve your Cedar policy in Verified Access.

If you want to test your own policies and claims, see the Cedar Playground. If you want more information about Verified Access, see the AWS Verified Access documentation.

Want more AWS Security news? Follow us on Twitter.

Riggs Goodman III

Riggs Goodman III

Riggs Goodman III is the Senior Global Tech Lead for the Networking Partner Segment at Amazon Web Services (AWS). Based in Atlanta, Georgia, Riggs has over 17 years of experience designing and architecting networking solutions for both partners and customers.

Bashuman Deb

Bashuman Deb

Bashuman is a Principal Software Development Engineer with Amazon Web Services. He loves to create delightful experiences for customers when they interact with the AWS Network. He loves dabbling with software-defined-networks and virtualized multi-tenant implementations of network-protocols. He is baffled by the complexities of keeping global routing meshes in sync.

Best Practices for managing data residency in AWS Local Zones using landing zone controls

Post Syndicated from Sheila Busser original https://aws.amazon.com/blogs/compute/best-practices-for-managing-data-residency-in-aws-local-zones-using-landing-zone-controls/

This blog post is written by Abeer Naffa’, Sr. Solutions Architect, Solutions Builder AWS, David Filiatrault, Principal Security Consultant, and Jared Thompson Hybrid Edge SA Specialist.

In this post, we discuss how you can leverage AWS Control Tower landing zone and AWS Organizations custom policies – guardrails – at the root level, known as Service Control Policies (SCPS) to enable certain data residency requirements on AWS Local Zones. Using the suggested controls lets you limit the ability to store data, process data outside a geographic location, and keep your data within specific Local Zone(s).

Data residency is a critical consideration for organizations that collect and store sensitive information, such as Personal Identifiable Information (PII), financial data, and healthcare data. With the rise of cloud computing and the global nature of the Internet, it can be challenging for organizations to make sure that their data is being stored and processed in compliance with local laws and regulations.

One potential solution for addressing data residency challenges with AWS is utilizing Local Zones, which places AWS infrastructure in large metro areas. This enables organizations to store and process data in specific geographic locations. By using Local Zones, organizations can architect their environment to meet data residency requirements when an AWS Region is unavailable within the same legal jurisdiction. Local Zones can be configured to utilize landing zone to further adhere to data residency requirements.

A landing zone is a well-architected, multi-account AWS environment that is scalable and secure. This is a starting point from which your organization can quickly launch and deploy workloads and applications with confidence in your security and infrastructure environment.

When leveraging a Local Zone to meet data residency requirements, you must have control over the in-scope data movement from the Local Zones to the AWS Region. This can be accomplished by implementing landing zone best practices and the suggested guardrails. The main focus of this post is the custom policies that restrict data snapshots, prohibit data creation within the Region, and limit data transfer to the Region. Furthermore, this post covers which prerequisites organizations should consider before implementing these guardrails.

Prerequisites

Landing zones best practices and custom guardrails can help when data must remain in a specific locality where the Local Zone is also located. This can be completed by defining and enforcing policies for data storage and usage within the landing zone organization that you set up. The following prerequisites should be considered before implementing the suggested guardrails:

  1. AWS Local Zones

Local Zones are enabled through the Amazon Elastic Compute Cloud (Amazon EC2) console or the AWS Command Line Interface (AWS CLI).

You can start using available AWS services on the designated Local Zone directly from the console. Moreover, you can manage the Local Zone using the same tools and interfaces that you use in AWS Region.

2. AWS Control Tower landing zone

AWS Control Tower is a managed service that provides a pre-packaged set of best-practice blueprints for setting up and governing multi-account AWS environments. You must have Control Tower fully implemented in your environment before you can deploy custom guardrails.

Control Tower launches a key resource associated with your account, called a landing zone, which serves as a home for your organizations and their accounts.

Note that Control Tower relies on Organizations to create and manage multi-account structures.

  1. Set up the data residency guardrails

Using Organizations, you must make sure that the Local Zone is enabled within a workload account in the landing zones.

Figure 1 Landing Zones Accelerator Local Zones workload on AWS high level Architecture

Figure 1: Landing Zones Accelerator – Local Zones workload on AWS high level Architecture

Utilizing Local Zones for regulated components

The availability of Local Zones provides an excellent opportunity to meet data residency requirements and comply with local regulations that restrict the use of the Region outside of your required geo-political boundary. By leveraging Local Zones, organizations can maintain compliance while utilizing AWS services to support their business needs. AWS owns and manages the infrastructure, including hardware, software, and networking for Local Zones. However, as part of the shared responsibility model, customers are responsible for the security of their applications and data, including access control, data encryption, etc.

You must also comply with all applicable regulations and security standards, such as HIPAA, PCI DSS, and GDPR. You should conduct regular security assessments and implement appropriate security controls to protect their applications and data.

In this post, we consider a scenario where there is a single Local Zones location in a metro. However, you must analyze the specific requirements of your workloads and the relevant regulations that apply to determine the most appropriate high availability configurations for your case.

Local Zones workload data residency guardrails

Organizations provides central governance and management for multiple accounts. Central security administrators use SCPs with Organizations to establish controls to which all AWS Identity and Access Management (IAM) principals (users and roles) adhere.

Now you can use SCPs to set permission guardrails. The suggested preventative controls that leverage the implementation of SCPs for data residency on Local Zones are shown in the next paragraph. SCPs let you set permission guardrails by defining the maximum available permissions for IAM entities in an account and all accounts within the Organization root or Organizational Unit (OU). If an SCP denies an action for an account, then none of the entities in any member account, including the member account’s root user, can take that action, even if their IAM permissions let them. The guardrails set in SCPs apply to all IAM entities in the account, which include all users, roles, and the account root user.

 Upon finalizing these prerequisites, you can create the guardrails for the chosen OU.

Note that although the following guidelines serve as helpful guardrails – SCPs – for data residency, you should consult internally with legal and security teams for specific organizational requirements.

 To exercise better control over the workload in Local Zones and prevent data transfer from Local Zones or data storage outside of the Local Zones, consider implementing the following guardrails:

  1. When your data residency requirements require restricting data transfer/saving to the Region, consider the following guardrails:

a. Deny copying data from Local Zones to the Region for Amazon EC2), Amazon Relational Database Service (Amazon RDS), Amazon ElastiCache, and data sync “DenyCopyToRegion”.

As the available services in Local Zones can vary based on location, you must review the services available in the chosen Local Zone and Adjust the SCPs accordingly.

b. Deny Amazon Simple Storage Service (Amazon S3) put action to the Region “DenyPutObjectToRegionalBuckets”.

If your data residency requirements mandate restrictions on data storage in the Region, then consider implementing this guardrail to prevent the use of Amazon S3 in the Region.

c. If your data residency requirements mandate restrictions on data storage in the Region, then consider implementing “DenyDirectTransferToRegion”

Out of Scope is metadata such as tags or operational data such as AWS Key Management Service (AWS KMS) keys.

{
  "Version": "2012-10-17",
  "Statement": [
      {
      "Sid": "DenyCopyToRegion",
      "Action": [
        "ec2:ModifyImageAttribute",
        "ec2:CopyImage",  
        "ec2:CreateImage",
        "ec2:CreateInstanceExportTask",
        "ec2:ExportImage",
        "ec2:ImportImage",
        "ec2:ImportInstance",
        "ec2:ImportSnapshot",
        "ec2:ImportVolume",
        "rds:CreateDBSnapshot",
        "rds:CreateDBClusterSnapshot",
        "rds:ModifyDBSnapshotAttribute",
        "elasticache:CreateSnapshot",
        "elasticache:CopySnapshot",
        "datasync:Create*",
        "datasync:Update*"
      ],
      "Resource": "*",
      "Effect": "Deny"
    },
    {
      "Sid": "DenyDirectTransferToRegion",
      "Action": [
        "dynamodb:PutItem",
        "dynamodb:CreateTable",
        "ec2:CreateTrafficMirrorTarget",
        "ec2:CreateTrafficMirrorSession",
        "rds:CreateGlobalCluster",
        "es:Create*",
        "elasticfilesystem:C*",
        "elasticfilesystem:Put*",
        "storagegateway:Create*",
        "neptune-db:connect",
        "glue:CreateDevEndpoint",
        "glue:UpdateDevEndpoint",
        "datapipeline:CreatePipeline",
        "datapipeline:PutPipelineDefinition",
        "sagemaker:CreateAutoMLJob",
        "sagemaker:CreateData*",
        "sagemaker:CreateCode*",
        "sagemaker:CreateEndpoint",
        "sagemaker:CreateDomain",
        "sagemaker:CreateEdgePackagingJob",
        "sagemaker:CreateNotebookInstance",
        "sagemaker:CreateProcessingJob",
        "sagemaker:CreateModel*",
        "sagemaker:CreateTra*",
        "sagemaker:Update*",
        "redshift:CreateCluster*",
        "ses:Send*",
        "ses:Create*",
        "sqs:Create*",
        "sqs:Send*",
        "mq:Create*",
        "cloudfront:Create*",
        "cloudfront:Update*",
        "ecr:Put*",
        "ecr:Create*",
        "ecr:Upload*",
        "ram:AcceptResourceShareInvitation"
      ],
      "Resource": "*",
      "Effect": "Deny"
    },
    {
      "Sid": "DenyPutObjectToRegionalBuckets",
      "Action": [
        "s3:PutObject"
      ],
      "Resource": ["arn:aws:s3:::*"],
      "Effect": "Deny"
    }
  ]
}
  1. If your data residency requirements require limitations on data storage in the Region, then consider implementing this guardrail “DenyAllSnapshots” to restrict the use of snapshots in the Region.

Note that the following guardrail restricts the creation of snapshots on AWS Outposts as well. If you’re using Outposts in the same AWS account, then you may need to customize this guardrail to make sure that it aligns with your organization’s specific needs and requirements. For more information on data residency considerations for Outposts, please refer to Architecting for data residency with AWS Outposts rack and landing zone guardrails.

{
  "Version": "2012-10-17",
  "Statement": [

    {
      "Sid": "DenyAllSnapshots",
      "Effect":"Deny",
      "Action":[
        "ec2:CreateSnapshot",
        "ec2:CreateSnapshots",
        "ec2:CopySnapshot",
        "ec2:ModifySnapshotAttribute"
      ],
      "Resource":"arn:aws:ec2:*::snapshot/*"
    }
  ]
}
  1. This guardrail helps prevent the launch of EC2 instances or the creation of network interfaces by subnet as opposed to Local Zones You should keep data residency workloads within the Local Zones rather than the Region to make sure of better control over regulated workloads. This approach can help your organization achieve better control over data residency workloads and improve governance over your Organization.

 Make sure to update the Local Zones subnets < localzones_subnet_arns>.

{
"Version": "2012-10-17",
  "Statement":[{
    "Sid": "DenyNotLocalZonesSubnet",
    "Effect":"Deny",
    "Action": [
      "ec2:RunInstances",
      "ec2:CreateNetworkInterface"
    ],
    "Resource": [
      "arn:aws:ec2:*:*:network-interface/*"
    ],
    "Condition": {
      "ForAllValues:ArnNotEquals": {
        "ec2:Subnet": ["<localzones_subnet_arns>"]
      }
    }
  }]
}

Additional considerations

When implementing data residency guardrails on Local Zones, consider backup and disaster recovery strategies to make sure that your data is protected in the event of an outage or other unexpected events. This may include creating regular backups of your data, implementing disaster recovery plans and procedures, and using redundancy and failover systems to minimize the impact of any potential disruptions. Additionally, you should make sure that your backup and disaster recovery systems are compliant with any relevant data residency regulations and requirements. You should also test your backup and disaster recovery systems regularly to make sure that they are functioning as intended.

Additionally, the provided SCPs for Local Zones in the above example do not block the “logs:PutLogEvents”. Therefore, even if you implemented data residency guardrails on Local Zones, the application may log data to Amazon CloudWatch Logs in the Region.

Highlights

By default, application-level logs on Local Zones are not automatically sent to CloudWatch Logs in the Region. You can configure CloudWatch Logs agent on Local Zones to collect and send your application-level logs to CloudWatch Logs.

logs:PutLogEvents does transmit data to the Region, but it is not blocked by the provided SCPs, as it’s expected that most use cases still want to be able to use this logging API. However, if blocking is desired, then add the action to the first recommended guardrail. If you want specific roles to be allowed, then combine with the ArnNotLike condition example referenced in the Customization Guide.

Conclusion

The combined use of Local Zones and the suggested guardrails via Organizations policies enables you to exercise better control over the movement of the data. By creating a landing zone for your organization, you can apply SCPs to your Local Zones that will help make sure that your data remains within a specific geographic location, as required by the data residency regulations.

Note that, although custom guardrails can help you manage data residency on Local Zones, it’s critical to thoroughly review your policies, procedures, and configurations. This lets you make sure that they are compliant with all relevant data residency regulations and requirements. Regularly testing and monitoring your systems can help make sure that your data is protected and your organization stays compliant.

References

Simplify Service-to-Service Connectivity, Security, and Monitoring with Amazon VPC Lattice – Now Generally Available

Post Syndicated from Danilo Poccia original https://aws.amazon.com/blogs/aws/simplify-service-to-service-connectivity-security-and-monitoring-with-amazon-vpc-lattice-now-generally-available/

At AWS re:Invent 2022, we introduced in preview Amazon VPC Lattice, a new capability of Amazon Virtual Private Cloud (Amazon VPC) that gives you a consistent way to connect, secure, and monitor communication between your services. With VPC Lattice, you can define policies for network access, traffic management, and monitoring to connect compute services across instances, containers, and serverless applications.

Today, I am happy to share that VPC Lattice is now generally available. Compared to the preview, you have access to new capabilities:

  • Services can use a custom domain name in addition to the domain name automatically generated by VPC Lattice. When using HTTPS, you can configure an SSL/TLS certificate that matches the custom domain name.
  • You can deploy the open-source AWS Gateway API Controller to use VPC Lattice with a Kubernetes-native experience. It uses the Kubernetes Gateway API to let you connect services across multiple Kubernetes clusters and services running on EC2 instances, containers, and serverless functions.
  • You can use an Application Load Balancer (ALB) or a Network Load Balancer (NLB) as a target for a service.
  • The IP address target type now supports IPv6 connectivity.

Let’s see some of these new features in practice.

Using Amazon VPC Lattice for Service-to-Service Connectivity
In my previous post introducing VPC Lattice, I show how to create a service network, associate multiple VPCs and services, and configure target groups for EC2 instances and Lambda functions. There, I also show how to route traffic based on request characteristics and how to use weighted routing. Weighted routing is really handy for blue/green and canary-style deployments or for migrating from one compute platform to another.

Now, let’s see how to use VPC Lattice to allow the services of an e-commerce application to communicate with each other. For simplicity, I only consider four services:

  • The Order service, running as a Lambda function.
  • The Inventory service, deployed as an Amazon Elastic Container Service (Amazon ECS) service in a dual-stack VPC supporting IPv6.
  • The Delivery service, deployed as an ECS service using an ALB to distribute traffic to the service tasks.
  • The Payment service, running on an EC2 instance.

First, I create a service network. The Order service needs to call the Inventory service (to check if an item is available for purchase), the Delivery service (to organize the delivery of the item), and the Payment service (to transfer the funds). The following diagram shows the service-to-service communication from the perspective of the service network.

Diagram describing the service network view of the e-commerce services.

These services run in different AWS accounts and multiple VPCs. VPC Lattice handles the complexity of setting up connectivity across VPC boundaries and permission across accounts so that service-to-service communication is as simple as an HTTP/HTTPS call.

The following diagram shows how the communication flows from an implementation point of view.

Diagram describing the implementation view of the e-commerce services.

The Order service runs in a Lambda function connected to a VPC. Because all the VPCs in the diagram are associated with the service network, the Order service is able to call the other services (Inventory, Delivery, and Payment) even if they are deployed in different AWS accounts and in VPCs with overlapping IP addresses.

Using a Network Load Balancer (NLB) as Target
The Inventory service runs in a dual-stack VPC. It’s deployed as an ECS service with an NLB to distribute traffic to the tasks in the service. To get the IPv6 addresses of the NLB, I look for the network interfaces used by the NLB in the EC2 console.

Console screenshot.

When creating the target group for the Inventory service, under Basic configuration, I choose IP addresses as the target type. Then, I select IPv6 for the IP Address type.

Console screenshot.

In the next step, I enter the IPv6 addresses of the NLB as targets. After the target group is created, the health checks test the targets to see if they are responding as expected.

Console screenshot.

Using an Application Load Balancer (ALB) as Target
Using an ALB as a target is even easier. When creating a target group for the Delivery service, under Basic configuration, I choose the new Application Load Balancer target type.

Console screenshot.

I select the VPC in which to look for the ALB and choose the Protocol version.

Console screenshot.

In the next step, I choose Register now and select the ALB from the dropdown. I use the default port used by the target group. VPC Lattice does not provide additional health checks for ALBs. However, load balancers already have their own health checks configured.

Console screenshot.

Using Custom Domain Names for Services
To call these services, I use custom domain names. For example, when I create the Payment service in the VPC console, I choose to Specify a custom domain configuration, enter a Custom domain name, and select an SSL/TLS certificate for the HTTPS listener. The Custom SSL/TLS certificate dropdown shows available certificates from AWS Certificate Manager (ACM).

Console screenshot.

Securing Service-to-Service Communications
Now that the target groups have been created, let’s see how I can secure the way services communicate with each other. To implement zero-trust authentication and authorization, I use AWS Identity and Access Management (IAM). When creating a service, I select the AWS IAM as Auth type.

I select the Allow only authenticated access policy template so that requests to services need to be signed using Signature Version 4, the same signing protocol used by AWS APIs. In this way, requests between services are authenticated by their IAM credentials, and I don’t have to manage secrets to secure their communications.

Console screenshot.

Optionally, I can be more precise and use an auth policy that only gives access to some services or specific URL paths of a service. For example, I can apply the following auth policy to the Order service to give to the Lambda function these permissions:

  • Read-only access (GET method) to the Inventory service /stock URL path.
  • Full access (any HTTP method) to the Delivery service /delivery URL path.
{
    "Version": "2012-10-17",
    "Statement": [
        {
            "Effect": "Allow",
            "Principal": {
                "AWS": "<Order Service Lambda Function IAM Role ARN>"
            },
            "Action": "vpc-lattice-svcs:Invoke",
            "Resource": "<Inventory Service ARN>/stock",
            "Condition": {
                "StringEquals": {
                    "vpc-lattice-svcs:RequestMethod": "GET"
                }
            }
        },
        {
            "Effect": "Allow",
            "Principal": {
                "AWS": "<Order Service Lambda Function IAM Role ARN>"
            },
            "Action": "vpc-lattice-svcs:Invoke",
            "Resource": "<Delivery Service ARN>/delivery"
        }
    ]
}

Using VPC Lattice, I quickly configured the communication between the services of my e-commerce application, including security and monitoring. Now, I can focus on the business logic instead of managing how services communicate with each other.

Availability and Pricing
Amazon VPC Lattice is available today in the following AWS Regions: US East (Ohio), US East (N. Virginia), US West (Oregon), Asia Pacific (Singapore), Asia Pacific (Sydney), Asia Pacific (Tokyo), and Europe (Ireland).

With VPC Lattice, you pay for the time a service is provisioned, the amount of data transferred through each service, and the number of requests. There is no charge for the first 300,000 requests every hour, and you only pay for requests above this threshold. For more information, see VPC Lattice pricing.

We designed VPC Lattice to allow incremental opt-in over time. Each team in your organization can choose if and when to use VPC Lattice. Other applications can connect to VPC Lattice services using standard protocols such as HTTP and HTTPS. By using VPC Lattice, you can focus on your application logic and improve productivity and deployment flexibility with consistent support for instances, containers, and serverless computing.

Simplify the way you connect, secure, and monitor your services with VPC Lattice.

Danilo

Week in Review – February 13, 2023

Post Syndicated from Sébastien Stormacq original https://aws.amazon.com/blogs/aws/week-in-review-february-13-2023/

AWS announced 32 capabilities since we published the last Week in Review blog post a week ago. I also read a couple of other news and blog posts.

Here is my summary.

The VPC section of the AWS Management Console now allows you to visualize your VPC resources, such as the relationships between a VPC and its subnets, routing tables, and gateways. This visualization was available at VPC creation time only, and now you can go back to it using the Resource Map tab in the console. You can read the details in Channy’s blog post.

CloudTrail Lake now gives you the ability to ingest activity events from non-AWS sources. This lets you immutably store and then process activity events without regard to their origin–AWS, on-premises servers, and so forth. All of this power is available to you with a single API call: PutAuditEvents. We launched AWS CloudTrail Lake about a year ago. It is a managed organization-scale data lake that aggregates, immutably stores, and allows querying of events recorded by CloudTrail. You can use it for auditing, security investigation, and troubleshooting. Again, my colleague Channy wrote a post with the details.

There are three new Amazon CloudWatch metrics for asynchronous AWS Lambda function invocations: AsyncEventsReceived, AsyncEventAge, and AsyncEventsDropped. These metrics provide visibility for asynchronous Lambda function invocations. They help you to identify the root cause of processing issues such as throttling, concurrency limit, function errors, processing latency because of retries, or missing events. You can learn more and have access to a sample application in this blog post.

Amazon Simple Notification Service (Amazon SNS) now supports AWS X-Ray to visualize, analyze, and debug applications. Developers can now trace messages going through Amazon SNS, making it easier to understand or debug microservices or serverless applications.

Amazon EC2 Mac instances now support replacing root volumes for quick instance restoration. Stopping and starting EC2 Mac instances trigger a scrubbing workflow that can take up to one hour to complete. Now you can swap the root volume of the instance with an EBS snapshot or an AMI. It helps to reset your instance to a previous known state in 10–15 minutes only. This significantly speeds up your CI and CD pipelines.

Amazon Polly launches two new Japanese NTTS voices. Neural Text To Speech (NTTS) produces the most natural and human-like text-to-speech voices possible. You can try these voices in the Polly section of the AWS Management Console. With this addition, according to my count, you can now choose among 52 NTTS voices in 28 languages or language variants (French from France or from Quebec, for example).

The AWS SDK for Java now includes the AWS CRT HTTP Client. The HTTP client is the center-piece powering our SDKs. Every single AWS API call triggers a network call to our API endpoints. It is therefore important to use a low-footprint and low-latency HTTP client library in our SDKs. AWS created a common HTTP client for all SDKs using the C programming language. We also offer 11 wrappers for 11 programming languages, from C++ to Swift. When you develop in Java, you now have the option to use this common HTTP client. It provides up to 76 percent cold start time reduction on AWS Lambda functions and up to 14 percent less memory usage compared to the Netty-based HTTP client provided by default. My colleague Zoe has more details in her blog post.

X in Y Jeff started this section a while ago to list the expansion of new services and capabilities to additional Regions. I noticed 10 Regional expansions this week:

Other AWS News
This week, I also noticed these AWS news items:

My colleague Mai-Lan shared some impressive customer stories and metrics related to the use and scale of Amazon S3 Glacier. Check it out to learn how to put your cold data to work.

Space is the final (edge) frontier. I read this blog post published on avionweek.com. It explains how AWS helps to deploy AIML models on observation satellites to analyze image quality before sending them to earth, saving up to 40 percent satellite bandwidth. Interestingly, the main cause for unusable satellite images is…clouds.

Upcoming AWS Events
Check your calendars and sign up for these AWS events:

AWS re:Invent recaps in your area. During the re:Invent week, we had lots of new announcements, and in the next weeks, you can find in your area a recap of all these launches. All the events are posted on this site, so check it regularly to find an event nearby.

AWS re:Invent keynotes, leadership sessions, and breakout sessions are available on demand. I recommend that you check the playlists and find the talks about your favorite topics in one collection.

AWS Summits season will restart in Q2 2023. The dates and locations will be announced here. Paris and Sidney are kicking off the season on April 4th. You can register today to attend these in-person, free events (Paris, Sidney).

Stay Informed
That was my selection for this week! To better keep up with all of this news, do not forget to check out the following resources:

— seb
This post is part of our Week in Review series. Check back each week for a quick roundup of interesting news and announcements from AWS!

How to choose between CoIP and Direct VPC routing modes on AWS Outposts rack

Post Syndicated from Sheila Busser original https://aws.amazon.com/blogs/compute/how-to-choose-between-coip-and-direct-vpc-routing-modes-on-aws-outposts-rack/

This blog post is written by Sumit Menaria, Senior Hybrid Solutions Architect AWS WWSO Core Services.

AWS Outposts Rack is a fully-managed service that extends AWS infrastructure, services, APIs, and tools to customer premises. By providing local access to AWS managed infrastructure and services, Outposts rack enables customers to build and run applications on premises using the same programming interfaces as in AWS Regions, while using local compute and storage resources for low latency, local data processing, and data residency needs.

There are various data sources on premises that you might want to connect from your Outpost. These sources can include field devices, on-premises databases, mainframes, storage arrays, or end users. Each Outpost supports a single Local Gateway (LGW) construct, which enables connectivity from your Outpost subnets to an on-premises network. Note that this post is specific to Outposts racks and a different method of local communication is used for AWS Outposts servers.

Two different options for facilitating communication between your Outpost based resources and on-premises network: Direct VPC routing and customer-owned IP pool. Both of these are mutually exclusive options, and routing works differently based on your choice of the mode. The two modes are the attributes of the LGW route table that your Outpost subnets’ VPC is associated with, which specifies the communication mode for the Outpost subnets.

Direct VPC routing mode

Direct VPC routing uses the private IP address of the instances in the VPC CIDR block to facilitate communication with your on-premises network. These addresses are advertised to your on-premises network with Border Gateway Protocol (BGP). Advertisement via BGP is only for the private IP addresses that belong to the subnets on your Outpost and have a route pointing to the LGW via the subnet’s route table. This type of routing is the default mode for Outposts Rack. In this mode, the LGW doesn’t perform Network Address Translation (NAT) for instances. Furthermore, you don’t have to assign an Elastic IP address to your Amazon Elastic Compute Cloud (Amazon EC2) instance from a (CoIP) to enable communication with your on-premises resources.

A diagram showing how an EC2 instance on an Outpost communicates with on-premises network using direct VPC routing mode

In this diagram, when the instance Y wants to communicate with an on-premises server, it traverses the LGW and can talk to the on-premises server using its source address (10.0.1.11) in the Subnet CIDR range (10.0.1.0/24) that is advertised over BGP from the LGW to the Customer Network Device. Similarly when the on-premises server wants to initiate communication with the Outpost based EC2 instance, it uses the instance’s private IP address (10.0.1.11) as the destination IP address to set up the connection.

CoIP mode

Utilizing CoIP mode means that you must provide a separate IP address range from your on-premises IP space for AWS to create an address pool, known as a CoIP. With CoIP, when an Outpost based resources, such as EC2 instances, Application Load Balancer (ALB), or Amazon Relational Database Service (Amazon RDS) instances, need to communicate to your on-premises network, the Local Gateway will perform 1:1 NAT from the resource’s private IP address from the Outpost subnet range to an IP address from the CoIP pool. The subnet-to-CoIP address mapping is done by assigning an Elastic IP (EIP) from the CoIP address range allocated for resources such as EC2 instances. To enable the communication with the CoIP pool from the on-premises network, and then the LGW advertises the CoIP pool through BGP over its peering with the Customer Network Device.

A diagram showing how an EC2 instance on an Outpost communicates with on-premises network using CoIP mode

In this diagram, when the instance Y wants to talk to an on-premises server, the traffic traverses the LGW and the source IP address (10.0.1.11) of the instance gets translated to an IP address (192.168.0.11) in the CoIP range that is associated with the instance. Similarly, when the on-premises server initiates the communication, the request will be sent with the CoIP address (192.168.0.11) of the instance as the destination IP address. This will be changed to the instance’s private IP address (10.0.1.11) via NAT at the LGW. The CoIP pool (192.168.0.0/26) is advertised via BGP to the Customer Network Device to provide the route to the on-premises environment for reaching the Outpost based resources.

When to choose CoIP routing mode

CoIP is particularly useful when you want to isolate your Outpost based workloads from the on-premises infrastructure and only need specific resources on the Outpost to be able to communicate to the on-premises infrastructure. This is useful in situations where large enterprise networks have hundreds of IP pools allocated and there is a high chance of overlap between IP addresses allocated to Outpost based VPCs/Subnets and those allocated to on-premises infrastructure. Furthermore, CoIP can act as another layer of security, as you may choose to allocate the CoIP addresses to only the resources which must communicate with the on-premises network. Then you can allocate for the rest of them using the subnet private IP address range for communication within the Outpost or Region based resources.

This means that you don’t need to have the number of IPs in the CoIP pool be equal to the number of resources on your Outpost. For example, you may choose to configure a /26 CoIP range and a /22 pool for subnets to meet your workload requirements.

CoIP mode can also be useful when using an external ALB on Outpost and you want to make it routable through the local internet connectivity. By using a smaller internet routable CoIP address range assignment for your external ALB, you can route traffic to the ALB on the Outpost without needing to traverse through the internet gateway (IGW) in the parent Region.

When to choose Direct VPC routing mode

You can choose Direct VPC routing if you don’t want the operational overhead of managing the additional IP pools for NAT between your Outpost based resources and on-premises network. There are also few applications which may not work well if there is an NAT of IPs between the two endpoints communicating with each other. Some examples you may see are Active Directory communication with on-premises based servers, or iSCSI mount of your instances as an additional storage to on-premises Storage Area Network (SAN). These applications may not work or may need additional tuning if they encounter NATed IP addresses between an Outpost based client on an EC2 instance and on-premises based server for a two-way communication.

When Direct VPC routing mode is used, multiple VPCs can be associated to an Outpost LGW route table, and the Outpost subnets with the LGW as the route target, are automatically advertised to the on-premises network through BGP. Therefore, you must make sure that appropriate IP planning is in place to avoid any overlap of the Outpost VPC/Subnet IP range with the on-premises IP range, as they are directly advertised from LGW toward the Customer Network Device. Having overlapping IP subnets in your network can lead to undesired effects on your application connectivity and you must pay special attention when allocating IP pools for your on-premises and Outpost based VPC address space. You can use Amazon VPC IP Address Manager (IPAM) to plan the IP space of your VPCs and CoIP pools, as well as add on-premises based IP Pools using manual allocation.

Conclusion

You can select either Direct VPC routing or CoIP mode for routing through an Outpost Local Gateway. Since this selection affects the routing for all of the subnets on your Outpost associated with the LGW route table, it should be selected based on your workload requirements and existing IP infrastructure planning. You can also change the LGW route table mode at a later stage. However, that involves network disruption and the creation of a new LGW route table. To learn more about Outposts Racks routing, visit the LGW Route table documentation.

New – Visualize Your VPC Resources from Amazon VPC Creation Experience

Post Syndicated from Channy Yun original https://aws.amazon.com/blogs/aws/new-visualize-your-vpc-resources-from-amazon-vpc-creation-experience/

Today we are announcing Amazon Virtual Private Cloud (Amazon VPC) resource map, a new feature that simplifies the VPC creation experience in the AWS Management Console. This feature displays your existing VPC resources and their routing visually on a single page, allowing you to quickly understand the architectural layout of the VPC.

A year ago, in March 2022, we launched a new VPC creation experience that streamlines the process of creating and connecting VPC resources. With just one click, even across multiple Availability Zones (AZs), you can create and connect VPC resources, eliminating more than 90 percent of the manual steps required in the past. The new creation experience is centered around an interactive diagram that displays a preview of the VPC architecture and updates as options are selected, providing a visual representation of the resources and their relationships within the VPC that you are about to create.

However, after the creation of the VPC, the diagram that was available during the creation experience that many of our customers loved was no longer available. Today we are changing that! With VPC resource map, you can quickly understand the architectural layout of the VPC, including the number of subnets, which subnets are associated with the public route table, and which route tables have routes to the NAT Gateway.

You can also get to the specific resource details by clicking on the resource. This eliminates the need for you to map out resource relationships mentally and hold the information in your head while working with your VPC, making the process much more efficient and less prone to mistakes.

Getting Started with VPC Resource Map
To get started, choose an existing VPC in the VPC console. In the details section, select the Resource map tab. Here, you can see the resources in your VPC and the relationships between those resources.

As you hover over a resource, you can see the related resources and the connected lines highlighted. If you click to select the resource, you can see a few lines of details and a link to see the details of the selected resource.

Getting Started with VPC Creation Experience
I want to explain how to use the VPC creation experience to improve your workflow to create a new VPC to make a high-availability three-tier VPC easily.

Choose Create VPC and select VPC and more in the VPC console. You can preview the VPC resources that you are about to create all on the same page.

In Name tag auto-generation, you can specify a prefix value for Name tags. This value is used to generate Name tags for all VPC resources in the preview. If I change the default value, which is project to channy, the Name tag in the preview changes to channy- something, such as channy-vpc. You can customize a Name tag per resource in the preview by clicking each resource and making changes.

You can easily change the default CIDR value (10.0.0.0/16) when you click the IPv4 CIDR block field to reveal the CIDR joystick. Use the left or right arrow to move to the previous (9.255.0.0/16) or next (10.0.1.0/16) CIDR block within the /16 network mask. You can also change the subnet mask to /17 by using the down arrow, or go back to /16 using the up arrow.

Choose the number of Availability Zones (AZs) up to 3. The number of public and private subnet types changes based on the number of AZs and shows the total number of each subnet type it will create.

I want a high-availability VPC in three AZs and select 6 for the number of private subnets. In the preview panel, you can see that there are 9 subnets. When I hover over channy-rtb-public, I can visually confirm that this route table is connected to three public subnets and also routed to the internet gateway (channy-igw). The dotted lines indicate routes to network node, and the solid lines indicate relationships such as implicit or explicit associations.

Adding NAT gateways and VPC endpoints is easy. You can simply change the number of NAT gateways in or per Availability Zone (AZ). Note that there is a charge for each NAT gateway. We always recommend having one NAT gateway per AZ and route traffic from subnets in an AZ to the NAT gateway in the same AZ for high availability and to avoid inter-AZ data charges.

To route traffic to Amazon Simple Storage Service (Amazon S3) buckets more securely, you can choose the S3 Gateway endpoint by default. The S3 Gateway endpoint is free of charge and does not use NAT gateways when moving data from private subnets.

You can create additional tags and assign them to all resources in the VPC in no time. I select Add new tag and enter environment for the Key and test for the Value. This key-value pair will be added to every resource here.

Choose Create VPC at the bottom of the page and see the resources and the IDs of those resources that are being created. Before creating, please validate resources from the preview.

Once all the resources are created, choose View VPC at the bottom. The button takes you directly to the VPC resource map, where you can see a visual representation of what you created.

Now Available
Amazon VPC resource map is now available in all AWS Regions where Amazon VPC is available, and you can start using it today.

The VPC resource map and creation experience now only displays VPC, subnets, route tables, internet gateway, NAT gateways, and Amazon S3 gateway. The Amazon VPC console teams and user experience teams will continue to improve the console experience using customer feedback.

To learn more, see the Amazon VPC User Guide, and please send feedback to AWS re:Post for Amazon VPC or through your usual AWS support contacts.

Channy

Automating your workload deployments in AWS Local Zones

Post Syndicated from Sheila Busser original https://aws.amazon.com/blogs/compute/automating-your-workload-deployments-in-aws-local-zones/

This blog post is written by Enrico Liguori, SA – Solutions Builder , WWPS Solution Architecture.

AWS Local Zones are a type of infrastructure deployment that places compute, storage,and other select AWS services close to large population and industry centers.

We now have a total of 32 Local Zones; 15 outside of the US (Bangkok, Buenos Aires, Copenhagen, Delhi, Hamburg, Helsinki, Kolkata, Lagos, Lima, Muscat, Perth, Querétaro, Santiago, Taipei, and Warsaw) and 17 in the US. We will continue to launch Local Zones in 21 metro areas in 18 countries, including Australia, Austria, Belgium, Brazil, Canada, Colombia, Czech Republic, Germany, Greece, India, Kenya, Netherlands, New Zealand, Norway, Philippines, Portugal, South Africa, and Vietnam.

Customers using AWS Local Zones can provision the infrastructure and services needed to host their workloads with the same APIs and tools for automation that they use in the AWS Region, included the AWS Cloud Development Kit (AWS CDK).

The AWS CDK is an open source software development framework to model and provision your cloud application resources using familiar programming languages, including TypeScript, JavaScript, Python, C#, and Java. For the solution in this post, we use Python.

Overview

In this post we demonstrate how to:

  1. Programmatically enable the Local Zone of your interest.
  2. Explore the supported APIs to check the types of Amazon Elastic Compute Cloud (Amazon EC2) instances available in a specific Local Zone and get their associated price per hour;
  3. Deploy a simple WordPress application in the Local Zone through AWS CDK.

Prerequisites

To be able to try the examples provided in this post, you must configure:

  1. AWS Command Line Interface (AWS CLI)
  2. Python version 3.8 or above
  3. AWS CDK

Enabling a Local Zone programmatically

To get started with Local Zones, you must first enable the Local Zone that you plan to use in your AWS account. In this tutorial, you can learn how to select the Local Zone that provides the lowest latency to your site and understand how to opt into the Local Zone from the AWS Management Console.

If you prefer to interact with AWS APIs programmatically, then you can enable the Local Zone of your interest by calling the ModifyAvailabilityZoneGroup API through the AWS CLI or one of the supported AWS SDKs.

The following examples show how to opt into the Atlanta Local Zone through the AWS CLI and through the Python SDK:

AWS CLI:

aws ec2 modify-availability-zone-group \
  --region us-east-1 \
  --group-name us-east-1-atl-1 \
  --opt-in-status opted-in

Python SDK:

ec2 = boto3.client('ec2', config=Config(region_name='us-east-1'))
response = ec2.modify_availability_zone_group(
                  GroupName='us-east-1-atl-1',
                  OptInStatus='opted-in'
           )

The opt in process takes approximately five minutes to complete. After this time, you can confirm the opt in status using the DescribeAvailabilityZones API.

From the AWS CLI, you can check the enabled Local Zones with:

aws ec2 describe-availability-zones --region us-east-1

Or, once again, we can use one of the supported SDKs. Here is an example using Phyton:

ec2 = boto3.client('ec2', config=Config(region_name='us-east-1'))
response = ec2.describe_availability_zones()

In both cases, a JSON object similar to the following, will be returned:

{
"State": "available",
"OptInStatus": "opted-in",
"Messages": [],
"RegionName": "us-east-1",
"ZoneName": "us-east-1-atl-1a",
"ZoneId": "use1-atl1-az1",
"GroupName": "us-east-1-atl-1",
"NetworkBorderGroup": "us-east-1-atl-1",
"ZoneType": "local-zone",
"ParentZoneName": "us-east-1d",
"ParentZoneId": "use1-az4"
}

The OptInStatus confirms that we successful enabled the Atlanta Local Zone and that we can now deploy resources in it.

How to check available EC2 instances in Local Zones

The set of instance types available in a Local Zone might change from one Local Zone to another. This means that before starting deploying resources, it’s a good practice to check which instance types are supported in the Local Zone.

After enabling the Local Zone, we can programmatically check the instance types that are available by using DescribeInstanceTypeOfferings. To use the API with Local Zones, we must pass availability-zone as the value of the LocationType parameter and use a Filter object to select the correct Local Zone that we want to check. The resulting AWS CLI command will look like the following example:

aws ec2 describe-instance-type-offerings --location-type "availability-zone" --filters 
Name=location,Values=us-east-1-atl-1a --region us-east-1

Using Python SDK:

ec2 = boto3.client('ec2', config=Config(region_name='us-east-1'))
response = ec2.describe_instance_type_offerings(
      LocationType='availability-zone',
      Filters=[
            {
            'Name': 'location',
            'Values': ['us-east-1-atl-1a']
            }
            ]
      )

How to check prices of EC2 instances in Local Zones

EC2 instances and other AWS resources in Local Zones will have different prices than in the parent Region. Check the pricing page for the complete list of pricing options and associated price-per-hour.

To access the pricing list programmatically, we can use the GetProducts API. The API returns the list of pricing options available for the AWS service specified in the ServiceCode parameter. We also recommend defining Filters to restrict the number of results returned. For example, to retrieve the On-Demand pricing list of a T3 Medium instance in Atlanta from the AWS CLI, we can use the following:

aws pricing get-products --format-version aws_v1 --service-code AmazonEC2 --region us-east-1 \
--filters 'Type=TERM_MATCH,Field=instanceType,Value=t3.medium' \
--filters 'Type=TERM_MATCH,Field=location,Value=US East (Atlanta)'

Similarly, with Python SDK we can use the following:

pricing = boto3.client('pricing',config=Config(region_name="us-east-1")) response = pricing.get_products(
         ServiceCode='AmazonEC2',
         Filters= [
          {
          "Type": "TERM_MATCH",
          "Field": "instanceType",
          "Value": "t3.medium"
          },
          {
          "Type": "TERM_MATCH",
          "Field": "regionCode",
          "Value": "us-east-1-atl-1"
          }
        ],
         FormatVersion='aws_v1',
)

Note that the Region specified in the CLI command and in Boto3, is the location of the AWS Price List service API endpoint. This API is available only in us-east-1 and ap-south-1 Regions.

Deploying WordPress in Local Zones using AWS CDK

In this section, we see how to use the AWS CDK and Python to deploy a simple non-production WordPress installation in a Local Zone.

Architecture overview

architecture overview

The AWS CDK stack will deploy a new standard Amazon Virtual Private Cloud (Amazon VPC) in the parent Region (us-east-1) that will be extended to the Local Zone. This creates two subnets associated with the Atlanta Local Zone: a public subnet to expose resources on the Internet, and a private subnet to host the application and database layers. Review the AWS public documentation for a definition of public and private subnets in a VPC.

The application architecture is made of the following:

  • A front-end in the private subnet where a WordPress application is installed, through a User Data script, in a type T3 medium EC2 instance.
  • A back-end in the private subnet where MySQL database is installed, through a User Data script, in a type T3 medium EC2 instance.
  • An Application Load Balancer (ALB) in the public subnet that will act as the entry point for the application.
  • A NAT instance to allow resources in the private subnet to initiate traffic to the Internet.

Clone the sample code from the AWS CDK examples repository

We can clone the AWS CDK code hosted on GitHub with:

$ git clone https://github.com/aws-samples/aws-cdk-examples.git

Then navigate to the directory aws-cdk-examples/python/vpc-ec2-local-zones using the following:

$ cd aws-cdk-examples/python/vpc-ec2-local-zones

Before starting the provisioning, let’s look at the code in the following sections.

Networking infrastructure

The networking infrastructure is usually the first building block that we must define. In AWS CDK, this can be done using the VPC construct:

import aws_cdk.aws_ec2 as ec2
vpc = ec2.Vpc(
            self,
            "Vpc",
            cidr=”172.31.100.0/24”,
            subnet_configuration=[
                ec2.SubnetConfiguration(
                    name = 'Public-Subnet',
                    subnet_type = ec2.SubnetType.PUBLIC,
                    cidr_mask = 26,
                ),
                ec2.SubnetConfiguration(
                    name = 'Private-Subnet',
                    subnet_type = ec2.SubnetType.PRIVATE_ISOLATED,
                    cidr_mask = 26,
                ),
            ]      
        )

Together with the VPC CIDR (i.e. 172.31.100.0/24), we define also the subnets configuration through the subnet_configuration parameter.

Note that in the subnet definitions above there is no specification of the Availability Zone or Local Zone that we want to associate them with. We can define this setting at the VPC level, overwriting the availability_zones method as shown here:

@property
def availability_zones(self):
   return [“us-east-1-atl-1a”]

As an alternative, you can use a Local Zone Name as the value of the availability_zones parameter in each Subnet definition. For a complete list of Local Zone Names, check out the Zone Names on the Local Zones Locations page.

Specifying ec2.SubnetType.PUBLIC  in the subnet_type parameter, AWS CDK  automatically creates an Internet Gateway (IGW) associated with our VPC and a default route in its routing table pointing to the IGW. With this setup, the Internet traffic will go directly to the IGW in the Local Zone without going through the parent AWS Region. For other connectivity options, check the AWS Local Zone User Guide.

The last piece of our networking infrastructure is a self-managed NAT instance. This will allow instances in the private subnet to communicate with services outside of the VPC and simultaneously prevent them from receiving unsolicited connection requests.

We can implement the best practices for NAT instances included in the AWS public documentation using a combination of parameters of the Instance construct, as shown here:

nat = ec2.Instance(self, "NATInstanceInLZ",
                 vpc=vpc,
                 security_group=self.create_nat_SG(vpc),
                 instance_type=ec2.InstanceType.of(ec2.InstanceClass.T3, ec2.InstanceSize.MEDIUM),
                 machine_image=ec2.MachineImage.latest_amazon_linux(),
                 user_data=ec2.UserData.custom(user_data),
                 vpc_subnets=ec2.SubnetSelection(availability_zones=[“us-east-1-atl-1a”], subnet_type=ec2.SubnetType.PUBLIC),
                 source_dest_check=False
                )

In the previous code example, we specify the following as parameters:

The final required step is to update the route table of the private subnet with the following:

priv_subnet.add_route("DefRouteToNAT",
            router_id=nat_instance.instance_id,
            router_type=ec2.RouterType.INSTANCE,
            destination_cidr_block="0.0.0.0/0",
            enables_internet_connectivity=True)

The application stack

The other resources, including the front-end instance managed by AutoScaling, the back-end instance, and ALB are deployed using the standard AWS CDK constructs. Note that the ALB service is only available in some Local Zones. If you plan to use a Local Zone where ALB isn’t supported, then you must deploy a load balancer on a self-managed EC2 instance, or use a load balancer available in AWS Marketplace.

Stack deployment

Next, let’s go through the AWS CDK bootstrapping process. This is required only for the first time that we use AWS CDK in a specific AWS environment (an AWS environment is a combination of an AWS account and Region).

$ cdk bootstrap

Now we can deploy the stack with the following:

$ cdk deploy

After the deployment is completed, we can connect to the application with a browser using the URL returned in the output of the cdk deploy command:

terminal screenshot

The WordPress install wizard will be displayed in the browser, thereby confirming that the deployment worked as expected:

The WordPress install wizard

Note that in this post we use the Local Zone in Atlanta. Therefore, we must deploy the stack in its parent Region, US East (N. Virginia). To select the Region used by the stack, configure the AWS CLI default profile.

Cleanup

To terminate the resources that we created in this post, you can simply run the following:

$ cdk destroy

Conclusion

In this post, we demonstrated how to interact programmatically with the different AWS APIs available for Local Zones. Furthermore, we deployed a simple WordPress application in the Atlanta Local Zone after analyzing the AWS CDK code used for the deployment.

We encourage you to try the examples provided in this post and get familiar with the programmatic configuration and deployment of resources in a Local Zone.

Stream VPC flow logs to Amazon OpenSearch Service via Amazon Kinesis Data Firehose

Post Syndicated from Chaitanya Shah original https://aws.amazon.com/blogs/big-data/stream-vpc-flow-logs-to-amazon-opensearch-service-via-amazon-kinesis-data-firehose/

Amazon Virtual Private Cloud (Amazon VPC) flow logs enable you to track the IP traffic going to and from the network interfaces in your VPC for your workloads. Analyzing VPC logs helps you understand how your applications are communicating over your VPC network with log records and acts as a main source of information to the network in your VPC. After collecting the flow logs, the next step is performing log analysis to understand user or application behavior and patterns to make informed decisions. You can analyze logs using log analytics tools such as Amazon OpenSearch Service.

Amazon Kinesis Data Firehose is a fully managed service for delivering near real-time streaming data to various destinations for storage and performing near real-time analytics. With its extensible data transformation capabilities, you can also streamline log processing and log delivery pipelines into a single Firehose delivery stream.

Amazon OpenSearch Service makes it easy for you to perform interactive log analytics, real-time application monitoring, website search, and more. Amazon OpenSearch is an open source, distributed search and analytics suite. Amazon OpenSearch Service offers the latest versions of OpenSearch, support for 19 versions of Elasticsearch (1.5 to 7.10 versions), as well as visualization capabilities powered by OpenSearch Dashboards and Kibana (1.5 to 7.10 versions). Amazon OpenSearch Service currently has tens of thousands of active customers with hundreds of thousands of clusters under management processing trillions of requests per month.

In this post, you will learn how to ingest VPC flow logs with Kinesis Data Firehose and deliver them to an Amazon OpenSearch Service for analysis using OpenSearch Service Dashboards.

Overview of solution

This solution uses native integration of VPC flow logs streaming to Kinesis Data Firehose. We use a Firehose delivery stream to buffer the streamed VPC flow logs, and deliver those to an OpenSearch Service destination endpoint. We use Amazon OpenSearch Service Dashboards to create an index pattern for the VPC flow logs to analyze and visualize the logs in a near-real time. The following diagram illustrates this architecture.

Solution Architecture

We walk you through the following high-level steps:

  1. Create an OpenSearch Service domain for storing and analyzing the VPC flow logs.
  2. Create a Firehose delivery stream to deliver the flow logs to the OpenSearch Service domain.
  3. Create a VPC flow log subscription to the delivery stream.
  4. Explore VPC flow logs in OpenSearch Service Dashboards
    • Create role mapping with an OpenSearch Service user to the Kinesis Data Firehose service role. Because we’re using a public access domain for OpenSearch Service, we have to map the delivery stream AWS Identity and Access Management (IAM) role to the OpenSearch Service primary user to deliver logs in bulk to the OpenSearch Service domain.
    • Create an index pattern in OpenSearch Service Dashboards to enable analysis and visualization of VPC logs.

Prerequisites

As a prerequisite, you need to create an Amazon Simple Storage Service (Amazon S3) bucket to store the Firehose delivery stream backups and failed logs.

Create an Amazon OpenSearch Service domain

For demonstration purposes, and to limit the costs, we create an OpenSearch Service domain with the Development and testing deployment type and public access to the dashboard. For instructions, refer to Create an Amazon OpenSearch Service domain. Note that we select Public access only for demo purposes. For production, we recommend using VPC access for security reasons.

When it’s complete, the OpenSearch Service domain shows as Active.

OpenSearch Domain

Create a Kinesis Data Firehose delivery stream

Now that your Amazon OpenSearch Service domain is active, you can create a Firehose delivery stream where VPC flow logs are streamed.

  1. On the Amazon Kinesis console, choose Kinesis Data Firehose in the navigation pane, then choose Create delivery stream.
  2. Choose Direct PUT as the source and set the destination as Amazon OpenSearch Service.
  3. For Delivery stream name, enter PUT-OPENSEARCH-STREAM-DEMO.Kinesis Delivery Stream
  4. In the Destination settings section, choose Browse and choose the previously created Amazon OpenSearch Service domain.
  5. For Index name, enter vpcflowlogs.
  6. For Index rotation, choose Every day.
  7. For this post, we set Buffer size to 5 and Buffer interval to 900.You can modify these settings to optimize ingestion throughput and near-real-time behavior.
    Kinesis Stream Destination setting
  1. In the Backup settings section, for Source record backup in Amazon S3, select Failed events only so you only save the data that fails to deliver to Amazon OpenSearch Service.
  2. For S3 bucket, choose Browse and choose the S3 bucket you created to store failed logs and backups.
  3. Optionally, you can input a prefix for backup files and error files.
  4. Select GZIP for Compression for data records.
  5. For Encryption for data records, select Disabled.Kinesis Stream - Backup Setting
  6. Expand Advanced settings, and for Amazon CloudWatch error logging, select Enabled.
  7. Choose Create delivery stream.Kinesis Stream - Advance Setting

When the delivery stream is active, proceed to the next step.

Create a VPC flow logs subscription

Now you create a VPC flow logs subscription for the Firehose delivery stream you created in the previous step.

  1. On the Amazon VPC console, choose Your VPCs.
  2. Select the VPC for which to create the flow log.
  3. On the Actions menu, choose Create flow log.VPC Flow Log
  4. Select All to send all flow log records to Amazon OpenSearch Service.

If you want to filter the flow logs, you can select either Accept or Reject.

  1. For Maximum aggregation interval, select 10 minutes or the minimum setting of 1 minute if you need the flow log data to be available for near-real-time analysis in Amazon OpenSearch Service.
  2. For Destination, select Send to Kinesis Firehose in the same account if the delivery stream is set up on the same account where you create the VPC flow logs.
  3. For Log record format, if you leave it at AWS default format, the flow logs are sent as version 2 format.

Alternatively, you can specify which fields you need the flow logs to capture and send to an Amazon OpenSearch Service. For more information on log format and available fields, refer to Flow log records.

  1. Choose Create flow log.Create VPC Flow Logs

Now let’s explore the VPC flow logs in Amazon OpenSearch Service.

Explore VPC flow logs in Amazon OpenSearch Service Dashboards

In the final step, we set up OpenSearch Service Dashboards to explore the VPC flow logs.

  1. On the OpenSearch Service console, choose Domains in the navigation pane.
  2. Choose the domain you created.
  3. Under OpenSearch Dashboards URL, choose the link to open a new tab.OpenSearch Dashboard
  4. Log in with the user you created during OpenSearch Service domain setup.OpenSearch Service Dashboard
  5. Select Private for Select your tenant, then choose Confirm.OpenSearch Service Dashboard Tenant

Because we used a public access domain for OpenSearch Service, you need to map the role created for the Firehose delivery stream to the OpenSearch Service Dashboards user, so that the delivery stream can deliver logs in bulk to the OpenSearch Service domain.

  1. On the menu icon, choose Security.
  2. Choose Roles.
  3. Choose the all_access role.OpenSearch Service All Access Role
  4. On the Mapped users tab, choose Manage mapping.OpenSearch Service Dashboard map role
  5. For Backend roles, enter the IAM role ARN created for the Firehose delivery stream.
  6. Choose Map.OpenSearch Service Dashboard Map role arn
  7. Now that mapping is complete, choose the menu icon, then choose Stack management.OpenSearch Service Dashboard Stack Management
  8. Choose Index Patterns, then choose Create index pattern.
  9. For Index pattern name, enter vpcflowlogs*.
  10. Choose Next step.OpenSearch Service Dashboard Create Index
  11. Navigate to the Discover menu option.You can see the VPC flow logs from your VPC in this dashboard. Now you can search and visualize the flow logs that are being streamed in near-real time to the OpenSearch Service domain.
    OpenSearch Service Dashboard Discover

Clean up

After you test out this solution, remember to delete all the resources you created to avoid incurring future charges:

  1. Delete your Amazon OpenSearch Service domain.
  2. Delete the VPC flow logs subscription.
  3. Delete the Firehose delivery stream.
  4. Delete the S3 bucket for the VPC flow logs backup and failed logs.
  5. If you created a new VPC and new resources in the VPC, delete the resources and VPC.

Conclusion

In this post, we walked through a solution of how integrate VPC flow logs with a Kinesis Data Firehose delivery stream and deliver it to an Amazon OpenSearch Service destination with no code and visualize it in OpenSearch Service Dashboards.

Try this new quick and hassle-free way of sending your VPC flow logs to an Amazon OpenSearch Service using Kinesis Data Firehose.


About the Author

Chaitanya Shah is a Sr. Technical Account Manager with AWS, based out of New York. He has over 22 years of experience working with enterprise customers. He loves to code and actively contributes to the AWS solutions labs to help customers solve complex problems. He provides guidance to AWS customers on best practices for their AWS Cloud migrations. He is also specialized in AWS data transfer and the data and analytics domain.

Building a healthcare data pipeline on AWS with IBM Cloud Pak for Data

Post Syndicated from Eduardo Monich Fronza original https://aws.amazon.com/blogs/architecture/building-a-healthcare-data-pipeline-on-aws-with-ibm-cloud-pak-for-data/

Healthcare data is being generated at an increased rate with the proliferation of connected medical devices and clinical systems. Some examples of these data are time-sensitive patient information, including results of laboratory tests, pathology reports, X-rays, digital imaging, and medical devices to monitor a patient’s vital signs, such as blood pressure, heart rate, and temperature.

These different types of data can be difficult to work with, but when combined they can be used to build data pipelines and machine learning (ML) models to address various challenges in the healthcare industry, like the prediction of patient outcome, readmission rate, or disease progression.

In this post, we demonstrate how to bring data from different sources, like Snowflake and connected health devices, to form a healthcare data lake on Amazon Web Services (AWS). We also explore how to use this data with IBM Watson to build, train, and deploy ML models. You can learn how to integrate model endpoints with clinical health applications to generate predictions for patient health conditions.

Solution overview

The main parts of the architecture we discuss are (Figure 1):

  1. Using patient data to improve health outcomes
  2. Healthcare data lake formation to store patient health information
  3. Analyzing clinical data to improve medical research
  4. Gaining operational insights from healthcare provider data
  5. Providing data governance to maintain the data privacy
  6. Building, training, and deploying an ML model
  7. Integration with the healthcare system
Data pipeline for the healthcare industry using IBM CP4D on AWS

Figure 1. Data pipeline for the healthcare industry using IBM CP4D on AWS

IBM Cloud Pak for Data (CP4D) is deployed on Red Hat OpenShift Service on AWS (ROSA). It provides the components IBM DataStage, IBM Watson Knowledge Catalogue, IBM Watson Studio, IBM Watson Machine Learning, plus a wide variety of connections with data sources available in a public cloud or on-premises.

Connected health devices, on the edge, use sensors and wireless connectivity to gather patient health data, such as biometrics, and send it to the AWS Cloud through Amazon Kinesis Data Firehose. AWS Lambda transforms the data that is persisted to Amazon Simple Storage Service (Amazon S3), making that information available to healthcare providers.

Amazon Simple Notification Service (Amazon SNS) is used to send notifications whenever there is an issue with the real-time data ingestion from the connected health devices. In case of failures, messages are sent via Amazon SNS topics for rectifying and reprocessing of failure messages.

DataStage performs ETL operations and move patient historical information from Snowflake into Amazon S3. This data, combined with the data from the connected health devices, form a healthcare data lake, which is used in IBM CP4D to build and train ML models.

The pipeline described in architecture uses Watson Knowledge Catalogue, which provides data governance framework and artifacts to enrich our data assets. It protects sensitive patient information from unauthorized access, like individually identifiable information, medical history, test results, or insurance information.

Data protection rules define how to control access to data, mask sensitive values, or filter rows from data assets. The rules are automatically evaluated and enforced each time a user attempts to access a data asset in any governed catalog of the platform.

After this, the datasets are published to Watson Studio projects, where they are used to train ML models. You can develop models using Jupyter Notebook, IBM AutoAI (low-code), or IBM SPSS modeler (no-code).

For the purpose of this use case, we used logistic regression algorithm for classifying and predicting the probability of an event, such as disease risk management to assist doctors in making critical medical decisions. You can also build ML models using algorithms like Classification, Random Forest, and K-Nearest Neighbor. These are widely used to predict disease risk.

Once the models are trained, they are exposed as endpoints with Watson Machine Learning and integrated with the healthcare application to generate predictions by analyzing patient symptoms.

The healthcare applications are a type of clinical software that offer crucial physiological insights and predict the effects of illnesses and possible treatments. It provides built-in dashboards that display patient information together with the patient’s overall metrics for outcomes and treatments. This can help healthcare practitioners gain insights into patient conditions. It also can help medical institutions prioritize patients with more risk factors and curate clinical and behavioral health plans.

Finally, we are using IBM Security QRadar XDR SIEM to collect, process, and aggregate Amazon Virtual Private Cloud (Amazon VPC) flow logs, AWS CloudTrail logs, and IBM CP4D logs. QRadar XDR uses this information to manage security by providing real-time monitoring, alerts, and responses to threats.

Healthcare data lake

A healthcare data lake can help health organizations turn data into insights. It is centralized, curated, and securely stores data on Amazon S3. It also enables you to break down data silos and combine different types of analytics to gain insights. We are using the DataStage, Kinesis Data Firehose, and Amazon S3 services to build the healthcare data lake.

Data governance

Watson Knowledge Catalogue provides an ML catalogue for data discovery, cataloging, quality, and governance. We define policies in Watson Knowledge Catalogue to enable data privacy and overall access to and utilization of this data. This includes sensitive data and personal information that needs to be handled through data protection, quality, and automation rules. To learn more about IBM data governance, please refer to Running a data quality analysis (Watson Knowledge Catalogue).

Build, train, and deploy the ML model

Watson Studio empowers data scientists, developers, and analysts to build, run, and manage AI models on IBM CP4D.

In this solution, we are building models using Watson Studio by:

  1. Promoting the governed data from Watson Knowledge Catalogue to Watson Studio for insights
  2. Using ETL features, such as built-in search, automatic metadata propagation, and simultaneous highlighting, to process and transform large amounts of data
  3. Training the model, including model technique selection and application, hyperparameter setting and adjustment, validation, ensemble model development and testing; algorithm selection; and model optimization
  4. Evaluating the model based on metric evaluation, confusion matrix calculations, KPIs, model performance metrics, model quality measurements for accuracy and precision
  5. Deploying the model on Watson Machine Learning using online deployments, which create an endpoint to generate a score or prediction in real time
  6. Integrating the endpoint with applications like health applications, as demonstrated in Figure 1

Conclusion

In this blog, we demonstrated how to use patient data to improve health outcomes by creating a healthcare data lake and analyzing clinical data. This can help patients and healthcare practitioners make better, faster decisions and prioritize cases. We also discussed how to build an ML model using IBM Watson and integrate it with healthcare applications for health analysis.

Additional resources

Simplify private network access for solutions using Amazon OpenSearch Service managed VPC endpoints

Post Syndicated from Aish Gunasekar original https://aws.amazon.com/blogs/big-data/simplify-private-network-access-for-solutions-using-amazon-opensearch-service-managed-vpc-endpoints/

Amazon OpenSearch Service makes it easy for you to perform interactive log analytics, real-time application monitoring, website search, and more. Amazon OpenSearch is an open source, distributed search and analytics suite. Amazon OpenSearch Service offers the latest versions of OpenSearch, support for 19 versions of Elasticsearch (1.5 to 7.10 versions), as well as visualization capabilities powered by OpenSearch Dashboards and Kibana (1.5 to 7.10 versions). Amazon OpenSearch Service currently has tens of thousands of active customers with hundreds of thousands of clusters under management processing trillions of requests per month.

To meet the needs of customers who want simplicity in their network setup with the Amazon OpenSearch Service, you can now use Amazon OpenSearch Service-managed virtual private cloud (VPC) endpoints (powered by AWS PrivateLink) to connect to your applications using Amazon OpenSearch Service domains launched in Amazon Virtual Private Cloud (VPC). With Amazon OpenSearch Service-managed VPC endpoints, you can privately access your Amazon OpenSearch Service domain from multiple VPCs in your account or other AWS accounts based on your application needs without configuring other services features such as VPC peering, AWS Transit Gateway (TGW), or other more complex network routing strategies that place operational burden on your support and engineering teams.

The feature is built using AWS PrivateLink. AWS PrivateLink provides private connectivity between VPCs, supported AWS services, and your on-premises networks without exposing your traffic to the public internet. It provides you with the means to connect multiple application deployments effortlessly to your Amazon OpenSearch Service domains.

This post introduces Amazon OpenSearch Service-managed VPC endpoints that build on top of AWS PrivateLink and shows how you can access a private Amazon OpenSearch Service from one or more VPCs hosted in the same account, or even VPCs hosted in other AWS accounts using AWS PrivateLink managed by Amazon OpenSearch Service.

­­­­Amazon OpenSearch Service managed VPC endpoints

Before the launch of Amazon OpenSearch Service managed VPC endpoints, if you needed to gain access to your domain outside of your VPC, you had three options:

  • Use VPC peering to connect your VPC with other VPCs
  • Use AWS Transit Gateway to connect your VPC with other VPCs
  • Create your own implementation of an AWS PrivateLink setup

The first two options require you to setup your VPCs so that the Classless Inter-Domain Routing (CIDR) block ranges don’t overlap. If they did, then your options are more complicated. The third option, create your own implementation of AWS PrivateLink, involve configuring a network load balancer (NLB) and associating a target group with the NLB as one of the steps in the setup. The architecture discussed in this post, demonstrates these additional layers of complexity.

With Amazon OpenSearch Service managed VPC endpoints (i.e., powered by AWS PrivateLink), these complex setups and processes are no longer needed!

You can access your Amazon OpenSearch Service private domain as if it were deployed in all the VPCs that you want to connect to your domain. If you need private connectivity from your on-premises hybrid deployments, then AWS PrivateLink helps you bring access from your Amazon OpenSearch Service domain to your data centers with minimal effort.

By using AWS PrivateLink with Amazon OpenSearch Service, you can realize the following benefits:

  • You simplify your network architecture between hybrid, multi-VPC, and multi account solutions
  • You address a multitude of compliance concerns by better controlling the traffic that moves between your solutions and Amazon OpenSearch Service domains

Shared search cluster for multiple development teams

Imagine that your company hosts a service as a software (SaaS) application that provides a search application programming interface (API) for the healthcare industry. Each team works on a different function of the API. The development teams API team 1 and API team 2 are in two different AWS accounts and each has their own VPCs within these accounts. Another team (data refinement team) works on the ingestion and data refinement to populate the Amazon OpenSearch Service domain hosted in the same account as API team 2 but in different VPC. Each team shares the domain during the development cycles to save costs and foster collaboration on the data modeling.

Solution overview

Self-managed AWS PrivateLink architecture to connect different VPCs

In this scenario prior to Amazon OpenSearch Service manage VPC endpoints (i.e., powered by AWS PrivateLink), you would have to create the following items:

  1. Deploy an NLB in your VPC
  2. Create a target group that points to the IP addresses of the Elastic Network Interfaces (ENIs), which the Amazon OpenSearch Service creates in your VPC and is used to launch the Amazon OpenSearch Service
  3. Create an AWS PrivateLink deployment and reference your newly created NLB

When you implement the NLB, a target group can only reference IP addresses, an Amazon EC2 instance, or an Application Load Balancer (ALB). If you referenced the IP addresses as targets, then you had to build a process that detected the changes in the IP address if the domain changed due to service initiated or self-initiated blue/green deployments. You must maintain yet another complex process to ensure that you always have active ENIs with which to point your target groups or you lose connectivity.

Typically, customers use an AWS Lambda with scheduled events in Amazon CloudWatch. This means that you use the AWS Lambda to detect the current state where the ENIs that provided the IP addresses were marked as active for the description that matched the ENIs your domain creates. You schedule AWS Lambda to wake up within the time to live (TTL) of the Domain Name Service (DNS) settings (typically 60 seconds) and compare the existing IP addresses in the target group with any new ones found when you query all ENIs with a description referencing your domain in the VPC. You then build a new target group with the deltas and you swap the target groups and drop the old one. It’s tricky, it’s complex, and you have to maintain the solution!

With the new simplified networking architecture, your teams go through the following steps.

OpenSearch Service managed VPC endpoints architecture (powered by AWS PrivateLink)

Since the Amazon OpenSearch Service takes care of the infrastructure described previously — but not necessarily on the same implementation — all you really need to concern yourself with is creating the connections using the instructions in our service documentation.

Once you complete the steps in the instructions and remove your own implementation, your architecture is then simplified as seen in the following diagram.

Once you complete the steps in the instructions and remove your own implementation, your architecture is then simplified.

At this point, the development teams (API team 1 and API team 2) can access the Amazon OpenSearch cluster via Amazon OpenSearch Service Managed VPC Endpoint. This option is highly scalable with a simplified network architecture in which you don’t have to worry about managing a NLB, or setting up target groups and the additional resources. If the number of development teams and VPCs grow in the future, you associate the domain with the associated interface VPC endpoint. You can access services in VPCs in same or different accounts, even if there are overlapping CIDR Block IP ranges.

Conclusion

In this post, we walked through the architectural design of accessing Amazon OpenSearch cluster from different VPCs across different accounts using OpenSearch Service-managed VPC endpoint (AWS PrivateLink). Using Transit Gateway, self-managed AWS PrivateLink or VPC peering required complex networking strategies that increased operation burden. With the introduction of VPC endpoints for Amazon OpenSearch Service, the complexity of your solutions is greatly simplified and what’s even better, it’s managed for you!


About the authors

Aish Gunasekar is a Specialist Solutions architect with a focus on Amazon OpenSearch Service. Her passion at AWS is to help customers design highly scalable architectures and help them in their cloud adoption journey. Outside of work, she enjoys hiking and baking.

Kevin Fallis (@AWSCodeWarrior) is an AWS specialist search solutions architect.  His passion at AWS is to help customers leverage the correct mix of AWS services to achieve success for their business goals. His after-work activities include family, DIY projects, carpentry, playing drums, and all things music.

Introducing VPC Lattice – Simplify Networking for Service-to-Service Communication (Preview)

Post Syndicated from Danilo Poccia original https://aws.amazon.com/blogs/aws/introducing-vpc-lattice-simplify-networking-for-service-to-service-communication-preview/

Modern applications are built using modular and distributed components. Each component is a service that implements its own subset of functionalities. To make these services communicate with each other, you need a way to let them discover where they are, authorize access, and route traffic. When troubleshooting issues, you need to keep communication configurations under control so that you can quickly understand what is happening at the application, service, and network levels. This can take a lot of your time.

Today, we are making available in preview Amazon VPC Lattice, a new capability of Amazon Virtual Private Cloud (Amazon VPC) that gives you a consistent way to connect, secure, and monitor communication between your services. With VPC Lattice, you can define policies for traffic management, network access, and monitoring so you can connect applications in a simple and consistent way across AWS compute services (instances, containers, and serverless functions). VPC Lattice automatically handles network connectivity between VPCs and accounts and network address translation between IPv4, IPv6, and overlapping IP addresses. VPC Lattice integrates with AWS Identity and Access Management (IAM) to give you the same authentication and authorization capabilities you are familiar with when interacting with AWS services today, but for your own service-to-service communication. With VPC Lattice, you have common controls to route traffic based on request characteristics and weighted routing for blue/green and canary-style deployments. For example, VPC Lattice allows you to mix and match compute types for a given service, which helps you modernize a monolith application architecture to microservices.

VPC Lattice is designed to be noninvasive, allowing teams across your organization to incrementally opt in over time. In this way, you are able to deliver applications faster by focusing on your application logic, while VPC Lattice handles service-to-service networking, security, and monitoring requirements.

How Amazon VPC Lattice Works
With VPC Lattice, you create a logical application layer network, called a service network, that connects clients and services across different VPCs and accounts, abstracting network complexity. A service network is a logical boundary that is used to automatically implement service discovery and connectivity as well as apply access and observability policies to a collection of services. It offers inter-application connectivity over HTTP/HTTPS and gRPC protocols within a VPC.

Once a VPC has been enabled for a service network, clients in the VPC will automatically be able to discover the services in the service network through DNS and will direct all inter-application traffic through VPC Lattice. You can use AWS Resource Access Manager (RAM) to control which accounts, VPCs, and applications can establish communication via VPC Lattice.

A service is an independently deployable unit of software that delivers a specific task or function. In VPC Lattice, a service is a logical component that can live in any VPC or account and can run on a mixture of compute types (virtual machines, containers, and serverless functions). A service configuration consists of:

  • One or two listeners that define the port and protocol that the service is expecting traffic on. Supported protocols are HTTP/1.1, HTTP/2, and gRPC, including HTTPS for TLS-enabled services.
  • Listeners have rules that consist of a priority, which specifies the order in which rules should be processed, one or more conditions that define when to apply the rule, and actions that forward traffic to target groups. Each listener has a default rule that takes effect when no additional rules are configured, or no conditions are met.
  • A target group is a collection of targets, or compute resources, that are running a specific workload you are trying to route toward. Targets can be Amazon Elastic Compute Cloud (Amazon EC2) instances, IP addresses, and Lambda functions. For Kubernetes workloads, VPC Lattice can target services and pods via the AWS Gateway Controller for Kubernetes. To have access to the AWS Gateway Controller for Kubernetes, you can join the preview.

VPC Lattice logical architecture.

To configure service access controls, you can use access policies. An access policy is an IAM resource policy that can be associated with a service network and individual services. With access policies, you can use the “PARC” (principal, action, resource, and condition) model to enforce context-specific access controls for services. For example, you can use an access policy to define which services can access a service you own. If you use AWS Organizations, you can limit access to a service network to a specific organization.

VPC Lattice also provides a service directory, a centralized view of the services that you own or have been shared with you via AWS RAM.

Using Amazon VPC Lattice
We expect people with different roles can use VPC Lattice. For example:

  • The service network administrator can:
    • Create and manage a service network.
    • Define access and monitoring for the service network.
    • Associate client and services.
    • Share the service network with other AWS accounts.
  • The service owner can:
    • Create and manage a service, including access and monitoring.
    • Define routing, for example, configuring listeners and rules that point to the target groups where the service is running.
    • Associate a service to service networks.

Let’s see how this works in practice. In this quick walkthrough, I am covering both roles.

Creating Two Backend Services
There is nothing specific to VPC Lattice in this section. I am just creating a couple of services, one running on Amazon EC2 and one on AWS Lambda, that I’ll use later when I configure networking with VPC Lattice.

In an Amazon Linux EC2 instance, I create a web app that replies “Hello from the instance” to HTTP requests. To allow access to the instance from clients coming via VPC Lattice, I add an inbound rule to the security group to allow TCP traffic on port 8080 from the VPC Lattice AWS-managed prefix list.

Here’s the app.py file. I am using Python and Flask for this app, but you don’t need to know them to follow along with the post.

from flask import Flask

app = Flask(__name__)

@app.route('/')
def index():
  return 'Hello from the instance'

@app.route('/<path>')
def somePath(path):
  return 'Hello from the instance at path "{}"'.format(path)

app.run(host='0.0.0.0', port=8080)

Here’s the requirements.txt file with the Python dependencies. There’s only one line because the only module I need is flask:

flask

I install the dependencies:

pip3 install -r requirements.txt

Then, I start the web app using the nohup command to keep it running in case I log out of the instance:

nohup flask run --host=0.0.0.0 --port 8080 &

On the EC2 instance, the web service is now listening to HTTP traffic on port 8080.

In the Lambda console, I create a simple function using the Node.js 18.x runtime that replies “Hello from the function” to all invocations.

exports.handler = async (event) => {
    const response = {
        statusCode: 200,
        body: JSON.stringify('Hello from the function'),
    };
    return response;
};

The two services are now both ready. Let’s use VPC Lattice to configure networking.

Creating VPC Lattice Target Groups
I start by creating two target groups, one for the EC2 instance and one for the Lambda function. In the VPC console, there is a new VPC Lattice section in the navigation pane. There, I choose Target groups and then Create target group.

For the first target group, I choose the Instances target type and enter a name.

Console screenshot.

I choose the protocol (HTTP) and port (8080) used by the web app running on the instance. I select the VPC where the instance is running and the protocol version (HTTP1).

Console screenshot.

Now I can configure the health check that will be used to test the target status. In this case, I use the default values proposed by the console.

Console screenshot.

In the next step, I can register the targets. I select the instance on which the web app is running from the list and choose to include it.

Console screenshot.

I review the selected targets (one instance in this case) and choose Submit.

In a similar way, I create a target group for the Lambda function. This time, I select the function from the list. I can choose which function version or function alias to use. For simplicity, I use the $LATEST version.

Console screenshot.

Creating VPC Lattice Services
Now that the target groups are ready, I choose Services in the navigation pane and then Create service. I enter a name and a description.

Console screenshot.

Now, I can choose the authentication type. If I choose None, the service network does not authenticate or authorize client access, and the auth policy, if present, is not used. I select AWS IAM and then, from the Apply policy template dropdown, the template that allows both authenticated and unauthenticated access.

Console screenshot.

In the Monitoring section, I turn on Access logs. As the destination for the access logs, I use an Amazon CloudWatch Log group that I created before. I also have the option to use an Amazon Simple Storage Service (Amazon S3) bucket or a Amazon Kinesis Data Firehose delivery stream.

Console screenshot.

In the next step, I define routing for the service. I choose Add listener. For the protocol, I configure the service to listen using HTTPS. In the default action, I choose to send two-thirds (Weight 20) of the requests to the instance target group and one-third (Weight 10) to the function target group.

Console screenshot.

Then, I add two additional rules. The first rule (Priority 10) sends all requests where the path is /to-instance to the instance target group.

Console screenshot.

The second rule (Priority 20) sends all traffic where the path is /to-function to the function target group.

Console screenshot.

In the next step, I am asked to associate the service with one or more service networks. I didn’t create a service network yet, so I skip this step for now and choose Next. I review the configuration and create the service.

Creating VPC Lattice Service Networks
Now, I create the service network so that I can associate the service and the VPCs I want to use. I choose Service network from the navigation pane and then Create service network. I enter a name and a description for the service network.

Console screenshot.

In the Associate services, I select the service I just created.

Console screenshot.

In the VPC associations, I select the VPC used by the instance where the web app runs. This can help in the future because it allows the web app to call other services associated with the service network.

Console screenshot.

Then, I select a second VPC where I have another EC2 instance that I want to use to run some tests.

Console screenshot.

For simplicity, in the Access section, I select the None auth type.

Console screenshot.

In the Monitoring section, I choose to send the access logs for the whole service network to an S3 bucket.

Console screenshot.

I review the summary of the configuration and create the service network. After a few seconds all service and VPC associations are active, and I can start using the service.

I write down the domain name of the service from the list of service associations.

Console screenshot.

Testing Access to the Service Using VPC Lattice
I look at the Routing tab of the service to find a nice recap of how the listener is handling routing towards the different target groups.

Console screenshot.

Then, I log into the EC2 instance in my second VPC and use curl to call the service domain name. As expected, I get about two-thirds of the responses from the instance and one-third from the function.

curl https://my-service-03e92ee54968d87ca.7d67968.vpc-lattice-svcs.us-west-2.on.aws
Hello from the instance

curl https://my-service-03e92ee54968d87ca.7d67968.vpc-lattice-svcs.us-west-2.on.aws
Hello from the instance

curl https://my-service-03e92ee54968d87ca.7d67968.vpc-lattice-svcs.us-west-2.on.aws
"Hello from the function"

When I call the /to-instance and /to-function paths, the additional rules forward the requests to the instance and the function, respectively.

curl https://my-service-03e92ee54968d87ca.7d67968.vpc-lattice-svcs.us-west-2.on.aws/to-instance
Hello from the instance "to-instance" path

curl https://my-service-03e92ee54968d87ca.7d67968.vpc-lattice-svcs.us-west-2.on.aws/to-function
"Hello from the function"

I can now review access to my service using the access log subscriptions I configured before.

For the service, I look in the CloudWatch Log group. There, I find a log stream containing detailed access information about the service.

Console screenshot.

The access log for all services associated with the service network is on the S3 bucket. I have only one service for now, but more are coming.

Console screenshot.

Available in Preview
Amazon VPC Lattice is available in preview in the US West (Oregon) Region.

VPC Lattice provides deployment consistency across AWS compute types so that you can connect your services across instances, containers, and serverless functions. You can use VPC Lattice to apply granular and rich traffic controls, such as policy-based routing and weighted targets to support blue/green and canary-style deployments.

VPC Lattice allows monitoring and troubleshooting service-to-service communication with detailed access logs and metrics that capture request type, volume of traffic, error rates, response time, and more. In this blog post, I only scratched the surface of what you can do with VPC Lattice.

Simplify the way you connect, secure, and monitor service-to-service communication with Amazon VPC Lattice.