Post Syndicated from Jonathan Nguyen original https://aws.amazon.com/blogs/security/how-to-generate-security-findings-to-help-your-security-team-with-incident-response-simulations/
Continually reviewing your organization’s incident response capabilities can be challenging without a mechanism to create security findings with actual Amazon Web Services (AWS) resources within your AWS estate. As prescribed within the AWS Security Incident Response whitepaper, it’s important to periodically review your incident response capabilities to make sure your security team is continually maturing internal processes and assessing capabilities within AWS. Generating sample security findings is useful to understand the finding format so you can enrich the finding with additional metadata or create and prioritize detections within your security information event management (SIEM) solution. However, if you want to conduct an end-to-end incident response simulation, including the creation of real detections, sample findings might not create actionable detections that will start your incident response process because of alerting suppressions you might have configured, or imaginary metadata (such as synthetic Amazon Elastic Compute Cloud (Amazon EC2) instance IDs), which might confuse your remediation tooling.
In this post, we walk through how to deploy a solution that provisions resources to generate simulated security findings for actual provisioned resources within your AWS account. Generating simulated security findings in your AWS account gives your security team an opportunity to validate their cyber capabilities, investigation workflow and playbooks, escalation paths across teams, and exercise any response automation currently in place.
Important: It’s strongly recommended that the solution be deployed in an isolated AWS account with no additional workloads or sensitive data. No resources deployed within the solution should be used for any purpose outside of generating the security findings for incident response simulations. Although the security findings are non-destructive to existing resources, they should still be done in isolation. For any AWS solution deployed within your AWS environment, your security team should review the resources and configurations within the code.
Conducting incident response simulations
Before deploying the solution, it’s important that you know what your goal is and what type of simulation to conduct. If you’re primarily curious about the format that active Amazon GuardDuty findings will create, you should generate sample findings with GuardDuty. At the time of this writing, Amazon Inspector doesn’t currently generate sample findings.
If you want to validate your incident response playbooks, make sure you have playbooks for the security findings the solution generates. If those playbooks don’t exist, it might be a good idea to start with a high-level tabletop exercise to identify which playbooks you need to create.
Because you’re running this sample in an AWS account with no workloads, it’s recommended to run the sample solution as a purple team exercise. Purple team exercises should be periodically run to support training for new analysts, validate existing playbooks, and identify areas of improvement to reduce the mean time to respond or identify areas where processes can be optimized with automation.
Now that you have a good understanding of the different simulation types, you can create security findings in an isolated AWS account.
Prerequisites
- [Recommended] A separate AWS account containing no customer data or running workloads
- GuardDuty, along with GuardDuty Kubernetes Protection
- Amazon Inspector must be enabled
- [Optional] AWS Security Hub can be enabled to show a consolidated view of security findings generated by GuardDuty and Inspector
Solution architecture
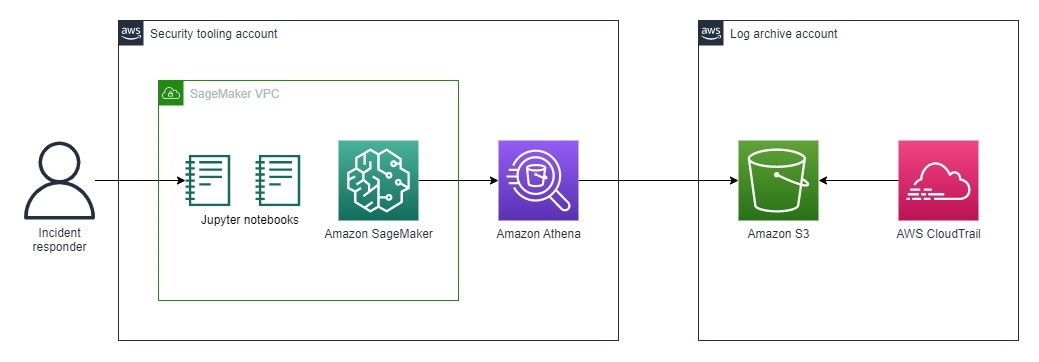
The architecture of the solution can be found in Figure 1.

Figure 1: Sample solution architecture diagram
- A user specifies the type of security findings to generate by passing an AWS CloudFormation parameter.
- An Amazon Simple Notification Service (Amazon SNS) topic is created to subscribe to findings for notifications. Subscribed users are notified of the finding through the deployed SNS topic.
- Upon user selection of the CloudFormation parameter, EC2 instances are provisioned to run commands to generate security findings.
Note: If the parameter inspector is provided during deployment, then only one EC2 instance is deployed. If the parameter guardduty is provided during deployment, then two EC2 instances are deployed.
- For Amazon Inspector findings:
- The Amazon EC2 user data creates a .txt file with vulnerable images, pulls down Docker images from open source vulhub, and creates an Amazon Elastic Container Registry (Amazon ECR) repository with the vulnerable images.
- The EC2 user data pushes and tags the images in the ECR repository which results in Amazon Inspector findings being generated.
- An Amazon EventBridge cron-style trigger rule, inspector_remediation_ecr, invokes an AWS Lambda function.
- The Lambda function, ecr_cleanup_function, cleans up the vulnerable images in the deployed Amazon ECR repository based on applied tags and sends a notification to the Amazon SNS topic.
Note: The ecr_cleanup_function Lambda function is also invoked as a custom resource to clean up vulnerable images during deployment. If there are issues with cleanup, the EventBridge rule continually attempts to clean up vulnerable images.
- For GuardDuty, the following actions are taken and resources are deployed:
- An AWS Identity and Access Management (IAM) user named guardduty-demo-user is created with an IAM access key that is INACTIVE.
- An AWS Systems Manager parameter stores the IAM access key for guardduty-demo-user.
- An AWS Secrets Manager secret stores the inactive IAM secret access key for guardduty-demo-user.
- An Amazon DynamoDB table is created, and the table name is stored in a Systems Manager parameter to be referenced within the EC2 user data.
- An Amazon Simple Storage Service (Amazon S3) bucket is created, and the bucket name is stored in a Systems Manager parameter to be referenced within the EC2 user data.
- A Lambda function adds a threat list to GuardDuty that includes the IP addresses of the EC2 instances deployed as part of the sample.
- EC2 user data generates GuardDuty findings for the following:
- Amazon Elastic Kubernetes Service (Amazon EKS)
- Installs eksctl from GitHub.
- Creates an EC2 key pair.
- Creates an EKS cluster (dependent on availability zone capacity).
- Updates EKS cluster configuration to make a dashboard public.
- DynamoDB
- Adds an item to the DynamoDB table for Joshua Tree.
- EC2
- Creates an AWS CloudTrail trail named guardduty-demo-trail-<GUID> and subsequently deletes the same CloudTrail trail. The <GUID> is randomly generated by using the $RANDOM function
- Runs portscan on 172.31.37.171 (an RFC 1918 private IP address) and private IP of the EKS Deployment EC2 instance provisioned as part of the sample. Port scans are primarily used by bad actors to search for potential vulnerabilities. The target of the port scans are internal IP addresses and do not leave the sample VPC deployed.
- Curls DNS domains that are labeled for bitcoin, command and control, and other domains associated with known threats.
- Amazon S3
- Disables Block Public Access and server access logging for the S3 bucket provisioned as part of the solution.
- IAM
- Deletes the existing account password policy and creates a new password policy with a minimum length of six characters.
- Amazon Elastic Kubernetes Service (Amazon EKS)
- The following Amazon EventBridge rules are created:
- guardduty_remediation_eks_rule – When a GuardDuty finding for EKS is created, a Lambda function attempts to delete the EKS resources. Subscribed users are notified of the finding through the deployed SNS topic.
- guardduty_remediation_credexfil_rule – When a GuardDuty finding for InstanceCredentialExfiltration is created, a Lambda function is used to revoke the IAM role’s temporary security credentials and AWS permissions. Subscribed users are notified of the finding through the deployed SNS topic.
- guardduty_respond_IAMUser_rule – When a GuardDuty finding for IAM is created, subscribed users are notified through the deployed SNS topic. There is no remediation activity triggered by this rule.
- Guardduty_notify_S3_rule – When a GuardDuty finding for Amazon S3 is created, subscribed users are notified through the deployed Amazon SNS topic. This rule doesn’t invoke any remediation activity.
- The following Lambda functions are created:
- guardduty_iam_remediation_function – This function revokes active sessions and sends a notification to the SNS topic.
- eks_cleanup_function – This function deletes the EKS resources in the EKS CloudFormation template.
Note: Upon attempts to delete the overall sample CloudFormation stack, this runs to delete the EKS CloudFormation template.
- An S3 bucket stores EC2 user data scripts run from the EC2 instances
Solution deployment
You can deploy the SecurityFindingGeneratorStack solution by using either the AWS Management Console or the AWS Cloud Development Kit (AWS CDK).
Option 1: Deploy the solution with AWS CloudFormation using the console
Use the console to sign in to your chosen AWS account and then choose the Launch Stack button to open the AWS CloudFormation console pre-loaded with the template for this solution. It takes approximately 10 minutes for the CloudFormation stack to complete.
![]()
Option 2: Deploy the solution by using the AWS CDK
You can find the latest code for the SecurityFindingGeneratorStack solution in the SecurityFindingGeneratorStack GitHub repository, where you can also contribute to the sample code. For instructions and more information on using the AWS Cloud Development Kit (AWS CDK), see Get Started with AWS CDK.
To deploy the solution by using the AWS CDK
- To build the app when navigating to the project’s root folder, use the following commands:
- Run the following command in your terminal while authenticated in your separate deployment AWS account to bootstrap your environment. Be sure to replace <INSERT_AWS_ACCOUNT> with your account number and replace <INSERT_REGION> with the AWS Region that you want the solution deployed to.
- Deploy the stack to generate findings based on a specific parameter that is passed. The following parameters are available:
- inspector
- guardduty
Reviewing security findings
After the solution successfully deploys, security findings should start appearing in your AWS account’s GuardDuty console within a couple of minutes.
Amazon GuardDuty findings
In order to create a diverse set of GuardDuty findings, the solution uses Amazon EC2 user data to run scripts. Those scripts can be found in the sample repository. You can also review and change scripts as needed to fit your use case or to remove specific actions if you don’t want specific resources to be altered or security findings to be generated.
A comprehensive list of active GuardDuty finding types and details for each finding can be found in the Amazon GuardDuty user guide. In this solution, activities which cause the following GuardDuty findings to be generated, are performed:
- Backdoor:EC2/C&CActivity.B!DNS
- CryptoCurrency:EC2/BitcoinTool.B!DNS
- Stealth:IAMUser/PasswordPolicyChange
- Discovery:Kubernetes/SuccessfulAnonymousAccess
- Discovery:Kubernetes/MaliciousIPCaller
- Execution:Kubernetes/ExecInKubeSystemPod
- Policy:Kubernetes/AdminAccessToDefaultServiceAccount
- Policy:Kubernetes/AnonymousAccessGranted
- Persistence:Kubernetes/ContainerWithSensitiveMount
- PrivilegeEscalation:Kubernetes/PrivilegedContainer
- Recon:EC2/Portscan
- Policy:S3/BucketBlockPublicAccessDisabled
- Stealth:S3/ServerAccessLoggingDisabled
- Trojan:EC2/BlackholeTraffic!DNS
- Trojan:EC2/DGADomainRequest.B
- Trojan:EC2/DNSDataExfiltration
- Trojan:EC2/DriveBySourceTraffic!DNS
- Trojan:EC2/PhishingDomainRequest!DNS
- UnauthorizedAccess:EC2/TorClient
- UnauthorizedAccess:EC2/MetadataDNSRebind
- UnauthorizedAccess:EC2/MaliciousIPCaller.Custom
To generate the EKS security findings, the EKS Deployment EC2 instance is running eksctl commands that deploy CloudFormation templates. If the EKS cluster doesn’t deploy, it might be because of capacity restraints in a specific Availability Zone. If this occurs, manually delete the failed EKS CloudFormation templates.
If you want to create the EKS cluster and security findings manually, you can do the following:
- Sign in to the Amazon EC2 console.
- Connect to the EKS Deployment EC2 instance using an IAM role that has access to start a session through Systems Manager. After connecting to the ssm-user, issue the following commands in the Session Manager session:
- sudo chmod 744 /home/ec2-user/guardduty-script.sh
- chown ec2-user /home/ec2-user/guardduty-script.sh
- sudo /home/ec2-user/guardduty-script.sh
It’s important that your security analysts have an incident response playbook. If playbooks don’t exist, you can refer to the GuardDuty remediation recommendations or AWS sample incident response playbooks to get started building playbooks.
Amazon Inspector findings
The findings for Amazon Inspector are generated by using the open source Vulhub collection. The open source collection has pre-built vulnerable Docker environments that pull images into Amazon ECR.
The Amazon Inspector findings that are created vary depending on what exists within the open source library at deployment time. The following are examples of findings you will see in the console:
- CVE-2022-28347 – django
- CVE-2022-34265 – django, django
- CVE-2023-31047 – django, django
- CVE-2022-28346 – django
- CVE-2023-24816 – ipython
- CVE-2021-45115 – django
- CVE-2022-23833 – django
- CVE-2021-31542 – django
- CVE-2023-4622 – kernel-devel, kernel
- CVE-2023-36053 – django, django
- CVE-2021-45116 – django
- CVE-2023-4207 – kernel-devel, kernel
- CVE-2023-24580 – django, django
- CVE-2022-36359 – django, django
- CVE-2023-4623 – kernel-devel, kernel
- CVE-2021-44420 – django
- CVE-2023-4921 – kernel-devel, kernel
- CVE-2022-22818 – django
- CVE-2021-45452 – django
- CVE-2021-33203 – django
- CVE-2021-32052 – django
- CVE-2021-3281 – django
- CVE-2023-3772 – kernel-devel, kernel
- CVE-2023-43804 – urllib3
- IN1-PYTHON-DJANGO-5880505 – django, django
- IN1-PYTHON-PYLINT-568073 – pylint, pylint
- IN1-PYTHON-DJANGO-5932095 – django, django
- IN1-PYTHON-PYLINT-1089548 – pylint, pylint
- IN1-PYTHON-PYLINT-609883 – pylint, pylint
For Amazon Inspector findings, you can refer to parts 1 and 2 of Automate vulnerability management and remediation in AWS using Amazon Inspector and AWS Systems Manager.
Clean up
If you deployed the security finding generator solution by using the Launch Stack button in the console or the CloudFormation template security_finding_generator_cfn, do the following to clean up:
- In the CloudFormation console for the account and Region where you deployed the solution, choose the SecurityFindingGeneratorStack stack.
- Choose the option to Delete the stack.
If you deployed the solution by using the AWS CDK, run the command cdk destroy.
Important: The solution uses eksctl to provision EKS resources, which deploys additional CloudFormation templates. There are custom resources within the solution that will attempt to delete the provisioned CloudFormation templates for EKS. If there are any issues, you should verify and manually delete the following CloudFormation templates:
- eksctl-GuardDuty-Finding-Demo-cluster
- eksctl-GuardDuty-Finding-Demo-addon-iamserviceaccount-kube-system-aws-node
- eksctl-GuardDuty-Finding-Demo-nodegroup-ng-<GUID>
Conclusion
In this blog post, I showed you how to deploy a solution to provision resources in an AWS account to generate security findings. This solution provides a technical framework to conduct periodic simulations within your AWS environment. By having real, rather than simulated, security findings, you can enable your security teams to interact with actual resources and validate existing incident response processes. Having a repeatable mechanism to create security findings also provides your security team the opportunity to develop and test automated incident response capabilities in your AWS environment.
AWS has multiple services to assist with increasing your organization’s security posture. Security Hub provides native integration with AWS security services as well as partner services. From Security Hub, you can also implement automation to respond to findings using custom actions as seen in Use Security Hub custom actions to remediate S3 resources based on Amazon Macie discovery results. In part two of a two-part series, you can learn how to use Amazon Detective to investigate security findings in EKS clusters. Amazon Security Lake automatically normalizes and centralizes your data from AWS services such as Security Hub, AWS CloudTrail, VPC Flow Logs, and Amazon Route 53, as well as custom sources to provide a mechanism for comprehensive analysis and visualizations.
If you have feedback about this post, submit comments in the Comments section below. If you have questions about this post, start a new thread on the Incident Response re:Post or contact AWS Support.


 ) in the toolbar at the top of the console.