Post Syndicated from Aravind Gopaluni original https://aws.amazon.com/blogs/security/scale-your-authorization-needs-for-secrets-manager-using-abac-with-iam-identity-center/
With AWS Secrets Manager, you can securely store, manage, retrieve, and rotate the secrets required for your applications and services running on AWS. A secret can be a password, API key, OAuth token, or other type of credential used for authentication purposes. You can control access to secrets in Secrets Manager by using AWS Identity and Access Management (IAM) permission policies. In this blog post, I will show you how to use principles of attribute-based access control (ABAC) to define dynamic IAM permission policies in AWS IAM Identity Center (successor to AWS Single Sign-On) by using user attributes from an external identity provider (IdP) and resource tags in Secrets Manager.
What is ABAC and why use it?
Attribute-based access control (ABAC) is an authorization strategy that defines permissions based on attributes or characteristics of the user, the data, or the environment, such as the department, business unit, or other factors that could affect the authorization outcome. In the AWS Cloud, these attributes are called tags. By assigning user attributes as principal tags, you can simplify the process of creating fine-grained permissions on AWS.
With ABAC, you can use attributes to build more dynamic policies that provide access based on matching attribute conditions. ABAC rules are evaluated dynamically at runtime, which means that the users’ access to applications and data and the type of allowed operations automatically change based on the contextual factors in the policy. For example, if a user changes department, access is automatically adjusted without the need to update permissions or request new roles. You can use ABAC in conjunction with role-based access control (RBAC) to combine the ease of policy administration with flexible policy specification and dynamic decision-making capability to enforce least privilege.
AWS IAM Identity Center (successor to AWS Single Sign-On) expands the capabilities of IAM to provide a central place that brings together the administration of users and their access to AWS accounts and cloud applications. With IAM Identity Center, you can define user permissions and manage access to accounts and applications in your AWS Organizations organization centrally. You can also create ABAC permission policies in a central place. ABAC will work with attributes from a supported identity source in IAM Identity Center. For a list of supported external IdPs for identity synchronization through the System for Cross-domain Identity Management (SCIM) and Security Assertion Markup Language (SAML) 2.0, see Supported identity providers.
The following are key benefits of using ABAC with IAM Identity Center and Secrets Manager:
- Fewer permission sets — With ABAC, multiple users who use the same IAM Identity Center permission set and the same IAM role can still get unique permissions, because permissions are now based on user attributes. Administrators can author IAM policies that grant users access only to secrets that have matching attributes. This helps reduce the number of distinct permissions that you need to create and manage in IAM Identity Center and, in turn, reduces your permission management complexity.
- Teams can change and grow quickly — When you create new secrets, you can apply the appropriate tags, which will automatically grant access without requiring you to update the permission policies.
- Use employee attributes from your corporate directory to define access — You can use existing employee attributes from a supported identity source configured in IAM Identity Center to make access control decisions on AWS.
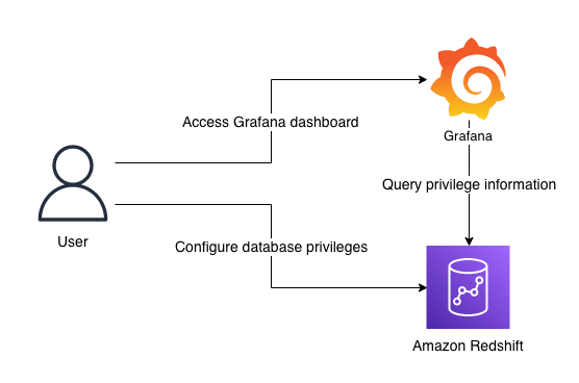
Figure 1 shows a framework to control access to Secrets Manager secrets using IAM Identity Center and ABAC principles.
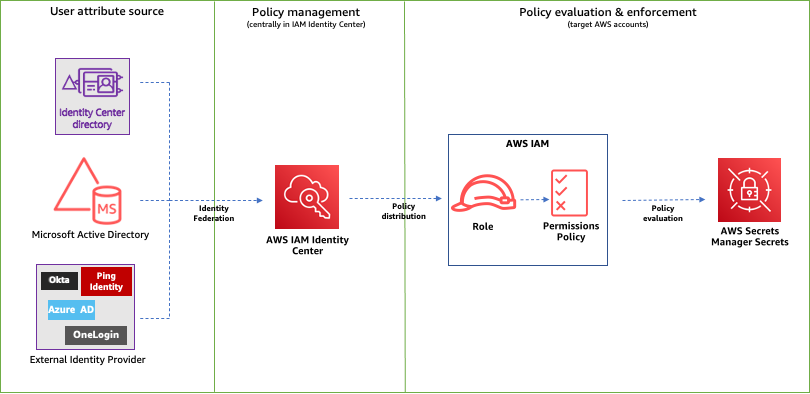
Figure 1: ABAC framework to control access to secrets using IAM Identity Center
The following is a brief introduction to the basic components of the framework:
- User attribute source or identity source — This is where your users and groups are administered. You can configure a supported identity source with IAM Identity Center. You can then define and manage supported user attributes in the identity source.
- Policy management — You can create and maintain policy definitions (permission sets) centrally in IAM Identity Center. You can assign access to a user or group to one or more accounts in IAM Identity Center with these permission sets. You can then use attributes defined in your identity source to build ABAC policies for managing access to secrets.
- Policy evaluation — When you assign a permission set, IAM Identity Center creates corresponding IAM Identity Center-controlled IAM roles in each account, and attaches the policies specified in the permission set to those roles. IAM Identity Center manages the role, and allows the authorized users that you’ve defined to assume the role. When users try to access a secret, IAM dynamically evaluates ABAC policies on the target account to determine access based on the attributes assigned to the user and resource tags assigned to that secret.
How to configure ABAC with IAM Identity Center
To configure ABAC with IAM Identity Center, you need to complete the following high-level steps. I will walk you through these steps in detail later in this post.
- Identify and set up identities that are created and managed in the identity source with user attributes, such as project, team, AppID or department.
- In IAM Identity Center, enable Attributes for access control and configure select attributes (such as department) to use for access control. For a list of supported attributes, see Supported external identity provider attributes.
- If you are using an external IdP and choose to use custom attributes from your IdP for access controls, configure your IdP to send the attributes through SAML assertions to IAM Identity Center.
- Assign appropriate tags to secrets in Secrets Manager.
- Create permission sets based on attributes added to identities and resource tags.
- Define guardrails to enforce access using ABAC.
ABAC enforcement and governance
Because an ABAC authorization model is based on tags, you must have a tagging strategy for your resources. To help prevent unintended access, you need to make sure that tagging is enforced and that a governance model is in place to protect the tags from unauthorized updates. By using service control policies (SCPs) and AWS Organizations tag policies, you can enforce tagging and tag governance on resources.
When you implement ABAC for your secrets, consider the following guidance for establishing a tagging strategy:
- During secret creation, secrets must have an ABAC tag applied (tag-on-create).
- During secret creation, the provided ABAC tag key must be the same case as the principal’s ABAC tag key.
- After secret creation, the ABAC tag cannot be modified or deleted.
- Only authorized principals can do tagging operations on secrets.
- You enforce the permissions that give access to secrets through tags.
For more information on tag strategy, enforcement, and governance, see the following resources:
- AWS Tagging Best Practices
- Implement AWS resource tagging strategy using AWS Tag Policies and Service Control Policies (SCPs)
- Securing resource tags used for authorization using a service control policy in AWS Organizations
- Protecting your ABAC security model through SCP guardrails
Solution overview
In this post, I will walk you through the steps to enable the IdP that is supported by IAM Identity Center.

Figure 2: Sample solution implementation
In the sample architecture shown in Figure 2, Arnav and Ana are users who each have the attributes department and AppID. These attributes are created and updated in the external directory—Okta in this case. The attribute department is automatically synchronized between IAM Identity Center and Okta using SCIM. The attribute AppID is a custom attribute configured on Okta, and is passed to AWS as a SAML assertion. Both users are configured to use the same IAM Identity Center permission set that allows them to retrieve the value of secrets stored in Secrets Manager. However, access is granted based on the tags associated with the secret and the attributes assigned to the user.
For example, user Arnav can only retrieve the value of the RDS_Master_Secret_AppAlpha secret. Although both users work in the same department, Arnav can’t retrieve the value of the RDS_Master_Secret_AppBeta secret in this sample architecture.
Prerequisites
Before you implement the solution in this blog post, make sure that you have the following prerequisites in place:
- You have IAM Identity Center enabled for your organization and connected to an external IdP using SAML 2.0 identity federation.
- You have IAM Identity Center configured for automatic provisioning with an external IdP using the SCIM v2.0 standard. SCIM keeps your IAM Identity Center identities in sync with identities from the external IdP.
Solution implementation
In this section, you will learn how to enable access to Secrets Manager using ABAC by completing the following steps:
- Configure ABAC in IAM Identity Center
- Define custom attributes in Okta
- Update configuration for the IAM Identity Center application on Okta
- Make sure that required tags are assigned to secrets in Secrets Manager
- Create and assign a permission set with an ABAC policy in IAM Identity Center
- Define guardrails to enforce access using ABAC
Step 1: Configure ABAC in IAM Identity Center
The first step is to set up attributes for your ABAC configuration in IAM Identity Center. This is where you will be mapping the attribute coming from your identity source to an attribute that IAM Identity Center passes as a session tag. The Key represents the name that you are giving to the attribute for use in the permission set policies. You need to specify the exact name in the policies that you author for access control. For the example in this post, you will create a new attribute with Key of department and Value of ${path:enterprise.department}. For supported external IdP attributes, see Attribute mappings.
To configure ABAC in IAM Identity Center (console)
- Open the IAM Identity Center console.
- In the Settings menu, enable Attributes for access control.
- Choose the Attributes for access control tab, select Add attribute, and then enter the Key and Value details as follows.
- Key: department
- Value: ${path:enterprise.department}
Note: For more information, see Attributes for access control.
Step 2: Define custom attributes in Okta
The sample architecture in this post uses a custom attribute (AppID) on an external IdP for access control. In this step, you will create a custom attribute in Okta.
To define custom attributes in Okta (console)
- Open the Okta console.
- Navigate to Directory and then select Profile Editor.
- On the Profile Editor page, choose Okta User (default).
- Select Add Attribute and create a new custom attribute with the following parameters.
- For Data type, enter string
- For Display name, enter AppID
- For Variable name, enter user.AppID
- For Attribute length, select Less Than from the dropdown and enter a value.
- For User permission, enter Read Only
- Navigate to Directory, select People, choose in-scope users, and enter a value for Department and AppID attributes. The following shows these values for the users in our example.
- First name (firstName): Arnav
- Last name (lastName): Desai
- Primary email (email): [email protected]
- Department (department): Digital
- AppID: Alpha
- First name (firstName): Ana
- Last name (lastName): Carolina
- Primary email (email): [email protected]
- Department (department): Digital
- AppID: Beta
Step 3: Update SAML configuration for IAM Identity Center application on Okta
Automatic provisioning (through the SCIM v2.0 standard) of user and group information from Okta into IAM Identity Center supports a set of defined attributes. A custom attribute that you create on Okta won’t be automatically synchronized to IAM Identity Center through SCIM. You can, however, define the attribute in the SAML configuration so that it is inserted into the SAML assertions.
To update the SAML configuration in Okta (console)
- Open the Okta console and navigate to Applications.
- On the Applications page, select the app that you defined for IAM Identity Center.
- Under the Sign On tab, choose Edit.
- Under SAML 2.0, expand the Attributes (Optional) section, and add an attribute statement with the following values, as shown in Figure 3:
- Name: https://aws.amazon.com/SAML/Attributes/AccessControl:AppID
- Name format: URI reference
- Value: user.AppID

Figure 3: Sample SAML configuration with custom attributes
- To check that the newly added attribute is reflected in the SAML assertion, choose Preview SAML, review the information, and then choose Save.

Step 4: Make sure that required tags are assigned to secrets in Secrets Manager
The next step is to make sure that the required tags are assigned to secrets in Secrets Manager. You will review the required tags from the Secrets Manager console.
To verify required tags on secrets (console)
- Open the Secrets Manager console in the target AWS account and then choose Secrets.
- Verify that the required tags are assigned to the secrets in scope for this solution, as shown in Figure 4. In our example, the tags are as follows:
- Key: department
- Value: Digital
- Key: AppID
- Value: Alpha or Beta
Figure 4: Sample secret configuration with required tags

Step 5a: Create a permission set in IAM Identity Center using ABAC policy
In this step, you will create a new permission set that allows access to secrets based on the principal attributes and resource tags.
When you enable ABAC and specify attributes, IAM Identity Center passes the attribute value of the authenticated user to AWS Security Token Service (AWS STS) as session tags when an IAM role is assumed. You can use access control attributes in your permission sets by using the aws:PrincipalTag condition key to create access control rules.
To create a permission set (console)
- Open the IAM Identity Center console and navigate to Multi-account permissions.
- Choose Permission sets, and then select Create permission set.
- On the Specify policies and permissions boundary page, choose Inline policy.
- For Inline policy, paste the following sample policy document and then choose Next. This policy allows users to retrieve the value of only those secrets that have resource tags that match the required user attributes (department and AppID in our example).
- Configure the session duration, and optionally provide a description and tags for the permission set.
- Review and create the permission set.
Step 5b: Assign permission set to users in IAM Identity Center
Now that you have created a permission set with ABAC policy, complete the configuration by assigning the permission set to users to grant them access to secrets in one or more accounts in your organization.
To assign a permission set (console)
- Open the IAM Identity Center console and navigate to Multi-account permissions.
- Choose AWS accounts and select one or more accounts to which you want to assign access.
- Choose Assign users or groups.
- On the Assign users and groups page, select the users, groups, or both to which you want to assign access. For this example, I select both Arnav and Ana.
- On the Assign permission sets page, select the permission set that you created in the previous section.
- Review your changes, as shown in Figure 5, and then select Submit.
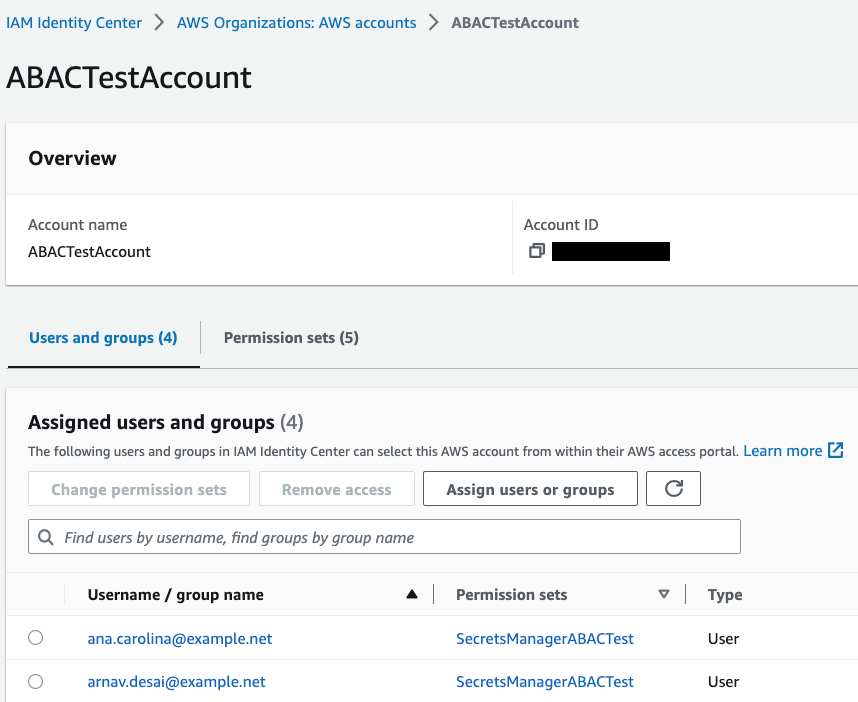
Figure 5: Sample permission set assignment
Step 6: Define guardrails to enforce access using ABAC
To govern access to secrets to your workforce users only through ABAC and to help prevent unauthorized access, you can define guardrails. In this section, I will show you some sample service control policies (SCPs) that you can use in your organization.
Note: Before you use these sample SCPs, you should carefully review, customize, and test them for your unique requirements. For additional instructions on how to attach an SCP, see Attaching and detaching service control policies.
Guardrail 1 – Enforce ABAC to access secrets
The following sample SCP requires the use of ABAC to access secrets in Secrets Manager. In this example, users and secrets must have matching values for the attributes department and AppID. Access is denied if those attributes don’t exist or if they don’t have matching values. Also, this example SCP allows only the admin role to access secrets without matching tags. Replace <arn:aws:iam::*:role/secrets-manager-admin-role> with your own information.
Guardrail 2 – Enforce tagging on secret creation
The following sample SCP denies the creation of new secrets that don’t have the required tag key-value pairs. In this example, the SCP denies creation of a new secret if it doesn’t include department and AppID tag keys. It also denies access if the tag department doesn’t have the value Digital and the tag AppID doesn’t have either Alpha or Beta assigned to it. Also, this example SCP allows only the admin role to create secrets without matching tags. Replace <arn:aws:iam::*:role/secrets-manager-admin-role> with your own information.
Guardrail 3 – Restrict deletion of ABAC tags
The following sample SCP denies the ability to delete the tags used for ABAC. In this example, only the admin role can delete the tags department and AppID after they are attached to a secret. Replace <arn:aws:iam::*:role/secrets-manager-admin-role> with your own information.
Guardrail 4 – Restrict modification of ABAC tags
The following sample SCP denies the ability to modify required tags for ABAC after they are attached to a secret. In this example, only the admin role can modify the tags department and AppID after they are attached to a secret. Replace <arn:aws:iam::*:role/secrets-manager-admin-role> with your own information.
Test the solution
In this section, you will test the solution by retrieving a secret using the Secrets Manager console. Your attempt to retrieve the secret value will be successful only when the required resource and principal tags exist, and have matching values (AppID and department in our example).
Test scenario 1: Retrieve and view the value of an authorized secret
In this test, you will verify whether you can successfully retrieve the value of a secret that belongs to your application.
To test the scenario
- Sign in to IAM Identity Center and log in with your external IdP user. For this example, I log in as Arnav.
- On the IAM Identity Center dashboard, select the target account.
- From the list of available roles that the user has access to, choose the role that you created in Step 5a and select Management console, as shown in Figure 6. For this example, I select the SecretsManagerABACTest permission set.
Figure 6: Sample IAM Identity Center dashboard
- Open the Secrets Manager console and select a secret that belongs to your application. For this example, I select RDS_Master_Secret_AppAlpha.
Because the AppID and department tags exist on both the secret and the user, the ABAC policy allowed the user to describe the secret, as shown in Figure 7.
Figure 7: Sample secret that was described successfully
- In the Secret value section, select Retrieve secret value.
Because the value of the resource tags, AppID and department, matches the value of the corresponding user attributes (in other words, the principal tags), the ABAC policy allows the user to retrieve the secret value, as shown in Figure 8.
Figure 8: Sample secret value that was retrieved successfully


Test scenario 2: Retrieve and view the value of an unauthorized secret
In this test, you will verify whether you can retrieve the value of a secret that belongs to a different application.
To test the scenario
- Repeat steps 1-3 from test scenario 1.
- Open the Secrets Manager console and select a secret that belongs to a different application. For this example, I select RDS_Master_Secret_AppBeta.
Because the value of the resource tag AppID doesn’t match the value of the corresponding user attribute (principal tag), the ABAC policy denies access to describe the secret, as shown in Figure 9.
Figure 9: Sample error when describing an unauthorized secret

Conclusion
In this post, you learned how to implement an ABAC strategy using attributes and to build dynamic policies that can simplify access management to Secrets Manager using IAM Identity Center configured with an external IdP. You also learned how to govern resource tags used for ABAC and establish guardrails to enforce access to secrets using ABAC. To learn more about ABAC and Secrets Manager, see Attribute-Based Access Control (ABAC) for AWS and the Secrets Manager documentation.
If you have feedback about this blog post, submit comments in the Comments section below. If you have questions about this blog post, start a new thread on AWS Secrets Manager re:Post.
Want more AWS Security news? Follow us on Twitter.


 Ennio Pastore is a Senior Data Architect on the AWS Data Lab team. He is an enthusiast of everything related to new technologies that have a positive impact on businesses and general livelihood. Ennio has over 10 years of experience in data analytics. He helps companies define and implement data platforms across industries, such as telecommunications, banking, gaming, retail, and insurance.


 Aruna Govindaraju is an Amazon OpenSearch Specialist Solutions Architect and has worked with many commercial and open-source search engines. She is passionate about search, relevancy, and user experience. Her expertise with correlating end-user signals with search engine behavior has helped many customers improve their search experience. Her favorite pastime is hiking the New England trails and mountains.


 Ahmed Zamzam is a Senior Partner Solutions Architect at Confluent, with a focus on the AWS partnership. In his role, he works with customers in the EMEA region across various industries to assist them in building applications that leverage their data using Confluent and AWS. Prior to Confluent, Ahmed was a Specialist Solutions Architect for Analytics AWS specialized in data streaming and search. In his free time, Ahmed enjoys traveling, playing tennis, and cycling.
 Geetha Anne is a Partner Solutions Engineer at Confluent with previous experience in implementing solutions for data-driven business problems on the cloud, involving data warehousing and real-time streaming analytics. She fell in love with distributed computing during her undergraduate days and has followed her interest ever since. Geetha provides technical guidance, design advice, and thought leadership to key Confluent customers and partners. She also enjoys teaching complex technical concepts to both tech-savvy and general audiences.


 Sandeep Bajwa is a Sr. Analytics Specialist based out of Northern Virginia, specialized in the design and implementation of analytics and data lake solutions.


 The following screenshot shows the same query in Amazon RedShift Query Editor V2.


 Erol Murtezaoglu, a Technical Product Manager at AWS, is an inquisitive and enthusiastic thinker with a drive for self-improvement and learning. He has a strong and proven technical background in software development and architecture, balanced with a drive to deliver commercially successful products. Erol highly values the process of understanding customer needs and problems, in order to deliver solutions that exceed expectations.
 Mohamed Shaaban is a Senior Software Engineer in Amazon Redshift and is based in Berlin, Germany. He has over 12 years of experience in the software engineering. He is passionate about cloud services and building solutions that delight customers. Outside of work, he is an amateur photographer who loves to explore and capture unique moments.


 Noritaka Sekiyama is a Principal Big Data Architect on the AWS Glue team. He is responsible for building software artifacts to help customers. In his spare time, he enjoys cycling with his new road bike.
 Scott Long is a Front End Engineer on the AWS Glue team. He is responsible for implementing new features in AWS Glue Studio. In his spare time, he enjoys socializing with friends and participating in various outdoor activities.
 Sean Ma is a Principal Product Manager on the AWS Glue team. He has an 18+ year track record of innovating and delivering enterprise products that unlock the power of data for users. Outside of work, Sean enjoys scuba diving and college football.


 John Telford is a Senior Consultant at Amazon Web Services. He is a specialist in big data and data warehouses. John has a Computer Science degree from Brunel University.
 Anwar Rizal is a Senior Machine Learning consultant based in Paris. He works with AWS customers to develop data and AI solutions to sustainably grow their business.
 Pauline Ting is a Data Scientist in the AWS Professional Services team. She supports customers in achieving and accelerating their business outcome by developing sustainable AI/ML solutions. In her spare time, Pauline enjoys traveling, surfing, and trying new dessert places.

 Satesh Sonti is a Sr. Analytics Specialist Solutions Architect based out of Atlanta, specialized in building enterprise data platforms, data warehousing, and analytics solutions. He has over 16 years of experience in building data assets and leading complex data platform programs for banking and insurance clients across the globe.
 Tanya Rhodes is a Senior Solutions Architect based out of San Francisco, focused on games customers with emphasis on analytics, scaling, and performance enhancement of games and supporting systems. She has over 25 years of experience in enterprise and solutions architecture specializing in very large business organizations across multiple lines of business including games, banking, healthcare, higher education, and state governments.


 Create a new job in the Job details page
 The script arguments provide the following details to the EMR Serverless application:


 Query the Delta tables through Athena to validate the merged data
 Sankar Sundaram is a Data Lab Architect at AWS, where he helps customers build and modernize data architectures and help them build secure, scalable, and performant data lake, database, and data warehouse solutions.
 Monjumi Sarma is a Data Lab Solutions Architect at AWS. She helps customers architect data analytics solutions, which gives them an accelerated path towards modernization initiatives.
 Abhi Sodhani is a Sr. AI/ML Solutions Architect at AWS. He helps customers with a wide range of solutions, including machine leaning, artificial intelligence, data lakes, data warehousing, and data visualization. Outside of work, he is passionate about books, yoga, and travel.