Tag Archives: Amazon Aurora

AWS Week in Review – October 10, 2022

Post Syndicated from Marcia Villalba original https://aws.amazon.com/blogs/aws/aws-week-in-review-october-10-2022/

This post is part of our Week in Review series. Check back each week for a quick roundup of interesting news and announcements from AWS!

I had an amazing start to the week last week as I was speaking at the AWS Community Day NL. This event had 500 attendees and over 70 speakers, and Dr. Werner Vogels, Amazon CTO, delivered the keynote. AWS Community Days are community-led conferences organized by local communities, with a variety of workshops and sessions. I recommend checking your region for any of these events.

Community Day NL

Last Week’s Launches
Here are some launches that got my attention during the previous week.

Amazon S3 Object Lambda now supports using your own code to change the results of HEAD and LIST requests, besides GET (which we launched last year). This feature now enables more capabilities for what you can do with S3 Object Lambda. Danilo made a Twitter thread with lots of use cases for this new launch.

Amazon SageMaker Clarify now can provide near real-time explanations for ML predictions. SageMaker Clarify is a service that provides explainability by ML models individual predictions. These explanations are important for developers to get visibility into their training data and models to identify potential bias.

AWS Storage Gateway now supports 15 TiB tapes. It increased the maximum supported virtual tape size on Tape Gateway from 5 TiB to 15 TiB, so you can store more data on a single virtual tape, and you can reduce the number of tapes you need to manage.

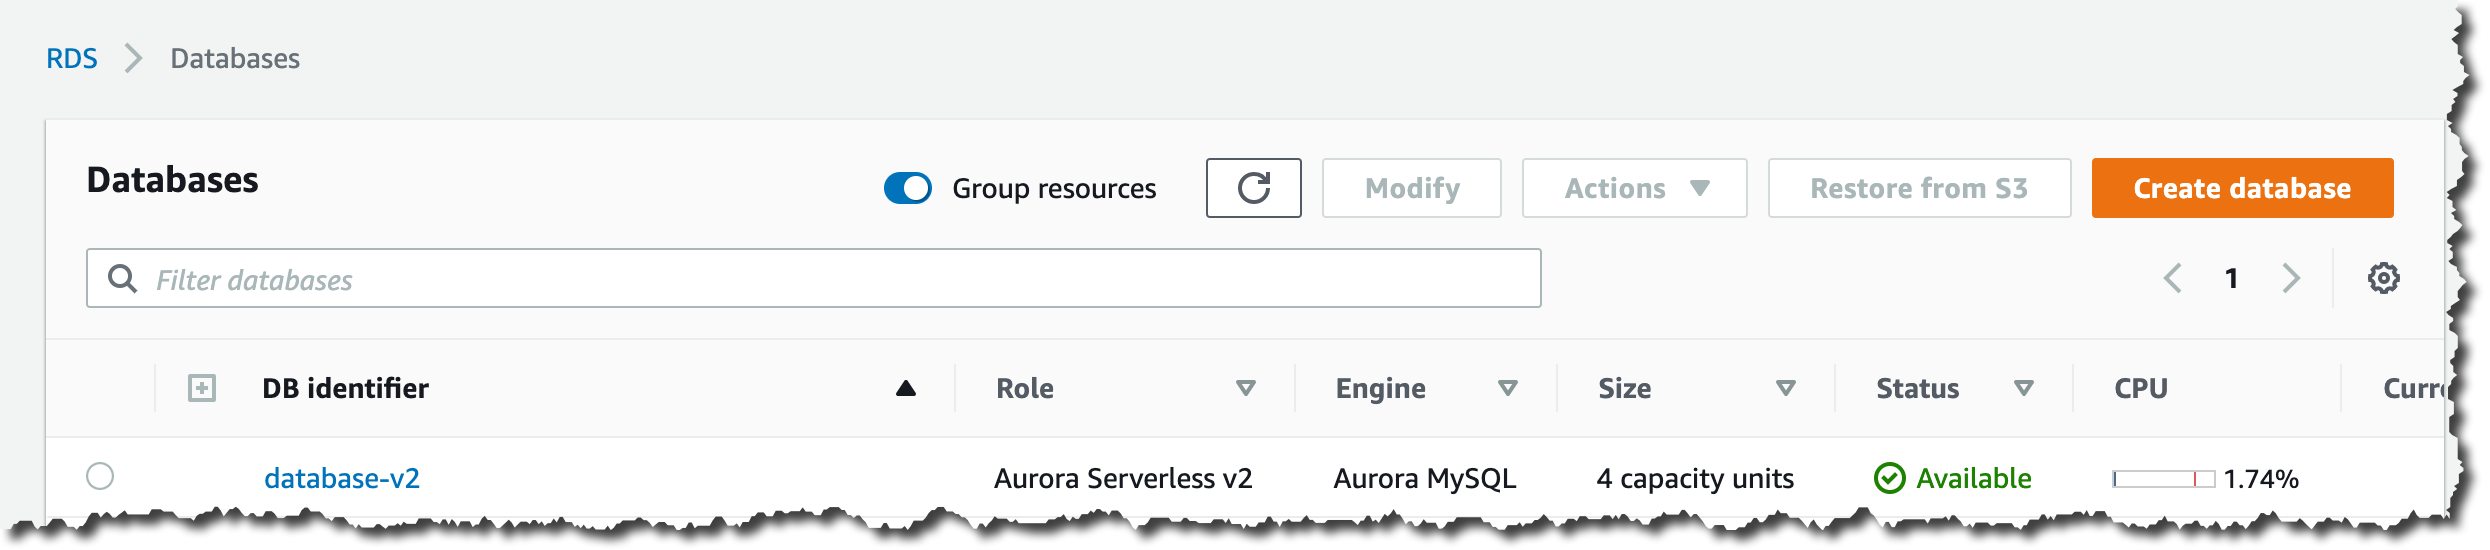
Amazon Aurora Serverless v2 now supports AWS CloudFormation. Early this year, we announced the general availability of Aurora Serverless v2, and now you can use AWS CloudFormation Templates to deploy and change the database along with the rest of your infrastructure.

AWS Config now supports 15 new resource types, including AWS DataSync, Amazon GuardDuty, Amazon Simple Email Service (Amazon SES), AWS AppSync, AWS Cloud Map, Amazon EC2, and AWS AppConfig. With this launch, you can use AWS Config to monitor configuration data for the supported resource types in your AWS account, and you can see how the configuration changes.

For a full list of AWS announcements, be sure to keep an eye on the What’s New at AWS page.

Other AWS News
Some other updates and news that you may have missed:

This week an article about how AWS is leading a pilot project to turn the Greek island of Naxos into a smart island caught my attention. The project introduces smart solutions for mobility, primary healthcare, and the transport of goods. The solution has been built based on four pillars that were important for the island: sustainability, telehealth, leisure, and digital skills. Check out the whole article to learn what they are doing.

Podcast Charlas Técnicas de AWS – If you understand Spanish, this podcast is for you. Podcast Charlas Técnicas is one of the official AWS podcasts in Spanish, and every other week there is a new episode. The podcast is meant for builders, and it shares stories about how customers implemented and learned AWS services, how to architect applications, and how to use new services. You can listen to all the episodes directly from your favorite podcast app or at AWS Podcasts en español.

AWS open-source news and updates – This is a newsletter curated by my colleague Ricardo to bring you the latest open-source projects, posts, events, and more.

Upcoming AWS Events
Check your calendars and sign up for these AWS events:

AWS re:Invent reserved seating opens on October 11. If you are planning to attend, book a spot in advance for your favorite sessions. AWS re:Invent is our biggest conference of the year, it happens in Las Vegas from November 28 to December 2, and registrations are open. Many writers of this blog have sessions at re:Invent, and you can search the event agenda using our names.

I started the post talking about AWS Community Days, and there is one in Warsaw, Poland, on October 14. If you are around Warsaw during this week, you can first check out the AWS Pop-up Hub in Warsaw that runs October 10-14 and then join for the Community Day.

On October 20, there is a virtual event for modernizing .NET workloads with Windows containers on AWS, You can register for free.

That’s all for this week. Check back next Monday for another Week in Review!

— Marcia

How Launchmetrics improves fashion brands performance using Amazon EC2 Spot Instances

Post Syndicated from Ivo Pinto original https://aws.amazon.com/blogs/architecture/how-launchmetrics-improves-fashion-brands-performance-using-amazon-ec2-spot-instances/

Launchmetrics offers its Brand Performance Cloud tools and intelligence to help fashion, luxury, and beauty retail executives optimize their global strategy. Launchmetrics initially operated their whole infrastructure on-premises; however, they wanted to scale their data ingestion while simultaneously providing improved and faster insights for their clients. These business needs led them to build their architecture in AWS cloud.

In this blog post, we explain how Launchmetrics’ uses Amazon Web Services (AWS) to crawl the web for online social and print media. Using the data gathered, Launchmetrics is able to provide prescriptive analytics and insights to their clients. As a result, clients can understand their brand’s momentum and interact with their audience, successfully launching their products.

Architecture overview

Launchmetrics’ platform architecture is represented in Figure 1 and composed of three tiers:

  1. Crawl
  2. Data Persistence
  3. Processing
Launchmetrics backend architecture

Figure 1. Launchmetrics backend architecture

The Crawl tier is composed of several Amazon Elastic Compute Cloud (Amazon EC2) Spot Instances launched via Auto Scaling groups. Spot Instances take advantage of unused Amazon EC2 capacity at a discounted rate compared with On-Demand Instances, which are compute instances that are billed per-hour or -second with no long-term commitments. Launchmetrics heavily leverages Spot Instances. The Crawl tier is responsible for retrieving, processing, and storing data from several media sources (represented in Figure 1 with the number 1).

The Data Persistence tier consists of two components: Amazon Kinesis Data Streams and Amazon Simple Queue Service (Amazon SQS). Kinesis Data Streams stores data that the Crawl tier collects, while Amazon SQS stores the metadata of the whole process. In this context, metadata helps Launchmetrics gain insight into when the data is collected and if it has started processing. This is key information if a Spot Instance is interrupted, which we will dive deeper into later.

The third tier, Processing, also makes use of Spot Instances and is responsible for pulling data from the Data Persistence tier (represented in Figure 1 with the number 2). It then applies proprietary algorithms, both analytics and machine learning models, to create consumer insights. These insights are stored in a data layer (not depicted) that consists of an Amazon Aurora cluster and an Amazon OpenSearch Service cluster.

By having this separation of tiers, Launchmetrics is able to use a decoupled architecture, where each component can scale independently and is more reliable. Both the Crawl and the Data Processing tiers use Spot Instances for up to 90% of their capacity.

Data processing using EC2 Spot Instances

When Launchmetrics decided to migrate their workloads to the AWS cloud, Spot Instances were one of the main drivers. As Spot Instances offer large discounts without commitment, Launchmetrics was able to track more than 1200 brands, translating to 1+ billion end users. Daily, this represents tracking upwards of 500k influencer profiles, 8 million documents, and around 70 million social media comments.

Aside from the cost-savings with Spot Instances, Launchmetrics incurred collateral benefits in terms of architecture design: building stateless, decoupled, elastic, and fault-tolerant applications. In turn, their stack architecture became more loosely coupled, as well.

All Launchmetrics Auto Scaling groups have the following configuration:

  • Spot allocation strategy: cost-optimized
  • Capacity rebalance: true
  • Three availability zones
  • A diversified list of instance types

By using Auto Scaling groups, Launchmetrics is able to scale worker instances depending on how many items they have in the SQS queue, increasing the instance efficiency. Data processing workloads like the ones Launchmetrics’ platform have, are an exemplary use of multiple instance types, such as M5, M5a, C5, and C5a. When adopting Spot Instances, Launchmetrics considered other instance types to have access to spare capacity. As a result, Launchmetrics found out that workload’s performance improved, as they use instances with more resources at a lower cost.

By decoupling their data processing workload using SQS queues, processes are stopped when an interruption arrives. As the Auto Scaling group launches a replacement Spot Instance, clients are not impacted and data is not lost. All processes go through a data checkpoint, where a new Spot Instance resumes processing any pending data. Spot Instances have resulted in a reduction of up to 75% of related operational costs.

To increase confidence in their ability to deal with Spot interruptions and service disruptions, Launchmetrics is exploring using AWS Fault Injection Simulator to simulate faults on their architecture, like a Spot interruption. Learn more about how this service works on the AWS Fault Injection Simulator now supports Spot Interruptions launch page.

Reporting data insights

After processing data from different media sources, AWS aided Launchmetrics in producing higher quality data insights, faster: the previous on-premises architecture had a time range of 5-6 minutes to run, whereas the AWS-driven architecture takes less than 1 minute.

This is made possible by elasticity and availability compute capacity that Amazon EC2 provides compared with an on-premises static fleet. Furthermore, offloading some management and operational tasks to AWS by using AWS managed services, such as Amazon Aurora or Amazon OpenSearch Service, Launchmetrics can focus on their core business and improve proprietary solutions rather than use that time in undifferentiated activities.

Building continuous delivery pipelines

Let’s discuss how Launchmetrics makes changes to their software with so many components.

Both of their computing tiers, Crawl and Processing, consist of standalone EC2 instances launched via Auto Scaling groups and EC2 instances that are part of an Amazon Elastic Container Service (Amazon ECS) cluster. Currently, 70% of Launchmetrics workloads are still running with Auto Scaling groups, while 30% are containerized and run on Amazon ECS. This is important because for each of these workload groups, the deployment process is different.

For workloads that run on Auto Scaling groups, they use an AWS CodePipeline to orchestrate the whole process, which includes:

I.  Creating a new Amazon Machine Image (AMI) using AWS CodeBuild
II. Deploying the newly built AMI using Terraform in CodeBuild

For containerized workloads that run on Amazon ECS, Launchmetrics also uses a CodePipeline to orchestrate the process by:

III. Creating a new container image, and storing it in Amazon Elastic Container Registry
IV. Changing the container image in the task definition, and updating the Amazon ECS service using CodeBuild

Conclusion

In this blog post, we explored how Launchmetrics is using EC2 Spot Instances to reduce costs while producing high-quality data insights for their clients. We also demonstrated how decoupling an architecture is important for handling interruptions and why following Spot Instance best practices can grant access to more spare capacity.

Using this architecture, Launchmetrics produced faster, data-driven insights for their clients and increased their capacity to innovate. They are continuing to containerize their applications and are projected to have 100% of their workloads running on Amazon ECS with Spot Instances by the end of 2023.

To learn more about handling EC2 Spot Instance interruptions, visit the AWS Best practices for handling EC2 Spot Instance interruptions blog post. Likewise, if you are interested in learning more about AWS Fault Injection Simulator and how it can benefit your architecture, read Increase your e-commerce website reliability using chaos engineering and AWS Fault Injection Simulator.

How Facteus improved Quantamatics performance by adopting Amazon Aurora Serverless and Amazon EKS

Post Syndicated from Aishwarya Subramaniam original https://aws.amazon.com/blogs/architecture/how-facteus-improved-quantamatics-performance-by-adopting-amazon-aurora-serverless-and-amazon-eks/

Facteus Inc. is a leading provider of actionable insights from sensitive transaction data. Facteus safely transforms raw financial transaction data from legacy technologies into actionable information, without compromising data privacy, through its innovative synthetic data process. Quantamatics is one of Facteus’ core product offering.

Quantamatics accelerates the time it takes a user to go from raw alternative data to insights, by providing a cloud-based, turnkey research platform that handles data from ingestion to analysis. This platform saves the analysts, data researchers, and data scientists time by doing all the preparation and normalization efforts prior to working with the data for insight discovery. The provided cloud environment also allows for easy and flexible analysis of both provided and external data sources. Quantamatics is a SaaS offering with a subscription model that provides access to both the research platform and the associated Facteus datasets.

In June 2021, Facteus re-architected their monolithic Quantamatics application to use microservices. This blog will contrast the before and after states from a performance and management perspective as they migrated from Snowflake to Amazon Aurora Serverless v2 (Postgres) and from Amazon Elastic Compute Cloud (Amazon EC2) to Amazon Elastic Kubernetes Service (Amazon EKS).

A great place to start when evaluating existing workloads for fault tolerance and reliability is the AWS Well-Architected Framework. The Well-Architected Framework is designed to help cloud architects build secure, high-performing, resilient, and efficient infrastructure for their applications. Based on six pillars—operational excellence, security, reliability, performance efficiency, cost optimization, and sustainability—the Framework provides a consistent approach for customers to evaluate architectures, and implement designs that will scale over time.

The AWS Well-Architected Tool,  available at no charge in the AWS Management Console, lets you create self-assessments to identify and correct gaps in your current architecture. Adhering to Well-Architected principles, Facteus adopted managed services, such as Amazon EKS and Amazon Aurora Serverless, as they reduce efforts on provisioning, configuring, scaling, backing up, and so on. Additionally, using managed services helps to save on the overall costs of maintaining the services.

Facteus’ architecture overview

Before

Users can access Quantamatics for their research either through a Jupyter notebook or a Microsoft Excel plugin. Facteus used EC2 instances to directly host the underlying JupyterHub deployments and AWS Elastic Beanstalk to deploy APIs.

The legacy architecture, while cloud-based, had multiple issues that made it ineffective from a maintenance, scalability, and cost perspective (as demonstrated in Figure 1):

  • JupyterHub does not currently support high availability (HA) natively. This meant an EC2 failover would require relatively long unavailability while a replacement EC2 node spun up or potentially double the cost to keep an idle node on standby.
    • Also, with the EC2 instances being specialized, portions of each EC2 instance will remain unused, resulting in unnecessary costs compared to more modern solutions such as Amazon EKS, which can pool and divide up instances in a more granular fashion.
    • Finally, as the EC2 instances were standalone, solutions would need to be set up to both monitor application health and perform the appropriate actions in case of an outage.
  • Although Elastic Beanstalk was a great way to deploy API instances in an HA and scalable way, to completely modernize and remain consistent throughout application to a microservice-based architecture, Facteus migrated their Elastic Beanstalk instances as well, to better utilize the pooled resources.
Cloud-based legacy architecture

Figure 1. Cloud-based legacy architecture

Quantamatics requires a Data Warehouse solution to constantly run behind an API to allow for acceptable request and response times. While Snowflake is a great data warehousing and big data querying solution, Facteus found it expensive for their deployment. The queries that the Quantamatics APIs run are typically not computationally expensive but do end up returning relatively large amounts of data. This makes transferring the results back to the API over the internet a potential bottleneck.

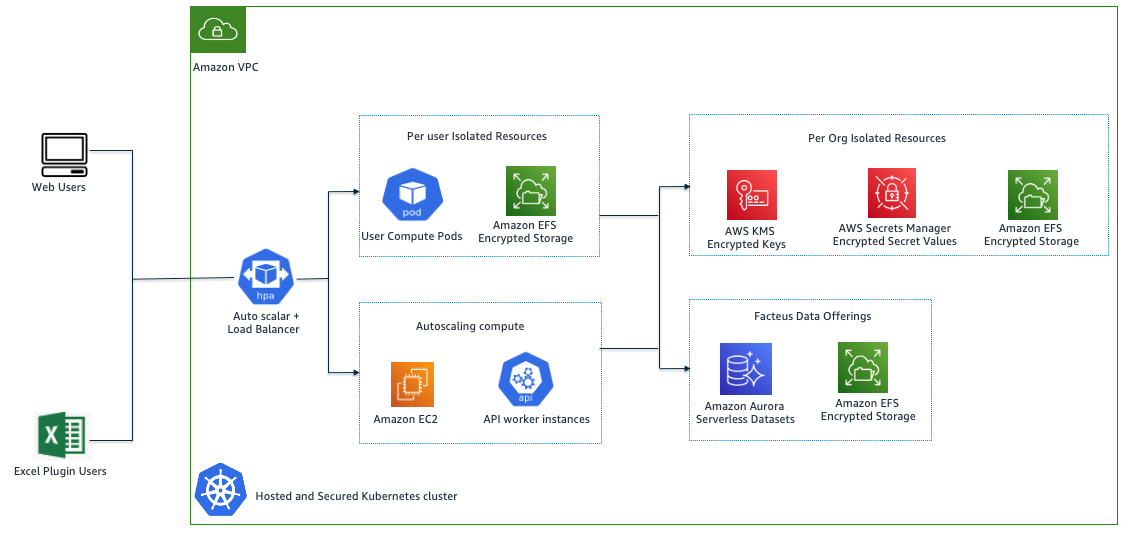
To address these bottlenecks, Facteus re-architected their application into an Amazon EKS based one, backed with Aurora Serverless v2 (Postgres).

The new architecture resolves the previous problems in two ways (Figure 2):

  • By using Aurora Serverless v2 (Postgres) to store and query the datasets used by the API within the same VPC instead of Snowflake, it kept the query run time relatively the same but drastically decreased both the transfer time and the associated costs due to the locality of the database as well as the cost and scalability of Aurora Serverless v2.
  • By switching to Amazon EKS, the underlying EC2 nodes could easily be pooled and more thoroughly utilized across the various deployments, thus reducing costs. Additionally, as the deployments were now containerized, an outage would result in the quick relocation of those containerized apps (pods) to nodes with capacity, thus reducing downtime and cost.
    • As a side benefit with the move to managed nodes on Amazon EKS, this completely removed the node patching overhead, as Amazon EKS safely handles the patching of the underlying nodes with a single command.
    • Amazon EKS monitors and restarts pods automatically, which eliminated the need to set up and manage a solution that monitors pod health and takes the appropriate actions upon failures.
Contemporary architecture with Amazon EKS and Aurora Serverless v2 (Postgres)

Figure 2. Contemporary architecture with Amazon EKS and Aurora Serverless v2 (Postgres)

Auto scaling with Amazon EKS and Aurora Serverless

  • Amazon EKS helped to greatly reduce the overhead of setting up and managing the auto scaling of Quantamatics in two ways:
    • User compute environments could be spun up as isolated pods, with Amazon EKS spinning nodes up and down automatically based on demand.
    • API instances could also be automatically spun up and down based on network throughput metrics queried by Amazon EKS to handle the requests made by users in a timely fashion.
  • Aurora Serverless v2
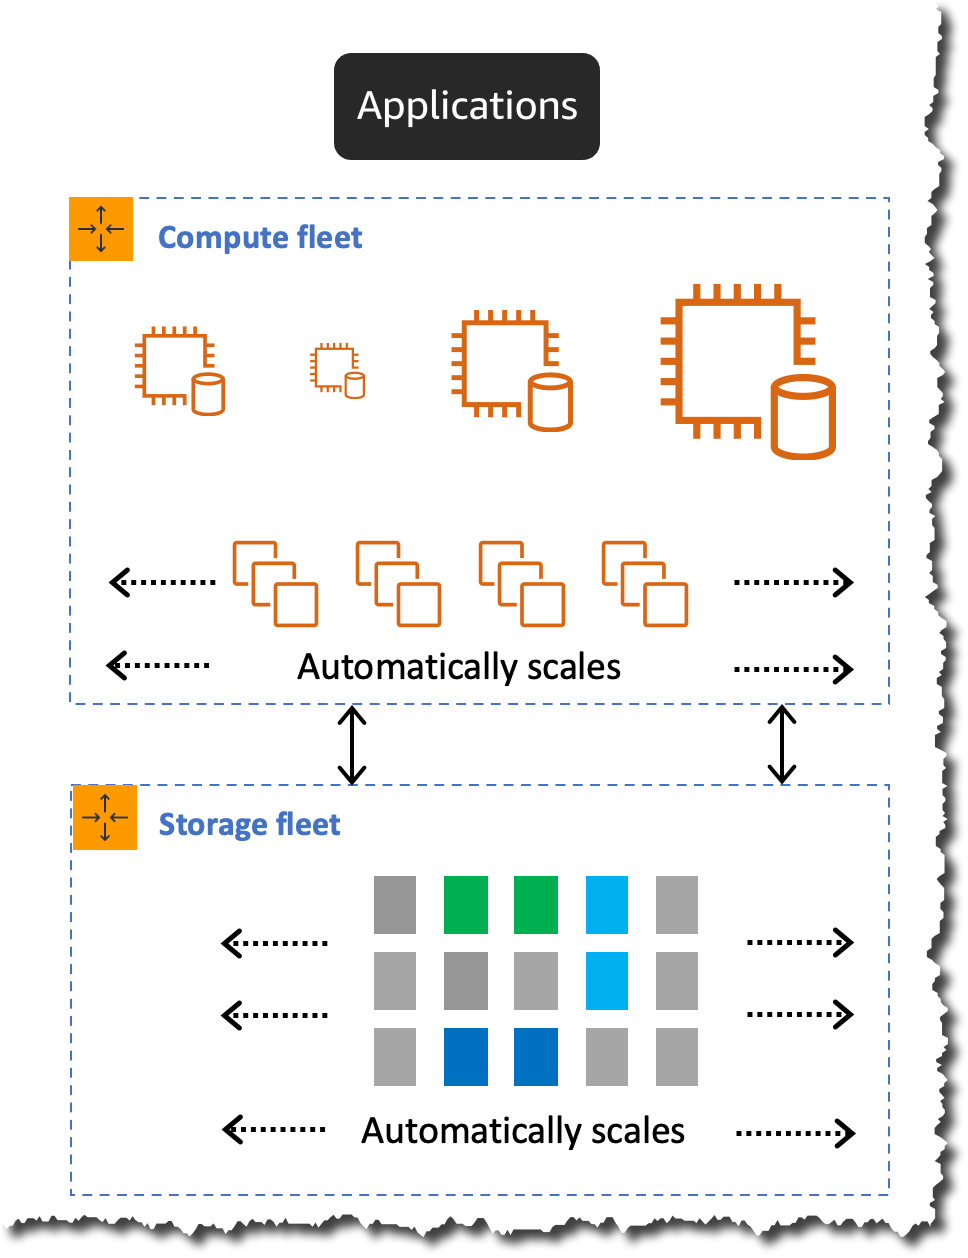
    • With Aurora Serverless v2, the needed compute capacity of the database automatically scales based on load generated by the corresponding API requests. This both reduced the cost as the load varies heavily throughout the day, reducing the management overhead of handling spinning up and down of read replicas if other solutions were used instead.

Snowflake vs. Aurora Serverless V2 (Postgres) – Quantamatics query performance and cost comparison

The following steps were performed to migrate data from Snowflake to Aurora Serverless v2:

  • Use the Snowflake COPY INTO <location> command to copy the data from the Snowflake database table into one or more files in an S3 bucket.
  • Create tables in Aurora Serverless. Use the create_s3_uri function to load variables.
  • Use the aws_s3.table_import_from_s3 function to import the data file from an Amazon S3 file name prefix.
  • Verify that the information was loaded.

This blog post describes importing data from Amazon S3 to Amazon Aurora PostgreSQL.

Testing strategy: Run the corresponding CLI database utility for each database (snowsql vs psql) from within the VPC. Run the same query on each dataset. Return and write the results as CSV to a local file.
Data set size: ~178,000,000 rows
Result set size: ~418,000 rows

Data source Configuration Results
Snowflake Snowflake: Medium Warehouse (running), AWS based in same Region as APIs

  • Cost: ~$0.01 per query based on credit usage
  • 21.99 seconds run time
  • 3.36 seconds run time, 18.63 seconds transfer time
Aurora Serverless V2(Postgres) Idling on four Aurora Compute Units (ACU)

  • Cost: ~$0.24 an hour
  • Tables and indexes tuned for Quantamatics use cases
  • 7.00 seconds run time
  • 3.58 seconds run time, 3.42 seconds transfer time

Conclusion

The customer was able to achieve similar run times for the given dataset and query, but faster transfer speeds from Aurora Serverless due to the locality of the database. They also realized up to ~40x runtime cost savings by using Aurora Serverless—1,000 queries in Aurora Serverless vs. ~24 queries in Snowflake for the same cost.

Note: These results are specific to Quantamatics use cases where queries are fixed and well-known, and relatively limited in terms of complexity. This allowed the tables and database in Aurora Serverless v2 to be tuned for those specific purposes.

AWS recommends customers review their workloads using the AWS Well-Architected Tool to help ensure that their workloads are performant, secure, and cost-optimized. Well-Architected Framework Reviews are excellent opportunities to work together with your AWS account team and key stakeholders to discuss how modern infrastructure can help you win in the market.

Graviton Fast Start – A New Program to Help Move Your Workloads to AWS Graviton

Post Syndicated from Danilo Poccia original https://aws.amazon.com/blogs/aws/graviton-fast-start-a-new-program-to-help-move-your-workloads-to-aws-graviton/

With the Graviton Challenge last year, we helped customers migrate to Graviton-based EC2 instances and get up to 40 percent price performance benefit in as little as 4 days. Tens of thousands of customers, including 48 of the top 50 Amazon Elastic Compute Cloud (Amazon EC2) customers, use AWS Graviton processors for their workloads. In addition to EC2, many AWS managed services can run their workloads on Graviton. For most customers, adoption is easy, requiring minimal code changes. However, the effort and time required to move workloads to Graviton depends on a few factors including your software development environment and the technology stack on which your application is built.

This year, we want to take it a step further and make it even easier for customers to adopt Graviton not only through EC2, but also through managed services. Today, we are launching AWS Graviton Fast Start, a new program that makes it even easier to move your workloads to AWS Graviton by providing step-by-step directions for EC2 and other managed services that support the Graviton platform:

  • Amazon Elastic Compute Cloud (Amazon EC2) – EC2 provides the most flexible environment for a migration and can support many kinds of workloads, such as web apps, custom databases, or analytics. You have full control over the interpreted or compiled code running in the EC2 instance. You can also use many open-source and commercial software products that support the Arm64 architecture.
  • AWS Lambda – Migrating your serverless functions can be really easy, especially if you use an interpreted runtime such as Node.js or Python. Most of the time, you only have to check the compatibility of your software dependencies. I have shown a few examples in this blog post.
  • AWS Fargate – Fargate works best if your applications are already running in containers or if you are planning to containerize them. By using multi-architecture container images or images that have Arm64 in their image manifest, you get the serverless benefits of Fargate and the price-performance advantages of Graviton.
  • Amazon Aurora – Relational databases are at the core of many applications. If you need a database compatible with PostgreSQL or MySQL, you can use Amazon Aurora to have a highly performant and globally available database powered by Graviton.
  • Amazon Relational Database Service (RDS) – Similarly to Aurora, Amazon RDS engines such as PostgreSQL, MySQL, and MariaDB can provide a fully managed relational database service using Graviton-based instances.
  • Amazon ElastiCache – When your workload requires ultra-low latency and high throughput, you can speed up your applications with ElastiCache and have a fully managed in-memory cache running on Graviton and compatible with Redis or Memcached.
  • Amazon EMR – With Amazon EMR, you can run large-scale distributed data processing jobs, interactive SQL queries, and machine learning applications on Graviton using open-source analytics frameworks such as Apache SparkApache Hive, and Presto.

Here’s some feedback we got from customers running their workloads on Graviton:

  • Formula 1 racing told us that Graviton2-based C6gn instances provided the best price performance benefits for some of their computational fluid dynamics (CFD) workloads. More recently, they found that Graviton3 C7g instances are 40 percent faster for the same simulations and expect Graviton3-based instances to become the optimal choice to run all of their CFD workloads.
  • Honeycomb has 100 percent of their production workloads running on Graviton using EC2 and Lambda. They have tested the high-throughput telemetry ingestion workload they use for their observability platform against early preview instances of Graviton3 and have seen a 35 percent performance increase for their workload over Graviton2. They were able to run 30 percent fewer instances of C7g than C6g serving the same workload and with 30 percent reduced latency. With these instances in production, they expect over 50 percent price performance improvement over x86 instances.
  • Twitter is working on a multi-year project to leverage Graviton-based EC2 instances to deliver Twitter timelines. As part of their ongoing effort to drive further efficiencies, they tested the new Graviton3-based C7g instances. Across a number of benchmarks representative of their workloads, they found Graviton3-based C7g instances deliver 20-80 percent higher performance compared to Graviton2-based C6g instances, while also reducing tail latencies by as much as 35 percent. They are excited to utilize Graviton3-based instances in the future to realize significant price performance benefits.

With all these options, getting the benefits of running all or part of your workload on AWS Graviton can be easier than you expect. To help you get started, there’s also a free trial on the Graviton-based T4g instances for up to 750 hours per month through December 31st, 2022.

Visit AWS Graviton Fast Start to get step-by-step directions on how to move your workloads to AWS Graviton.

Danilo

Amazon Prime Day 2022 – AWS for the Win!

Post Syndicated from Jeff Barr original https://aws.amazon.com/blogs/aws/amazon-prime-day-2022-aws-for-the-win/

As part of my annual tradition to tell you about how AWS makes Prime Day possible, I am happy to be able to share some chart-topping metrics (check out my 2016, 2017, 2019, 2020, and 2021 posts for a look back).

My purchases this year included a first aid kit, some wood brown filament for my 3D printer, and a non-stick frying pan! According to our official news release, Prime members worldwide purchased more than 100,000 items per minute during Prime Day, with best-selling categories including Amazon Devices, Consumer Electronics, and Home.

Powered by AWS
As always, AWS played a critical role in making Prime Day a success. A multitude of two-pizza teams worked together to make sure that every part of our infrastructure was scaled, tested, and ready to serve our customers. Here are a few examples:

Amazon Aurora – On Prime Day, 5,326 database instances running the PostgreSQL-compatible and MySQL-compatible editions of Amazon Aurora processed 288 billion transactions, stored 1,849 terabytes of data, and transferred 749 terabytes of data.

Amazon EC2 – For Prime Day 2022, Amazon increased the total number of normalized instances (an internal measure of compute power) on Amazon Elastic Compute Cloud (Amazon EC2) by 12%. This resulted in an overall server equivalent footprint that was only 7% larger than that of Cyber Monday 2021 due to the increased adoption of AWS Graviton2 processors.

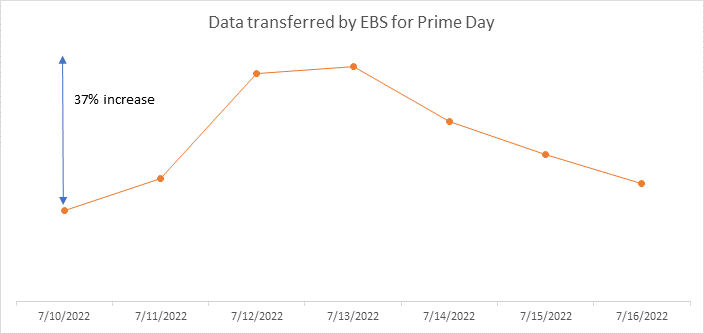
Amazon EBS – For Prime Day, the Amazon team added 152 petabytes of EBS storage. The resulting fleet handled 11.4 trillion requests per day and transferred 532 petabytes of data per day. Interestingly enough, due to increased efficiency of some of the internal Amazon services used to run Prime Day, Amazon actually used about 4% less EBS storage and transferred 13% less data than it did during Prime Day last year. Here’s a graph that shows the increase in data transfer during Prime Day:

Amazon SES – In order to keep Prime Day shoppers aware of the deals and to deliver order confirmations, Amazon Simple Email Service (SES) peaked at 33,000 Prime Day email messages per second.

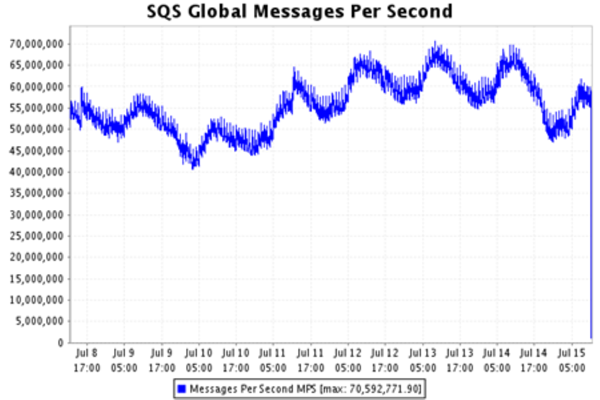
Amazon SQS – During Prime Day, Amazon Simple Queue Service (SQS) set a new traffic record by processing 70.5 million messages per second at peak:

Amazon DynamoDB – DynamoDB powers multiple high-traffic Amazon properties and systems including Alexa, the Amazon.com sites, and all Amazon fulfillment centers. Over the course of Prime Day, these sources made trillions of calls to the DynamoDB API. DynamoDB maintained high availability while delivering single-digit millisecond responses and peaking at 105.2 million requests per second.

Amazon SageMaker – The Amazon Robotics Pick Time Estimator, which uses Amazon SageMaker to train a machine learning model to predict the amount of time future pick operations will take, processed more than 100 million transactions during Prime Day 2022.

Package Planning – In North America, and on the highest traffic Prime 2022 day, package-planning systems performed 60 million AWS Lambda invocations, processed 17 terabytes of compressed data in Amazon Simple Storage Service (Amazon S3), stored 64 million items across Amazon DynamoDB and Amazon ElastiCache, served 200 million events over Amazon Kinesis, and handled 50 million Amazon Simple Queue Service events.

Prepare to Scale
Every year I reiterate the same message: rigorous preparation is key to the success of Prime Day and our other large-scale events. If you are preparing for a similar chart-topping event of your own, I strongly recommend that you take advantage of AWS Infrastructure Event Management (IEM). As part of an IEM engagement, my colleagues will provide you with architectural and operational guidance that will help you to execute your event with confidence!

Jeff;

How Plugsurfing doubled performance and reduced cost by 70% with purpose-built databases and AWS Graviton

Post Syndicated from Anand Shah original https://aws.amazon.com/blogs/big-data/how-plugsurfing-doubled-performance-and-reduced-cost-by-70-with-purpose-built-databases-and-aws-graviton/

Plugsurfing aligns the entire car charging ecosystem—drivers, charging point operators, and carmakers—within a single platform. The over 1 million drivers connected to the Plugsurfing Power Platform benefit from a network of over 300,000 charging points across Europe. Plugsurfing serves charging point operators with a backend cloud software for managing everything from country-specific regulations to providing diverse payment options for customers. Carmakers benefit from white label solutions as well as deeper integrations with their in-house technology. The platform-based ecosystem has already processed more than 18 million charging sessions. Plugsurfing was acquired fully by Fortum Oyj in 2018.

Plugsurfing uses Amazon OpenSearch Service as a central data store to store 300,000 charging stations’ information and to power search and filter requests coming from mobile, web, and connected car dashboard clients. With the increasing usage, Plugsurfing created multiple read replicas of an OpenSearch Service cluster to meet demand and scale. Over time and with the increase in demand, this solution started to become cost exhaustive and limited in terms of cost performance benefit.

AWS EMEA Prototyping Labs collaborated with the Plugsurfing team for 4 weeks on a hands-on prototyping engagement to solve this problem, which resulted in 70% cost savings and doubled the performance benefit over the current solution. This post shows the overall approach and ideas we tested with Plugsurfing to achieve the results.

The challenge: Scaling higher transactions per second while keeping costs under control

One of the key issues of the legacy solution was keeping up with higher transactions per second (TPS) from APIs while keeping costs low. The majority of the cost was coming from the OpenSearch Service cluster, because the mobile, web, and EV car dashboards use different APIs for different use cases, but all query the same cluster. The solution to achieve higher TPS with the legacy solution was to scale the OpenSearch Service cluster.

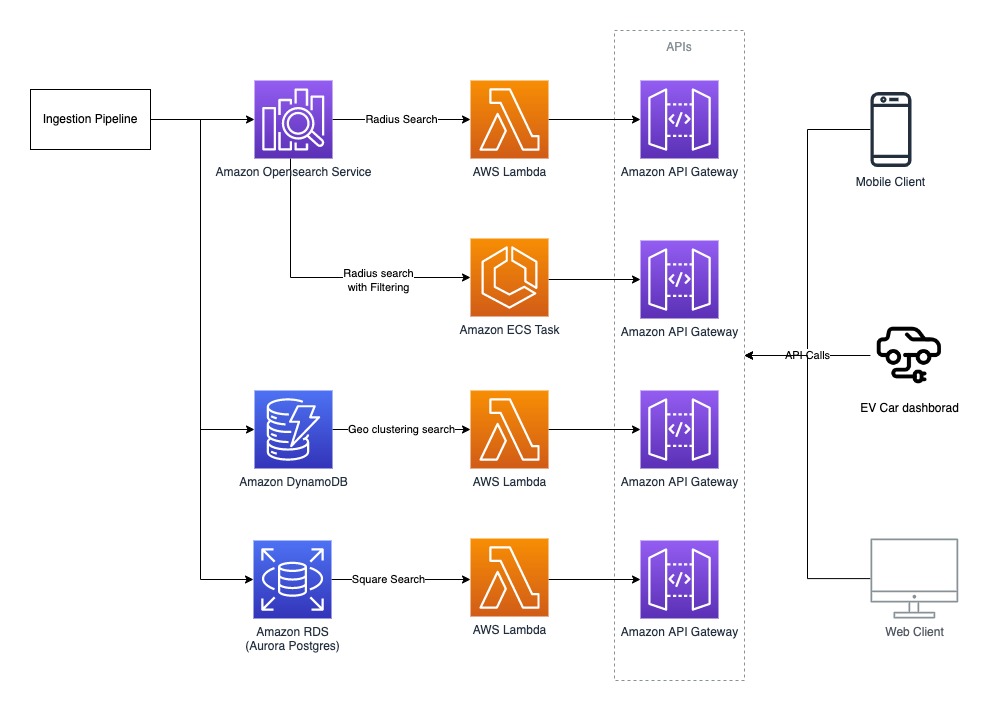
The following figure illustrates the legacy architecture.

Legacy Architecture

Plugsurfing APIs are responsible for serving data for four different use cases:

  • Radius search – Find all the EV charging stations (latitude/longitude) with in x km radius from the point of interest (or current location on GPS).
  • Square search – Find all the EV charging stations within a box of length x width, where the point of interest (or current location on GPS) is at the center.
  • Geo clustering search – Find all the EV charging stations clustered (grouped) by their concentration within a given area. For example, searching all EV chargers in all of Germany results in something like 50 in Munich and 100 in Berlin.
  • Radius search with filtering – Filter the results by EV charger that are available or in use by plug type, power rating, or other filters.

The OpenSearch Service domain configuration was as follows:

  • m4.10xlarge.search x 4 nodes
  • Elasticsearch 7.10 version
  • A single index to store 300,000 EV charger locations with five shards and one replica
  • A nested document structure

The following code shows the example document

{
   "locationId":"location:1",
   "location":{
      "latitude":32.1123,
      "longitude":-9.2523
   },
   "adress":"parking lot 1",
   "chargers":[
      {
         "chargerId":"location:1:charger:1",
         "connectors":[
            {
               "connectorId":"location:1:charger:1:connector:1",
               "status":"AVAILABLE",
               "plug_type":"Type A"
            }
         ]
      }
   ]
}

Solution overview

AWS EMEA Prototyping Labs proposed an experimentation approach to try three high-level ideas for performance optimization and to lower overall solution costs.

We launched an Amazon Elastic Compute Cloud (EC2) instance in a prototyping AWS account to host a benchmarking tool based on k6 (an open-source tool that makes load testing simple for developers and QA engineers) Later, we used scripts to dump and restore production data to various databases, transforming it to fit with different data models. Then we ran k6 scripts to run and record performance metrics for each use case, database, and data model combination. We also used the AWS Pricing Calculator to estimate the cost of each experiment.

Experiment 1: Use AWS Graviton and optimize OpenSearch Service domain configuration

We benchmarked a replica of the legacy OpenSearch Service domain setup in a prototyping environment to baseline performance and costs. Next, we analyzed the current cluster setup and recommended testing the following changes:

  • Use AWS Graviton based memory optimized EC2 instances (r6g) x 2 nodes in the cluster
  • Reduce the number of shards from five to one, given the volume of data (all documents) is less than 1 GB
  • Increase the refresh interval configuration from the default 1 second to 5 seconds
  • Denormalize the full document; if not possible, then denormalize all the fields that are part of the search query
  • Upgrade to Amazon OpenSearch Service 1.0 from Elasticsearch 7.10

Plugsurfing created multiple new OpenSearch Service domains with the same data and benchmarked them against the legacy baseline to obtain the following results. The row in yellow represents the baseline from the legacy setup; the rows with green represent the best outcome out of all experiments performed for the given use cases.

DB Engine Version Node Type Nodes in Cluster Configurations Data Modeling Radius req/sec Filtering req/sec Performance Gain %
Elasticsearch 7.1 m4.10xlarge 4 5 shards, 1 replica Nested 2841 580 0
Amazon OpenSearch Service 1.0 r6g.xlarge 2 1 shards, 1 replica Nested 850 271 32.77
Amazon OpenSearch Service 1.0 r6g.xlarge 2 1 shards, 1 replica Denormalized 872 670 45.07
Amazon OpenSearch Service 1.0 r6g.2xlarge 2 1 shards, 1 replica Nested 1667 474 62.58
Amazon OpenSearch Service 1.0 r6g.2xlarge 2 1 shards, 1 replica Denormalized 1993 1268 95.32

Plugsurfing was able to gain 95% (doubled) better performance across the radius and filtering use cases with this experiment.

Experiment 2: Use purpose-built databases on AWS for different use cases

We tested Amazon OpenSearch Service, Amazon Aurora PostgreSQL-Compatible Edition, and Amazon DynamoDB extensively with many data models for different use cases.

We tested the square search use case with an Aurora PostgreSQL cluster with a db.r6g.2xlarge single node as the reader and a db.r6g.large single node as the writer. The square search used a single PostgreSQL table configured via the following steps:

  1. Create the geo search table with geography as the data type to store latitude/longitude:
CREATE TYPE status AS ENUM ('available', 'inuse', 'out-of-order');

CREATE TABLE IF NOT EXISTS square_search
(
id     serial PRIMARY KEY,
geog   geography(POINT),
status status,
data   text -- Can be used as json data type, or add extra fields as flat json
);
  1. Create an index on the geog field:
CREATE INDEX global_points_gix ON square_search USING GIST (geog);
  1. Query the data for the square search use case:
SELECT id, ST_AsText(geog), status, datafrom square_search
where geog && ST_MakeEnvelope(32.5,9,32.8,11,4326) limit 100;

We achieved an eight-times greater improvement in TPS for the square search use case, as shown in the following table.

DB Engine Version Node Type Nodes in Cluster Configurations Data modeling Square req/sec Performance Gain %
Elasticsearch 7.1 m4.10xlarge 4 5 shards, 1 replica Nested 412 0
Aurora PostgreSQL 13.4 r6g.large 2 PostGIS, Denormalized Single table 881 213.83
Aurora PostgreSQL 13.4 r6g.xlarge 2 PostGIS, Denormalized Single table 1770 429.61
Aurora PostgreSQL 13.4 r6g.2xlarge 2 PostGIS, Denormalized Single table 3553 862.38

We tested the geo clustering search use case with a DynamoDB model. The partition key (PK) is made up of three components: <zoom-level>:<geo-hash>:<api-key>, and the sort key is the EV charger current status. We examined the following:

  • The zoom level of the map set by the user
  • The geo hash computed based on the map tile in the user’s view port area (at every zoom level, the map of Earth is divided into multiple tiles, where each tile can be represented as a geohash)
  • The API key to identify the API user
Partition Key: String Sort Key: String total_pins: Number filter1_pins: Number filter2_pins: Number filter3_pins: Number
5:gbsuv:api_user_1 Available 100 50 67 12
5:gbsuv:api_user_1 in-use 25 12 6 1
6:gbsuvt:api_user_1 Available 35 22 8 0
6:gbsuvt:api_user_1 in-use 88 4 0 35

The writer updates the counters (increment or decrement) against each filter condition and charger status whenever the EV charger status is updated at all zoom levels. With this model, the reader can query pre-clustered data with a single direct partition hit for all the map tiles viewable by the user at the given zoom level.

The DynamoDB model helped us gain a 45-times greater read performance for our geo clustering use case. However, it also added extra work on the writer side to pre-compute numbers and update multiple rows when the status of a single EV charger is updated. The following table summarizes our results.

DB Engine Version Node Type Nodes in Cluster Configurations Data modeling Clustering req/sec Performance Gain %
Elasticsearch 7.1 m4.10xlarge 4 5 shards, 1 replica Nested 22 0
DynamoDB NA Serverless 0 100 WCU, 500 RCU Single table 1000 4545.45

Experiment 3: Use AWS Lambda@Edge and AWS Wavelength for better network performance

We recommended that Plugsurfing use Lambda@Edge and AWS Wavelength to optimize network performance by shifting some of the APIs at the edge to closer to the user. The EV car dashboard can use the same 5G network connectivity to invoke Plugsurfing APIs with AWS Wavelength.

Post-prototype architecture

The post-prototype architecture used purpose-built databases on AWS to achieve better performance across all four use cases. We looked at the results and split the workload based on which database performs best for each use case. This approach optimized performance and cost, but added complexity on readers and writers. The final experiment summary represents the database fits for the given use cases that provide the best performance (highlighted in orange).

Plugsurfing has already implemented a short-term plan (light green) as an immediate action post-prototype and plans to implement mid-term and long-term actions (dark green) in the future.

DB Engine Node Type Configurations Radius req/sec Radius Filtering req/sec Clustering req/sec Square req/sec Monthly Costs $ Cost Benefit % Performance Gain %
Elasticsearch 7.1 m4.10xlarge x4 5 shards 2841 580 22 412 9584,64 0 0
Amazon OpenSearch Service 1.0 r6g.2xlarge x2

1 shard

Nested

1667 474 34 142 1078,56 88,75 -39,9
Amazon OpenSearch Service 1.0 r6g.2xlarge x2 1 shard 1993 1268 125 685 1078,56 88,75 5,6
Aurora PostgreSQL 13.4 r6g.2xlarge x2 PostGIS 0 0 275 3553 1031,04 89,24 782,03
DynamoDB Serverless

100 WCU

500 RCU

0 0 1000 0 106,06 98,89 4445,45
Summary . . 2052 1268 1000 3553 2215,66 76,88 104,23

The following diagram illustrates the updated architecture.

Post Prototype Architecture

Conclusion

Plugsurfing was able to achieve a 70% cost reduction over their legacy setup with two-times better performance by using purpose-built databases like DynamoDB, Aurora PostgreSQL, and AWS Graviton based instances for Amazon OpenSearch Service. They achieved the following results:

  • The radius search and radius search with filtering use cases achieved better performance using Amazon OpenSearch Service on AWS Graviton with a denormalized document structure
  • The square search use case performed better using Aurora PostgreSQL, where we used the PostGIS extension for geo square queries
  • The geo clustering search use case performed better using DynamoDB

Learn more about AWS Graviton instances and purpose-built databases on AWS, and let us know how we can help optimize your workload on AWS.


About the Author

Anand ShahAnand Shah is a Big Data Prototyping Solution Architect at AWS. He works with AWS customers and their engineering teams to build prototypes using AWS Analytics services and purpose-built databases. Anand helps customers solve the most challenging problems using art-of-the-possible technology. He enjoys beaches in his leisure time.

AWS Week In Review – July 11, 2022

Post Syndicated from Sébastien Stormacq original https://aws.amazon.com/blogs/aws/aws-week-in-review-july-11/

This post is part of our Week in Review series. Check back each week for a quick roundup of interesting news and announcements from AWS!

In France, we know summer has started when you see the Tour de France bike race on TV or in a city nearby. This year, the tour stopped in the city where I live, and I was blocked on my way back home from a customer conference to let the race pass through.

It’s Monday today, so let’s make another tour—a tour of the AWS news, announcements, or blog posts that captured my attention last week. I selected these as being of interest to IT professionals and developers: the doers, the builders that spend their time on the AWS Management Console or in code.

Last Week’s Launches
Here are some launches that got my attention during the previous week:

Amazon EC2 Mac M1 instances are generally available – this new EC2 instance type allows you to deploy Mac mini computers with M1 Apple Silicon running macOS using the same console, API, SDK, or CLI you are used to for interacting with EC2 instances. You can start, stop them, assign a security group or an IAM role, snapshot their EBS volume, and recreate an AMI from it, just like with Linux-based or Windows-based instances. It lets iOS developers create full CI/CD pipelines in the cloud without requiring someone in your team to reinstall various combinations of macOS and Xcode versions on on-prem machines. Some of you had the chance the enter the preview program for EC2 Mac M1 instances when we announced it last December. EC2 Mac M1 instances are now generally available.

AWS IAM Roles Anywhere – this is one of those incremental changes that has the potential to unlock new use cases on the edge or on-prem. AWS IAM Roles Anywhere enables you to use IAM roles for your applications outside of AWS to access AWS APIs securely, the same way that you use IAM roles for workloads on AWS. With IAM Roles Anywhere, you can deliver short-term credentials to your on-premises servers, containers, or other compute platforms. It requires an on-prem Certificate Authority registered as a trusted source in IAM. IAM Roles Anywhere exchanges certificates issued by this CA for a set of short-term AWS credentials limited in scope by the IAM role associated to the session. To make it easy to use, we do provide a CLI-based signing helper tool that can be integrated in your CLI configuration.

A streamlined deployment experience for .NET applications – the new deployment experience focuses on the type of application you want to deploy instead of individual AWS services by providing intelligent compute recommendations. You can find it in the AWS Toolkit for Visual Studio using the new “Publish to AWS” wizard. It is also available via the .NET CLI by installing AWS Deploy Tool for .NET. Together, they help easily transition from a prototyping phase in Visual Studio to automated deployments. The new deployment experience supports ASP.NET Core, Blazor WebAssembly, console applications (such as long-lived message processing services), and tasks that need to run on a schedule.

For a full list of AWS announcements, be sure to keep an eye on the What’s New at AWS page.

Other AWS News
This week, I also learned from these blog posts:

TLS 1.2 to become the minimum TLS protocol level for all AWS API endpointsthis article was published at the end of June, and it deserves more exposure. Starting in June 2022, we will progressively transition all our API endpoints to TLS 1.2 only. The good news is that 95 percent of the API calls we observe are already using TLS 1.2, and only five percent of the applications are impacted. If you have applications developed before 2014 (using a Java JDK before version 8 or .NET before version 4.6.2), it is worth checking your app and updating them to use TLS 1.2. When we detect your application is still using TLS 1.0 or TLS 1.1, we inform you by email and in the AWS Health Dashboard. The blog article goes into detail about how to analyze AWS CloudTrail logs to detect any API call that would not use TLS 1.2.

How to implement automated appointment reminders using Amazon Connect and Amazon Pinpoint this blog post guides you through the steps to implement a system to automatically call your customers to remind them of their appointments. This automated outbound campaign for appointment reminders checked the campaign list against a “do not call” list before making an outbound call. Your customers are able to confirm automatically or reschedule by speaking to an agent. You monitor the results of the calls on a dashboard in near real time using Amazon QuickSight. It provides you with AWS CloudFormation templates for the parts that can be automated and detailed instructions for the manual steps.

Using Amazon CloudWatch metrics math to monitor and scale resources AWS Auto Scaling is one of those capabilities that may look like magic at first glance. It uses metrics to take scale-out or scale-in decisions. Most customers I talk with struggle a bit at first to define the correct combination of metrics that allow them to scale at the right moment. Scaling out too late impacts your customer experience while scaling out too early impacts your budget. This article explains how to use metric math, a way to query multiple Amazon CloudWatch metrics, and use math expressions to create new time series based on these metrics. These math metrics may, in turn, be used to trigger scaling decisions. The typical use case would be to mathematically combine CPU, memory, and network utilization metrics to decide when to scale in or to scale out.

How to use Amazon RDS and Amazon Aurora with a static IP address – in the cloud, it is better to access network resources by referencing their DNS name instead of IP addresses. IP addresses come and go as resources are stopped, restarted, scaled out, or scaled in. However, when integrating with older, more rigid environments, it might happen, for a limited period of time, to authorize access through a static IP address. You have probably heard that scary phrase: “I have to authorize your IP address in my firewall configuration.” This new blog post explains how to do so for Amazon Relational Database Service (Amazon RDS) database. It uses a Network Load Balancer and traffic forwarding at the Linux-kernel level to proxy your actual database server.

Amazon S3 Intelligent-Tiering significantly reduces storage costs – we estimate our customers saved up to $250 millions in storage costs since we launched S3 Intelligent-Tiering in 2018. A recent blog post describes how Amazon Photo, a service that provides unlimited photo storage and 5 GB of video storage to Amazon Prime members in eight marketplaces world-wide, uses S3 Intelligent-Tiering to significantly save on storage costs while storing hundreds of petabytes of content and billions of images and videos on S3.

Upcoming AWS Events
Check your calendars and sign up for these AWS events:

AWS re:Inforce is the premier cloud security conference, July 26-27. This year it is hosted at the Boston Convention and Exhibition Center, Massachusetts, USA. The conference agenda is available and there is still time to register.

AWS Summit Chicago, August 25, at McCormick Place, Chicago, Illinois, USA. You may register now.

AWS Summit Canberra, August 31, at the National Convention Center, Canberra, Australia. Registrations are already open.

That’s all for this week. Check back next Monday for another tour of AWS news and launches!

— seb

Considerations for modernizing Microsoft SQL database service with high availability on AWS

Post Syndicated from Lewis Tang original https://aws.amazon.com/blogs/architecture/considerations-for-modernizing-microsoft-sql-database-service-with-high-availability-on-aws/

Many organizations have applications that require Microsoft SQL Server to run relational database workloads: some applications can be proprietary software that the vendor mandates Microsoft SQL Server to run database service; the other applications can be long-standing, home-grown applications that included Microsoft SQL Server when they were initially developed. When organizations migrate applications to AWS, they often start with lift-and-shift approach and run Microsoft SQL database service on Amazon Elastic Compute Cloud (Amazon EC2). The reason could be this is what they are most familiar with.

In this post, I share the architecture options to modernize Microsoft SQL database service and run highly available relational data services on Amazon EC2, Amazon Relational Database Service (Amazon RDS), and Amazon Aurora (Aurora).

Running Microsoft SQL database service on Amazon EC2 with high availability

This option is the least invasive to existing operations models. It gives you a quick start to modernize Microsoft SQL database service by leveraging the AWS Cloud to manage services like physical facilities. The low-level infrastructure operational tasks—such as server rack, stack, and maintenance—are managed by AWS. You have full control of the database and operating-system–level access, so there is a choice of tools to manage the operating system, database software, patches, data replication, backup, and restoration.

You can use any Microsoft SQL Server-supported replication technology with your Microsoft SQL Server database on Amazon EC2 to achieve high availability, data protection, and disaster recovery. Common solutions include log shipping, database mirroring, Always On availability groups, and Always On Failover Cluster Instances.

High availability in a single Region

Figure 1 shows how you can use Microsoft SQL Server on Amazon EC2 across multiple Availability Zones (AZs) within single Region. The interconnects among AZs that are similar to your data center intercommunications are managed by AWS. The primary database is a read-write database, and the secondary database is configured with log shipping, database mirroring, or Always On availability groups for high availability. All the transactional data from the primary database is transferred and can be applied to the secondary database asynchronously for log shipping, and it can either asynchronously or synchronously for Always On availability groups and mirroring.

High availability in a single Region with Microsoft SQL Database Service on Amazon EC2

Figure 1. High availability in a single Region with Microsoft SQL database service on Amazon EC2

High availability across multiple Regions

Figure 2 demonstrates how to configure high availability for Microsoft SQL Server on Amazon EC2 across multiple Regions. A secondary Microsoft SQL Server in a different Region from the primary is configured with log shipping, database mirroring, or Always On availability groups for high availability. The transactional data from primary database is transferred via the fully managed backbone network of AWS across Regions.

High availability across multiple Regions with Microsoft SQL database service on Amazon EC2

Figure 2. High availability across multiple Regions with Microsoft SQL database service on Amazon EC2

Replatforming Microsoft SQL Database Service on Amazon RDS with high availability

Amazon RDS is a managed database service and responsible for most management tasks. It currently supports Multi-AZ deployments for SQL Server using SQL Server Database Mirroring (DBM) or Always On Availability Groups (AGs) as a high-availability, failover solution.

High availability in a single Region

Figure 3 demonstrates the Microsoft SQL database service that is run on Amazon RDS is configured with a multi-AZ deployment model in single region. Multi-AZ deployments provide increased availability, data durability, and fault tolerance for DB instances. In the event of planned database maintenance or unplanned service disruption, Amazon RDS automatically fails-over to the up-to-date secondary DB instance. This functionality lets database operations resume quickly without manual intervention. The primary and standby instances use the same endpoint, whose physical network address transitions to the secondary replica as part of the failover process. You don’t have to reconfigure your application when a failover occurs. Amazon RDS supports multi-AZ deployments for Microsoft SQL Server by using either SQL Server database mirroring or Always On availability groups.

High availability in a single Region with Microsoft SQL database service on Amazon RDS

Figure 3. High availability in a single Region with Microsoft SQL database service on Amazon RDS

High availability across multiple Regions

Figure 4 depicts how you can use AWS Database Migration Service (AWS DMS) to configure continuous replication among Microsoft SQL Database Service on Amazon RDS across multiple Regions. AWS DMS needs Microsoft Change Data Capture to be enabled on the Amazon RDS for the Microsoft SQL Server instance. If problems occur, you can initiate manual failovers and reinstate database services by promoting the Amazon RDS read replica in a different Region.

High availability across multiple Regions with Microsoft SQL database service on Amazon RDS

Figure 4. High availability across multiple Regions with Microsoft SQL database service on Amazon RDS

Refactoring Microsoft SQL database service on Amazon Aurora with high availability

This option helps you to eliminate the cost of SQL database service license. You can run database service on a truly cloud native modern database architecture. You can use AWS Schema Conversion Tool to assist in the assessment and conversion of your database code and storage objects. Any objects that cannot be automatically converted are clearly marked so they can be manually converted to complete the migration.

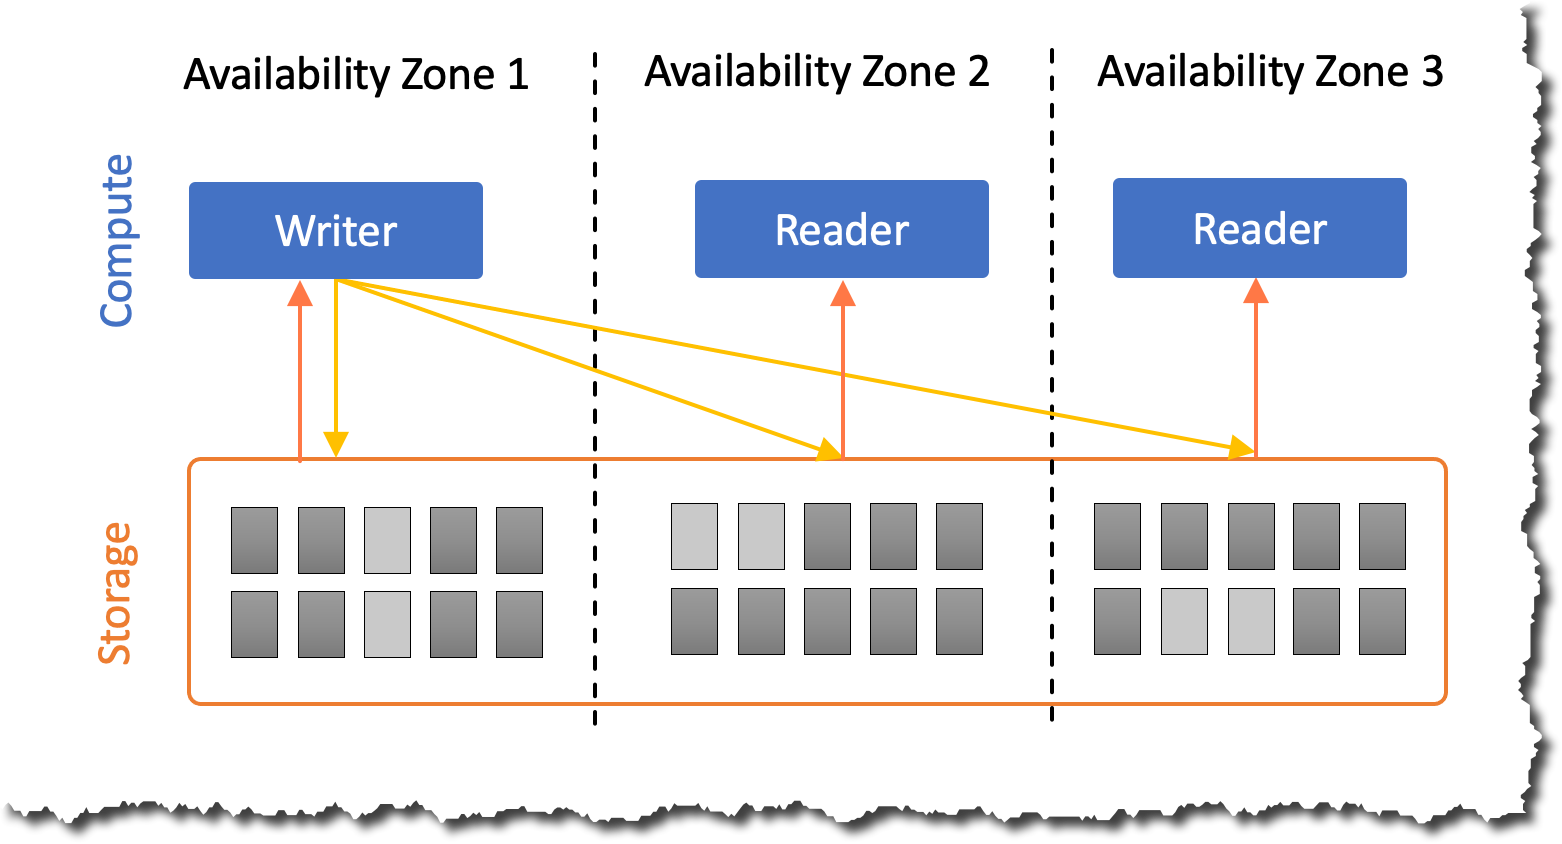
The Aurora architecture involves separation of storage and compute. Aurora includes some high availability features that apply to the data in your database cluster. The data remains safe even if some or all of the DB instances in the cluster become unavailable. Other high availability features apply to the DB instances. These features help to make sure that one or more DB instances are ready to handle database requests from your application.

High availability in a single Region

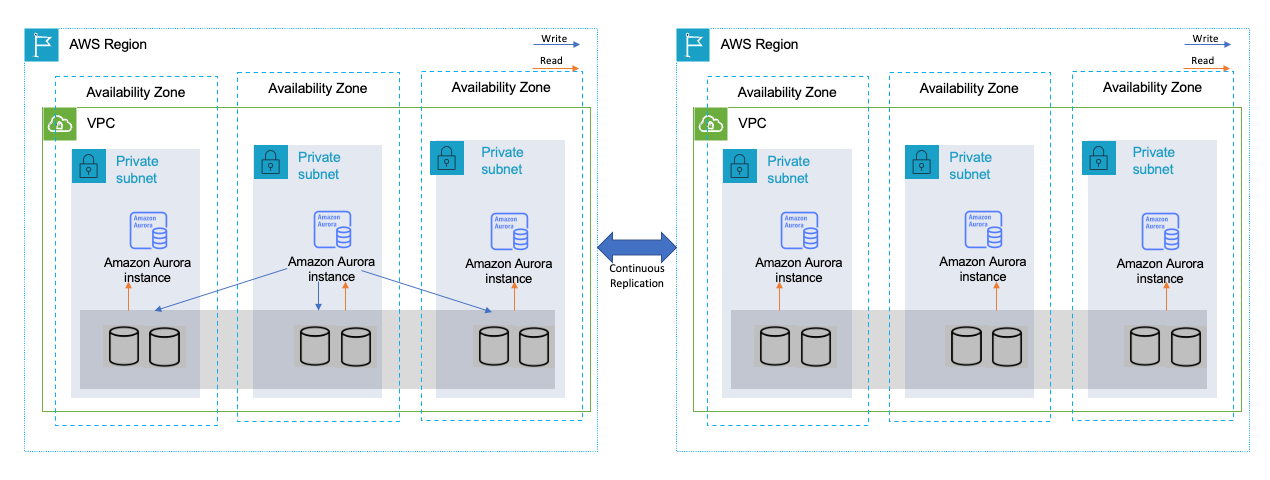
Figure 5 demonstrates Aurora stores copies of the data in a database cluster across multiple AZs in single Region. When data is written to the primary DB instance, Aurora synchronously replicates the data across AZs to six storage nodes associated with your cluster volume. Doing so provides data redundancy, eliminates I/O freezes, and minimizes latency spikes during system backups. Running a DB instance with high availability can enhance availability during planned system maintenance, such as database engine updates, and help protect your databases against failure and AZ disruption.

High availability in a single Region with Amazon Aurora

Figure 5. High availability in a single Region with Amazon Aurora

High availability across multiple Regions

Figure 6 depicts how you can set up Aurora global databases for high availability across multiple Regions. An Aurora global database consists of one primary Region where your data is written, and up to five read-only secondary Regions. You issue write operations directly to the primary database cluster in the primary Region. Aurora automatically replicates data to the secondary Regions using dedicated infrastructure, with latency typically under a second.

High availability across multiple Regions with Amazon Aurora global databases

Figure 6. High availability across multiple Regions with Amazon Aurora global databases

Summary

You can choose among the options of Amazon EC2, Amazon RDS, and Amazon Aurora when modernizing SQL database service on AWS. Understanding the features required by business and the scope of service management responsibilities are good starting points. When presented with multiple options that meet with business needs, choose one that will allow more focus on your application, business value-add capabilities, and help you to reduce the services’ “total cost of ownership”.

Leverage DevOps Guru for RDS to detect anomalies and resolve operational issues

Post Syndicated from Kishore Dhamodaran original https://aws.amazon.com/blogs/devops/leverage-devops-guru-for-rds-to-detect-anomalies-and-resolve-operational-issues/

The Relational Database Management System (RDBMS) is a popular choice among organizations running critical applications that supports online transaction processing (OLTP) use-cases. But managing the RDBMS database comes with its own challenges. AWS has made it easier for organizations to operate these databases in the cloud, thereby addressing the undifferentiated heavy lifting with managed databases (Amazon Aurora, Amazon RDS). Although using managed services has freed up engineering from provisioning hardware, database setup, patching, and backups, they still face the challenges that come with running a highly performant database. As applications scale in size and sophistication, it becomes increasingly challenging for customers to detect and resolve relational database performance bottlenecks and other operational issues quickly.

Amazon RDS Performance Insights is a database performance tuning and monitoring feature, that lets you quickly assess your database load and determine when and where to take action. Performance Insights lets non-experts in database administration diagnose performance problems with an easy-to-understand dashboard that visualizes database load. Furthermore, Performance Insights expands on the existing Amazon RDS monitoring features to illustrate database performance and help analyze any issues that affect it. The Performance Insights dashboard also lets you visualize the database load and filter the load by waits, SQL statements, hosts, or users.

On Dec 1st, 2021, we announced Amazon DevOps Guru for RDS, a new capability for Amazon DevOps Guru. It’s a fully-managed machine learning (ML)-powered service that detects operational and performance related issues for Amazon Aurora engines. It uses the data that it collects from Performance Insights, and then automatically detects and alerts customers of application issues, including database problems. When DevOps Guru detects an issue in an RDS database, it publishes an insight in the DevOps Guru dashboard. The insight contains an anomaly for the resource AWS/RDS. If DevOps Guru for RDS is turned on for your instances, then the anomaly contains a detailed analysis of the problem. DevOps Guru for RDS also recommends that you perform an investigation, or it provides a specific corrective action. For example, the recommendation might be to investigate a specific high-load SQL statement or to scale database resources.

In this post, we’ll deep-dive into some of the common issues that you may encounter while running your workloads against Amazon Aurora MySQL-Compatible Edition databases, with simulated performance issues. We’ll also look at how DevOps Guru for RDS can help identify and resolve these issues. Simulating a performance issue is resource intensive, and it will cost you money to run these tests. If you choose the default options that are provided, and clean up your resources using the following clean-up instructions, then it will cost you approximately $15 to run the first test only. If you wish to run all of the tests, then you can choose “all” in the Tests parameter choice. This will cost you approximately $28 to run all three tests.

Prerequisites

To follow along with this walkthrough, you must have the following prerequisites:

  • An AWS account with a role that has sufficient access to provision the required infrastructure. The account should also not have exceeded its quota for the resources being deployed (VPCs, Amazon Aurora, etc.).
  • Credentials that enable you to interact with your AWS account.
  • If you already have Amazon DevOps Guru turned on, then make sure that it’s tagged properly to detect issues for the resource being deployed.

Solution overview

You will clone the project from GitHub and deploy an AWS CloudFormation template, which will set up the infrastructure required to run the tests. If you choose to use the defaults, then you can run only the first test. If you would like to run all of the tests, then choose the “all” option under Tests parameter.

We simulate some common scenarios that your database might encounter when running enterprise applications. The first test simulates locking issues. The second test simulates the behavior when the AUTOCOMMIT property of the database driver is set to: True. This could result in statement latency. The third test simulates performance issues when an index is missing on a large table.

Solution walk through

Clone the repo and deploy resources

  1. Utilize the following command to clone the GitHub repository that contains the CloudFormation template and the scripts necessary to simulate the database load. Note that by default, we’ve provided the command to run only the first test.
    git clone https://github.com/aws-samples/amazon-devops-guru-rds.git
    cd amazon-devops-guru-rds
    
    aws cloudformation create-stack --stack-name DevOpsGuru-Stack \
        --template-body file://DevOpsGuruMySQL.yaml \
        --capabilities CAPABILITY_IAM \
        --parameters ParameterKey=Tests,ParameterValue=one \
    ParameterKey=EnableDevOpsGuru,ParameterValue=y

    If you wish to run all four of the tests, then flip the ParameterValue of the Tests ParameterKey to “all”.

    If Amazon DevOps Guru is already enabled in your account, then change the ParameterValue of the EnableDevOpsGuru ParameterKey to “n”.

    It may take up to 30 minutes for CloudFormation to provision the necessary resources. Visit the CloudFormation console (make sure to choose the region where you have deployed your resources), and make sure that DevOpsGuru-Stack is in the CREATE_COMPLETE state before proceeding to the next step.

  2. Navigate to AWS Cloud9, then choose Your environments. Next, choose DevOpsGuruMySQLInstance followed by Open IDE. This opens a cloud-based IDE environment where you will be running your tests. Note that in this setup, AWS Cloud9 inherits the credentials that you used to deploy the CloudFormation template.
  3. Open a new terminal window which you will be using to clone the repository where the scripts are located.

  1. Clone the repo into your Cloud9 environment, then navigate to the directory where the scripts are located, and run initial setup.
git clone https://github.com/aws-samples/amazon-devops-guru-rds.git
cd amazon-devops-guru-rds/scripts
sh setup.sh 
# NOTE: If you are running all test cases, use sh setup.sh all command instead. 
source ~/.bashrc
  1. Initialize databases for all of the test cases, and add random data into them. The script to insert random data takes approximately five hours to complete. Your AWS Cloud9 instance is set up to run for up to 24 hours before shutting down. You can exit the browser and return between 5–24 hours to validate that the script ran successfully, then continue to the next step.
source ./connect.sh test 1
USE devopsgurusource;
CREATE TABLE IF NOT EXISTS test1 (id int, filler char(255), timer timestamp);
exit;
python3 ct.py

If you chose to run all test cases, and you ran the sh setup.sh all command in Step 4, open two new terminal windows and run the following commands to insert random data for test cases 2 and 3.

# Test case 2 – Open a new terminal window to run the commands
cd amazon-devops-guru-rds/scripts
source ./connect.sh test 2
USE devopsgurusource;
CREATE TABLE IF NOT EXISTS test1 (id int, filler char(255), timer timestamp);
exit;
python3 ct.py
# Test case 3 - Open a new terminal window to run the commands
cd amazon-devops-guru-rds/scripts
source ./connect.sh test 3
USE devopsgurusource;
CREATE TABLE IF NOT EXISTS test1 (id int, filler char(255), timer timestamp);
exit;
python3 ct.py
  1. Return between 5-24 hours to run the next set of commands.
  1. Add an index to the first database.
source ./connect.sh test 1
CREATE UNIQUE INDEX test1_pk ON test1(id);
INSERT INTO test1 VALUES (-1, 'locker', current_timestamp);
exit;
  1. If you chose to run all test cases, and you ran the sh setup.sh all command in Step 4, add an index to the second database. NOTE: Do no add an index to the third database.
source ./connect.sh test 2
CREATE UNIQUE INDEX test1_pk ON test1(id);
INSERT INTO test1 VALUES (-1, 'locker', current_timestamp);
exit;

DevOps Guru for RDS uses Performance Insights, and it establishes a baseline for the database metrics. Baselining involves analyzing the database performance metrics over a period of time to establish a “normal” behavior. DevOps Guru for RDS then uses ML to detect anomalies against the established baseline. If your workload pattern changes, then DevOps Guru for RDS establishes a new baseline that it uses to detect anomalies against the new “normal”. For new database instances, DevOps Guru for RDS takes up to two days to establish an initial baseline, as it requires an analysis of the database usage patterns and establishing what is considered a normal behavior.

  1. Allow two days before you start running the following tests.

Scenario 1: Locking Issues

In this scenario, multiple sessions compete for the same (“locked”) record, and they must wait for each other.
In real life, this often happens when:

  • A database session gets disconnected due to a (i.e., temporary network) malfunction, while still holding a critical lock.
  • Other sessions become stuck while waiting for the lock to be released.
  • The problem is often exacerbated by the application connection manager that keeps spawning additional sessions (because the existing sessions don’t complete the work on time), thus creating a distinct “inclined slope” pattern that you’ll see in this scenario.

Here’s how you can reproduce it:

  1. Connect to the database.
cd amazon-devops-guru-rds/scripts
source ./connect.sh test 1
  1. In your MySQL, enter the following SQL, and don’t exit the shell.
START TRANSACTION;
UPDATE test1 SET timer=current_timestamp WHERE id=-1;
-- Do NOT exit!
  1. Open a new terminal, and run the command to simulate competing transactions. Give it approximately five minutes before you run the commands in this step.
cd amazon-devops-guru-rds/scripts
source ./connect.sh test 1
exit;
python3 locking_scenario.py 1 1200 2
  1. After the program completes its execution, navigate to the Amazon DevOps Guru console, choose Insights, and then choose RDS DB Load Anomalous. You’ll notice a summary of the insight under Description.

Shows navigation to Amazon DevOps Guru Insights and RDS DB Load Anomalous screen to find the summary description of the anomaly.

  1. Choose the View Recommendations link on the top right, and observe the databases for which it’s showing the recommendations.
  2. Next, choose View detailed analysis for database performance anomaly for the following resources.
  3. Under To view a detailed analysis, choose a resource name, choose the database associated with the first test.

 Shows the detailed analysis of the database performance anomaly. The database experiencing load is chosen, and a graphical representation of how the Average active sessions (AAS) spikes, which Amazon DevOps Guru is able to identify.

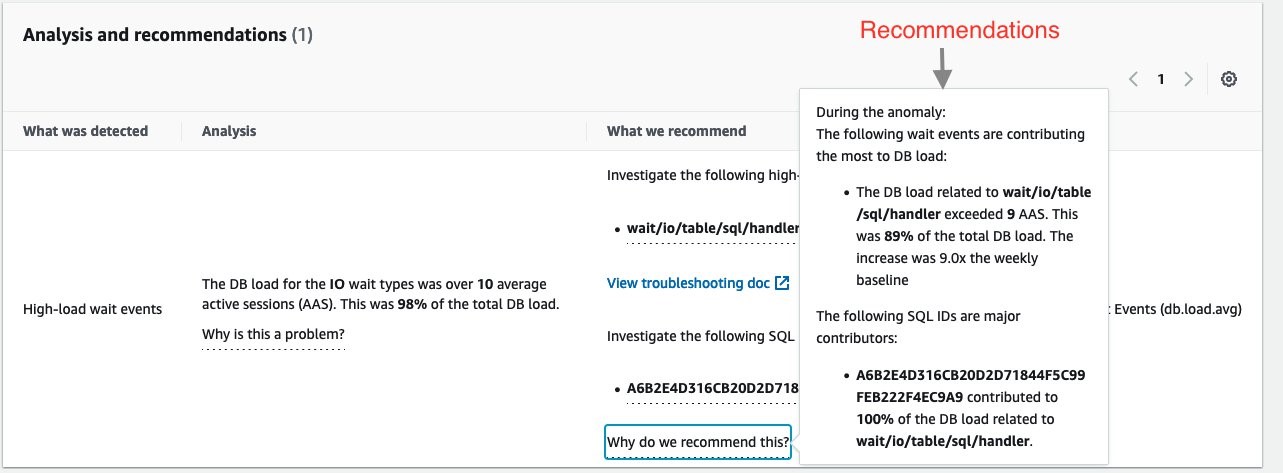
  1. Observe the recommendations under Analysis and recommendations. It provides you with analysis, recommendations, and links to troubleshooting documentation.

Shows a different section of the detailed analysis screen that provides Analysis and recommendations and links to the troubleshooting documentation.

In this example, DevOps Guru for RDS has detected a high and unusual spike of database load, and then marked it as “performance anomaly”.

Note that the relative size of the anomaly is significant: 490 times higher than the “typical” database load, which is why it’s deemed: “HIGH severity”.

In the analysis section, note that a single “wait event”, wait/synch/mutex/innodb/aurora_lock_thread_slot_futex, is dominating the entire spike. Moreover, a single SQL is “responsible” (or more precisely: “suffering”) from this wait event at the time of the problem. Select the wait event name and see a simple explanation of what’s happening in the database. For example, it’s “record locking”, where multiple sessions are competing for the same database records. Additionally, you can select the SQL hash and see the exact text of the SQL that’s responsible for the issue.

If you’re interested in why DevOps Guru for RDS detected this problem, and why these particular wait events and an SQL were selected, the Why is this a problem? and Why do we recommend this? links will provide the answer.

Finally, the most relevant part of this analysis is a View troubleshooting doc link. It references a document that contains a detailed explanation of the likely causes for this problem, as well as the actions that you can take to troubleshoot and address it.

Scenario 2: Autocommit: ON

In this scenario, we must run multiple batch updates, and we’re using a fairly popular driver setting: AUTOCOMMIT: ON.

This setting can sometimes lead to performance issues as it causes each UPDATE statement in a batch to be “encased” in its own “transaction”. This leads to data changes being frequently synchronized to disk, thus dramatically increasing batch latency.

Here’s how you can reproduce the scenario:

  1. On your Cloud9 terminal, run the following commands:
cd amazon-devops-guru-rds/scripts
source ./connect.sh test 2
exit;
python3 batch_autocommit.py 50 1200 1000 10000000
  1. Once the program completes its execution, or after an hour, navigate to the Amazon DevOps Guru console, choose Insights, and then choose RDS DB Load Anomalous. Then choose Recommendations and choose View detailed analysis for database performance anomaly for the following resources. Under To view a detailed analysis, choose a resource name, choose the database associated with the second test.

  1. Observe the recommendations under Analysis and recommendations. It provides you with analysis, recommendations, and links to troubleshooting documentation.

Shows a different section of the detailed analysis screen that provides Analysis and recommendations and links to the troubleshooting documentation.

Note that DevOps Guru for RDS detected a significant (and unusual) spike of database load and marked it as a HIGH severity anomaly.

The spike looks similar to the previous example (albeit, “smaller”), but it describes a different database problem (“COMMIT slowdowns”). This is because of a different database wait event that dominates the spike: wait/io/aurora_redo_log_flush.

As in the previous example, you can select the wait event name to see a simple description of what’s going on, and you can select the SQL hash to see the actual statement that is slow. Furthermore, just as before, the View troubleshooting doc link references the document that describes what you can do to troubleshoot the problem further and address it.

Scenario 3: Missing index

Have you ever wondered what would happen if you drop a frequently accessed index on a large table?

In this relatively simple scenario, we’re testing exactly that – an index gets dropped causing queries to switch from fast index lookups to slow full table scans, thus dramatically increasing latency and resource use.

Here’s how you can reproduce this problem and see it for yourself:

  1. On your Cloud9 terminal, run the following commands:
cd amazon-devops-guru-rds/scripts
source ./connect.sh test 3
exit;
python3 no_index.py 50 1200 1000 10000000
  1. Once the program completes its execution, or after an hour, navigate to the Amazon DevOps Guru console, choose Insights, and then choose RDS DB Load Anomalous. Then choose Recommendations and choose View detailed analysis for database performance anomaly for the following resources. Under To view a detailed analysis, choose a resource name, choose the database associated with the third test.

Shows the detailed analysis of the database performance anomaly. The database experiencing load is chosen and a graphical representation of how the Average active sessions (AAS) spikes which Amazon DevOps Guru is able to identify.

  1. Observe the recommendations under Analysis and recommendations. It provides you with analysis, recommendations, and links to troubleshooting documentation.

Shows a different section of the detailed analysis screen that provides Analysis and recommendations and links to the troubleshooting documentation.

As with the previous examples, DevOps Guru for RDS detected a high and unusual spike of database load (in this case, ~ 50 times larger than the “typical” database load). It also identified that a single wait event, wait/io/table/sql/handler, and a single SQL, are responsible for this issue.

The analysis highlights the SQL that you must pay attention to, and it links a detailed troubleshooting document that lists the likely causes and recommended actions for the problems that you see. While it doesn’t tell you that the “missing index” is the real root cause of the issue (this is planned in future versions), it does offer many relevant details that can help you come to that conclusion yourself.

Cleanup

On your terminal where you originally ran the AWS Command Line Interface (AWS CLI) command to create the CloudFormation resources, run the following command:

aws cloudformation delete-stack --stack-name DevOpsGuru-Stack

Conclusion

In this post, you learned how to leverage DevOps Guru for RDS to alert you of any operational issues with recommendations. You simulated some of the commonly encountered, real-world production issues, such as locking contentions, AUTOCOMMIT, and missing indexes. Moreover, you saw how DevOps Guru for RDS helped you detect and resolve these issues. Try this out, and let us know how DevOps Guru for RDS was able to address your use-case.

Authors:

Kishore Dhamodaran

Kishore Dhamodaran is a Senior Solutions Architect at AWS. Kishore helps strategic customers with their cloud enterprise strategy and migration journey, leveraging his years of industry and cloud experience.

Simsek Mert

Simsek Mert is a Cloud Application Architect with AWS Professional Services.
Simsek helps customers with their application architecture, containers, serverless applications, leveraging his over 20 years of experience.

Maxym Kharchenko

Maxym Kharchenko is a Principal Database Engineer at AWS. He builds automated monitoring tools that use machine learning to discover and explain performance problems in relational databases.

Jared Keating

Jared Keating is a Senior Cloud Consultant with Amazon Web Services Professional Services. Jared assists customers with their cloud infrastructure, compliance, and automation requirements drawing from his over 20 years of experience in IT.

Chaos experiments on Amazon RDS using AWS Fault Injection Simulator

Post Syndicated from Anup Sivadas original https://aws.amazon.com/blogs/devops/chaos-experiments-on-amazon-rds-using-aws-fault-injection-simulator/

Performing controlled chaos experiments on your Amazon Relational Database Service (RDS) database instances and validating the application behavior is essential to making sure that your application stack is resilient. How does the application behave when there is a database failover? Will the connection pooling solution or tools being used gracefully connect after a database failover is successful? Will there be a cascading failure if the database node gets rebooted for a few seconds? These are some of the fundamental questions that you should consider when evaluating the resiliency of your database stack. Chaos engineering is a way to effectively answer these questions.

Traditionally, database failure conditions, such as a failover or a node reboot, are often triggered using a script or 3rd party tools. However, at scale, these external dependencies often become a bottleneck and are hard to maintain and manage. Scripts and 3rd party tools can fail when called, whereas a web service is highly available. The scripts and 3rd party tools also tend to require elevated permissions to work, which is a management overhead and insecure from a least privilege access model perspective. This is where AWS Fault Injection Simulator (FIS) comes to the rescue.

AWS Fault Injection Simulator (AWS FIS) is a fully managed service for running fault injection experiments on AWS that makes it easier to improve an application’s performance, observability, and resiliency. Fault injection experiments are used in chaos engineering, which is the practice of stressing an application in testing or production environments by creating disruptive events, such as a sudden increase in CPU or memory consumption, database failover and observing how the system responds, and implementing improvements.

We can define the key phases of chaos engineering as identifying the steady state of the workload, defining a hypothesis, running the experiment, verifying the experiment results and making necessary improvements based on the experiment results. These phases will confirm that you are injecting failures in a controlled environment through well-planned experiments in order to build confidence in the workloads and tools we are using to withstand turbulent conditions.

This diagram explains the phases of chaos engineering. We start with identifying the steady state, defining a hypothesis, run the experiment, verify the experiment results and improve. This is a cycle.

Example—

  • Baseline: we have a managed database with a replica and automatic failover enabled.
  • Hypothesis: failure of a single database instance / replica may slow down a few requests but will not adversely affect our application.
  • Run experiment: trigger a DB failover.
  • Verify: confirm/dis-confirm the hypothesis by looking at KPIs for the application (e.g., via CloudWatch metric/alarm).

Methodology and Walkthrough

Let’s look at how you can configure AWS FIS to perform failure conditions for your RDS database instances. For this walkthrough, we’ll look at injecting a cluster failover for Amazon Aurora PostgreSQL. You can leverage an existing Aurora PostgreSQL cluster or you can launch a new cluster by following the steps in the Create an Aurora PostgreSQL DB Cluster documentation.

Step 1: Select the Aurora Cluster.

The Aurora PostgreSQL instance that we’ll use for this walkthrough is provisioned in us-east-1 (N. Virginia), and it’s a cluster with two instances. There is one writer instance and another reader instance (Aurora replica). The cluster is named chaostest, the writer instance is named chaostest-instance-1, and the reader is named chaostest-intance-1-us-east-1a.

Under RDS Databases Section, the cluster named chaostest is selected. Under the cluster there are two instances which is available. Chaostest-instance-1 is the writer instance and chaostest-instance-1-us-east-1a is the reader instance.

The goal is to simulate a failover for this Aurora PostgreSQL cluster so that the existing chaostest-intance-1-us-east-1a reader instance will switch roles and then be promoted as the writer, and the existing chaostest-instance-1 will become the reader.

Step 2: Navigate to the AWS FIS console.

We will now navigate to the AWS FIS console to create an experiment template. Select Create experiment template.

Under FIS console, Create experiment template needs to be selected.

Step 3: Complete the AWS FIS template pre-requisites.

Enter a Description, Name, and select the AWS IAM Role for the experiment template.

Under create experiment template section, Simulate Database Failover is entered for the Description field. DBFailover is entered for the Name field(Optional). FISWorkshopServiceRole is selected for the IAM role drop down field.

The IAM role selected above was pre-created. To use AWS FIS, you must create an IAM role that grants AWS FIS the permissions required so that the service can run experiments on your behalf. The role follows the least privileged model and includes permissions to act on your database clusters like trigger a failover. AWS FIS only uses the permissions that have been delegated explicitly for the role. To learn more about how to create an IAM role with the required permissions for AWS FIS, refer to the FIS documentation.

Step 4: Navigate to the Actions, Target, Stop Condition section of the template.

The next key section of AWS FIS is Action, Target, and Stop Condition.

Action, Target and Stop Conditions section is highlighted in the image.

Action—An action is an activity that AWS FIS performs on an AWS resource during an experiment. AWS FIS provides a set of pre-configured actions based on the AWS resource type. Each Action runs for a specified duration during an experiment, or until you stop the experiment. An action can run sequentially or in parallel.

For our experiment, the Action will be aws:rds:failover-db-cluster.

Target—A target is one or more AWS resources on which AWS FIS performs an action during an experiment. You can choose specific resources or select a group of resources based on specific criteria, such as tags or state.

For our experiment, the target will be the chaostest Aurora PostgreSQL cluster.

Stop Condition—AWS FIS provides the controls and guardrails that you need to run experiments safely on your AWS workloads. A stop condition is a mechanism to stop an experiment if it reaches a threshold that you define as an Amazon CloudWatch alarm. If a stop condition is triggered while the experiment is running, then AWS FIS stops the experiment.

For our experiment, we won’t be defining a stop condition. This is because this simple experiment contains only one action. Stop conditions are especially useful for experiments with a series of actions, to prevent them from continuing if something goes wrong.

Step 5: Configure Action.

Now, let’s configure the Action and Target for our experiment template. Under the Actions section, we will select Add action to get the New action window.

The action section displays Name,Description, Action Type and Start After fields. There is a Add action button that needs to be selected.

Enter a Name, a Description, and select Action type aws:rds:failover-db-cluster. Start after is an optional setting. This setting allows you to specify an action that should precede the one we are currently configuring.

Under Actions section, DBFailover is entered for the Name field. DB Failover Action is entered for the Description field. aws:rds:failover-db-cluster is entered for the Action Type field. Start after field is left blank and Clusters-Target-1 is selected for the Target field. The save button will save the info entered for the respective fields.

Step 6: Configure Target.

Note that a Target has been automatically created with the name Clusters-Target-1. Select Save to save the action.

Next, you will edit the Clusters-Target-1 target to select the target, i.e., the Aurora PostgreSQL cluster.

Under Targets section, the edit button for Clusters-Target-1 is highlighted.

Select Target method as Resource IDs, and select the chaostest cluster.  If you are interested to select a group of resources, then select Resource tags, filters and parameters option.

Under Edit Target section, Clusters-Target-1 is selected for the Name field. aws:rds:cluster is selected for the Resource type field. Action is set as DBFailover. Resource IDs is selected for the Target Method field. Chaostest cluster is selected for the Resource IDs drop down box. Save button is also available in this section to save the configuration.

Step 7: Create the experiment template to complete this stage.

We will wrap up the process by selecting the create experiment template.

Create experiment template option is highlighted. The user will click this button to proceed creating a template.

We will get a warning stating that a stop condition isn’t defined. We’ll enter create in the provided field to create the template.

After selecting the create experiment template option in the previous screen, the user is prompted to enter "create" in the field to proceed.

We will get a success message if the entries are correct and the template will be successfully created.

"You successfully created experiment template" success message is displayed in the screen and its highlighted in green color.

Step 8: Verify the Aurora Cluster.

Before we run the experiment, let’s double-check the chaostest Aurora Cluster to confirm which instance is the writer and which is the reader.

Under the RDS section, chaos cluster is listed. The user is confirming that chaostest-instance-1 is the writer and chaostest-instance-1-us-east-1a is the reader.

We confirmed that chaostest-instance-1 is the writer and chaostest-instance-1-us-east-1a is the reader.

Step 9: Run the AWS FIS experiment.

Now we’ll run the FIS experiment. Select Actions, and then select Start for the experiment template.

Under the experiment template section, the Simulate Database Failover template is selection. Under the actions section, option Start is selected to start the experiment. The other options under Actions section includes Update, Manage tags and Delete.

Select Start experiment and you’ll get another warning to confirm if you really want to start this experiment. Confirm by entering start say Start experiment.

Under the Start Experiement section, user is promoted to enter "start" in the field to start the experiement.

Step 10: Observe the various stages of the experiment.

The experiment will be in initiating, running and will eventually be in completed states.

The experiment is in initiating state.

The experiment is in Complete state.

Step 11: Verify the Aurora Cluster to confirm failover.

Now let’s look at the chaostest Aurora PostgreSQL cluster to check the state. Note that a failover was indeed triggered by FIS and chaostest-instance-1-us-east-1a is the newly promoted writer and chaostest-instance-1 is the reader now.

Under RDS Section, Chaostest cluster is shown. This time, the writer is chaostest-instance-1-us-east-1a.

Step 12: Verify the Aurora Cluster logs.

We can also confirm the failover action by looking at the Logs and events section of the Aurora Cluster.

Under the Recent Events section of the chaos-test cluster, the failover messages is displayed. One of the messages lists "Started cross AZ failover to DB instance:chaostest-instance-1-us-east-1a. This confirms that the experiment was successful.

Clean up

If you created a new Aurora PostgreSQL cluster for this walkthrough, then you can terminate the cluster to optimize the costs by following the steps in the Deleting an Aurora DB cluster documentation.

You can also delete the AWS FIS experiment template by following the steps in the Delete an experiment template documentation.

You can refer to the AWS FIS documentation to learn more about the service. If you want to know more about chaos engineering, check out the AWS re:Invent session Testing resiliency using chaos engineering and The Chaos Engineering Collection. Finally, check out the following GitHub repo for additional example experiments, and how you can work with AWS FIS using the AWS Cloud Development Kit (AWS CDK).

Conclusion

In this walkthrough, you learned how you can leverage AWS FIS to inject failures into your RDS Instances. To get started with AWS Fault Injection Service for Amazon RDS, refer to the service documentation.

Author:

Anup Sivadas

Anup Sivadas is a Principal Solutions Architect at Amazon Web Services and is based out of Arlington, Virginia. With 18 + years in technology, Anup enjoys working with AWS customers and helps them craft highly scalable, performing, resilient, secure, sustainable and cost-effective cloud architectures. Outside work, Anup’s passion is to travel and explore the nature with his family.

Amazon Aurora Serverless v2 is Generally Available: Instant Scaling for Demanding Workloads

Post Syndicated from Marcia Villalba original https://aws.amazon.com/blogs/aws/amazon-aurora-serverless-v2-is-generally-available-instant-scaling-for-demanding-workloads/

Today we are very excited to announce that Amazon Aurora Serverless v2 is generally available for both Aurora PostgreSQL and MySQL. Aurora Serverless is an on-demand, auto-scaling configuration for Amazon Aurora that allows your database to scale capacity up or down based on your application’s needs.

Amazon Aurora is a MySQL- and PostgreSQL-compatible relational database built for the cloud. It is fully managed by Amazon Relational Database Service (RDS), which automates time-consuming administrative tasks, such as hardware provisioning, database setup, patches, and backups.

One of the key features of Amazon Aurora is the separation of compute and storage. As a result, they scale independently. Amazon Aurora storage automatically scales as the amount of data in your database increases. For example, you can store lots of data, and if one day you decide to drop most of the data, the storage provisioned adjusts.

How Amazon Aurora works - compute and storage separation
However, many customers said that they need the same flexibility in the compute layer of Amazon Aurora since most database workloads don’t need a constant amount of compute. Workloads can be spiky, infrequent, or have predictable spikes over a period of time.
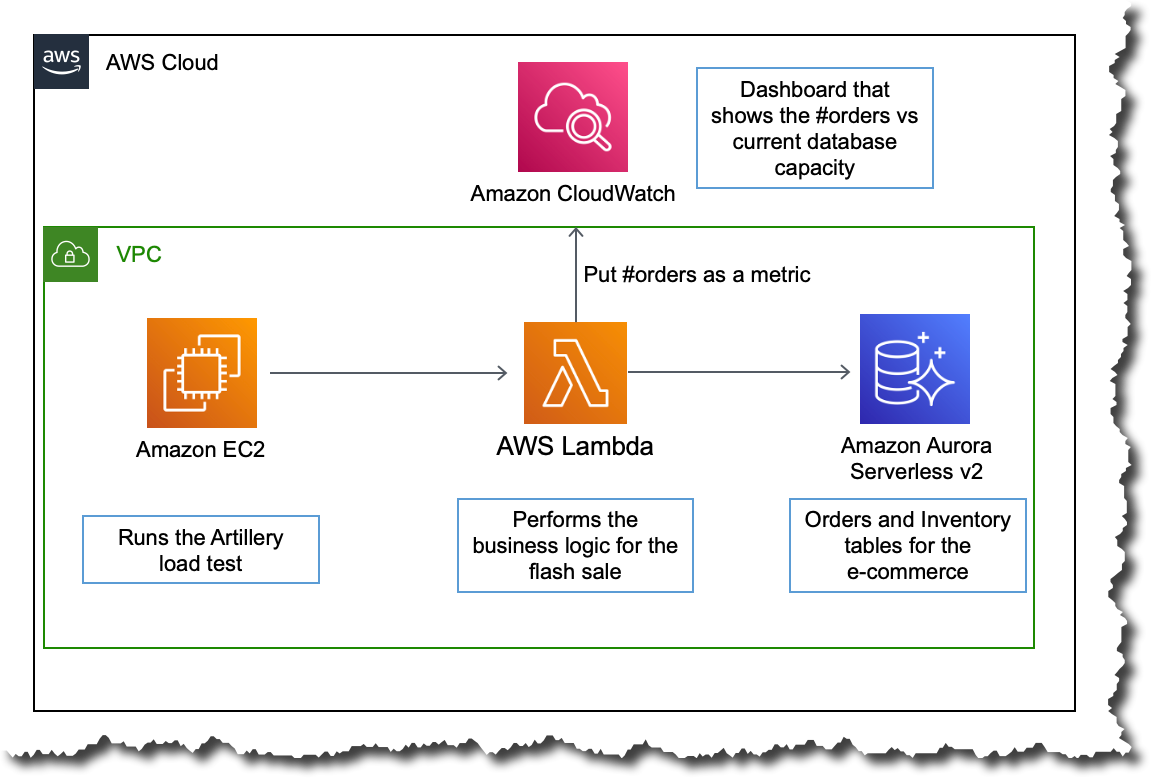
To serve these kinds of workloads, you need to provision for the peak capacity you expect your database will need. However, this approach is expensive as database workloads rarely run at peak capacity. To provision the right amount of compute, you need to continuously monitor the database capacity consumption and scale up resources if consumption is high. However, this requires expertise and often incurs downtime.

To solve this problem, in 2018, we launched the first version of Amazon Aurora Serverless. Since its launch, thousands of customers have used Amazon Aurora Serverless as a cost-effective option for infrequent, intermittent, and unpredictable workloads.

Today, we are making the next version of Amazon Aurora Serverless generally available, which enables customers to run even the most demanding workload on serverless with instant and nondisruptive scaling, fine-grained capacity adjustments, and additional functionality, including read replicas, Multi-AZ deployments, and Amazon Aurora Global Database.

Aurora Serverless v2 is launching with the latest major versions available on Amazon Aurora. Versions supported: Aurora PostgreSQL-compatible edition with PostgreSQL 13 and Aurora MySQL-compatible edition with MySQL 8.0.

Main features of Aurora Serverless v2
Aurora Serverless v2 enables you to scale your database to hundreds of thousands of transactions per second and cost-effectively manage the most demanding workloads. It scales database capacity in fine-grained increments to closely match the needs of your workload without disrupting connections or transactions. In addition, you pay only for the exact capacity you consume, and you can save up to 90 percent compared to provisioning for peak load.

If you have an existing Amazon Aurora cluster, you can create an Aurora Serverless v2 instance within the same cluster. This way, you’ll have a mixed configuration cluster where both provisioned and Aurora Serverless v2 instances can coexist within the same cluster.

It supports the full breadth of Amazon Aurora features. For example, you can create up to 15 Amazon Aurora read replicas deployed across multiple Availability Zones. Any number of these read replicas can be Aurora Serverless v2 instances and can be used as failover targets for high availability or for scaling read operations.

Similarly, with Global Database, you can assign any of the instances to be Aurora Serverless v2 and only pay for minimum capacity when idling. These instances in secondary Regions can also scale independently to support varying workloads across different Regions. Check out the Amazon Aurora user guide for a comprehensive list of features.

Aurora Serverless compute and storage scaling

How Aurora Serverless v2 scaling works
Aurora Serverless v2 scales instantly and nondisruptively by growing the capacity of the underlying instance in place by adding more CPU and memory resources. This technique allows for the underlying instance to increase and decrease capacity in place without failing over to a new instance for scaling.

For scaling down, Aurora Serverless v2 takes a more conservative approach. It scales down in steps until it reaches the required capacity needed for the workload. Scaling down too quickly can prematurely evict cached pages and decrease the buffer pool, which may affect the performance.

Aurora Serverless capacity is measured in Aurora capacity units (ACUs). Each ACU is a combination of approximately 2 gibibytes (GiB) of memory, corresponding CPU, and networking. With Aurora Serverless v2, your starting capacity can be as small as 0.5 ACU, and the maximum capacity supported is 128 ACU. In addition, it supports fine-grained increments as small as 0.5 ACU which allows your database capacity to closely match the workload needs.

Aurora Serverless v2 scaling in action
To show Aurora Serverless v2 in action, we are going to simulate a flash sale. Imagine that you run an e-commerce site. You run a marketing campaign where customers can purchase items 50 percent off for a limited amount of time. You are expecting a spike in traffic on your site for the duration of the sale.
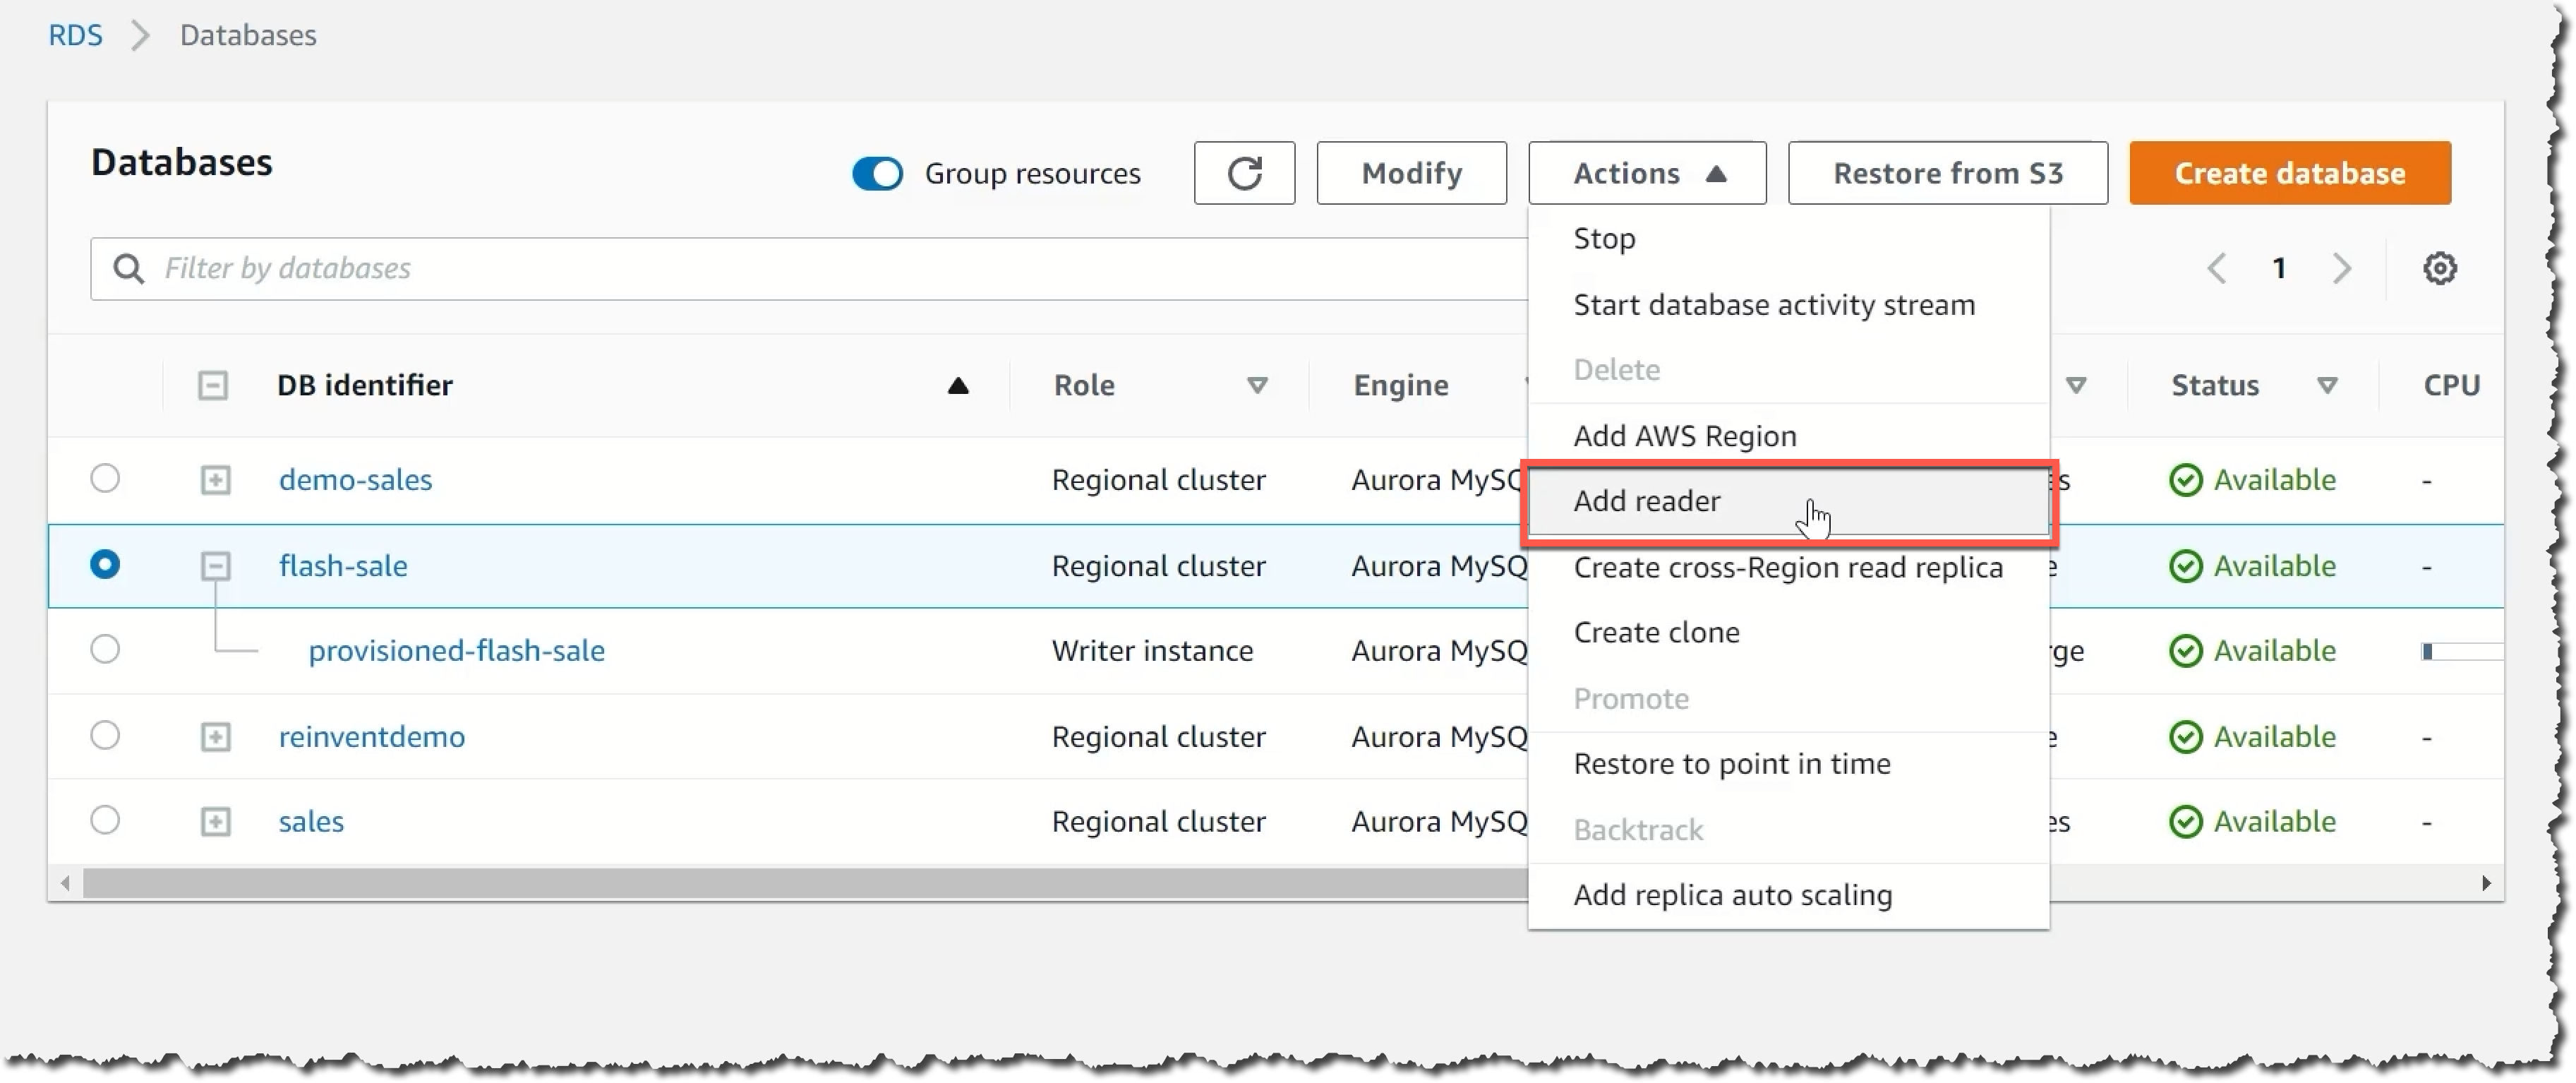
When you use a traditional database, if you run those marketing campaigns regularly, you need to provision for the peak load you expect. Or, if you run them now and then, you need to reconfigure your database for the expected peak of traffic during the sale. In both cases, you are limited to your assumption of the capacity you need. What happens if you have more sales than you expected? If your database cannot keep up with the demand, it may cause service degradation. Or when your marketing campaign doesn’t produce the sales you expected? You are unnecessarily paying for capacity you don’t need.

For this demo, we use Aurora Serverless v2 as the transactional database. An AWS Lambda function is used to call the database and process orders during the sale event for the e-commerce site. The Lambda function and the database are in the same Amazon Virtual Private Cloud (VPC), and the function connects directly to the database to perform all the operations.

To simulate the traffic of a flash sale, we will use an open-source load testing framework called Artillery. It will allow us to generate varying load by invoking multiple Lambda functions. For example, we can start with a small load and then increase it rapidly to observe how the database capacity adjusts based on the workload. This Artillery load test runs on an Amazon Elastic Compute Cloud (Amazon EC2) instance inside the same VPC.

Architecture diagram
The following Amazon CloudWatch dashboard shows how the database capacity behaves when the order count increases. The dashboard shows the orders placed in blue and the current database capacity in orange.

At the beginning of the sale, the Aurora Serverless v2 database starts with a capacity of 5 ACUs, which was the minimum database capacity configured. For the first few minutes, the orders increase, but the database capacity doesn’t increase right away. The database can handle the load with the starting provisioned capacity.

However, around the time 15:55, the number of orders spikes to 12,000. As a result, the database increases the capacity to 14 ACUs. The database capacity increases in milliseconds, adjusting exactly to the load.

The number of orders placed stays up for some seconds, and then it goes dramatically down by 15:58. However, the database capacity doesn’t adjust exactly to the drop in traffic. Instead, it decreases in steps until it reaches 5 ACUs. The scaling down is done more conservatively to avoid prematurely evicting cached pages and affecting performance. This is done to prevent any unnecessary latency to spiky workloads, and also so the caches and buffer pools are not aggressively purged.

Cloudwatch dashboard

Get started with Aurora Serverless v2 with an existing Amazon Aurora cluster
If you already have an Amazon Aurora cluster and you want to try Aurora Serverless v2, the fastest way to get started is by using mixed configuration clusters that contain both serverless and provisioned instances. Start by adding a new reader into the existing cluster. Configure the reader instance to be of the type Serverless v2.

Adding a serverless reader

Test the new serverless instance with your workload. Once you have confirmation that it works as expected, you can start a failover to the serverless instance, which will take less than 30 seconds to finish. This option provides a minimal downtime experience to get started with Aurora Serverless v2.

Failover to the serverless instance

How to create a new Aurora Serverless v2 database
To get started with Aurora Serverless v2, create a new database from the RDS console. The first step is to pick the engine type: Amazon Aurora. Then, pick which database engine you want it to be compatible with: MySQL or PostgreSQL. Open the filters under Engine version and select the filter Show versions that support Serverless v2. Then, you see that the Available versions dropdown list only shows options that are supported by Aurora Serverless v2.

Engine options
Next, you need to set up the database. Specify credential settings with a username and password for the administrator of the database.

Database settings
Then, configure the instance for the database. You need to select what kind of instance class you want. This allocates the computational, network, and memory capacity for the database instance. Select Serverless.

Then, you need to define the capacity range. Aurora Serverless v2 capacity scales up and down within the minimum and maximum configuration. Here you can specify the minimum and maximum database capacity for your workload. The minimum capacity you can specify is 0.5 ACUs, and the maximum is 128 ACUs. For more information on Aurora Serverless v2 capacity units, see the Instant autoscaling documentation.

Capacity configuration
Next, configure connectivity by creating a new VPC and security group or use the default. Finally, select Create database.

Connectivity configuration

Creating the database takes a couple of minutes. You know your database is ready when the status switches to Available.

Database list

You will find the connection details for the database on the database page. The endpoint and the port, combined with the user name and password for the administrator, are all you need to connect to your new Aurora Serverless v2 database.

Database details page

Available Now!
Aurora Serverless v2 is available now in US East (Ohio), US East (N. Virginia), US West (N. California), US West (Oregon), Asia Pacific (Hong Kong), Asia Pacific (Mumbai), Asia Pacific (Seoul), Asia Pacific (Singapore), Asia Pacific (Sydney), Asia Pacific (Tokyo), Canada (Central), Europe (Frankfurt), Europe (Ireland), Europe (London), Europe (Paris), Europe (Stockholm), and South America (São Paulo).

Visit the Amazon Aurora Serverless v2 page for more information about this launch.

Marcia

Selecting the right database and database migration plan for your workloads

Post Syndicated from Nikhil Anand original https://aws.amazon.com/blogs/architecture/selecting-the-right-database-and-database-migration-plan-for-your-workloads/

There has been a tectonic shift in the approach to hosting enterprise workloads. Companies are rapidly moving from on-premises data centers to cloud-based services. The driving factor has been the ability to innovate faster on the cloud.

Your transition to cloud can be straightforward, but it does go beyond the usual ‘lift-and-shift’ approach. To start with, you’ll need a cloud provider that provides a data store and computing facility. But you’ll be able to grow your business with a provider that has purpose-built resources and a platform that supports innovation. Companies are using higher-level services such as fully managed databases and serverless compute offered by Amazon Web Services (AWS) to get the most out of their cloud adoption journey.

In this blog, we will focus on the database tier of enterprise applications. We will evaluate the reasons for moving to managed or purpose-built databases. Then we’ll discuss in more detail the options you have and how to implement the right database migration plan for your workloads.

Why move to a managed database?

Managed databases, or purpose-built databases, are managed services by AWS that free you to focus on other business and technical priorities. Different types of databases fill certain needs, and so the database tier in an application should never be a one-size-fits-all approach. Based on the kind of application you are developing, you should research managed options that suit your business and enterprise use cases.

Database Type Use Cases AWS Service
Relational Traditional applications, enterprise resource planning (ERP), customer relationship management (CRM), ecommerce
  • Amazon Aurora
  • Amazon RDS
  • Amazon Redshift
Key-Value High-traffic web applications, ecommerce systems, gaming applications
  • Amazon DynamoDB
In-Memory Caching, session management, gaming leaderboards, geospatial applications
  • Amazon ElastiCache
  • Amazon MemoryDB for Redis
Document Content management, catalogs, user profiles
  • Amazon DocumentDB (with MongoDB compatibility)
Wide Column High-scale industrial apps for equipment maintenance, fleet management, and route optimization
  • Amazon Keyspaces
Graph Fraud detection, social networking, recommendation engines
  • Amazon Neptune
Time Series Internet of Things (IoT) applications, DevOps, industrial telemetry
  • Amazon TimeStream
Ledger Systems of record, supply chain, registrations, banking transactions
  • Amazon QLDB

Table 1. Managed databases by AWS

Managed database features

Manageability. The top priority and most valuable asset that you own as a company is your data. While data remains your key asset, spending time on database management is not the optimum use of your time. Managed services have built-in reliable tooling for multiple aspects of database management, which can help your database operate at the highest level.

Availability and disaster recovery. Most managed databases at AWS are highly available by default. For example, Amazon Aurora is designed to offer 99.99% availability, replicating six copies of your data across three Availability Zones (Figure 1). It backs up your data continuously to Amazon S3. It recovers transparently from physical storage failures; instance failover typically takes less than 30 seconds.

Replication across three Availability Zones with Amazon Aurora DB cluster

Figure 1. Replication across three Availability Zones with Amazon Aurora DB cluster

With managed databases, you get multiple options to create a highly available and fault tolerant database. Alternatively, if you choose to self-host a database elsewhere you will have to formulate your own disaster recovery (DR) strategy. This takes meticulous DR planning and relies heavily on a constant monitoring solution.

Elasticity and agility: Cloud offers elasticity for scaling your database. You can scale in minutes and spin up and down additional servers and storage size as needed. It offers you flexibility with capacity planning. You can always reassess your database tier to see if it is over or under provisioned.

Self-managed databases on AWS

If I do not need a managed database, should I still use Amazon EC2 to host my database?

Here are some cases when you may find it beneficial to host your database on Amazon EC2 instances:

  • You need full control over the database and access to its underlying operating system, database installation, and configuration.
  • You are ready to plan for the high availability of your database, and prepare your disaster recovery plan.
  • You want to administer your database, including backups and recovery. You must perform tasks such as patching the operating system and the database, tuning the operating system and database parameters, managing security, and configuring high availability or replication.
  • You want to use features that aren’t currently supported by managed services.
  • You need a specific database version that isn’t supported by AWS managed database service.
  • Your database size and performance needs exceed the limits of the managed service.
  • You want to avoid automatic software patches that might not be compliant with your applications.
  • You want to achieve higher IOPS and storage capacity than the current limits of the managed services.

Can I customize my underlying OS and database environment?

Amazon RDS Custom is a managed database service for applications that require customization of the underlying operating system and database environment. With Amazon RDS Custom, you have access to the underlying EC2 instance that hosts the DB engine. You can access the EC2 instance via secure shell (AWS Systems Manager and SSH) and perform the customizations to suit your application needs.

Choosing which migration plan to implement

The first step in your cloud database migration journey is identifying which database that you want to migrate to. For relational databases, determine the migration strategy. In the majority of the database migrations, you can choose to rehost, replatform, or refactor.

Refer the AWS Prescriptive Guidance for choosing a migration strategy for relational databases.

The next is determining which database migration plan best serves your needs. AWS provides a number of options to help correctly handle your data migration with minimal downtime. Here are the database migration plans that you can consider using for your cloud database adoption journey:

1. AWS-offered AWS Database Migration Service (AWS DMS): AWS Database Migration Service (AWS DMS) is a self-service option for migrating databases. You can use AWS DMS to migrate between homogeneous database types, such as going from one MySQL instance to a new one. You can also use AWS DMS between heterogeneous database types, such as moving from a commercial database like Oracle to a cloud-native relational database like Aurora. Read tutorials about migrating sample data: AWS Database Migration Service Step-by-Step Walkthroughs.

AWS DMS offers minimal downtime, supports widely used databases, supports on-going replication, is offered as a low-cost service, and is highly reliable. If you are looking for an end-to-end service for database migration, consider AWS DMS.

2. AWS Database Migration Service (DMS) with AWS Schema Conversion Tool (SCT): If you are migrating between heterogenous databases, use the AWS Schema Conversion Tool (SCT). It converts the source database schema and the database code objects (like views, stored procedures, and functions) to a format compatible with the target database (Figure 2).

Supported conversions with AWS Schema Conversion Tool

Figure 2. Supported conversions with AWS Schema Conversion Tool

For heterogeneous migrations, consider using AWS DMS with AWS SCT.

3. Database Freedom Program: If you are new to cloud computing or if your database migration plan must be evaluated and validated by industry experts, then try the Database Freedom Program. Database Freedom is a unique program designed to assist customers in migrating to AWS databases and analytics services. They will provide technical advice, migration support, and financial assistance.

You can use the Contact Us page for the Database Freedom program to get in touch with experts that can assist you in your cloud adoption journey.

4. AWS Professional Services and Partners: You may have in-house database expertise, but need end-to-end implementation assistance across different application tiers. Get help from the Professional Services of AWS or connect with the certified network of AWS Partners. AWS Database Migration Service Delivery Partners help customers use AWS DMS to migrate databases to AWS securely, while minimizing application downtime and following best practices.

Conclusion

Migrating to the cloud is a journey that is ever-evolving. To remain focused on your innovations, leverage the managed services of AWS for your migration journey.

I hope this post helps you consider using a managed database service when available, and effectively evaluate and choose the right database migration plan for your enterprise. For any queries, feel free to get in touch with us. We will be happy to help you in your cloud journey.

Happy migrating!

Additional Reading

Insights for CTOs: Part 3 – Growing your business with modern data capabilities

Post Syndicated from Syed Jaffry original https://aws.amazon.com/blogs/architecture/insights-for-ctos-part-3-growing-your-business-with-modern-data-capabilities/

This post was co-wrtiten with Jonathan Hwang, head of Foundation Data Analytics at Zendesk.


In my role as a Senior Solutions Architect, I have spoken to chief technology officers (CTOs) and executive leadership of large enterprises like big banks, software as a service (SaaS) businesses, mid-sized enterprises, and startups.

In this 6-part series, I share insights gained from various CTOs and engineering leaders during their cloud adoption journeys at their respective organizations. I have taken these lessons and summarized architecture best practices to help you build and operate applications successfully in the cloud. This series also covers building and operating cloud applications, security, cloud financial management, modern data and artificial intelligence (AI), cloud operating models, and strategies for cloud migration.

In Part 3, I’ve collaborated with the head of Foundation Analytics at Zendesk, Jonathan Hwang, to show how Zendesk incrementally scaled their data and analytics capabilities to effectively use the insights they collect from customer interactions. Read how Zendesk built a modern data architecture using Amazon Simple Storage Service (Amazon S3) for storage, Apache Hudi for row-level data processing, and AWS Lake Formation for fine-grained access control.

Why Zendesk needed to build and scale their data platform

Zendesk is a customer service platform that connects over 100,000 brands with hundreds of millions of customers via telephone, chat, email, messaging, social channels, communities, review sites, and help centers. They use data from these channels to make informed business decisions and create new and updated products.

In 2014, Zendesk’s data team built the first version of their big data platform in their own data center using Apache Hadoop for incubating their machine learning (ML) initiative. With that, they launched Answer Bot and Zendesk Benchmark report. These products were so successful they soon overwhelmed the limited compute resources available in the data center. By the end of 2017, it was clear Zendesk needed to move to the cloud to modernize and scale their data capabilities.

Incrementally modernizing data capabilities

Zendesk built and scaled their workload to use data lakes on AWS, but soon encountered new architecture challenges:

  • The General Data Protection Regulation (GDPR) “right to be forgotten” rule made it difficult and costly to maintain data lakes, because deleting a small piece of data required reprocessing large datasets.
  • Security and governance was harder to manage when data lake scaled to a larger number of users.

The following sections show you how Zendesk is addressing GDPR rules by evolving from plain Apache Parquet files on Amazon S3 to Hudi datasets on Amazon S3 to enable row level inserts/updates/deletes. To address security and governance, Zendesk is migrating to AWS Lake Formation centralized security for fine-grained access control at scale.

Zendesk’s data platform

Figure 1 shows Zendesk’s current data platform. It consists of three data pipelines: “Data Hub,” “Data Lake,” and “Self Service.”

Zendesk data pipelines

Figure 1. Zendesk data pipelines

Data Lake pipelines

The Data Lake and Data Hub pipelines cover the entire lifecycle of the data from ingestion to consumption.

The Data Lake pipelines consolidate the data from Zendesk’s highly distributed databases into a data lake for analysis.

Zendesk uses Amazon Database Migration Service (AWS DMS) for change data capture (CDC) from over 1,800 Amazon Aurora MySQL databases in eight AWS Regions. It detects transaction changes and applies them to the data lake using Amazon EMR and Hudi.

Zendesk ticket data consists of over 10 billion events and petabytes of data. The data lake files in Amazon S3 are transformed and stored in Apache Hudi format and registered on the AWS Glue catalog to be available as data lake tables for analytics querying and consumption via Amazon Athena.

Data Hub pipelines

The Data Hub pipelines focus on real-time events and streaming analytics use cases with Apache Kafka. Any application at Zendesk can publish events to a global Kafka message bus. Apache Flink ingests these events into Amazon S3.

The Data Hub provides high-quality business data that is highly available and scalable.

Self-managed pipeline

The self-managed pipelines empower product engineering teams to use the data lake for those use cases that don’t fit into our standard integration patterns. All internal Zendesk product engineering teams can use standard tools such as Amazon EMR, Amazon S3, Athena, and AWS Glue to publish their own analytics dataset and share them with other teams.

A notable example of this is Zendesk’s fraud detection engineering team. They publish their fraud detection data and findings through our self-manage data lake platform and use Amazon QuickSight for visualization.

You need fine-grained security and compliance

Data lakes can accelerate growth through faster decision making and product innovation. However, they can also bring new security and compliance challenges:

  • Visibility and auditability. Who has access to what data? What level of access do people have and how/when and who is accessing it?
  • Fine-grained access control. How do you define and enforce least privilege access to subsets of data at scale without creating bottlenecks or key person/team dependencies?

Lake Formation helps address these concerns by auditing data access and offering row- and column-level security and a delegated access control model to create data stewards for self-managed security and governance.

Zendesk used Lake Formation to build a fine-grained access control model that uses row-level security. It detects personally identifiable information (PII) while scaling the data lake for self-managed consumption.

Some Zendesk customers opt out of having their data included in ML or market research. Zendesk uses Lake Formation to apply row-level security to filter out records associated with a list of customer accounts who have opted out of queries. They also help data lake users understand which data lake tables contain PII by automatically detecting and tagging columns in the data catalog using AWS Glue’s PII detection algorithm.

The value of real-time data processing

When you process and consume data closer to the time of its creation, you can make faster decisions. Streaming analytics design patterns, implemented using services like Amazon Managed Streaming for Apache Kafka (Amazon MSK) or Amazon Kinesis, create an enterprise event bus to exchange data between heterogeneous applications in near real time.

For example, it is common to use streaming to augment the traditional database CDC ingestion into the data lake with additional streaming ingestion of application events. CDC is a common data ingestion pattern, but the information can be too low level. This requires application context to be reconstructed in the data lake and business logic to be duplicated in two places, inside the application and in the data lake processing layer. This creates a risk of semantic misrepresentation of the application context.

Zendesk faced this challenge with their CDC data lake ingestion from their Aurora clusters. They created an enterprise event bus built with Apache Kafka to augment their CDC with higher-level application domain events to be exchanged directly between heterogeneous applications.

Zendesk’s streaming architecture

A CDC database ticket table schema can sometimes contain unnecessary and complex attributes that are application specific and do not capture the domain model of the ticket. This makes it hard for downstream consumers to understand and use the data. A ticket domain object may span several database tables when modeled in third normal form, which makes querying for analysts difficult downstream. This is also a brittle integration method because downstream data consumers can easily be impacted when the application logic changes, which makes it hard to derive a common data view.

To move towards event-based communication between microservices, Zendesk created the Platform Data Architecture (PDA) project, which uses a standard object model to represent a higher level, semantic view of their application data. Standard objects are domain objects designed for cross-domain communication and do not suffer from the lower level fragmented scope of database CDC. Ultimately, Zendesk aims to transition their data architecture from a collection of isolated products and data silos into a cohesive unified data platform.

An application view of Zendesk’s streaming architecture

Figure 2. An application view of Zendesk’s streaming architecture

Figure 3 shows how all Zendesk products and users integrate through common standard objects and standard events within the Data Hub. Applications publish and consume standard objects and events to/from the event bus.

For example, a complete ticket standard object will be published to the message bus whenever it is created, updated, or changed. On the consumption side, these events get used by product teams to enable platform capabilities such as search, data export, analytics, and reporting dashboards.

Summary

As Zendesk’s business grew, their data lake evolved from simple Parquet files on Amazon S3 to a modern Hudi-based incrementally updateable data lake. Now, their original coarse-grained IAM security policies use fine-grained access control with Lake Formation.

We have repeatedly seen this incremental architecture evolution achieve success because it reduces the business risk associated with the change and provides sufficient time for your team to learn and evaluate cloud operations and managed services.

Looking for more architecture content? AWS Architecture Center provides reference architecture diagrams, vetted architecture solutions, Well-Architected best practices, patterns, icons, and more!

Other posts in this series

QsrSoft launches Digital Huddle Board in 3 months with AWS serverless and Fire devices

Post Syndicated from Sushanth Mangalore original https://aws.amazon.com/blogs/architecture/qsrsoft-launches-digital-huddle-board-in-3-months-with-aws-serverless-and-fire-devices/

QsrSoft is a software as a service (SaaS) company that develops solutions for clients in the restaurant, hospitality, and retail industries to help them achieve operational excellence. QsrSoft has provided these services for more than two decades and now services over 14,000 locations. QsrSoft started using AWS in 2015 and fully migrated all their workloads to AWS by 2016. QsrSoft can innovate rapidly with AWS and use best-in class technologies for cloud-native solutions for their customers.

In QsrSoft’s target industries, it is important to have a way to focus and motivate employees on common objectives. It can be hard to stay on top of ongoing activities and inspire a team towards operational goals. Through client engagement and data collection, QsrSoft identified this as a pressing business challenge that could be solved with technology. After attending an AWS Digital Innovation Program workshop, QsrSoft conceptualized a digital huddle board that connects teams through gamification, communication, recognition, and excellence in shift management. To bring QsrSoft TV to market in the shortest possible time, QsrSoft decided to build using the AWS serverless suite of services.

QsrSoft successfully lowered the barrier of entry when installing a digital huddle board. Using commodity hardware from Amazon devices such as Fire TV Sticks and Fire Smart TVs, QsrSoft released the product as an app in the Amazon App store. Clients can use existing TV screens when rolling out QsrSoft TV, and only have to plug in a Fire TV Stick and pair it with a five-digit code. This blog post describes QsrSoft TV’s architecture and the AWS services employed in building it.

QsrSoft TV architecture

Building on top of their existing microservices architecture and AWS Amplify, a team of three developers brought QsrSoft TV to market in three months. The solution relies heavily on serverless technologies on AWS. Traditionally, in developing a new product, QsrSoft would need to engage several specialized technical resources. Using the fully managed experience of serverless technologies, QsrSoft can focus on delivering business value for the use case. AWS takes care of managing the technology’s hosting and implementation. With serverless, you only pay for what you use, which makes it possible to correlate your costs with the success of your solution.

Figure 1 illustrates the architecture of this solution:

Figure 1. Architecture diagram of QsrSoft TV solution

Figure 1. Architecture diagram of QsrSoft TV solution

Digital huddle board app

The customer-facing component of the solution is the application, which runs on Fire devices in restaurants. AWS Amplify is a service that streamlines development of both web applications and native apps. The app is derived from a single-page application (SPA) developed with Vue.js. AWS Amplify provides features such as integrated authentication, CI/CD, and Web Preview. It also provides GraphQL-based endpoints to access Amazon DynamoDB using AWS AppSync. This enables the QsrSoft development team to function autonomously without dependency on the operations or data integration teams. You can connect to the different Amplify backends from the AWS Management Console or with command line interface (CLI) commands. With the Amplify CLI, you can use default categories for the backends or use the AWS Cloud Development Kit (CDK) to customize them.

GraphQL based API layer

The heart of QsrSoft TV is the API that provides the application with its core functionality. QsrSoft built an AWS AppSync endpoint to power QsrSoft TV’s business logic. AWS Amplify provides an easy way to create a secure AWS AppSync API endpoint through integrated authentication and transport layer security (TLS) for in-transit encryption. The development team can first model the data visually in Amplify Studio. Amplify then creates the queries, subscriptions, and mutations. With a single click from the Studio, you can deploy this model to an AWS AppSync API endpoint. The use of annotations permitted the dev team to customize the model further for the application’s needs, such as indexing by key attributes, authorization, and model relationships. This feature of Amplify Studio saved the development team up to 50% of the total API development effort.

Continuous automated deployments and releases

AWS Amplify abstracts the need for a dedicated operations team. This is enabled by AWS Amplify’s fully managed deployment and hosting for full-stack web applications. The development team connected Amplify to the GitHub repository, and in minutes had a complete CI/CD pipeline in place. There was no need to configure any pipelines or handcraft any YAML files. QsrSoft uses Amplify Web Previews, which enabled the product team and beta testers to preview multiple changes and experiments without releasing code to production. While Amplify deployed the Vue.js application, QsrSoft used fastlane to automate the deployment of the Fire TV application into the Amazon App Store. fastlane is an open-source tool that automates tasks like code signing and releasing the Fire TV binary to the Amazon App Store. This enabled QsrSoft to stay true to its automated deployments and infrastructure as code (IaC) practices.

Simplified password-less authentication

With this command line statement, amplify add auth, QsrSoft laid the groundwork for securing their TV application. Behind the scenes, Amplify uses Amazon Cognito to set up a user pool for the app users. QsrSoft TV provides a password-less login experience to the users, by abstracting the need to log in using a username and password. Instead, you use a five-digit code to pair the Fire TV app with a specific location. Amazon Cognito enables this by securing the app with JSON web tokens (JWT).

Automatic data synchronization

The development team focused on data modeling using the visual tools built into Amplify Studio. Amplify provided an AWS AppSync endpoint, so the developers could use GraphQL to interact with Amplify DataStore. Since the data models in the Amplify Studio support DataStore, the development team can now support an app that works offline. Offline mode is vital to any enterprise application, and it engages QsrSoft TV’s users even during an internet outage. Amplify is used to create an AWS AppSync backend with Amazon DynamoDB tables that match the schema created at the application. As the app interacts with the local DataStore, it starts an instance of its Sync Engine, which publishes the data changes by the application to the DynamoDB backend. An additional AWS Lambda-based backend called QORM, aggregates information from QsrSoft’s custom data warehouse implementation based on Amazon S3 and Amazon Aurora.

The scaling and performance provided by DynamoDB and Lambda allowed QsrSoft to scale without extensive planning, as the number of installs increased. This fully serverless application stack is cost-effective and enables QsrSoft to innovate freely. QsrSoft TV onboarded 100 locations in the first week. QsrSoft projects 7,000+ installs in the first year.

Conclusion

AWS is constantly innovating on behalf of our customers like QsrSoft. By leveraging serverless technologies on AWS, QsrSoft accelerated the go-to-market time for QsrSoft TV. Serverless on AWS provides a low barrier to entry for innovation-focused organizations who want to bring an idea to life quickly to provide business value to their customers.

Amazon Fire devices enable software vendors to make their applications available for large-scale distribution. Fire devices are today being used by several thousand households and workplaces worldwide. Many industries can benefit from developing apps for Amazon Fire devices that can be used on large displays and television screens.

Further reading:

Creating a Multi-Region Application with AWS Services – Part 2, Data and Replication

Post Syndicated from Joe Chapman original https://aws.amazon.com/blogs/architecture/creating-a-multi-region-application-with-aws-services-part-2-data-and-replication/

In Part 1 of this blog series, we looked at how to use AWS compute, networking, and security services to create a foundation for a multi-Region application.

Data is at the center of many applications. In this post, Part 2, we will look at AWS data services that offer native features to help get your data where it needs to be.

In Part 3, we’ll look at AWS application management and monitoring services to help you build, monitor, and maintain a multi-Region application.

Considerations with replicating data

Data replication across the AWS network can happen quickly, but we are still limited by the speed of light. For this reason, data consistency must be considered when building a multi-Region application. Generally speaking, the longer a physical distance is, the longer it will take the data to get there.

When building a distributed system, consider the consistency, availability, partition tolerance (CAP) theorem. This theorem states that an application can only pick 2 out of the 3, and tradeoffs should be considered.

  • Consistency – all clients always have the same view of data
  • Availability – all clients can always read and write data
  • Partition Tolerance – the system will continue to work despite physical partitions

CAP diagram

Achieving consistency and availability is common for single-Region applications. For example, when an application connects to a single in-Region database. However, this becomes more difficult with multi-Region applications due to the latency added by transferring data over long distances. For this reason, highly distributed systems will typically follow an eventual consistency approach, favoring availability and partition tolerance.

Replicating objects and files

To ensure objects are in multiple Regions, Amazon Simple Storage Service (Amazon S3) can be set up to replicate objects across AWS Regions automatically with one-way or two-way replication. A subset of objects in an S3 bucket can be replicated with S3 replication rules. If low replication lag is critical, S3 Replication Time Control can help meet requirements by replicating 99.99% of objects within 15 minutes, and most within seconds. To monitor the replication status of objects, Amazon S3 events and metrics will track replication and can send an alert if there’s an issue.

Traditionally, each S3 bucket has its own single, Regional endpoint. To simplify connecting to and managing multiple endpoints, S3 Multi-Region Access Points create a single global endpoint spanning multiple S3 buckets in different Regions. When applications connect to this endpoint, it will route over the AWS network using AWS Global Accelerator to the bucket with the lowest latency. Failover routing is also automatically handled if the connectivity or availability to a bucket changes.

For files stored outside of Amazon S3, AWS DataSync simplifies, automates, and accelerates moving file data across Regions and accounts. It supports homogeneous and heterogeneous file migrations across Elastic File System (Amazon EFS), Amazon FSx, AWS Snowcone, and Amazon S3. It can even be used to sync on-premises files stored on NFS, SMB, HDFS, and self-managed object storage to AWS for hybrid architectures.

File and object replication should be expected to be eventually consistent. The rate at which a given dataset can transfer is a function of the amount of data, I/O bandwidth, network bandwidth, and network conditions.

Copying backups

Scheduled backups can be set up with AWS Backup, which automates backups of your data to meet business requirements. Backup plans can automate copying backups to one or more AWS Regions or accounts. A growing number of services are supported, and this can be especially useful for services that don’t offer real-time replication to another Region such as Amazon Elastic Block Store (Amazon EBS) and Amazon Neptune.

Figure 1 shows how these data transfer services can be combined for each resource.

Storage replication services

Figure 1. Storage replication services

Spanning non-relational databases across Regions

Amazon DynamoDB global tables provide multi-Region and multi-writer features to help you build global applications at scale. A DynamoDB global table is the only AWS managed offering that allows for multiple active writers in a multi-Region topology (active-active and multi-Region). This allows for applications to read and write in the Region closest to them, with changes automatically replicated to other Regions.

Global reads and fast recovery for Amazon DocumentDB (with MongoDB compatibility) can be achieved with global clusters. These clusters have a primary Region that handles write operations. Dedicated storage-based replication infrastructure enables low-latency global reads with a lag of typically less than one second.

Keeping in-memory caches warm with the same data across Regions can be critical to maintain application performance. Amazon ElastiCache for Redis offers global datastore to create a fully managed, fast, reliable, and secure cross-Region replica for Redis caches and databases. With global datastore, writes occurring in one Region can be read from up to two other cross-Region replica clusters – eliminating the need to write to multiple caches to keep them warm.

Spanning relational databases across Regions

For applications that require a relational data model, Amazon Aurora global database provides for scaling of database reads across Regions in Aurora PostgreSQL-compatible and MySQL-compatible editions. Dedicated replication infrastructure utilizes physical replication to achieve consistently low replication lag that outperforms the built-in logical replication database engines offer, as shown in Figure 2.

SysBench OLTP (write-only) stepped every 600 seconds on R4.16xlarge

Figure 2. SysBench OLTP (write-only) stepped every 600 seconds on R4.16xlarge

With Aurora global database, one primary Region is designated as the writer, and secondary Regions are dedicated to reads. Aurora MySQL supports write forwarding, which forwards write requests from a secondary Region to the primary Region to simplify logic in application code. Failover testing can happen by utilizing managed planned failover, which will change the active write cluster to another Region while keeping the replication topology intact. All databases discussed in this post employ eventual consistency when used across Regions, but Aurora PostgreSQL has an option to set the maximum a replica lag allowed with managed recovery point objective (managed RPO).

Logical replication, which utilizes a database engine’s built-in replication technology, can be set up for Amazon Relational Database Service (Amazon RDS) for MariaDB, MySQL, Oracle, PostgreSQL, and Aurora databases. A cross-Region read replica will receive these changes from the writer in the primary Region. For applications built on RDS for Microsoft SQL Server, cross-Region replication can be achieved by utilizing the AWS Database Migration Service. Cross-Region replicas allow for quicker local reads and can reduce data loss and recovery times in the case of a disaster by being promoted to a standalone instance.

For situations where a longer RPO and recovery time objective (RTO) are acceptable, backups can be copied across Regions. This is true for all of the relational and non-relational databases mentioned in this post, except for ElastiCache for Redis. Amazon Redshift can also automatically do this for your data warehouse. Backup copy times will vary depending on size and change rates.

A purpose-built database strategy offers many benefits, Figure 3 forms a purpose-built global database architecture.

Purpose-built global database architecture

Figure 3. Purpose-built global database architecture

Summary

Data is at the center of almost every application. In this post, we reviewed AWS services that offer cross-Region data replication to get your data where it needs to be quickly. Whether you need faster local reads, an active-active database, or simply need your data durably stored in a second Region, we have a solution for you. In the 3rd and final post of this series, we’ll cover application management and monitoring features.

Ready to get started? We’ve chosen some AWS Solutions, AWS Blogs, and Well-Architected labs to help you!

Related posts

Using Amazon Aurora Global Database for Low Latency without Application Changes

Post Syndicated from Roneel Kumar original https://aws.amazon.com/blogs/architecture/using-amazon-aurora-global-database-for-low-latency-without-application-changes/

Deploying global applications has many challenges, especially when accessing a database to build custom pages for end users. One example is an application using AWS Lambda@Edge. Two main challenges include performance and availability.

This blog explains how you can optimally deploy a global application with fast response times and without application changes.

The Amazon Aurora Global Database enables a single database cluster to span multiple AWS Regions by asynchronously replicating your data within subsecond timing. This provides fast, low-latency local reads in each Region. It also enables disaster recovery from Region-wide outages using multi-Region writer failover. These capabilities minimize the recovery time objective (RTO) of cluster failure, thus reducing data loss during failure. You will then be able to achieve your recovery point objective (RPO).

However, there are some implementation challenges. Most applications are designed to connect to a single hostname with atomic, consistent, isolated, and durable (ACID) consistency. But Global Aurora clusters provide reader hostname endpoints in each Region. In the primary Region, there are two endpoints, one for writes, and one for reads. To achieve strong  data consistency, a global application requires the ability to:

  • Choose the optimal reader endpoints
  • Change writer endpoints on a database failover
  • Intelligently select the reader with the most up-to-date, freshest data

These capabilities typically require additional development.

The Heimdall Proxy coupled with Amazon Route 53 allows edge-based applications to access the Aurora Global Database seamlessly, without  application changes. Features include automated Read/Write split with ACID compliance and edge results caching.

Figure 1. Heimdall Proxy architecture

Figure 1. Heimdall Proxy architecture

The architecture in Figure 1 shows Aurora Global Databases primary Region in AP-SOUTHEAST-2, and secondary Regions in AP-SOUTH-1 and US-WEST-2. The Heimdall Proxy uses latency-based routing to determine the closest Reader Instance for read traffic, and redirects all write traffic to the Writer Instance. The Heimdall Configuration stores the Amazon Resource Name (ARN) of the global cluster. It automatically detects failover and cross-Region on the cluster, and directs traffic accordingly.

With an Aurora Global Database, there are two approaches to failover:

  • Managed planned failover. To relocate your primary database cluster to one of the secondary Regions in your Aurora global database, see Managed planned failovers with Amazon Aurora Global Database. With this feature, RPO is 0 (no data loss) and it synchronizes secondary DB clusters with the primary before making any other changes. RTO for this automated process is typically less than that of the manual failover.
  • Manual unplanned failover. To recover from an unplanned outage, you can manually perform a cross-Region failover to one of the secondaries in your Aurora Global Database. The RTO for this manual process depends on how quickly you can manually recover an Aurora global database from an unplanned outage. The RPO is typically measured in seconds, but this is dependent on the Aurora storage replication lag across the network at the time of the failure.

The Heimdall Proxy automatically detects Amazon Relational Database Service (RDS) / Amazon Aurora configuration changes based on the ARN of the Aurora Global cluster. Therefore, both managed planned and manual unplanned failovers are supported.

Solution benefits for global applications

Implementing the Heimdall Proxy has many benefits for global applications:

  1. An Aurora Global Database has a primary DB cluster in one Region and up to five secondary DB clusters in different Regions. But the Heimdall Proxy deployment does not have this limitation. This allows for a larger number of endpoints to be globally deployed. Combined with Amazon Route 53 latency-based routing, new connections have a shorter establishment time. They can use connection pooling to connect to the database, which reduces overall connection latency.
  2. SQL results are cached to the application for faster response times.
  3. The proxy intelligently routes non-cached queries. When safe to do so, the closest (lowest latency) reader will be used. When not safe to access the reader, the query will be routed to the global writer. Proxy nodes globally synchronize their state to ensure that volatile tables are locked to provide ACID compliance.

For more information on configuring the Heimdall Proxy and Amazon Route 53 for a global database, read the Heimdall Proxy for Aurora Global Database Solution Guide.

Download a free trial from the AWS Marketplace.

Resources:

Heimdall Data, based in the San Francisco Bay Area, is an AWS Advanced ISV partner. They have AWS Service Ready designations for Amazon RDS and Amazon Redshift. Heimdall Data offers a database proxy that offloads SQL improving database scale. Deployment does not require code changes.

Define application boundary using AWS resources tags in Amazon DevOps Guru

Post Syndicated from Suneel Joshi original https://aws.amazon.com/blogs/devops/define-application-boundary-using-aws-resources-tags-in-amazon-devops-guru/

Amazon DevOps Guru is an ML powered service that makes it easy to improve an application’s operational performance and availability. By analyzing application metrics, logs, events and traces, DevOps Guru identifies behaviors that deviate from normal operating patterns and creates insights that you can use to improve your application.

At re:Invent 2021, we announced a new tagging feature in DevOps Guru. This feature allows you to organize resources into logical applications, using AWS resources tags so that you can have more control over how applications are defined. Well-defined applications enable DevOps Guru to group related anomalies together to better identify problems and to provide more meaningful recommendations. A tag is a label consisting of a user-defined key and a value. Previously, the coverage boundary consisted of an entire AWS account or specific resources defined by AWS CloudFormation stacks.

Getting Started

Define Resources to analyze using AWS resources tags

An AWS resource tag is a label that consists of a key and a value. A key-value pair can create useful grouping of resources into different applications. For DevOps Guru, you specify one tag key across all your applications. Resources with the same tag value are grouped together into a logical application. The tag key needs to be prefixed with the string “devops-guru-”. Note that the prefix string is not case sensitive. The tag value can be any value you define. The next section describes how you can use tag values to define coverage boundary for your applications.

You can add tags to your resources using the AWS service to which each resource belongs, or use the Tag Editor. To manage tags using your resource’s service, you can use the console, AWS CLI or SDK of the service.

Define Application boundary using AWS resources tag values

For DevOps Guru, we define an application as a group of instantiated AWS resources (Amazon EC2, AWS Lambda, Amazon RDS, etc.) that your workload is running on. You assign the same tag value to all resources that make up your application. DevOps Guru will analyze each resource separately, and will also look at metrics and events across all resources in your application to detect anomalies and generate insights. For example, see the diagram below.

You can have one tag key across all your applications. For each application, assign a different tag value. All resources that make up an application should have the same tag value.

App 1 consists of 2 different resources for a database application – an EC2 instance and a database instance. Assigning the same tag value of RDS to both of the resources. I have another serverless application in App 2, which has a Lambda function and a DynamoDB instance. I assign a different tag value of serverless-app-1 to both of the App 2 resources.

Example Test Scenario

I am going to create a test scenario with an application server running in an EC2 instance. The application server is connected to an Aurora MySQL-Compatible database instance. I will instrument my application to introduce a misbehaving SQL query to create a performance anomaly.

In my example below, I tagged my EC2 instance and database instance with the tag value of RDS. I am interested in detecting performance issues in my Database instance and I want DevOps Guru to provide recommendations to fix those issues.

Manage DevOpsGuru Analysis Coverage

Next, I define the coverage boundary in DevOps Guru Console. In the Settings options in navigation pane, I select Analyzed resources and choose Edit.

To define coverage boundary in the DevOps Guru Console, select the “Settings” option in navigation pane, select “Analyzed resources“ and choose Edit.

Next, I select the “devops-guru-applications” as tag key from the dropdown menu. I am going to select RDS as the tag value, since I am interested in looking at performance issues in my Amazon Aurora database instance.

In the “Edit analyzed resources” screen, choose your tag key in the “Tag key” dropdown menu. Next, press the radio button for choosing specific tag values and then select the tag values to define the coverage boundary of your application.

Filter insights by tags

Next, I created my test scenario. Once DevOps Guru generated an insight, I am able to filter the insights by tag key or tag values. To display insights for my database instance, I select “Affected applications” from the search menu bar on insights page as shown below:

Insights generated by DevOps Guru can be filtered based on the tag values. Select “Affected applications” in the search menu bar in insights page.

Next, I select “Affected applications” as RDS in the above dropdown menu. Below is the Insight overview screen that gets displayed.

The metrics section of the Insights page provides a summary of the Anomaly detected. It also displays a graphical representation of the time window when the anomaly was detected as well as the detailed metric the anomaly was based upon.

The insights generated by DevOps Guru for my Amazon Aurora instances are enabled by Amazon DevOps Guru for RDS, a new feature we announced at re:Invent 2021. It allows developers to easily detect, diagnose, and resolve performance and operational issues in Amazon Aurora. For more information on Amazon DevOps Guru for RDS, see a related news blog written by my colleague, Marcia Villalba.

The insight summary indicates that there is high DB load, ten times above baseline. DevOps Guru for RDS uses anomaly detection on the database load (DB load) performance metric to detect issues. DB load is measured in units of Average Active Sessions (AAS). DB load measures the level of activity in your database, making it a great metric to understand the health of your database.

If you continue scrolling on the DevOps Guru for RDS analysis page, you can discover the cause for the problem and some recommendations to fix it. DevOps Guru for RDS detected there was a high load of wait events, and one SQL query was found to require further investigation. You can even see the exact SQL query if you click on the SQL digest IDs. The insight’s analysis and recommendation section is full of information on how to investigate further and fix the issue.

The easy-to-understand recommendations made by DevOps Guru for RDS means that as a DevOps engineer, you do not need to rely on a database administrator (DBA) or use any third party tools.

DevOps Guru for RDS provides specific recommendations to fix the performance issues detected. In this example, specific wait events contributing to high DB load were identified and specific SQL query ID was identified as a major contributor

Conclusion

AWS resources tags give you one more way to specify the resource analysis coverage boundary, in addition to existing methods of an entire AWS account or specific AWS CloudFormation stacks. AWS tags allows you to better isolate the applications you want DevOps Guru to analyze. In this post, we used AWS tags to define the coverage boundary for a database application. We reduced unrelated and unnecessary resource coverage from our analysis, thereby controlling our resource analysis costs.  Visit the DevOps Guru documentation to learn more about how to use tags to identify resources in your DevOps Guru applications.

About the author

Suneel Joshi

Suneel is an Enterprise Support Lead at Amazon Web Services. He provides advocacy and guidance to customers in their cloud journey as they plan and build cloud solutions. He is a DevOps and Machine Learning enthusiast. Among other things, he helps customers build intelligence in their applications using AI services.

Exploring Data Transfer Costs for AWS Managed Databases

Post Syndicated from Dennis Schmidt original https://aws.amazon.com/blogs/architecture/exploring-data-transfer-costs-for-aws-managed-databases/

When selecting managed database services in AWS, it’s important to understand how data transfer charges are calculated – whether it’s relational, key-value, document, in-memory, graph, time series, wide column, or ledger.

This blog will outline the data transfer charges for several AWS managed database offerings to help you choose the most cost-effective setup for your workload.

This blog illustrates pricing at the time of publication and assumes no volume discounts or applicable taxes and duties. For demonstration purposes, we list the primary AWS Region as US East (Northern Virginia) and the secondary Region is US West (Oregon). Always refer to the individual service pricing pages for the most up-to-date pricing.

Data transfer between AWS and internet

There is no charge for inbound data transfer across all services in all Regions. When you transfer data from AWS resources to the internet, you’re charged per service, with rates specific to the originating Region. Figure 1 illustrates data transfer charges that accrue from AWS services discussed in this blog out to the public internet in the US East (Northern Virginia) Region.

Data transfer to the internet

Figure 1. Data transfer to the internet

The remainder of this blog will focus on data transfer within AWS.

Data transfer with Amazon RDS

Amazon Relational Database Service (Amazon RDS) makes it straightforward to set up, operate, and scale a relational database in the cloud. Amazon RDS provides six database engines to choose from: Amazon Aurora, MySQL, MariaDB, Oracle, SQL Server, and PostgreSQL.

Let’s consider an application running on Amazon Elastic Compute Cloud (Amazon EC2) that uses Amazon RDS as a data store.

Figure 2 illustrates where data transfer charges apply. For clarity, we have left out connection points to the replica servers – this is addressed in Figure 3.

Amazon RDS data transfer

Figure 2. Amazon RDS data transfer

In this setup, you will not incur charges for:

  • Data transfer to or from Amazon EC2 in the same Region, Availability Zone, and virtual private cloud (VPC)

You will accrue charges for data transfer between:

  • Amazon EC2 and Amazon RDS across Availability Zones within the same VPC, charged at Amazon EC2 and Amazon RDS ($0.01/GB in and $0.01/GB out)
  • Amazon EC2 and Amazon RDS across Availability Zones and across VPCs, charged at Amazon EC2 only ($0.01/GB in and $0.01/GB out). For Aurora, this is charged at Amazon EC2 and Aurora ($0.01/GB in and $0.01/GB out)
  • Amazon EC2 and Amazon RDS across Regions, charged on both sides of the transfer ($0.02/GB out)

Figure 3 illustrates several features that are available within Amazon RDS to show where data transfer charges apply. These include multi-Availability Zone deployment, read replicas, and cross-Region automated backups. Not all database engines support all features, consult the product documentation to learn more.

Amazon RDS features

Figure 3. Amazon RDS features

In this setup, you will not incur data transfer charges for:

In addition to the charges you will incur when you transfer data to the internet, you will accrue data transfer charges for:

  • Data replication to read replicas deployed across Regions ($0.02/GB out)
  • Regional transfers for Amazon RDS snapshot copies or automated cross-Region backups ($0.02/GB out)

Refer to the following pricing pages for more detail:

Data transfer with Amazon DynamoDB

Amazon DynamoDB is a key-value and document database that delivers single-digit millisecond performance at any scale. Figures 4 and 5 illustrate an application hosted on Amazon EC2 that uses DynamoDB as a data store and includes DynamoDB global tables and DynamoDB Accelerator (DAX).

DynamoDB with global tables

Figure 4. DynamoDB with global tables

DynamoDB without global tables

Figure 5. DynamoDB without global tables

You will not incur data transfer charges for:

  • Inbound data transfer to DynamoDB
  • Data transfer between DynamoDB and Amazon EC2 in the same Region
  • Data transfer between Amazon EC2 and DAX in the same Availability Zone

In addition to the charges you will incur when you transfer data to the internet, you will accrue charges for data transfer between:

  • Amazon EC2 and DAX across Availability Zones, charged at the EC2 instance ($0.01/GB in and $0.01/GB out)
  • Global tables for cross-Region replication or adding replicas to tables that contain data in DynamoDB, charged at the source Region, as shown in Figure 4 ($0.02/GB out)
  • Amazon EC2 and DynamoDB across Regions, charged on both sides of the transfer, as shown in Figure 5 ($0.02/GB out)

Refer to the DynamoDB pricing page for more detail.

Data transfer with Amazon Redshift

Amazon Redshift is a cloud data warehouse that makes it fast and cost-effective to analyze your data using standard SQL and your existing business intelligence tools. There are many integrations and services available to query and visualize data within Amazon Redshift. To illustrate data transfer costs, Figure 6 shows an EC2 instance running a consumer application connecting to Amazon Redshift over JDBC/ODBC.

Amazon Redshift data transfer

Figure 6. Amazon Redshift data transfer

You will not incur data transfer charges for:

  • Data transfer within the same Availability Zone
  • Data transfer to Amazon S3 for backup, restore, load, and unload operations in the same Region

In addition to the charges you will incur when you transfer data to the internet, you will accrue charges for the following:

  • Across Availability Zones, charged on both sides of the transfer ($0.01/GB in and $0.01/GB out)
  • Across Regions, charged on both sides of the transfer ($0.02/GB out)

Refer to the Amazon Redshift pricing page for more detail.

Data transfer with Amazon DocumentDB

Amazon DocumentDB (with MongoDB compatibility) is a database service that is purpose-built for JSON data management at scale. Figure 7 illustrates an application hosted on Amazon EC2 that uses Amazon DocumentDB as a data store, with read replicas in multiple Availability Zones and cross-Region replication for Amazon DocumentDB Global Clusters.

Amazon DocumentDB data transfer

Figure 7. Amazon DocumentDB data transfer

You will not incur data transfer charges for:

  • Data transfer between Amazon DocumentDB and EC2 instances in the same Availability Zone
  • Data transferred for replicating multi-Availability Zone deployments of Amazon DocumentDB between Availability Zones in the same Region

In addition to the charges you will incur when you transfer data to the internet, you will accrue charges for the following:

  • Between Amazon EC2 and Amazon DocumentDB in different Availability Zones within a Region, charged at Amazon EC2 and Amazon DocumentDB ($0.01/GB in and $0.01/GB out)
  • Across Regions between Amazon DocumentDB instances, charged at the source Region ($0.02/GB out)

Refer to the Amazon DocumentDB pricing page for more details.

Tips to save on data transfer costs to your databases

  • Review potential data transfer charges on both sides of your communication channel. Remember that “Data Transfer In” to a destination is also “Data Transfer Out” from a source.
  • Use Regional and global readers or replicas where available. This can reduce the amount of cross-Availability Zone or cross-Region traffic.
  • Consider data transfer tiered pricing when estimating workload pricing. Rate tiers aggregate usage for data transferred out to the Internet across Amazon EC2, Amazon RDS, Amazon Redshift, DynamoDB, Amazon S3, and several other services. See the Amazon EC2 On-Demand pricing page for more details.
  • Understand backup or snapshots requirements and how data transfer charges apply.
  • AWS offers various purpose-built, managed database offerings. Selecting the right one for your workload can optimize performance and cost.
  • Review your application and query design. Look for ways to reduce the amount of data transferred between your application and data store. Consider designing your application or queries to use read replicas.

Conclusion/next steps

AWS offers purpose-built databases to support your applications and data models, including relational, key-value, document, in-memory, graph, time series, wide column, and ledger databases. Each database has different deployment options, and understanding different data transfer charges can help you design a cost-efficient architecture.

This blog post is intended to help you make informed decisions for designing your workload using managed databases in AWS. Note that service charges and charges related to network topology, such as AWS Transit Gateway, VPC Peering, and AWS Direct Connect, are out of scope for this blog but should be carefully considered when designing any architecture.

Looking for more cost saving tips and information? Check out the Overview of Data Transfer Costs for Common Architectures blog post.

Goodbye Microsoft SQL Server, Hello Babelfish

Post Syndicated from Sébastien Stormacq original https://aws.amazon.com/blogs/aws/goodbye-microsoft-sql-server-hello-babelfish/

Many of our customers are telling us they want to move away from commercial database vendors to avoid expensive costs and burdensome licensing terms. But migrating away from commercial and legacy databases can be time-consuming and resource-intensive. When migrating your databases, you can automate the migration of your database schema and data using the AWS Schema Conversation Tool and AWS Database Migration Service. But there is always more work to do to migrate the application itself, including rewriting application code that interacts with the database. Motivation is there, but costs and risks are often limiting factors.

Today, we are making Babelfish for Aurora PostgreSQL available. Babelfish allows Amazon Aurora PostgreSQL-Compatible Edition to understand the SQL Server wire protocol. It allows you to migrate your SQL Server applications to PostgreSQL cheaper, faster, and with less risks involved with such change.

You can migrate your application in a fraction of the time that a traditional migration would require. You continue to use the existing queries and drivers your application uses today. Just point the application to an Amazon Aurora PostgreSQL database with Babelfish activated. Babelfish adds the capability to Amazon Aurora PostgreSQL to understand the SQL Server wire protocol Tabular Data Stream (TDS), as well as extending PostgreSQL to understand commonly used T-SQL commands used by SQL Server. Support for T-SQL includes elements such as the SQL dialect, static cursors, data types, triggers, stored procedures, and functions. Babelfish reduces the risk associated with database migration projects by significantly reducing the number of changes required to the application. When adopting Babelfish, you save on licensing costs of using SQL Server. Amazon Aurora provides the security, availability, and reliability of commercial databases at 1/10th the cost.

SQL Server has evolved over more than 30 years, and we do not expect to support all functionalities right away. Instead, we focused on the most common T-SQL commands and returning the correct response or an error message. For example, the MONEY datatype has different characteristics in SQL Server (with four decimals precision) and PostgreSQL (with two decimals precision). Such a subtle difference might lead to rounding errors and have a significant impact on downstream processes, such as financial reporting. In this case, and many others, Babelfish ensures the semantics of SQL Server data types and T-SQL functionality are preserved: we created a MONEY datatype that behaves as SQL Server apps would expect. When you create a table with this datatype through the Babelfish connection, you get this compatible datatype and behaviors that a SQL Server app would expect.

Create a Babelfish Cluster Using the Console
To show you how Babelfish works, let’s first connect to the console and create a new Amazon Aurora PostgreSQL cluster. The procedure is no different than for the regular Amazon Aurora database. In the RDS launch wizard, I first make sure I select an Aurora version compatible with PostgreSQL 13.4, or more recent. The updated console has additional filters to help you select the versions that are compatible with Babelfish.

Babelfish Create databaseThen, lower on the page, I select the option Turn on Babelfish.

Aurora turn on babelfish

Under Monitoring section, I also make sure I turn off Enable Enhanced monitoring. This option requires additional IAM permissions and preparation that are not relevant for this demo.

Enable Enhanced MonitoringAfter a couple of minutes, my cluster is created, it has two instances, one writer and one reader.

Babelfish cluster created

Create a Babelfish Cluster Using the CLI
Alternatively, I may use the CLI to create a cluster. I first create a parameter group to activate Babelfish (the console does it automatically):

aws rds create-db-cluster-parameter-group             \
    --db-cluster-parameter-group-name myapp-babelfish \
    --db-parameter-group-family aurora-postgresql13   \
    --description "babelfish APG 13"
aws rds modify-db-cluster-parameter-group             \
    --db-cluster-parameter-group-name myapp-babelfish \
    --parameters "ParameterName=rds.babelfish_status,ParameterValue=on,ApplyMethod=pending-reboot" \

Then I create the database cluster (when using the command below, adjust the security group id and the subnet group name) :

aws rds create-db-cluster \
    --db-cluster-identifier awsnewblog-cli-demo \
    --master-username postgres \  
    --master-user-password Passw0rd \
    --engine aurora-postgresql \
    --engine-version 13.4 \
    --vpc-security-group-ids sg-abcd1234 \
    --db-subnet-group-name default-vpc-1234abcd \
    --db-cluster-parameter-group-name myapp-babelfish
{
    "DBCluster": {
        "AllocatedStorage": 1,
        "AvailabilityZones": [
            "us-east-1c",
            "us-east-1d",
            "us-east-1a"
        ],
        "BackupRetentionPeriod": 1,
        "DBClusterIdentifier": "awsnewblog-cli-demo",
        "Status": "creating",
        ... <redacted for brevity> ...
    }
}

Once the cluster is created, I create an instance using

aws rds create-db-instance \
    --db-instance-identifier myapp-db1 \
    --db-instance-class db.r5.4xlarge \
    --db-subnet-group-name default-vpc-1234abcd \
    --db-cluster-identifier awsnewblog-cli-demo \
    --engine aurora-postgresql
{
    "DBInstance": {
        "DBInstanceIdentifier": "myapp-db1",
        "DBInstanceClass": "db.r5.4xlarge",
        "Engine": "aurora-postgresql",
        "DBInstanceStatus": "creating",
        ... <redacted for brevity> ...

Connect to the Babelfish Cluster
Once the cluster and instances are ready, I connect to the writer instance to create the database itself. I may connect to the instance using SQL Server Management Studio (SSMS) or other SQL client such as sqlcmd. The Windows client must be able to connect to the Babelfish cluster, I made sure the RDS security group authorizes connections from the Windows host.

Using SSMS on Windows, I select New Query in the toolbar, I enter the database DNS name as Server name. I select SQL Server Authentication and I enter the database Login and Password. I click on Connect.

Important: Do not connect via the SSMS Object Explorer. Be sure to connect using the query editor via the New Query button. At this time, Babelfish supports the query editor, but not the Object Explorer.

SSMS Connect to babelfish

Once connected, I check the version with select @@version statement and click the green Execute button in the toolbar. I can read the statement result on the bottom part of the screen.

Babelfish check version

Finally, I create the database on the instance with the create database demo statement.

babelfish create database

By default, Babelfish runs in single-db mode. Using this mode, you can have maximum one user database per instance. It allows to have a close mapping of schema names between SQL Server and PostgreSQL. Alternatively, you may turn on multi-db mode at cluster creation time. This allows you to create multiple user databases per instance. In PostgreSQL, user databases will be mapped to multiple schemas with the database name as a prefix.

Run an Application
For the purpose of this demo, I use a database schema provided by SQLServerTutorial.net as part of their SQL Server Tutorial to create a schema and populate it with data. The SQL script and application C# code I use in this demo are available on my GitHub repository. A big thanks to my colleague Anuja for providing me with a C# demo application.

In SQL Server Management Studio, I open the create_objects.sql script and I choose the green execute icon on the top toolbar. A confirmation message tells me the database schema is created.

babelfish create schema

I repeat the operation with the load_data.sql script to load data in the newly created tables. Data loading takes a few minutes to run.

Now the database is loaded, let’s open Anuja‘s  C# application developed to access a SQL Server database. I modify two lines of code:

  • line 12 : I type the DNS name of the Babelfish cluster I created earlier. Note that I use the DNS name of a “write” node from my cluster.
  • line 15 : I type the password I entered when I created the database cluster.

Visual Studio Code - Prepare app to connect to babelfish

And that’s it! No other modification is required on this app. This code written to query and interact with SQL Server is just working “as-is” on Aurora PostgreSQL with Babelfish.

babelfish application execution

Open Source Transparency
We decided to open-source the technology behind Babelfish to create the Babelfish for PostgreSQL open source project. It uses the permissive Apache 2.0 and PostgreSQL licenses, meaning you can modify or tweak or distribute Babelfish in whatever fashion you see fit. Over time, we are shifting Babelfish to fully open development on GitHub, so there is transparency from the start. Now, anyone, whether you are an AWS customer or not, can use Babelfish to leave behind SQL Server and quickly, easily, and cost-effectively migrate your applications to open source PostgreSQL. We believe Babelfish is going to make PostgreSQL accessible to a much wider group of customers and developers than ever before, particularly those with large numbers of complex applications originally written for SQL Server.

Availability
Babelfish for Aurora PostgreSQL is available today in all publicly available AWS Regions at no additional cost. Start your application migration today.

— seb

PS : if you wonder where the name Babelfish comes from, just remember the answer is 42. (Or you can read this slightly longer answer.)

Offloading SQL for Amazon RDS using the Heimdall Proxy

Post Syndicated from Antony Prasad Thevaraj original https://aws.amazon.com/blogs/architecture/offloading-sql-for-amazon-rds-using-the-heimdall-proxy/

Getting the maximum scale from your database often requires fine-tuning the application. This can increase time and incur cost – effort that could be used towards other strategic initiatives. The Heimdall Proxy was designed to intelligently manage SQL connections to help you get the most out of your database.

In this blog post, we demonstrate two SQL offload features offered by this proxy:

  1. Automated query caching
  2. Read/Write split for improved database scale

By leveraging the solution shown in Figure 1, you can save on development costs and accelerate the onboarding of applications into production.

Figure 1. Heimdall Proxy distributed, auto-scaling architecture

Figure 1. Heimdall Proxy distributed, auto-scaling architecture

Why query caching?

For ecommerce websites with high read calls and infrequent data changes, query caching can drastically improve your Amazon Relational Database Sevice (RDS) scale. You can use Amazon ElastiCache to serve results. Retrieving data from cache has a shorter access time, which reduces latency and improves I/O operations.

It can take developers considerable effort to create, maintain, and adjust TTLs for cache subsystems. The proxy technology covered in this article has features that allow for automated results caching in grid-caching chosen by the user, without code changes. What makes this solution unique is the distributed, scalable architecture. As your traffic grows, scaling is supported by simply adding proxies. Multiple proxies work together as a cohesive unit for caching and invalidation.

View video: Heimdall Data: Query Caching Without Code Changes

Why Read/Write splitting?

It can be fairly straightforward to configure a primary and read replica instance on the AWS Management Console. But it may be challenging for the developer to implement such a scale-out architecture.

Some of the issues they might encounter include:

  • Replication lag. A query read-after-write may result in data inconsistency due to replication lag. Many applications require strong consistency.
  • DNS dependencies. Due to the DNS cache, many connections can be routed to a single replica, creating uneven load distribution across replicas.
  • Network latency. When deploying Amazon RDS globally using the Amazon Aurora Global Database, it’s difficult to determine how the application intelligently chooses the optimal reader.

The Heimdall Proxy streamlines the ability to elastically scale out read-heavy database workloads. The Read/Write splitting supports:

  • ACID compliance. Determines the replication lag and know when it is safe to access a database table, ensuring data consistency.
  • Database load balancing. Tracks the status of each DB instance for its health and evenly distribute connections without relying on DNS.
  • Intelligent routing. Chooses the optimal reader to access based on the lowest latency to create local-like response times. Check out our Aurora Global Database blog.

View video: Heimdall Data: Scale-Out Amazon RDS with Strong Consistency

Customer use case: Tornado

Hayden Cacace, Director of Engineering at Tornado

Tornado is a modern web and mobile brokerage that empowers anyone who aspires to become a better investor.

Our engineering team was tasked to upgrade our backend such that it could handle a massive surge in traffic. With a 3-month timeline, we decided to use read replicas to reduce the load on the main database instance.

First, we migrated from Amazon RDS for PostgreSQL to Aurora for Postgres since it provided better data replication speed. But we still faced a problem – the amount of time it would take to update server code to use the read replicas would be significant. We wanted the team to stay focused on user-facing enhancements rather than server refactoring.

Enter the Heimdall Proxy: We evaluated a handful of options for a database proxy that could automatically do Read/Write splits for us with no code changes, and it became clear that Heimdall was our best option. It had the Read/Write splitting “out of the box” with zero application changes required. And it also came with database query caching built-in (integrated with Amazon ElastiCache), which promised to take additional load off the database.

Before the Tornado launch date, our load testing showed the new system handling several times more load than we were able to previously. We were using a primary Aurora Postgres instance and read replicas behind the Heimdall proxy. When the Tornado launch date arrived, the system performed well, with some background jobs averaging around a 50% hit rate on the Heimdall cache. This has really helped reduce the database load and improve the runtime of those jobs.

Using this solution, we now have a data architecture with additional room to scale. This allows us to continue to focus on enhancing the product for all our customers.

Download a free trial from the AWS Marketplace.

Resources

Heimdall Data, based in the San Francisco Bay Area, is an AWS Advanced Tier ISV partner. They have Amazon Service Ready designations for Amazon RDS and Amazon Redshift. Heimdall Data offers a database proxy that offloads SQL improving database scale. Deployment does not require code changes. For other proxy options, consider the Amazon RDS Proxy, PgBouncer, PgPool-II, or ProxySQL.