Tag Archives: Amazon CloudWatch

Monitor Apache Spark applications on Amazon EMR with Amazon Cloudwatch

Post Syndicated from Le Clue Lubbe original https://aws.amazon.com/blogs/big-data/monitor-apache-spark-applications-on-amazon-emr-with-amazon-cloudwatch/

To improve a Spark application’s efficiency, it’s essential to monitor its performance and behavior. In this post, we demonstrate how to publish detailed Spark metrics from Amazon EMR to Amazon CloudWatch. This will give you the ability to identify bottlenecks while optimizing resource utilization.

CloudWatch provides a robust, scalable, and cost-effective monitoring solution for AWS resources and applications, with powerful customization options and seamless integration with other AWS services. By default, Amazon EMR sends basic metrics to CloudWatch to track the activity and health of a cluster. Spark’s configurable metrics system allows metrics to be collected in a variety of sinks, including HTTP, JMX, and CSV files, but additional configuration is required to enable Spark to publish metrics to CloudWatch.

Solution overview

This solution includes Spark configuration to send metrics to a custom sink. The custom sink collects only the metrics defined in a Metricfilter.json file. It utilizes the CloudWatch agent to publish the metrics to a custom Cloudwatch namespace. The bootstrap action script included is responsible for installing and configuring the CloudWatch agent and the metric library on the Amazon Elastic Compute Cloud (Amazon EC2) EMR instances. A CloudWatch dashboard can provide instant insight into the performance of an application.

The following diagram illustrates the solution architecture and workflow.

architectural diagram illustrating the solution overview

The workflow includes the following steps:

  1. Users start a Spark EMR job, creating a step on the EMR cluster. With Apache Spark, the workload is distributed across the different nodes of the EMR cluster.
  2. In each node (EC2 instance) of the cluster, a Spark library captures and pushes metric data to a CloudWatch agent, which aggregates the metric data before pushing them to CloudWatch every 30 seconds.
  3. Users can view the metrics accessing the custom namespace on the CloudWatch console.

We provide an AWS CloudFormation template in this post as a general guide. The template demonstrates how to configure a CloudWatch agent on Amazon EMR to push Spark metrics to CloudWatch. You can review and customize it as needed to include your Amazon EMR security configurations. As a best practice, we recommend including your Amazon EMR security configurations in the template to encrypt data in transit.

You should also be aware that some of the resources deployed by this stack incur costs when they remain in use. Additionally, EMR metrics don’t incur CloudWatch costs. However, custom metrics incur charges based on CloudWatch metrics pricing. For more information, see Amazon CloudWatch Pricing.

In the next sections, we go through the following steps:

  1. Create and upload the metrics library, installation script, and filter definition to an Amazon Simple Storage Service (Amazon S3) bucket.
  2. Use the CloudFormation template to create the following resources:
  3. Monitor the Spark metrics on the CloudWatch console.

Prerequisites

This post assumes that you have the following:

  • An AWS account.
  • An S3 bucket for storing the bootstrap script, library, and metric filter definition.
  • A VPC created in Amazon Virtual Private Cloud (Amazon VPC), where your EMR cluster will be launched.
  • Default IAM service roles for Amazon EMR permissions to AWS services and resources. You can create these roles with the aws emr create-default-roles command in the AWS Command Line Interface (AWS CLI).
  • An optional EC2 key pair, if you plan to connect to your cluster through SSH rather than Session Manager, a capability of AWS Systems Manager.

Define the required metrics

To avoid sending unnecessary data to CloudWatch, our solution implements a metric filter. Review the Spark documentation to get acquainted with the namespaces and their associated metrics. Determine which metrics are relevant to your specific application and performance goals. Different applications may require different metrics to monitor, depending on the workload, data processing requirements, and optimization objectives. The metric names you’d like to monitor should be defined in the Metricfilter.json file, along with their associated namespaces.

We have created an example Metricfilter.json definition, which includes capturing metrics related to data I/O, garbage collection, memory and CPU pressure, and Spark job, stage, and task metrics.

Note that certain metrics are not available in all Spark release versions (for example, appStatus was introduced in Spark 3.0).

Create and upload the required files to an S3 bucket

For more information, see Uploading objects and Installing and running the CloudWatch agent on your servers.

To create and the upload the bootstrap script, complete the following steps:

  1. On the Amazon S3 console, choose your S3 bucket.
  2. On the Objects tab, choose Upload.
  3. Choose Add files, then choose the Metricfilter.json, installer.sh, and examplejob.sh files.
  4. Additionally, upload the emr-custom-cw-sink-0.0.1.jar metrics library file that corresponds to the Amazon EMR release version you will be using:
    1. EMR-6.x.x
    2. EMR-5.x.x
  5. Choose Upload, and take note of the S3 URIs for the files.

Provision resources with the CloudFormation template

Choose Launch Stack to launch a CloudFormation stack in your account and deploy the template:

launch stack 1

This template creates an IAM role, IAM instance profile, EMR cluster, and CloudWatch dashboard. The cluster starts a basic Spark example application. You will be billed for the AWS resources used if you create a stack from this template.

The CloudFormation wizard will ask you to modify or provide these parameters:

  • InstanceType – The type of instance for all instance groups. The default is m5.2xlarge.
  • InstanceCountCore – The number of instances in the core instance group. The default is 4.
  • EMRReleaseLabel – The Amazon EMR release label you want to use. The default is emr-6.9.0.
  • BootstrapScriptPath – The S3 path of the installer.sh installation bootstrap script that you copied earlier.
  • MetricFilterPath – The S3 path of your Metricfilter.json definition that you copied earlier.
  • MetricsLibraryPath – The S3 path of your CloudWatch emr-custom-cw-sink-0.0.1.jar library that you copied earlier.
  • CloudWatchNamespace – The name of the custom CloudWatch namespace to be used.
  • SparkDemoApplicationPath – The S3 path of your examplejob.sh script that you copied earlier.
  • Subnet – The EC2 subnet where the cluster launches. You must provide this parameter.
  • EC2KeyPairName – An optional EC2 key pair for connecting to cluster nodes, as an alternative to Session Manager.

View the metrics

After the CloudFormation stack deploys successfully, the example job starts automatically and takes approximately 15 minutes to complete. On the CloudWatch console, choose Dashboards in the navigation pane. Then filter the list by the prefix SparkMonitoring.

The example dashboard includes information on the cluster and an overview of the Spark jobs, stages, and tasks. Metrics are also available under a custom namespace starting with EMRCustomSparkCloudWatchSink.

CloudWatch dashboard summary section

Memory, CPU, I/O, and additional task distribution metrics are also included.

CloudWatch dashboard executors

Finally, detailed Java garbage collection metrics are available per executor.

CloudWatch dashboard garbage-collection

Clean up

To avoid future charges in your account, delete the resources you created in this walkthrough. The EMR cluster will incur charges as long as the cluster is active, so stop it when you’re done. Complete the following steps:

  1. On the CloudFormation console, in the navigation pane, choose Stacks.
  2. Choose the stack you launched (EMR-CloudWatch-Demo), then choose Delete.
  3. Empty the S3 bucket you created.
  4. Delete the S3 bucket you created.

Conclusion

Now that you have completed the steps in this walkthrough, the CloudWatch agent is running on your cluster hosts and configured to push Spark metrics to CloudWatch. With this feature, you can effectively monitor the health and performance of your Spark jobs running on Amazon EMR, detecting critical issues in real time and identifying root causes quickly.

You can package and deploy this solution through a CloudFormation template like this example template, which creates the IAM instance profile role, CloudWatch dashboard, and EMR cluster. The source code for the library is available on GitHub for customization.

To take this further, consider using these metrics in CloudWatch alarms. You could collect them with other alarms into a composite alarm or configure alarm actions such as sending Amazon Simple Notification Service (Amazon SNS) notifications to trigger event-driven processes such as AWS Lambda functions.


About the Author

author portraitLe Clue Lubbe is a Principal Engineer at AWS. He works with our largest enterprise customers to solve some of their most complex technical problems. He drives broad solutions through innovation to impact and improve the life of our customers.

AWS Weekly Roundup – AWS AppSync, AWS CodePipeline, Events and More – August 21, 2023

Post Syndicated from Marcia Villalba original https://aws.amazon.com/blogs/aws/aws-weekly-roundup-aws-appsync-aws-codepipeline-events-and-more-august-21-2023/

In a few days, I will board a plane towards the south. My tour around Latin America starts. But I won’t be alone in this adventure, you can find some other News Blog authors, like Jeff or Seb, speaking at AWS Community Days and local events in Peru, Argentina, Chile, and Uruguay. If you see us, come and say hi. We would love to meet you.

Latam Community in reInvent 2022

Last Week’s Launches
Here are some launches that got my attention during the previous week.

AWS AppSync now supports JavaScript for all resolvers in GraphQL APIs – Last year, we announced that AppSync now supports JavaScript pipeline resolvers. And starting last week, developers can use JavaScript to write unit resolvers, pipeline resolvers, and AppSync functions that are run on the AppSync Javascript runtime.

AWS CodePipeline now supports GitLabNow you can use your GitLab.com source repository to build, test, and deploy code changes using AWS CodePipeline, in addition to other providers like AWS CodeCommit, Bitbucket, GitHub.com, and GitHub Enterprise Server.

Amazon CloudWatch Agent adds support for OpenTelemetry traces and AWS X-Ray With the new version of the agent you are now able to collect metrics, logs, and traces with a single agent, not only for CloudWatch but also for OpenTelemetry and AWS X-Ray. Simplifying the installation, configuration, and management of telemetry collection.

New instance types: Amazon EC2 M7a and Amazon EC2 Hpc7a – The new Amazon EC2 M7a is a general purpose instance type powered by 4th Gen AMD EPYC processor. In the announcement blog, you can find all the specifics for this instance type. The new Amazon EC2 Hpc7a instances are also powered by 4th Gen AMD EPYC processors. These instance types are optimized for high performance computing and Channy Yun wrote a blog post describing the different characteristics of the Amazon EC2 Hpc7a instance type.

AWS DeepRacer Educator PlaybooksLast week we introduced the AWS DeepRacer educator playblooks, these are a tool for educators to integrate foundational machine learning (ML) curriculum and labs into their classrooms. Educators can use these playbooks to easily upskill students in the basics of ML with autonomous vehicles.

For a full list of AWS announcements, be sure to keep an eye on the What’s New at AWS page.

Other AWS News
Some other updates and news that you might have missed:

Guide for using AWS Lambda to process Apache Kafka StreamsJulian Wood just published the most complete guide you can find on how to use Lambda with Apache Kafka. If you are an Amazon Kinesis user, don’t worry. We’ve got you covered with this video series where you will find similar topics.

Using AWS Lambda with Kafka guide

The Official AWS Podcast – Listen each week for updates on the latest AWS news and deep dives into exciting use cases. There are also official AWS podcasts in several languages. Check out the ones in FrenchGermanItalian, and Spanish.

AWS Open-Source News and Updates – This is a newsletter curated by my colleague Ricardo to bring you the latest open source projects, posts, events, and more.

Upcoming AWS Events
Check your calendars and sign up for these AWS events:

Join AWS Hybrid Cloud & Edge Day to learn how to deploy your applications in the everywhere cloud

AWS Global SummitsAWS Summits – The 2023 AWS Summits season is almost ending with the last two in-person events in Mexico City (August 30) and Johannesburg (September 26).

AWS re:Invent reInvent(November 27–December 1) – But don’t worry because re:Invent season is coming closer. Join us to hear the latest from AWS, learn from experts, and connect with the global cloud community. Registration is now open.

AWS Community Days AWS Community Day– Join a community-led conference run by AWS user group leaders in your region:Taiwan (August 26), Aotearoa (September 6), Lebanon (September 9), Munich (September 14), Argentina (September 16), Spain (September 23), and Chile (September 30). Check all the upcoming AWS Community Days here.

CDK Day (September 29) – A community-led fully virtual event with tracks in English and in Spanish about CDK and related projects. Learn more in the website.

That’s all for this week. Check back next Monday for another Week in Review!

This post is part of our Week in Review series. Check back each week for a quick roundup of interesting news and announcements from AWS!

— Marcia

Monitor data pipelines in a serverless data lake

Post Syndicated from Virendhar Sivaraman original https://aws.amazon.com/blogs/big-data/monitor-data-pipelines-in-a-serverless-data-lake/

AWS serverless services, including but not limited to AWS Lambda, AWS Glue, AWS Fargate, Amazon EventBridge, Amazon Athena, Amazon Simple Notification Service (Amazon SNS), Amazon Simple Queue Service (Amazon SQS), and Amazon Simple Storage Service (Amazon S3), have become the building blocks for any serverless data lake, providing key mechanisms to ingest and transform data without fixed provisioning and the persistent need to patch the underlying servers. The combination of a data lake in a serverless paradigm brings significant cost and performance benefits. The advent of rapid adoption of serverless data lake architectures—with ever-growing datasets that need to be ingested from a variety of sources, followed by complex data transformation and machine learning (ML) pipelines—can present a challenge. Similarly, in a serverless paradigm, application logs in Amazon CloudWatch are sourced from a variety of participating services, and traversing the lineage across logs can also present challenges. To successfully manage a serverless data lake, you require mechanisms to perform the following actions:

  • Reinforce data accuracy with every data ingestion
  • Holistically measure and analyze ETL (extract, transform, and load) performance at the individual processing component level
  • Proactively capture log messages and notify failures as they occur in near-real time

In this post, we will walk you through a solution to efficiently track and analyze ETL jobs in a serverless data lake environment. By monitoring application logs, you can gain insights into job execution, troubleshoot issues promptly to ensure the overall health and reliability of data pipelines.

Overview of solution

The serverless monitoring solution focuses on achieving the following goals:

  • Capture state changes across all steps and tasks in the data lake
  • Measure service reliability across a data lake
  • Quickly notify operations of failures as they happen

To illustrate the solution, we create a serverless data lake with a monitoring solution. For simplicity, we create a serverless data lake with the following components:

  • Storage layer – Amazon S3 is the natural choice, in this case with the following buckets:
    • Landing – Where raw data is stored
    • Processed – Where transformed data is stored
  • Ingestion layer – For this post, we use Lambda and AWS Glue for data ingestion, with the following resources:
    • Lambda functions – Two Lambda functions that run to simulate a success state and failure state, respectively
    • AWS Glue crawlers – Two AWS Glue crawlers that run to simulate a success state and failure state, respectively
    • AWS Glue jobs – Two AWS Glue jobs that run to simulate a success state and failure state, respectively
  • Reporting layer – An Athena database to persist the tables created via the AWS Glue crawlers and AWS Glue jobs
  • Alerting layer – Slack is used to notify stakeholders

The serverless monitoring solution is devised to be loosely coupled as plug-and-play components that complement an existing data lake. The Lambda-based ETL tasks state changes are tracked using AWS Lambda Destinations. We have used an SNS topic for routing both success and failure states for the Lambda-based tasks. In the case of AWS Glue-based tasks, we have configured EventBridge rules to capture state changes. These event changes are also routed to the same SNS topic. For demonstration purposes, this post only provides state monitoring for Lambda and AWS Glue, but you can extend the solution to other AWS services.

The following figure illustrates the architecture of the solution.

The architecture contains the following components:

  • EventBridge rules – EventBridge rules that capture the state change for the ETL tasks—in this case AWS Glue tasks. This can be extended to other supported services as the data lake grows.
  • SNS topic – An SNS topic that serves to catch all state events from the data lake.
  • Lambda function – The Lambda function is the subscriber to the SNS topic. It’s responsible for analyzing the state of the task run to do the following:
    • Persist the status of the task run.
    • Notify any failures to a Slack channel.
  • Athena database – The database where the monitoring metrics are persisted for analysis.

Deploy the solution

The source code to implement this solution uses AWS Cloud Development Kit (AWS CDK) and is available on the GitHub repo monitor-serverless-datalake. This AWS CDK stack provisions required network components and the following:

  • Three S3 buckets (the bucket names are prefixed with the AWS account name and Regions, for example, the landing bucket is <aws-account-number>-<aws-region>-landing):
    • Landing
    • Processed
    • Monitor
  • Three Lambda functions:
    • datalake-monitoring-lambda
    • lambda-success
    • lambda-fail
  • Two AWS Glue crawlers:
    • glue-crawler-success
    • glue-crawler-fail
  • Two AWS Glue jobs:
    • glue-job-success
    • glue-job-fail
  • An SNS topic named datalake-monitor-sns
  • Three EventBridge rules:
    • glue-monitor-rule
    • event-rule-lambda-fail
    • event-rule-lambda-success
  • An AWS Secrets Manager secret named datalake-monitoring
  • Athena artifacts:
    • monitor database
    • monitor-table table

You can also follow the instructions in the GitHub repo to deploy the serverless monitoring solution. It takes about 10 minutes to deploy this solution.

Connect to a Slack channel

We still need a Slack channel to which the alerts are delivered. Complete the following steps:

  1. Set up a workflow automation to route messages to the Slack channel using webhooks.
  2. Note the webhook URL.

The following screenshot shows the field names to use.

The following is a sample message for the preceding template.

  1. On the Secrets Manager console, navigate to the datalake-monitoring secret.
  2. Add the webhook URL to the slack_webhook secret.

Load sample data

The next step is to load some sample data. Copy the sample data files to the landing bucket using the following command:

aws s3 cp --recursive s3://awsglue-datasets/examples/us-legislators s3://<AWS_ACCCOUNT>-<AWS_REGION>-landing/legislators

In the next sections, we show how Lambda functions, AWS Glue crawlers, and AWS Glue jobs work for data ingestion.

Test the Lambda functions

On the EventBridge console, enable the rules that trigger the lambda-success and lambda-fail functions every 5 minutes:

  • event-rule-lambda-fail
  • event-rule-lambda-success

After a few minutes, the failure events are relayed to the Slack channel. The following screenshot shows an example message.

Disable the rules after testing to avoid repeated messages.

Test the AWS Glue crawlers

On the AWS Glue console, navigate to the Crawlers page. Here you can start the following crawlers:

  • glue-crawler-success
  • glue-crawler-fail

In a minute, the glue-crawler-fail crawler’s status changes to Failed, which triggers a notification in Slack in near-real time.

Test the AWS Glue jobs

On the AWS Glue console, navigate to the Jobs page, where you can start the following jobs:

  • glue-job-success
  • glue-job-fail

In a few minutes, the glue-job-fail job status changes to Failed, which triggers a notification in Slack in near-real time.

Analyze the monitoring data

The monitoring metrics are persisted in Amazon S3 for analysis and can be used of historical analysis.

On the Athena console, navigate to the monitor database and run the following query to find the service that failed the most often:

SELECT service_type, count(*) as "fail_count"
FROM "monitor"."monitor"
WHERE event_type = 'failed'
group by service_type
order by fail_count desc;

Over time with rich observability data – time series based monitoring data analysis will yield interesting findings.

Clean up

The overall cost of the solution is less than one dollar but to avoid future costs, make sure to clean up the resources created as part of this post.

Summary

The post provided an overview of a serverless data lake monitoring solution that you can configure and deploy to integrate with enterprise serverless data lakes in just a few hours. With this solution, you can monitor a serverless data lake, send alerts in near-real time, and analyze performance metrics for all ETL tasks operating in the data lake. The design was intentionally kept simple to demonstrate the idea; you can further extend this solution with Athena and Amazon QuickSight to generate custom visuals and reporting. Check out the GitHub repo for a sample solution and further customize it for your monitoring needs.


About the Authors

Virendhar (Viru) Sivaraman is a strategic Senior Big Data & Analytics Architect with Amazon Web Services. He is passionate about building scalable big data and analytics solutions in the cloud. Besides work, he enjoys spending time with family, hiking & mountain biking.

Vivek Shrivastava is a Principal Data Architect, Data Lake in AWS Professional Services. He is a Bigdata enthusiast and holds 14 AWS Certifications. He is passionate about helping customers build scalable and high-performance data analytics solutions in the cloud. In his spare time, he loves reading and finds areas for home automation.

How Thomson Reuters monitors and tracks AWS Health alerts at scale

Post Syndicated from Srinivasa Shaik original https://aws.amazon.com/blogs/architecture/how-thomson-reuters-monitors-and-tracks-aws-health-alerts-at-scale/

Thomson Reuters Corporation is a leading provider of business information services. The company’s products include highly specialized information-enabled software and tools for legal, tax, accounting and compliance professionals combined with the world’s most trusted global news service: Reuters.

Thomson Reuters is committed to a cloud first strategy on AWS, with thousands of applications hosted on AWS that are critical to its customers, with a growing number of AWS accounts that are used by different business units to deploy the applications. Service Management in Thomson Reuters is a centralized team, who needs an efficient way to measure, monitor and track the health of AWS services across the AWS environment. AWS Health provides the required visibility to monitor the performance and availability of AWS services and scheduled changes or maintenance that may impact their applications.

With approximately 16,000 AWS Health events received in 2022 alone due to the scale at which Thomson Reuters is operating on AWS, manually tracking AWS Health events is challenging. This necessitates a solution to provide centralized visibility of Health alerts across the organization, and an efficient way to track and monitor the Health events across the AWS accounts. Thomson Reuters requires retaining AWS Health event history for a minimum of 2 years to derive indicators affecting performance and availability of applications in the AWS environment and thereby ensuring high service levels to customers. Thomson Reuters utilizes ServiceNow for tracking IT operations and Datadog for infrastructure monitoring which is integrated with AWS Health to measure and track all the events and estimate the health performance with key indicators. Before this solution, Thomson Reuters didn’t have an efficient way to track scheduled events, and no metrics to identify the applications impacted by these Health events.

In this post, we will discuss how Thomson Reuters has implemented a solution to track and monitor AWS Health events at scale, automate notifications, and efficiently track AWS scheduled changes. This gives Thomson Reuters visibility into the health of AWS resources using Health events, and allows them to take proactive measures to minimize impact to their applications hosted on AWS.

Solution overview

Thomson Reuters leverages AWS Organizations to centrally govern their AWS environment. AWS Organization helps to centrally manage accounts and resources, optimize the cost, and simplify billing. The AWS environment in Thomson Reuters has a dedicated organizational management account to create Organizational Units (OUs), and policies to manage the organization’s member accounts. Thomson Reuters enabled organizational view within AWS Health, which once activated provides an aggregated view of AWS Health events across all their accounts (Figure 1).

Architecture to track and monitor AWS Health events

Figure 1. Architecture to track and monitor AWS Health events

Let us walk through the architecture of this solution:

  1. Amazon CloudWatch Scheduler invokes AWS Lambda every 10 minutes to fetch AWS Health API data from the Organization Management account.
  2. Lambda leverages execution role permissions to connect to the AWS Health API and send events to Amazon EventBridge. The loosely coupled architecture of Amazon EventBridge allows for storing and routing of the events to various targets based upon the AWS Health Event Type category.
  3. AWS Health Event is matched against the EventBridge rules to identify the event category and route to the target AWS Lambda functions that process specific AWS Health Event types.
  4. The AWS Health events are routed to ServiceNow and Datadog based on the AWS Health Event Type category.
  5. If the Health Event Type category is “Scheduled change“ or ” Issues“ then it is routed to ServiceNow.
    • The event is stored in a DynamoDB table to track the AWS Health events beyond the 90 days history available in AWS Health.
    • If the entity value of the affected AWS resource exists inside the Health Event, then tags associated with that entity value are used to identify the application and resource owner to notify. One of the internal policies mandates the owners to include AWS resource tags for every AWS resource provisioned. The DynamoDB table is updated with additional details captured based on entity value.
    • Events that are not of interest are excluded from tracking.
    • A ServiceNow ticket is created containing the details of the AWS Health event and includes additional details regarding the application and resource owner that are captured in the DynamoDB table. The ServiceNow credentials to connect are stored securely in AWS Secrets Manager. The ServiceNow ticket details are also updated back in DynamoDB table to correlate AWS Health event with a ServiceNow tickets.
  6. If the Health Event Type category is “Account Notification”, then it is routed to Datadog.
    • All account notifications including public notifications are routed to Datadog for tracking.
    • Datadog monitors are created to help derive more meaningful information from the account notifications received from the AWS Health events.

AWS Health Event Type “Account Notification” provides information about the administration or security of AWS accounts and services. These events are mostly informative, but some of them need urgent action, and tracking each of these events within Thomson Reuters incident management is substantial. Thomson Reuters has decided to route these events to Datadog, which is monitored by the Global Command Center from the centralized Service Management team. All other AWS Health Event types are tracked using ServiceNow.

ServiceNow to track scheduled changes and issues

Thomson Reuters leverages ServiceNow for incident management and change management across the organization, including both AWS cloud and on-premises applications. This allows Thomson Reuters to continue using the existing proven process to track scheduled changes in AWS through the ServiceNow change management process and AWS Health issues and investigations by using ServiceNow incident management, notify relevant teams, and monitor until resolution. Any AWS service maintenance or issues reported through AWS Health are tracked in ServiceNow.

One of the challenges while processing thousands of AWS Health events every month is also to identify and track events that has the potential to cause significant impact to the applications. Thomson Reuters decided to exclude events that are not relevant for Thomson Reuters hosted Regions, or specific AWS services. The process of identifying events to include is a continuous iterative effort, relying on the data captured in DynamoDB tables and from experiences of different teams. AWS EventBridge simplifies the process of filtering out events by eliminating the need to develop a custom application.

ServiceNow is used to create various dashboards which are important to Thomson Reuters leadership to view the health of the AWS environment in a glance, and detailed dashboards for individual application, business units and AWS Regions are also curated for specific requirements. This solution allows Thomson Reuters to capture metrics which helps to understand the scheduled changes that AWS performs and identify the underlying resources that are impacted in different AWS accounts. The ServiceNow incidents created from Health events are used to take real-time actions to mitigate any potential issues.

Thomson Reuters has a business requirement to persist AWS Health event history for a minimum of 2 years, and a need for customized dashboards for leadership to view performance and availability metrics across applications. This necessitated the creation of dashboards in ServiceNow. Figures 2, 3, and 4 are examples of dashboards that are created to provide a comprehensive view of AWS Health events across the organization.

ServiceNow dashboard with a consolidated view of AWS Health events

Figure 2. ServiceNow dashboard with a consolidated view of AWS Health events

ServiceNow dashboard with a consolidated view of AWS Health events

Figure 3. ServiceNow dashboard with a consolidated view of AWS Health events

ServiceNow dashboard showing AWS Health events

Figure 4. ServiceNow dashboard showing AWS Health events

Datadog for account notifications

Thomson Reuters leverages Datadog as its strategic platform to observe, monitor, and track the infrastructure, applications and more. Health events with the category type Account Notification are forwarded to Datadog and are monitored by Thomson Reuters Global Command Center part of the Service Management. Account notifications are important to track as they contain information about administration or security of AWS accounts. Like ServiceNow, Datadog is also used to curate separate dashboards with unique Datadog monitors for monitoring and tracking these events (Figure 5). Currently, the Thomson Reuters Service Management team are the main consumers of these Datadog alerts, but in the future the strategy would be to route relevant and important notifications only to the concerned application team by ensuring a mandatory and robust tagging standards on the existing AWS accounts for all AWS resource types.

Datadog dashboard for AWS Health event type account notification

Figure 5. Datadog dashboard for AWS Health event type account notification

What’s next?

Thomson Reuters will continue to enhance the logic for identifying important Health events that require attention, reducing noise by filtering out unimportant ones. Thomson Reuters plan to develop a self-service subscription model, allowing application teams to opt into the Health events related to their applications.

The next key focus will also be to look at automating actions for specific AWS Health scheduled events wherever possible, such as responding to maintenance with AWS System Manager Automation documents.

Conclusion

By using this solution, Thomson Reuters can effectively monitor and track AWS Health events at scale using the preferred internal tools ServiceNow and Datadog. Integration with ServiceNow allowed Thomson Reuters to measure and track all the events and estimate the health performance with key indicators that can be generated from ServiceNow. This architecture provided an efficient way to track the AWS scheduled changes, capture metrics to understand the various schedule changes that AWS is doing and resources that are getting impacted in different AWS accounts. This solution provides actionable insights from the AWS Health events, allowing Thomson Reuters to take real-time actions to mitigate impacts to the applications and thus offer high Service levels to Thomson Reuters customers.

AWS Weekly Roundup – AWS Storage Day, AWS Israel (Tel Aviv) Region, and More – Aug 8, 2023

Post Syndicated from Veliswa Boya original https://aws.amazon.com/blogs/aws/aws-weekly-roundup-aws-storage-day-aws-israel-tel-aviv-region-and-more-aug-8-2023/

(Editor’s note: Today, we are changing the title of this regular weekly post from AWS Week in Review to AWS Weekly Roundup to better reflect the mix of recent top news and announcements as well as upcoming events you won’t want to miss.)


It’s taken me some time to finally be comfortable with being in front of a camera, a strange thing for a Developer Advocate to say I know! Last week I joined a couple of my team-mates at the AWS London Studios to record a series of videos that will be published in our Build On AWS YouTube Channel. Build On AWS is for the hands-on, technical AWS cloud builder who wants to become more agile and innovate faster. In the channel, you’ll find dynamic, high-quality content that’s designed for developers, by developers!

This video tells you more about what you’ll find in the channel. Check it out and consider subscribing to not miss out when we publish new content.

Now on to the AWS updates. There was a lot of news related to AWS last week, and I’ve compiled a few announcements and upcoming events you need to know about. Let’s get started!

Last Week’s Launches
Here are a few launches from last week that you might have missed:

Microsoft 365 Apps for enterprise now available on Amazon WorkSpaces servicesAmazon WorkSpaces is a fully managed, secure, and reliable virtual desktop in the AWS Cloud. With Amazon WorkSpaces, you improve IT agility and maximize user experience, while only paying for the infrastructure that you use. We announced the availability of Microsoft 365 Apps for enterprise on Amazon WorkSpaces. You can bring your own Microsoft 365 licenses (if they meet Microsoft’s licensing requirements) and activate the applications at no additional cost to run Microsoft 365 Apps for enterprise on Amazon WorkSpaces services.

AWS Israel (Tel Aviv) Region is Now Open – You can now securely store data in Israel while serving users in the vicinity with even lower latency. This is because last week we launched the Tel Aviv Region to give customers an additional option for running applications and serving users from data centers located in Israel.

Amazon Connect Launches – This is one of my favorite AWS services to write about because of how Amazon Connect is changing our customers’ engagement with their own customers. Last week, Amazon Connect announced automatic activity scheduling based on shift duration, custom flow block titles, and archiving and deleting flows from the UI, to name a few.

Other AWS News
A few more news items and blog posts you might have missed:

Customizable thresholds for health events supported on Amazon CloudWatch Internet Monitor – Until this announcement, the default threshold for overall availability and performance scores to invoke a health event was 95 percent. Now, you can customize the thresholds for when to invoke a health event for internet-facing traffic between your end users and your applications hosted on AWS.

Improved AWS Backup performance for Amazon S3 buckets – Now you can speed up your initial Amazon S3 backup workflow and back up buckets with more than 3 billion objects due to improvements to the speed of backups by up to 10x for buckets with more than 300 million objects. This performance improvement is automatically enabled at no additional cost in all Regions where AWS Backup support for Amazon S3 is available.

For AWS open-source news and updates, check out the latest newsletter curated by my colleague Ricardo Sueiras to bring you the most recent updates on open-source projects, posts, events, and more.

For a full list of AWS announcements, be sure to keep an eye on the What’s New at AWS page.

Upcoming AWS Events
We have the following upcoming events:

AWS Storage Day (August 9) – A one-day virtual event where you’ll learn how to prepare for AI/ML with the storage decisions you make now, how to do more with your budget by optimizing storage costs for on-premises and cloud data, and how to deliver holistic data protection for your organization, including recovery planning to help protect against ransomware. Learn more and register here.

AWS Summit Mexico City (August 30)Sign up for the Summit to connect and collaborate with other like-minded folks while learning about AWS.

AWS Community Days (August 12, 19) – Join these community-led conferences where event logistics and content are planned, sourced, and delivered by community leaders: Colombia (August 12), and West Africa (August 19).


P.S. We’re focused on improving our content to provide a better customer experience, and we need your feedback to do so. Take this quick survey to share insights on your experience with the AWS Blog. Note that this survey is hosted by an external company, so the link doesn’t lead to our website. AWS handles your information as described in the AWS Privacy Notice.

– Veliswa

How to Receive Alerts When Your IAM Configuration Changes

Post Syndicated from Dylan Souvage original https://aws.amazon.com/blogs/security/how-to-receive-alerts-when-your-iam-configuration-changes/

July 27, 2023: This post was originally published February 5, 2015, and received a major update July 31, 2023.


As an Amazon Web Services (AWS) administrator, it’s crucial for you to implement robust protective controls to maintain your security configuration. Employing a detective control mechanism to monitor changes to the configuration serves as an additional safeguard in case the primary protective controls fail. Although some changes are expected, you might want to review unexpected changes or changes made by a privileged user. AWS Identity and Access Management (IAM) is a service that primarily helps manage access to AWS services and resources securely. It does provide detailed logs of its activity, but it doesn’t inherently provide real-time alerts or notifications. Fortunately, you can use a combination of AWS CloudTrail, Amazon EventBridge, and Amazon Simple Notification Service (Amazon SNS) to alert you when changes are made to your IAM configuration. In this blog post, we walk you through how to set up EventBridge to initiate SNS notifications for IAM configuration changes. You can also have SNS push messages directly to ticketing or tracking services, such as Jira, Service Now, or your preferred method of receiving notifications, but that is not discussed here.

In any AWS environment, many activities can take place at every moment. CloudTrail records IAM activities, EventBridge filters and routes event data, and Amazon SNS provides notification functionality. This post will guide you through identifying and setting alerts for IAM changes, modifications in authentication and authorization configurations, and more. The power is in your hands to make sure you’re notified of the events you deem most critical to your environment. Here’s a quick overview of how you can invoke a response, shown in Figure 1.

Figure 1: Simple architecture diagram of actors and resources in your account and the process for sending notifications through IAM, CloudTrail, EventBridge, and SNS.

Figure 1: Simple architecture diagram of actors and resources in your account and the process for sending notifications through IAM, CloudTrail, EventBridge, and SNS.

Log IAM changes with CloudTrail

Before we dive into implementation, let’s briefly understand the function of AWS CloudTrail. It records and logs activity within your AWS environment, tracking actions such as IAM role creation, deletion, or modification, thereby offering an audit trail of changes.

With this in mind, we’ll discuss the first step in tracking IAM changes: establishing a log for each modification. In this section, we’ll guide you through using CloudTrail to create these pivotal logs.

For an in-depth understanding of CloudTrail, refer to the AWS CloudTrail User Guide.

In this post, you’re going to start by creating a CloudTrail trail with the Management events type selected, and read and write API activity selected. If you already have a CloudTrail trail set up with those attributes, you can use that CloudTrail trail instead.

To create a CloudTrail log

  1. Open the AWS Management Console and select CloudTrail, and then choose Dashboard.
  2. In the CloudTrail dashboard, choose Create Trail.
    Figure 2: Use the CloudTrail dashboard to create a trail

    Figure 2: Use the CloudTrail dashboard to create a trail

  3. In the Trail name field, enter a display name for your trail and then select Create a new S3 bucket. Leave the default settings for the remaining trail attributes.
    Figure 3: Set the trail name and storage location

    Figure 3: Set the trail name and storage location

  4. Under Event type, select Management events. Under API activity, select Read and Write.
  5. Choose Next.
    Figure 4: Choose which events to log

    Figure 4: Choose which events to log

Set up notifications with Amazon SNS

Amazon SNS is a managed service that provides message delivery from publishers to subscribers. It works by allowing publishers to communicate asynchronously with subscribers by sending messages to a topic, a logical access point, and a communication channel. Subscribers can receive these messages using supported endpoint types, including email, which you will use in the blog example today.

For further reading on Amazon SNS, refer to the Amazon SNS Developer Guide.

Now that you’ve set up CloudTrail to log IAM changes, the next step is to establish a mechanism to notify you about these changes in real time.

To set up notifications

  1. Open the Amazon SNS console and choose Topics.
  2. Create a new topic. Under Type, select Standard and enter a name for your topic. Keep the defaults for the rest of the options, and then choose Create topic.
    Figure 5: Select Standard as the topic type

    Figure 5: Select Standard as the topic type

  3. Navigate to your topic in the topic dashboard, choose the Subscriptions tab, and then choose Create subscription.
    Figure 6: Choose Create subscription

    Figure 6: Choose Create subscription

  4. For Topic ARN, select the topic you created previously, then under Protocol, select Email and enter the email address you want the alerts to be sent to.
    Figure 7: Select the topic ARN and add an endpoint to send notifications to

    Figure 7: Select the topic ARN and add an endpoint to send notifications to

  5. After your subscription is created, go to the mailbox you designated to receive notifications and check for a verification email from the service. Open the email and select Confirm subscription to verify the email address and complete setup.

Initiate events with EventBridge

Amazon EventBridge is a serverless service that uses events to connect application components. EventBridge receives an event (an indicator of a change in environment) and applies a rule to route the event to a target. Rules match events to targets based on either the structure of the event, called an event pattern, or on a schedule.

Events that come to EventBridge are associated with an event bus. Rules are tied to a single event bus, so they can only be applied to events on that event bus. Your account has a default event bus that receives events from AWS services, and you can create custom event buses to send or receive events from a different account or AWS Region.

For a more comprehensive understanding of EventBridge, refer to the Amazon EventBridge User Guide.

In this part of our post, you’ll use EventBridge to devise a rule for initiating SNS notifications based on IAM configuration changes.

To create an EventBridge rule

  1. Go to the EventBridge console and select EventBridge Rule, and then choose Create rule.
    Figure 8: Use the EventBridge console to create a rule

    Figure 8: Use the EventBridge console to create a rule

  2. Enter a name for your rule, keep the defaults for the rest of rule details, and then choose Next.
    Figure 9: Rule detail screen

    Figure 9: Rule detail screen

  3. Under Target 1, select AWS service.
  4. In the dropdown list for Select a target, select SNS topic, select the topic you created previously, and then choose Next.
    Figure 10: Target with target type of AWS service and target topic of SNS topic selected

    Figure 10: Target with target type of AWS service and target topic of SNS topic selected

  5. Under Event source, select AWS events or EventBridge partner events.
    Figure 11: Event pattern with AWS events or EventBridge partner events selected

    Figure 11: Event pattern with AWS events or EventBridge partner events selected

  6. Under Event pattern, verify that you have the following selected.
    1. For Event source, select AWS services.
    2. For AWS service, select IAM.
    3. For Event type, select AWS API Call via CloudTrail.
    4. Select the radio button for Any operation.
    Figure 12: Event pattern details selected

    Figure 12: Event pattern details selected

Now that you’ve set up EventBridge to monitor IAM changes, test it by creating a new user or adding a new policy to an IAM role and see if you receive an email notification.

Centralize EventBridge alerts by using cross-account alerts

If you have multiple accounts, you should be evaluating using AWS Organizations. (For a deep dive into best practices for using AWS Organizations, we recommend reading this AWS blog post.)

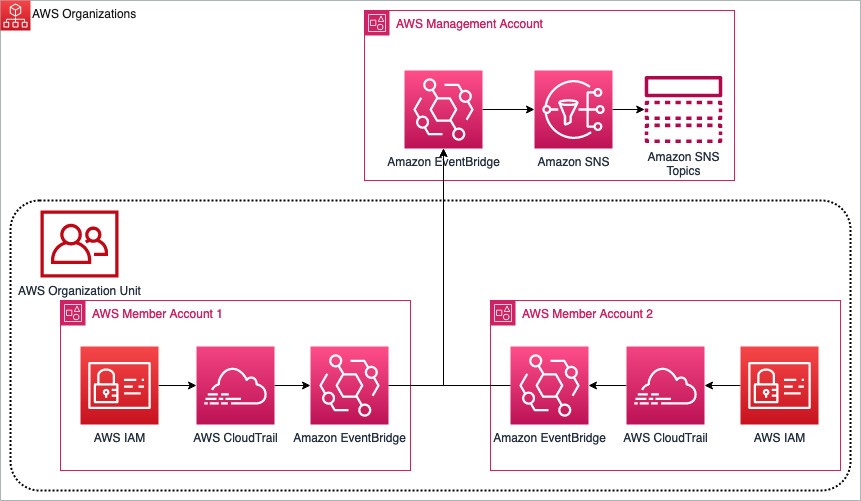
By standardizing the implementation to channel alerts from across accounts to a primary AWS notification account, you can use a multi-account EventBridge architecture. This allows aggregation of notifications across your accounts through sender and receiver accounts. Figure 13 shows how this works. Separate member accounts within an AWS organizational unit (OU) have the same mechanism for monitoring changes and sending notifications as discussed earlier, but send notifications through an EventBridge instance in another account.

Figure 13: Multi-account EventBridge architecture aggregating notifications between two AWS member accounts to a primary management account

Figure 13: Multi-account EventBridge architecture aggregating notifications between two AWS member accounts to a primary management account

You can read more and see the implementation and deep dive of the multi-account EventBridge solution on the AWS samples GitHub, and you can also read more about sending and receiving Amazon EventBridge notifications between accounts.

Monitor calls to IAM

In this blog post example, you monitor calls to IAM.

The filter pattern you selected while setting up EventBridge matches CloudTrail events for calls to the IAM service. Calls to IAM have a CloudTrail eventSource of iam.amazonaws.com, so IAM API calls will match this pattern. You will find this simple default filter pattern useful if you have minimal IAM activity in your account or to test this example. However, as your account activity grows, you’ll likely receive more notifications than you need. This is when filtering only the relevant events becomes essential to prioritize your responses. Effectively managing your filter preferences allows you to focus on events of significance and maintain control as your AWS environment grows.

Monitor changes to IAM

If you’re interested only in changes to your IAM account, you can modify the event pattern inside EventBridge, the one you used to set up IAM notifications, with an eventName filter pattern, shown following.

"eventName": [
      "Add*",
      "Attach*",
      "Change*",
      "Create*",
      "Deactivate*",
      "Delete*",
      "Detach*",
      "Enable*",
      "Put*",
      "Remove*",
      "Set*",
      "Update*",
      "Upload*"
    ]

This filter pattern will only match events from the IAM service that begin with Add, Change, Create, Deactivate, Delete, Enable, Put, Remove, Update, or Upload. For more information about APIs matching these patterns, see the IAM API Reference.

To edit the filter pattern to monitor only changes to IAM

  1. Open the EventBridge console, navigate to the Event pattern, and choose Edit pattern.
    Figure 14: Modifying the event pattern

    Figure 14: Modifying the event pattern

  2. Add the eventName filter pattern from above to your event pattern.
    Figure 15: Use the JSON editor to add the eventName filter pattern

    Figure 15: Use the JSON editor to add the eventName filter pattern

Monitor changes to authentication and authorization configuration

Monitoring changes to authentication (security credentials) and authorization (policy) configurations is critical, because it can alert you to potential security vulnerabilities or breaches. For instance, unauthorized changes to security credentials or policies could indicate malicious activity, such as an attempt to gain unauthorized access to your AWS resources. If you’re only interested in these types of changes, use the preceding steps to implement the following filter pattern.

    "eventName": [
      "Put*Policy",
      "Attach*",
      "Detach*",
      "Create*",
      "Update*",
      "Upload*",
      "Delete*",
      "Remove*",
      "Set*"
    ]

This filter pattern matches calls to IAM that modify policy or create, update, upload, and delete IAM elements.

Conclusion

Monitoring IAM security configuration changes allows you another layer of defense against the unexpected. Balancing productivity and security, you might grant a user broad permissions in order to facilitate their work, such as exploring new AWS services. Although preventive measures are crucial, they can potentially restrict necessary actions. For example, a developer may need to modify an IAM role for their task, an alteration that could pose a security risk. This change, while essential for their work, may be undesirable from a security standpoint. Thus, it’s critical to have monitoring systems alongside preventive measures, allowing necessary actions while maintaining security.

Create an event rule for IAM events that are important to you and have a response plan ready. You can refer to Security best practices in IAM for further reading on this topic.

If you have questions or feedback about this or any other IAM topic, please visit the IAM re:Post forum. You can also read about the multi-account EventBridge solution on the AWS samples GitHub and learn more about sending and receiving Amazon EventBridge notifications between accounts.

If you have feedback about this post, submit comments in the Comments section below. If you have questions about this post, contact AWS Support.

Want more AWS Security news? Follow us on Twitter.

Dylan Souvage

Dylan Souvage

Dylan is a Solutions Architect based in Toronto, Canada. Dylan loves working with customers to understand their business and enable them in their cloud journey. In his spare time, he enjoys martial arts, sports, anime, and traveling to warm, sunny places to spend time with his friends and family.

Abhra Sinha

Abhra Sinha

Abhra is a Toronto-based Enterprise Solutions Architect at AWS. Abhra enjoys being a trusted advisor to customers, working closely with them to solve their technical challenges and help build a secure, scalable architecture on AWS. In his spare time, he enjoys Photography and exploring new restaurants.

Detecting and stopping recursive loops in AWS Lambda functions

Post Syndicated from Julian Wood original https://aws.amazon.com/blogs/compute/detecting-and-stopping-recursive-loops-in-aws-lambda-functions/

This post is written by Pawan Puthran, Principal Serverless Specialist TAM, Aneel Murari, Senior Serverless Specialist Solution Architect, and Shree Shrikhande, Senior AWS Lambda Product Manager.

AWS Lambda is announcing a recursion control to detect and stop Lambda functions running in a recursive or infinite loop.

At launch, this feature is available for Lambda integrations with Amazon Simple Queue Service (Amazon SQS), Amazon SNS, or when invoking functions directly using the Lambda invoke API. Lambda now detects functions that appear to be running in a recursive loop and drops requests after exceeding 16 invocations.

This can help reduce costs from unexpected Lambda function invocations because of recursion. You receive notifications about this action through the AWS Health Dashboard, email, or by configuring Amazon CloudWatch Alarms.

Overview

You can invoke Lambda functions in multiple ways. AWS services generate events that invoke Lambda functions, and Lambda functions can send messages to other AWS services. In most architectures, the service or resource that invokes a Lambda function should be different from the service or resource that the function outputs to. Because of misconfiguration or coding bugs, a function can send a processed event to the same service or resource that invokes the Lambda function, causing a recursive loop.

Lambda now detects the function running in a recursive loop between supported services, after exceeding 16 invocations. It returns a RecursiveInvocationException to the caller. There is no additional charge for this feature. For asynchronous invokes, Lambda sends the event to a dead-letter queue or on-failure destination, if one is configured.

The following is an example of an order processing system.

Image processing system

Order processing system

  1. A new order information message is sent to the source SQS queue.
  2. Lambda consumes the message from the source queue using an ESM.
  3. The Lambda function processes the message and sends the updated orders message to a destination SQS queue using the SQS SendMessage API.
  4. The source queue has a dead-letter queue(DLQ) configured for handling any failed or unprocessed messages.
  5. Because of a misconfiguration, the Lambda function sends the message to the source SQS queue instead of the destination queue. This causes a recursive loop of Lambda function invocations.

To explore sample code for this example, see the GitHub repo.

In the preceding example, after 16 invocations, Lambda throws a RecursiveInvocationException to the ESM. The ESM stops invoking the Lambda function and, once the maxReceiveCount is exceeded, SQS moves the message to the source queues configured DLQ.

You receive an AWS Health Dashboard notification with steps to troubleshoot the function.

AWS Health Dashboard notification

AWS Health Dashboard notification

You also receive an email notification to the registered email address on the account.

Email notification

Email notification

Lambda emits a RecursiveInvocationsDropped CloudWatch metric, which you can view in the CloudWatch console.

RecursiveInvocationsDropped CloudWatch metric

RecursiveInvocationsDropped CloudWatch metric

How does Lambda detect recursion?

For Lambda to detect recursive loops, your function must use one of the supported AWS SDK versions or higher.

Lambda uses an AWS X-Ray trace header primitive called “Lineage” to track the number of times a function has been invoked with an event. When your function code sends an event using a supported AWS SDK version, Lambda increments the counter in the lineage header. If your function is then invoked with the same triggering event more than 16 times, Lambda stops the next invocation for that event. You do not need to configure active X-Ray tracing for this feature to work.

An example lineage header looks like:

X-Amzn-Trace-Id:Root=1-645f7998-4b1e232810b0bb733dba2eab;Parent=5be88d12eefc1fc0;Sampled=1;Lineage=43e12f0f:5

43e12f0f is the hash of a resource, in this case a Lambda function. 5 is the number of times this function has been invoked with the same event. The logic of hash generation, encoding, and size of the lineage header may change in the future. You should not design any application functionality based on this.

When using an ESM to consume messages from SQS, after the maxReceiveCount value is exceeded, the message is sent to the source queue’s configured DLQ. When Lambda detects a recursive loop and drops subsequent invocations, it returns a RecursiveInvocationException to the ESM. This increments the maxReceiveCount value. When the ESM auto retries to process events, based on the error handling configuration, these retries are not considered recursive invocations.

When using SQS, you can also batch multiple messages into one Lambda event. Where the message batch size is greater than 1, Lambda uses the maximum lineage value within the batch of messages. It drops the entire batch if the value exceeds 16.

Recursion detection in action

You can deploy a sample application example in the GitHub repo to test Lambda recursive loop detection. The application includes a Lambda function that reads from an SQS queue and writes messages back to the same SQS queue.

As prerequisites, you must install:

To deploy the application:

    1. Set your AWS Region:
export REGION=<your AWS region>
    1. Clone the GitHub repository
git clone https://github.com/aws-samples/aws-lambda-recursion-detection-sample.git
cd aws-lambda-recursion-detection-sample
    1. Use AWS SAM to build and deploy the resources to your AWS account. Enter a stack name, such as lambda-recursion, when prompted. Accept the remaining default values.
sam build –-use-container
sam deploy --guided --region $REGION

To test the application:

    1. Save the name of the SQS queue in a local environment variable:
SOURCE_SQS_URL=$(aws cloudformation describe-stacks \ --region $REGION \ --stack-name lambda-recursion \ --query 'Stacks[0].Outputs[?OutputKey==`SourceSQSqueueURL`].OutputValue' --output text)
  1. Publish a message to the source SQS queue:
aws sqs send-message --queue-url $SOURCE_SQS_URL --message-body '{"orderId":"111","productName":"Bolt","orderStatus":"Submitted"}' --region $REGION

This invokes the Lambda function, which writes the message back to the queue.

To verify that Lambda has detected the recursion:

  1. Navigate to the CloudWatch console. Choose All Metrics under Metrics in the left-hand panel and search for RecursiveInvocationsDropped.

    Find RecursiveInvocationsDropped.

    Find RecursiveInvocationsDropped.

  2. Choose Lambda > By Function Name and choose RecursiveInvocationsDropped for the function you created. Under Graphed metrics, change the statistic to sum and Period to 1 minute. You see one record. Refresh if you don’t see the metric after a few seconds.
Metrics sum view

Metrics sum view

Actions to take when Lambda stops a recursive loop

When you receive a notification regarding recursion in your account, the following steps can help address the issue.

  • To stop further invoke attempts while you fix the underlying configuration issue, set the function concurrency to 0. This acts as an off switch for the Lambda function. You can choose the “Throttle” button in the Lambda console or use the PutFunctionConcurrency API to set the function concurrency to 0.
  • You can also disable or delete the event source mapping or trigger for the Lambda function.
  • Check your Lambda function code and configuration for any code defects that create loops. For example, check your environment variables to ensure you are not using the same SQS queue or SNS topic as source and target.
  • If an SQS Queue is the event source for your Lambda function, configure a DLQ on the source queue.
  • If an SNS topic is the event source, configure an On-Failure Destination for the Lambda function.

Disabling recursion detection

You may have valid use-cases where Lambda recursion is intentional as part of your design. In this case, use caution and implement suitable guardrails to prevent unexpected charges to your account. To learn more about best practices for using recursive invocation patterns, see Recursive patterns that cause run-away Lambda functions in the AWS Lambda Operator Guide.

This feature is turned on by default to stop recursive loops. To request turning it off for your account, reach out to AWS Support.

Conclusion

Lambda recursion control for SQS and SNS automatically detects and stops functions running in a recursive or infinite loop. This can be due to misconfiguration or coding errors. Recursion control helps reduce unexpected usage with Lambda and downstream services. The post also explains how Lambda detects and stops recursive loops and notifies you through AWS Health Dashboard to troubleshoot the function.

To learn more about the feature, visit the AWS Lambda Developer Guide.

For more serverless learning resources, visit Serverless Land

AWS Week in Review – AWS Glue Crawlers Now Supports Apache Iceberg, Amazon RDS Updates, and More – July 10, 2023

Post Syndicated from Antje Barth original https://aws.amazon.com/blogs/aws/aws-week-in-review-aws-glue-crawlers-now-supports-apache-iceberg-amazon-rds-updates-and-more-july-10-2023/

The US celebrated Independence Day last week on July 4 with fireworks and barbecues across the country. But fireworks weren’t the only thing that launched last week. Let’s have a look!

Last Week’s Launches
Here are some launches that got my attention:

AWS GlueAWS Glue Crawlers now supports Apache Iceberg tables. Apache Iceberg is an open-source table format for data stored in data lakes. You can now automatically register Apache Iceberg tables into AWS Glue Data Catalog by running the Glue Crawler. You can then query Glue Catalog Iceberg tables across various analytics engines and apply AWS Lake Formation fine-grained permissions when querying from Amazon Athena. Check out the AWS Glue Crawler documentation to learn more.

Amazon Relational Database Service (Amazon RDS) for PostgreSQL – PostgreSQL 16 Beta 2 is now available in the Amazon RDS Database Preview Environment. The PostgreSQL community released PostgreSQL 16 Beta 2 on June 29, 2023, which enables logical replication from standbys and includes numerous performance improvements. You can deploy PostgreSQL 16 Beta 2 in the preview environment and start evaluating the pre-release of PostgreSQL 16 on Amazon RDS for PostgreSQL.

In addition, Amazon RDS for PostgreSQL Multi-AZ Deployments with two readable standbys now supports logical replication. With logical replication, you can stream data changes from Amazon RDS for PostgreSQL to other databases for use cases such as data consolidation for analytical applications, change data capture (CDC), replicating select tables rather than the entire database, or for replicating data between different major versions of PostgreSQL. Check out the Amazon RDS User Guide for more details.

Amazon CloudWatch – Amazon CloudWatch now supports Service Quotas in cross-account observability. With this, you can track and visualize resource utilization and limits across various AWS services from multiple AWS accounts within a region using a central monitoring account. You no longer have to track the quotas by logging in to individual accounts, instead from a central monitoring account, you can create dashboards and alarms for the AWS service quota usage across all your source accounts from a central monitoring account. Setup CloudWatch cross-account observability to get started.

Amazon SageMaker – You can now associate a SageMaker Model Card with a specific model version in SageMaker Model Registry. This lets you establish a single source of truth for your registered model versions, with comprehensive, centralized, and standardized documentation across all stages of the model’s journey on SageMaker, facilitating discoverability and promoting governance, compliance, and accountability throughout the model lifecycle. Learn more about SageMaker Model Cards in the developer guide.

For a full list of AWS announcements, be sure to keep an eye on the What’s New at AWS page.

Other AWS News
Here are some additional blog posts and news items that you might find interesting:

Building generative AI applications for your startup – In this AWS Startups Blog post, Hrushikesh explains various approaches to build generative AI applications, and reviews their key component. Read the full post for the details.

Components of the generative AI landscape

Components of the generative AI landscape.

How Alexa learned to speak with an Irish accent – If you’re curious how Amazon researchers used voice conversation to generate Irish-accented training data in Alexa’s own voice, check out this Amazon Science Blog post. 

AWS open-source news and updates – My colleague Ricardo writes this weekly open-source newsletter in which he highlights new open-source projects, tools, and demos from the AWS Community.

Upcoming AWS Events
Check your calendars and sign up for these AWS events:

AWS Global Summits – Check your calendars and sign up for the AWS Summit close to where you live or work: Hong Kong (July 20), New York City (July 26), Taiwan (August 2-3), São Paulo (August 3), and Mexico City (August 30).

AWS Community Days – Join a community-led conference run by AWS user group leaders in your region: Malaysia (July 22), Philippines (July 29-30), Colombia (August 12), and West Africa (August 19).

AWS re:Invent 2023AWS re:Invent (November 27 – December 1) – Join us to hear the latest from AWS, learn from experts, and connect with the global cloud community. Registration is now open.

You can browse all upcoming in-person and virtual events.

That’s all for this week. Check back next Monday for another Week in Review!

— Antje

This post is part of our Week in Review series. Check back each week for a quick roundup of interesting news and announcements from AWS!

Centralize near-real-time governance through alerts on Amazon Redshift data warehouses for sensitive queries

Post Syndicated from Rajdip Chaudhuri original https://aws.amazon.com/blogs/big-data/centralize-near-real-time-governance-through-alerts-on-amazon-redshift-data-warehouses-for-sensitive-queries/

Amazon Redshift is a fully managed, petabyte-scale data warehouse service in the cloud that delivers powerful and secure insights on all your data with the best price-performance. With Amazon Redshift, you can analyze your data to derive holistic insights about your business and your customers. In many organizations, one or multiple Amazon Redshift data warehouses run daily for data and analytics purposes. Therefore, over time, multiple Data Definition Language (DDL) or Data Control Language (DCL) queries, such as CREATE, ALTER, DROP, GRANT, or REVOKE SQL queries, are run on the Amazon Redshift data warehouse, which are sensitive in nature because they could lead to dropping tables or deleting data, causing disruptions or outages. Tracking such user queries as part of the centralized governance of the data warehouse helps stakeholders understand potential risks and take prompt action to mitigate them following the operational excellence pillar of the AWS Data Analytics Lens. Therefore, for a robust governance mechanism, it’s crucial to alert or notify the database and security administrators on the kind of sensitive queries that are run on the data warehouse, so that prompt remediation actions can be taken if needed.

To address this, in this post we show you how you can automate near-real-time notifications over a Slack channel when certain queries are run on the data warehouse. We also create a simple governance dashboard using a combination of Amazon DynamoDB, Amazon Athena, and Amazon QuickSight.

Solution overview

An Amazon Redshift data warehouse logs information about connections and user activities taking place in databases, which helps monitor the database for security and troubleshooting purposes. These logs can be stored in Amazon Simple Storage Service (Amazon S3) buckets or Amazon CloudWatch. Amazon Redshift logs information in the following log files, and this solution is based on using an Amazon Redshift audit log to CloudWatch as a destination:

  • Connection log – Logs authentication attempts, connections, and disconnections
  • User log – Logs information about changes to database user definitions
  • User activity log – Logs each query before it’s run on the database

The following diagram illustrates the solution architecture.

Solution Architecture

The solution workflow consists of the following steps:

  1. Audit logging is enabled in each Amazon Redshift data warehouse to capture the user activity log in CloudWatch.
  2. Subscription filters on CloudWatch capture the required DDL and DCL commands by providing filter criteria.
  3. The subscription filter triggers an AWS Lambda function for pattern matching.
  4. The Lambda function processes the event data and sends the notification over a Slack channel using a webhook.
  5. The Lambda function stores the data in a DynamoDB table over which a simple dashboard is built using Athena and QuickSight.

Prerequisites

Before starting the implementation, make sure the following requirements are met:

  • You have an AWS account.
  • The AWS Region used for this post is us-east-1. However, this solution is relevant in any other Region where the necessary AWS services are available.
  • Permissions to create Slack a workspace.

Create and configure an Amazon Redshift cluster

To set up your cluster, complete the following steps:

  1. Create a provisioned Amazon Redshift data warehouse.

For this post, we use three Amazon Redshift data warehouses: demo-cluster-ou1, demo-cluster-ou2, and demo-cluster-ou3. In this post, all the Amazon Redshift data warehouses are provisioned clusters. However, the same solution applies for Amazon Redshift Serverless.

  1. To enable audit logging with CloudWatch as the log delivery destination, open an Amazon Redshift cluster and go to the Properties tab.
  2. On the Edit menu, choose Edit audit logging.

Redshift edit audit logging

  1. Select Turn on under Configure audit logging.
  2. Select CloudWatch for Log export type.
  3. Select all three options for User log, Connection log, and User activity log.
  4. Choose Save changes.

  1. Create a parameter group for the clusters with enable_user_activity_logging set as true for each of the clusters.
  2. Modify the cluster to attach the new parameter group to the Amazon Redshift cluster.

For this post, we create three custom parameter groups: custom-param-grp-1, custom-param-grp-2, and custom-param-grp-3 for three clusters.

Note, if you enable only the audit logging feature, but not the associated parameter, the database audit logs log information for only the connection log and user log, but not for the user activity log.

  1. On the CloudWatch console, choose Log groups under Logs in the navigation pane.
  2. Search for /aws/redshift/cluster/demo.

This will show all the log groups created for the Amazon Redshift clusters.

Create a DynamoDB audit table

To create your audit table, complete the following steps:

  1. On the DynamoDB console, choose Tables in the navigation pane.
  2. Choose Create table.
  3. For Table name, enter demo_redshift_audit_logs.
  4. For Partition key, enter partKey with the data type as String.

  1. Keep the table settings as default.
  2. Choose Create table.

Create Slack resources

Slack Incoming Webhooks expect a JSON request with a message string corresponding to a "text" key. They also support message customization, such as adding a user name and icon, or overriding the webhook’s default channel. For more information, see Sending messages using Incoming Webhooks on the Slack website.

The following resources are created for this post:

  • A Slack workspace named demo_rc
  • A channel named #blog-demo in the newly created Slack workspace
  • A new Slack app in the Slack workspace named demo_redshift_ntfn (using the From Scratch option)
  • Note down the Incoming Webhook URL, which will be used in this post for sending the notifications

Create an IAM role and policy

In this section, we create an AWS Identity and Access Management (IAM) policy that will be attached to an IAM role. The role is then used to grant a Lambda function access to a DynamoDB table. The policy also includes permissions to allow the Lambda function to write log files to Amazon CloudWatch Logs.

  1. On the IAM console, choose Policies in navigation pane.
  2. Choose Create policy.
  3. In the Create policy section, choose the JSON tab and enter the following IAM policy. Make sure you replace your AWS account ID in the policy (replace XXXXXXXX with your AWS account ID).
{
    "Version": "2012-10-17",
    "Statement": [
        {
            "Sid": "ReadWriteTable",
            "Effect": "Allow",
            "Action": [
                "dynamodb:BatchGetItem",
                "dynamodb:BatchWriteItem",
                "dynamodb:PutItem",
                "dynamodb:GetItem",
                "dynamodb:Scan",
                "dynamodb:Query",
                "dynamodb:UpdateItem",
                "logs:PutLogEvents"
            ],
            "Resource": [
                "arn:aws:dynamodb:us-east-1:XXXXXXXX:table/demo_redshift_audit_logs",
                "arn:aws:logs:*:XXXXXXXX:log-group:*:log-stream:*"
            ]
        },
        {
            "Sid": "WriteLogStreamsAndGroups",
            "Effect": "Allow",
            "Action": [
                "logs:CreateLogStream",
                "logs:CreateLogGroup"
            ],
            "Resource": "arn:aws:logs:*:XXXXXXXX:log-group:*"
        }
    ]
}
  1. Choose Next: Tags, then choose Next: Review.
  2. Provide the policy name demo_post_policy and choose Create policy.

To apply demo_post_policy to a Lambda function, you first have to attach the policy to an IAM role.

  1. On the IAM console, choose Roles in the navigation pane.
  2. Choose Create role.
  3. Select AWS service and then select Lambda.
  4. Choose Next.

  1. On the Add permissions page, search for demo_post_policy.
  2. Select demo_post_policy from the list of returned search results, then choose Next.

  1. On the Review page, enter demo_post_role for the role and an appropriate description, then choose Create role.

Create a Lambda function

We create a Lambda function with Python 3.9. In the following code, replace the slack_hook parameter with the Slack webhook you copied earlier:

import gzip
import base64
import json
import boto3
import uuid
import re
import urllib3

http = urllib3.PoolManager()
dynamodb = boto3.resource('dynamodb')
table = dynamodb.Table("demo_redshift_audit_logs")
slack_hook = "https://hooks.slack.com/services/xxxxxxx"

def exe_wrapper(data):
    cluster_name = (data['logStream'])
    for event in data['logEvents']:
        message = event['message']
        reg = re.match(r"'(?P<ts>\d{4}-\d\d-\d\dT\d\d:\d\d:\d\dZ).*?\bdb=(?P<db>\S*).*?\buser=(?P<user>\S*).*?LOG:\s+(?P<query>.*?);?$", message)
        if reg is not None:
            filter = reg.groupdict()
            ts = filter['ts']
            db = filter['db']
            user = filter['user']
            query = filter['query']
            query_type = ' '.join((query.split(" "))[0 : 2]).upper()
            object = query.split(" ")[2]
            put_dynamodb(ts,cluster_name,db,user,query,query_type,object,message)
            slack_api(cluster_name,db,user,query,query_type,object)
            
def put_dynamodb(timestamp,cluster,database,user,sql,query_type,object,event):
    table.put_item(Item = {
        'partKey': str(uuid.uuid4()),
        'redshiftCluster': cluster,
        'sqlTimestamp' : timestamp,
        'databaseName' : database,
        'userName': user,
        'sqlQuery': sql,
        'queryType' : query_type,
        'objectName': object,
        'rawData': event
        })
        
def slack_api(cluster,database,user,sql,query_type,object):
    payload = {
	'channel': '#blog-demo',
	'username': 'demo_redshift_ntfn',
	'blocks': [{
			'type': 'section',
			'text': {
				'type': 'mrkdwn',
				'text': 'Detected *{}* command\n *Affected Object*: `{}`'.format(query_type, object)
			}
		},
		{
			'type': 'divider'
		},
		{
			'type': 'section',
			'fields': [{
					'type': 'mrkdwn',
					'text': ':desktop_computer: *Cluster Name:*\n{}'.format(cluster)
				},
				{
					'type': 'mrkdwn',
					'text': ':label: *Query Type:*\n{}'.format(query_type)
				},
				{
					'type': 'mrkdwn',
					'text': ':card_index_dividers: *Database Name:*\n{}'.format(database)
				},
				{
					'type': 'mrkdwn',
					'text': ':technologist: *User Name:*\n{}'.format(user)
				}
			]
		},
		{
			'type': 'section',
			'text': {
				'type': 'mrkdwn',
				'text': ':page_facing_up: *SQL Query*\n ```{}```'.format(sql)
			}
		}
	]
	}
    encoded_msg = json.dumps(payload).encode('utf-8')
    resp = http.request('POST',slack_hook, body=encoded_msg)
    print(encoded_msg) 

def lambda_handler(event, context):
    print(f'Logging Event: {event}')
    print(f"Awslog: {event['awslogs']}")
    encoded_zipped_data = event['awslogs']['data']
    print(f'data: {encoded_zipped_data}')
    print(f'type: {type(encoded_zipped_data)}')
    zipped_data = base64.b64decode(encoded_zipped_data)
    data = json.loads(gzip.decompress(zipped_data))
    exe_wrapper(data)

Create your function with the following steps:

  1. On the Lambda console, choose Create function.
  2. Select Author from scratch and for Function name, enter demo_function.
  3. For Runtime, choose Python 3.9.
  4. For Execution role, select Use an existing role and choose demo_post_role as the IAM role.
  5. Choose Create function.

  1. On the Code tab, enter the preceding Lambda function and replace the Slack webhook URL.
  2. Choose Deploy.

Create a CloudWatch subscription filter

We need to create the CloudWatch subscription filter on the useractivitylog log group created by the Amazon Redshift clusters.

  1. On the CloudWatch console, navigate to the log group /aws/redshift/cluster/demo-cluster-ou1/useractivitylog.
  2. On the Subscription filters tab, on the Create menu, choose Create Lambda subscription filter.

  1. Choose demo_function as the Lambda function.
  2. For Log format, choose Other.
  3. Provide the subscription filter pattern as ?create ?alter ?drop ?grant ?revoke.
  4. Provide the filter name as Sensitive Queries demo-cluster-ou1.
  5. Test the filter by selecting the actual log stream. If it has any queries with a match pattern, then you can see some results. For testing, use the following pattern and choose Test pattern.
'2023-04-02T04:18:43Z UTC [ db=dev user=awsuser pid=100 userid=100 xid=100 ]' LOG: alter table my_table alter column string type varchar(16);
'2023-04-02T04:06:08Z UTC [ db=dev user=awsuser pid=100 userid=100 xid=200 ]' LOG: create user rs_user with password '***';

  1. Choose Start streaming.

  1. Repeat the same steps for /aws/redshift/cluster/demo-cluster-ou2/useractivitylog and /aws/redshift/cluster/demo-cluster-ou3/useractivitylog by giving unique subscription filter names.
  2. Complete the preceding steps to create a second subscription filter for each of the Amazon Redshift data warehouses with the filter pattern ?CREATE ?ALTER ?DROP ?GRANT ?REVOKE, ensuring uppercase SQL commands are also captured through this solution.

Test the solution

In this section, we test the solution in the three Amazon Redshift clusters that we created in the previous steps and check for the notifications of the commands on the Slack channel as per the CloudWatch subscription filters as well as data getting ingested in the DynamoDB table. We use the following commands to test the solution; however, this is not restricted to these commands only. You can check with other DDL commands as per the filter criteria in your Amazon Redshift cluster.

create schema sales;
create schema marketing;
create table dev.public.demo_test_table_1  (id int, string varchar(10));
create table dev.public.demo_test_table_2  (empid int, empname varchar(100));
alter table dev.public.category alter column catdesc type varchar(65);
drop table dev.public.demo_test_table_1;
drop table dev.public.demo_test_table_2;

In the Slack channel, details of the notifications look like the following screenshot.

To get the results in DynamoDB, complete the following steps:

  1. On the DynamoDB console, choose Explore items under Tables in the navigation pane.
  2. In the Tables pane, select demo_redshift_audit_logs.
  3. Select Scan and Run to get the results in the table.

Athena federation over the DynamoDB table

The Athena DynamoDB connector enables Athena to communicate with DynamoDB so that you can query your tables with SQL. As part of the prerequisites for this, deploy the connector to your AWS account using the Athena console or the AWS Serverless Application Repository. For more details, refer to Deploying a data source connector or Using the AWS Serverless Application Repository to deploy a data source connector. For this post, we use the Athena console.

  1. On the Athena console, under Administration in the navigation pane, choose Data sources.
  2. Choose Create data source.

  1. Select the data source as Amazon DynamoDB, then choose Next.

  1. For Data source name, enter dynamo_db.
  2. For Lambda function, choose Create Lambda function to open a new window with the Lambda console.

  1. Under Application settings, enter the following information:
    • For Application name, enter AthenaDynamoDBConnector.
    • For SpillBucket, enter the name of an S3 bucket.
    • For AthenaCatalogName, enter dynamo.
    • For DisableSpillEncryption, enter false.
    • For LambdaMemory, enter 3008.
    • For LambdaTimeout, enter 900.
    • For SpillPrefix, enter athena-spill-dynamo.

  1. Select I acknowledge that this app creates custom IAM roles and choose Deploy.
  2. Wait for the function to deploy, then return to the Athena window and choose the refresh icon next to Lambda function.
  3. Select the newly deployed Lambda function and choose Next.

  1. Review the information and choose Create data source.
  2. Navigate back to the query editor, then choose dynamo_db for Data source and default for Database.
  3. Run the following query in the editor to check the sample data:
SELECT partkey,
       redshiftcluster,
       databasename,
       objectname,
       username,
       querytype,
       sqltimestamp,
       sqlquery,
       rawdata
FROM dynamo_db.default.demo_redshift_audit_logs limit 10;

Visualize the data in QuickSight

In this section, we create a simple governance dashboard in QuickSight using Athena in direct query mode to query the record set, which is persistently stored in a DynamoDB table.

  1. Sign up for QuickSight on the QuickSight console.
  2. Select Amazon Athena as a resource.
  3. Choose Lambda and select the Lambda function created for DynamoDB federation.

  1. Create a new dataset in QuickSight with Athena as the source.
  2. Provide the name of the data source name as demo_blog.
  3. Choose dynamo_db for Catalog, default for Database, and demo_redshift_audit_logs for Table.
  4. Choose Edit/Preview data.

  1. Choose String in the sqlTimestamp column and choose Date.

  1. In the dialog box that appears, enter the data format yyyy-MM-dd'T'HH:mm:ssZZ.
  2. Choose Validate and Update.

  1. Choose PUBLISH & VISUALIZE.
  2. Choose Interactive sheet and choose CREATE.

This will take you to the visualization page to create the analysis on QuickSight.

  1. Create a governance dashboard with the appropriate visualization type.

Refer to the Amazon QuickSight learning videos in QuickSight community for basic to advanced level of authoring. The following screenshot is a sample visualization created on this data.

Clean up

Clean up your resources with the following steps:

  1. Delete all the Amazon Redshift clusters.
  2. Delete the Lambda function.
  3. Delete the CloudWatch log groups for Amazon Redshift and Lambda.
  4. Delete the Athena data source for DynamoDB.
  5. Delete the DynamoDB table.

Conclusion

Amazon Redshift is a powerful, fully managed data warehouse that can offer significantly increased performance and lower cost in the cloud. In this post, we discussed a pattern to implement a governance mechanism to identify and notify sensitive DDL/DCL queries on an Amazon Redshift data warehouse, and created a quick dashboard to enable the DBA and security team to take timely and prompt action as required. Additionally, you can extend this solution to include DDL commands used for Amazon Redshift data sharing across clusters.

Operational excellence is a critical part of the overall data governance on creating a modern data architecture, as it’s a great enabler to drive our customers’ business. Ideally, any data governance implementation is a combination of people, process, and technology that organizations use to ensure the quality and security of their data throughout its lifecycle. Use these instructions to set up your automated notification mechanism as sensitive queries are detected as well as create a quick dashboard on QuickSight to track the activities over time.


About the Authors

Rajdip Chaudhuri is a Senior Solutions Architect with Amazon Web Services specializing in data and analytics. He enjoys working with AWS customers and partners on data and analytics requirements. In his spare time, he enjoys soccer and movies.

Dhiraj Thakur is a Solutions Architect with Amazon Web Services. He works with AWS customers and partners to provide guidance on enterprise cloud adoption, migration, and strategy. He is passionate about technology and enjoys building and experimenting in the analytics and AI/ML space.

Amazon SES – How to track email deliverability to domain level with CloudWatch

Post Syndicated from Alaa Hammad original https://aws.amazon.com/blogs/messaging-and-targeting/amazon-ses-how-to-track-email-deliverability-to-domain-level-with-cloudwatch/

Why is it important to track email deliverability per domain with Amazon Simple Email Service (SES)?

Amazon Simple Email Service (Amazon SES) is a scalable cloud email service provider that enables businesses to build a large-scale email solution and host multiple domains from the same SES account for different purposes ex: one domain for sending marketing emails such as special offers, another domain to send transactional emails such as order confirmations, and other types of correspondence such as newsletters.

As your product, service or solution built on Amazon SES grows and you require multiple domains verified, it is important to track email deliverability for emails you send from each domain for business continuity, billing purposes or incidents investigations. This can be useful to identify if you have low email deliverability for your business domain or if you have a domain generating high bounce or complaint rates and take proactive actions before impacting the account’s ability to send emails from any other domains.

SES offers features that automatically manage deliverability per domain through Virtual Deliverability Manager. Virtual Deliverability Manager helps enhance email deliverability and provides insights into sending and delivery data, as well as offering solutions to fix negative email sending reputation. You can learn more about Virtual Deliverability Manager here.

Solution Walkthrough

Amazon SES provides a way to monitor sender reputation metrics such as bounce and complaint rates per account or configuration sets using event publishing. This blog will discuss how you can use Amazon SES message auto-tags to monitor and publish email deliverability events (Send, Delivery, Bounce, Complaints) to CloudWatch custom metrics per domain. In addition, you will see how to create a custom CloudWatch dashboard that’s easy to access in a single view to monitor your domain metrics. This CloudWatch dashboard can help to provide guidance for your team members during operational events about how to respond to specific incidents for your sending domain.

What are Amazon SES Auto-Tags:

Message tags are a form of name/value pairs to categorize the email you are sending. For example, if you advertise books, you could name a message tag general, and assign a value of sci-fi or western, when you send an email for the associated campaign. Depending on which email sending interface you use, you can provide the message tag as a parameter to the API call (SendEmail, SendRawEmail) or as an Amazon SES-specific email header.

In addition to the message tags you add to any emails you send, Amazon SES adds a set of Auto-Tags that are automatically included in any emails you send. You don’t need to pass the parameters of the auto-tags to the API call or email headers since SES does this automatically.

The auto-tags in the list below are used to track the email deliverability for specific events ( ex: Send, Delivery, Bounce, Complaint). SES does this by using the name/value pairs of the auto-tag name as a dimension in CloudWatch metric to track the count of events of specific auto-tag. This blog post will use “ses:from-domain” auto-tag to configure event publishing for tracking and publish email deliverability events (Send, Delivery, Bounce, Complaints) you receive per domain to CloudWatch metrics and CloudWatch dashboard.

Amazon SES auto-tags added to messages you send

Prerequisites:

For this walkthrough, you should have the following prerequisites:

Configure Amazon SES to publish email deliverability events to CloudWatch destination:

To configure event publishing for tracking email deliverability events, you first need to create a configuration set. Configuration sets in SES are groups of rules, that you can apply to your verified identities. When you apply a configuration set to an email, all of the rules in that configuration set are applied to the email.

After your configuration set is created, you need to create Amazon SES event destination. Amazon SES will send all email deliverability events you intend to track to this event destination. In this blog the event destination is Amazon CloudWatch.

    1. Sign in to the Amazon SES console.
    2. In the navigation pane, under Configuration, choose Configuration sets. Choose Create set.
    3. Enter Configuration set name, leave the rest of fields to default, scroll to the send and click on Create set.
    4. Under configuration set home page click on Event destinations tab and select Add destination
    5. Add SES event destination to configuration set
    6. Under Select event types, check Sends, Deliveries, Hard bounces and Complaints boxes and click Next.
    7. selecting event types to track
    8. Under Specify destination, Select Amazon CloudWatch.
    9. Select event destination as Amazon CloudWatch
    10. Name – enter the name of the destination for this configuration set. The name can include letters, numbers, dashes, and hyphens. (example : Tracking_per_Domain)
    11. Under Amazon CloudWatch dimensions, Select Value source: Message tag , Dimension name: ses:from-domain and Default value: example.com (you will need to add the verified domain name you want to track) as shown below:
    12. add message auto-tag as CloudWatch dimension to track
    13. Review, When you are satisfied that your entries are correct, Click Add destination to add your event destination.

Send a test email via Amazon SES mailbox simulator to trigger events in CloudWatch custom metric.

After selected Amazon CloudWatch as event destination , Amazon CloudWatch will create a custom metric with the auto-tag dimension and value you chose. For this custom metric to appear in CloudWatch Console, you must send an email to trigger each selected event. We recommend using the Amazon SES Mailbox Simulator to avoid generating real bounces or complaints that could impact your account’s reputation.

In the below section, This blog will show how to send those test emails to the following recipients manually using CLI. If you would like to use the console method to send those emails. you will need to send three separate test emails since the console will only allow one recipient per message:

Amazon SES Mailbox Simulator recipients to trigger the events in CloudWatch metrics:
[email protected]
[email protected]
[email protected]

Note: You must pass the name of the configuration set when sending an email. This can be done by either specifying the configuration set name in the headers of emails, or specifying it as a default configuration set. This can be done at the time of identity creation, or later while editing a verified identity.

The following example uses send-emailCLI command to send a formatted email to the Amazon SES simulator recipients:

Before you run any commands, set your default credentials by following Configuring the AWS CLI. The IAM user must has “ses:SendEmail” permission to send email.

  1. Navigate to your terminal where the AWS CLI is installed and configured. Create message.json file for the message to send and add the following content:
  2. {
    "Subject": {
    "Data": "Testing CW events with email simulator",
    "Charset": "UTF-8"
    },
    "Body": {
    "Text": {
    "Data": "This is the message body of testing CW events with email similulator.",
    "Charset": "UTF-8"
    }
    }
    }
  3. Create a destination.json file to add Amazon SES simulator recipients for bounces, complaints and delivery events as shown below:
  4. { 
    
    "ToAddresses": ["[email protected]", "[email protected]" , "[email protected]"]
    
    }
  5. Send a test email using send-email CLI command to send a formatted email to the Amazon SES simulator recipients:
  6. aws ses send-email --from [email protected] --destination file://destination.json --message file://message.json --configuration-set-name SES_Config_Set --region <AWS Region>
  7. After the message sent, you are expected to see the following output:
  8. {
    
    "MessageId": "EXAMPLEf3a5efcd1-51adec81-d2a4-4e3f-9fe2-5d85c1b23783-000000"
    
    }

Now you sent a test email to trigger the events you want to track in CloudWatch custom metrics. Lets create the CloudWatch dashboard to see those metrics.

Create CloudWatch dashboard to track the email deliverability events for my domain.

  1. Sign in to the Amazon CloudWatch console.
  2. In the navigation pane, choose Dashboards, and then choose Create dashboard.
  3. In the Create new dashboard dialog box, enter a name like ‘CW_Domain_Tracking’ for the dashboard, and then choose Create dashboard.
  4. In the Add Widget dialog box, Choose Number to add a number displaying a metric to the dashboard and then choose Next
  5. Under Add metric graph, click on edit sign to rename the graph with your domain example.com . this will make it easy for you to select the dashboard of the domain if you have multiple domains.
  6. In the Browse tab , Select the AWS region where you are running your SES account and in the search bar, search for “ses:from-domain”.
  7. You will get four metrics returned with your domain name “example.com”. Select checkbox beside the four metrics and click Create widget.
  8. CloudWatch dashboard with the metrics
  9. Save dashboard in the top right corner of the dashboard page to save the widget settings.
  10. Save CloudWatch dashboard settings

After the CloudWatch dashboard created, for any email you send from example.com domain with configuration set name passed in the email header, The email deliverability events will be counted in your CloudWatch metrics and you will be able to see them in the CloudWatch dashboard.

As an additional step. You can also setup a CloudWatch alarms for this custom metrics and add a threshold for each metric. When the metric breach the threshold, the alarm goes on and send an SNS notification to you to take the necessary actions.

Cleaning Up:

This setup includes Amazon CloudWatch and Amazon SES service charges. To avoid incurring any extra charges, remember to delete any resources created manually if you no longer need them for monitoring.

Resources to delete from Amazon SES console.

  1. In the navigation pane, under Configuration, choose Configuration sets.
  2. Check the box beside Configuration set you created and select Delete.

Resources to delete from Amazon CloudWatch console.

  1. In the navigation pane, choose Dashboards, and then choose the dashboard you created.
  2. In the upper-right corner of the graph that you want to remove, choose Actions, and then choose Delete Dashboard.
  3. Save dashboard.

Conclusion:

You have now seen how to configure Amazon SES to track email deliverability at domain level with CloudWatch dashboard. Tracking email deliverability for emails you send from each domain is essential for business continuity, billing purposes or incidents investigations. Using SES message auto-tags and CloudWatch metrics you can identify the domains that have low email deliverability quickly and take necessary actions to maximize your email deliverability and take proactive actions before impacting the account’s ability to send emails from any other domains.

About the author:

Alaa Hammad

Alaa Hammad is a Senior Cloud Support Engineer at AWS and subject matter expert in Amazon Simple Email Service and AWS Backup service. She has a 10 years of diverse experience in supporting enterprise customers across different industries. She enjoys cooking and try new recipes from different cuisines.

Deploying an automated Amazon CloudWatch dashboard for AWS Outposts using AWS CDK

Post Syndicated from Sheila Busser original https://aws.amazon.com/blogs/compute/deploying-an-automated-amazon-cloudwatch-dashboard-for-aws-outposts-using-aws-cdk/

This post is written by Enrico Liguori, Networking Solutions Architect, Hybrid Cloud and Sumeeth Siriyur, Sr. Hybrid Cloud Solutions Architect.

AWS Outposts is a fully managed service that brings the same AWS infrastructure, services, APIs, and tools to virtually any data center, colocation space, manufacturing floor, or on-premises facility where it might be needed. With Outposts, you can run some AWS services on-premises and connect to a broad range of services available in the local AWS Region. Outposts supports workloads requiring low latency, local data processing, data residency, and application migration.

Outposts capacity is driven as per your compute and storage requirements to run workloads. You can monitor Outposts resources using metrics gathered by Amazon CloudWatch. Using these metrics, you can effectively monitor and manage the Outposts resources as they would in the Region, levereging cloud native tools such as CloudWatch dashboards. Check the Monitoring best practices for AWS Outposts blog post to dive deep into the available monitoring options for Outposts.

CloudWatch dashboards are customizable home pages in the CloudWatch console that can be used to monitor resources running on Outposts in a single view. For example, you can monitor in a single pane the number Amazon EC2 instances used per EC2 instance type, the available capacity of Amazon EBS volumes and Amazon S3 buckets, and the operational status of the service link of Outposts.

As a you start deploying additional Outposts resources as a part of their capacity expansion, they must all be integrated and visualized within CloudWatch in an automated way. Traditionally CloudWatch dashboards are built manually and may be time consuming to tune. This post provides also an overview of building CloudWatch dashboards in an automated way using AWS Cloud Development Kit (AWS CDK).

Overview

CloudWatch metrics available to monitor Outposts resources and capacity

CloudWatch metrics for Outposts are available to customers in all public AWS Regions and AWS GovCloud (US) at no additional cost. We can classify the available metrics in two main categories:

To identify the metrics published under the service specific namespaces, we can leverage metadata in the form of tags. A tag is a label that you assign to an AWS resource and consists of a key and an optional value. For the purpose of the monitoring strategy described in this post, we use a tag that contains the OutpostID of the Outpost where the resource is deployed. In this way, we can easily filter the CloudWatch metrics that we would like to show in our dashboard.

To enforce the assignment of tags to our resources we can implement a tagging strategy using AWS tag Policies and Service Control Policies (SCPs).

The following sections describe two different methods to build a CloudWatch dashboard that includes the different types of metrics described so far. In both cases, we see how particularly useful the presence of tags is to identify the service-specific metrics.

Manual approach to building a CloudWatch dashboard for Outposts

This section describes a manual (i.e., non-automated) approach to building a dashboard that could summarize both the capacity utilization metrics and the service specific metrics for your resources running on Outposts.

The benefit of this approach is that we can implement a fully operational dashboard directly from the CloudWatch console. However, it will simultaneously require more effort to properly tune the dashboard to satisfy your monitoring requirements.

You can start creating the dashboard opening the CloudWatch console and following the steps listed in the public documentation.

To display a metric under AWS/Outposts namespace we can choose any of the widgets available. Based on the nature of the data, we can choose different types of Widgets such as Number, Line, Gauge, Explorer, or you can even build your own custom widget.

Together with the Widget type, we must select Outposts namespace in the metric graph dialog box and then navigate to the specific metric of interest.

In case we are creating the dashboard in a different account than the Outposts owner, we must select the right account in the View data drop-down menu to see the Outposts metric in which we are interested.

View data drop-down menu

After selecting one or more metrics we can select Create widget button.

For the service specific metrics, we recommend using the explorer widget. In this way, we can utilize the tagging strategy described earlier to automatically identify the metrics belonging to the resources running on Outposts. Check the documentation page for a step-by-step guide for creating an explorer widget based on tags.

Automated outpost dashboard

After we’ve seen how to build a dashboard manually from the console, in this secton we describe an automated approach to deploy a dashboard for Outposts through AWS CDK.

AWS CDK is an open source software development framework to model and provision your cloud application resources using familiar programming languages, including TypeScript, JavaScript, Python, C#, and Java. For the solution in this post, we use Python.

Architecture overview

The AWS CDK stack described in this post, assumes that the resources running on Outposts (EC2 instances, S3 buckets, Application Load Balancers (ALBs), and RDS instances) are tagged using the tagging strategy described earlier.

Specifying a tag name and a tag value in a configuration file automatically discovers the resources with that tag and adds the related metrics to the CloudWatch dashboard.

Together with the service specific metrics, it creates a series of widgets that we can use to monitor the capacity available and utilized in each Outpost that belongs to the account where the script is running.

The workflow is made of the following phases:

  1. The AWS CDK stack creates an AWS CodeCommit repository and uploads its own code into it. The code contains a series of modules, one for each section of the CloudWatch dashboard. A section of the dashboard contains one or more widgets showing the metrics of a specific service.
  2. To maintain the CloudWatch dashboard always up-to-date with the resources matching the tag, it creates a pipeline in AWS CodePipeline that can dynamically create and or update the dashboard. The pipeline runs the code in the CodeCommit repository and is made of two stages. In the first one, the build stage, it builds the dependencies needed by the AWS CDK stack. In the second stage, the Deploy stage, it loads and runs the modules used to build the dashboard.
  3. Each module contains the code to automatically discover the tagged resources of a specific service. This discovery phase uses standard AWS APIs called through the Python SDK Boto3.
  4. Based on the results of the discovery phase, AWS CDK produces an AWS CloudFormation template containing the definition of the CloudWatch dashboard sections. The template is submitted to CloudFormation.
  5. CloudFormation creates or, if already defined, updates the CloudWatch dashboard.
  6. Together with the dashboard, the AWS CDK script also contains the definition of a CloudWatch Event that, once deployed, triggers the pipeline each time a resource tagged with the specified tag is created or destroyed.

Prerequisites

To implement the solution presented in this post, you must configure:

  1. git as distributed version control system.
  2. In case it is the first time that you’re using AWS CDK in this account and region, you must:

a. Install the AWS CDK, and its prerequisites, following these instructions.

b. Go through the AWS CDK bootstrapping process. This is required only for the first time that we use AWS CDK in a specific AWS environment (an AWS environment is a combination of an AWS account and Region).

How to install

Step 1: Clone the AWS CDK code hosted on GitHub with:

$ git clone https://github.com/aws-samples/automated-cloudwatch-dashboard.git

Step 2: enter the directory using the following:

$ cd  automated-cloudwatch-dashboard/

Step 3: Install the needed Python dependencies with:

$ pip install -r requirements.txt

Step 4: Modify the configuration file

Before deploying the stack, we must modify the configuration file to specify the tag we use for identifying our resources running on Outposts. Open the file with the name config.yaml with your preferred text editor and specify:

      • A name for the dashboard. The default name used is Automated-CloudWatch-Dashboard.
      • Replace <tag_name> placeholder following the tag_name variable with the tag name used to tag the resources that you want to include in the dashboard.
      • Replace <tag_value> placeholder under tag_values variable with the tag value that you used.

Here is an example config.yaml configuration file:

dashboard_name: Automated-CloudWatch-Dahsboard
tag_name: OutpostID
tag_values:
  - op-1234567890abcdefg 

Stack deployment

We can deploy the stack with the following:

$ cdk deploy

At the end of the deployment process, the pipeline that creates the dashboard is provisioned. You can now go to your CloudWatch console to view it.

Automated Outposts dashboard overview

Now that we have built our dashboard, let’s review each section:

  1. Outpost capacity

Outpost Capacity diagram

The AWS CDK stacks define a capacity section for each Outpost available to the AWS account where the script runs.

In this section, we find four widgets showing metrics published under the AWS/Outpost namespace. The first widget shows for each EC2 instance type available on the Outposts the number of instances utilized and available for that instance type. In the second row, we can visualize the available capacity for the Amazon EBS volumes and for the S3 buckets. The last widget shows the operational status of the service link of Outposts.

2. EC2 instances

CPU, Network, and Disk Utilization for an EC2 instance diagram

In this section of the dashboard, we find the metrics showing the CPU, Network, and Disk Utilization for an EC2 instance. It has defined a section of this type for each EC2 instance with a tag assigned matching the name and the value specified in the configuration file of the script.

3. Application Load Balancer

The ALB section aggregates metrics showing the operational status of a load balancer hosted on Outposts

The ALB section aggregates metrics showing the operational status of a load balancer hosted on Outposts. A section of this type is defined for each ALB with an assigned tag matching the one specified in the configuration file.

4. S3 buckets

The S3 buckets section diagram

The S3 buckets section is defined only once and aggregates the utilization metrics for all S3 buckets with an assigned tag.

5. AutoScaling group

The AutoScaling group section diagram

The AutoScaling group section can be used to monitor the number of instances in service in a specific AS group with a tag assigned. This section is defined once and can aggregate the metrics for multiple AutoScaling groups.

Clean up

To terminate the resources that we created in this post, run the following:

$ cdk destroy

Then, go to the Cloudformation console and delete the stack with the name “Deploy-AutomatedCloudWatchDashboard”.

Conclusion

In conclusion, this post demonstrates a manual way of creating CloudWatch Metrics dashboard using the CloudWatch console and an automated way using AWS CDK. The automated approach is also scalable by automatically discovering any new resources added to the existing Outposts in the your environment without any changes to the code.

Integrating DevOps Guru Insights with CloudWatch Dashboard

Post Syndicated from Suresh Babu original https://aws.amazon.com/blogs/devops/integrating-devops-guru-insights-with-cloudwatch-dashboard/

Many customers use Amazon CloudWatch dashboards to monitor applications and often ask how they can integrate Amazon DevOps Guru Insights in order to have a unified dashboard for monitoring.  This blog post showcases integrating DevOps Guru proactive and reactive insights to a CloudWatch dashboard by using Custom Widgets. It can help you to correlate trends over time and spot issues more efficiently by displaying related data from different sources side by side and to have a single pane of glass visualization in the CloudWatch dashboard.

Amazon DevOps Guru is a machine learning (ML) powered service that helps developers and operators automatically detect anomalies and improve application availability. DevOps Guru’s anomaly detectors can proactively detect anomalous behavior even before it occurs, helping you address issues before they happen; detailed insights provide recommendations to mitigate that behavior.

Amazon CloudWatch dashboard is a customizable home page in the CloudWatch console that monitors multiple resources in a single view. You can use CloudWatch dashboards to create customized views of the metrics and alarms for your AWS resources.

Solution overview

This post will help you to create a Custom Widget for Amazon CloudWatch dashboard that displays DevOps Guru Insights. A custom widget is part of your CloudWatch dashboard that calls an AWS Lambda function containing your custom code. The Lambda function accepts custom parameters, generates your dataset or visualization, and then returns HTML to the CloudWatch dashboard. The CloudWatch dashboard will display this HTML as a widget. In this post, we are providing sample code for the Lambda function that will call DevOps Guru APIs to retrieve the insights information and displays as a widget in the CloudWatch dashboard. The architecture diagram of the solution is below.

Solution Architecture

Figure 1: Reference architecture diagram

Prerequisites and Assumptions

  • An AWS account. To sign up:
  • DevOps Guru should be enabled in the account. For enabling DevOps guru, see DevOps Guru Setup
  • Follow this Workshop to deploy a sample application in your AWS Account which can help generate some DevOps Guru insights.

Solution Deployment

We are providing two options to deploy the solution – using the AWS console and AWS CloudFormation. The first section has instructions to deploy using the AWS console followed by instructions for using CloudFormation. The key difference is that we will create one Widget while using the Console, but three Widgets are created when we use AWS CloudFormation.

Using the AWS Console:

We will first create a Lambda function that will retrieve the DevOps Guru insights. We will then modify the default IAM role associated with the Lambda function to add DevOps Guru permissions. Finally we will create a CloudWatch dashboard and add a custom widget to display the DevOps Guru insights.

  1. Navigate to the Lambda Console after logging to your AWS Account and click on Create function.

    Figure 2a: Create Lambda Function

    Figure 2a: Create Lambda Function

  2. Choose Author from Scratch and use the runtime Node.js 16.x. Leave the rest of the settings at default and create the function.

    Figure 2b: Create Lambda Function

    Figure 2b: Create Lambda Function

  3. After a few seconds, the Lambda function will be created and you will see a code source box. Copy the code from the text box below and replace the code present in code source as shown in screen print below.
    // SPDX-License-Identifier: MIT-0
    // CloudWatch Custom Widget sample: displays count of Amazon DevOps Guru Insights
    const aws = require('aws-sdk');
    
    const DOCS = `## DevOps Guru Insights Count
    Displays the total counts of Proactive and Reactive Insights in DevOps Guru.
    `;
    
    async function getProactiveInsightsCount(DevOpsGuru, StartTime, EndTime) {
        let NextToken = null;
        let proactivecount=0;
    
        do {
            const args = { StatusFilter: { Any : { StartTimeRange: { FromTime: StartTime, ToTime: EndTime }, Type: 'PROACTIVE'  }}}
            const result = await DevOpsGuru.listInsights(args).promise();
            console.log(result)
            NextToken = result.NextToken;
            result.ProactiveInsights.forEach(res =&gt; {
            console.log(result.ProactiveInsights[0].Status)
            proactivecount++;
            });
            } while (NextToken);
        return proactivecount;
    }
    
    async function getReactiveInsightsCount(DevOpsGuru, StartTime, EndTime) {
        let NextToken = null;
        let reactivecount=0;
    
        do {
            const args = { StatusFilter: { Any : { StartTimeRange: { FromTime: StartTime, ToTime: EndTime }, Type: 'REACTIVE'  }}}
            const result = await DevOpsGuru.listInsights(args).promise();
            NextToken = result.NextToken;
            result.ReactiveInsights.forEach(res =&gt; {
            reactivecount++;
            });
            } while (NextToken);
        return reactivecount;
    }
    
    function getHtmlOutput(proactivecount, reactivecount, region, event, context) {
    
        return `DevOps Guru Proactive Insights&lt;br&gt;&lt;font size="+10" color="#FF9900"&gt;${proactivecount}&lt;/font&gt;
        &lt;p&gt;DevOps Guru Reactive Insights&lt;/p&gt;&lt;font size="+10" color="#FF9900"&gt;${reactivecount}`;
    }
    
    exports.handler = async (event, context) =&gt; {
        if (event.describe) {
            return DOCS;
        }
        const widgetContext = event.widgetContext;
        const timeRange = widgetContext.timeRange.zoom || widgetContext.timeRange;
        const StartTime = new Date(timeRange.start);
        const EndTime = new Date(timeRange.end);
        const region = event.region || process.env.AWS_REGION;
        const DevOpsGuru = new aws.DevOpsGuru({ region });
    
        const proactivecount = await getProactiveInsightsCount(DevOpsGuru, StartTime, EndTime);
        const reactivecount = await getReactiveInsightsCount(DevOpsGuru, StartTime, EndTime);
    
        return getHtmlOutput(proactivecount, reactivecount, region, event, context);
        
    };

    Figure 3: Lambda Function Source Code

    Figure 3: Lambda Function Source Code

  4. Click on Deploy to save the function code
  5. Since we used the default settings while creating the function, a default Execution role is created and associated with the function. We will need to modify the IAM role to grant DevOps Guru permissions to retrieve Proactive and Reactive insights.
  6. Click on the Configuration tab and select Permissions from the left side option list. You can see the IAM execution role associated with the function as shown in figure 4.

    Figure 4: Lambda function execution role

    Figure 4: Lambda function execution role

  7. Click on the IAM role name to open the role in the IAM console. Click on Add Permissions and select Attach policies.

    Figure 5: IAM Role Update

    Figure 5: IAM Role Update

  8. Search for DevOps and select the AmazonDevOpsGuruReadOnlyAccess. Click on Add permissions to update the IAM role.

    Figure 6: IAM Role Policy Update

    Figure 6: IAM Role Policy Update

  9. Now that we have created the Lambda function for our custom widget and assigned appropriate permissions, we can navigate to CloudWatch to create a Dashboard.
  10. Navigate to CloudWatch and click on dashboards from the left side list. You can choose to create a new dashboard or add the widget in an existing dashboard.
  11. We will choose to create a new dashboard

    Figure 7: Create New CloudWatch dashboard

    Figure 7: Create New CloudWatch dashboard

  12. Choose Custom Widget in the Add widget page

    Figure 8: Add widget

    Figure 8: Add widget

  13. Click Next in the custom widge page without choosing a sample

    Figure 9: Custom Widget Selection

    Figure 9: Custom Widget Selection

  14. Choose the region where devops guru is enabled. Select the Lambda function that we created earlier. In the preview pane, click on preview to view DevOps Guru metrics. Once the preview is successful, create the Widget.

    Figure 10: Create Custom Widget

    Figure 10: Create Custom Widget

  15. Congratulations, you have now successfully created a CloudWatch dashboard with a custom widget to get insights from DevOps Guru. The sample code that we provided can be customized to suit your needs.

Using AWS CloudFormation

You may skip this step and move to future scope section if you have already created the resources using AWS Console.

In this step we will show you how to  deploy the solution using AWS CloudFormation. AWS CloudFormation lets you model, provision, and manage AWS and third-party resources by treating infrastructure as code. Customers define an initial template and then revise it as their requirements change. For more information on CloudFormation stack creation refer to  this blog post.

The following resources are created.

  • Three Lambda functions that will support CloudWatch Dashboard custom widgets
  • An AWS Identity and Access Management (IAM) role to that allows the Lambda function to access DevOps Guru Insights and to publish logs to CloudWatch
  • Three Log Groups under CloudWatch
  • A CloudWatch dashboard with widgets to pull data from the Lambda Functions

To deploy the solution by using the CloudFormation template

  1. You can use this downloadable template  to set up the resources. To launch directly through the console, choose Launch Stack button, which creates the stack in the us-east-1 AWS Region.
  2. Choose Next to go to the Specify stack details page.
  3. (Optional) On the Configure Stack Options page, enter any tags, and then choose Next.
  4. On the Review page, select I acknowledge that AWS CloudFormation might create IAM resources.
  5. Choose Create stack.

It takes approximately 2-3 minutes for the provisioning to complete. After the status is “Complete”, proceed to validate the resources as listed below.

Validate the resources

Now that the stack creation has completed successfully, you should validate the resources that were created.

  • On AWS Console, head to CloudWatch, under Dashboards – there will be a dashboard created with name <StackName-Region>.
  • On AWS Console, head to CloudWatch, under LogGroups there will be 3 new log-groups created with the name as:
    • lambdaProactiveLogGroup
    • lambdaReactiveLogGroup
    • lambdaSummaryLogGroup
  • On AWS Console, head to Lambda, there will be lambda function(s) under the name:
    • lambdaFunctionDGProactive
    • lambdaFunctionDGReactive
    • lambdaFunctionDGSummary
  • On AWS Console, head to IAM, under Roles there will be a new role created with name “lambdaIAMRole”

To View Results/Outcome

With the appropriate time-range setup on CloudWatch Dashboard, you will be able to navigate through the insights that have been generated from DevOps Guru on the CloudWatch Dashboard.

Figure 11: DevOpsGuru Insights in Cloudwatch Dashboard

Figure 11: DevOpsGuru Insights in Cloudwatch Dashboard

Cleanup

For cost optimization, after you complete and test this solution, clean up the resources. You can delete them manually if you used the AWS Console or by deleting the AWS CloudFormation stack called devopsguru-cloudwatch-dashboard if you used AWS CloudFormation.

For more information on deleting the stacks, see Deleting a stack on the AWS CloudFormation console.

Conclusion

This blog post outlined how you can integrate DevOps Guru insights into a CloudWatch Dashboard. As a customer, you can start leveraging CloudWatch Custom Widgets to include DevOps Guru Insights in an existing Operational dashboard.

AWS Customers are now using Amazon DevOps Guru to monitor and improve application performance. You can start monitoring your applications by following the instructions in the product documentation. Head over to the Amazon DevOps Guru console to get started today.

To learn more about AIOps for Serverless using Amazon DevOps Guru check out this video.

Suresh Babu

Suresh Babu is a DevOps Consultant at Amazon Web Services (AWS) with 21 years of experience in designing and implementing software solutions from various industries. He helps customers in Application Modernization and DevOps adoption. Suresh is a passionate public speaker and often speaks about DevOps and Artificial Intelligence (AI)

Venkat Devarajan

Venkat Devarajan is a Senior Solutions Architect at Amazon Webservices (AWS) supporting enterprise automotive customers. He has over 18 years of industry experience in helping customers design, build, implement and operate enterprise applications.

Ashwin Bhargava

Ashwin is a DevOps Consultant at AWS working in Professional Services Canada. He is a DevOps expert and a security enthusiast with more than 15 years of development and consulting experience.

Murty Chappidi

Murty is an APJ Partner Solutions Architecture Lead at Amazon Web Services with a focus on helping customers with accelerated and seamless journey to AWS by providing solutions through our GSI partners. He has more than 25 years’ experience in software and technology and has worked in multiple industry verticals. He is the APJ SME for AI for DevOps Focus Area. In his free time, he enjoys gardening and cooking.

Optimizing Amazon EC2 Spot Instances with Spot Placement Scores

Post Syndicated from Sheila Busser original https://aws.amazon.com/blogs/compute/optimizing-amazon-ec2-spot-instances-with-spot-placement-scores/

This blog post is written by Steve Cole, Principal Specialist SA, and Robert McCone, Sr. Specialist SA.

Getting the compute resources you need, even vCPUS numbering in the millions, and completing a workload using Amazon EC2 Spot Instances is just a configuration away. In this post you will learn how to use Spot placement scores to reduce interruptions, acquire greater capacity, and identify optimal configurations, times, and locations to run workloads on Spot Instances. Amazon EC2 Spot Instances let you take advantage of unused EC2 capacity in the AWS cloud and are available at up to a 90% discount compared to On-Demand prices. Spot placement scores is a feature that many customers use to identify optimal instance types or to choose the best Availability Zone (AZ) for ephemeral work like data analytics or high-performance computing. As a real-time tool, Spot placement scores are often integrated into deployment automation. However, because of its logging and graphic capabilities, you may find it be a valuable resource even before you launch a workload into the cloud. Now available through AWS Labs, a Github repository hosting tools for customers, the Spot placement score tracker tackles the undifferentiated heavy lifting and can do this for any customer.

About Spot placement score

Spot placement scores are a feature available through AWS APIs – also implemented in the Amazon EC2 Spot requests console – that uses internal capacity and interruption data to scrutinize the size and shape of a Spot Instance request and responds with a “likelihood of success” rating of 1 to imply lower likelihood of success and 10 to imply higher likelihood of success. The score represents confidence in being able to acquire the desired capacity (size) using the instance configuration (shape) for the next few hours. The shape of the request can be a list of specific instances or can be requirements-based with attribute-based instance type selection. The size of the request can be instance count, number of vCPUs, or GB of RAM. It’s based on known capacity, allocation strategies, and the trending of capacities over time.

Before the release of Spot placement score, customers could track the trends of their existing workloads and configurations. This might have helped them to anticipate capacity constraints over time, but the ability to do something more meaningful when assessing configurations was something customers requested often. With the launch of Spot placement score, that capability was delivered and enabled customers to receive guidance on how a configuration change might affect the effectiveness of Spot Instances in a workload.

Customers immediately recognized the power of this new feature and started writing tooling around their workloads to incorporate the new functionality provided by Spot placement scores. For examples, customers leveraged Spot placement scores to find the highest scoring AZ in a region for work that requires low latency within a cluster. Customers running data analytics with services like Amazon EMR could more confidently launch clusters on Spot Instances. This reduces costs and the time necessary to process data because of fewer interruptions. Financial customers, health care and life sciences, and high tech were some of the early adopters of this strategy.

Benefits of Spot placement scores

One specific customer used tools like the Spot instance advisor and Spot pricing history tools to make decisions about what instances to run every night. If the customer’s analytics workload received too many interruptions, then it would inevitably be relaunched using On-Demand Instances, increasing costs and time-to-complete. The addition of Spot placement scores to the customer’s tooling allowed for more informed decisions about which configurations worked best and, more specifically, which AZ(s) to use. Ultimately, this led not only to higher confidence in using Spot instances, but also to significant cost savings over time.

Other customers tracked Spot placement scores over time with regular queries stored in time series databases to identify not only the best configuration or location, but also the best time-of-day or day-of-week to run their workloads. Different configurations of instance types were queried through automation and the results were logged into a time series database that could then be presented as graphs. These graphs were scrutinized, configurations were tuned, and ultimately these customers could take greater advantage of the cost optimization that Spot instances offer through fewer interruptions by running their workloads where and when scores were higher.

AWS was interested in how this solved problems for customers, and after some more research with customers and design ideation, led to the creation of an OSS tool that AWS has recently released: Spot placement score tracker. Spot placement score tracker helps customers evaluate different configurations against multiple times and locations. It’s an AWS-native solution that leverages the Spot placement score API along with AWS Lambda and Amazon CloudWatch to create a dashboard that enables any AWS customer to benefit from this model without having to write it themselves.

How to use the Spot placement score tracker

The project provides Infrastructure as Code (IaC) automation using the AWS Cloud Development Kit (AWS CDK) to deploy the infrastructure and permissions required to run Lambda. This gets executed every five minutes to collect the placement scores of as many diversified configurations as defined.

Architectural diagram: CDK building connections between EventBridge, Lambda, S3, and CloudWatch to generate dashboards

After installing the CloudWatch dashboard, and given some time to collect and record data, you will be provided valuable insights in an intuitive graph such as those in the following example.

Sample CloudWatch dashboard with four graphs showing Spot placement score results over time for different configurations

Insights available through the Spot placement score tracker

The first thing you may notice by observing data over time is that instance diversification is the primary driver of high placement scores. This has always been a best practice for the use of Spot Instances, and it extends to On-Demand Instances as well. In short, if you can only run on one instance type, then the likelihood of experiencing interruptions is far greater than if you can run on six or twelve. Sometimes the simple inclusion of -a, -d, and -n instance types (e.g. m5.large, m5a.large, m5d.large, m5d.large), previous generations (e.g., m5.large, m4.large), different sizes in a container environment (e.g., m5.large, m5.xlarge, m5.2xlarge), and even the inclusion of AWS Graviton will have a material impact on placement scores, which equates to fewer interruptions. This ultimately leads to more efficient use of resources through less restarted processes, resulting in increased efficiency and reduced costs.

The second insight that you can realize through the use of placement scores over time is identifying the optimal AZ in which an ephemeral process can be placed. Perhaps the best use case for this type of insight is data analytics clusters that are launched to complete many calculations overnight. This is common in financial institutions for various reasons including risk analysis and compliance, but could apply to medical research examining results of experiments during the day as well as other situations where a 24/7 presence isn’t required by the workload. These customers are typically using a single AZ to allow for faster communication between nodes and to reduce data transfer costs. Therefore, the ability for Spot placement scores to provide different scores for different AZs is highly advantageous.

Third, with access to placement scores over time, it becomes possible to identify exactly how large a workload’s footprint can be. By submitting identical configurations to Spot placement scores but with different sizes, you can surface the ideal workload size. Not too small, where perhaps the job takes too long to complete, but also not so large that the interruptions are too frequent and cause restarts too often. This can benefit not only ephemeral workloads, but also persistent clusters or fleets by understanding what the lowest score would be over time and giving you solid information regarding what they can expect from Spot Instances and where. This might inform you to be ready to launch On-Demand Instances to compensate when Spot Instance availability is lower. This can also help to forecast pricing and inform decisions about the consideration of AWS Savings Plans or On-Demand Capacity Reservations.

Finally, analyzing Spot placement scores over time can provide regional scoring. Through this lens it’s possible for you to identify entire regions that they may have overlooked without the knowledge that Spot Instances outside the your primary region(s) might offer lower interruptions during daylight hours due to them being off-peak. When it’s possible to place a workload in another region, unconstrained by local data access requirements, it’s quite possible to harness the compute of a significant footprint in locations that are otherwise un(der)-utilized. Workloads that require less data transfer and more compute can benefit tremendously from access to Spot Instances in other regions. For example, things like build servers might run extraordinarily well in Europe during North American business hours and the reduction in compute cost might offset the data transfer to complete the job.

Conclusion

Spot placement scores can be used to make decisions about how, when, and where Spot Instances can be most efficiently utilized to deliver business needs, and at greatly reduced prices. We’re very excited to release this tool to enable you to tap into information which was previously unavailable and make data-driven decisions for your business. The information in this post, combined with the output of placement scores over time, is a significant evolution.

Install the Spot placement score tracker today, configure it to match an existing Spot workload, and see how you might perform at different times or different locations.  Explore more robust options and discover greater capacity and lower interruptions. Or investigate how On-Demand workloads could migrate to Spot Instances.

Optimizing GPU utilization for AI/ML workloads on Amazon EC2

Post Syndicated from Sheila Busser original https://aws.amazon.com/blogs/compute/optimizing-gpu-utilization-for-ai-ml-workloads-on-amazon-ec2/

­­­­This blog post is written by Ben Minahan, DevOps Consultant, and Amir Sotoodeh, Machine Learning Engineer.

Machine learning workloads can be costly, and artificial intelligence/machine learning (AI/ML) teams can have a difficult time tracking and maintaining efficient resource utilization. ML workloads often utilize GPUs extensively, so typical application performance metrics such as CPU, memory, and disk usage don’t paint the full picture when it comes to system performance. Additionally, data scientists conduct long-running experiments and model training activities on existing compute instances that fit their unique specifications. Forcing these experiments to be run on newly provisioned infrastructure with proper monitoring systems installed might not be a viable option.

In this post, we describe how to track GPU utilization across all of your AI/ML workloads and enable accurate capacity planning without needing teams to use a custom Amazon Machine Image (AMI) or to re-deploy their existing infrastructure. You can use Amazon CloudWatch to track GPU utilization, and leverage AWS Systems Manager Run Command to install and configure the agent across your existing fleet of GPU-enabled instances.

Overview

First, make sure that your existing Amazon Elastic Compute Cloud (Amazon EC2) instances have the Systems Manager Agent installed, and also have the appropriate level of AWS Identity and Access Management (IAM) permissions to run the Amazon CloudWatch Agent. Next, specify the configuration for the CloudWatch Agent in Systems Manager Parameter Store, and then deploy the CloudWatch Agent to our GPU-enabled EC2 instances. Finally, create a CloudWatch Dashboard to analyze GPU utilization.

Architecture Diagram depicting the integration between AWS Systems Manager with RunCommand Arguments stored in SSM Parameter Store, your Amazon GPU enabled EC2 instance with installed Amazon CloudWatch Agen­t, and Amazon CloudWatch Dashboard that aggregates and displays the ­reported metrics.

  1. Install the CloudWatch Agent on your existing GPU-enabled EC2 instances.
  2. Your CloudWatch Agent configuration is stored in Systems Manager Parameter Store.
  3. Systems Manager Documents are used to install and configure the CloudWatch Agent on your EC2 instances.
  4. GPU metrics are published to CloudWatch, which you can then visualize through the CloudWatch Dashboard.

Prerequisites

This post assumes you already have GPU-enabled EC2 workloads running in your AWS account. If the EC2 instance doesn’t have any GPUs, then the custom configuration won’t be applied to the CloudWatch Agent. Instead, the default configuration is used. For those instances, leveraging the CloudWatch Agent’s default configuration is better suited for tracking resource utilization.

For the CloudWatch Agent to collect your instance’s GPU metrics, the proper NVIDIA drivers must be installed on your instance. Several AWS official AMIs including the Deep Learning AMI already have these drivers installed. To see a list of AMIs with the NVIDIA drivers pre-installed, and for full installation instructions for Linux-based instances, see Install NVIDIA drivers on Linux instances.

Additionally, deploying and managing the CloudWatch Agent requires the instances to be running. If your instances are currently stopped, then you must start them to follow the instructions outlined in this post.

Preparing your EC2 instances

You utilize Systems Manager to deploy the CloudWatch Agent, so make sure that your EC2 instances have the Systems Manager Agent installed. Many AWS-provided AMIs already have the Systems Manager Agent installed. For a full list of the AMIs which have the Systems Manager Agent pre-installed, see Amazon Machine Images (AMIs) with SSM Agent preinstalled. If your AMI doesn’t have the Systems Manager Agent installed, see Working with SSM Agent for instructions on installing based on your operating system (OS).

Once installed, the CloudWatch Agent needs certain permissions to accept commands from Systems Manager, read Systems Manager Parameter Store entries, and publish metrics to CloudWatch. These permissions are bundled into the managed IAM policies AmazonEC2RoleforSSM, AmazonSSMReadOnlyAccess, and CloudWatchAgentServerPolicy. To create a new IAM role and associated IAM instance profile with these policies attached, you can run the following AWS Command Line Interface (AWS CLI) commands, replacing <REGION_NAME> with your AWS region, and <INSTANCE_ID> with the EC2 Instance ID that you want to associate with the instance profile:

aws iam create-role --role-name CloudWatch-Agent-Role --assume-role-policy-document  '{"Statement":{"Effect":"Allow","Principal":{"Service":"ec2.amazonaws.com"},"Action":"sts:AssumeRole"}}'
aws iam attach-role-policy --role-name CloudWatch-Agent-Role --policy-arn arn:aws:iam::aws:policy/service-role/AmazonEC2RoleforSSM
aws iam attach-role-policy --role-name CloudWatch-Agent-Role --policy-arn arn:aws:iam::aws:policy/AmazonSSMReadOnlyAccess
aws iam attach-role-policy --role-name CloudWatch-Agent-Role --policy-arn arn:aws:iam::aws:policy/CloudWatchAgentServerPolicy
aws iam create-instance-profile --instance-profile-name CloudWatch-Agent-Instance-Profile
aws iam add-role-to-instance-profile --instance-profile-name CloudWatch-Agent-Instance-Profile --role-name CloudWatch-Agent-Role
aws ec2 associate-iam-instance-profile --region <REGION_NAME> --instance-id <INSTANCE_ID> --iam-instance-profile Name=CloudWatch-Agent-Instance-Profile

Alternatively, you can attach the IAM policies to your existing IAM role associated with an existing IAM instance profile.

aws iam attach-role-policy --role-name <ROLE_NAME> --policy-arn arn:aws:iam::aws:policy/service-role/AmazonEC2RoleforSSM
aws iam attach-role-policy --role-name <ROLE_NAME> --policy-arn arn:aws:iam::aws:policy/AmazonSSMReadOnlyAccess
aws iam attach-role-policy --role-name <ROLE_NAME> --policy-arn arn:aws:iam::aws:policy/CloudWatchAgentServerPolicy
aws ec2 associate-iam-instance-profile --region <REGION_NAME> --instance-id <INSTANCE_ID> --iam-instance-profile Name=<INSTANCE_PROFILE>

Once complete, you should see that your EC2 instance is associated with the appropriate IAM role.

An Amazon EC2 Instance with the CloudWatch-Agent-Role IAM Role attached

This role should have the AmazonEC2RoleforSSM, AmazonSSMReadOnlyAccess and CloudWatchAgentServerPolicy IAM policies attached.

The CloudWatch-Agent-Role IAM Role’s attached permission policies, Amazon EC2 Role for SSM, CloudWatch Agent Server ¬Policy, and Amazon SSM Read Only Access

Configuring and deploying the CloudWatch Agent

Before deploying the CloudWatch Agent onto our EC2 instances, make sure that those agents are properly configured to collect GPU metrics. To do this, you must create a CloudWatch Agent configuration and store it in Systems Manager Parameter Store.

Copy the following into a file cloudwatch-agent-config.json:

{
    "agent": {
        "metrics_collection_interval": 60,
        "run_as_user": "cwagent"
    },
    "metrics": {
        "aggregation_dimensions": [
            [
                "InstanceId"
            ]
        ],
        "append_dimensions": {
            "AutoScalingGroupName": "${aws:AutoScalingGroupName}",
            "ImageId": "${aws:ImageId}",
            "InstanceId": "${aws:InstanceId}",
            "InstanceType": "${aws:InstanceType}"
        },
        "metrics_collected": {
            "cpu": {
                "measurement": [
                    "cpu_usage_idle",
                    "cpu_usage_iowait",
                    "cpu_usage_user",
                    "cpu_usage_system"
                ],
                "metrics_collection_interval": 60,
                "resources": [
                    "*"
                ],
                "totalcpu": false
            },
            "disk": {
                "measurement": [
                    "used_percent",
                    "inodes_free"
                ],
                "metrics_collection_interval": 60,
                "resources": [
                    "*"
                ]
            },
            "diskio": {
                "measurement": [
                    "io_time"
                ],
                "metrics_collection_interval": 60,
                "resources": [
                    "*"
                ]
            },
            "mem": {
                "measurement": [
                    "mem_used_percent"
                ],
                "metrics_collection_interval": 60
            },
            "swap": {
                "measurement": [
                    "swap_used_percent"
                ],
                "metrics_collection_interval": 60
            },
            "nvidia_gpu": {
                "measurement": [
                    "utilization_gpu",
                    "temperature_gpu",
                    "utilization_memory",
                    "fan_speed",
                    "memory_total",
                    "memory_used",
                    "memory_free",
                    "pcie_link_gen_current",
                    "pcie_link_width_current",
                    "encoder_stats_session_count",
                    "encoder_stats_average_fps",
                    "encoder_stats_average_latency",
                    "clocks_current_graphics",
                    "clocks_current_sm",
                    "clocks_current_memory",
                    "clocks_current_video"
                ],
                "metrics_collection_interval": 60
            }
        }
    }
}

Run the following AWS CLI command to deploy a Systems Manager Parameter CloudWatch-Agent-Config, which contains a minimal agent configuration for GPU metrics collection. Replace <REGION_NAME> with your AWS Region.

aws ssm put-parameter \
--region <REGION_NAME> \
--name CloudWatch-Agent-Config \
--type String \
--value file://cloudwatch-agent-config.json

Now you can see a CloudWatch-Agent-Config parameter in Systems Manager Parameter Store, containing your CloudWatch Agent’s JSON configuration.

CloudWatch-Agent-Config stored in Systems Manager Parameter Store

Next, install the CloudWatch Agent on your EC2 instances. To do this, you can leverage Systems Manager Run Command, specifically the AWS-ConfigureAWSPackage document which automates the CloudWatch Agent installation.

  1. Run the following AWS CLI command, replacing <REGION_NAME> with the Region into which your instances are deployed, and <INSTANCE_ID> with the EC2 Instance ID on which you want to install the CloudWatch Agent.
aws ssm send-command \
--query 'Command.CommandId' \
--region <REGION_NAME> \
--instance-ids <INSTANCE_ID> \
--document-name AWS-ConfigureAWSPackage \
--parameters '{"action":["Install"],"installationType":["In-place update"],"version":["latest"],"name":["AmazonCloudWatchAgent"]}'

2. To monitor the status of your command, use the get-command-invocation AWS CLI command. Replace <COMMAND_ID> with the command ID output from the previous step, <REGION_NAME> with your AWS region, and <INSTANCE_ID> with your EC2 instance ID.

aws ssm get-command-invocation --query Status --region <REGION_NAME> --command-id <COMMAND_ID> --instance-id <INSTANCE_ID>

3.Wait for the command to show the status Success before proceeding.

$ aws ssm send-command \
	 --query 'Command.CommandId' \
    --region us-east-2 \
    --instance-ids i-0123456789abcdef \
    --document-name AWS-ConfigureAWSPackage \
    --parameters '{"action":["Install"],"installationType":["Uninstall and reinstall"],"version":["latest"],"additionalArguments":["{}"],"name":["AmazonCloudWatchAgent"]}'

"5d8419db-9c48-434c-8460-0519640046cf"

$ aws ssm get-command-invocation --query Status --region us-east-2 --command-id 5d8419db-9c48-434c-8460-0519640046cf --instance-id i-0123456789abcdef

"Success"

Repeat this process for all EC2 instances on which you want to install the CloudWatch Agent.

Next, configure the CloudWatch Agent installation. For this, once again leverage Systems Manager Run Command. However, this time the AmazonCloudWatch-ManageAgent document which applies your custom agent configuration is stored in the Systems Manager Parameter Store to your deployed agents.

  1. Run the following AWS CLI command, replacing <REGION_NAME> with the Region into which your instances are deployed, and <INSTANCE_ID> with the EC2 Instance ID on which you want to configure the CloudWatch Agent.
aws ssm send-command \
--query 'Command.CommandId' \
--region <REGION_NAME> \
--instance-ids <INSTANCE_ID> \
--document-name AmazonCloudWatch-ManageAgent \
--parameters '{"action":["configure"],"mode":["ec2"],"optionalConfigurationSource":["ssm"],"optionalConfigurationLocation":["/CloudWatch-Agent-Config"],"optionalRestart":["yes"]}'

2. To monitor the status of your command, utilize the get-command-invocation AWS CLI command. Replace <COMMAND_ID> with the command ID output from the previous step, <REGION_NAME> with your AWS region, and <INSTANCE_ID> with your EC2 instance ID.

aws ssm get-command-invocation --query Status --region <REGION_NAME> --command-id <COMMAND_ID> --instance-id <INSTANCE_ID>

3. Wait for the command to show the status Success before proceeding.

$ aws ssm send-command \
    --query 'Command.CommandId' \
    --region us-east-2 \
    --instance-ids i-0123456789abcdef \
    --document-name AmazonCloudWatch-ManageAgent \
    --parameters '{"action":["configure"],"mode":["ec2"],"optionalConfigurationSource":["ssm"],"optionalConfigurationLocation":["/CloudWatch-Agent-Config"],"optionalRestart":["yes"]}'

"9a4a5c43-0795-4fd3-afed-490873eaca63"

$ aws ssm get-command-invocation --query Status --region us-east-2 --command-id 9a4a5c43-0795-4fd3-afed-490873eaca63 --instance-id i-0123456789abcdef

"Success"

Repeat this process for all EC2 instances on which you want to install the CloudWatch Agent. Once finished, the CloudWatch Agent installation and configuration is complete, and your EC2 instances now report GPU metrics to CloudWatch.

Visualize your instance’s GPU metrics in CloudWatch

Now that your GPU-enabled EC2 Instances are publishing their utilization metrics to CloudWatch, you can visualize and analyze these metrics to better understand your resource utilization patterns.

The GPU metrics collected by the CloudWatch Agent are within the CWAgent namespace. Explore your GPU metrics using the CloudWatch Metrics Explorer, or deploy our provided sample dashboard.

  1. Copy the following into a file, cloudwatch-dashboard.json, replacing instances of <REGION_NAME> with your Region:
{
    "widgets": [
        {
            "height": 10,
            "width": 24,
            "y": 16,
            "x": 0,
            "type": "metric",
            "properties": {
                "metrics": [
                    [{"expression": "SELECT AVG(nvidia_smi_utilization_gpu) FROM SCHEMA(\"CWAgent\", InstanceId) GROUP BY InstanceId","id": "q1"}]
                ],
                "view": "timeSeries",
                "stacked": false,
                "region": "<REGION_NAME>",
                "stat": "Average",
                "period": 300,
                "title": "GPU Core Utilization",
                "yAxis": {
                    "left": {"label": "Percent","max": 100,"min": 0,"showUnits": false}
                }
            }
        },
        {
            "height": 7,
            "width": 8,
            "y": 0,
            "x": 0,
            "type": "metric",
            "properties": {
                "metrics": [
                    [{"expression": "SELECT AVG(nvidia_smi_utilization_gpu) FROM SCHEMA(\"CWAgent\", InstanceId)", "label": "Utilization","id": "q1"}]
                ],
                "view": "gauge",
                "stacked": false,
                "region": "<REGION_NAME>",
                "stat": "Average",
                "period": 300,
                "title": "Average GPU Core Utilization",
                "yAxis": {"left": {"max": 100, "min": 0}
                },
                "liveData": false
            }
        },
        {
            "height": 9,
            "width": 24,
            "y": 7,
            "x": 0,
            "type": "metric",
            "properties": {
                "metrics": [
                    [{ "expression": "SEARCH(' MetricName=\"nvidia_smi_memory_used\" {\"CWAgent\", InstanceId} ', 'Average')", "id": "m1", "visible": false }],
                    [{ "expression": "SEARCH(' MetricName=\"nvidia_smi_memory_total\" {\"CWAgent\", InstanceId} ', 'Average')", "id": "m2", "visible": false }],
                    [{ "expression": "SEARCH(' MetricName=\"mem_used_percent\" {CWAgent, InstanceId} ', 'Average')", "id": "m3", "visible": false }],
                    [{ "expression": "100*AVG(m1)/AVG(m2)", "label": "GPU", "id": "e2", "color": "#17becf" }],
                    [{ "expression": "AVG(m3)", "label": "RAM", "id": "e3" }]
                ],
                "view": "timeSeries",
                "stacked": false,
                "region": "<REGION_NAME>",
                "stat": "Average",
                "period": 300,
                "yAxis": {
                    "left": {"min": 0,"max": 100,"label": "Percent","showUnits": false}
                },
                "title": "Average Memory Utilization"
            }
        },
        {
            "height": 7,
            "width": 8,
            "y": 0,
            "x": 8,
            "type": "metric",
            "properties": {
                "metrics": [
                    [ { "expression": "SEARCH(' MetricName=\"nvidia_smi_memory_used\" {\"CWAgent\", InstanceId} ', 'Average')", "id": "m1", "visible": false } ],
                    [ { "expression": "SEARCH(' MetricName=\"nvidia_smi_memory_total\" {\"CWAgent\", InstanceId} ', 'Average')", "id": "m2", "visible": false } ],
                    [ { "expression": "100*AVG(m1)/AVG(m2)", "label": "Utilization", "id": "e2" } ]
                ],
                "sparkline": true,
                "view": "gauge",
                "region": "<REGION_NAME>",
                "stat": "Average",
                "period": 300,
                "yAxis": {
                    "left": {"min": 0,"max": 100}
                },
                "liveData": false,
                "title": "GPU Memory Utilization"
            }
        }
    ]
}

2. run the following AWS CLI command, replacing <REGION_NAME> with the name of your Region:

aws cloudwatch put-dashboard \
    --region <REGION_NAME> \
    --dashboard-name My-GPU-Usage \
    --dashboard-body file://cloudwatch-dashboard.json

View the My-GPU-Usage CloudWatch dashboard in the CloudWatch console for your AWS region..

An example CloudWatch dashboard, My-GPU-Usage, showing the GPU usage metrics over time.

Cleaning Up

To avoid incurring future costs for resources created by following along in this post, delete the following:

  1. My-GPU-Usage CloudWatch Dashboard
  2. CloudWatch-Agent-Config Systems Manager Parameter
  3. CloudWatch-Agent-Role IAM Role

Conclusion

By following along with this post, you deployed and configured the CloudWatch Agent across your GPU-enabled EC2 instances to track GPU utilization without pausing in-progress experiments and model training. Then, you visualized the GPU utilization of your workloads with a CloudWatch Dashboard to better understand your workload’s GPU usage and make more informed scaling and cost decisions. For other ways that Amazon CloudWatch can improve your organization’s operational insights, see the Amazon CloudWatch documentation.

Push Amazon EMR step logs from Amazon EC2 instances to Amazon CloudWatch logs

Post Syndicated from Nausheen Sayed original https://aws.amazon.com/blogs/big-data/push-amazon-emr-step-logs-from-amazon-ec2-instances-to-amazon-cloudwatch-logs/

Amazon EMR is a big data service offered by AWS to run Apache Spark and other open-source applications on AWS to build scalable data pipelines in a cost-effective manner. Monitoring the logs generated from the jobs deployed on EMR clusters is essential to help detect critical issues in real time and identify root causes quickly.

Pushing those logs into Amazon CloudWatch enables you to centralize and drive actionable intelligence from your logs to address operational issues without needing to provision servers or manage software. You can instantly begin writing queries with aggregations, filters, and regular expressions. In addition, you can visualize time series data, drill down into individual log events, and export query results to CloudWatch dashboards.

To ingest logs that are persisted on the Amazon Elastic Compute Cloud (Amazon EC2) instances of an EMR cluster into CloudWatch, you can use the CloudWatch agent. This provides a simple way to push logs from an EC2 instance to CloudWatch.

The CloudWatch agent is a software package that autonomously and continuously runs on your servers. You can install and configure the CloudWatch agent to collect system and application logs from EC2 instances, on-premises hosts, and containerized applications. CloudWatch processes and stores the logs collected by the CloudWatch agent, which further helps with the performance and health monitoring of your infrastructure and applications.

In this post, we create an EMR cluster and centralize the EMR step logs of the jobs in CloudWatch. This will make it easier for you to manage your EMR cluster, troubleshoot issues, and monitor performance. This solution is particularly helpful if you want to use CloudWatch to collect and visualize real-time logs, metrics, and event data, streamlining your infrastructure and application maintenance.

Overview of solution

The solution presented in this post is based on a specific configuration where the EMR step concurrency level is set to 1. This means that only one step is run at a time on the cluster. It’s important to note that if the EMR step concurrency level is set to a value greater than 1, the solution may not work as expected. We highly recommend verifying your EMR step concurrency configuration before implementing the solution presented in this post.

The following diagram illustrates the solution architecture.

Solution Architecture Diagram

The workflow includes the following steps:

  1. Users start an Apache Spark EMR job, creating a step on the EMR cluster. Using Apache Spark, the workload is distributed across the different nodes of the EMR cluster.
  2. In each node (EC2 instance) of the cluster, a CloudWatch agent watches different logs directories, capturing new entries in the log files and pushing them to CloudWatch.
  3. Users can view the step logs accessing the different log groups from the CloudWatch console. The step logs written by Amazon EMR are as follows:
    • controller — Information about the processing of the step. If your step fails while loading, you can find the stack trace in this log.
    • stderr — The standard error channel of Spark while it processes the step.
    • stdout — The standard output channel of Spark while it processes the step.

We provide an AWS CloudFormation template in this post as a general guide. The template demonstrates how to configure a CloudWatch agent on Amazon EMR to push Spark logs to CloudWatch. You can review and customize it as needed to include your Amazon EMR security configurations. As a best practice, we recommend including your Amazon EMR security configurations in the template to encrypt data in transit.

You should also be aware that some of the resources deployed by this stack incur costs when they remain in use.

In the next sections, we go through the following steps:

  1. Create and upload the bootstrap script to an Amazon Simple Storage Service (Amazon S3) bucket.
  2. Use the CloudFormation template to create the following resources:
  3. Monitor the Spark logs on the CloudWatch console.

Prerequisites

This post assumes that you have the following:

Create and upload the bootstrap script to an S3 bucket

For more information, see Uploading objects and Installing and running the CloudWatch agent on your servers.

To create and the upload the bootstrap script, complete the following steps:

  1. Create a local file named bootstrap_cloudwatch_agent.sh with the following content:
    #!/bin/bash
    
    echo -e 'Installing CloudWatch Agent... \n'
    sudo rpm -Uvh --force https://s3.amazonaws.com/amazoncloudwatch-agent/amazon_linux/amd64/latest/amazon-cloudwatch-agent.rpm
    
    echo -e 'Starting CloudWatch Agent... \n'
    sudo amazon-cloudwatch-agent-ctl -a fetch-config -m ec2 -c ssm:AmazonCloudWatch-Config.json -s

  2. On the Amazon S3 console, choose your S3 bucket.
  3. On the Objects tab, choose Upload.
  4. Choose Add files, then choose the bootstrap script.
  5. Choose Upload, then choose the file name: bootstrap_cloudwatch_agent.sh.
  6. Choose Copy S3 URI. We use this value in a later step.

Provision resources with the CloudFormation template

Choose Launch Stack to launch a CloudFormation stack in your account and deploy the template:

This template creates an IAM role, IAM instance profile, Systems Manager parameter, and EMR cluster. The cluster starts the Spark PI estimation example application. You will be billed for the AWS resources used if you create a stack from this template.

The CloudFormation wizard will ask you to modify or provide these parameters:

  • InstanceType – The type of instance for all instance groups. The default is m4.xlarge.
  • InstanceCountCore – The number of instances in the core instance group. The default is 2.
  • EMRReleaseLabel – The Amazon EMR release label you want to use. The default is emr-6.9.0.
  • BootstrapScriptPath – The S3 path of your CloudWatch agent installation bootstrap script that you copied earlier.
  • Subnet – The EC2 subnet where the cluster launches. You must provide this parameter.
  • EC2KeyPairName – An optional EC2 keypair for connecting to cluster nodes, as an alternative to Session Manager.

Monitor the log streams

After the CloudFormation stack deploys successfully, on the CloudWatch console, choose Log groups in the navigation pane. Then filter the log groups by the prefix /aws/emr/master.

choose Log groups in the navigation pane

The ID in the log group corresponds to the EC2 instance ID of the EMR primary node. If you have multiple EMR clusters, you can use this ID to identify a particular EMR cluster, based on the primary node ID.

In the log group, you will find the three different log streams.

In the log group, you will find the three different log streams.

The log streams contain the following information:

  • step-stdout – The standard output channel of Spark while it processes the step.
    The standard output channel of Spark while it processes the step
  • step-stderr – The standard error channel of Spark while it processes the step.
    The standard error channel of Spark while it processes the step.
  • step-controller – Information about the processing of the step. If your step fails while loading, you can find the stack trace in this log.
    Information about the processing of the step.

Clean up

To avoid future charges in your account, delete the resources you created in this walkthrough. The EMR cluster will incur charges as long as the cluster is active, so stop it when you’re done.

  1. On the CloudFormation console, in the navigation pane, choose Stacks.
  2. Choose the stack you launched (EMR-CloudWatch-Demo), then choose Delete.
  3. Empty the S3 bucket you created.
  4. Delete the S3 bucket you created.

Conclusion

Now that you have completed the steps in this walkthrough, you have the CloudWatch agent running on your cluster hosts and configured to push EMR step logs to CloudWatch. With this feature, you can effectively monitor the health and performance of your Spark jobs running on Amazon EMR, detecting critical issues in real time and identifying root causes quickly.

You can package and deploy this solution through a CloudFormation template like this example template, which creates the IAM instance profile role, Systems Manager parameter, and EMR cluster.

To take this further, consider using these logs in CloudWatch alarms for alerts on a log group-metric filter. You could collect them with other alarms into a composite alarm or configure alarm actions such as sending Amazon Simple Notification Service (Amazon SNS) notifications to trigger event-driven processes such as AWS Lambda functions.


About the Author

Ennio Pastore is a Senior Data Architect on the AWS Data Lab team. He is an enthusiast of everything related to new technologies that have a positive impact on businesses and general livelihood. Ennio has over 10 years of experience in data analytics. He helps companies define and implement data platforms across industries, such as telecommunications, banking, gaming, retail, and insurance.

Serverless ICYMI Q1 2023

Post Syndicated from Julian Wood original https://aws.amazon.com/blogs/compute/serverless-icymi-q1-2023/

Welcome to the 21st edition of the AWS Serverless ICYMI (in case you missed it) quarterly recap. Every quarter, we share all the most recent product launches, feature enhancements, blog posts, webinars, live streams, and other interesting things that you might have missed!

ICYMI2023Q1

In case you missed our last ICYMI, check out what happened last quarter here.

Artificial intelligence (AI) technologies, ChatGPT, and DALL-E are creating significant interest in the industry at the moment. Find out how to integrate serverless services with ChatGPT and DALL-E to generate unique bedtime stories for children.

Example notification of a story hosted with Next.js and App Runner

Example notification of a story hosted with Next.js and App Runner

Serverless Land is a website maintained by the Serverless Developer Advocate team to help you build serverless applications and includes workshops, code examples, blogs, and videos. There is now enhanced search functionality so you can search across resources, patterns, and video content.

SLand-search

ServerlessLand search

AWS Lambda

AWS Lambda has improved how concurrency works with Amazon SQS. You can now control the maximum number of concurrent Lambda functions invoked.

The launch blog post explains the scaling behavior of Lambda using this architectural pattern, challenges this feature helps address, and a demo of maximum concurrency in action.

Maximum concurrency is set to 10 for the SQS queue.

Maximum concurrency is set to 10 for the SQS queue.

AWS Lambda Powertools is an open-source library to help you discover and incorporate serverless best practices more easily. Lambda Powertools for .NET is now generally available and currently focused on three observability features: distributed tracing (Tracer), structured logging (Logger), and asynchronous business and application metrics (Metrics). Powertools is also available for Python, Java, and Typescript/Node.js programming languages.

To learn more:

Lambda announced a new feature, runtime management controls, which provide more visibility and control over when Lambda applies runtime updates to your functions. The runtime controls are optional capabilities for advanced customers that require more control over their runtime changes. You can now specify a runtime management configuration for each function with three settings, Automatic (default), Function update, or manual.

There are three new Amazon CloudWatch metrics for asynchronous Lambda function invocations: AsyncEventsReceived, AsyncEventAge, and AsyncEventsDropped. You can track the asynchronous invocation requests sent to Lambda functions to monitor any delays in processing and take corrective actions if required. The launch blog post explains the new metrics and how to use them to troubleshoot issues.

Lambda now supports Amazon DocumentDB change streams as an event source. You can use Lambda functions to process new documents, track updates to existing documents, or log deleted documents. You can use any programming language that is supported by Lambda to write your functions.

There is a helpful blog post suggesting best practices for developing portable Lambda functions that allow you to port your code to containers if you later choose to.

AWS Step Functions

AWS Step Functions has expanded its AWS SDK integrations with support for 35 additional AWS services including Amazon EMR Serverless, AWS Clean Rooms, AWS IoT FleetWise, AWS IoT RoboRunner and 31 other AWS services. In addition, Step Functions also added support for 1000+ new API actions from new and existing AWS services such as Amazon DynamoDB and Amazon Athena. For the full list of added services, visit AWS SDK service integrations.

Amazon EventBridge

Amazon EventBridge has launched the AWS Controllers for Kubernetes (ACK) for EventBridge and Pipes . This allows you to manage EventBridge resources, such as event buses, rules, and pipes, using the Kubernetes API and resource model (custom resource definitions).

EventBridge event buses now also support enhanced integration with Service Quotas. Your quota increase requests for limits such as PutEvents transactions-per-second, number of rules, and invocations per second among others will be processed within one business day or faster, enabling you to respond quickly to changes in usage.

AWS SAM

The AWS Serverless Application Model (SAM) Command Line Interface (CLI) has added the sam list command. You can now show resources defined in your application, including the endpoints, methods, and stack outputs required to test your deployed application.

AWS SAM has a preview of sam build support for building and packaging serverless applications developed in Rust. You can use cargo-lambda in the AWS SAM CLI build workflow and AWS SAM Accelerate to iterate on your code changes rapidly in the cloud.

You can now use AWS SAM connectors as a source resource parameter. Previously, you could only define AWS SAM connectors as a AWS::Serverless::Connector resource. Now you can add the resource attribute on a connector’s source resource, which makes templates more readable and easier to update over time.

AWS SAM connectors now also support multiple destinations to simplify your permissions. You can now use a single connector between a single source resource and multiple destination resources.

In October 2022, AWS released OpenID Connect (OIDC) support for AWS SAM Pipelines. This improves your security posture by creating integrations that use short-lived credentials from your CI/CD provider. There is a new blog post on how to implement it.

Find out how best to build serverless Java applications with the AWS SAM CLI.

AWS App Runner

AWS App Runner now supports retrieving secrets and configuration data stored in AWS Secrets Manager and AWS Systems Manager (SSM) Parameter Store in an App Runner service as runtime environment variables.

AppRunner also now supports incoming requests based on HTTP 1.0 protocol, and has added service level concurrency, CPU and Memory utilization metrics.

Amazon S3

Amazon S3 now automatically applies default encryption to all new objects added to S3, at no additional cost and with no impact on performance.

You can now use an S3 Object Lambda Access Point alias as an origin for your Amazon CloudFront distribution to tailor or customize data to end users. For example, you can resize an image depending on the device that an end user is visiting from.

S3 has introduced Mountpoint for S3, a high performance open source file client that translates local file system API calls to S3 object API calls like GET and LIST.

S3 Multi-Region Access Points now support datasets that are replicated across multiple AWS accounts. They provide a single global endpoint for your multi-region applications, and dynamically route S3 requests based on policies that you define. This helps you to more easily implement multi-Region resilience, latency-based routing, and active-passive failover, even when data is stored in multiple accounts.

Amazon Kinesis

Amazon Kinesis Data Firehose now supports streaming data delivery to Elastic. This is an easier way to ingest streaming data to Elastic and consume the Elastic Stack (ELK Stack) solutions for enterprise search, observability, and security without having to manage applications or write code.

Amazon DynamoDB

Amazon DynamoDB now supports table deletion protection to protect your tables from accidental deletion when performing regular table management operations. You can set the deletion protection property for each table, which is set to disabled by default.

Amazon SNS

Amazon SNS now supports AWS X-Ray active tracing to visualize, analyze, and debug application performance. You can now view traces that flow through Amazon SNS topics to destination services, such as Amazon Simple Queue Service, Lambda, and Kinesis Data Firehose, in addition to traversing the application topology in Amazon CloudWatch ServiceLens.

SNS also now supports setting content-type request headers for HTTPS notifications so applications can receive their notifications in a more predictable format. Topic subscribers can create a DeliveryPolicy that specifies the content-type value that SNS assigns to their HTTPS notifications, such as application/json, application/xml, or text/plain.

EDA Visuals collection added to Serverless Land

The Serverless Developer Advocate team has extended Serverless Land and introduced EDA visuals. These are small bite sized visuals to help you understand concept and patterns about event-driven architectures. Find out about batch processing vs. event streaming, commands vs. events, message queues vs. event brokers, and point-to-point messaging. Discover bounded contexts, migrations, idempotency, claims, enrichment and more!

EDA-visuals

EDA Visuals

To learn more:

Serverless Repos Collection on Serverless Land

There is also a new section on Serverless Land containing helpful code repositories. You can search for code repos to use for examples, learning or building serverless applications. You can also filter by use-case, runtime, and level.

Serverless Repos Collection

Serverless Repos Collection

Serverless Blog Posts

January

Jan 12 – Introducing maximum concurrency of AWS Lambda functions when using Amazon SQS as an event source

Jan 20 – Processing geospatial IoT data with AWS IoT Core and the Amazon Location Service

Jan 23 – AWS Lambda: Resilience under-the-hood

Jan 24 – Introducing AWS Lambda runtime management controls

Jan 24 – Best practices for working with the Apache Velocity Template Language in Amazon API Gateway

February

Feb 6 – Previewing environments using containerized AWS Lambda functions

Feb 7 – Building ad-hoc consumers for event-driven architectures

Feb 9 – Implementing architectural patterns with Amazon EventBridge Pipes

Feb 9 – Securing CI/CD pipelines with AWS SAM Pipelines and OIDC

Feb 9 – Introducing new asynchronous invocation metrics for AWS Lambda

Feb 14 – Migrating to token-based authentication for iOS applications with Amazon SNS

Feb 15 – Implementing reactive progress tracking for AWS Step Functions

Feb 23 – Developing portable AWS Lambda functions

Feb 23 – Uploading large objects to Amazon S3 using multipart upload and transfer acceleration

Feb 28 – Introducing AWS Lambda Powertools for .NET

March

Mar 9 – Server-side rendering micro-frontends – UI composer and service discovery

Mar 9 – Building serverless Java applications with the AWS SAM CLI

Mar 10 – Managing sessions of anonymous users in WebSocket API-based applications

Mar 14 –
Implementing an event-driven serverless story generation application with ChatGPT and DALL-E

Videos

Serverless Office Hours – Tues 10AM PT

Weekly office hours live stream. In each session we talk about a specific topic or technology related to serverless and open it up to helping you with your real serverless challenges and issues. Ask us anything you want about serverless technologies and applications.

January

Jan 10 – Building .NET 7 high performance Lambda functions

Jan 17 – Amazon Managed Workflows for Apache Airflow at Scale

Jan 24 – Using Terraform with AWS SAM

Jan 31 – Preparing your serverless architectures for the big day

February

Feb 07- Visually design and build serverless applications

Feb 14 – Multi-tenant serverless SaaS

Feb 21 – Refactoring to Serverless

Feb 28 – EDA visually explained

March

Mar 07 – Lambda cookbook with Python

Mar 14 – Succeeding with serverless

Mar 21 – Lambda Powertools .NET

Mar 28 – Server-side rendering micro-frontends

FooBar Serverless YouTube channel

Marcia Villalba frequently publishes new videos on her popular serverless YouTube channel. You can view all of Marcia’s videos at https://www.youtube.com/c/FooBar_codes.

January

Jan 12 – Serverless Badge – A new certification to validate your Serverless Knowledge

Jan 19 – Step functions Distributed map – Run 10k parallel serverless executions!

Jan 26 – Step Functions Intrinsic Functions – Do simple data processing directly from the state machines!

February

Feb 02 – Unlock the Power of EventBridge Pipes: Integrate Across Platforms with Ease!

Feb 09 – Amazon EventBridge Pipes: Enrichment and filter of events Demo with AWS SAM

Feb 16 – AWS App Runner – Deploy your apps from GitHub to Cloud in Record Time

Feb 23 – AWS App Runner – Demo hosting a Node.js app in the cloud directly from GitHub (AWS CDK)

March

Mar 02 – What is Amazon DynamoDB? What are the most important concepts? What are the indexes?

Mar 09 – Choreography vs Orchestration: Which is Best for Your Distributed Application?

Mar 16 – DynamoDB Single Table Design: Simplify Your Code and Boost Performance with Table Design Strategies

Mar 23 – 8 Reasons You Should Choose DynamoDB for Your Next Project and How to Get Started

Sessions with SAM & Friends

SAMFiends

AWS SAM & Friends

Eric Johnson is exploring how developers are building serverless applications. We spend time talking about AWS SAM as well as others like AWS CDK, Terraform, Wing, and AMPT.

Feb 16 – What’s new with AWS SAM

Feb 23 – AWS SAM with AWS CDK

Mar 02 – AWS SAM and Terraform

Mar 10 – Live from ServerlessDays ANZ

Mar 16 – All about AMPT

Mar 23 – All about Wing

Mar 30 – SAM Accelerate deep dive

Still looking for more?

The Serverless landing page has more information. The Lambda resources page contains case studies, webinars, whitepapers, customer stories, reference architectures, and even more Getting Started tutorials.

You can also follow the Serverless Developer Advocacy team on Twitter to see the latest news, follow conversations, and interact with the team.

How to use Amazon GuardDuty and AWS WAF v2 to automatically block suspicious hosts

Post Syndicated from Eucke Warren original https://aws.amazon.com/blogs/security/how-to-use-amazon-guardduty-and-aws-waf-v2-to-automatically-block-suspicious-hosts/

In this post, we’ll share an automation pattern that you can use to automatically detect and block suspicious hosts that are attempting to access your Amazon Web Services (AWS) resources. The automation will rely on Amazon GuardDuty to generate findings about the suspicious hosts, and then you can respond to those findings by programmatically updating AWS WAF to block the host from accessing your workloads.

You should implement security measures across your AWS resources by using a holistic approach that incorporates controls across multiple areas. In the AWS CAF Security Perspective section of the AWS Security Incident Response Guide, we define these controls across four categories:

  • Directive controls — Establish the governance, risk, and compliance models the environment will operate within
  • Preventive controls — Protect your workloads and mitigate threats and vulnerabilities
  • Detective controls — Provide full visibility and transparency over the operation of your deployments in AWS
  • Responsive controls — Drive remediation of potential deviations from your security baselines

Security automation is a key principle outlined in the Response Guide. It helps reduce operational overhead and creates repeatable, predictable approaches to monitoring and responding to events. AWS services provide the building blocks to create powerful patterns for the automated detection and remediation of threats against your AWS environments. You can configure automated flows that use both detective and responsive controls and might also feed into preventative controls to help mitigate risks in the future. Depending on the type of source event, you can automatically invoke specific actions, such as modifying access controls, terminating instances, or revoking credentials.

The patterns highlighted in this post provide an example of how to automatically remediate detected threats. You should modify these patterns to suit your defined requirements, and test and validate them before deploying them in a production environment.

AWS services used for the example pattern

Amazon GuardDuty is a continuous security monitoring and threat detection service that incorporates threat intelligence, anomaly detection, and machine learning to help protect your AWS resources, including your AWS accounts. Amazon EventBridge delivers a near-real-time stream of system events that describe changes in AWS resources. Amazon GuardDuty sends events to Amazon CloudWatch when a change in the findings takes place. In the context of GuardDuty, such changes include newly generated findings and subsequent occurrences of these findings. You can quickly set up rules to match events generated by GuardDuty findings in EventBridge events and route those events to one or more target actions. The pattern in this post routes matched events to AWS Lambda, which then updates AWS WAF web access control lists (web ACLs) and Amazon Virtual Private Cloud (Amazon VPC) network access control lists (network ACLs). AWS WAF is a web application firewall that helps protect your web applications from common web exploits that could affect application availability, security, or excess resource consumption. It supports both managed rules as well as a powerful rule language for custom rules. A network ACL is stateless and is an optional layer of security for your VPC that helps you restrict specific inbound and outbound traffic at the subnet level.

Pattern overview

This example pattern assumes that Amazon GuardDuty is enabled in your AWS account. If it isn’t enabled, you can learn more about the free trial and pricing, and follow the steps in the GuardDuty documentation to configure the service and start monitoring your account. The example code will only work in the us-east-1 AWS Region due to the use of Amazon CloudFront and web ACLs within the template.

Figure 1 shows how the AWS CloudFormation template creates the sample pattern.

Figure 1: How the CloudFormation template works

Figure 1: How the CloudFormation template works

Here’s how the pattern works, as shown in the diagram:

  1. A GuardDuty finding is generated due to suspected malicious activity.
  2. An EventBridge event is configured to filter for GuardDuty finding types by using event patterns.
  3. A Lambda function is invoked by the EventBridge event and parses the GuardDuty finding.
  4. The Lambda function checks the Amazon DynamoDB state table for an existing entry that matches the identified host. If state data is not found in the table for the identified host, a new entry is created in the Amazon DynamoDB state table.
  5. The Lambda function creates a web ACL rule inside AWS WAF and updates a subnet network ACL.
  6. A notification email is sent through Amazon Simple Notification Service (SNS).

A second Lambda function runs on a 5-minute recurring schedule and removes entries that are past the configurable retention period from AWS WAF IPSets (an IPSet is a list that contains the blocklisted IPs or CIDRs), VPC network ACLs, and the DynamoDB table.

GuardDuty prefix patterns and findings

The EventBridge event rule provided by the example automation uses the following seven prefix patterns, which allow coverage for 36 GuardDuty finding types. These specific finding types are of a network nature, and so we can use AWS WAF to block them. Be sure to read through the full list of finding types in the GuardDuty documentation to better understand what GuardDuty can report findings for. The covered findings are as follows:

  1. UnauthorizedAccess:EC2
    • UnauthorizedAccess:EC2/MaliciousIPCaller.Custom
    • UnauthorizedAccess:EC2/MetadataDNSRebind
    • UnauthorizedAccess:EC2/RDPBruteForce
    • UnauthorizedAccess:EC2/SSHBruteForce
    • UnauthorizedAccess:EC2/TorClient
    • UnauthorizedAccess:EC2/TorRelay
  2. Recon:EC2
    • Recon:EC2/PortProbeEMRUnprotectedPort
    • Recon:EC2/PortProbeUnprotectedPort
    • Recon:EC2/Portscan
  3. Trojan:EC2
    • Trojan:EC2/BlackholeTraffic
    • Trojan:EC2/BlackholeTraffic!DNS
    • Trojan:EC2/DGADomainRequest.B
    • Trojan:EC2/DGADomainRequest.C!DNS
    • Trojan:EC2/DNSDataExfiltration
    • Trojan:EC2/DriveBySourceTraffic!DNS
    • Trojan:EC2/DropPoint
    • Trojan:EC2/DropPoint!DNS
    • Trojan:EC2/PhishingDomainRequest!DNS
  4. Backdoor:EC2
    • Backdoor:EC2/C&CActivity.B
    • Backdoor:EC2/C&CActivity.B!DNS
    • Backdoor:EC2/DenialOfService.Dns
    • Backdoor:EC2/DenialOfService.Tcp
    • Backdoor:EC2/DenialOfService.Udp
    • Backdoor:EC2/DenialOfService.UdpOnTcpPorts
    • Backdoor:EC2/DenialOfService.UnusualProtocol
    • Backdoor:EC2/Spambot
  5. Impact:EC2
    • Impact:EC2/AbusedDomainRequest.Reputation
    • Impact:EC2/BitcoinDomainRequest.Reputation
    • Impact:EC2/MaliciousDomainRequest.Reputation
    • Impact:EC2/PortSweep
    • Impact:EC2/SuspiciousDomainRequest.Reputation
    • Impact:EC2/WinRMBruteForce
  6. CryptoCurrency:EC2
    • CryptoCurrency:EC2/BitcoinTool.B
    • CryptoCurrency:EC2/BitcoinTool.B!DNS
  7. Behavior:EC2
    • Behavior:EC2/NetworkPortUnusual
    • Behavior:EC2/TrafficVolumeUnusual

When activity occurs that generates one of these GuardDuty finding types and is then matched by the EventBridge event rule, an entry is created in the target web ACLs and subnet network ACLs to deny access from the suspicious host, and then a notification is sent to an email address by this pattern’s Lambda function. Blocking traffic from the suspicious host helps to mitigate potential threats while you perform additional investigation and remediation. For more information, see Remediating a compromised EC2 instance.

Solution deployment

To deploy the solution, you’ll do the following steps. Each step is described in more detail in the sections that follow.

  1. Download the required files.
  2. Create your Amazon Simple Storage Service (Amazon S3) bucket and upload the .zip files.
  3. Deploy the CloudFormation template.
  4. Create and test the Lambda function for a GuardDuty finding event.
  5. Confirm the entry for the test event in the VPC network ACL.
  6. Confirm the entry in the AWS WAF IP sets.
  7. Confirm the SNS notification email alert.
  8. Apply the AWS WAF web ACLs to resources.

Step 1: Download the required files

Download the following four files from the amazon-guardduty-waf-acl GitHub code repository:

  1. CloudFormation template – Copy and save the linked raw text, using the file name guarddutytoacl.template on your local file system.
  2. JSON event test file – Copy and save the linked raw text, using the file name gd2acl_test_event.json on your local file system.
  3. guardduty_to_acl_lambda_wafv2.zip – Choose the Download button on the GitHub page and save the .zip file to your local file system.
  4. prune_old_entries_wafv2.zip – Choose the Download button on the GitHub page and save the .zip file to your local file system.

Step 2: Create your S3 bucket and upload .zip files

For this step, create an S3 bucket with public access blocked, and then upload the Lambda .zip files to the newly created S3 bucket.

To create your S3 bucket and upload .zip files

  1. Create an S3 bucket in the us-east-1 Region.
  2. Upload the .zip files guardduty_to_acl_lambda_wafv2.zip and prune_old_entries_wafv2.zip that you saved to your local file system in Step 1 to the newly created S3 bucket.

Step 3: Deploy the CloudFormation template

For this step, deploy the CloudFormation template only to the us-east-1 Region within the AWS account where GuardDuty findings are to be monitored.

To deploy the CloudFormation template

  1. Sign in to the AWS Management Console, choose the CloudFormation service, and set N.Virginia (us-east-1) as the Region.
  2. Choose Create stack, and then choose With new resources (standard).
  3. When the Create stack landing page is presented, make sure that Template is ready is selected in the Prepare template section. In the Template source section, choose Upload a template file.
  4. Choose the Choose file button and browse to the location where the guarddutytoacl.template file was saved on your local file system. Select the file, choose Open, and then choose Next.
  5. On the Specify stack details page, provide the following input parameters. You can modify the default values to customize the pattern for your environment.

    Input parameter Input parameter description
    Notification email The email address to receive notifications. Must be a valid email address.
    Retention time, in minutes How long to retain IP addresses in the blocklist (in minutes). The default is 12 hours.
    S3 bucket for artifacts The S3 bucket with artifact files (Lambda functions, templates, HTML files, and so on). Keep the default value for deployment into the N. Virginia Region.
    S3 path to artifacts The path in the S3 bucket that contains artifact files. Keep the default value for deployment into the N. Virginia Region.
    CloudFrontWebACL Create CloudFront Web ACL? If set to true, a CloudFront IP set will be created automatically.
    RegionalWebACL Create Regional Web ACL? If set to true, a Regional IP set will be created automatically.

    Figure 2 shows an example of the values entered on this page.

    Figure 2: CloudFormation parameters on the Specify stack details page

    Figure 2: CloudFormation parameters on the Specify stack details page

  6. Enter values for all of the input parameters, and then choose Next.
  7. On the Configure stack options page, accept the defaults, and then choose Next.
  8. On the Review page, confirm the details, check the box acknowledging that the template will require capabilities for AWS::IAM::Role, and then choose Create Stack.

    The stack normally requires no more than 3–5 minutes to complete.

  9. While the stack is being created, check the email inbox that you specified for the Notification email address parameter. Look for an email message with the subject “AWS Notification – Subscription Confirmation”. Choose the link in the email to confirm the subscription to the SNS topic. You should see a message similar to the following.
    Figure 3: Subscription confirmation

    Figure 3: Subscription confirmation

When the Status field for the CloudFormation stack changes to CREATE_COMPLETE, as shown in Figure 4, the pattern is implemented and is ready for testing.

Figure 4: The stack status is CREATE_COMPLETE

Figure 4: The stack status is CREATE_COMPLETE

Step 4: Create and test the Lambda function for a GuardDuty finding event

After the CloudFormation stack has completed deployment, you can test the functionality by using a Lambda test event.

To create and run a Lambda GuardDuty finding test event

  1. In the AWS Management Console, choose Services > VPC > Subnets and locate a subnet that is suitable for testing the pattern.
  2. On the Details tab, copy the subnet ID to the clipboard or to a text editor.
    Figure 5: The subnet ID value on the Details tab

    Figure 5: The subnet ID value on the Details tab

  3. In the AWS Management Console, choose Services > CloudFormation > GuardDutytoACL stack. On the Outputs tab for the stack, look for the GuardDutytoACLLambda entry.
    Figure 6: The GuardDutytoACLLambda entry on the Outputs tab

    Figure 6: The GuardDutytoACLLambda entry on the Outputs tab

  4. Choose the link for the entry, and you’ll be redirected to the Lambda console, with the Lambda Code source page already open.
    Figure 7: The Lambda function open in the Lambda console

    Figure 7: The Lambda function open in the Lambda console

  5. In the middle of the Code source menu, in the Test dropdown list, locate and select the Configure test event option.
    Figure 8: Select Configure test event from the dropdown list

    Figure 8: Select Configure test event from the dropdown list

  6. To facilitate testing, we’ve provided a test event file. On the Configure test event page, do the following:
    1. For Event name, enter a name.
    2. In the body of the Event JSON field, paste the provided test event JSON, overwriting the existing contents.
    3. Update the value of SubnetId key (line 35) to the value of the subnet ID that you chose in Step 1 of this procedure.
    4. Choose Save.
    Figure 9: Update the value of the subnetId key

    Figure 9: Update the value of the subnetId key

  7. Choose Test to invoke the Lambda function with the test event. You should see the message “Status: succeeded” at the top of the execution results, similar to what is shown in Figure 10.
    Figure 10: The Test button and the “succeeded” message

    Figure 10: The Test button and the “succeeded” message

Step 5: Confirm the entry in the VPC network ACL

In this step, you’ll confirm that the DENY entry was created in the network ACL. This pattern is configured to create up to 10 entries in an ACL, ranging between rule numbers 71 and 80. Because network ACL rules are processed in order, it’s important that the DENY rule is placed before the ALLOW rule.

To confirm the entry in the VPC network ACL

  1. In the AWS Management Console, choose Services > VPC > Subnets, and locate the subnet you provided for the test event.
  2. Choose the network ACL link and confirm that the new DENY entry was generated from the test event.
    Figure 11: Check the entry from the test event on the Network tab

    Figure 11: Check the entry from the test event on the Network tab

    Note that VPC network ACL entries are created in the rule number range between 71 and 80. Older entries are aged out to create a “sliding window” of blocked hosts.

Step 6: Confirm the entry in the AWS WAF IP sets and blocklists

Next, verify that the entry was added to the CloudFront AWS WAF IP set and to the Application Load Balancer (ALB) AWS WAF IP set.

To confirm the entry in the AWS WAF IP set and blocklist

  1. In the AWS Management Console, choose Services > WAF & Shield > Web ACLs, and then set the selected Region to Global (CloudFront).
  2. Find and select the web ACL name that starts with CloudFrontBlockListWeb. In the Rule view, on the Rules tab, select the rule named CloudFrontBlocklistIPSetRule. Note that 198.51.100.0/32 appears as an entry in the rule.
    Figure 12: Confirm that the IP address was added

    Figure 12: Confirm that the IP address was added

  3. In the AWS Management Console, on the left navigation menu, choose Web ACLs, and then set the selected Region to US East (N. Virginia).
  4. Find and select the web ACL name that starts with RegionalBlocklistACL. In the Rule view, on the Rules tab, select the rule named RegionalBlocklistIPSetRule. Note that 198.51.100.0/32 appears as an entry in the rule.
    Figure 13: Make sure that the IP address was added

    Figure 13: Make sure that the IP address was added

There might be specific host addresses that you want to prevent from being added to the blocklist. You can do this within GuardDuty by using a trusted IP list. Trusted IP lists consist of IP addresses that you have allowlisted for secure communication with your AWS infrastructure and applications. GuardDuty doesn’t generate findings for IP addresses on trusted IP lists. For more information, see Working with trusted IP lists and threat lists.

Step 7: Confirm the SNS notification email

Finally, verify that the SNS notification was sent to the email address you set up.

To confirm receipt of the SNS notification email

  • Review the email inbox that you specified for the AdminEmail parameter and look for a message with the subject line “AWS GD2ACL Alert”. The contents of the message from SNS should be similar to the following.
    Figure 14: SNS message example

    Figure 14: SNS message example

Step 8: Apply the AWS WAF web ACLs to resources

The final task is to associate the web ACL with the CloudFront distributions and Application Load Balancers that you want to automatically update with this pattern. To learn how to do this, see Associating or disassociating a web ACL with an AWS resource.

You can also use AWS Firewall Manager to associate the web ACLs. AWS Firewall Manager can simplify your AWS WAF administration and maintenance tasks across multiple accounts and resources. With Firewall Manager, you set up your firewall rules just once. The service automatically applies your rules across your accounts and resources, even as you add new resources.

Conclusion

In this post, you’ve learned how to use Lambda to automatically update AWS WAF and VPC network ACLs in response to GuardDuty findings. With just a few steps, you can use this sample pattern to help mitigate threats by blocking communication with suspicious hosts. You can explore additional possible patterns by using GuardDuty finding types and Amazon EventBridge target actions. This pattern’s code is available on GitHub. Feel free to play around with the code to add more GuardDuty findings to this pattern and also to build bigger and better patterns! Make sure to modify the patterns in this post to suit your defined requirements, and test and validate them before deploying them in a production environment.

If you have comments about this blog post, you can submit them in the Comments section below. If you have questions about using this pattern, start a thread in the GuardDutyAWS WAF, or CloudWatch forums, or contact AWS Support.

Want more AWS Security news? Follow us on Twitter.

Eucke Warren

Eucke Warren

Eucke is a Sr Solution Architect helping ISV customers grow and mature securely. He has been fortunate to be able to work with technology for more than 30 years and counts automation, infrastructure, and security as areas of focus. When he’s not supporting customers, he enjoys time with his wife, family, and the company of a very bossy 18-pound dog.

Geoff Sweet

Geoff Sweet

Geoff has been in industry for over 20 years. He began his career in Electrical Engineering. Starting in IT during the dot-com boom, he has held a variety of diverse roles, such as systems architect, network architect, and, for the past several years, security architect. Geoff specializes in infrastructure security.

Invoking asynchronous external APIs with AWS Step Functions

Post Syndicated from Jorge Fonseca original https://aws.amazon.com/blogs/architecture/invoking-asynchronous-external-apis-with-aws-step-functions/

External vendor APIs can help organizations streamline operations, reduce costs, and provide better services to their customers. But many challenges exist in integrating with third-party services such as security, reliability, and cost.

Organizations must ensure their systems can handle performance issues or downtime. In some cases, calling an external API may have associated costs such as licensing fees. If a contract exists with the external API vendor to adhere to maximum Requests Per Second (RPS), the system needs to adapt accordingly.

In this blog post, we show you how to build an architecture to invoke an external vendor API using AWS Step Functions, with specific guidance on reliability.

This orchestration is applicable to any industry that relies on technology and data benefitting from external vendor API integration. Examples include e-commerce applications for online retailers integrating with third-party payment gateways, shipping carriers, or applications in the healthcare and banking sectors.

Invoking asynchronous external APIs overview

This solution outlines the use of AWS services to build an orchestrator controlling the invocation rate of third-party services that implement the service callback pattern to process long-running jobs. This architecture is also available in the AWS Reference Architecture Diagrams section of the AWS Architecture Center.

As in Figure 1, the architecture gives you the control to feed your calls to an external service according to its maximum RPS contract using Step Functions capabilities. Step Functions pauses main request workflows until you receive a callback from the external system indicating job completion.

Invoking Asynchronous External APIs architecture

Figure 1. Invoking Asynchronous External APIs architecture

Let’s explore each step.

  1. Set up Step Functions to handle the lifecycle of long-running requests to the third party. Inside the workflow, add a request step that pauses it using waitForTaskToken as a callback to continue. Set a timeout to throw a timeout error if a callback isn’t received.
  2. Send the task token and request payload to an Amazon Simple Queue Service (Amazon SQS) queue. Use Amazon CloudWatch to monitor its length. Consider adjusting the contract with the third-party service if the queue length grows beyond a soft limit determined on the maximum RPS with the third party.
  3. Use AWS Lambda to poll Amazon SQS and trigger an express Step Functions workflow. Control the invocation rate of Lambda using polling batch size, reserved concurrency, and maximum concurrency, discussed in more detail later in the blog.
  4. Optionally, add dynamic delay inside Lambda controlled by AWS AppConfig if the system still needs a lower invocation rate to comply with the contracted RPS.
  5. Step Functions invokes an Amazon API Gateway HTTP proxy API configured with rate limit to comply with the contracted RPS. API Gateway is a safeguard proxy to make sure your system is not breaking the RPS contract while dynamically adjusting the invocation rate parameters.
  6. Invoke the external third-party asynchronous service API sending the payload consumed from the requests queue and receiving the jobID from the service. Send failed requests to the Dead Letter Queue (DLQ) using Amazon SQS.
  7. Store the main workflow’s task token and jobID from the third-party service in an Amazon DynamoDB table. This is used as a mapping to correlate the jobID with the task token.
  8. When the external service completes, receive the completed jobID in a callback webhook endpoint implemented with API Gateway.
  9. Transform the external callbacks with API Gateway mapping templates, add the payload and jobID to an Amazon SQS queue, and respond immediately to the caller.
  10. Use Lambda to poll the callback Amazon SQS queue, then query the token stored. Use the token to unblock the waiting workflow by calling SendTaskSuccess and the callback DLQ to store failed messages.
  11. On the main workflow, pass the jobID to the next step and invoke a Step Functions processor to fetch the third-party results. Finally, process the external service’s results.

Controlling external API invocation rates

To comply with third-party RPS contracts, adopt a mechanism to control your system’s invocation rate. The rate of polling the messages from the request Amazon SQS (or step 3 in the architecture) directly impacts your invocation rate.

Different parameters can be used to control the invocation rate for Lambda with Amazon SQS as its trigger “event source,” such as:

  1. Batch size: The number of records to send to the function in each batch. For a standard queue, this can be up to 10,000 records. For a first-in, first-out (FIFO) queue, the maximum is 10. Using batch size on its own will not limit the invocation rate. It should be used in conjunction with other parameters such as reserved concurrency or maximum concurrency.
  2. Batch window: The maximum amount of time to gather records before invoking the function, in seconds. This applies only to standard queues.
  3. Maximum concurrency: Sets limits on the number of concurrent instances of the function that an Amazon SQS event source can invoke. Maximum concurrency is an event source-level setting.

Trigger configuration is shown in Figure 2.

Configuration parameters for triggering Lambda

Figure 2. Configuration parameters for triggering Lambda

Other Lambda configuration parameters can also be used to control the invocation rate, such as:

  1. Reserved concurrency: Guarantees the maximum number of concurrent instances for the function. When a function has reserved concurrency, no other function can use that concurrency. This can be used to limit and reduce the invocation rate.
  2. Provisioned concurrency: Initializes a requested number of execution environments so that they are prepared to respond immediately to your function’s invocations. Note that configuring provisioned concurrency incurs charges to your AWS account.

These additional Lambda configuration parameters are shown here in Figure 3.

Lambda concurrency configuration options - Reserved and Provisioned

Figure 3. Lambda concurrency configuration options – Reserved and Provisioned

Maximizing your external API architecture

During this architecture implementation, consider some use cases to ensure that you are building a mature orchestrator.

Let’s explore some examples:

  • If the external system fails to respond to the API request in step 8, a timeout exception will occur at step 1. A sensible timeout should be configured in the main state machine in step 1. The timeout value should consider the maximum response time of the external system.

The Error handling capabilities in Step Functions section of the AWS Step Functions Developer Guide provides the ability to implement your own logic for different error types. Configure timeout errors using the States.Timeout error state.

  • Dynamic delay inside the Lambda function—as mentioned in step 4—should only be used temporarily for burst traffic. If the external party has a very low RPS contract, consider other alternatives to introduce delay.

For example, Amazon EventBridge Scheduler can be used to trigger the Lambda function at regular intervals to consume the messages from Amazon SQS. This avoids costs for the idle/waiting state of your Lambda functions.

Conclusion

This blog post discusses how to build end-to-end orchestration to manage a request’s lifecycle, five different parameters to control invocation rate of third-party services, and throttle calls to external service API per maximum RPS contract.

We also consider use cases on using error handling capabilities in Step Functions and monitor systems with CloudWatch. In addition, this architecture adopts fully managed AWS Serverless services, removing the undifferentiated heavy lifting in building highly available, reliable, secure, and cost-effective systems in AWS.

Boosting Resiliency with an ML-based Telemetry Analytics Architecture

Post Syndicated from Shibu Nair original https://aws.amazon.com/blogs/architecture/boosting-resiliency-with-an-ml-based-telemetry-analytics-architecture/

Data proliferation has become a norm and as organizations become more data driven, automating data pipelines that enable data ingestion, curation, and processing is vital. Since many organizations have thousands of time-bound, automated, complex pipelines, monitoring their telemetry information is critical. Keeping track of telemetry data helps businesses monitor and recover their pipelines faster which results in better customer experiences.

In our blog post, we explain how you can collect telemetry from your data pipeline jobs and use machine learning (ML) to build a lower- and upper-bound threshold to help operators identify anomalies in near-real time.

The applications of anomaly detection on telemetry data from job pipelines are wide-ranging, including these and more:

  • Detecting abnormal runtimes
  • Detecting jobs running slower than expected
  • Proactive monitoring
  • Notifications

Key tenets of telemetry analytics

There are five key tenets of telemetry analytics, as in Figure 1.

Key tenets of telemetry analytics

Figure 1. Key tenets of telemetry analytics

The key tenets for near real-time telemetry analytics for data pipelines are:

  1. Collecting the metrics
  2. Aggregating the metrics
  3. Identify anomaly
  4. Notify and resolve issues
  5. Persist for compliance reasons, historical trend analysis, and to visualize

This blog post describes how customers can easily implement these steps by using AWS native no-code, low-code (AWS LCNC) solutions.

ML-based telemetry analytics solution architecture

The architecture defined here helps customers incrementally enable features with AWS LCNC solutions by leveraging AWS managed services to avoid the overhead of infrastructure provisioning. Most of the steps are configurations of the features provided by AWS services. This enables customers to make their applications resilient by tracking and resolving anomalies in near real time, as in Figure 2.

ML-based telemetry analytics solution architecture

Figure 2. ML-based telemetry analytics solution architecture

Let’s explore each of the architecture steps in detail.

1. Indicative AWS data analytics services: Choose from a broad range of AWS analytics services, including data movement, data storage, data lakes, big data analytics, log analytics, and streaming analytics to business intelligence, ML, and beyond. This diagram shows a subset of these data analytics services. You may use one or a combination of many, depending on your use case.

2. Amazon CloudWatch metrics for telemetry analytics: Collecting and visualizing real-time logs, metrics, and event data is a key step in any process. CloudWatch helps you accomplish these tasks without any infrastructure provisioning. Almost every AWS data analytics service is integrated with CloudWatch to enable automatic capturing of the detailed metrics needed for telemetry analytics.

3. Near real-time use case examples: Step three presents practical, near real-time use cases that represent a range of real-world applications, one or more of which may apply to your own business needs.

Use case 1: Anomaly detection

CloudWatch provides the functionality to apply anomaly detection for a metric. The key business use case of this feature is to apply statistical and ML algorithms on a per-metrics basis of business critical applications to proactively identify issues and raise alarms.

The focus is on a single set of metrics that will be important for the application’s functioning—for example, AWS Lambda metrics of a 24/7 credit card company’s fraud monitoring application.

Use case 2: Unified metrics using Amazon Managed Grafana

For proper insights into telemetry data, it is important to unify metrics and collaboratively identify and troubleshoot issues in analytical systems. Amazon Managed Grafana helps to visualize, query, and corelate metrics from CloudWatch in near real-time.

For example, Amazon Managed Grafana can be used to monitor container metrics for Amazon EMR running on Amazon Elastic Kubernetes Service (Amazon EKS), which supports processing high-volume data from business critical Internet of Things (IoT) applications like connected factories, offsite refineries, wind farms, and more.

Use case 3: Combined business and metrics data using Amazon OpenSearch Service

Amazon OpenSearch Service provides the capability to perform near real-time, ML-based interactive log analytics, application monitoring, and search by combining business and telemetry data.

As an example, customers can combine AWS CloudTrail logs for AWS logins, Amazon Athena, and Amazon RedShift query access times with employee reference data to detect insider threats.

This log analytics use case architecture integrates into OpenSearch, as in Figure 3.

Log analytics use case architecture overview with OpenSearch

Figure 3. Log analytics use case architecture overview with OpenSearch

Use case 4: ML-based advanced analytics

Using Amazon Simple Storage Service (Amazon S3) as data storage, data lake customers can tap into AWS analytics services such as the AWS Glue Catalog, AWS Glue DataBrew, and Athena for preparing and transforming data, as well as build trend analysis using ML models in Amazon SageMaker. This mechanism helps with performing ML-based advanced analytics to identify and resolve recurring issues.

4. Anomaly resolution: When an alert is generated either by CloudWatch alarm, OpenSearch, or Amazon Managed Grafana, you have the option to act on the alert in near-real time. Amazon Simple Notification Service (Amazon SNS) and Lambda can help build workflows. Lambda also helps integrate with ServiceNow ticket creation, Slack channel notifications, or other ticketing systems.

Simple data pipeline example

Let’s explore another practical example using an architecture that demonstrates how AWS Step Functions orchestrates Lambda, AWS Glue jobs, and crawlers.

To report an anomaly on AWS Glue jobs based on total number of records processed, you can leverage the glue.driver.aggregate.recordsRead CloudWatch metric and set up a CloudWatch alarm based on anomaly detection, Amazon SNS topic for notifications, and Lambda for resolution, as in Figure 4.

AWS Step Functions orchestrating Lamba, AWS Glue jobs, and crawlers

Figure 4. AWS Step Functions orchestrating Lamba, AWS Glue jobs, and crawlers

Here are the steps involved in the architecture proposed:

  • CloudWatch automatically captures the metric glue.driver.aggregate.recordsRead from AWS Glue jobs.
  • Customers set a CloudWatch alarm based on the anomaly detection of glue.driver.aggregate.recordsRead metric and set a notification to Amazon SNS topic.
  • CloudWatch applies a ML algorithm to the metric’s past data and creates a model of metric’s expected values.
  • When the number of records increases significantly, the metric from the CloudWatch anomaly detection model notifies the Amazon SNS topic.
  • Customers can notify an email group and trigger a Lambda function to resolve the issue, or create tickets in their operational monitoring system.
  • Customers can also unify all the AWS Glue metrics using Amazon Managed Grafana. Using Amazon S3, data lake customers can crawl and catalog the data in the AWS Glue catalog and make it available for ad-hoc querying. Amazon SageMaker can be used for custom model training and inferencing.

Conclusion

In this blog post, we covered a recommended architecture to enable near-real time telemetry analytics for data pipelines, anomaly detection, notification, and resolution. This provides resiliency to the customer applications by proactively identifying and resolving issues.

Introducing AWS Lambda Powertools for .NET

Post Syndicated from Julian Wood original https://aws.amazon.com/blogs/compute/introducing-aws-lambda-powertools-for-net/

This blog post is written by Amir Khairalomoum, Senior Solutions Architect.

Modern applications are built with modular architectural patterns, serverless operational models, and agile developer processes. They allow you to innovate faster, reduce risk, accelerate time to market, and decrease your total cost of ownership (TCO). A microservices architecture comprises many distributed parts that can introduce complexity to application observability. Modern observability must respond to this complexity, the increased frequency of software deployments, and the short-lived nature of AWS Lambda execution environments.

The Serverless Applications Lens for the AWS Well-Architected Framework focuses on how to design, deploy, and architect your serverless application workloads in the AWS Cloud. AWS Lambda Powertools for .NET translates some of the best practices defined in the serverless lens into a suite of utilities. You can use these in your application to apply structured logging, distributed tracing, and monitoring of metrics.

Following the community’s continued adoption of AWS Lambda Powertools for Python, Java, and TypeScript, AWS Lambda Powertools for .NET is now generally available.

This post shows how to use the new open source Powertools library to implement observability best practices with minimal coding. It walks through getting started, with the provided examples available in the Powertools GitHub repository.

About Powertools

Powertools for .NET is a suite of utilities that helps with implementing observability best practices without needing to write additional custom code. It currently supports Lambda functions written in C#, with support for runtime versions .NET 6 and newer. Powertools provides three core utilities:

  • Tracing provides a simpler way to send traces from functions to AWS X-Ray. It provides visibility into function calls, interactions with other AWS services, or external HTTP requests. You can add attributes to traces to allow filtering based on key information. For example, when using the Tracing attribute, it creates a ColdStart annotation. You can easily group and analyze traces to understand the initialization process.
  • Logging provides a custom logger that outputs structured JSON. It allows you to pass in strings or more complex objects, and takes care of serializing the log output. The logger handles common use cases, such as logging the Lambda event payload, and capturing cold start information. This includes appending custom keys to the logger.
  • Metrics simplifies collecting custom metrics from your application, without the need to make synchronous requests to external systems. This functionality allows capturing metrics asynchronously using Amazon CloudWatch Embedded Metric Format (EMF) which reduces latency and cost. This provides convenient functionality for common cases, such as validating metrics against CloudWatch EMF specification and tracking cold starts.

Getting started

The following steps explain how to use Powertools to implement structured logging, add custom metrics, and enable tracing with AWS X-Ray. The example application consists of an Amazon API Gateway endpoint, a Lambda function, and an Amazon DynamoDB table. It uses the AWS Serverless Application Model (AWS SAM) to manage the deployment.

When you send a GET request to the API Gateway endpoint, the Lambda function is invoked. This function calls a location API to find the IP address, stores it in the DynamoDB table, and returns it with a greeting message to the client.

Example application

Example application

The AWS Lambda Powertools for .NET utilities are available as NuGet packages. Each core utility has a separate NuGet package. It allows you to add only the packages you need. This helps to make the Lambda package size smaller, which can improve the performance.

To implement each of these core utilities in a separate example, use the Globals sections of the AWS SAM template to configure Powertools environment variables and enable active tracing for all Lambda functions and Amazon API Gateway stages.

Sometimes resources that you declare in an AWS SAM template have common configurations. Instead of duplicating this information in every resource, you can declare them once in the Globals section and let your resources inherit them.

Logging

The following steps explain how to implement structured logging in an application. The logging example shows you how to use the logging feature.

To add the Powertools logging library to your project, install the packages from NuGet gallery, from Visual Studio editor, or by using following .NET CLI command:

dotnet add package AWS.Lambda.Powertools.Logging

Use environment variables in the Globals sections of the AWS SAM template to configure the logging library:

  Globals:
    Function:
      Environment:
        Variables:
          POWERTOOLS_SERVICE_NAME: powertools-dotnet-logging-sample
          POWERTOOLS_LOG_LEVEL: Debug
          POWERTOOLS_LOGGER_CASE: SnakeCase

Decorate the Lambda function handler method with the Logging attribute in the code. This enables the utility and allows you to use the Logger functionality to output structured logs by passing messages as a string. For example:

[Logging]
public async Task<APIGatewayProxyResponse> FunctionHandler
         (APIGatewayProxyRequest apigProxyEvent, ILambdaContext context)
{
  ...
  Logger.LogInformation("Getting ip address from external service");
  var location = await GetCallingIp();
  ...
}

Lambda sends the output to Amazon CloudWatch Logs as a JSON-formatted line.

{
  "cold_start": true,
  "xray_trace_id": "1-621b9125-0a3b544c0244dae940ab3405",
  "function_name": "powertools-dotnet-tracing-sampl-HelloWorldFunction-v0F2GJwy5r1V",
  "function_version": "$LATEST",
  "function_memory_size": 256,
  "function_arn": "arn:aws:lambda:eu-west-2:286043031651:function:powertools-dotnet-tracing-sample-HelloWorldFunction-v0F2GJwy5r1V",
  "function_request_id": "3ad9140b-b156-406e-b314-5ac414fecde1",
  "timestamp": "2022-02-27T14:56:39.2737371Z",
  "level": "Information",
  "service": "powertools-dotnet-sample",
  "name": "AWS.Lambda.Powertools.Logging.Logger",
  "message": "Getting ip address from external service"
}

Another common use case, especially when developing new Lambda functions, is to print a log of the event received by the handler. You can achieve this by enabling LogEvent on the Logging attribute. This is disabled by default to prevent potentially leaking sensitive event data into logs.

[Logging(LogEvent = true)]
public async Task<APIGatewayProxyResponse> FunctionHandler
         (APIGatewayProxyRequest apigProxyEvent, ILambdaContext context)
{
  ...
}

With logs available as structured JSON, you can perform searches on this structured data using CloudWatch Logs Insights. To search for all logs that were output during a Lambda cold start, and display the key fields in the output, run following query:

fields coldStart='true'
| fields @timestamp, function_name, function_version, xray_trace_id
| sort @timestamp desc
| limit 20
CloudWatch Logs Insights query for cold starts

CloudWatch Logs Insights query for cold starts

Tracing

Using the Tracing attribute, you can instruct the library to send traces and metadata from the Lambda function invocation to AWS X-Ray using the AWS X-Ray SDK for .NET. The tracing example shows you how to use the tracing feature.

When your application makes calls to AWS services, the SDK tracks downstream calls in subsegments. AWS services that support tracing, and resources that you access within those services, appear as downstream nodes on the service map in the X-Ray console.

You can instrument all of your AWS SDK for .NET clients by calling RegisterXRayForAllServices before you create them.

public class Function
{
  private static IDynamoDBContext _dynamoDbContext;
  public Function()
  {
    AWSSDKHandler.RegisterXRayForAllServices();
    ...
  }
  ...
}

To add the Powertools tracing library to your project, install the packages from NuGet gallery, from Visual Studio editor, or by using following .NET CLI command:

dotnet add package AWS.Lambda.Powertools.Tracing

Use environment variables in the Globals sections of the AWS SAM template to configure the tracing library.

  Globals:
    Function:
      Tracing: Active
      Environment:
        Variables:
          POWERTOOLS_SERVICE_NAME: powertools-dotnet-tracing-sample
          POWERTOOLS_TRACER_CAPTURE_RESPONSE: true
          POWERTOOLS_TRACER_CAPTURE_ERROR: true

Decorate the Lambda function handler method with the Tracing attribute to enable the utility. To provide more granular details for your traces, you can use the same attribute to capture the invocation of other functions outside of the handler. For example:

[Tracing]
public async Task<APIGatewayProxyResponse> FunctionHandler
         (APIGatewayProxyRequest apigProxyEvent, ILambdaContext context)
{
  ...
  var location = await GetCallingIp().ConfigureAwait(false);
  ...
}

[Tracing(SegmentName = "Location service")]
private static async Task<string?> GetCallingIp()
{
  ...
}

Once traffic is flowing, you see a generated service map in the AWS X-Ray console. Decorating the Lambda function handler method, or any other method in the chain with the Tracing attribute, provides an overview of all the traffic flowing through the application.

AWS X-Ray trace service view

AWS X-Ray trace service view

You can also view the individual traces that are generated, along with a waterfall view of the segments and subsegments that comprise your trace. This data can help you pinpoint the root cause of slow operations or errors within your application.

AWS X-Ray waterfall trace view

AWS X-Ray waterfall trace view

You can also filter traces by annotation and create custom service maps with AWS X-Ray Trace groups. In this example, use the filter expression annotation.ColdStart = true to filter traces based on the ColdStart annotation. The Tracing attribute adds these automatically when used within the handler method.

View trace attributes

View trace attributes

Metrics

CloudWatch offers a number of included metrics to help answer general questions about the application’s throughput, error rate, and resource utilization. However, to understand the behavior of the application better, you should also add custom metrics relevant to your workload.

The metrics utility creates custom metrics asynchronously by logging metrics to standard output using the Amazon CloudWatch Embedded Metric Format (EMF).

In the sample application, you want to understand how often your service is calling the location API to identify the IP addresses. The metrics example shows you how to use the metrics feature.

To add the Powertools metrics library to your project, install the packages from the NuGet gallery, from the Visual Studio editor, or by using the following .NET CLI command:

dotnet add package AWS.Lambda.Powertools.Metrics

Use environment variables in the Globals sections of the AWS SAM template to configure the metrics library:

  Globals:
    Function:
      Environment:
        Variables:
          POWERTOOLS_SERVICE_NAME: powertools-dotnet-metrics-sample
          POWERTOOLS_METRICS_NAMESPACE: AWSLambdaPowertools

To create custom metrics, decorate the Lambda function with the Metrics attribute. This ensures that all metrics are properly serialized and flushed to logs when the function finishes its invocation.

You can then emit custom metrics by calling AddMetric or push a single metric with a custom namespace, service and dimensions by calling PushSingleMetric. You can also enable the CaptureColdStart on the attribute to automatically create a cold start metric.

[Metrics(CaptureColdStart = true)]
public async Task<APIGatewayProxyResponse> FunctionHandler
         (APIGatewayProxyRequest apigProxyEvent, ILambdaContext context)
{
  ...
  // Add Metric to capture the amount of time
  Metrics.PushSingleMetric(
        metricName: "CallingIP",
        value: 1,
        unit: MetricUnit.Count,
        service: "lambda-powertools-metrics-example",
        defaultDimensions: new Dictionary<string, string>
        {
            { "Metric Type", "Single" }
        });
  ...
}

Conclusion

CloudWatch and AWS X-Ray offer functionality that provides comprehensive observability for your applications. Lambda Powertools .NET is now available in preview. The library helps implement observability when running Lambda functions based on .NET 6 while reducing the amount of custom code.

It simplifies implementing the observability best practices defined in the Serverless Applications Lens for the AWS Well-Architected Framework for a serverless application and allows you to focus more time on the business logic.

You can find the full documentation and the source code for Powertools in GitHub. We welcome contributions via pull request, and encourage you to create an issue if you have any feedback for the project. Happy building with AWS Lambda Powertools for .NET.

For more serverless learning resources, visit Serverless Land.