Post Syndicated from Balaji Mohan original https://aws.amazon.com/blogs/big-data/deliver-amazon-cloudwatch-logs-to-amazon-opensearch-serverless/
Amazon CloudWatch Logs collect, aggregate, and analyze logs from different systems in one place. CloudWatch provides subcriptions as a real-time feed of these logs to other services like Amazon Kinesis Data Streams, AWS Lambda, and Amazon OpenSearch Service. These subscriptions are a popular mechanism to enable custom processing and advanced analysis of log data to gain additional valuable insights. At the time of publishing this blog post, these subscription filters support delivering logs to Amazon OpenSearch Service provisioned clusters only. Customers are increasingly adopting Amazon OpenSearch Serverless as a cost-effective option for infrequent, intermittent and unpredictable workloads.
In this blog post, we will show how to use Amazon OpenSearch Ingestion to deliver CloudWatch logs to OpenSearch Serverless in near real-time. We outline a mechanism to connect a Lambda subscription filter with OpenSearch Ingestion and deliver logs to OpenSearch Serverless without explicitly needing a separate subscription filter for it.
Solution overview
The following diagram illustrates the solution architecture.

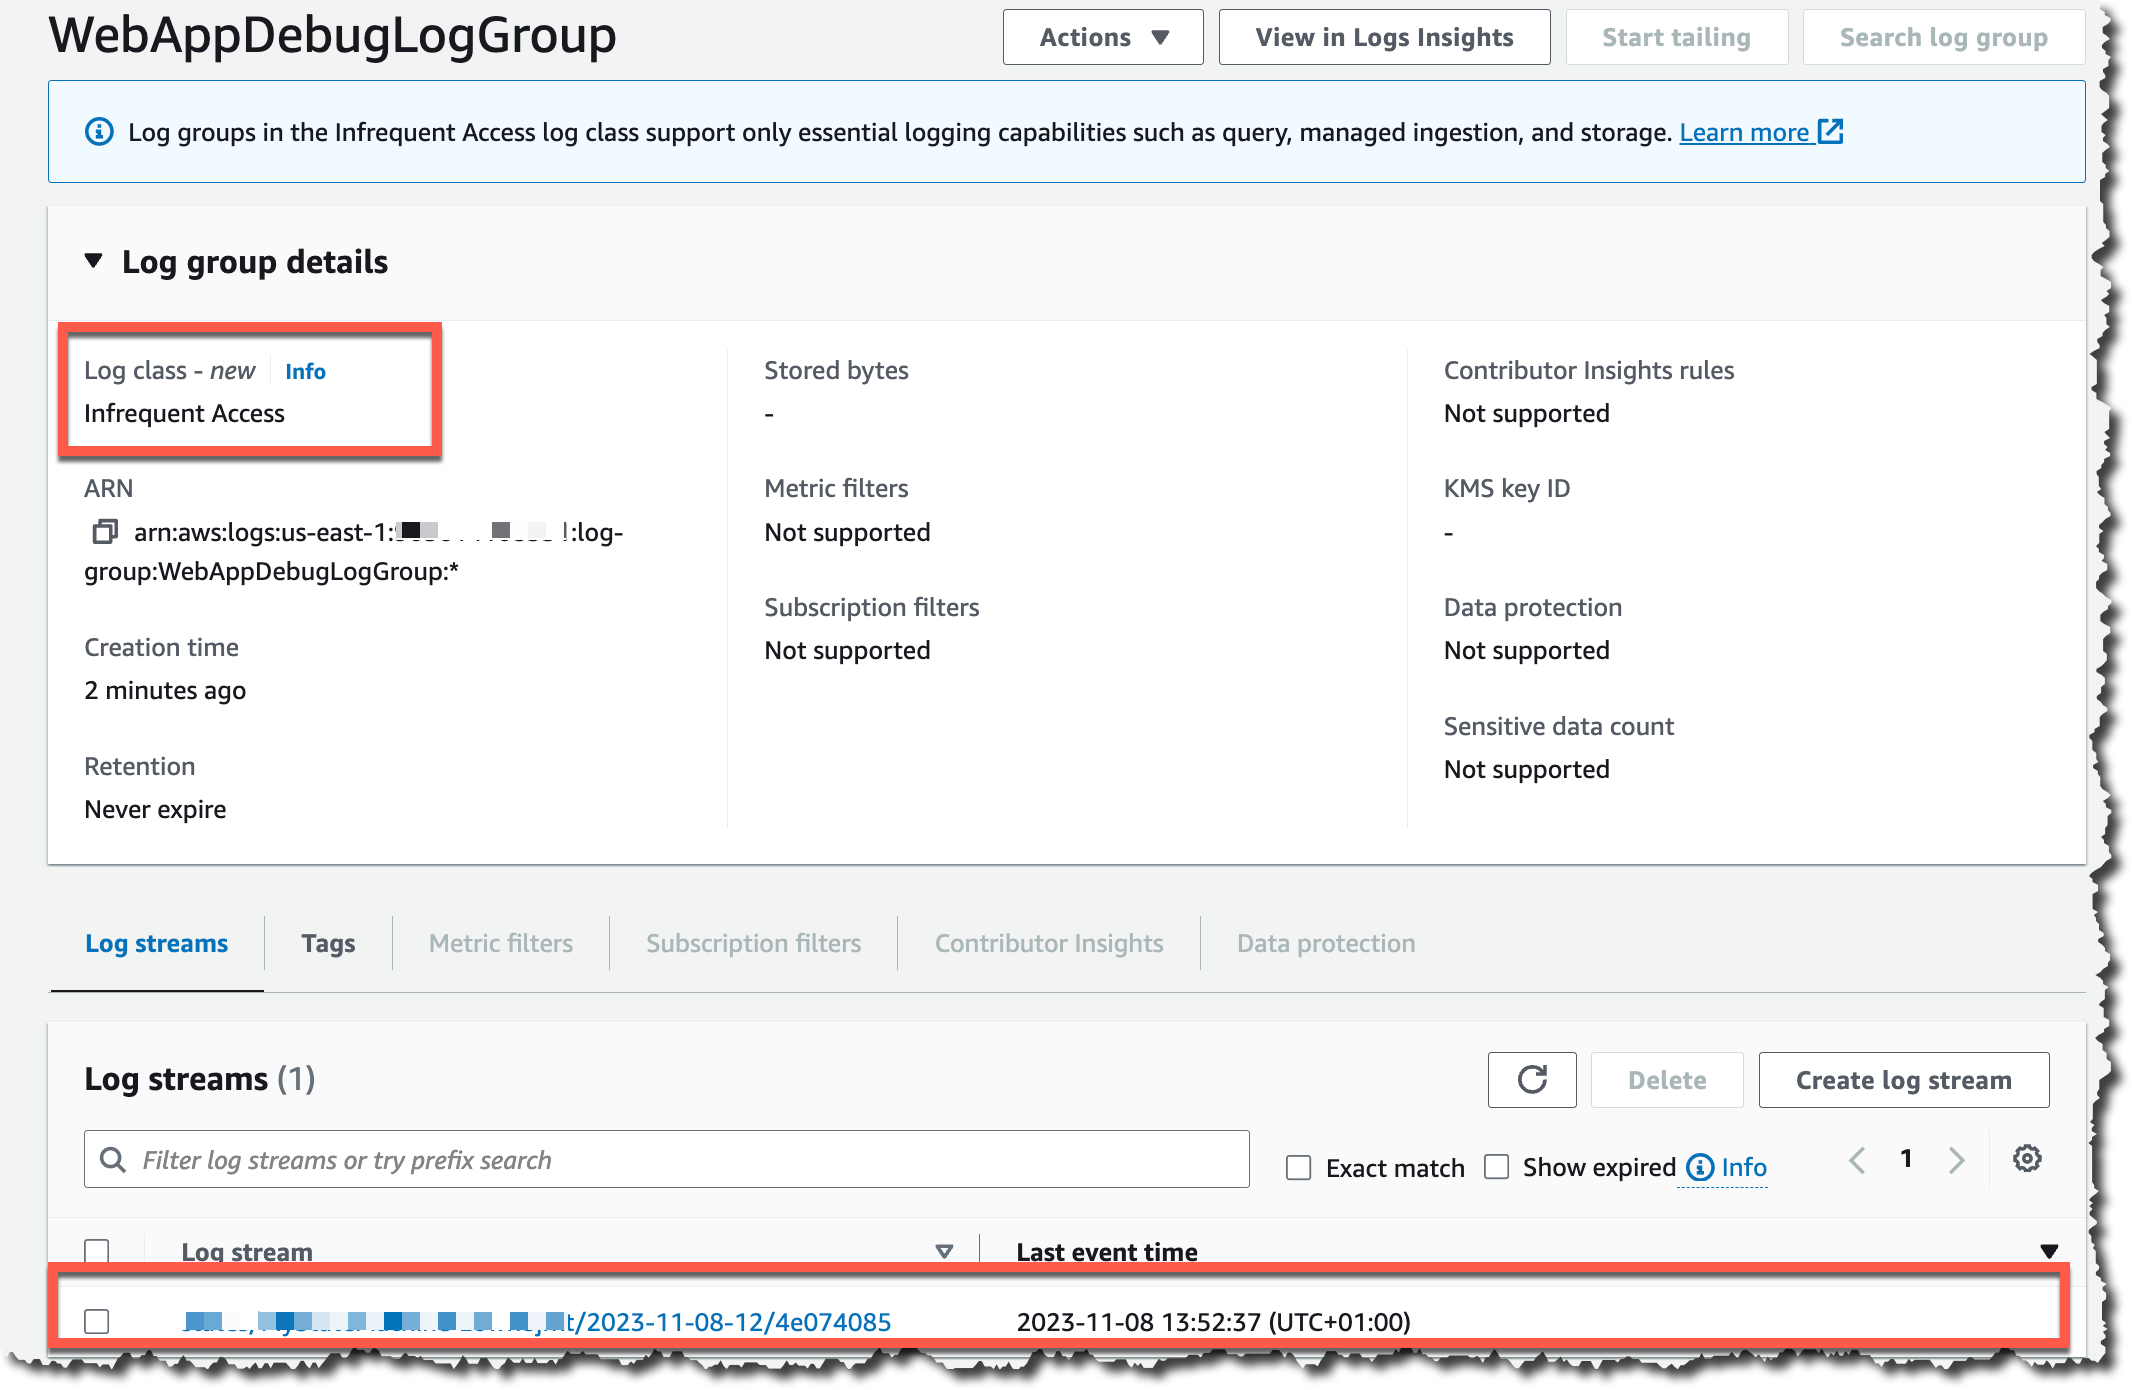
- CloudWatch Logs: Collects and stores logs from various AWS resources and applications. It serves as the source of log data in this solution.
- Subscription filter : A CloudWatch Logs subscription filter filters and routes specific log data from CloudWatch Logs to the next component in the pipeline.
- CloudWatch exporter Lambda function: This is a Lambda function that receives the filtered log data from the subscription filter. Its purpose is to transform and prepare the log data for ingestion into the OpenSearch Ingestion pipeline.
- OpenSearch Ingestion: This is a component of OpenSearch Service. The Ingestion pipeline is responsible for processing and enriching the log data received from the CloudWatch exporter Lambda function before storing it in the OpenSearch Serverless collection.
- OpenSearch Service: This is fully managed service that stores and indexes log data, making it searchable and available for analysis and visualization. OpenSearch Service offers two configurations: provisioned domains and serverless. In this setup, we use serverless, which is an auto-scaling configuration for OpenSearch Service.
Prerequisites
- An AWS account
- CloudWatch logs set up in your AWS environment
- OpenSearch Serverless collection created
- VPC and subnet configuration
Deploy the solution
With the prerequisites in place, you can create and deploy the pieces of the solution.
Step 1: Create PipelineRole for ingestion
- Open the AWS Management Console for AWS Identity and Access Management (IAM).
- Choose Policies, and then choose Create policy.
- Select JSON and paste the following policy into the editor:
- Choose Next, choose Next, and name your policy collection-pipeline-policy.
- Choose Create policy.
- Next, create a role and attach the policy to it. Choose Roles, and then choose Create role.
- Select Custom trust policy and paste the following policy into the editor:
- Choose Next, and then search for and select the collection-pipeline-policy you just created.
- Choose Next and name the role PipelineRole.
- Choose Create role.
Step 2: Configure the network and data policy for OpenSearch collection
- In the OpenSearch Service console, navigate to the Serverless menu.
- Create a VPC endpoint by following the instruction in Create an interface endpoint for OpenSearch Serverless.
- Go to Security and choose Network policies.
- Choose Create network policy.
- Configure the following policy
- Go to Security and choose Data access policies.
- Choose Create access policy.
- Configure the following policy:
Step 3: Create an OpenSearch Ingestion pipeline
- Navigate to the OpenSearch Service.
- Go to the Ingestion pipelines section.
- Choose Create pipeline.
- Define the pipeline configuration.
Step 4: Create a Lambda function
- Create a Lambda layer for requests and sigv4 packages. Run the following commands in AWS Cloudshell.
- Create a function with Python 3.x runtime. See Create your first Lambda function.
- Replace {OpenSearch Pipeline Endpoint}’ with the endpoint of your OpenSearch Ingestion pipeline.
- Attach the following inline policy in execution role.
- Deploy the function.
Step 5: Set up a CloudWatch Logs subscription
- Grant permission to a specific AWS service or AWS account to invoke the specified Lambda function. The following command grants permission to the CloudWatch Logs service to invoke the cloud-logs Lambda function for the specified log group. This is necessary because CloudWatch Logs cannot directly invoke a Lambda function without being granted permission. Run the following command in CloudShell to add permission.
- Create a subscription filter for a log group. The following command creates a subscription filter on the log group, which forwards all log events (because the filter pattern is an empty string) to the Lambda function. Run the following command in Cloudshell to create the subscription filter.
Step 6: Testing and verification
- Generate some logs in your CloudWatch log group. Run the following command in Cloudshell to create sample logs in log group.
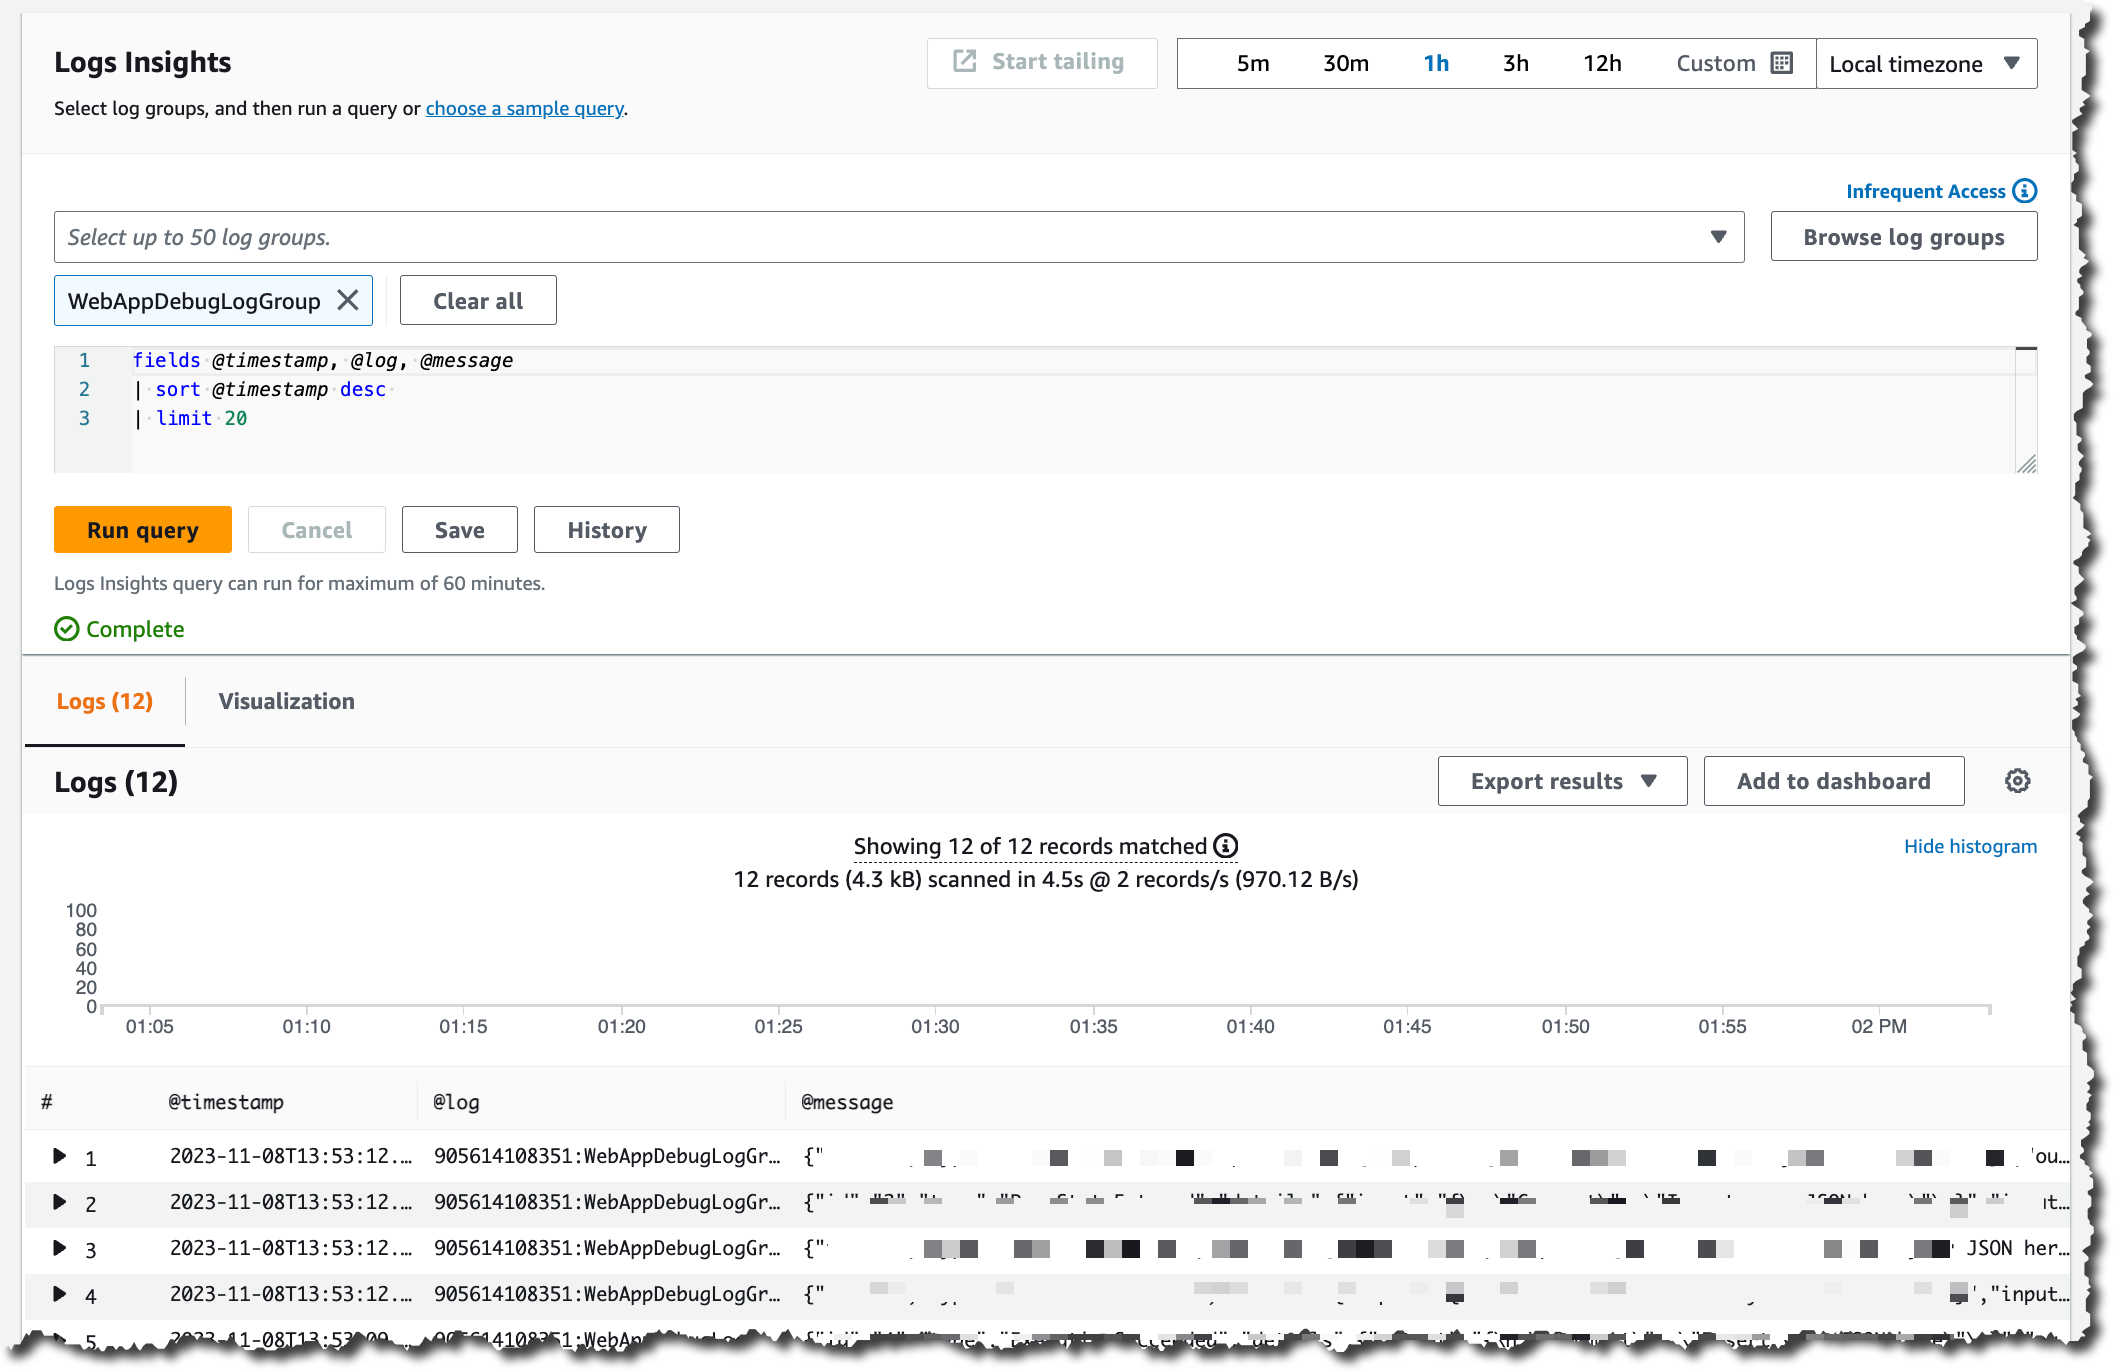
- Check the OpenSearch collection to ensure logs are indexed correctly.

Clean up
Remove the infrastructure for this solution when not in use to avoid incurring unnecessary costs.
Conclusion
You saw how to set up a pipeline to send CloudWatch logs to an OpenSearch Serverless collection within a VPC. This integration uses CloudWatch for log aggregation, Lambda for log processing, and OpenSearch Serverless for querying and visualization. You can use this solution to take advantage of the pay-as-you-go pricing model for OpenSearch Serverless to optimize operational costs for log analysis.
To further explore, you can:
- Learn more about querying and visualizing log data in OpenSearch Dashboards.
- Integrate additional log sources, such as EC2 instances or container logs, into the same pipeline.
- Set up alerting and notification rules based on log patterns or anomalies.
About the Authors
 Balaji Mohan is a senior modernization architect specializing in application and data modernization to the cloud. His business-first approach ensures seamless transitions, aligning technology with organizational goals. Using cloud-native architectures, he delivers scalable, agile, and cost-effective solutions, driving innovation and growth.
 Souvik Bose is a Software Development Engineer working on Amazon OpenSearch Service.
 Muthu Pitchaimani is a Search Specialist with Amazon OpenSearch Service. He builds large-scale search applications and solutions. Muthu is interested in the topics of networking and security, and is based out of Austin, Texas.

 Life is not always happy, there are difficult times. However, we can share our joys and sufferings with those we work with. The AWS Community is no exception.


 The Internet has a plethora of moving parts: routers, switches, hubs, terrestrial and submarine cables, and connectors on the hardware side, and complex protocol stacks and configurations on the software side. When something goes wrong that slows or disrupts the Internet in a way that affects your customers, you want to be able to localize and understand the issue as quickly as possible.


 Parnab Basak is a Senior Solutions Architect and a Serverless Specialist at AWS. He specializes in creating new solutions that are cloud native using modern software development practices like serverless, DevOps, and analytics. Parnab works closely in the analytics and integration services space helping customers adopt AWS services for their workflow orchestration needs.
 Chandan Rupakheti is a Solutions Architect and a Serverless Specialist at AWS. He is a passionate technical leader, researcher, and mentor with a knack for building innovative solutions in the cloud and bringing stakeholders together in their cloud journey. Outside his professional life, he loves spending time with his family and friends besides listening and playing music.
 Vinod Jayendra is a Enterprise Support Lead in ISV accounts at Amazon Web Services, where he helps customers in solving their architectural, operational, and cost optimization challenges. With a particular focus on Serverless technologies, he draws from his extensive background in application development to deliver top-tier solutions. Beyond work, he finds joy in quality family time, embarking on biking adventures, and coaching youth sports team.
 Rupesh Tiwari is a Senior Solutions Architect at AWS in New York City, with a focus on Financial Services. He has over 18 years of IT experience in the finance, insurance, and education domains, and specializes in architecting large-scale applications and cloud-native big data workloads. In his spare time, Rupesh enjoys singing karaoke, watching comedy TV series, and creating joyful moments with his family.

 Deepthi Mohan is a Principal PMT on the Amazon Managed Service for Apache Flink team.
 Francisco Morillo is a Streaming Solutions Architect at AWS. Francisco works with AWS customers, helping them design real-time analytics architectures using AWS services, supporting Amazon Managed Streaming for Apache Kafka (Amazon MSK) and Amazon Managed Service for Apache Flink.
 Happy New Year! Cloud technologies, machine learning, and generative AI have become more accessible, impacting nearly every aspect of our lives. Amazon CTO Dr. Werner Vogels offers four tech predictions for 2024 and beyond:


 DescribeGetMetricData – This handler returns a string that includes the name of the connector, default values for the arguments to the other handler, and a text description in