Post Syndicated from James Beswick original https://aws.amazon.com/blogs/compute/build-workflows-for-amazon-forecast-with-aws-step-functions/
This post is written by Péter Molnár, Data Scientist, ML ProServe and Sachin Doshi, Senior Application Architect, ProServe.
This blog builds a full lifecycle workflow for Amazon Forecast to predict household electricity consumption from historic data. Previously, developers used AWS Lambda function to build workflows for Amazon Forecast. You can now use AWS Step Functions with AWS SDK integrations to reduce cost and complexity.
Step Functions recently expanded the number of supported AWS service integrations from 17 to over 200 with AWS API actions from 46 to over 9,000 with AWS SDK service integrations.
Step Functions is a low-code visual workflow service used for workflow automation and service orchestration. Developers use Step Functions with managed services such as artificial intelligence services, Amazon S3, and AWS Glue.
You can create state machines that use AWS SDK Service Integrations with Amazon States Language (ASL), AWS Cloud Development Kit (AWS CDK), AWS Serverless Application Model (AWS SAM), or visually using AWS Step Function Workflow Studio.
To create workflows for AWS AI services like Forecast, you can use Step Functions AWS SDK service integrations. This approach can be simpler because it allows users to build solutions without writing JavaScript or Python code.
Workflow for Amazon Forecast
The solution includes four components:

- IAM role granting Step Functions control over Forecast.
- IAM role granting Forecast access to S3 storage locations.
- S3 bucket with input data
- Define Step Functions state machine and parameters for Forecast.
The repo provides an AWS SAM template to deploy these resources in your AWS account.
Understanding Amazon Forecast
Amazon Forecast is a fully managed service for time series forecasting. Forecast uses machine learning to combine time series data with additional variables to build forecasts.
Using Amazon Forecast involves steps that may take from minutes to hours. Instead of executing each step and waiting for its completion, you use Step Functions to define the steps of the forecasting process.
These are the individual steps of the Step Functions workflow:
- Create a dataset: In Forecast, there are three types of datasets, target time series, related time series, and item metadata. The target time series is required and the others provide additional context with certain algorithms.
- Import data: This moves the information from S3 into a storage volume where the data is used for training and validation.
- Create a dataset group: This is the large box that isolates models and the data they are trained on from each other.
- Train a model: Forecast automates this process for you but you can also select algorithms. You can provide your own hyper parameters or use hyperparameter optimization (HPO) to determine the most performant values.
- Export back-test results: this creates a detailed table of the model performance.
- Deploy a predictor to deploy the model to use it to generate a forecast.
- Export forecast to create future predictions.
For more details, read the documentation of the Forecast APIs.
Example dataset
This example uses the individual household electric power consumption dataset. This dataset is available from the UCI Machine Learning Repository. We have aggregated the usage data to hourly intervals.
The dataset has three columns: the timestamp, value, and item ID. These are the minimum required to generate a forecast with Amazon Forecast.
Read more about the data and parameters in https://github.com/aws-samples/amazon-forecast-samples/tree/master/notebooks/basic/Tutorial.
Step Functions AWS SDK integrations
The AWS SDK integrations of Step Functions reduce the need for Lambda functions that call the Forecast APIs. You can call any AWS SDK-compatible service directly from the ASL. Use the following syntax in the resource field of a Step Functions task:
arn:aws:states:::aws-sdk:serviceName:apiAction.[serviceIntegrationPattern]
The following example compares using Step Functions AWS SDK service integrations with calling the boto3 Python method to create a dataset with a corresponding resource in the state machine definition. This is the ASL of a Step Functions state machine:
"States": {
  "Create-Dataset": {
    "Resource": "arn:aws:states:::aws-sdk:forecast:createDataset",
    "Parameters": {
      "DatasetName": "blog_example",
      "DataFrequency": "H",
      "Domain": "CUSTOM",
      "DatasetType": "TARGET_TIME_SERIES",
      "Schema": {
        "Attributes": [
          {
            "AttributeName": "timestamp",
            "AttributeType": "timestamp"
          },
          {
            "AttributeName": "target_value",
            "AttributeType": "float"
          },
          {
            "AttributeName": "item_id",
            "AttributeType": "string"
          }
        ]
      }
    },
    "ResultPath": "$.createDatasetResult",
    "Next": "Import-Data"
  }
The structure is similar to the corresponding boto3 methods. Compare the Python code with the state machine code – it uses the same parameters as calling the Python API:
forecast = boto3.client('forecast')
response = forecast.create_dataset(
             Domain='CUSTOM',
             DatasetType='TARGET_TIME_SERIES',
             DatasetName='blog_example',
             DataFrequency='H',
             Schema={
               'Attributes': [
                  {
                    'AttributeName': 'timestamp',
                    'AttributeType': 'timestamp'
                  },
                  {
                    'AttributeName': 'target_value',
                    'AttributeType': 'float'
                  },
                  {
                    'AttributeName': 'item_id',
                    'AttributeType': 'string'
                  }
               ]
             }
           )
Handling asynchronous API calls
Several Forecast APIs run asynchronously, such as createDatasetImportJob and createPredictor. This means that your workflow must wait until the import job is completed.
You can use one of two methods in the state machine: create a wait loop, or allow any following task that depends on the completion of the previous task to retry.
In general, it is good practice to allow any task to retry for a few times. For simplicity this example does not include general error handling. Read the blog Handling Errors, Retries, and adding Alerting to Step Function State Machine Executions to learn more about writing robust state machines.
1. State machine wait loop

To wait for an asynchronous task to complete, use the services’ Describe* API methods to get the status of current job. You can implement the wait loop with the native Step Function tasks Choice and Wait.
Here, the task “Check-Data-Import” calls the describeDatasetImportJob API to receive a status value of the running job:
"Check-Data-Import": {
  "Type": "Task",
  "Resource": "arn:aws:states:::aws-sdk:forecast:describeDatasetImportJob",
  "Parameters": {
    "DatasetImportJobArn.$": "$.createDatasetImportJobResult.DatasetImportJobArn"
   },
   "ResultPath": "$.describeDatasetImportJobResult",
   "Next": "Fork-Data-Import"
 },
 "Fork-Data-Import": {
   "Type": "Choice",
   "Choices": [
     {
       "Variable": "$.describeDatasetImportJobResult.Status",
       "StringEquals": "ACTIVE",
       "Next": "Done-Data-Import"
     }
   ],
   "Default": "Wait-Data-Import"
 },
 "Wait-Data-Import": {
   "Type": "Wait",
   "Seconds": 60,
   "Next": "Check-Data-Import"
 },
 "Done-Data-Import": {
   "Type": "Pass",
   "Next": "Create-Predictor"
 },
2. Fail and retry
Alternatively, use the Retry parameter to specify how to repeat the API call in case of an error. This example shows how the attempt to create the forecast is repeated if the resource that it depends on is not created. In this case, the preceding task of creating the predictor.
The time between retries is set to 180 seconds and the number of retries must not exceed 100. This means that the workflow waits 3 minutes before trying again. The longest time to wait for the ML training is five hours.
With the BackoffRate set to 1, the wait interval of 3 minutes remains constant. Value greater that 1 may reduce the number of retries but may also add increased wait time for training jobs that run for several hours:
"Create-Forecast": {
  "Type": "Task",
  "Resource": "arn:aws:states:::aws-sdk:forecast:createForecast",
  "Parameters": {
    "ForecastName.$": "States.Format('{}_forecast', $.ProjectName)",
    "PredictorArn.$": "$.createPredictorResult.PredictorArn"
   },
   "ResultPath": "$.createForecastResult",
   "Retry": [
     {
       "ErrorEquals": ["Forecast.ResourceInUseException"],
       "IntervalSeconds": 180,
       "BackoffRate": 1.0,
       "MaxAttempts": 100
     }
   ],
   "Next": "Forecast-Export"
 },
Deploying the workflow
The AWS Serverless Application Model Command Line Interface (AWS SAM CLI) is an extension of the AWS CLI that adds functionality for building and testing serverless applications. Follow the instructions to install the AWS SAM CLI.
To build and deploy the application:
- Clone the GitHub repo:
git clone https://github.com/aws-samples/aws-stepfunctions-examples/tree/main/sam/demo-forecast-service-integration
- Change directory to cloned repo.
cd demo-forecast-service-integration
- Enable execute permissions for the deployment script
chmod 700 ./bootstrap_deployment_script.sh
- Execute the script with a stack name of your choosing as parameter.
./bootstrap_deployment_script.sh <Here goes your stack name>
The script builds the AWS SAM template and deploys the stack under the given name. The AWS SAM template creates the underlying resources like S3 bucket, IAM policies, and Step Functions workflow. The script also copies the data file used for training to the newly created S3 bucket.
Running the workflow
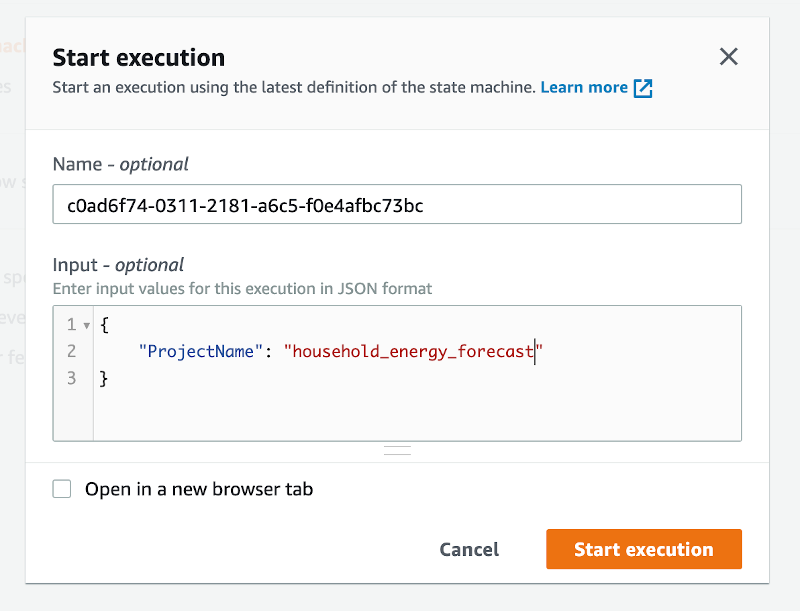
After the AWS SAM Forecast workflow application is deployed, run the workflow to train a forecast predictor for the energy consumption:
- Navigate to the AWS Step Functions console.
- Select the state machine named “ForecastWorkflowStateMachine-*” and choose New execution.
- Define the “ProjectName” parameter in form of a JSON structure. The name for the Forecast Dataset group is “household_energy_forecast”.

- Choose Start execution.
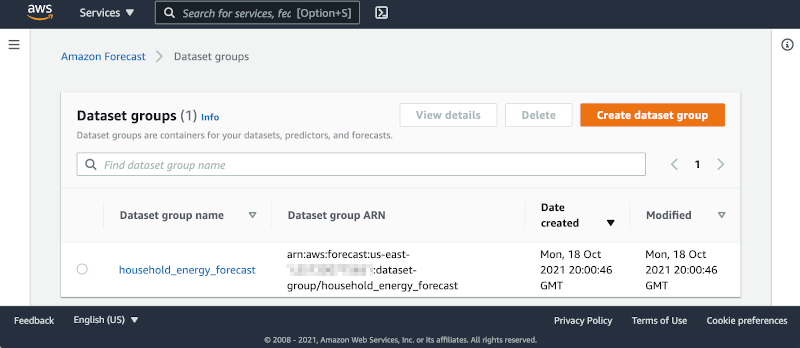
Viewing resources in the Amazon Forecast console
Navigate to the Amazon Forecast console and select the data set group “household_energy_forecast”. You can see the details of the Forecast resource as they are created. The provided state machine executes every step in the workflow and then deletes all resources, leaving the output files in S3.

You can disable the clean-up process by editing the state machine:
- Choose Edit to open the editor.
- Find the tasks “Clean-Up” and change the “Next” state from “Delete-Forecast_export” to “SuccessState”.
"Clean-Up": {
   "Type": "Pass",
   "Next": "SuccessState"
},
- Delete all tasks named Delete-*.
Remember to delete the dataset group manually if you bypass the clean-up process of the workflow.
Analyzing Forecast Results
The forecast workflow creates a folder “forecast_results” for all of its output files. In there you find the subfolders “backtestexport” with data produced by Backtest-Export task, and “forecast” with the predicted energy demand forecast produced by the Forecast-Export job.
The “backtestexport” folder contains two tables: “accuracy-metrics-values” with the model performance accuracy metrics, and “forecast-values” with the predicted forecast values of the training set. Read the blog post Amazon Forecast now supports accuracy measurements for individual items for details.
The forecast predictions are stored in the “forecast” folder. The table contains forecasts at three different quantiles: 10%, 50% and 90%.
The data files are partitioned into multiple CSV files. In order to analyze them, first download and merge the files into proper tables. Use the AWS CLI command to download
BUCKET="<your account number>-<your region>-sf-forecast-workflow"
aws s3 cp s3://$BUCKET/forecast_results . –recursive
Alternatively, you may import and analyze the data into Amazon Athena.
Cleaning up
To delete the application that you created, use the AWS SAM CLI.
sam delete --stack-name <Here goes your stack name>
Also delete the data files in the S3 bucket. If you skipped the clean-up tasks in your workflow, you must delete the dataset group from the Forecast console.
Important things to know
Here are things know, that will help you to use AWS SDK service integration:
- Call AWS SDK services directly from the ASL in the resource field of a task state. To do this, use the following syntax:
arn:aws:states:::aws-sdk:serviceName:apiAction.[serviceIntegrationPattern]
- Use camelCase for apiAction names in the Resource field, such as “copyObject”, and use PascalCase for parameter names in the Parameters field, such as “CopySource”.
- Step Functions cannot generate IAM policies for most AWS SDK service integrations. You must add those to the IAM role of the state machine explicitly.
Learn more about this new capability by reading its documentation.
Conclusion
This post shows how to create a Step Functions workflow for Forecast using AWS SDK service integrations, which allows you to use over 200 with AWS API actions. It shows two patterns for handling asynchronous tasks. The first pattern queries the describe-* API repeatedly and the second pattern uses the “Retry” option. This simplifies the development of workflows because in many cases they can replace Lambda functions.
For more serveless learning resources, visit Serverless Land.