Post Syndicated from Kirankumar Chandrashekar original https://aws.amazon.com/blogs/devops/controlling-aws-api-calls-from-amazon-q-developer-enterprise-governance-with-built-in-user-agent-markers/
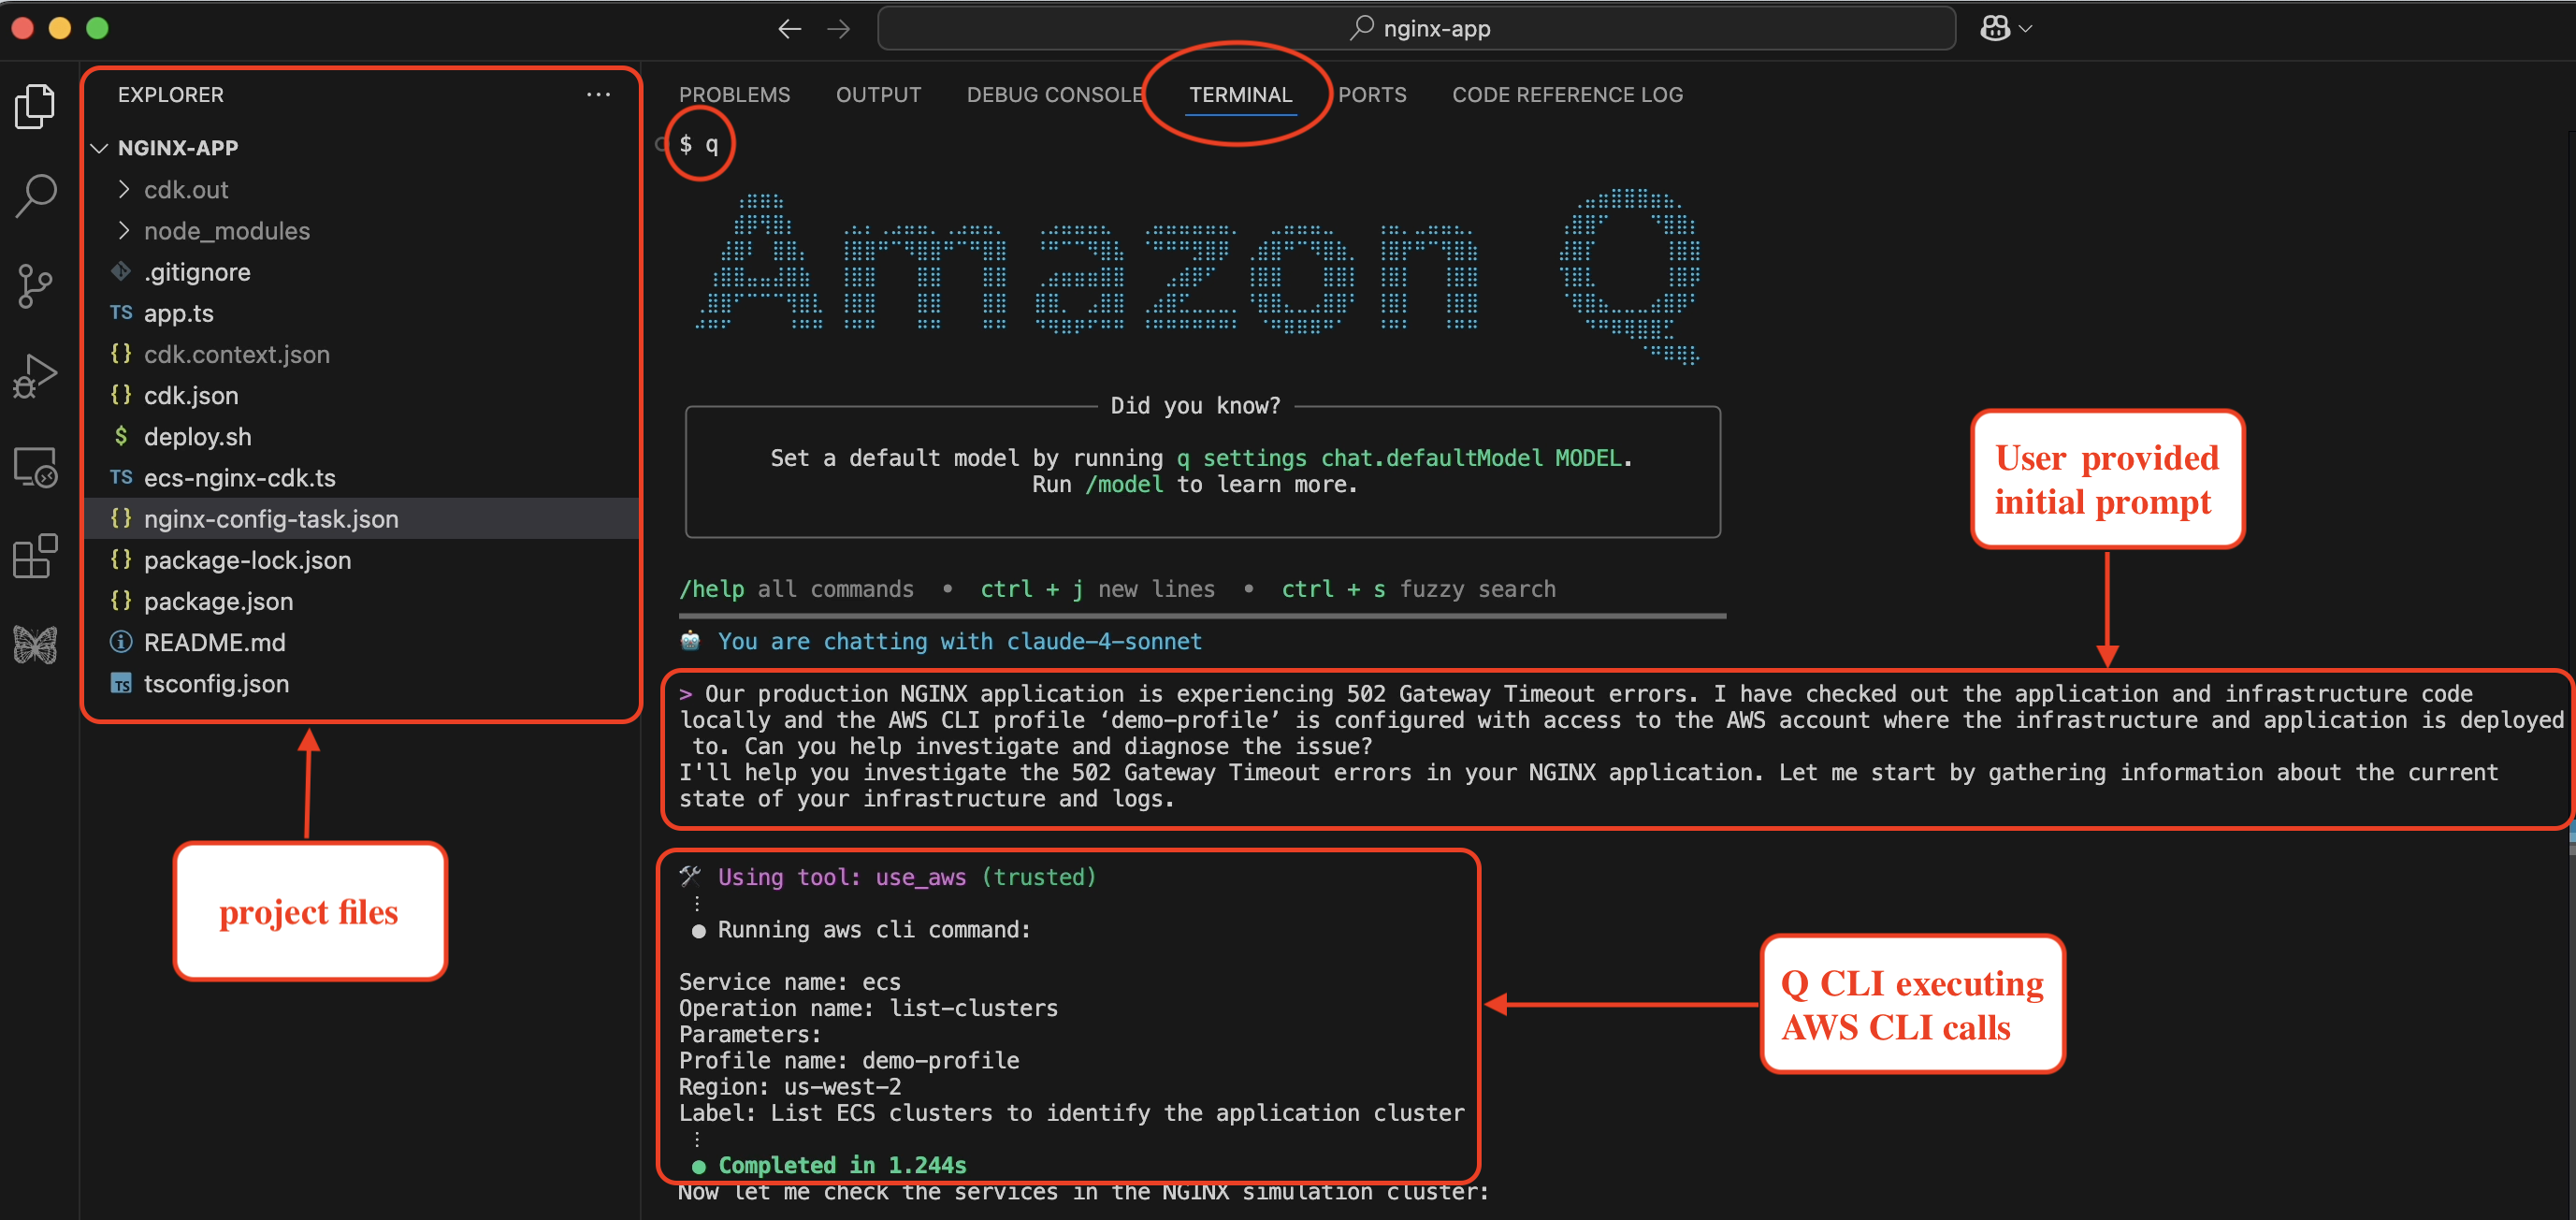
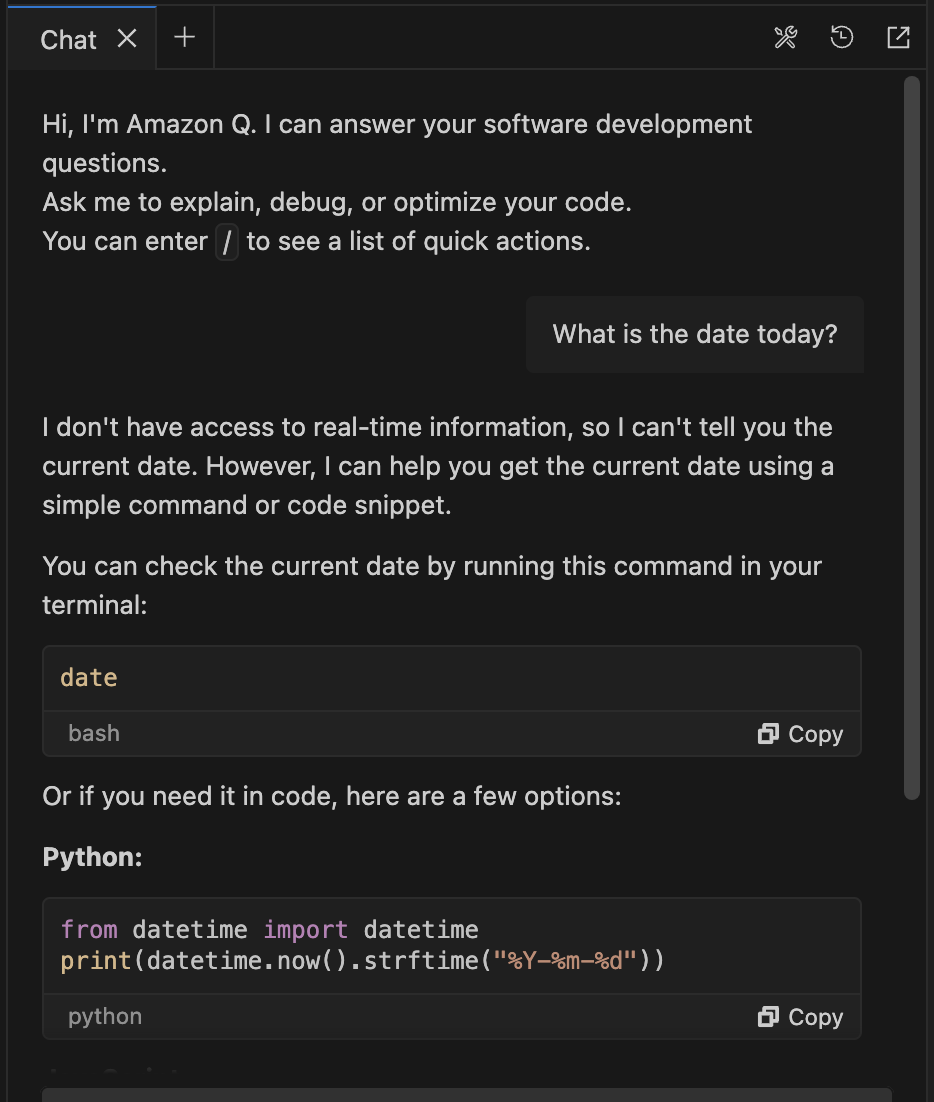
As organizations increasingly adopt AI-powered development tools, a critical challenge emerges: how do you maintain security governance when AI assistants execute AWS operations on behalf of users? Organizations want to leverage AI assistance for development and read operations while maintaining strict controls over write operations that impact production systems and auditing calls made via AI assistants. Consider this scenario: A developer asks Amazon Q Developer “List my S3 buckets”, Q Developer suggests aws s3 ls, the developer approves, and Q Developer executes the command via AWS CLI. From an AWS perspective, this looks identical to the developer manually running the aws s3 ls command on the terminal outside of Amazon Q Developer. But what if your organization needs to distinguish between AI-assisted operations and manual commands for governance or compliance?
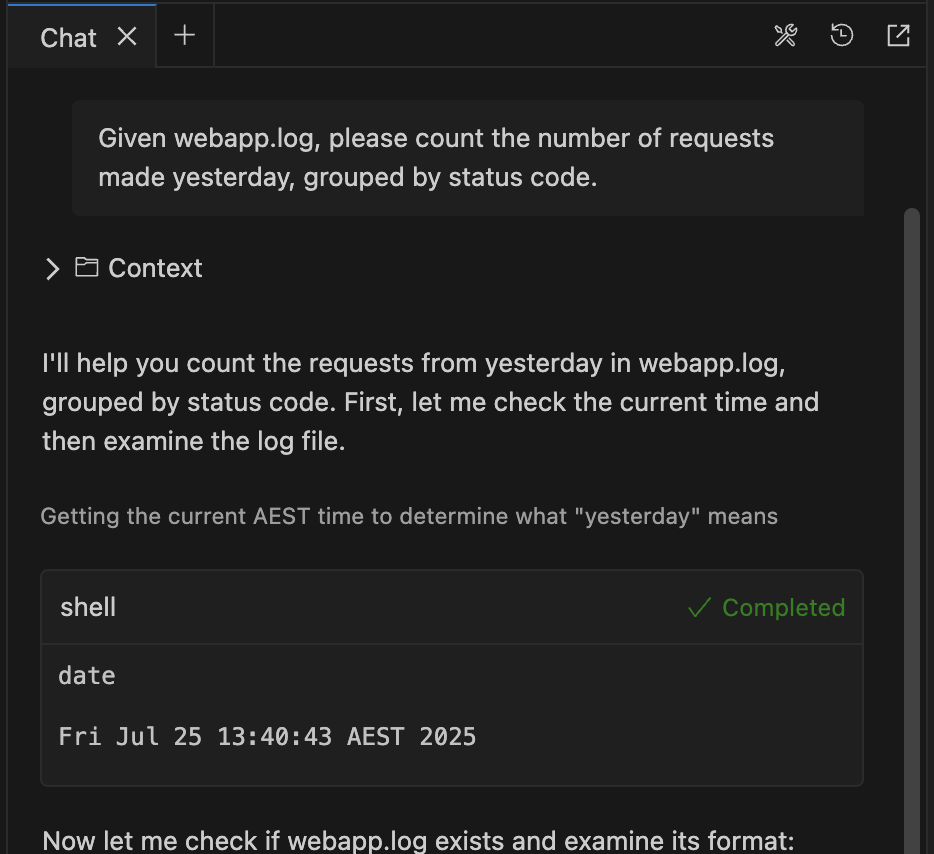
Amazon Q Developer, the most capable generative AI–powered assistant for software development, generates AWS CLI commands in response to user requests and executes them using its use_aws and execute_bash built-in tools. The challenge of distinguishing AI-assisted operations from manual commands is a key consideration for Amazon Q Developer adoption in enterprise environments. To address this governance challenge, Amazon Q Developer includes a built-in solution: user-agent markers that automatically identify AWS CLI calls made through Q Developer in CloudTrail logs, enabling precise IAM policy controls.
This blog post explores how Amazon Q Developer’s built-in user agent markers set for AWS CLI calls enable precise IAM policy controls, allowing organizations to distinguish and govern AI-assisted AWS operations while maintaining the productivity benefits of AI-powered development. The following sections demonstrate how these user agent markers work, how to implement IAM policies that leverage them, and how to monitor their effectiveness in your environment.
Understanding Amazon Q Developer User Agent Markers
Prerequisites
This section builds on your knowledge of these concepts and assumes you have the necessary setup in place. These foundational elements are essential for understanding how user agent markers work and for implementing the governance controls discussed later in this post. If you need guidance on any of these topics, please refer to the linked documentation:
- AWS CLI v2.x installation and configuration with credential setup – Required to execute AWS commands and observe user agent behavior
- Amazon Q Developer setup for CLI and/or IDE extensions – Needed to generate the user agent markers this post examines
- AWS CloudTrail concepts and API logging – Essential for monitoring and verifying user agent markers in practice
- IAM policies and permissions management – Critical for implementing the governance controls that leverage these markers
Amazon Q Developer automatically includes identifiable markers in the user agent string of all AWS API calls it makes via AWS CLI. These markers appear in two primary contexts: CLI tool operations and IDE integration operations.
Q Developer CLI Tool
When using Amazon Q Developer CLI (both use_aws and execute_bash tools), all AWS CLI calls include:
exec-env/AmazonQ-For-CLI-Version-<QCLI-VersionNo>
How It Works: Amazon Q Developer CLI automatically sets:
AWS_EXECUTION_ENV=AmazonQ-For-CLI-Version-<QCLI-VersionNo>
This means all AWS CLI commands executed through Q Developer CLI – whether via the use_aws tool or execute_bash commands – automatically include this marker.
Q Developer IDE Integration
When using Amazon Q Developer from IDE integrations, AWS CLI calls include:
exec-env/AmazonQ-For-IDE-Version-<QIDE-Plugin-VersionNo>
How It Works: Amazon Q Developer IDE plugin automatically sets:
AWS_EXECUTION_ENV=AmazonQ-For-IDE-Version-<QIDE-Plugin-VersionNo>
This applies when Q Developer makes AWS API calls through IDE integrations, such as when analyzing your codebase or suggesting AWS resource configurations. The IDE marker enables you to distinguish between CLI-based and IDE-based Q Developer operations.
Complete User Agent Example
Here’s how a complete user agent string appears in CloudTrail:
From Q Developer CLI:
"userAgent": "aws-cli/2.27.17 md/awscrt#0.26.1 ua/2.1 os/macos#24.6.0 md/arch#x86_64 lang/python#3.13.3 md/pyimpl#CPython exec-env/AmazonQ-For-CLI-Version-1.15.0
cfg/retry-mode#standard md/installer#exe md/prompt#off md/command#sts.get-caller-identity"
From Q Developer IDE Integration:
"user-agent": "aws-cli/2.27.17 md/awscrt#0.26.1 ua/2.1 os/macos#24.6.0 md/arch#x86_64 lang/python#3.13.3 md/pyimpl#CPython exec-env/AmazonQ-For-IDE-Version-1.93.0
cfgretry-mode#standard md/installer#exe md/prompt#off md/command#sts.get-caller-identity"
The key identifiers are exec-env/AmazonQ-For-CLI-Version-* and exec-env/AmazonQ-For-IDE-Version-*, which clearly distinguish Amazon Q Developer operations from regular AWS CLI/SDK usage executed outside of Q Developer.
Architecture Diagram
┌─────────────────────────────────────────────────────────────────────────────┐
│                           Amazon Q Developer Flow                           │
└─────────────────────────────────────────────────────────────────────────────┘

┌──────────────────┐    ┌──────────────────┐    ┌──────────────────┐
│   Developer      │    │   Amazon Q       │    │   AWS APIs       │
│                  │    │   Developer      │    │                  │
│ ┌──────────────┐ │    │                  │    │                  │
│ │ Q CLI        │ │    │ ┌──────────────┐ │    │ ┌──────────────┐ │
│ │ use_aws tool │ │────┼─│ Adds marker: │ │────┼─│ CloudTrail   │ │
│ └──────────────┘ │    │ │ exec-env/    │ │    │ │ Event with   │ │
│                  │    │ │ AmazonQ-For- │ │    │ │ User Agent   │ │
│ ┌──────────────┐ │    │ │ CLI-Version  │ │    │ │ Marker       │ │
│ │ IDE          │ │    │ └──────────────┘ │    │ └──────────────┘ │
│ │ Integration  │ │────┼─│ Adds marker: │ │    │                  │
│ └──────────────┘ │    │ │ exec-env/    │ │    │                  │
│                  │    │ │ AmazonQ-For- │ │    │                  │
│ ┌──────────────┐ │    │ │ IDE-Version  │ │    │                  │
│ │ execute_bash │ │────┼─└──────────────┘ │    │                  │
│ │ commands     │ │    │                  │    │                  │
│ └──────────────┘ │    │                  │    │                  │
└──────────────────┘    └──────────────────┘    └──────────────────┘
         │                        │                        │
         │                        │                        │
         ▼                        ▼                        ▼
┌──────────────────────────────────────────────────────────────────────────────┐
│                              IAM Policy Engine                               │
│                                                                              │
│  ┌─────────────────────────────────────────────────────────────────────────┐ │
│  │ Condition: StringLike                                                   │ │
│  │ "aws:userAgent": "*exec-env/AmazonQ-For-*"                              │ │
│  │                                                                         │ │
│  │ ┌─────────────────┐              ┌─────────────────┐                    │ │
│  │ │ Q Developer     │              │ Regular AWS     │                    │ │
│  │ │ Operations      │              │ CLI Operations  │                    │ │
│  │ │                 │              │                 │                    │ │
│  │ │ • Block writes  │              │ • Allow writes  │                    │ │
│  │ │ • Allow reads   │              │ • Allow reads   │                    │ │
│  │ └─────────────────┘              └─────────────────┘                    │ │
│  └─────────────────────────────────────────────────────────────────────────┘ │
└──────────────────────────────────────────────────────────────────────────────┘
IAM Policy Implementation
Use the aws:userAgent condition in IAM policies to control Amazon Q Developer operations through two approaches:
IAM Policies: Deploy in each AWS account where developers have access for deploying workloads or performing AWS operations. Q Developer operates using the developer’s existing AWS credentials and permissions – it doesn’t have additional access beyond what the user already possesses. Attach these policies to the same IAM users, groups, or roles that developers use for their regular AWS work.
Service Control Policies (SCPs): Deploy once at the AWS Organizations level for organization-wide governance. SCPs apply to all member accounts automatically and cannot be overridden by account-level policies.
The following policy allows read operations from Q Developer, blocks write operations from Q Developer, and allows write operations from regular AWS CLI executed outside Q Developer:
Note: This IAM policy example is for illustration purposes only. Follow least privilege principles in production environments. For more details refer prepare for least previlege permissions.
{
  "Version": "2012-10-17",
  "Statement": [
    {
      "Sid": "AllowReadOperationsFromQDeveloper",
      "Effect": "Allow",
      "Action": [
        "s3:GetObject*",
        "s3:ListBucket*",
        "ec2:Describe*"
      ],
      "Resource": "*",
      "Condition": {
        "StringLike": {
          "aws:userAgent": "*exec-env/AmazonQ-For-*"
        }
      }
    },
    {
      "Sid": "BlockWriteOperationsFromQDeveloper",
      "Effect": "Deny",
      "Action": [
        "s3:DeleteObject*",
        "ec2:TerminateInstances",
        "iam:DeleteUser"
      ],
      "Resource": "*",
      "Condition": {
        "StringLike": {
          "aws:userAgent": "*exec-env/AmazonQ-For-*"
        }
      }
    },
    {
      "Sid": "AllowWriteOperationsFromRegularCLI",
      "Effect": "Allow",
      "Action": [
        "s3:DeleteObject*",
        "ec2:TerminateInstances",
        "iam:DeleteUser"
      ],
      "Resource": "*",
      "Condition": {
        "StringNotLike": {
          "aws:userAgent": "*exec-env/AmazonQ-For-*"
        }
      }
    }
  ]
}
Note on User Agent Reliability: While AWS warns that user agents can be “spoofed,” this concern is reduced for Q Developer governance use cases. The user agent is automatically set by Q Developer’s tools, not manually controlled by users. Any spoofing would require deliberate effort and would be detectable through usage pattern analysis. This approach is designed for operational governance and policy differentiation, not as a sole security control.
Additional Control Layer: Custom Agent Configuration
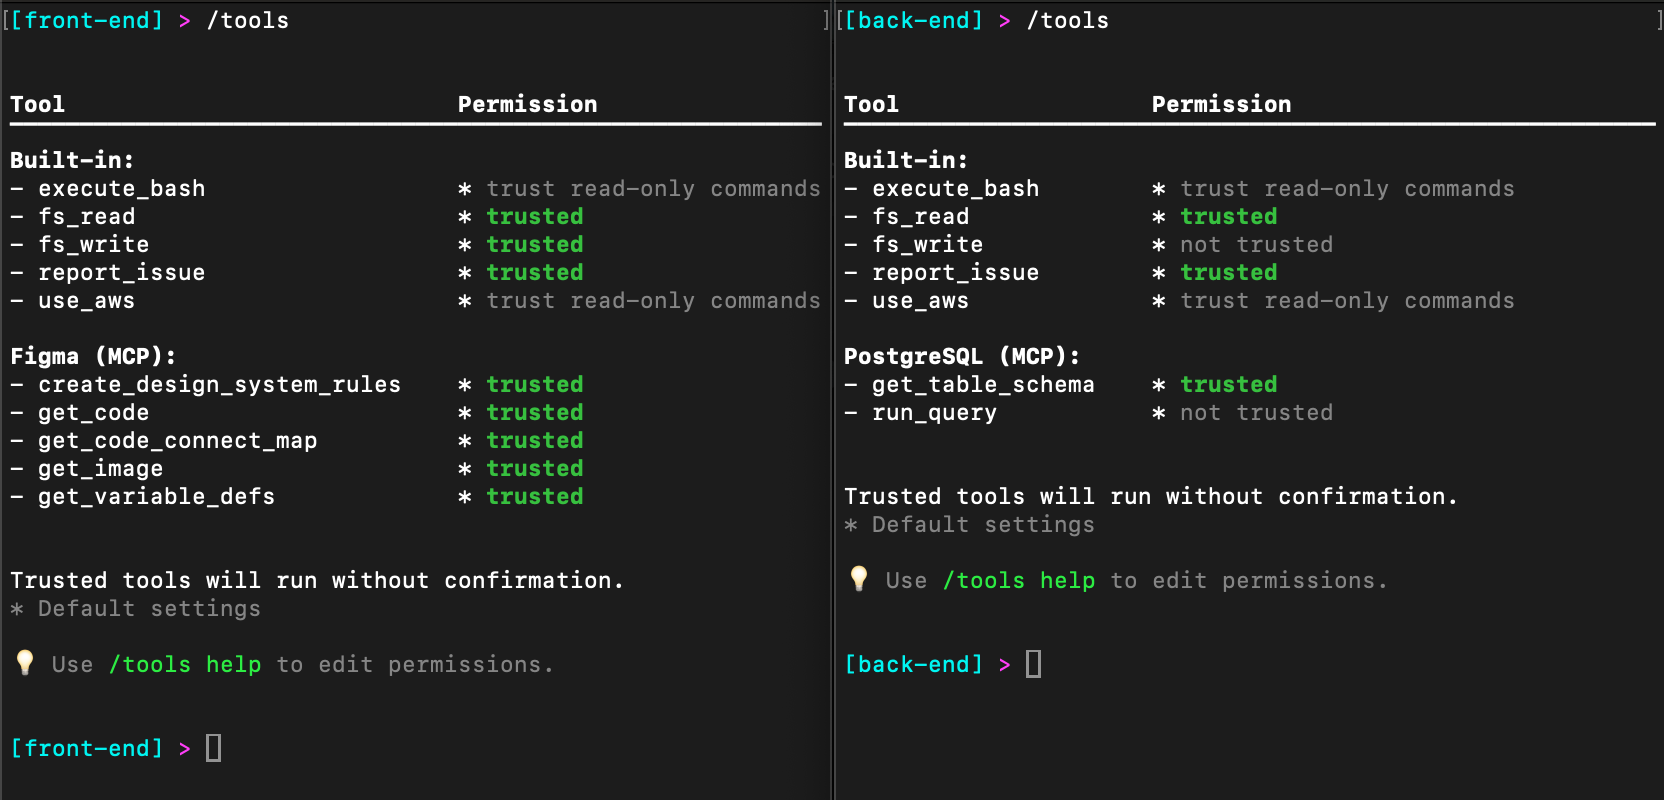
For an additional layer of control, you can create a custom agent configuration that restricts which AWS services Amazon Q Developer can access using allowedServices and deniedServices parameters for the use_aws tool:
{
  "toolsSettings": {
    "use_aws": {
      "allowedServices": ["s3", "lambda", "ec2"],
      "deniedServices": ["eks", "rds"]
    }
  }
}
This custom agent configuration works in conjunction with IAM policies to provide defense-in-depth governance of AI-assisted AWS operations. For more details, refer to the agent configuration documentation.
Verification and Monitoring
CloudTrail Event Analysis
To verify that your policies are working correctly, examine CloudTrail events. Here’s what to look for:
Amazon Q Developer Event
{
  "eventTime": "2025-01-15T10:30:00Z",
  "eventName": "GetCallerIdentity",
  "userAgent": "aws-cli/2.27.17 md/awscrt#0.26.1 ua/2.1 os/macos#24.6.0 md/arch#x86_64 lang/python#3.13.3 md/pyimpl#CPython exec-env/AmazonQ-For-CLI-Version-1.15.0 cfg/retry-mode#standard md/installer#exe md/prompt#off md/command#sts.get-caller-identity",
  "sourceIPAddress": "203.0.113.12",
  "userIdentity": {
    "type": "IAMUser",
    "principalId": "AIDACKCEVSQ6C2EXAMPLE",
    "arn": "arn:aws:iam::123456789012:user/developer"
  }
}
Regular AWS CLI Event
{
  "eventTime": "2025-01-15T10:35:00Z",
  "eventName": "GetCallerIdentity",
  "userAgent": "aws-cli/2.27.17 md/awscrt#0.26.1 ua/2.1 os/macos#24.6.0 md/arch#x86_64 lang/python#3.13.3 md/pyimpl#CPython cfg/retry-mode#standard md/installer#exe md/prompt#off md/command#sts.get-caller-identity",
  "sourceIPAddress": "203.0.113.12",
  "userIdentity": {
    "type": "IAMUser",
    "principalId": "AIDACKCEVSQ6C2EXAMPLE",
    "arn": "arn:aws:iam::123456789012:user/developer"
  }
}
Monitoring Script Example
Create a simple monitoring script to track Amazon Q Developer usage:
#!/bin/bash
# Monitor Amazon Q Developer AWS API usage
# Get events from last 24 hours and filter for Q Developer user agents
aws cloudtrail lookup-events \
  --start-time $(date -u -v-24H '+%Y-%m-%dT%H:%M:%SZ') \
  --lookup-attributes AttributeKey=EventName,AttributeValue=GetCallerIdentity \
  --query 'Events[?contains(CloudTrailEvent, `AmazonQ-For-CLI`)].[EventTime,EventName,UserIdentity.userName]' \
  --output table
Conclusion
Amazon Q Developer’s built-in user agent markers provide a powerful foundation for implementing enterprise-grade security controls around AI-assisted AWS operations. By leveraging these markers in IAM policies, organizations can:
- Distinguish between AI-assisted and manual AWS operations
- Implement differentiated security policies based on operation source
- Maintain detailed audit trails for compliance requirements
- Enable secure Amazon Q Developer adoption in enterprise environments while maintaining strict controls over write operations that could impact production systems
For organizations currently evaluating Amazon Q Developer adoption, implementing user agent marker-based controls is a key component of your deployment strategy. This approach enables you to realize the productivity benefits of AI-assisted development while maintaining the governance and security controls your organization requires.
Experience the power of Amazon Q Developer as your AI-powered coding assistant, and implement the governance controls outlined in this post to ensure secure adoption in your enterprise environment. These built-in user agent markers enable you to maintain enterprise-grade security while unlocking the productivity benefits of AI-assisted development.
To learn more about Amazon Q Developer’s features and capabilities, visit the Amazon Q Developer product page.
About the Author

Kirankumar Chandrashekar is a Generative AI Specialist Solutions Architect at AWS, focusing on Amazon Q Developer/Kiro and developer productivity. Bringing deep expertise in AWS cloud services, DevOps, modernization, and infrastructure as code, he helps customers accelerate their development cycles and elevate developer productivity through innovative AI-powered solutions. By leveraging Amazon Q Developer and Kiro, he enables teams to build applications faster, automate routine tasks, and streamline development workflows. Kirankumar is dedicated to enhancing developer efficiency while solving complex customer challenges, and enjoys music, cooking, and traveling.
 Aaron Sempf is Next Gen Tech Lead for the AWS Partner Organization in Asia-Pacific and Japan. With over 20 years in distributed system engineering design and development, he focuses on solving for large scale complex integration and event driven systems. In his spare time, he can be found coding prototypes for autonomous robots, IoT devices, distributed solutions, and designing agentic architecture patterns for generative AI assisted business automation.
 Joshua Toth is a Senior Prototyping Engineer with over a decade of experience in software engineering and distributed systems. He specializes in solving complex business challenges through technical prototypes, demonstrating the art of the possible. With deep expertise in proof of concept development, he focuses on bridging the gap between emerging technologies and practical business applications. In his spare time, he can be found developing next-generation interactive demonstrations and exploring cutting-edge technological innovations.


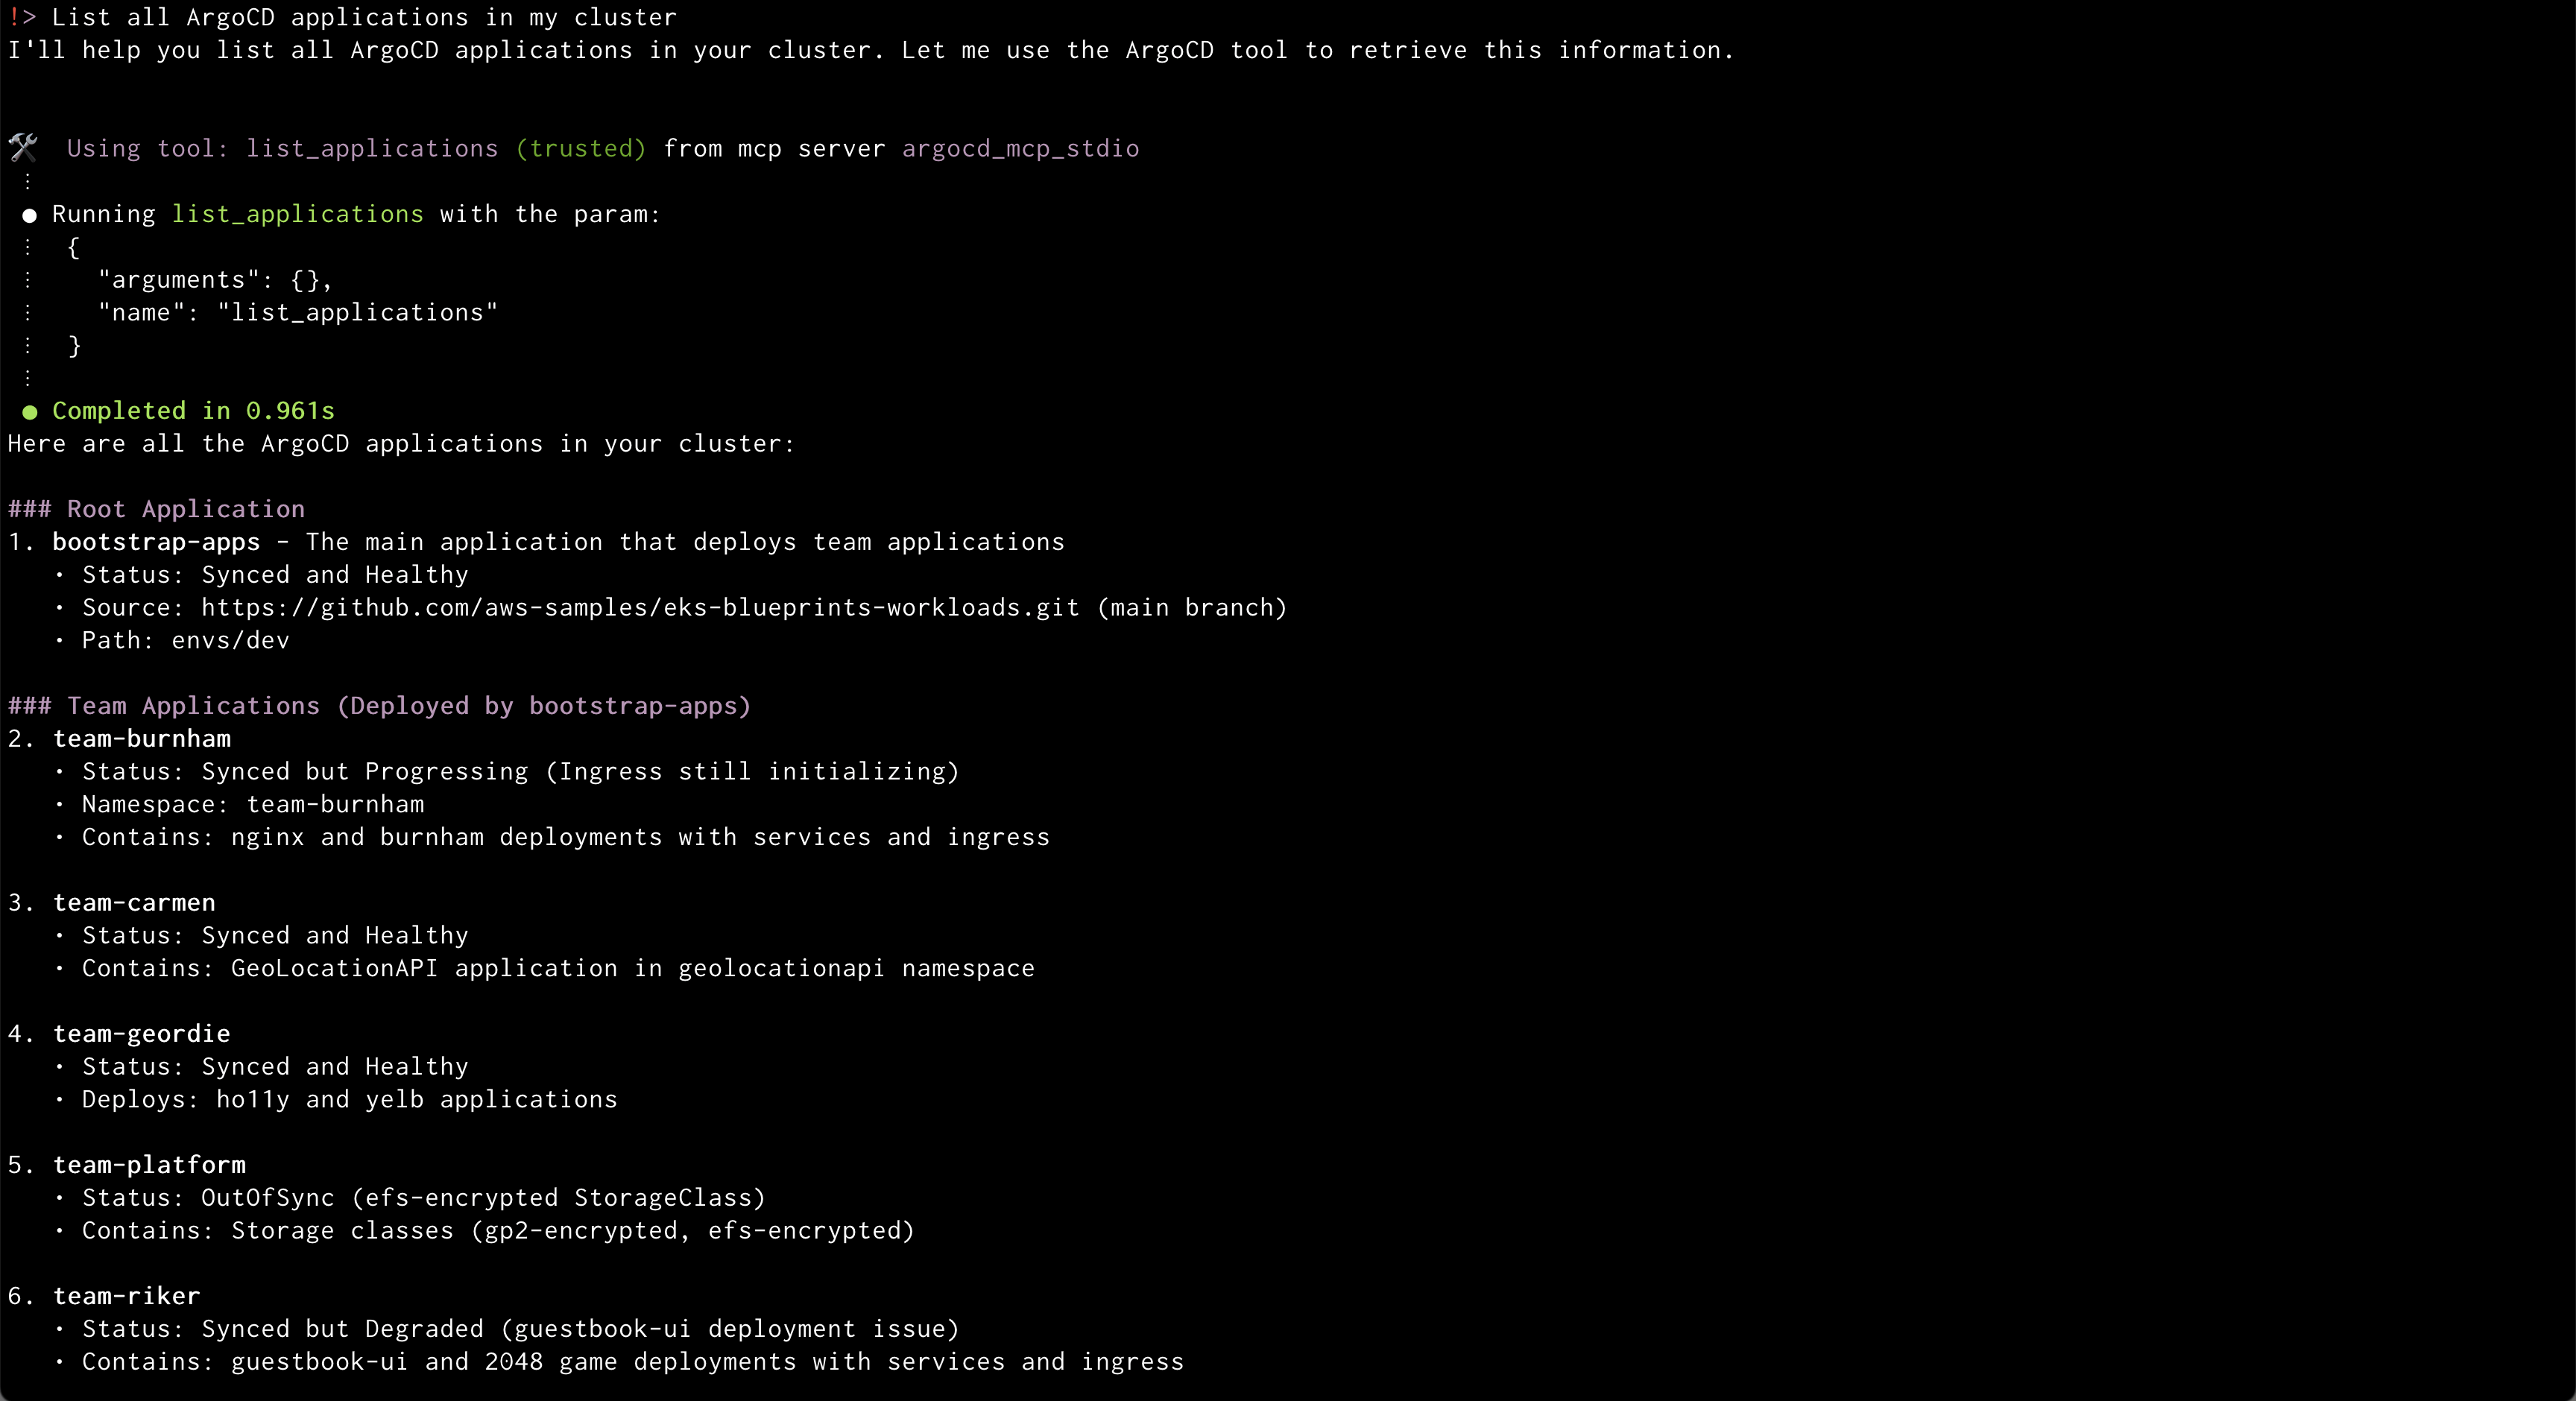 Amazon Q will use the ArgoCD MCP server to retrieve and display all applications
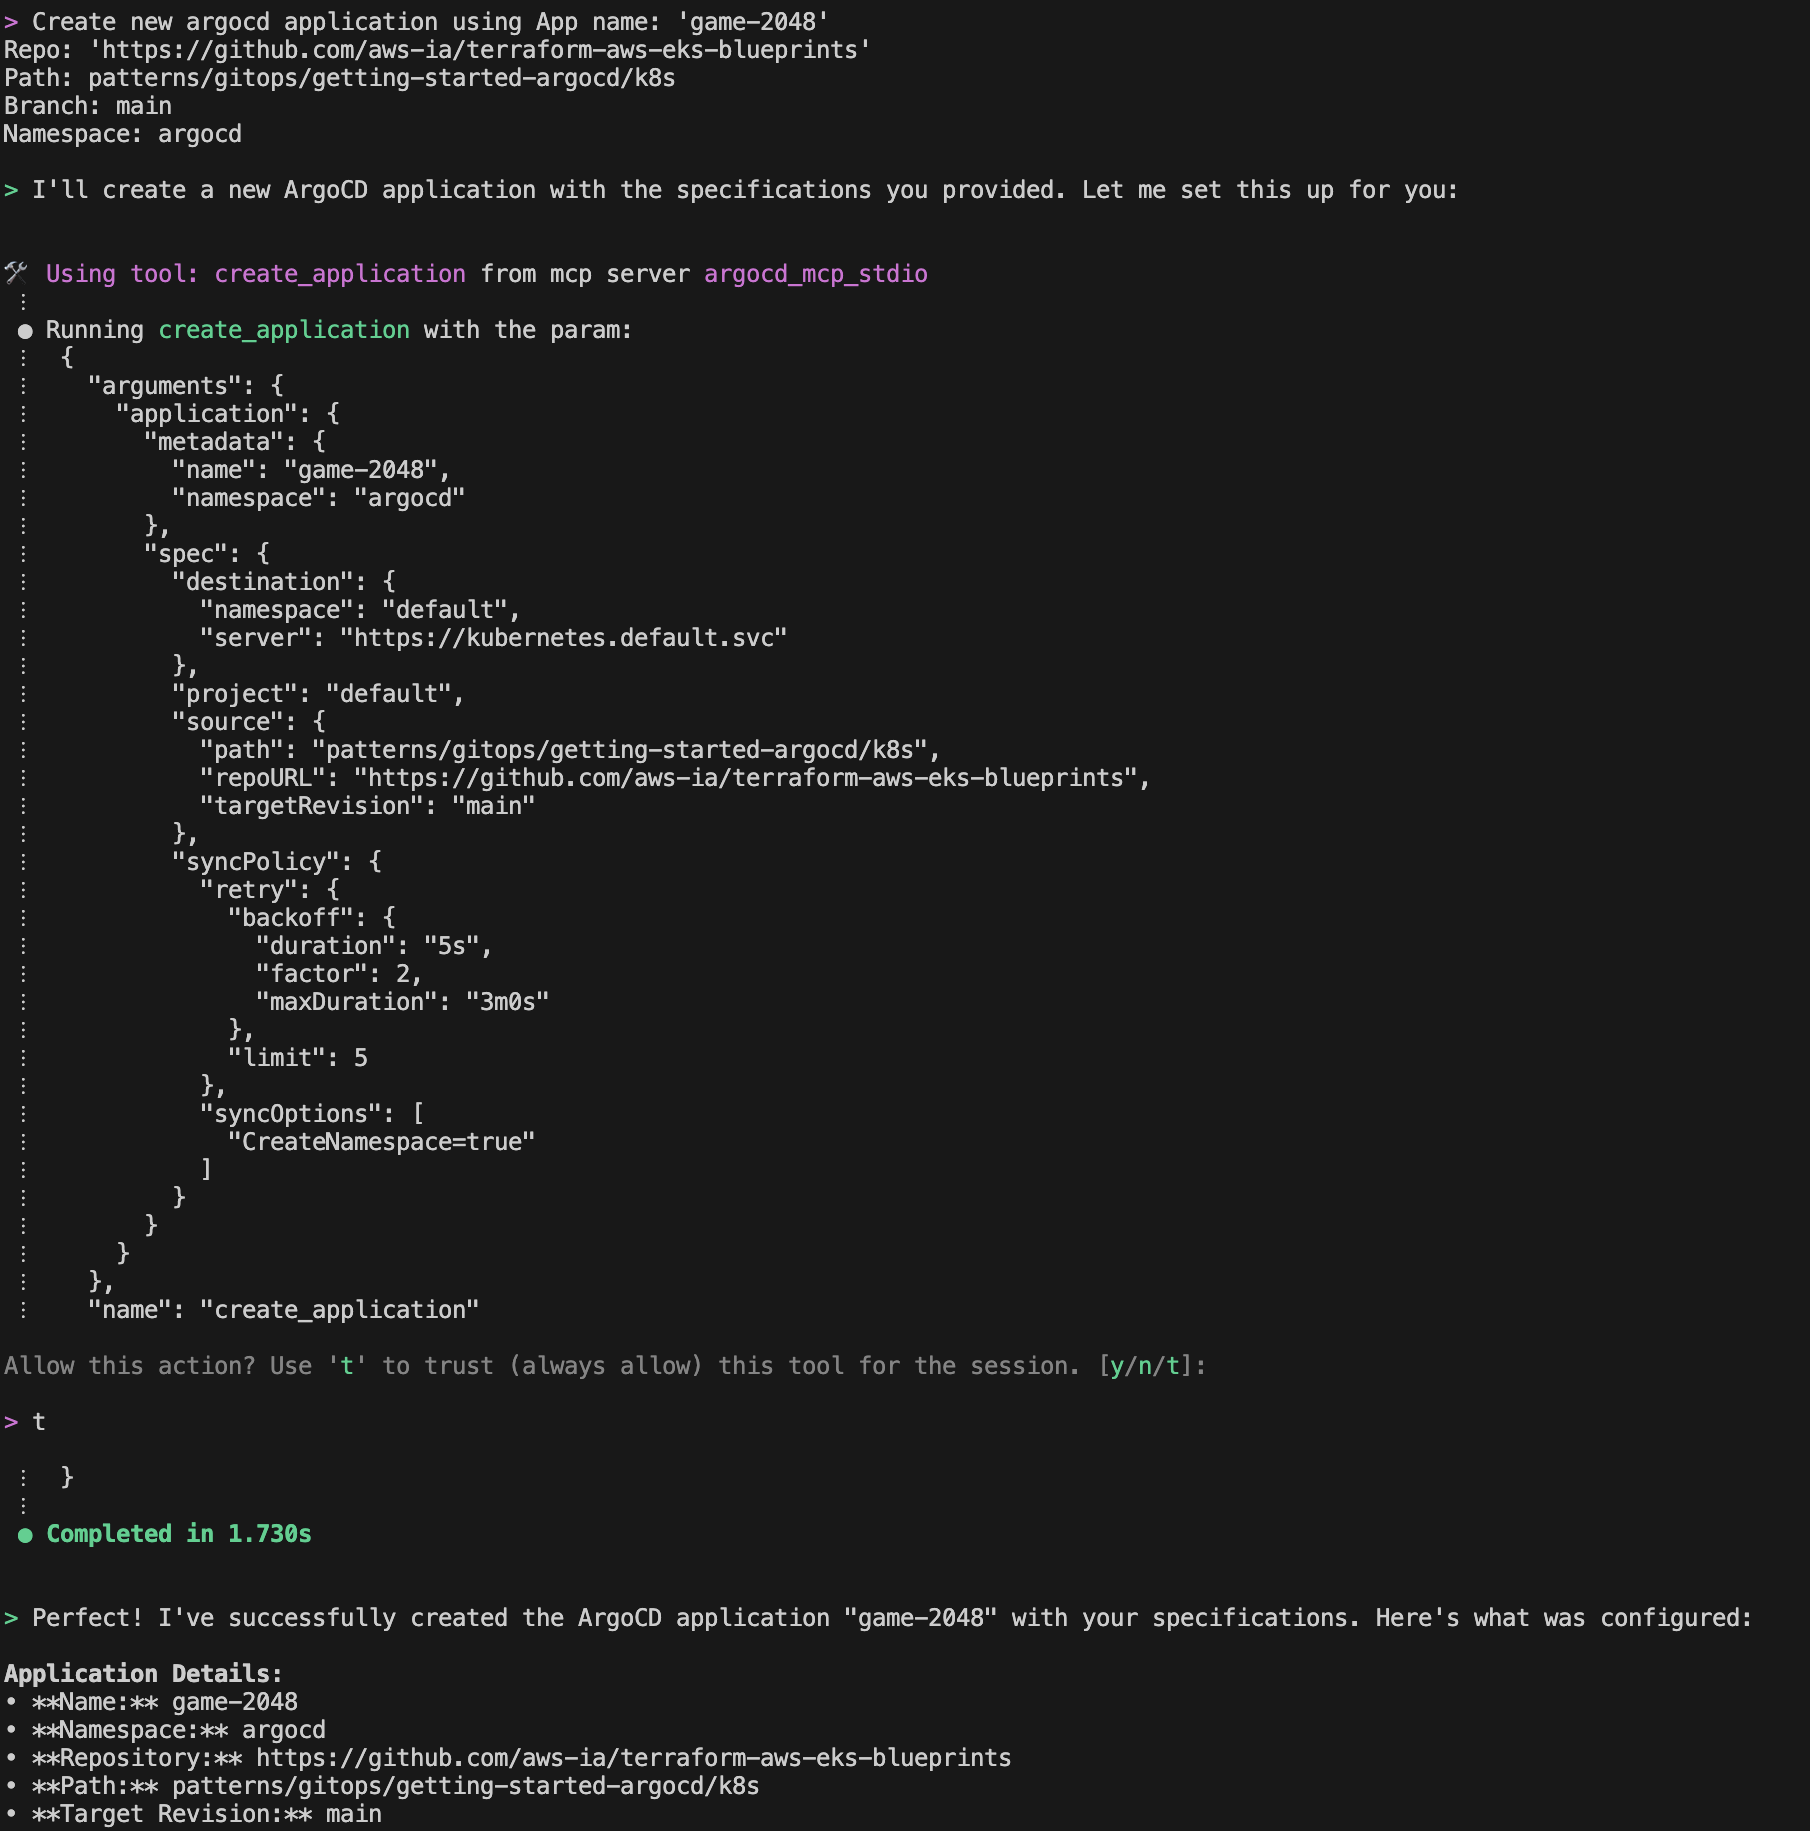 Amazon Q will create a new application from GitRepo information provided
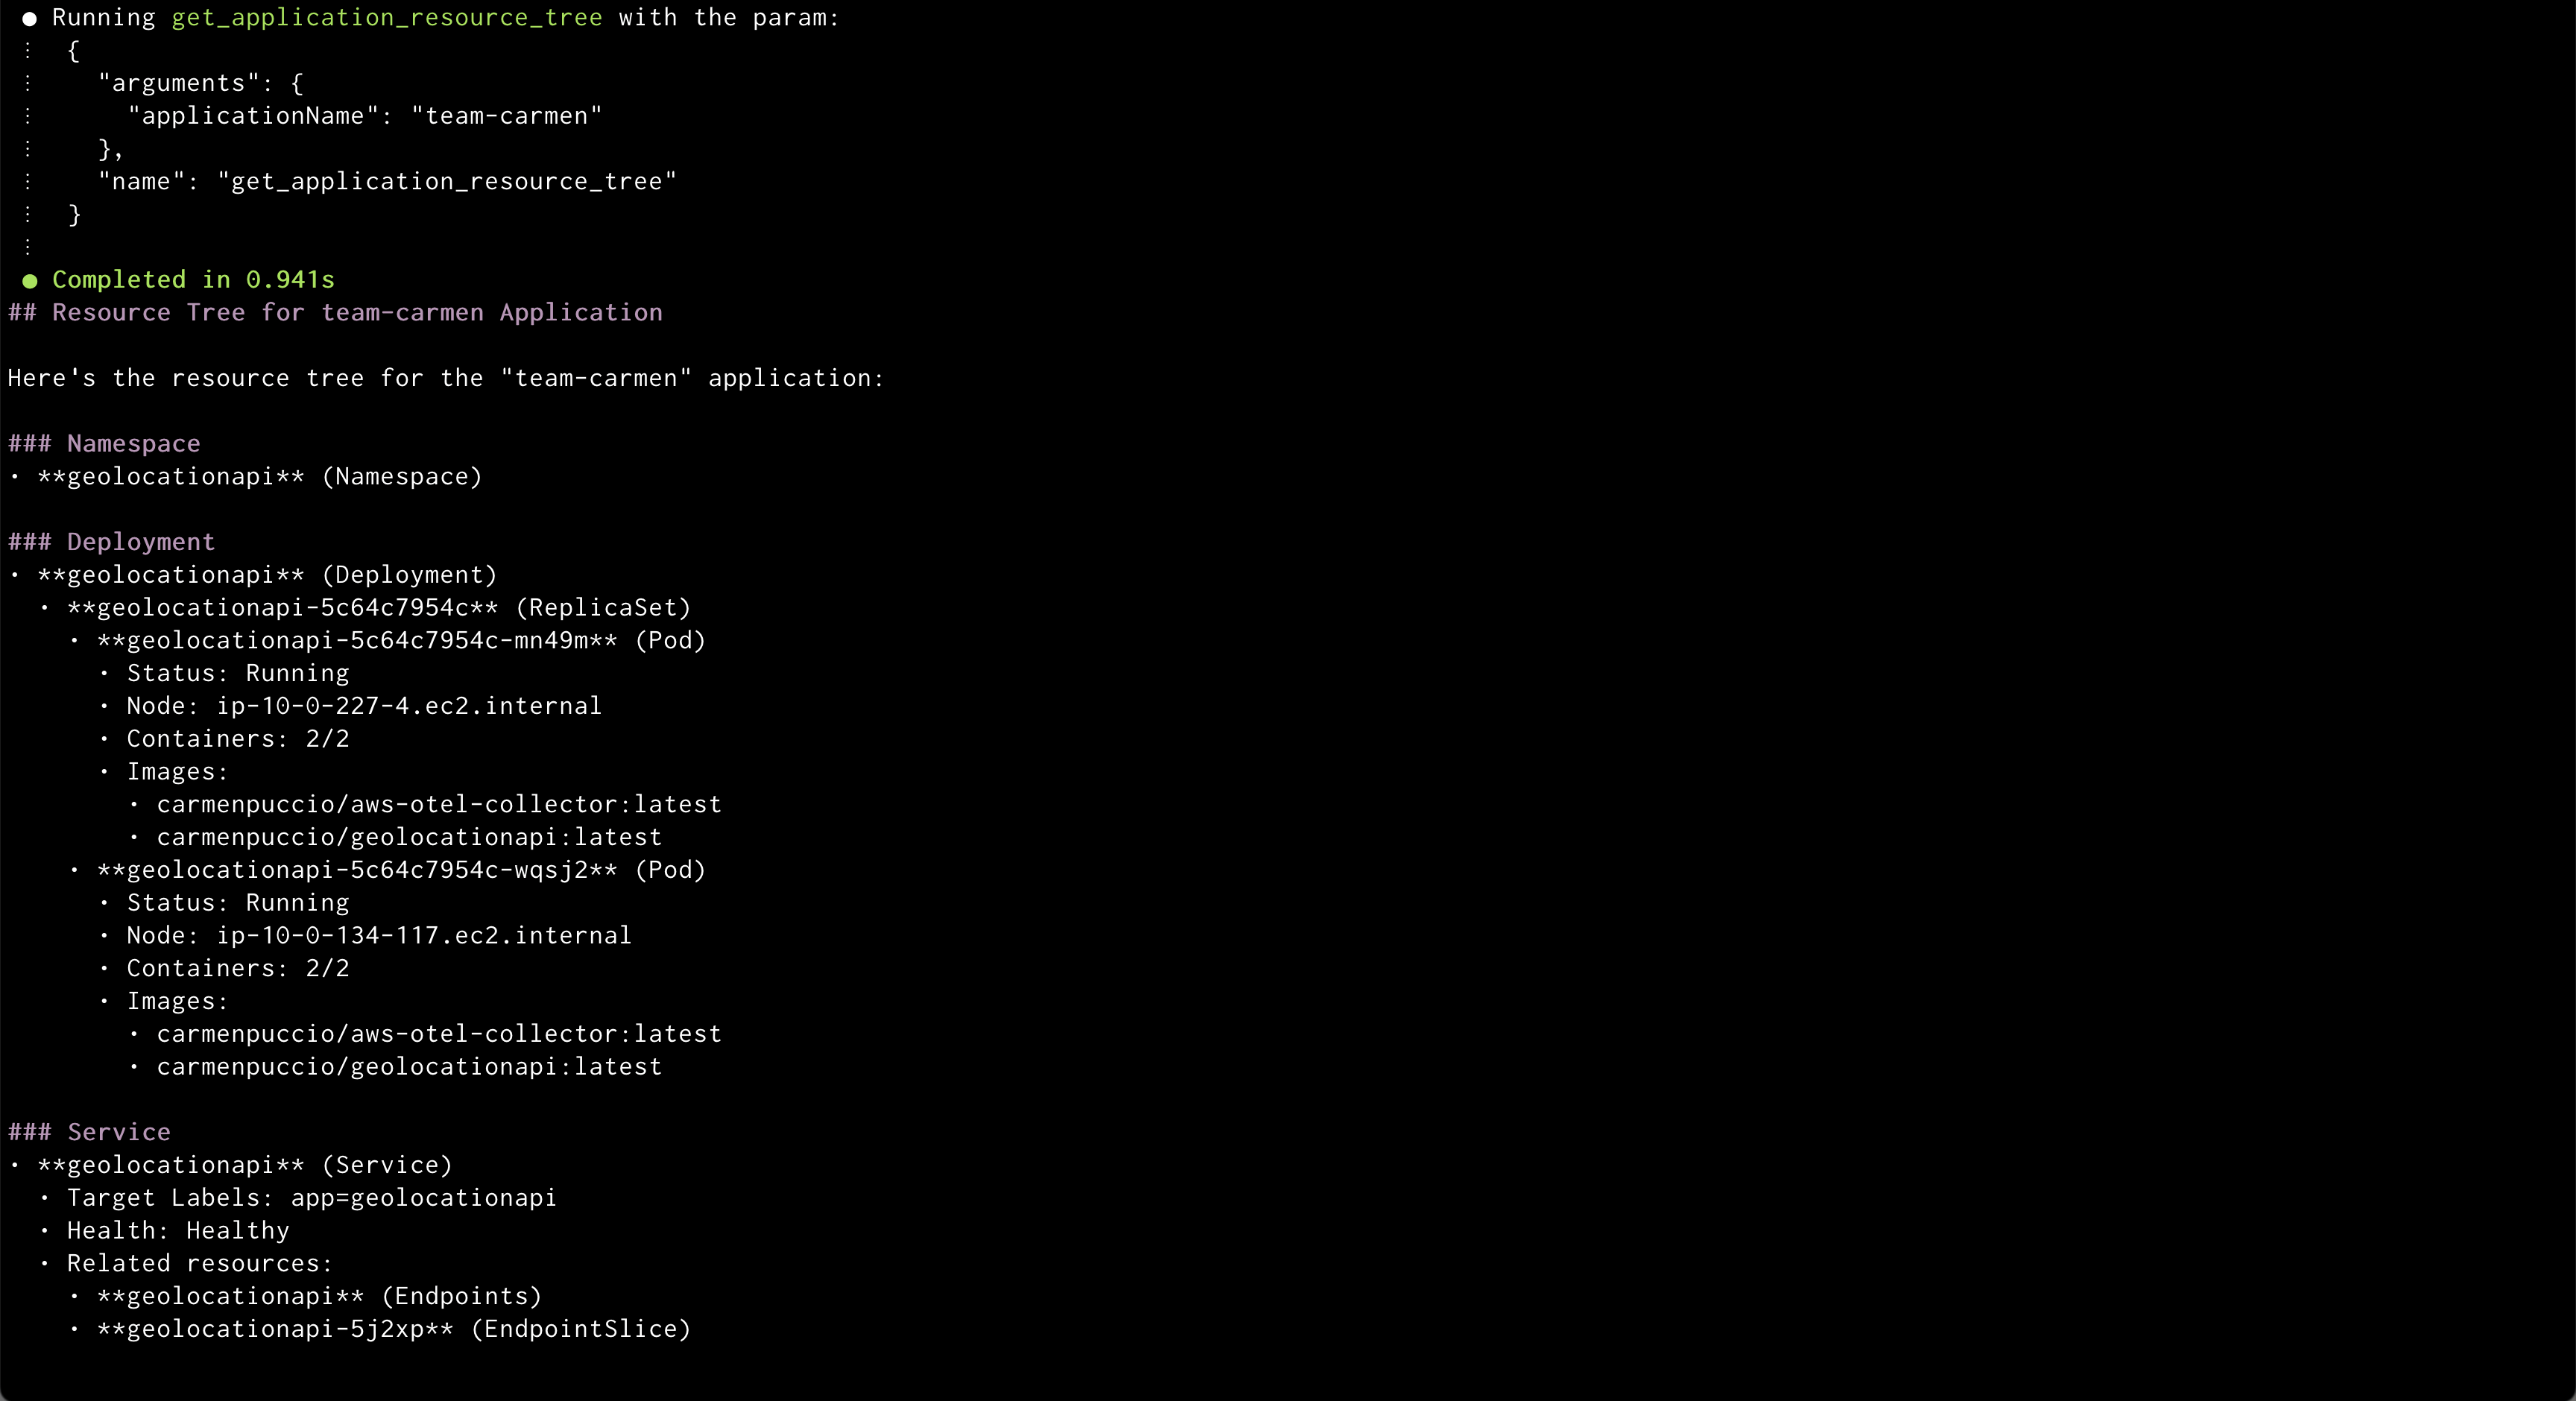
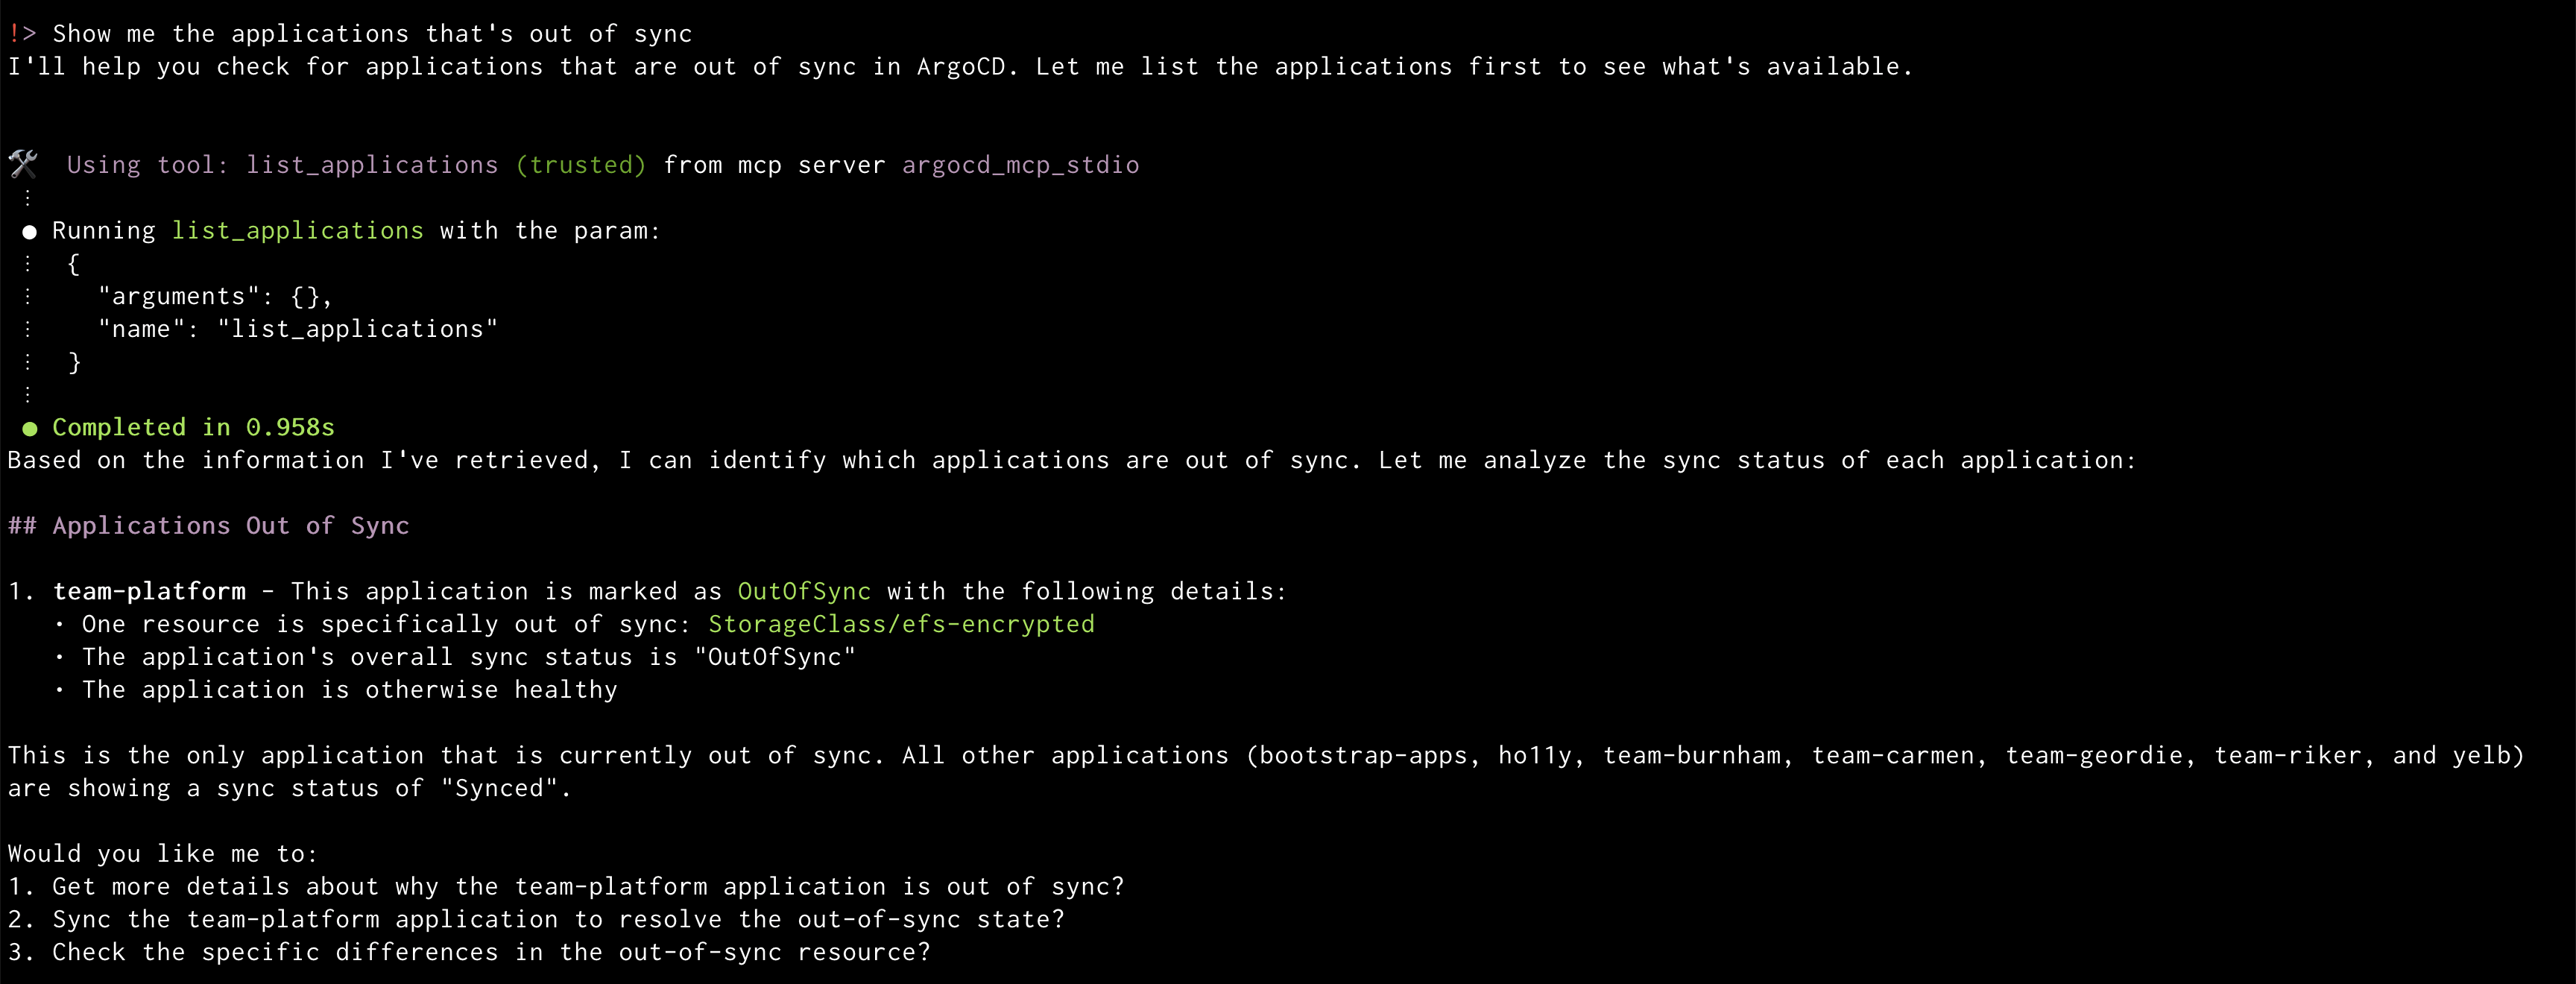 Amazon Q will display the out of sync applications
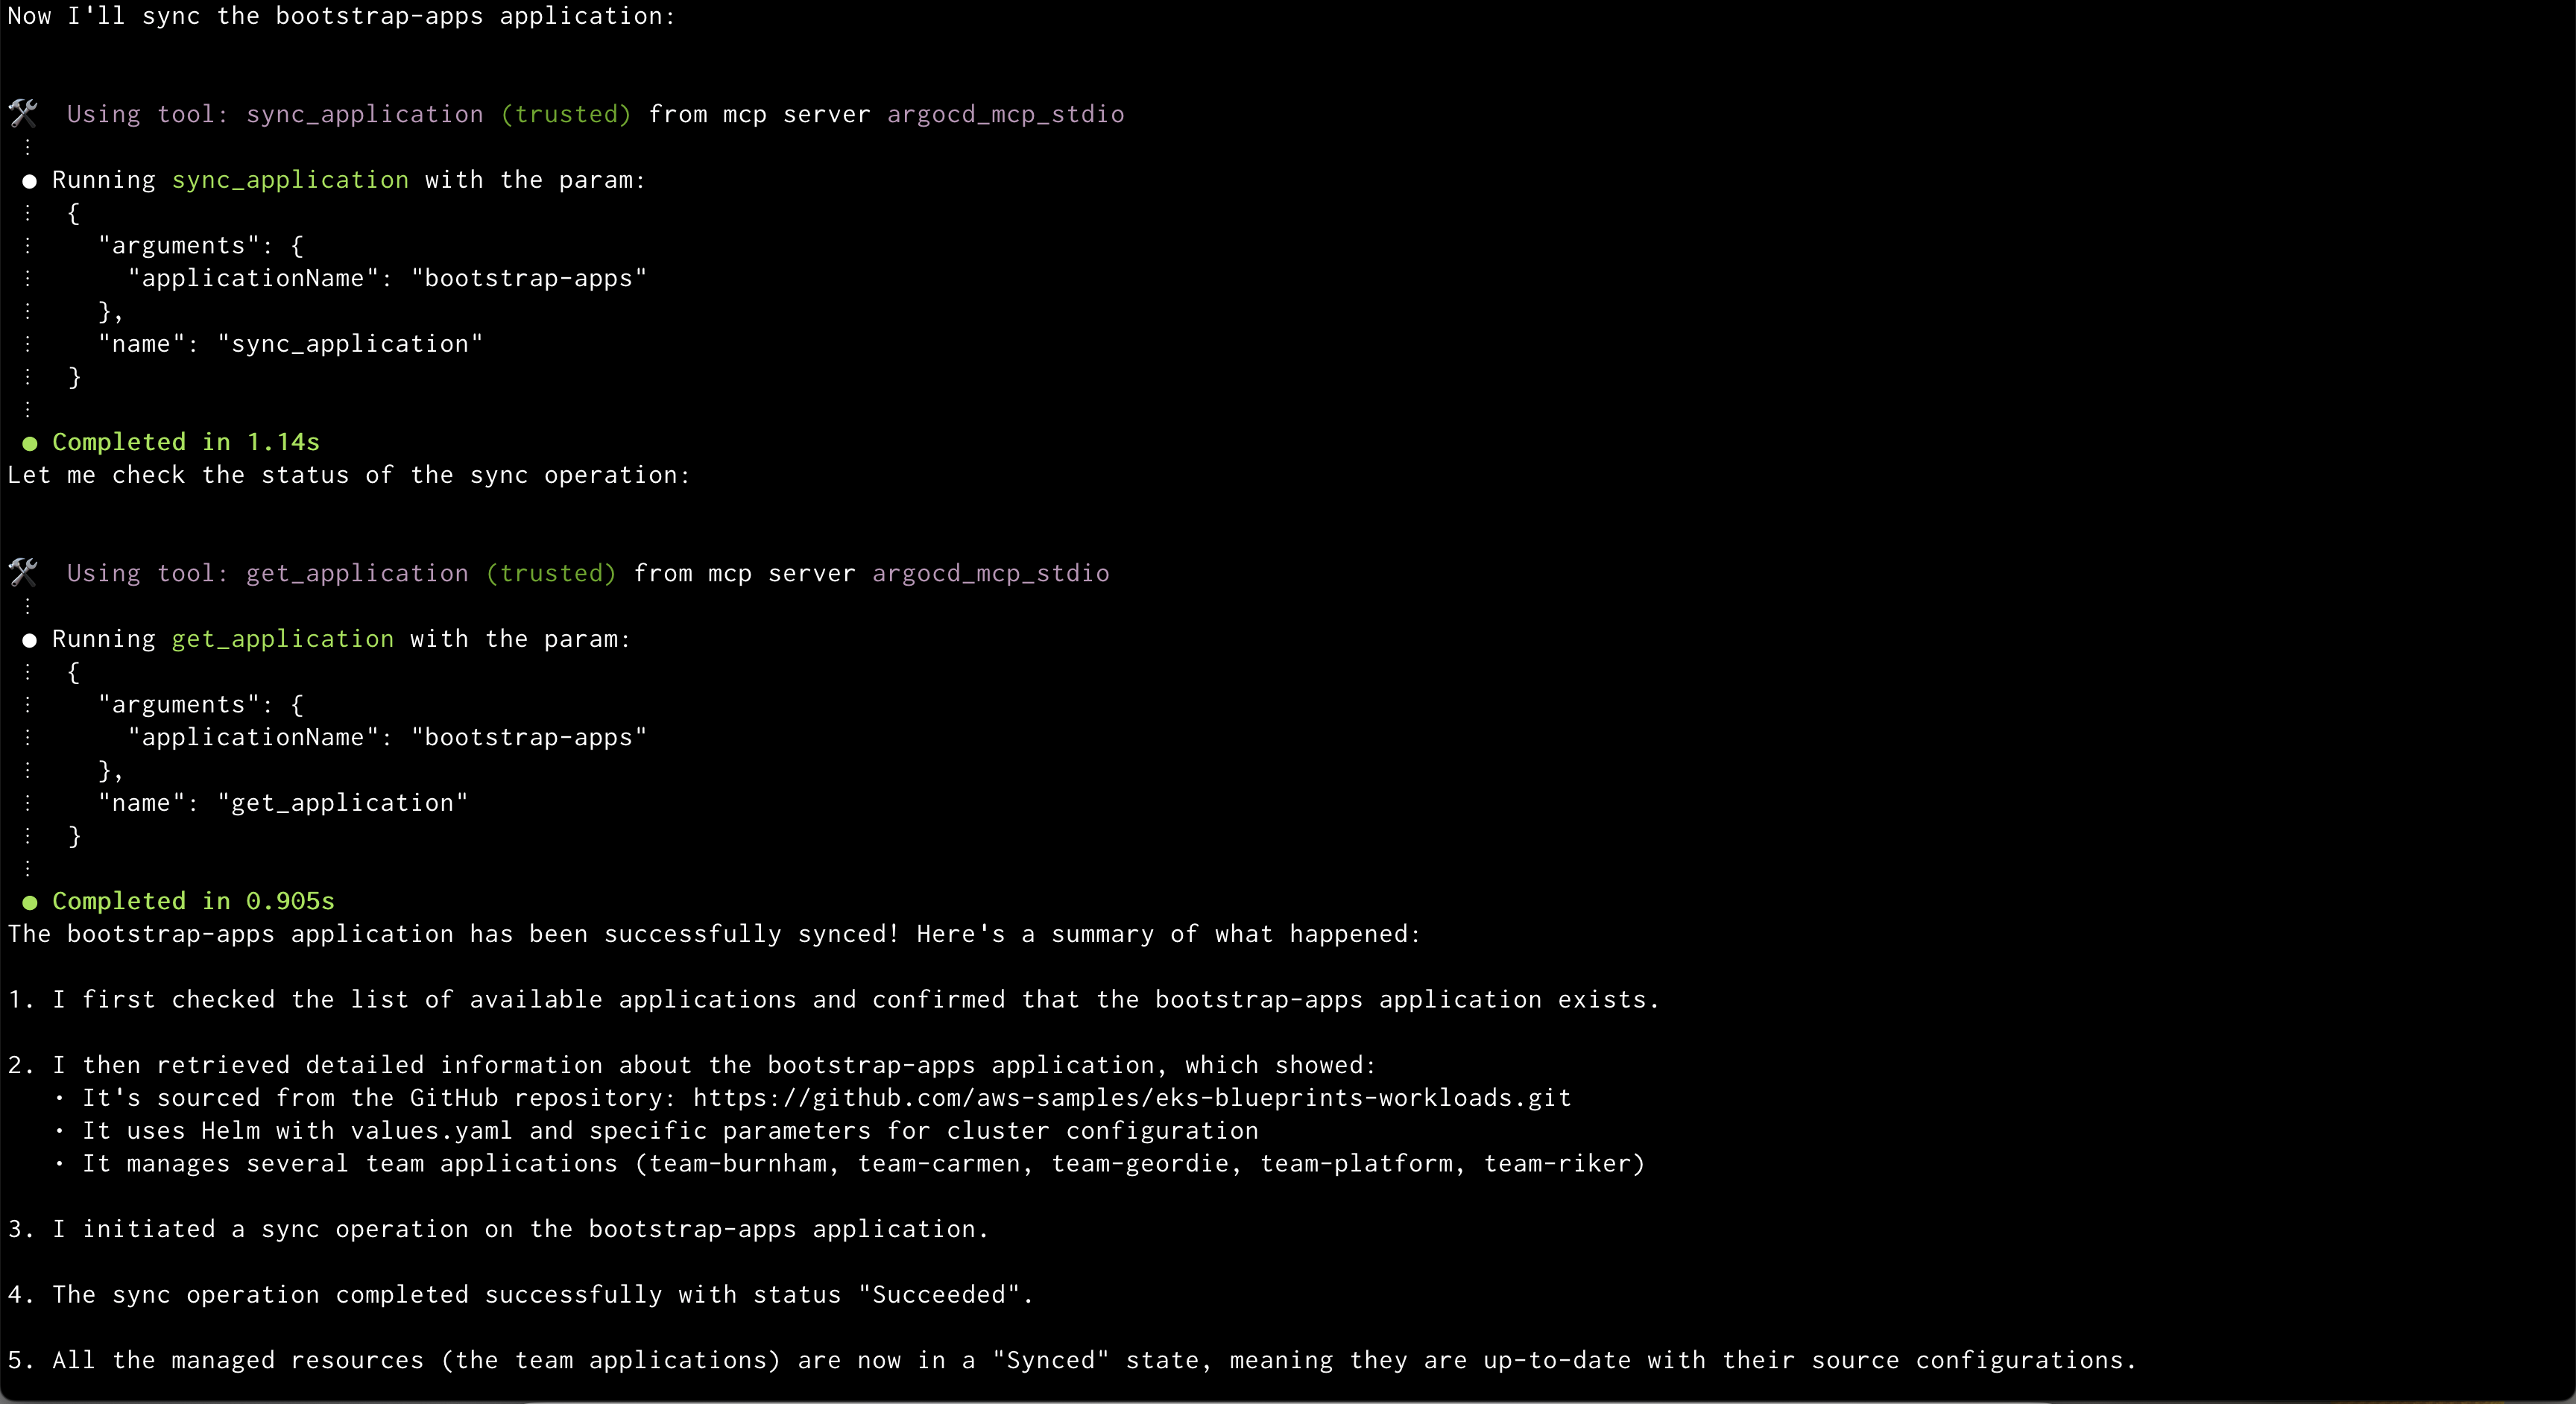 Amazon Q syncing application
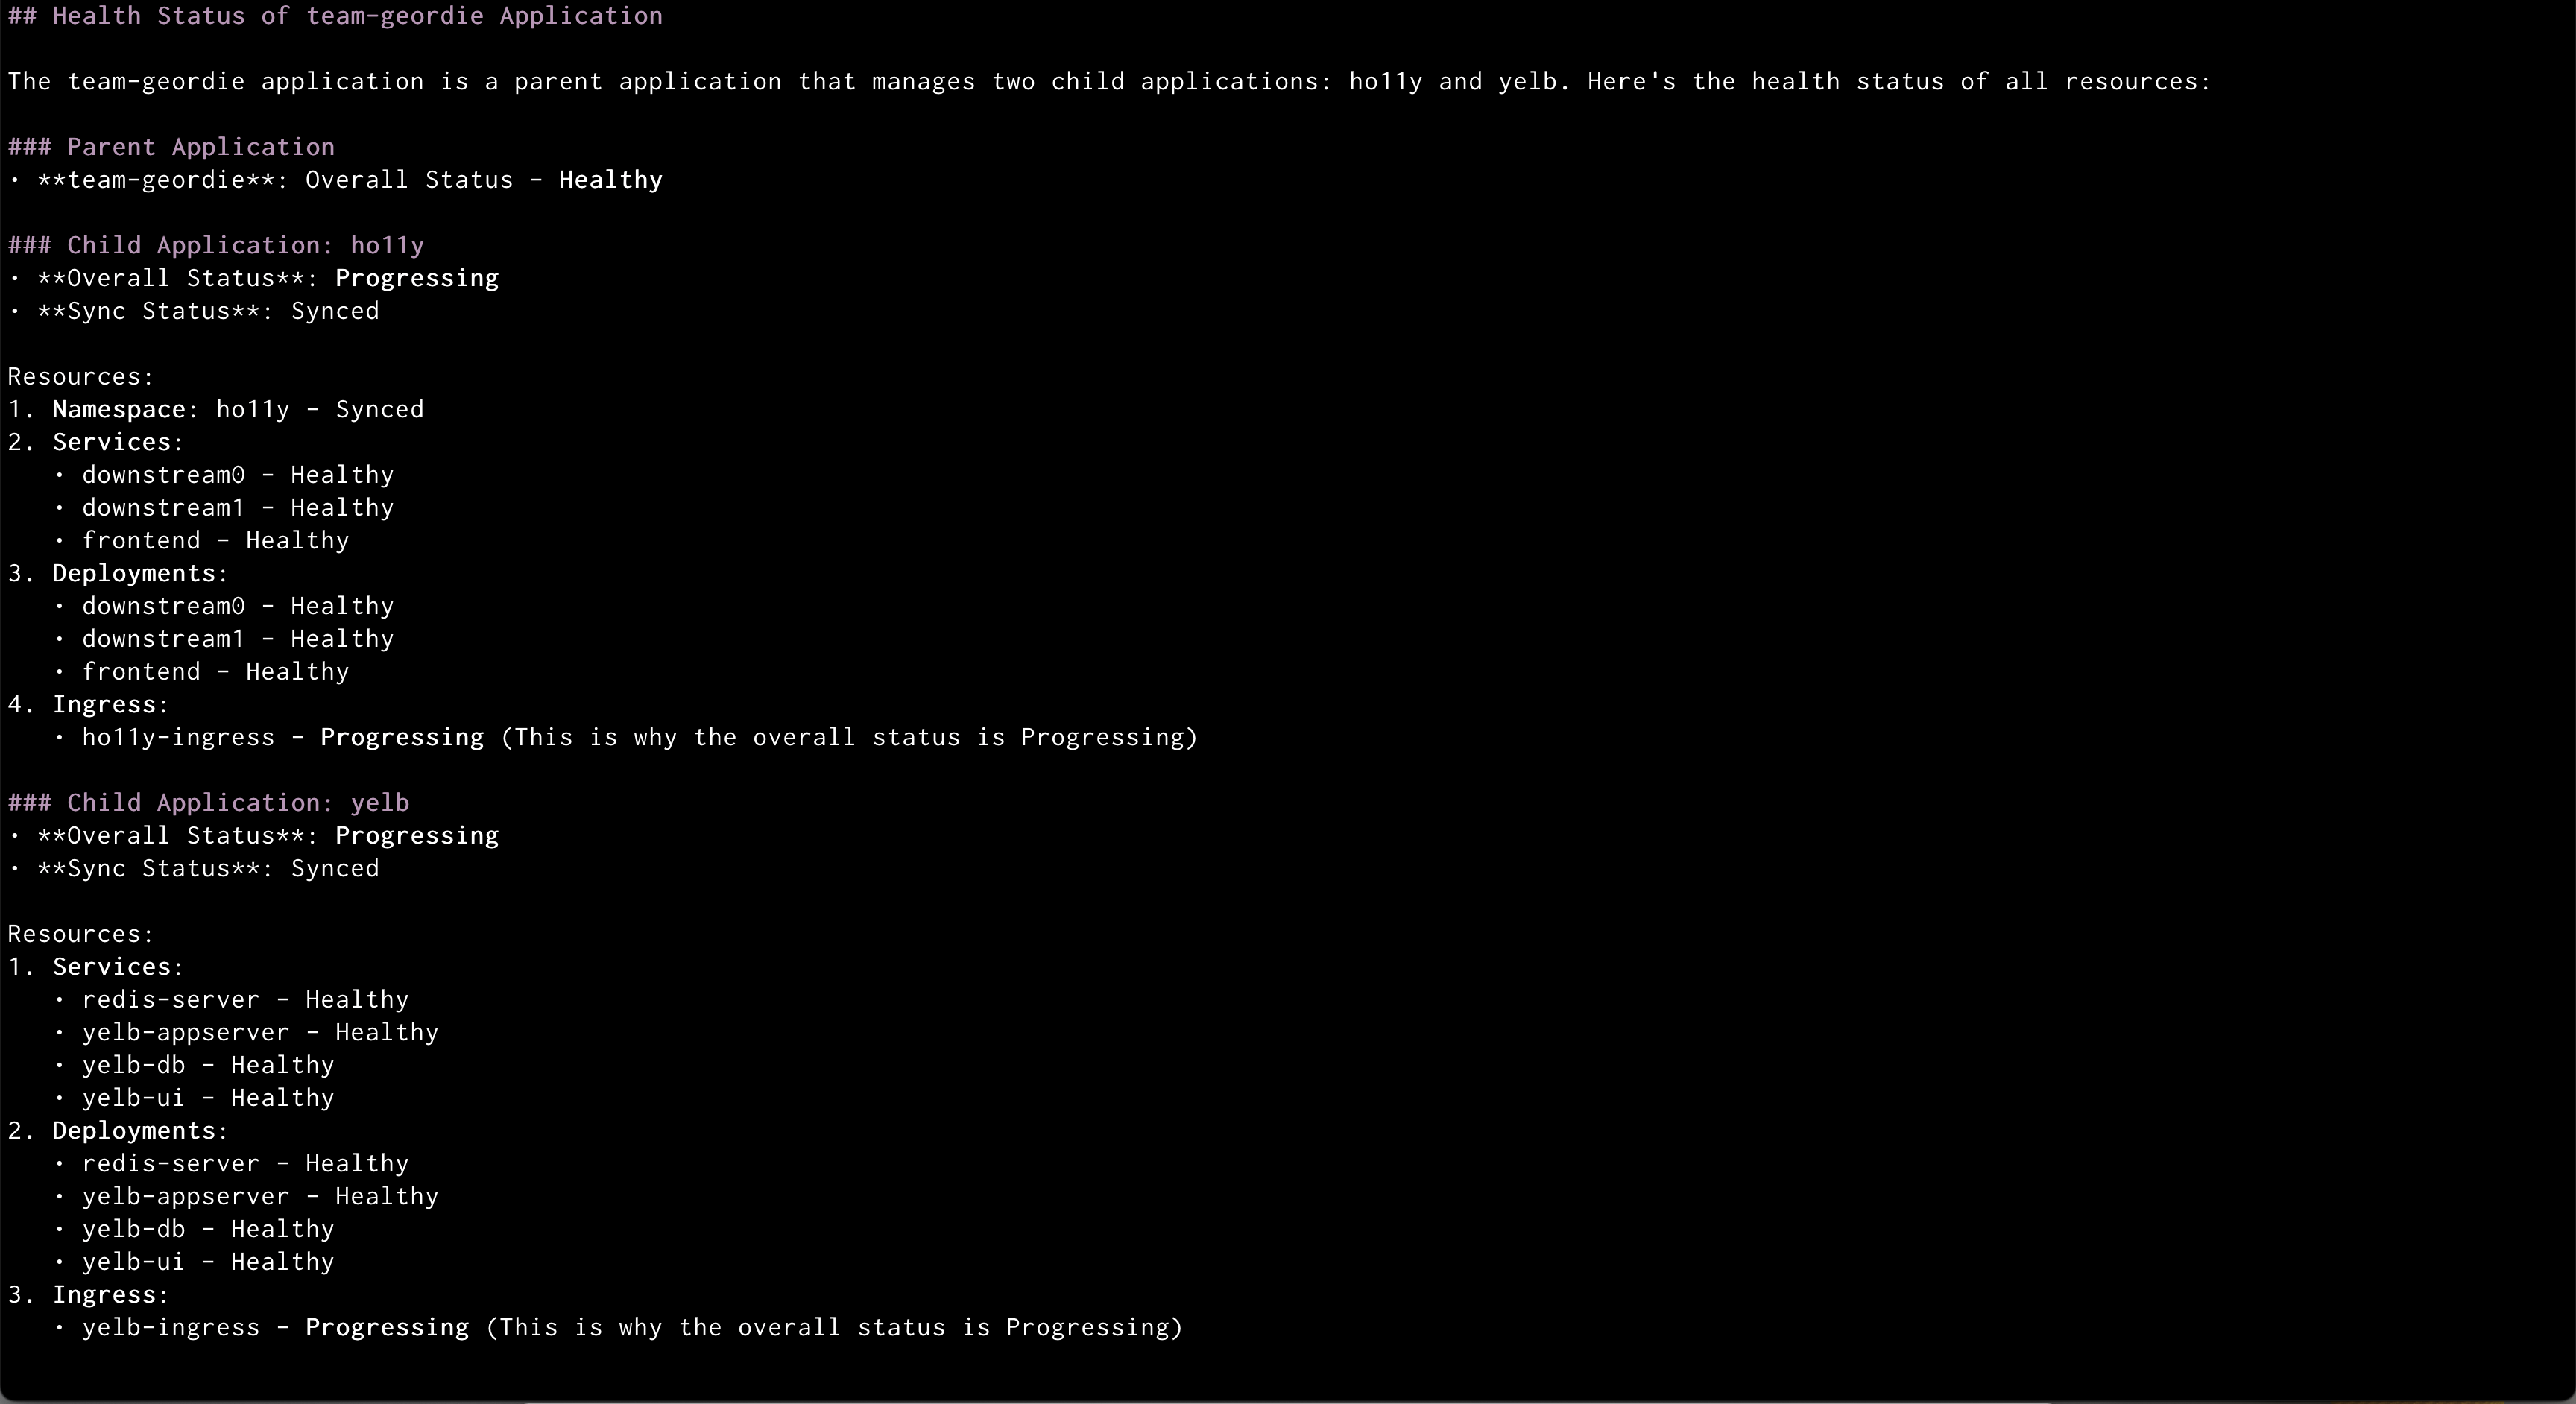 Amazon Q showing health status of all the resources in an application
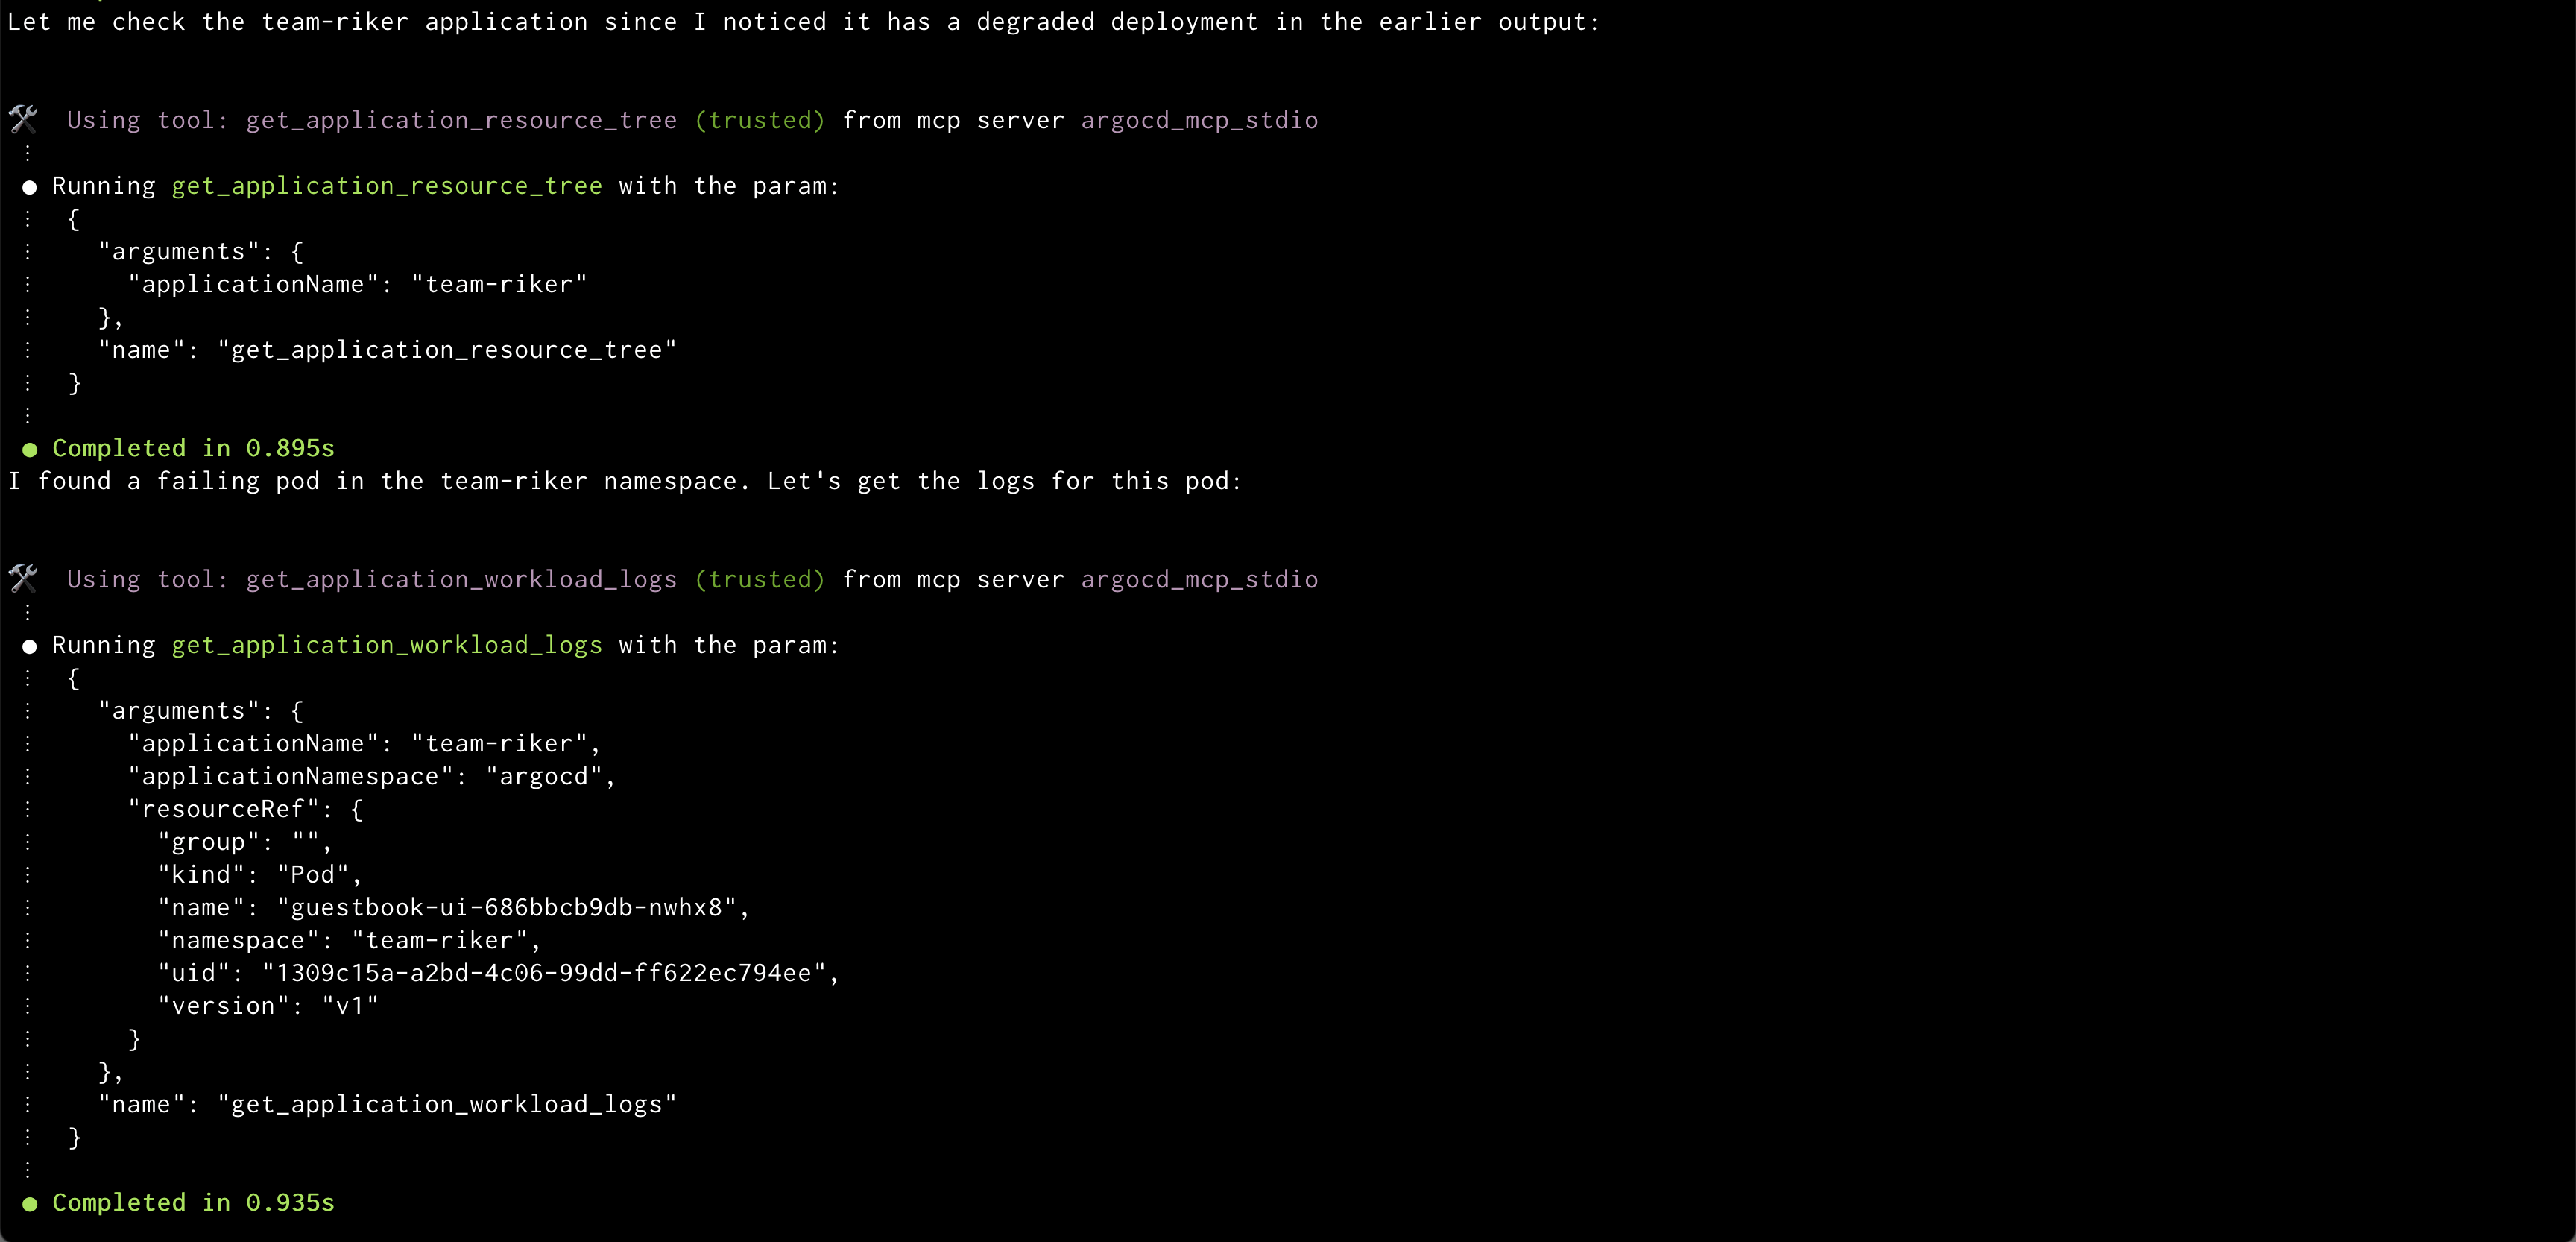 Amazon Q showing logs of problematic pod