Tag Archives: Amazon EMR

Query big data with resilience using Trino in Amazon EMR with Amazon EC2 Spot Instances for less cost

Post Syndicated from Ashwini Kumar original https://aws.amazon.com/blogs/big-data/query-big-data-with-resilience-using-trino-in-amazon-emr-with-amazon-ec2-spot-instances-for-less-cost/

Amazon Elastic Compute Cloud (Amazon EC2) Spot Instances offer spare compute capacity available in the AWS Cloud at steep discounts compared to On-Demand prices. Amazon EMR provides a managed Hadoop framework that makes it straightforward, fast, and cost-effective to process vast amounts of data using EC2 instances. Amazon EMR with Spot Instances allows you to reduce costs for running your big data workloads on AWS. Amazon EC2 can interrupt Spot Instances with a 2-minute notification whenever Amazon EC2 needs to reclaim capacity for On-Demand customers. Spot Instances are best suited for running stateless and fault-tolerant big data applications such as Apache Spark with Amazon EMR, which are resilient against Spot node interruptions.

Trino (formerly PrestoSQL) is an open-source, highly parallel, distributed SQL query engine to run interactive queries as well as batch processing on petabytes of data. It can perform in-place, federated queries on data stored in a multitude of data sources, including relational databases (MySQL, PostgreSQL, and others), distributed data stores (Cassandra, MongoDB, Elasticsearch, and others), and Amazon Simple Storage Service (Amazon S3), without the need for complex and expensive processes of copying the data to a single location.

Before Project Tardigrade, Trino queries failed whenever any of the nodes in Trino clusters failed, and there was no automatic retry mechanism with iterative querying capability. Also, failed queries had to be restarted from scratch. Due to this limitation, the cost of failures of long-running extract, transform, and load (ETL) and batch queries on Trino was high in terms of completion time, compute wastage, and spend. Spot Instances were not appropriate for long-running queries with Trino clusters and only suited for short-lived Trino queries.

In October 2022, Amazon EMR announced a new capability in the Trino engine to detect 2-minute Spot interruption notifications and determine if the existing queries can complete within 2 minutes on those nodes. If the queries can’t finish, Trino will fail them quickly and retry the queries on different nodes. Also, Trino doesn’t schedule new queries on these Spot nodes, which are about to be reclaimed. In November 2022, Amazon EMR added support for Project Tardigrade’s fault-tolerant option in the Trino engine with Amazon EMR 6.8 and above. Enabling this feature mitigates Trino task failures caused by worker node failures due to Spot interruptions or On-Demand node stops. Trino now retries failed tasks using intermediate exchange data checkpointed on Amazon S3 or HDFS.

These new enhancements in Trino with Amazon EMR provide improved resiliency for running ETL and batch workloads on Spot Instances with reduced costs. This post showcases the resilience of Amazon EMR with Trino using fault-tolerant configuration to run long-running queries on Spot Instances to save costs. We simulate Spot interruptions on Trino worker nodes by using AWS Fault Injection Simulator (AWS FIS).

Trino architecture overview

Trino runs a query by breaking up the run into a hierarchy of stages, which are implemented as a series of tasks distributed over a network of Trino workers. This pipelined execution model runs multiple stages in parallel and streams data from one stage to another as the data becomes available. This parallel architecture reduces end-to-end latency and makes Trino a fast tool for ad hoc data exploration and ETL jobs over very large datasets. The following diagram illustrates this architecture.

In a Trino cluster, the coordinator is the server responsible for parsing statements, planning queries, and managing workers. The coordinator is also the node to which a client connects and submits statements to run. Every Trino cluster must have at least one coordinator. The coordinator creates a logical model of a query involving a series of stages, which is then translated into a series of connected tasks running on Trino workers. In Amazon EMR, the Trino coordinator runs on the EMR primary node and workers run on core and task nodes.

Faster insights with lower costs with EC2 Spot

You can save significant costs for your ETL and batch workloads running on EMR Trino clusters with a blend of Spot and On-Demand Instances. You can also reduce time-to-insight with faster query runs with lower costs by running more worker nodes on Spot Instances, using the parallel architecture of Trino.

For example, a long-running query on EMR Trino that takes an hour can be finished faster by provisioning more worker nodes on Spot Instances, as shown in the following figure.

Fault-tolerant Trino configuration in Amazon EMR

Fault-tolerant execution in Trino is disabled by default; you can enable it by setting a retry policy in the Amazon EMR configuration. Trino supports two types of retry policies:

  • QUERY – The QUERY retry policy instructs Trino to retry the whole query automatically when an error occurs on a worker node. This policy is only suitable for short-running queries because the whole query is retried from scratch.
  • TASK – The TASK retry policy instructs Trino to retry individual query tasks in the event of failure. This policy is recommended for long-running ETL and batch queries.

With fault-tolerant execution enabled, intermediate exchange data is spooled on an exchange manager so that another worker node can reuse it in the event of a node failure to complete the query run. The exchange manager uses a storage location on Amazon S3 or Hadoop Distributed File System (HDFS) to store and manage spooled data, which is spilled beyond in-memory buffer size of worker nodes. By default, Amazon EMR release 6.9.0 and later uses HDFS as an exchange manager.

Solution overview

In this post, we create an EMR cluster with following architecture.

We provision the following resources using Amazon EMR and AWS FIS:

  • An EMR 6.9.0 cluster with the following configuration:
    • Apache Hadoop, Hue, and Trino applications
    • EMR instance fleets with the following:
      • One primary node (On-Demand) as the Trino coordinator
      • Two core nodes (On-Demand) as the Trino workers and exchange manager
      • Four task nodes (Spot Instances) as Trino workers
    • Trino’s fault-tolerant configuration with following:
      • TPCDS connector
      • The TASK retry policy
      • Exchange manager directory on HDFS
      • Optional recommended settings for query performance optimization
  • An FIS experiment template to target Spot worker nodes in the Trino cluster with interruptions to demonstrate fault-tolerance of EMR Trino with Spot Instances

We use the new Amazon EMR console to create an EMR 6.9.0 cluster. For more information about the new console, refer to Summary of differences.

Create an EMR 6.9.0 cluster

Complete the following steps to create your EMR cluster:

  1. On the Amazon EMR console, create an EMR 6.9.0 cluster named emr-trino-cluster with Hadoop, Hue, and Trino applications using the Custom application bundle.

We need Hue’s web-based interface for submitting SQL queries to the Trino engine and HDFS on core nodes to store intermediate exchange data for Trino’s fault-tolerant runs.

Using multiple Spot capacity pools (each instance type in each Availability Zone is a separate pool) is a best practice to increase your chances of getting large-scale Spot capacity and minimize the impact of a specific instance type being reclaimed in EMR clusters. The Amazon EMR console allows you to configure up to 5 instance types for your core fleet and 15 instance types for your task fleet with the Spot allocation strategy, which allows up to 30 instance types for each fleet from the AWS Command Line Interface (AWS CLI) or Amazon EMR API.

  1. Configure the primary, core, and task fleets with primary and core nodes with On-Demand Instances (m5.xlarge) and task nodes with Spot Instances using multiple instance types.

When you use the Amazon EMR console, the number of vCPUs of the EC2 instance type are used as the count towards the total target capacity of a core or task fleet by default. For example, an m5.xlarge instance type with 4 vCPUs is considered as 4 units of capacity by default.

  1. On the Actions menu under Core or Task fleet, choose Edit weighted capacity.

  1. Because each instance type with 4 vCPUs (xlarge size) is 4 units of capacity, let’s set the cluster size with 8 core units (2 nodes) with On-Demand and 16 task units (4 nodes) with Spot.

Unlike core and task fleets, the primary fleet is always one instance, so no sizing configuration is needed or available for the primary node on the Amazon EMR console.

  1. Select Price-capacity optimized as your Spot allocation strategy, which launches the lowest-priced Spot Instances from your most available pools.

  1. Configure Trino’s fault-tolerant settings in the Software settings section:
[
  {
    "Classification": "trino-connector-tpcds",
    "Properties": {
      "connector.name": "tpcds"
    }
  },
  {
    "Classification": "trino-config",
    "Properties": {
      "exchange.compression-enabled": "true",
      "query.low-memory-killer.delay": "0s",
      "query.remote-task.max-error-duration": "1m",
      "retry-policy": "TASK"
    }
  },
  {
    "Classification": "trino-exchange-manager",
    "Properties": {
      "exchange.base-directories": "/exchange",
      "exchange.use-local-hdfs": "true"
    }
  }
]

Alternatively, you can create a JSON config file with the configuration, store it in an S3 bucket, and select the file path from its S3 location by selecting Load JSON from Amazon S3.

Let’s understand some optional settings for query performance optimization that we have configured:

  • “exchange.compression-enabled”:”true” – This is recommended to enable compression to reduce the amount of data spooled on exchange manager.
  • “query.low-memory-killer.delay”: “0s” – This will reduce the low memory killer delay to allow the Trino engine to unblock nodes running short on memory faster.
  • “query.remote-task.max-error-duration”: “1m” – By default, Trino waits for up to 5 minutes for the task to recover before considering it lost and rescheduling it. This timeout can be reduced for faster retrying of the failed tasks.

For more details of Trino’s fault-tolerant configuration parameters, refer to Fault-tolerant execution.

  1. Let’s also add a tag key called Name with the value MyTrinoCluster to launch EC2 instances with this tag name.

We’ll use this tag to target Spot Instances in the cluster with AWS FIS.

The EMR cluster will take few minutes to be ready in the Waiting state.

Configure an FIS experiment template to target Spot Instances with interruptions in the EMR Trino cluster

We now use the AWS FIS console to simulate interruptions of Spot Instances in the EMR Trino cluster and showcase the fault-tolerance of the Trino engine. Complete the following steps:

  1. On the AWS FIS console, create an experiment template.

  1. Under Actions, choose Add action.
  2. Create an AWS FIS action with Action type as aws:ec2:send-spot-instance-interruptions and Duration Before Interruption as 2 minutes.
  3. Choose Save.

This means FIS will interrupt targeted Spot Instances after 2 minutes of running the experiment.

  1. Under Targets, choose Edit to target all Spot Instances running in the EMR cluster.
  2. For Resource tags, use Name= MyTrinoCluster.
  3. For Resource filters, use as State.Name=running.
  4. For Selection mode, set to ALL.
  5. Choose Save.

  1. Create a new AWS Identity and Access Management (IAM) role automatically to provide permissions to AWS FIS.

  1. Choose Create experiment template.

Launch Hue and Trino web interfaces

When your EMR cluster is in the Waiting state, connect to the Hue web interface for Trino queries and the Trino web interface for monitoring. Alternatively, you can submit your Trino queries using trino-cli after connecting via SSH to your EMR cluster’s primary node. In this post, we will use the Hue web interface for running queries on the EMR Trino engine.

  1. To connect to Hue interface on the primary node from your local computer, navigate to the EMR cluster’s Properties, Network and security, and EC2 security groups (firewall) section.
  2. Edit the primary node security group’s inbound rule to add your IP address and port (port 22).
  3. Retrieve your EMR cluster’s primary node public DNS from your EMR cluster’s Summary tab.

Refer to View web interfaces hosted on Amazon EMR clusters for details on connecting to web interfaces in the primary node from your local computer. You can set up an SSH tunnel with dynamic port forwarding between your local computer and the EMR primary node. Then you can configure proxy settings for your internet browser by using an add-ons such as FoxyProxy for Firefox or SwitchyOmega for Chrome to manage your SOCKS proxy settings.

  1. Connect to Hue by copying the URL (http://<youremrcluster-primary-node-public-dns>:8888/) in your web browser.
  2. Create an account with your choice of user name and password.

After you log in to your account, you can see the query editor on Hue’s web interface.

By default, Amazon EMR configures the Trino web interface on the Trino coordinator (EMR primary node) to use port 8889.

  1. To connect to the Trino web interface, copy the URL (http://<youremrcluster-primary-node-public-dns>:8889/) in your web browser, where you can monitor the Trino cluster and query performance.

In the following screenshot, we can see six active Trino workers (two core and four task nodes of EMR cluster) and no running queries.

  1. Let’s run the Trino query

    select * from system.runtime.nodes from the Hue query editor to see the coordinator and worker nodes’ status and details.

We can see all cluster nodes are in the active state.

Test fault tolerance on Spot interruptions

To test the fault tolerance on Spot interruptions, complete the following steps:

  1. Run the following Trino query using Hue’s query editor:
with inv as
(select w_warehouse_name,w_warehouse_sk,i_item_sk,d_moy
,stdev,mean, case mean when 0 then null else stdev/mean end cov
from(select w_warehouse_name,w_warehouse_sk,i_item_sk,d_moy
,stddev_samp(inv_quantity_on_hand) stdev,avg(inv_quantity_on_hand) mean
from tpcds.sf100.inventory
,tpcds.sf100.item
,tpcds.sf100.warehouse
,tpcds.sf100.date_dim
where inv_item_sk = i_item_sk
and inv_warehouse_sk = w_warehouse_sk
and inv_date_sk = d_date_sk
and d_year =1999
group by w_warehouse_name,w_warehouse_sk,i_item_sk,d_moy) foo
where case mean when 0 then 0 else stdev/mean end > 1)
select inv1.w_warehouse_sk,inv1.i_item_sk,inv1.d_moy,inv1.mean, inv1.cov
,inv2.w_warehouse_sk,inv2.i_item_sk,inv2.d_moy,inv2.mean, inv2.cov
from inv inv1,inv inv2
where inv1.i_item_sk = inv2.i_item_sk
and inv1.w_warehouse_sk = inv2.w_warehouse_sk
and inv1.d_moy=4
and inv2.d_moy=4+1
and inv1.cov > 1.5
order by inv1.w_warehouse_sk,inv1.i_item_sk,inv1.d_moy,inv1.mean,inv1.cov ,inv2.d_moy,inv2.mean, inv2.cov

When you go to the Trino web interface, you can see the query running on six active worker nodes (two core On-Demand and four task nodes on Spot Instances).

  1. On the AWS FIS console, choose Experiment templates in the navigation pane.
  2. Select the experiment template EMR_Trino_Interrupter and choose Start experiment.

After a few seconds, the experiment will be in the Completed state and it will trigger stopping all four Spot Instances (four Trino workers) after 2 minutes.

After some time, we can observe in the Trino web UI that we have lost four Trino workers (task nodes running on Spot Instances) but the query is still running with the two remaining On-Demand worker nodes (core nodes). Without the fault-tolerant configuration in EMR Trino, the whole query would fail with even a single worker node failure.

  1. Run the select * from system.runtime.nodes query again in Hue to check the Trino cluster nodes status.

We can see four Spot worker nodes with the status shutting_down.

Trino starts shutting down the four Spot worker nodes as soon as they receive the 2-minute Spot interruption notification sent by the AWS FIS experiment. It will start retrying any failed tasks of these four Spot workers on the remaining active workers (two core nodes) of the cluster. The Trino engine will also not schedule tasks of any new queries on Spot worker nodes in the shutting_down state.

The Trino query will keep running on the remaining two worker nodes and succeed despite the interruption of the four Spot worker nodes. Soon after the Spot nodes stop, Amazon EMR will replenish the stopped capacity (four task nodes) by launching four replacement Spot nodes.

Achieve faster query performance for lower cost with more Trino workers on Spot

Now let’s increase Trino workers capacity from 6 to 10 nodes by manually resizing EMR task nodes on Spot Instances (from 4 to 8 nodes).

We run the same query on a larger cluster with 10 Trino workers. Let’s compare the query completion time (wall time in the Trino Web UI) with the earlier smaller cluster with six workers. We can see 32% faster query performance (1.57 minutes vs. 2.33 minutes).

You can run more Trino workers on Spot Instances to run queries faster to meet your SLAs or process a larger number of queries. With Spot Instances available at discounts up to 90% off On-Demand prices, your cluster costs will not increase significantly vs. running the whole compute capacity on On-Demand Instances.

Clean up

To avoid ongoing charges for resources, navigate to the Amazon EMR console and delete the cluster emr-trino-cluster.

Conclusion

In this post, we showed how you can configure and launch EMR clusters with the Trino engine using its fault-tolerant configuration. With the fault tolerant feature, Trino worker nodes can be run as EMR task nodes on Spot Instances with resilience. You can configure a well-diversified task fleet with multiple instance types using the price-capacity optimized allocation strategy. This will make Amazon EMR request and launch task nodes from the most available, lower-priced Spot capacity pools to minimize costs, interruptions, and capacity challenges. We also demonstrated the resilience of EMR Trino against Spot interruptions using an AWS FIS Spot interruption experiment. EMR Trino continues to run queries by retrying failed tasks on remaining available worker nodes in the event of any Spot node interruption. With fault-tolerant EMR Trino and Spot Instances, you can run big data queries with resilience, while saving costs. For your SLA-driven workloads, you can also add more compute on Spot to adhere to or exceed your SLAs for faster query performance with lower costs compared to On-Demand Instances.


About the Authors

Ashwini Kumar is a Senior Specialist Solutions Architect at AWS based in Delhi, India. Ashwini has more than 18 years of industry experience in systems integration, architecture, and software design, with more recent experience in cloud architecture, DevOps, containers, and big data engineering. He helps customers optimize their cloud spend, minimize compute waste, and improve performance at scale on AWS. He focuses on architectural best practices for various workloads with services including EC2 Spot, AWS Graviton, EC2 Auto Scaling, Amazon EKS, Amazon ECS, and AWS Fargate.

Dipayan Sarkar is a Specialist Solutions Architect for Analytics at AWS, where he helps customers modernize their data platform using AWS Analytics services. He works with customers to design and build analytics solutions, enabling businesses to make data-driven decisions.

Apache Iceberg optimization: Solving the small files problem in Amazon EMR

Post Syndicated from Avijit Goswami original https://aws.amazon.com/blogs/big-data/apache-iceberg-optimization-solving-the-small-files-problem-in-amazon-emr/

In our previous post Improve operational efficiencies of Apache Iceberg tables built on Amazon S3 data lakes, we discussed how you can implement solutions to improve operational efficiencies of your Amazon Simple Storage Service (Amazon S3) data lake that is using the Apache Iceberg open table format and running on the Amazon EMR big data platform. Iceberg tables store metadata in manifest files. As the number of data files increase, the amount of metadata stored in these manifest files also increases, leading to longer query planning time. The query runtime also increases because it’s proportional to the number of data or metadata file read operations. Compaction is the process of combining these small data and metadata files to improve performance and reduce cost. Compaction also gets rid of deleting files by applying deletes and rewriting a new file without deleting records. Currently, Iceberg provides a compaction utility that compacts small files at a table or partition level. But this approach requires you to implement the compaction job using your preferred job scheduler or manually triggering the compaction job.

In this post, we discuss the new Iceberg feature that you can use to automatically compact small files while writing data into Iceberg tables using Spark on Amazon EMR or Amazon Athena.

Use cases for processing small files

Streaming applications are prone to creating a large number of small files, which can negatively impact the performance of subsequent processing times. For example, consider a critical Internet of Things (IoT) sensor from a cold storage facility that is continuously sending temperature and health data into an S3 data lake for downstream data processing and triggering actions like emergency maintenance. Systems of this nature generate a huge number of small objects and need attention to compact them to a more optimal size for faster reading, such as 128 MB, 256 MB, or 512 MB. In this post, we show you a streaming sensor data use case with a large number of small files and the mitigation steps using the Iceberg open table format. For more information on streaming applications on AWS, refer to Real-time Data Streaming and Analytics.

Streaming Architecture

Solution overview

To compact the small files for improved performance, in this example, Amazon EMR triggers a compaction job after the write commit as a post-commit hook when defined thresholds (for example, number of commits) are met. By default, Amazon EMR waits for 10 commits to trigger the post-commit hook compaction utility.

This Iceberg event-based table management feature lets you monitor table activities during writes to make better decisions about how to manage each table differently based on events. As of this writing, only the optimize-data optimization is supported. To learn more about the available optimize data executors and catalog properties, refer to the README file in the GitHub repo.

To use the feature, you can use the iceberg-aws-event-based-table-management source code and provide the built JAR in the engine’s class-path. The following bootstrap action can place the JAR in the engine’s class-path:

sudo aws s3 cp s3://<path>/iceberg-aws-event-based-table-management-0.1.jar /usr/lib/spark/jars/

Note that the Iceberg AWS event-based table management feature works with Iceberg v1.2.0 and above (available from Amazon EMR 6.11.0).

In some use cases, you may want to run the event-based compaction jobs in a different EMR cluster in order to avoid any impact to the ETL jobs running in their current EMR cluster. You can get the metadata, including the cluster ID of your current ETL workflows, from the /mnt/var/lib/info/job-flow.json file and then use a different cluster to process the event-based compactions.

The notebook examples shown in the following sections are also available in the aws-samples GitHub repo.

Prerequisite

For this performance comparison exercise between a Spark external table and an Iceberg table and Iceberg with compaction, we generate a significant number of small files in Parquet format and store them in an S3 bucket. We used the Amazon Kinesis Data Generator (KDG) tool to generate sample sensor data information using the following template:

{"sensorId": {{random.number(5000)}},
 "currentTemperature": {{random.number(
        {
            "min":10,
            "max":150
        }
  )}},
 "status": "{{random.arrayElement(
        ["OK","FAIL","WARN"]
    )}}",
 "date_ts": "{{date.now("YYYY-MM-DD HH:mm:ss")}}"
}

We configured an Amazon Kinesis Data Firehose delivery stream and sent the generated data into a staging S3 bucket. Then we ran an AWS Glue extract, transform, and load (ETL) job to convert the JSON files into Parquet format. For our testing, we generated about 58,176 small objects with total size of 2 GB.

For running the Amazon EMR tests, we used Amazon EMR version emr-6.11.0 with Spark 3.3.2, and JupyterEnterpriseGateway 2.6.0. The cluster used had one primary node (r5.2xlarge) and two core nodes (r5.xlarge). We used a bootstrap action during cluster creation to enable event-based table management:

sudo aws s3 cp s3://<path>/iceberg-aws-event-based-table-management-0.1.jar /usr/lib/spark/jars/

Also, refer to our guidance on how to use an Iceberg cluster with Spark, which is a prerequisite for this exercise.

As part of the exercise, we see new steps are being added to the EMR cluster to trigger the compaction jobs. To enable adding new steps to the running cluster, we add the elasticmapreduce:AddJobFlowSteps action to the cluster’s default role, EMR_EC2_DefaultRole, as a prerequisite.

Performance of Iceberg reads with the compaction utility on Amazon EMR

In the following steps, we demonstrate how to use the compaction utility and what performance benefits you can achieve. We use an EMR notebook to demonstrate the benefits of the compaction utility. For instructions to set up an EMR notebook, refer to Amazon EMR Studio overview.

First, you configure your Spark session using the %%configure magic command. We use the Hive catalog for Iceberg tables.

  1. Before you run the following step, create an Amazon S3 bucket in your AWS account called <your-iceberg-storage-blog>. To check how to create an Amazon S3 bucket, follow the instructions given here. Update the your-iceberg-storage-blog bucket name in the following configuration with the actual bucket name you created to test this example:
    %%configure -f
    {
    "conf":{
        "spark.sql.extensions":"org.apache.iceberg.spark.extensions.IcebergSparkSessionExtensions",
        "spark.sql.catalog.dev":"org.apache.iceberg.spark.SparkCatalog",
        "spark.sql.catalog.dev.catalog-impl":"org.apache.iceberg.aws.glue.GlueCatalog",
        "spark.sql.catalog.dev.io-impl":"org.apache.iceberg.aws.s3.S3FileIO",
        "spark.sql.catalog.dev.warehouse":"s3://<your-iceberg-storage-blog>/iceberg/"
        }
    }

  2. Create a new database for the Iceberg table in the AWS Glue Data Catalog named DB and provide the S3 URI specified in the Spark config as s3://<your-iceberg-storage-blog>/iceberg/db. Also, create another Database named iceberg_db in Glue for the parquet tables. Follow the instructions given in Working with databases on the AWS Glue console to create your Glue databases. Then create a new Spark table in Parquet format pointing to the bucket containing small objects in your AWS account. See the following code:
    spark.sql(""" CREATE TABLE iceberg_db.sensor_data_parquet_table (
        sensorid int,
        currenttemperature int,
        status string,
        date_ts timestamp)
    USING parquet
    location 's3://<your-bucket-with-parquet-files>/'
    """)

  3. Run an aggregate SQL to measure the performance of Spark SQL on the Parquet table with 58,176 small objects:
    spark.sql(""" select maxtemp, mintemp, avgtemp from
    (select
    max(currenttemperature) as maxtemp,
    min(currenttemperature) as mintemp,
    avg(currenttemperature) as avgtemp
    from iceberg_db.sensor_data_parquet_table
    where month(date_ts) between 2 and 10
    order by maxtemp, mintemp, avgtemp)""").show()

In the following steps, we create a new Iceberg table from the Spark/Parquet table using CTAS (Create Table As Select). Then we show how the automated compaction job can help improve query performance.

  1. Create a new Iceberg table using CTAS from the earlier AWS Glue table with the small files:
    spark.sql(""" CREATE TABLE dev.db.sensor_data_iceberg_format USING iceberg AS (SELECT * FROM iceberg_db.sensor_data_parquet_table)""")

  2. Validate that a new Iceberg snapshot was created for the new table:
    spark.sql(""" Select * from dev.db.sensor_data_iceberg_format.snapshots limit 5""").show()

We have confirmed that our S3 folder corresponds to the newly created Iceberg table. It shows that during the CTAS statement, it added 1,879 objects in the new folder with a total size of 1.3 GB. We can conclude that Iceberg did some optimization while loading data from the Parquet table.

  1. Now that you have data in the Iceberg table, run the previous aggregation SQL to check the runtime:
    spark.sql(""" select maxtemp, mintemp, avgtemp from
    (select
    max(currenttemperature) as maxtemp,
    min(currenttemperature) as mintemp,
    avg(currenttemperature) as avgtemp
    from dev.db.sensor_data_iceberg_format
    where month(date_ts) between 2 and 10
    order by maxtemp, mintemp, avgtemp)""").show()

The runtime for the preceding query ran on the Iceberg table with 1,879 objects in 1 minute, 39 seconds. There is already some significant performance improvement by converting the external Parquet table to an Iceberg table.

  1. Now let’s add the configurations needed to apply the automatic compaction of small files in the Iceberg tables. Note the last four newly added configurations in the following statement. The parameter optimize-data.commit-threshold suggests that the compaction will take place after the first successful commit. The default is 10 successful commits to trigger the compaction.
    %%configure -f
    {
    "conf":{
        "spark.sql.extensions":"org.apache.iceberg.spark.extensions.IcebergSparkSessionExtensions",
        "spark.sql.catalog.dev":"org.apache.iceberg.spark.SparkCatalog",
        "spark.sql.catalog.dev.catalog-impl":"org.apache.iceberg.aws.glue.GlueCatalog",
        "spark.sql.catalog.dev.io-impl":"org.apache.iceberg.aws.s3.S3FileIO",
        "spark.sql.catalog.dev.warehouse":"s3://<your-iceberg-storage-blog>/iceberg/",
        "spark.sql.catalog.dev.metrics-reporter-impl":"org.apache.iceberg.aws.manage.AwsTableManagementMetricsEvaluator",
        "spark.sql.catalog.dev.optimize-data.impl":"org.apache.iceberg.aws.manage.EmrOnEc2OptimizeDataExecutor",
        "spark.sql.catalog.dev.optimize-data.emr.cluster-id":"j-1N8J5NZI0KEU3",
        "spark.sql.catalog.dev.optimize-data.commit-threshold":"1"
        }
    }

  2. Run a quick sanity check to confirm that the configurations are working fine with Spark SQL.

  1. 10. To activate the automatic compaction process, add a new record to the existing Iceberg table using a Spark insert:
    spark.sql(""" Insert into dev.db.sensor_data_iceberg_format values(999123, 86, 'PASS', timestamp'2023-07-26 12:50:25') """)

  2. Navigate to the Amazon EMR console to check the cluster steps.

You should see a new step added that goes from Pending to Running and finally the Completed state. Every time the data in the Iceberg table is updated or inserted, based on configuration optimize-data.commit-threshold, the optimize job will automatically trigger to compact the underlying data.

  1. Validate that the record insert was successful.

  1. Check the snapshot table to see that a new snapshot is created for the table with the operation replace.

For every successful run of the background optimize job, a new entry will be added to the snapshot table.

  1. On the Amazon S3 console, navigate to the folder corresponding to the Iceberg table and see that the data files are compacted.

In our case, it was compacted from the previous smaller sizes to approximately 437 MB. The folder will still contain the previous smaller files for time travel unless you issue an expire snapshot command to remove them.

  1. Now you can run the same aggregate query and record the performance after the compaction.

Summary of Amazon EMR testing

The runtime for the preceding aggregation query on the compacted Iceberg table reduced to approximately 59 seconds from the previous runtime of 1 minute, 39 seconds. That is about a 40% improvement. The more small files you have in your source bucket, the bigger performance boost you can achieve with this post-hook compaction implementation. The examples shown in this blog were executed in a small Amazon EMR cluster with only two core nodes (r5.xlarge). To improve the performance of your Spark applications, Amazon EMR provides multiple optimization features that you can implement for your production workloads.

Performance of Iceberg reads with the compaction utility on Athena

To manage the Iceberg table based on events, you can start the Spark 3.3 SQL shell as shown in the following code. Make sure that the athena:StartQueryExecution and athena:GetQueryExecution permission policies are enabled.

spark-sql --conf spark.sql.catalog.my_catalog=org.apache.iceberg.spark.SparkCatalog \
          --conf spark.sql.catalog.my_catalog.catalog-impl=org.apache.iceberg.aws.glue.GlueCatalog \
          --conf spark.sql.catalog.my_catalog.warehouse=<s3-bucket> \
          --conf spark.sql.catalog.my_catalog.metrics-reporter-impl=org.apache.iceberg.aws.manage.AwsTableManagementMetricsEvaluator \
          --conf spark.sql.catalog.my_catalog.optimize-data.impl=org.apache.iceberg.aws.manage.AthenaOptimizeDataExecutor \
          --conf spark.sql.catalog.my_catalog.optimize-data.athena.output-bucket=<s3-bucket>

Clean up

After you complete the test, clean up your resources to avoid any recurring costs:

  1. Delete the S3 buckets that you created for this test.
  2. Delete the EMR cluster.
  3. Stop and delete the EMR notebook instance.

Conclusion

In this post, we showed how Iceberg event-based table management lets you manage each table differently based on events and compact small files to boost application performance. This event-based process significantly reduces the operational overhead of using the Iceberg rewrite_data_files procedure, which needs manual or scheduled operation.

To learn more about Apache Iceberg and implement this open table format for your transactional data lake use cases, refer to the following resources:


About the Authors

Avijit Goswami is a Principal Solutions Architect at AWS specialized in data and analytics. He supports AWS strategic customers in building high-performing, secure, and scalable data lake solutions on AWS using AWS managed services and open-source solutions. Outside of his work, Avijit likes to travel, hike, watch sports, and listen to music.

Rajarshi Sarkar is a Software Development Engineer at Amazon EMR/Athena. He works on cutting-edge features of Amazon EMR/Athena and is also involved in open-source projects such as Apache Iceberg and Trino. In his spare time, he likes to travel, watch movies, and hang out with friends.

Capacity Management and Amazon EMR Managed Scaling improvements for Amazon EMR on EC2 clusters

Post Syndicated from Sushant Majithia original https://aws.amazon.com/blogs/big-data/capacity-management-and-amazon-emr-managed-scaling-improvements-for-amazon-emr-on-ec2-clusters/

In 2022, we told you about the new enhancements we made in Amazon EMR Managed Scaling, which helped improve cluster utilization as well as reduced cluster costs. In 2023, we are happy to report that the Amazon EMR team has been hard at work. We worked backward from customer requirements and launched multiple new features to enhance your Amazon EMR on EC2 clusters capacity management and scaling experience.

Amazon EMR is the cloud big data solution for petabyte-scale data processing, interactive analytics, and machine learning (ML) using open-source frameworks such as Apache Spark, Apache Hive, and Presto. Customers asked us for features that would further improve the capacity management and scaling experience of their EMR on EC2 clusters, including their large, long-running clusters. We have been hard at work to meet those needs. The following are some of the key enhancements:

  • Enhanced customer transparency and flexibility with provisioning timeout for Spot Instances
  • Optimized task nodes scale-up for Amazon EMR on EC2 clusters launched with instance groups
  • Improved job resiliency with enhanced protection for Spark Drivers

Let’s dive deeper and discuss the new Amazon EMR on EC2 features in detail.

Enhanced customer transparency and flexibility with provisioning timeout for Spot Instances

Many Amazon EMR customers use EC2 Spot Instances for their EMR on EC2 clusters to reduce costs. Spot Instances are spare Amazon Elastic Compute Cloud (Amazon EC2) compute capacity offered at discounts of up to 90% compared to On-Demand pricing. Amazon EMR offers you the capability to scale your cluster either manually or by using Automatic Scaling. You can also use the Amazon EMR Managed Scaling feature to automatically resize your cluster based on workload and utilization.

To enhance the customer experience when scaling up using Spot Instances, for EMR on EC2 clusters launched using instance fleets, you can now specify a provisioning timeout for Spot Instances. A provisioning timeout will tell Amazon EMR to stop provisioning Spot Instance capacity if the cluster exceeds a specified time threshold during cluster scaling operations. You can configure the Spot instance provisioning timeout for clusters getting resized manually or using Amazon EMR Managed Scaling and Auto Scaling.

Additionally, to provide better transparency, when the timeout period expires, Amazon EMR will also automatically send events to an Amazon CloudWatch Events stream. With these CloudWatch events, you can create rules that match events according to a specified pattern, and then route the events to targets to take action. To learn more, please refer to Customize a provisioning timeout period for cluster resize in Amazon EMR.

Please find summarized below the experience for different scenario’s when you configure a provisioning timeout period during resize for your Amazon EMR on EC2 cluster

Scenario Experience
Amazon EMR is able to provision the desired Spot capacity before expiration of the provisioning timeout Amazon EMR automatically scales-up the cluster to the desired capacity and no action is needed from the customer
Amazon EMR is not able to provision any Spot capacity or only able to provision partial Spot capacity and the provisioning timeout has expired If Amazon EMR can’t provision the required Spot capacity and the provisioning timeout has expired, Amazon EMR will cancel the resize request and stops it’s attempts to provision additional Spot capacity. Amazon EMR will also publish events to an Amazon CloudWatch Events stream. Customers can use these events to create rules and take appropriate actions
If the Spot instances in your Amazon EMR on EC2 clusters are interrupted as Amazon EC2 needs them back Amazon EMR will automatically trigger a new resize request to rebalance your clusters by replacing instances with any of the available types in your cluster. Amazon EMR will also use the same provisioning resize timeout which was configured on the cluster. No action is needed from the customer.

You should consider the criticality of capacity availability when specifying the provisioning timeout value:

  • When your workload capacity availability is critical To ensure the desired capacity is available, we recommend configuring the resize provisioning timeout based on the time it takes to run the application and application SLAs. For example, if application SLA is 60 minutes and it takes 30 minutes for the application to complete, you should set the resize provisioning timeout to 30 minutes or less. Amazon EMR will try to provision to get Spot capacity until the timeout expires (30 minutes or less) and publish a CloudWatch event so that you can take appropriate actions.
  • When your workload is time flexible and capacity availability is not a factor If the workload is time flexible and capacity availability is not a factor, to ensure the highest likelihood for getting the desired Spot capacity, you can configure a higher timeout value for the resize provisioning timeout.

Optimized task nodes scale-up for Amazon EMR on EC2 clusters launched with Instance groups

Instance groups offer a simpler setup to launch EMR on EC2 clusters. Each cluster launched using instance groups can include up to 50 instance groups: one primary instance group that contains one EC2 instance, a core instance group that contains one or more EC2 instances, and up to 48 optional task instance groups. You can scale each instance group by adding and removing EC2 instances manually, or you can set up automatic scaling. You can also use the Amazon EMR Managed Scaling feature to automatically resize your cluster based on workload and utilization.

To enhance the customer experience for instance groups on EMR on EC2 clusters when scaling up task nodes using Amazon EMR Managed Scaling, we have enhanced the managed scaling algorithm to choose the task instance groups that have the highest likelihood of acquiring capacity. Furthermore, when managed scaling is not able to acquire capacity with a single task instance group, to reduce any scale-up delays, Amazon EMR will automatically switch to another task group and fulfill the capacity by using multiple task instance groups. Consequently, the more flexible you are about your instance types, the higher the chances of provisioning capacity. To learn more, refer to Best practices for instance and Availability Zone flexibility.

Improved job resiliency with enhanced protection for Spark Drivers

In 2022, to improve the job resiliency when using Amazon EMR Managed Scaling, we enhanced managed scaling to be Spark shuffle data aware, which prevents scale-down of instances that store intermediate shuffle data for Apache Spark. This helps prevents job reattempts and recomputations, which leads to better performance and lower cost.

To further improve job resiliency when using Amazon EMR Managed Scaling, we have further enhanced managed scaling to be Spark Driver aware, which ensures that during cluster scale-down, Amazon EMR Managed Scaling prioritizes the scale-down of nodes that don’t have an active Spark Driver running on them. This helps minimize job failures and job retries, helping further improve performance and reduce costs. This enhancement is enabled by default for EMR clusters using Amazon EMR versions 5.34.0 and later, and Amazon EMR versions 6.4.0 and later.

To confirm which nodes in your cluster are running Spark Driver, you can visit the Spark History Server and filter for the driver on the Executors tab of your Spark application ID.

Conclusion

In this post, we highlighted the improvements that we made in capacity management and Amazon EMR Managed Scaling for EMR on EC2 clusters. We focused on improving job resiliency, enhanced flexibility and transparency when provisioning Spot Instances, and optimizing the scale-up experience when using managed scaling with instance groups on Amazon EMR on EC2 clusters. Although we have launched multiple features so far in 2023 and the pace of innovation continues to accelerate, it remains day 1 and we look forward to hearing from you on how these features help you unlock more value for your organizations. We invite you to try these new features and get in touch with us through your AWS account team if you have further comments.


About the authors

Sushant Majithia is a Principal Product Manager for EMR at AWS.

Ankur Goyal is a SDM with Amazon EMR Big Data Platform team. He builds large scale distributed applications and cluster optimization algorithms. Ankur is interested in topics of Analytics, Machine Learning and Forecasting.

Matthew Liem is a Senior Solution Architecture Manager at AWS.

Tarun Chanana is an SDM with Amazon EMR Big Data Platform team.

Monitor Apache Spark applications on Amazon EMR with Amazon Cloudwatch

Post Syndicated from Le Clue Lubbe original https://aws.amazon.com/blogs/big-data/monitor-apache-spark-applications-on-amazon-emr-with-amazon-cloudwatch/

To improve a Spark application’s efficiency, it’s essential to monitor its performance and behavior. In this post, we demonstrate how to publish detailed Spark metrics from Amazon EMR to Amazon CloudWatch. This will give you the ability to identify bottlenecks while optimizing resource utilization.

CloudWatch provides a robust, scalable, and cost-effective monitoring solution for AWS resources and applications, with powerful customization options and seamless integration with other AWS services. By default, Amazon EMR sends basic metrics to CloudWatch to track the activity and health of a cluster. Spark’s configurable metrics system allows metrics to be collected in a variety of sinks, including HTTP, JMX, and CSV files, but additional configuration is required to enable Spark to publish metrics to CloudWatch.

Solution overview

This solution includes Spark configuration to send metrics to a custom sink. The custom sink collects only the metrics defined in a Metricfilter.json file. It utilizes the CloudWatch agent to publish the metrics to a custom Cloudwatch namespace. The bootstrap action script included is responsible for installing and configuring the CloudWatch agent and the metric library on the Amazon Elastic Compute Cloud (Amazon EC2) EMR instances. A CloudWatch dashboard can provide instant insight into the performance of an application.

The following diagram illustrates the solution architecture and workflow.

architectural diagram illustrating the solution overview

The workflow includes the following steps:

  1. Users start a Spark EMR job, creating a step on the EMR cluster. With Apache Spark, the workload is distributed across the different nodes of the EMR cluster.
  2. In each node (EC2 instance) of the cluster, a Spark library captures and pushes metric data to a CloudWatch agent, which aggregates the metric data before pushing them to CloudWatch every 30 seconds.
  3. Users can view the metrics accessing the custom namespace on the CloudWatch console.

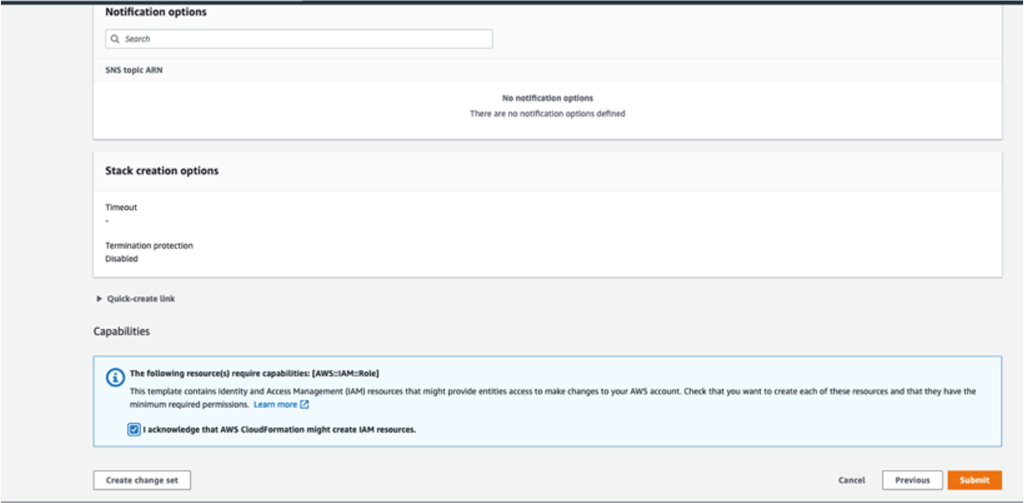
We provide an AWS CloudFormation template in this post as a general guide. The template demonstrates how to configure a CloudWatch agent on Amazon EMR to push Spark metrics to CloudWatch. You can review and customize it as needed to include your Amazon EMR security configurations. As a best practice, we recommend including your Amazon EMR security configurations in the template to encrypt data in transit.

You should also be aware that some of the resources deployed by this stack incur costs when they remain in use. Additionally, EMR metrics don’t incur CloudWatch costs. However, custom metrics incur charges based on CloudWatch metrics pricing. For more information, see Amazon CloudWatch Pricing.

In the next sections, we go through the following steps:

  1. Create and upload the metrics library, installation script, and filter definition to an Amazon Simple Storage Service (Amazon S3) bucket.
  2. Use the CloudFormation template to create the following resources:
  3. Monitor the Spark metrics on the CloudWatch console.

Prerequisites

This post assumes that you have the following:

  • An AWS account.
  • An S3 bucket for storing the bootstrap script, library, and metric filter definition.
  • A VPC created in Amazon Virtual Private Cloud (Amazon VPC), where your EMR cluster will be launched.
  • Default IAM service roles for Amazon EMR permissions to AWS services and resources. You can create these roles with the aws emr create-default-roles command in the AWS Command Line Interface (AWS CLI).
  • An optional EC2 key pair, if you plan to connect to your cluster through SSH rather than Session Manager, a capability of AWS Systems Manager.

Define the required metrics

To avoid sending unnecessary data to CloudWatch, our solution implements a metric filter. Review the Spark documentation to get acquainted with the namespaces and their associated metrics. Determine which metrics are relevant to your specific application and performance goals. Different applications may require different metrics to monitor, depending on the workload, data processing requirements, and optimization objectives. The metric names you’d like to monitor should be defined in the Metricfilter.json file, along with their associated namespaces.

We have created an example Metricfilter.json definition, which includes capturing metrics related to data I/O, garbage collection, memory and CPU pressure, and Spark job, stage, and task metrics.

Note that certain metrics are not available in all Spark release versions (for example, appStatus was introduced in Spark 3.0).

Create and upload the required files to an S3 bucket

For more information, see Uploading objects and Installing and running the CloudWatch agent on your servers.

To create and the upload the bootstrap script, complete the following steps:

  1. On the Amazon S3 console, choose your S3 bucket.
  2. On the Objects tab, choose Upload.
  3. Choose Add files, then choose the Metricfilter.json, installer.sh, and examplejob.sh files.
  4. Additionally, upload the emr-custom-cw-sink-0.0.1.jar metrics library file that corresponds to the Amazon EMR release version you will be using:
    1. EMR-6.x.x
    2. EMR-5.x.x
  5. Choose Upload, and take note of the S3 URIs for the files.

Provision resources with the CloudFormation template

Choose Launch Stack to launch a CloudFormation stack in your account and deploy the template:

launch stack 1

This template creates an IAM role, IAM instance profile, EMR cluster, and CloudWatch dashboard. The cluster starts a basic Spark example application. You will be billed for the AWS resources used if you create a stack from this template.

The CloudFormation wizard will ask you to modify or provide these parameters:

  • InstanceType – The type of instance for all instance groups. The default is m5.2xlarge.
  • InstanceCountCore – The number of instances in the core instance group. The default is 4.
  • EMRReleaseLabel – The Amazon EMR release label you want to use. The default is emr-6.9.0.
  • BootstrapScriptPath – The S3 path of the installer.sh installation bootstrap script that you copied earlier.
  • MetricFilterPath – The S3 path of your Metricfilter.json definition that you copied earlier.
  • MetricsLibraryPath – The S3 path of your CloudWatch emr-custom-cw-sink-0.0.1.jar library that you copied earlier.
  • CloudWatchNamespace – The name of the custom CloudWatch namespace to be used.
  • SparkDemoApplicationPath – The S3 path of your examplejob.sh script that you copied earlier.
  • Subnet – The EC2 subnet where the cluster launches. You must provide this parameter.
  • EC2KeyPairName – An optional EC2 key pair for connecting to cluster nodes, as an alternative to Session Manager.

View the metrics

After the CloudFormation stack deploys successfully, the example job starts automatically and takes approximately 15 minutes to complete. On the CloudWatch console, choose Dashboards in the navigation pane. Then filter the list by the prefix SparkMonitoring.

The example dashboard includes information on the cluster and an overview of the Spark jobs, stages, and tasks. Metrics are also available under a custom namespace starting with EMRCustomSparkCloudWatchSink.

CloudWatch dashboard summary section

Memory, CPU, I/O, and additional task distribution metrics are also included.

CloudWatch dashboard executors

Finally, detailed Java garbage collection metrics are available per executor.

CloudWatch dashboard garbage-collection

Clean up

To avoid future charges in your account, delete the resources you created in this walkthrough. The EMR cluster will incur charges as long as the cluster is active, so stop it when you’re done. Complete the following steps:

  1. On the CloudFormation console, in the navigation pane, choose Stacks.
  2. Choose the stack you launched (EMR-CloudWatch-Demo), then choose Delete.
  3. Empty the S3 bucket you created.
  4. Delete the S3 bucket you created.

Conclusion

Now that you have completed the steps in this walkthrough, the CloudWatch agent is running on your cluster hosts and configured to push Spark metrics to CloudWatch. With this feature, you can effectively monitor the health and performance of your Spark jobs running on Amazon EMR, detecting critical issues in real time and identifying root causes quickly.

You can package and deploy this solution through a CloudFormation template like this example template, which creates the IAM instance profile role, CloudWatch dashboard, and EMR cluster. The source code for the library is available on GitHub for customization.

To take this further, consider using these metrics in CloudWatch alarms. You could collect them with other alarms into a composite alarm or configure alarm actions such as sending Amazon Simple Notification Service (Amazon SNS) notifications to trigger event-driven processes such as AWS Lambda functions.


About the Author

author portraitLe Clue Lubbe is a Principal Engineer at AWS. He works with our largest enterprise customers to solve some of their most complex technical problems. He drives broad solutions through innovation to impact and improve the life of our customers.

AWS Weekly Roundup – Amazon MWAA, EMR Studio, Generative AI, and More – August 14, 2023

Post Syndicated from Antje Barth original https://aws.amazon.com/blogs/aws/aws-weekly-roundup-amazon-mwaa-emr-studio-generative-ai-and-more-august-14-2023/

While I enjoyed a few days off in California to get a dose of vitamin sea, a lot has happened in the AWS universe. Let’s take a look together!

Last Week’s Launches
Here are some launches that got my attention:

Amazon MWAA now supports Apache Airflow version 2.6Amazon Managed Workflows for Apache Airflow (Amazon MWAA) is a managed orchestration service for Apache Airflow that you can use to set up and operate end-to-end data pipelines in the cloud. Apache Airflow version 2.6 introduces important security updates and bug fixes that enhance the security and reliability of your workflows. If you’re currently running Apache Airflow version 2.x, you can now seamlessly upgrade to version 2.6.3. Check out this AWS Big Data Blog post to learn more.

Amazon EMR Studio adds support for AWS Lake Formation fine-grained access controlAmazon EMR Studio is a web-based integrated development environment (IDE) for fully managed Jupyter notebooks that run on Amazon EMR clusters. When you connect to EMR clusters from EMR Studio workspaces, you can now choose the AWS Identity and Access Management (IAM) role that you want to connect with. Apache Spark interactive notebooks will access only the data and resources permitted by policies attached to this runtime IAM role. When data is accessed from data lakes managed with AWS Lake Formation, you can enforce table and column-level access using policies attached to this runtime role. For more details, have a look at the Amazon EMR documentation.

AWS Security Hub launches 12 new security controls AWS Security Hub is a cloud security posture management (CSPM) service that performs security best practice checks, aggregates alerts, and enables automated remediation. With the newly released controls, Security Hub now supports three additional AWS services: Amazon Athena, Amazon DocumentDB (with MongoDB compatibility), and Amazon Neptune. Security Hub has also added an additional control against Amazon Relational Database Service (Amazon RDS). AWS Security Hub now offers 276 controls. You can find more information in the AWS Security Hub documentation.

Additional AWS services available in the AWS Israel (Tel Aviv) Region – The AWS Israel (Tel Aviv) Region opened on August 1, 2023. This past week, AWS Service Catalog, Amazon SageMaker, Amazon EFS, and Amazon Kinesis Data Analytics were added to the list of available services in the Israel (Tel Aviv) Region. Check the AWS Regional Services List for the most up-to-date availability information.

For a full list of AWS announcements, be sure to keep an eye on the What’s New at AWS page.

Other AWS News
Here are some additional blog posts and news items that you might find interesting:

AWS recognized as a Leader in 2023 Gartner Magic Quadrant for Contact Center as a Service with Amazon Connect – AWS was named a Leader for the first time since Amazon Connect, our flexible, AI-powered cloud contact center, was launched in 2017. Read the full story here. 

Generate creative advertising using generative AI –  This AWS Machine Learning Blog post shows how to generate captivating and innovative advertisements at scale using generative AI. It discusses the technique of inpainting and how to seamlessly create image backgrounds, visually stunning and engaging content, and reducing unwanted image artifacts.

AWS open-source news and updates – My colleague Ricardo writes this weekly open-source newsletter in which he highlights new open-source projects, tools, and demos from the AWS Community.

Upcoming AWS Events
Check your calendars and sign up for these AWS events:

Build On AWS - Generative AIBuild On Generative AI – Your favorite weekly Twitch show about all things generative AI is back for season 2 today! Every Monday, 9:00 US PT, my colleagues Emily and Darko look at new technical and scientific patterns on AWS, inviting guest speakers to demo their work and show us how they built something new to improve the state of generative AI.

In today’s episode, Emily and Darko discussed the latest models LlaMa-2 and Falcon, and explored them in retrieval-augmented generation design patterns. You can watch the video here. Check out show notes and the full list of episodes on community.aws.

AWS NLP Conference 2023 – Join this in-person event on September 13–14 in London to hear about the latest trends, ground-breaking research, and innovative applications that leverage natural language processing (NLP) capabilities on AWS. This year, the conference will primarily focus on large language models (LLMs), as they form the backbone of many generative AI applications and use cases. Register here.

AWS Global Summits – The 2023 AWS Summits season is almost coming to an end with the last two in-person events in Mexico City (August 30) and Johannesburg (September 26).

AWS Community Days – Join a community-led conference run by AWS user group leaders in your region: West Africa (August 19), Taiwan (August 26), Aotearoa (September 6), Lebanon (September 9), and Munich (September 14).

AWS re:Invent 2023AWS re:Invent (November 27 – December 1) – Join us to hear the latest from AWS, learn from experts, and connect with the global cloud community. Registration is now open.

You can browse all upcoming in-person and virtual events.

That’s all for this week. Check back next Monday for another Weekly Roundup!

— Antje

P.S. We’re focused on improving our content to provide a better customer experience, and we need your feedback to do so. Take this quick survey to share insights on your experience with the AWS Blog. Note that this survey is hosted by an external company, so the link doesn’t lead to our website. AWS handles your information as described in the AWS Privacy Notice.

Improved scalability and resiliency for Amazon EMR on EC2 clusters

Post Syndicated from Ravi Kumar Singh original https://aws.amazon.com/blogs/big-data/improved-scalability-and-resiliency-for-amazon-emr-on-ec2-clusters/

Amazon EMR is the cloud big data solution for petabyte-scale data processing, interactive analytics, and machine learning using open-source frameworks such as Apache Spark, Apache Hive, and Presto. Customers asked us for features that would further improve the resiliency and scalability of their Amazon EMR on EC2 clusters, including their large, long-running clusters. We have been hard at work to meet those needs. Over the past 12 months, we have worked backward from customer requirements and launched over 30 new features that improve the resiliency and scalability of your Amazon EMR on EC2 clusters. This post covers some of these key enhancements across three main areas:

  • Improved cluster utilization with optimized scaling experience
  • Minimized interruptions with enhanced resiliency and availability
  • Improved cluster resiliency with upgraded logging and debugging capabilities

Let’s dive into each of these areas.

Improved cluster utilization with optimized scaling experience

Customers use Amazon EMR to run diverse analytics workloads with varying SLAs, ranging from near-real-time streaming jobs to exploratory interactive workloads and everything in between. To cater to these dynamic workloads, you can resize your clusters either manually or by enabling automatic scaling. You can also use the Amazon EMR managed scaling feature to automatically resize your clusters for optimal performance at the lowest possible cost. To ensure swift cluster resizes, we implemented multiple improvements that are available in the latest Amazon EMR releases:

  • Enhanced resiliency of cluster scaling workflow to EC2 Spot Instance interruptions – Many Amazon EMR customers use EC2 Spot Instances for their Amazon EMR on EC2 clusters to reduce costs. Spot Instances are spare Amazon Elastic Compute Cloud (Amazon EC2) compute capacity offered at discounts of up to 90% compared to On-Demand pricing. However, Amazon EC2 can reclaim Spot capacity with a two-minute warning, which can lead to interruptions in workload. We identified an issue where the cluster’s scaling operation gets stuck when over a hundred core nodes launched on Spot Instances are reclaimed by Amazon EC2 throughout the life of the cluster. Starting with Amazon EMR version 6.8.0, we mitigated this issue by fixing a gap in the process HDFS uses to decommission nodes that caused the scaling operations to get stuck. We contributed this improvement back to the open-source community, enabling seamless recovery and efficient scaling in the event of Spot interruptions.
  • Improve cluster utilization by recommissioning recently decommissioned nodes for Spark workloads within seconds – Amazon EMR allows you to scale down your cluster without affecting your workload by gracefully decommissioning core and task nodes. Furthermore, to prevent task failures, Apache Spark ensures that decommissioning nodes are not assigned any new tasks. However, if a new job is submitted immediately before these nodes are fully decommissioned, Amazon EMR will trigger a scale-up operation for the cluster. This results in these decommissioning nodes to be immediately recommissioned and added back into the cluster. Due to a gap in Apache Spark’s recommissioning logic, these recommissioned nodes would not accept new Spark tasks for up to 60 minutes. We enhanced the recommissioning logic, which ensures recommissioned nodes would start accepting new tasks within seconds, thereby improving cluster utilization. This improvement is available in Amazon EMR release 6.11 and higher.
  • Minimized cluster scaling interruptions due to disk over-utilization – The YARN ResourceManager exclude file is a key component of Apache Hadoop that Amazon EMR uses to centrally manage cluster resources for multiple data-processing frameworks. This exclude file contains a list of nodes to be removed from the cluster to facilitate a cluster scale-down operation. With Amazon EMR release 6.11.0, we improved the cluster scaling workflow to reduce scale-down failures. This improvement minimizes failures due to partial updates or corruption in the exclude file caused by low disk space. Additionally, we built a robust file recovery mechanism to restore the exclude file in case of corruption, ensuring uninterrupted cluster scaling operations.

Minimized interruptions with enhanced resiliency and availability

Amazon EMR offers high availability and fault tolerance for your big data workloads. Let’s look at a few key improvements we launched in this area:

  • Improved fault tolerance to hardware reconfiguration – Amazon EMR offers the flexibility to decouple storage and compute. We observed that customers often increase the size of or add incremental block-level storage to their EC2 instances as their data processing volume and concurrency grow. Starting with Amazon EMR release 6.11.0, we made the EMR cluster’s local storage file system more resilient to unpredictable instance reconfigurations such as instance restarts. By addressing scenarios where an instant restart could result in the block storage device name to change, we eliminated the risk of the cluster becoming inoperable or losing data.
  • Reduce cluster startup time for Kerberos-enabled EMR clusters with long-running bootstrap actions – Multiple customers use Kerberos for authentication and run long-running bootstrap actions on their EMR clusters. In Amazon EMR 6.9.0 and higher releases, we fixed a timing sequence mismatch issue that occurs between Apache BigTop and the Amazon EMR on EC2 cluster startup sequence. This timing sequence mismatch occurs when a system attempts to perform two or more operations at the same time instead of doing them in the proper sequence. This issue caused certain cluster configurations to experience instance startup timeouts. We contributed a fix to the open-source community and made additional improvements to the Amazon EMR startup sequence to prevent this condition, resulting in cluster start time improvements of up to 200% for such clusters.

Improved cluster resiliency with upgraded logging and debugging capabilities

Effective log management is essential to ensure log availability and maintain the health of EMR clusters. This becomes especially critical when you’re running multiple custom client tools and third-party applications on your Amazon EMR on EC2 clusters. Customers depend on EMR logs, in addition to EMR events, to monitor cluster and workload health, troubleshoot urgent issues, simplify security audit, and enhance compliance. Let’s look at a few key enhancements we made in this area:

  • Upgraded on-cluster log management daemon – Amazon EMR now automatically restarts the log management daemon if it’s interrupted. The Amazon EMR on-cluster log management daemon archives logs to Amazon Simple Storage Service (Amazon S3) and deletes them from instance storage. This minimizes cluster failures due to disk over-utilization, while allowing the log files to remain accessible even after the cluster or node stops. This upgrade is available in Amazon EMR release 6.10.0 and higher. For more information, see Configure cluster logging and debugging.
  • Enhanced cluster stability with improved log rotation and monitoring – Many of our customers have long-running clusters that have been operating for years. Some open-source application logs such as Hive and Kerberos logs that are never rotated can continue to grow on these long-running clusters. This could lead to disk over-utilization and eventually result in cluster failures. We enabled log rotation for such log files to minimize disk, memory, and CPU over-utilization scenarios. Furthermore, we expanded our log monitoring to include additional log folders. These changes, available starting with Amazon EMR version 6.10.0, minimize situations where EMR cluster resources are over-utilized, while ensuring log files are archived to Amazon S3 for a wider variety of use cases.

Conclusion

In this post, we highlighted the improvements that we made in Amazon EMR on EC2 with the goal to make your EMR clusters more resilient and stable. We focused on improving cluster utilization with the improved and optimized scaling experience for EMR workloads, minimized interruptions with enhanced resiliency and availability for Amazon EMR on EC2 clusters, and improved cluster resiliency with upgraded logging and debugging capabilities. We will continue to deliver further enhancements with new Amazon EMR releases. We invite you to try new features and capabilities in the latest Amazon EMR releases and get in touch with us through your AWS account team to share your valuable feedback and comments. To learn more and get started with Amazon EMR, check out the tutorial Getting started with Amazon EMR.


About the Authors

Ravi Kumar is a Senior Product Manager for Amazon EMR at Amazon Web Services.

Kevin Wikant is a Software Development Engineer for Amazon EMR at Amazon Web Services.
Orca Security’s journey to a petabyte-scale data lake with Apache Iceberg and AWS Analytics

Post Syndicated from Yonatan Dolan original https://aws.amazon.com/blogs/big-data/orca-securitys-journey-to-a-petabyte-scale-data-lake-with-apache-iceberg-and-aws-analytics/

This post is co-written with Eliad Gat and Oded Lifshiz from Orca Security.

With data becoming the driving force behind many industries today, having a modern data architecture is pivotal for organizations to be successful. One key component that plays a central role in modern data architectures is the data lake, which allows organizations to store and analyze large amounts of data in a cost-effective manner and run advanced analytics and machine learning (ML) at scale.

Orca Security is an industry-leading Cloud Security Platform that identifies, prioritizes, and remediates security risks and compliance issues across your AWS Cloud estate. Orca connects to your environment in minutes with patented SideScanning technology to provide complete coverage across vulnerabilities, malware, misconfigurations, lateral movement risk, weak and leaked passwords, overly permissive identities, and more.

The Orca Platform is powered by a state-of-the-art anomaly detection system that uses cutting-edge ML algorithms and big data capabilities to detect potential security threats and alert customers in real time, ensuring maximum security for their cloud environment. At the core of Orca’s anomaly detection system is its transactional data lake, which enables the company’s data scientists, analysts, data engineers, and ML specialists to extract valuable insights from vast amounts of data and deliver innovative cloud security solutions to its customers.

In this post, we describe Orca’s journey building a transactional data lake using Amazon Simple Storage Service (Amazon S3), Apache Iceberg, and AWS Analytics. We explore why Orca chose to build a transactional data lake and examine the key considerations that guided the selection of Apache Iceberg as the preferred table format.

In addition, we describe the Orca Platform architecture and the technologies used. Lastly, we discuss the challenges encountered throughout the project, present the solutions used to address them, and share valuable lessons learned.

Why did Orca build a data lake?

Prior to the creation of the data lake, Orca’s data was distributed among various data silos, each owned by a different team with its own data pipelines and technology stack. This setup led to several issues, including scaling difficulties as the data size grew, maintaining data quality, ensuring consistent and reliable data access, high costs associated with storage and processing, and difficulties supporting streaming use cases. Moreover, running advanced analytics and ML on disparate data sources proved challenging. To overcome these issues, Orca decided to build a data lake.

A data lake is a centralized data repository that enables organizations to store and manage large volumes of structured and unstructured data, eliminating data silos and facilitating advanced analytics and ML on the entire data. By decoupling storage and compute, data lakes promote cost-effective storage and processing of big data.

Why did Orca choose Apache Iceberg?

Orca considered several table formats that have evolved in recent years to support its transactional data lake. Amongst the options, Apache Iceberg stood out as the ideal choice because it met all of Orca’s requirements.

First, Orca sought a transactional table format that ensures data consistency and fault tolerance. Apache Iceberg’s transactional and ACID guarantees, which allow concurrent read and write operations while ensuring data consistency and simplified fault handling, fulfill this requirement. Furthermore, Apache Iceberg’s support for time travel and rollback capabilities makes it highly suitable for addressing data quality issues by reverting to a previous state in a consistent manner.

Second, a key requirement was to adopt an open table format that integrates with various processing engines. This was to avoid vendor lock-in and allow teams to choose the processing engine that best suits their needs. Apache Iceberg’s engine-agnostic and open design meets this requirement by supporting all popular processing engines, including Apache Spark, Amazon Athena, Apache Flink, Trino, Presto, and more.

In addition, given the substantial data volumes handled by the system, an efficient table format was required that can support querying petabytes of data very fast. Apache Iceberg’s architecture addresses this need by efficiently filtering and reducing scanned data, resulting in accelerated query times.

An additional requirement was to allow seamless schema changes without impacting end-users. Apache Iceberg’s range of features, including schema evolution, hidden partitions, and partition evolution, addresses this requirement.

Lastly, it was important for Orca to choose a table format that is widely adopted. Apache Iceberg’s growing and active community aligned with the requirement for a popular and community-backed table format.

Solution overview

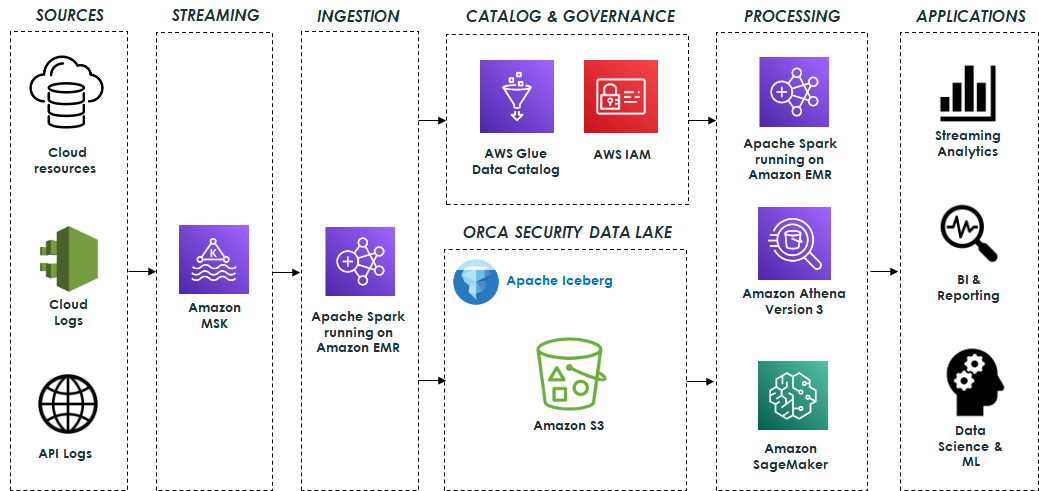
Orca’s data lake is based on open-source technologies that seamlessly integrate with Apache Iceberg. The system ingests data from various sources such as cloud resources, cloud activity logs, and API access logs, and processes billions of messages, resulting in terabytes of data daily. This data is sent to Apache Kafka, which is hosted on Amazon Managed Streaming for Apache Kafka (Amazon MSK). It is then processed using Apache Spark Structured Streaming running on Amazon EMR and stored in the data lake. Amazon EMR streamlines the process of loading all required Iceberg packages and dependencies, ensuring that the data is stored in Apache Iceberg format and ready for consumption as quickly as possible.

The data lake is built on top of Amazon S3 using Apache Iceberg table format with Apache Parquet as the underlying file format. In addition, the AWS Glue Data Catalog enables data discovery, and AWS Identity and Access Management (IAM) enforces secure access controls for the lake and its operations.

The data lake serves as the foundation for a variety of capabilities that are supported by different engines.

Data pipelines built on Apache Spark and Athena SQL analyze and process the data stored in the data lake. These data pipelines generate valuable insights and curated data that are stored in Apache Iceberg tables for downstream usage. This data is then used by various applications for streaming analytics, business intelligence, and reporting.

Amazon SageMaker is used to build, train, and deploy a range of ML models. Specifically, the system uses Amazon SageMaker Processing jobs to process the data stored in the data lake, employing the AWS SDK for Pandas (previously known as AWS Wrangler) for various data transformation operations, including cleaning, normalization, and feature engineering. This ensures that the data is suitable for training purposes. Additionally, SageMaker training jobs are employed for training the models. After the models are trained, they are deployed and used to identify anomalies and alert customers in real time to potential security threats. The following diagram illustrates the solution architecture.

Orca security Data Lake Architecture

Challenges and lessons learned

Orca faced several challenges while building its petabyte-scale data lake, including:

  • Determining optimal table partitioning
  • Optimizing EMR streaming ingestion for high throughput
  • Taming the small files problem for fast reads
  • Maximizing performance with Athena version 3
  • Maintaining Apache Iceberg tables
  • Managing data retention
  • Monitoring the data lake infrastructure and operations
  • Mitigating data quality issues

In this section, we describe each of these challenges and the solutions implemented to address them.

Determining optimal table partitioning

Determining optimal partitioning for each table is very important in order to optimize query performance and minimize the impact on teams querying the tables when partitioning changes. Apache Iceberg’s hidden partitions combined with partition transformations proved to be valuable in achieving this goal because it allowed for transparent changes to partitioning without impacting end-users. Additionally, partition evolution enables experimentation with various partitioning strategies to optimize cost and performance without requiring a rewrite of the table’s data every time.

For example, with these features, Orca was able to easily change several of its table partitioning from DAY to HOUR with no impact on user queries. Without this native Iceberg capability, they would have needed to coordinate the new schema with all the teams that query the tables and rewrite the entire data, which would have been a costly, time-consuming, and error-prone process.

Optimizing EMR streaming ingestion for high throughput

As mentioned previously, the system ingests billions of messages daily, resulting in terabytes of data processed and stored each day. Therefore, optimizing the EMR clusters for this type of load while maintaining high throughput and low costs has been an ongoing challenge. Orca addressed this in several ways.

First, Orca chose to use instance fleets with its EMR clusters because they allow optimized resource allocation by combining different instance types and sizes. Instance fleets improve resilience by allowing multiple Availability Zones to be configured. As a result, the cluster will launch in an Availability Zone with all the required instance types, preventing capacity limitations. Additionally, instance fleets can use both Amazon Elastic Compute Cloud (Amazon EC2) On-Demand and Spot instances, resulting in cost savings.

The process of sizing the cluster for high throughput and lower costs involved adjusting the number of core and task nodes, selecting suitable instance types, and fine-tuning CPU and memory configurations. Ultimately, Orca was able to find an optimal configuration consisting of on-demand core nodes and spot task nodes of varying sizes, which provided high throughput but also ensured compliance with SLAs.

Orca also found that using different Kafka Spark Structured Streaming properties, such as minOffsetsPerTrigger, maxOffsetsPerTrigger, and minPartitions, provided higher throughput and better control of the load. Using minPartitions, which enables better parallelism and distribution across a larger number of tasks, was particularly useful for consuming high lags quickly.

Lastly, when dealing with a high data ingestion rate, Amazon S3 may throttle the requests and return 503 errors. To address this scenario, Iceberg offers a table property called write.object-storage.enabled, which incorporates a hash prefix into the stored S3 object path. This approach effectively mitigates throttling problems.

Taming the small files problem for fast reads

A common challenge often encountered when ingesting streaming data into the data lake is the creation of many small files. This can have a negative impact on read performance when querying the data with Athena or Apache Spark. Having a high number of files leads to longer query planning and runtimes due to the need to process and read each file, resulting in overhead for file system operations and network communication. Additionally, this can result in higher costs due to the large number of S3 PUT and GET requests required.

To address this challenge, Apache Spark Structured Streaming provides the trigger mechanism, which can be used to tune the rate at which data is committed to Apache Iceberg tables. The commit rate has a direct impact on the number of files being produced. For instance, a higher commit rate, corresponding to a shorter time interval, results in lots of data files being produced.

In certain cases, launching the Spark cluster on an hourly basis and configuring the trigger to AvailableNow facilitated the processing of larger data batches and reduced the number of small files created. Although this approach led to cost savings, it did involve a trade-off of reduced data freshness. However, this trade-off was deemed acceptable for specific use cases.

In addition, to address preexisting small files within the data lake, Apache Iceberg offers a data files compaction operation that combines these smaller files into larger ones. Running this operation on a schedule is highly recommended to optimize the number and size of the files. Compaction also proves valuable in handling late-arriving data and enables the integration of this data into consolidated files.

Maximizing performance with Athena version 3

Orca was an early adopter of Athena version 3, Amazon’s implementation of the Trino query engine, which provides extensive support for Apache Iceberg. Whenever possible, Orca preferred using Athena over Apache Spark for data processing. This preference was driven by the simplicity and serverless architecture of Athena, which led to reduced costs and easier usage, unlike Spark, which typically required provisioning and managing a dedicated cluster at higher costs.

In addition, Orca used Athena as part of its model training and as the primary engine for ad hoc exploratory queries conducted by data scientists, business analysts, and engineers. However, for maintaining Iceberg tables and updating table properties, Apache Spark remained the more scalable and feature-rich option.

Maintaining Apache Iceberg tables

Ensuring optimal query performance and minimizing storage overhead became a significant challenge as the data lake grew to a petabyte scale. To address this challenge, Apache Iceberg offers several maintenance procedures, such as the following:

  • Data files compaction – This operation, as mentioned earlier, involves combining smaller files into larger ones and reorganizing the data within them. This operation not only reduces the number of files but also enables data sorting based on different columns or clustering similar data using z-ordering. Using Apache Iceberg’s compaction results in significant performance improvements, especially for large tables, making a noticeable difference in query performance between compacted and uncompacted data.
  • Expiring old snapshots – This operation provides a way to remove outdated snapshots and their associated data files, enabling Orca to maintain low storage costs.

Running these maintenance procedures efficiently and cost-effectively using Apache Spark, particularly the compaction operation, which operates on terabytes of data daily, requires careful consideration. This entails appropriately sizing the Spark cluster running on EMR and adjusting various settings such as CPU and memory.

In addition, using Apache Iceberg’s metadata tables proved to be very helpful in identifying issues related to the physical layout of Iceberg’s tables, which can directly impact query performance. Metadata tables offer insights into the physical data storage layout of the tables and offer the convenience of querying them with Athena version 3. By accessing the metadata tables, crucial information about tables’ data files, manifests, history, partitions, snapshots, and more can be obtained, which aids in understanding and optimizing the table’s data layout.

For instance, the following queries can uncover valuable information about the underlying data:

  • The number of files and their average size per partition:
    >SELECT partition, file_count, (total_size / file_count) AS avg_file_size FROM "db"."table$partitions"

  • The number of data files pointed to by each manifest:
    SELECT path, added_data_files_count + existing_data_files_count AS number_of_data_files FROM "db"."table$manifests"

  • Information about the data files:
    SELECT file_path, file_size_in_bytes FROM "db"."table$files"

  • Information related to data completeness:
    SELECT record_count, partition FROM "db"."table$partitions"

Managing data retention

Effective management of data retention in a petabyte-scale data lake is crucial to ensure low storage costs as well as to comply with GDPR. However, implementing such a process can be challenging when dealing with Iceberg data stored in S3 buckets, because deleting files based on simple S3 lifecycle policies could potentially cause table corruption. This is because Iceberg’s data files are referenced in manifest files, so any changes to data files must also be reflected in the manifests.

To address this challenge, certain considerations must be taken into account while handling data retention properly. Apache Iceberg provides two modes for handling deletes, namely copy-on-write (CoW), and merge-on-read (MoR). In CoW mode, Iceberg rewrites data files at the time of deletion and creates new data files, whereas in MoR mode, instead of rewriting the data files, a delete file is written that lists the position of deleted records in files. These files are then reconciled with the remaining data during read time.

In favor of faster read times, CoW mode is preferable and when used in conjunction with the expiring old snapshots operation, it allows for the hard deletion of data files that have exceeded the set retention period.

In addition, by storing the data sorted based on the field that will be utilized for deletion (for example, organizationID), it’s possible to reduce the number of files that require rewriting. This optimization significantly enhances the efficiency of the deletion process, resulting in improved deletion times.

Monitoring the data lake infrastructure and operations

Managing a data lake infrastructure is challenging due to the various components it encompasses, including those responsible for data ingestion, storage, processing, and querying.

Effective monitoring of all these components involves tracking resource utilization, data ingestion rates, query runtimes, and various other performance-related metrics, and is essential for maintaining optimal performance and detecting issues as soon as possible.

Monitoring Amazon EMR was crucial because it played a vital role in the system for data ingestion, processing, and maintenance. Orca monitored the cluster status and resource usage of Amazon EMR by utilizing the available metrics through Amazon CloudWatch. Furthermore, it used JMX Exporter and Prometheus to scrape specific Apache Spark metrics and create custom metrics to further improve the pipelines’ observability.

Another challenge emerged when attempting to further monitor the ingestion progress through Kafka lag. Although Kafka lag tracking is the standard method for monitoring ingestion progress, it posed a challenge because Spark Structured Streaming manages its offsets internally and doesn’t commit them back to Kafka. To overcome this, Orca utilized the progress of the Spark Structured Streaming Query Listener (StreamingQueryListener) to monitor the processed offsets, which were then committed to a dedicated Kafka consumer group for lag monitoring.

In addition, to ensure optimal query performance and identify potential performance issues, it was essential to monitor Athena queries. Orca addressed this by using key metrics from Athena and the AWS SDK for Pandas, specifically TotalExecutionTime and ProcessedBytes. These metrics helped identify any degradation in query performance and keep track of costs, which were based on the size of the data scanned.

Mitigating data quality issues

Apache Iceberg’s capabilities and overall architecture played a key role in mitigating data quality challenges.

One of the ways Apache Iceberg addresses these challenges is through its schema evolution capability, which enables users to modify or add columns to a table’s schema without rewriting the entire data. This feature prevents data quality issues that may arise due to schema changes, because the table’s schema is managed as part of the manifest files, ensuring safe changes.

Furthermore, Apache Iceberg’s time travel feature provides the ability to review a table’s history and roll back to a previous snapshot. This functionality has proven to be extremely useful in identifying potential data quality issues and swiftly resolving them by reverting to a previous state with known data integrity.

These robust capabilities ensure that data within the data lake remains accurate, consistent, and reliable.

Conclusion

Data lakes are an essential part of a modern data architecture, and now it’s easier than ever to create a robust, transactional, cost-effective, and high-performant data lake by using Apache Iceberg, Amazon S3, and AWS Analytics services such as Amazon EMR and Athena.

Since building the data lake, Orca has observed significant improvements. The data lake infrastructure has allowed Orca’s platform to have seamless scalability while reducing the cost of running its data pipelines by over 50% utilizing Amazon EMR. Additionally, query costs were reduced by more than 50% using the efficient querying capabilities of Apache Iceberg and Athena version 3.

Most importantly, the data lake has made a profound impact on Orca’s platform and continues to play a key role in its success, supporting new use cases such as change data capture (CDC) and others, and enabling the development of cutting-edge cloud security solutions.

If Orca’s journey has sparked your interest and you are considering implementing a similar solution in your organization, here are some strategic steps to consider:

  • Start by thoroughly understanding your organization’s data needs and how this solution can address them.
  • Reach out to experts, who can provide you with guidance based on their own experiences. Consider engaging in seminars, workshops, or online forums that discuss these technologies. The following resources are recommended for getting started:
  • An important part of this journey would be to implement a proof of concept. This hands-on experience will provide valuable insights into the complexities of a transactional data lake.

Embarking on a journey to a transactional data lake using Amazon S3, Apache Iceberg, and AWS Analytics can vastly improve your organization’s data infrastructure, enabling advanced analytics and machine learning, and unlocking insights that drive innovation.


About the Authors

Eliad Gat is a Big Data & AI/ML Architect at Orca Security. He has over 15 years of experience designing and building large-scale cloud-native distributed systems, specializing in big data, analytics, AI, and machine learning.

Oded Lifshiz is a Principal Software Engineer at Orca Security. He enjoys combining his passion for delivering innovative, data-driven solutions with his expertise in designing and building large-scale machine learning pipelines.

Yonatan Dolan is a Principal Analytics Specialist at Amazon Web Services. He is located in Israel and helps customers harness AWS analytical services to leverage data, gain insights, and derive value. Yonatan also leads the Apache Iceberg Israel community.

Carlos Rodrigues is a Big Data Specialist Solutions Architect at Amazon Web Services. He helps customers worldwide build transactional data lakes on AWS using open table formats like Apache Hudi and Apache Iceberg.

Sofia Zilberman is a Sr. Analytics Specialist Solutions Architect at Amazon Web Services. She has a track record of 15 years of creating large-scale, distributed processing systems. She remains passionate about big data technologies and architecture trends, and is constantly on the lookout for functional and technological innovations.
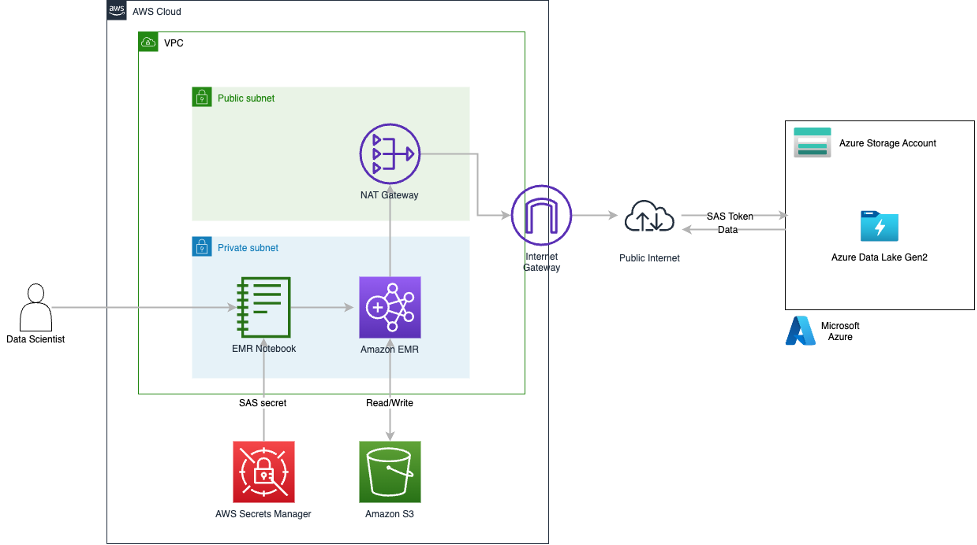
Enable remote reads from Azure ADLS with SAS tokens using Spark in Amazon EMR

Post Syndicated from Kiran Anand original https://aws.amazon.com/blogs/big-data/enable-remote-reads-from-azure-adls-with-sas-tokens-using-spark-in-amazon-emr/

Organizations use data from many sources to understand, analyze, and grow their business. These data sources are often spread across various public cloud providers. Enterprises may also expand their footprint by mergers and acquisitions, and during such events they often end up with data spread across different public cloud providers. These scenarios can create the need for AWS services to remotely access, in an ad hoc and temporary fashion, data stored in another public cloud provider such as Microsoft Azure to enable business as usual or facilitate a transition.

In such scenarios, data scientists and analysts are presented with a unique challenge when working to complete a quick data analysis because data typically has to be duplicated or migrated to a centralized location. Doing so introduces time delays, increased cost, and higher complexity as pipelines or replication processes are stood up by data engineering teams. In the end, the data may not even be needed, resulting in further loss of resources and time. Having quick, secure, and constrained access to the maximum amount of data is critical for enterprises to improve decision-making. Amazon EMR, with its open-source Hadoop modules and support for Apache Spark and Jupyter and JupyterLab notebooks, is a good choice to solve this multi-cloud data access problem.

Amazon EMR is a top-tier cloud big data solution for petabyte-scale data processing, interactive analytics, and machine learning using open-source frameworks such as Apache Spark, Apache Hive, and Presto. Amazon EMR Notebooks, a managed environment based on Jupyter and JupyterLab notebooks, enables you to interactively analyze and visualize data, collaborate with peers, and build applications using EMR clusters running Apache Spark.

In this post, we demonstrate how to set up quick, constrained, and time-bound authentication and authorization to remote data sources in Azure Data Lake Storage (ADLS) using a shared access signature (SAS) when running Apache Spark jobs via EMR Notebooks attached to an EMR cluster. This access enables data scientists and data analysts to access data directly when operating in multi-cloud environments and join datasets in Amazon Simple Storage Service (Amazon S3) with datasets in ADLS using AWS services.

Overview of solution

Amazon EMR inherently includes Apache Hadoop at its core and integrates other related open-source modules. The hadoop-aws and hadoop-azure modules provide support for AWS and Azure integration, respectively. For ADLS Gen2, the integration is done through the abfs connector, which supports reading and writing data in ADLS. Azure provides various options to authorize and authenticate requests to storage, including SAS. With SAS, you can grant restricted access to ADLS resources over a specified time interval (maximum of 7 days). For more information about SAS, refer to Delegate access by using a shared access signature.

Out of the box, Amazon EMR doesn’t have the required libraries and configurations to connect to ADLS directly. There are different methods to connect Amazon EMR to ADLS, and they all require custom configurations. In this post, we focus specifically on connecting from Apache Spark in Amazon EMR using SAS tokens generated for ADLS. The SAS connectivity is possible in Amazon EMR version 6.9.0 and above, which bundles hadoop-common 3.3.0 where support for HADOOP-16730 has been implemented. However, although the hadoop-azure module provides a SASTokenProvider interface, it is not yet implemented as a class. For accessing ADLS using SAS tokens, this interface should be implemented as a custom class JAR and presented as a configuration within the EMR cluster.

You can find a sample implementation of the SASTokenProvider interface on GitHub. In this post, we use this sample implementation of the SASTokenProvider interface and package it as a JAR file that can be added directly to an EMR environment on version 6.9.0 and above. To enable the JAR, a set of custom configurations are required on Amazon EMR that enable the SAS token access to ADLS. The provided JAR needs to be added to the HADOOP_CLASSPATH, and then the HADOOP_CLASSPATH needs to be added to the SPARK_DIST_CLASSPATH. This is all handled in the sample AWS CloudFormation template provided with this post. At a high level, the CloudFormation template deploys the Amazon EMR cluster with the custom configurations and has a bootstrapping script that stages the JAR on the nodes of the EMR cluster. The CloudFormation template also stages a sample Jupyter notebook and datasets into an S3 bucket. When the EMR cluster is ready, the EMR notebook needs to be attached to it and the sample Jupyter notebook loaded. After the SAS token configurations are done in the notebook, we can start reading data remotely from ADLS by running the cells within the notebook. The following diagram provides a high-level view of the solution architecture.

Architecture Overview

We walk through the following high-level steps to implement the solution:

  1. Create resources using AWS CloudFormation.
  2. Set up sample data on ADLS and create a delegated access with an SAS token.
  3. Store the SAS token securely in AWS Secrets Manager.
  4. Deploy an EMR cluster with the required configurations to securely connect and read data from ADLS via the SAS token.
  5. Create an EMR notebook and attach it to the launched EMR cluster.
  6. Read data via Spark from ADLS within the JupyterLab notebook.

For this setup, data is going over the public internet, which is not a best practice nor an AWS recommendation, but it’s sufficient to showcase the Amazon EMR configurations that enable remote reads from ADLS. Solutions such as AWS Direct Connect or AWS Site-to-Site VPN should be utilized to secure data traffic in enterprise deployments.

For an AWS Command Line Interface (AWS CLI)-based deployment example, refer to the appendix at the end of this post.

Prerequisites

To get this solution working, we have a set of prerequisites for both AWS and Microsoft Azure:

  • An AWS account that can create AWS Identity and Access Management (IAM) resources with custom names and has access enabled for Amazon EMR, Amazon S3, AWS CloudFormation, and Secrets Manager.
  • The old Amazon EMR console enabled.
  • An Azure account with a storage account and container.
  • Access to blob data in ADLS with Azure AD credentials. The user must have the required role assignments in Azure. Refer to Assign an Azure role for more details.

We are following the best practice of using Azure AD credentials to create a user delegation SAS when applications need access to data storage using shared access signature tokens. In this post, we create and use a user delegation SAS with read and list permissions for ADLS access. For more information about creating SAS tokens using the Azure portal, refer to Use the Azure portal.

Before we generate the user delegation SAS token, we need to ensure the credential that will be used to generate the token has appropriate permissions to access data on the ADLS storage account. Requests submitted to the ADLS account using the user delegation SAS token are authorized with the Azure AD credentials that were used to create the SAS token.

The following minimum Azure role-based access control is required at the storage account level to access the data on ADLS storage:

  • Reader – Allow viewing resources such as listing the Azure storage account and its configuration
  • Storage Blob Data Reader – Allow reading and listing Azure storage containers and blobs
  • Storage Blob Delegator – In addition to the permissions to access the data on the ADLS account, you also need this role to generate a user delegation SAS token

Create an EMR cluster and S3 artifacts with AWS CloudFormation

To create the supported version of an EMR cluster with the required SAS configurations and stage all the required artifacts in Amazon S3, complete the following steps:

  1. Sign in to the AWS Management Console in your Region (for this post, we use us-east-1).
  2. Choose Launch Stack to deploy the CloudFormation template:
  3. Choose Next.

Create Stack

  1. For Stack name, enter an appropriate lowercase name.
  2. For EmrRelease, leave as default.

As of this writing, the stack has been tested against 6.9.0 and 6.10.0.

  1. Choose Next.
    Stack Details
  2. On the next page, choose Next.
  3. Review the details and select I acknowledge that AWS CloudFormation might create IAM resources with custom names.
  4. Choose Create stack.
  5. Monitor the progress of the stack creation until it’s complete (about 15–20 minutes).
  6. When the stack creation is complete, navigate to the stack detail page.
  7. On the Resources tab, find the logical ID with the name S3ArtifactsBucket.
  8. Choose the link for the physical ID that starts with emr-spark-on-adls-<GUID> to be redirected to the bucket on the Amazon S3 console.
  9. On the Objects tab, open the EMR/ folder.
    S3 Bucket
  10. Open the artifacts/ folder.

There are five artifacts staged by the CloudFormation stack in this path:

  • azsastknprovider-1.0-SNAPSHOT.jar – The custom implementation of the SASTokenProvider interface.
  • EMR-Direct-Read-From-ADLS.ipynb – The Jupyter notebook that we’ll use with the EMR cluster to read data from ADLS.
  • env-staging.sh – A bash script that the Amazon EMR bootstrap process runs to stage azsastknprovider-1.0-SNAPSHOT.jar across cluster nodes.
  • Medallion_Drivers_-_Active.csv – A sample dataset that needs to be staged in the ADLS container from which we will read.
  • self-signed-certs.zip – The openSSL self-signed certificates used by AWS CloudFormation to encrypt data in transit. This example is a proof of concept demonstration only. Using self-signed certificates is not recommended and presents a potential security risk. For production systems, use a trusted certification authority (CA) to issue certificates.
  1. Select Medallion_Drivers_-_Active.csv and choose Download.
  2. Select EMR-Direct-Read-From-ADLS.ipynb and choose Download.

Create the SAS token and stage sample data

To generate the user delegation SAS token from the Azure portal, log in to the Azure portal with your account credentials and complete the following steps:

  1. Navigate to Storage account, Access Control, and choose Add role assignment.
  2. Add the following roles to your user: Reader, Storage Blob Data Reader, and Storage Blob Delegator.
  3. Navigate to Storage account, Containers, and choose the container you want to use.
  4. Under Settings in the navigation pane, choose Shared access tokens.
  5. Select User delegation key for Signing method.
  6. On the Permissions menu, select Read and List.
    ADLS Container
  7. For Start and expiry date/time, define the start and expiry times for the SAS token.
  8. Choose Generate SAS token and URL.
  9. Copy the token under Blob SAS token and save this value.
    SAS Token
  10. Choose Overview in the navigation pane.
  11. Choose Upload and upload the Medallion_Drivers_-_Active.csv file downloaded earlier.

Store the SAS token in Secrets Manager

Next, we secure the SAS token in Secrets Manager so it can be programmatically pulled from the Jupyter notebook.

  1. Open the Secrets Manager console in the same Region you have been working in (in this case, us-east-1).
  2. Choose Store a new secret.
  3. For Secret type, select Other type of secret.
  4. In the Key/value pairs section, enter a name for the key and enter the blob SAS token for the value.
  5. For Encryption key, choose the default AWS managed key.
  6. Choose Next.
    Secret Type
  7. For Secret name, enter a name for your secret.
  8. Leave the optional fields as default and choose Next.
  9. On the next page, leave the settings as default and choose Next.

Setting up a secret rotation is a best practice but out of scope for this post. You can do so via Azure RM PowerShell, which can be integrated with the Lambda rotation function from Secrets Manager.

  1. Choose Store.
  2. Refresh the Secrets section and choose your secret.
  3. In the Secret details section, copy the value for Secret ARN to use in the Jupyter notebook.
    Secret ARN

Configure an EMR notebook with the SAS token and read ADLS data

Finally, we create the EMR notebook environment, integrate the SAS token into the downloaded Jupyter notebook, and perform a read against ADLS.

  1. Open the Amazon EMR console in the same Region you have been working in (in this case. us-east-1).
  2. Under EMR on EC2 in the navigation pane, choose Clusters.
  3. In the cluster table, choose Cluster with ADLS SAS Access.
    EMR Cluster

On the Summary tab, you will find the applications deployed on the cluster.

EMR Summary Tab

On the Configurations tab, you can see the configurations deployed by the CloudFormation stack loading the customer JAR in the appropriate classpaths.

EMR Configurations Tab

  1. Under EMR on EC2 in the navigation pane, choose Notebooks.
  2. Choose Create notebook.
  3. Enter an appropriate name for the notebook for Notebook name.
  4. For Cluster, select Choose an existing cluster, then choose the cluster you created earlier.
  5. Leave all other settings as default and choose Create notebook.
    Create Notebook
  6. When the notebook environment is set up, choose Open in JupyterLab.
  7. On your local machine, navigate to where you saved the EMR-Direct-Read-From-ADLS.ipynb notebook.
  8. Drag and drop it into the left pane of the JupyterLab environment.
  9. Choose EMR-Direct-Read-From-ADLS.ipynb from the left pane and ensure that the interpreter selected for the notebook in the top-right corner is PySpark.
    Open Notebook
  10. In the notebook, under the SAS TOKEN SETUP markup cell, replace <AWS_REGION> with the Region you are using (in this case, us-east-1).
  11. In the same code cell, replace <ADLS_SECRET_MANAGER_SECRET_ARN> with your secret ARN and <SECRET_KEY> with your secret key.

You can get the secret key from Secrets Manager in the Secret value section for the secret you created earlier.

Secret Key

  1. In the code cell below the HADOOP CONFIGURATIONS markup cell, replace <YOUR_STORAGE_ACCOUNT> with your Azure storage account where the SAS token was set up earlier.
  2. In the code cell below the READ TEST DATA markup cell, replace <YOUR_CONTAINER> and <YOUR_STORAGE_ACCOUNT> with your Azure container and storage account name, respectively.
  3. On the Run menu, choose Run All Cells.
    Run All Cells

After all notebook cells run, you should see 10 rows in a tabular format containing the data coming from ADLS, which now can be used directly in the notebook or can be written to Amazon S3 for further use.

Results

Clean up

Deploying a CloudFormation template incurs cost based on the resources deployed. The EMR cluster is configured to stop after an hour of inactivity, but to avoid incurring ongoing charges and to fully clean up the environment, complete the following steps:

  1. On the Amazon EMR console, choose Notebooks in the navigation pane.
  2. Select the notebook you created and choose Delete, and wait for the delete to complete before proceeding to the next step.
  3. On the Amazon EMR console, choose Clusters in the navigation pane.
  4. Select the cluster Cluster With ADLS SAS Access and choose Terminate.
  5. On the Amazon VPC console, choose Security groups in the navigation pane.
  6. Find the ElasticMapReduce-Master-Private, ElasticMapReduce-Slave-Private, ElasticMapReduce-ServiceAccess, ElasticMapReduceEditors-Livy, and ElasticMapReduceEditors-Editor security groups attached to the VPC created by the CloudFormation stack and delete their inbound and outbound rules.
  7. Select these five security groups and on the Actions menu, choose Delete security groups.
  8. On the AWS CloudFormation console, choose Stacks in the navigation pane.
  9. Select the stack and choose Delete.
  10. On the Secrets Manager console, choose Secrets in the navigation pane.
  11. Select the stored SAS secret and on the Actions menu, choose Delete secret.
  12. On the IAM console, choose Roles in the navigation pane.
  13. Select the role EMR_Notebooks_DefaultRole and choose Delete.

Conclusion

In this post, we used AWS CloudFormation to deploy an EMR cluster with the appropriate configurations to connect to Azure Data Lake Storage using SAS tokens over the public internet. We provided an implementation of the SASTokenProvider interface to enable the SAS token-based connectivity to ADLS. We also provided relevant information on the SAS token creation steps on the Azure side. Furthermore, we showed how data scientists and analysts can use EMR notebooks connected to an EMR cluster to read data directly from ADLS with a minimum set of configurations. Finally, we used Secrets Manager to secure the storage of the SAS token and integrated it within the EMR notebook.

We encourage you to review the CloudFormation stack YAML template and test the setup on your own. If you implement the example and run into any issues or just have feedback, please leave a comment.


Appendix

AWS CLI-based deployment model

If you prefer to use command line options, this section provides AWS CLI commands to deploy this solution. Note that this is an alternative deployment model different from the CloudFormation template provided in the previous sections. Sample scripts and commands provided here include placeholders for values that need to be updated to suit your environment. The AWS CLI commands provided in this section should be used as guidance to understand the deployment model. Update the commands as needed to follow all the security procedures required by your organization.

Prerequisites for an AWS CLI-based deployment

The following are the assumptions made while using this AWS CLI-based deployment:

  • You will be deploying this solution in an existing AWS environment that has all the necessary security configurations enabled
  • You already have an Azure environment where you have staged the data that needs to be accessed through AWS services

You must also complete additional requirements on the AWS and Azure sides.

For AWS, complete the following prerequisites:

  1. Install the AWS CLI on your local computer or server. For instructions, see Installing, updating, and uninstalling the AWS CLI.
  2. Create an Amazon Elastic Compute Cloud (Amazon EC2) key pair for SSH access to your Amazon EMR nodes. For instructions, see Create a key pair using Amazon EC2.
  3. Create an S3 bucket to store the EMR configuration files, bootstrap shell script, and custom JAR file. Make sure that you create a bucket in the same Region as where you plan to launch your EMR cluster.
  4. Copy and save the SAS token from ADLS to use in Amazon EMR.

For Azure, complete the following prerequisites:

  1. Generate the user delegation SAS token on the ADLS container where your files are present, with the required levels of access granted. In this post, we are use SAS tokens with only read and list access.
  2. Copy and save the generated SAS token to use with Amazon EMR.

Update configurations

We have created a custom class that implements the SASTokenProvider interface and created a JAR file called azsastknprovider-1.0-SNAPSHOT.jar, which is provided as a public artifact for this post. A set of configurations are required on the Amazon EMR side to use the SAS tokens to access ADLS. A sample configuration file in JSON format called EMR-HadoopSpark-ADLS-SASConfig.json is also provided as a public artifact for this post. Download the JAR and sample config files.

While copying the code or commands from this post, make sure to remove any control characters or extra newlines that may get added.

  1. Create a shell script called env-staging-hadoopspark.sh to copy the custom JAR file azsastknprovider-1.0-SNAPSHOT.jar (provided in this post) to the EMR cluster nodes’ local storage during the bootstrap phase. The following code is a sample bootstrap shell script:
    #!/bin/bash
    # Stage the SASTokenProvider interface implementation jar on the local filesystem
    sudo mkdir /lib/customjars
    sudo aws s3 cp s3://<s3 bucket>/<path>/azsastknprovider-1.0-SNAPSHOT.jar /lib/customjars
    sudo chmod 755 /lib/customjars

  2. Update the bootstrap shell script to include your S3 bucket and the proper path where the custom JAR file is uploaded in your AWS environment.
  3. Upload the JAR file, config file, and the bootstrap shell script to your S3 bucket.
  4. Keep a copy of the updated configuration file EMR-HadoopSpark-ADLS-SASConfig.json locally in the same directory from where you plan to run the AWS CLI commands.

Launch the EMR cluster using the AWS CLI

We use the create-cluster command in the AWS CLI to deploy an EMR cluster. We need a bootstrap action at cluster creation to copy the custom JAR file to the EMR cluster nodes’ local storage. We also need to add a few custom configurations on Amazon EMR to connect to ADLS. For this, we need to supply a configuration file in JSON format. The following code launches and configures an EMR cluster that can connect to your Azure account and read objects in ADLS through Hadoop and Spark:

aws emr create-cluster \
--name "Spark Cluster with ADLS Access" \
--release-label emr-6.10.0 \
--applications Name=Hadoop Name=Spark \
--ec2-attributes KeyName=<key pair name> \
--instance-type m5.xlarge \
--instance-count 3 \
--use-default-roles \
--enable-debugging \
--log-uri s3://<s3 bucket>/<logs path>/ \
--configurations file://EMR-HadoopSpark-ADLS-SASConfig.json \
--bootstrap-actions Path="s3://<s3 bucket>/<path>/env-staging-hadoopspark.sh"

Additional configurations for Spark jobs

The following additional properties should be set inside your Spark application code to access data in ADLS through Amazon EMR. These should be set on the Spark session object used within your Spark application code.

spark.conf.set("fs.azure.account.auth.type.<azure storage account>.dfs.core.windows.net", "SAS")
spark.conf.set("fs.azure.sas.token.provider.type.<azure storage account>.dfs.core.windows.net", "org.apache.hadoop.fs.azurebfs.sas.FixedSASTokenProvider")
spark.conf.set("fs.azure.sas.fixed.token.<azure storage account>.dfs.core.windows.net", "<Your SAS token from ADLS - remove the first character if it is &>")

These additional configurations can be set in the core-site.xml file for the EMR cluster. However, setting these in the application code is more secure and recommended because it won’t expose the SAS token in the Amazon EMR configurations.

Submit the Spark application in Amazon EMR using the AWS CLI

You can run a Spark application on Amazon EMR in different ways:

  • Log in to an EMR cluster node through SSH using the EC2 key pair you created earlier and then run the application using spark-submit
  • Submit a step via the console while creating the cluster or after the cluster is running
  • Use the AWS CLI to submit a step to a running cluster:
aws emr add-steps \
--cluster-id <cluster-id> \
--steps 'Type=Spark,Name=Read-ADLS-Data,ActionOnFailure=CONTINUE,Args=[s3://<s3 bucket>/<path>/<spark-application>,—deploy-mode,cluster]'

To read files in ADLS within a Spark application that is running on an EMR cluster, you need to use the abfs driver and refer to the file in the following format, just as you would have done in your Azure environment:

abfs://<azure container name>@<azure storage account>.dfs.core.windows.net/<path>/<file-name>

The following sample PySpark script reads a CSV file in ADLS using SAS tokens and writes it to Amazon S3, and can be run from the EMR cluster you created:

from pyspark import SparkContext
from pyspark.sql import SQLContext, SparkSession
spark = SparkSession.builder.appName('Read data from ADLS').getOrCreate()
spark.conf.set("fs.azure.account.auth.type.<azure storage account>.dfs.core.windows.net", "SAS")
spark.conf.set("fs.azure.sas.token.provider.type.<azure storage account>.dfs.core.windows.net", "org.apache.hadoop.fs.azurebfs.sas.FixedSASTokenProvider")
spark.conf.set("fs.azure.sas.fixed.token.<azure storage account>.dfs.core.windows.net", "<Your SAS token from ADLS>")
adlsDF = spark.read.csv("abfs://<azure container name>@<azure storage account>.dfs.core.windows.net/<path>/<file.csv>")
adlsDF.write.csv("s3://<s3 bucket>/<path>/")

Clean up using the AWS CLI

Delete the EMR cluster created using the delete-cluster command.


About the authors

Kiran Anand is a Principal Solutions Architect with the AWS Data Lab. He is a seasoned professional with more than 20 years of experience in information technology. His areas of expertise are databases and big data solutions for data engineering and analytics. He enjoys music, watching movies, and traveling with his family.

Andre Hass is a Sr. Solutions Architect with the AWS Data Lab. He has more than 20 years of experience in the databases and data analytics field. Andre enjoys camping, hiking, and exploring new places with his family on the weekends, or whenever he gets a chance. He also loves technology and electronic gadgets.

Stefan Marinov is a Sr. Solutions Architecture Manager with the AWS Data Lab. He is passionate about big data solutions and distributed computing. Outside of work, he loves spending active time outdoors with his family.

Hari Thatavarthy is a Senior Solutions Architect on the AWS Data Lab team. He helps customers design and build solutions in the data and analytics space. He believes in data democratization and loves to solve complex data processing-related problems.

Hao Wang is a Senior Big Data Architect at AWS. Hao actively works with customers building large scale data platforms on AWS. He has a background as a software architect on implementing distributed software systems. In his spare time, he enjoys reading and outdoor activities with his family.
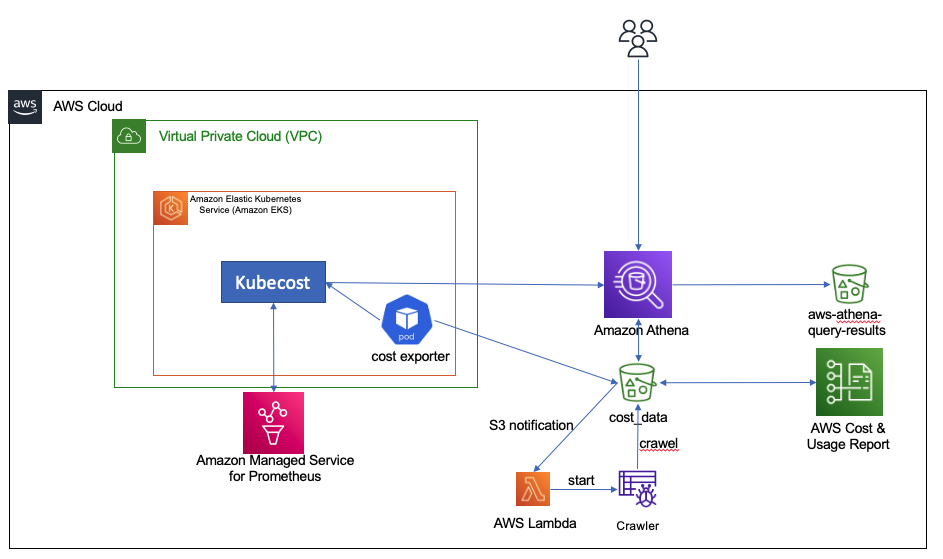
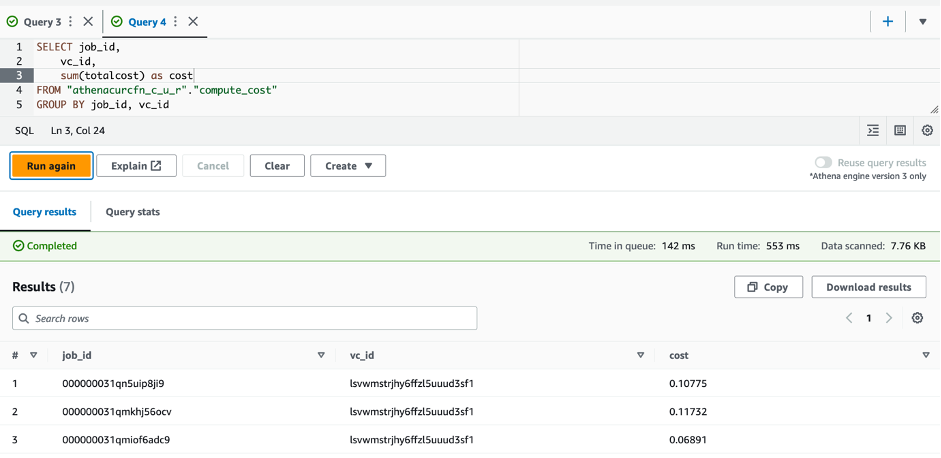
Cost monitoring for Amazon EMR on Amazon EKS

Post Syndicated from Lotfi Mouhib original https://aws.amazon.com/blogs/big-data/cost-monitoring-for-amazon-emr-on-amazon-eks/

Amazon EMR is the industry-leading cloud big data solution, providing a collection of open-source frameworks such as Spark, Hive, Hudi, and Presto, fully managed and with per-second billing. Amazon EMR on Amazon EKS is a deployment option allowing you to deploy Amazon EMR on the same Amazon Elastic Kubernetes Service (Amazon EKS) clusters that is multi-tenant and used by other applications, improving resource utilization, reducing cost, and simplifying infrastructure management. EMR on EKS provide you up to 5.37 times better performance than OSS Spark v3.3.1 with 76.8% cost savings. It also provides a wide variety of job submission methods, like an AWS API called StartJobRun, or through a declarative way with a Kubernetes controller through the AWS Controllers for Kubernetes for Amazon EMR on EKS.

This consolidation comes with a trade-off of increased difficulty measuring fine-grained costs for showback or chargeback by team or application. According to a CNCF and FinOps Foundation survey, 68% of Kubernetes users either rely on monthly estimates or don’t monitor Kubernetes costs at all. And for respondents reporting active Kubernetes cost monitoring, AWS Cost Explorer and Kubecost were ranked as the most popular tools being used.

Currently, you can distribute costs per tenant using a hard multi-tenancy with separate EKS clusters in dedicated AWS accounts or a soft multi-tenancy using separate node groups in a shared EKS cluster. To reduce costs and improve resource utilization, you can use namespace-based segregation, where nodes are shared across different namespaces. However, calculating and attributing costs to teams by workload or namespaces while taking into account compute optimization (like Saving Plans or Spot Instance cost) and the cost of AWS services like EMR on EKS is a challenging and non-trivial task.

In this post, we present a cost chargeback solution for EMR on EKS that combines the AWS-native capabilities of AWS Cost and Usage Reports (AWS CUR) alongside the in-depth Kubernetes cost visibility and insights using Kubecost on Amazon EKS.

Solution overview

A job in EMR on EKS incur costs mainly on two dimensions: compute resources and a marginal uplift charge for EMR on EKS usage. To track the cost associated with each of the dimensions, we use data from three sources:

  • AWS CUR – We use this to get the EMR on EKS cost uplift per job and for Kubecost to reconcile the compute cost with any saving plans or reserved instance used. The supporting infrastructure for CUR is deployed as defined in Setting up Athena using AWS CloudFormation templates.
  • Kubecost – We use this to get the compute cost incurred by the executor and driver pods.

The cost allocation process includes the following components:

  • The compute cost is provided by Kubecost. However, in order to do an in-depth analysis, we define an hourly Kubernetes CronJob on it that starts a pod to retrieve data from Kubecost and stores it in Amazon Simple Storage Service (Amazon S3).
  • CUR files are stored in an S3 bucket.
  • We use Amazon Athena to create a view and provide a consolidated view of the total cost to run an EMR on EKS job.
  • Finally, you can connect your preferred business intelligence tools using the JDBC or ODBC connections to Athena. In this post, we use Amazon QuickSight native integration for visualization purposes.

The following diagram shows the overall architecture as well as how the different components interact with each other.

emr-eks-cost-tracking-architecture

We provide a shell script to deploy our the tracking solution. The shell script configures the infrastructure using an AWS CloudFormation template, the AWS Command Line Interface (AWS CLI), and eksctl and kubectl commands. This script runs the following actions:

  1. Start the CloudFormation deployment.
  2. Create and configure an AWS Cost and Usage Report.
  3. Configure and deploy Kubecost backed by Amazon Managed Service for Prometheus.
  4. Deploy a Kubernetes CronJob.

Prerequisites

You need the following prerequisites:

This post assumes you already have an EKS cluster and run EMR on EKS jobs. If you don’t have an EKS cluster ready to test the solution, we suggest starting with a standard EMR on EKS blueprint that configures a cluster to submit EMR on EKS jobs.

Set up the solution

To run the shell script, complete the following steps:

  1. Clone the following GitHub repository.
  2. Go to the folder cost-tracking with the following command:

cd cost-tracking

  1. Run the script with following command :

sh deploy-emr-eks-cost-tracking.sh REGION KUBECOST-VERSION EKS-CLUSTER-NAME ACCOUNT-ID

After you run the script, you’re ready to use Kubecost and the CUR data to understand the cost associated with your EMR on EKS jobs.

Tracking cost

In this section, we show you how to analyze the compute cost that is retrieved from Kubecost, how to query EMR on EKS uplift data, and how to combine them to have a single consolidated view for the cost.

Compute cost

Kubecost offers various ways to track cost per Kubernetes object. For example, you can track cost by pod, controller, job, label, or deployment. It also allows you to understand the cost of idle resources, like Amazon Elastic Compute Cloud (Amazon EC2) instances that aren’t fully utilized by pods. In this post, we assume that no nodes are provisioned if no EMR on EKS job is running, and we use the Karpenter Cluster Autoscaler to provision nodes when jobs are submitted. Karpenter also does bin packing, which optimizes the EC2 resource utilization and in turn reduces the cost of idle resources.

To track compute cost associated with EMR on EKS pods, we query the Kubecost allocation API by passing pod and labels in the aggregate parameter. We use the emr-containers.amazonaws.com/job.id and emr-containers.amazonaws.com/virtual-cluster-id labels that are always present in executor and driver pods. The labels are used to filter Kubecost data to get only the cost associated with EMR on EKS pods. You can review various levels of granularity at the pod, job, and virtual cluster level to understand the cost of a driver vs. executor, or of using Spot Instances in jobs. You can also use the virtual cluster cost to understand the overall cost of a EMR on EMR when it’s used in a namespace that is used by applications other than EMR on EKS.

We also provide the instance_id, instance size, and capacity type (On-Demand or Spot) that was used to run the pod. This is retrieved through querying the Kubecost assets API. This data can be useful to understand how you run your jobs and which capacity you use more often.

The data about the cost of running the pods as well as the assets is retrieved with a Kubernetes CronJob that submits the request to the Kubecost API, joins the two data sources (allocation and assets data) on the instance_id, cleans the data, and stores it in Amazon S3 in CSV format.

The compute cost data has multiple fields that are of interest, including cpucost, ramcost (cost of memory), pvcost (cost of Amazon EBS storage), efficiency of use of CPU and RAM, as well as total cost, which represents the aggregate cost of all the resources used, either at pod, job, or virtual cluster level.

To view this data, complete the following steps:

  1. On the Athena console, navigate to the query editor.
  2. Choose athenacurcfn_c_u_r for the database and cost_data for the table.
  3. Run the following query:
SELECT job_id,
vc_id,
sum(totalcost) as cost
FROM "athenacurcfn_c_u_r"."compute_cost"
GROUP BY job_id, vc_id

The following screenshot shows the query results.

To query the data about information at the pod level, you can run the following SQL statement:

SELECT
split_part(name, '/', 1) as pod_name,
job_id,
vc_id,
totalcost,
instance_id,
"properties.labels.node_kubernetes_io_instance_type",
capacity_type
FROM "athenacurcfn_c_u_r"."compute_cost";

EMR on EKS uplift

The cost associated with EMR on EKS uplift is available through AWS CUT and is stored in an S3 bucket. The script you ran in the setup step created an Athena table associated to the data in the S3 bucket. The following steps take you through how you can query the data:

  1. On the Athena console, navigate to the query editor.
  2. Choose athenacurcfn_c_u_r for the database and cur_data for the table.
  3. Run the following query:
SELECT
split_part(line_item_resource_id, '/', 5) as job_id,
split_part(line_item_resource_id, '/', 3) as vc_id,
sum(line_item_blended_cost) as cost
FROM athenacurcfn_c_u_r.automated
WHERE product_product_family='EMR Containers'
GROUP BY line_item_resource_id

This query provides you with the cost per job. The following screenshot shows the results.

You will have to wait up to 24 hours for the CUR data to be available. As such, you should only run the preceding query after the CUR data is available and you have run the EMR on EKS jobs.

Overall cost

To view the overall cost and perform analysis on it, create a view in Athena as follows:

CREATE VIEW emr_eks_cost AS
SELECT
split_part(line_item_resource_id, '/', 5) as job_id,
split_part(line_item_resource_id, '/', 3) as vc_id,
sum(line_item_blended_cost) as cost,
'emr-uplift' as category
FROM athenacurcfn_c_u_r.cur_data
WHERE product_product_family='EMR Containers'
GROUP BY line_item_resource_id
UNION
SELECT
job_id,
vc_id,
sum(totalCost) as cost,
'compute' as category
FROM "athenacurcfn_c_u_r"."compute_cost"
group by job_id, vc_id

Now that the view is created, you can query and analyze the cost of running your EMR on EKS jobs:

SELECT sum(cost) as total_cost, job_id, vc_id
FROM "athenacurcfn_c_u_r"."emr_eks_cost"
GROUP BY job_id, vc_id;

The following screenshot shows an example output of the query on the created view.

Lastly, you can use QuickSight for a graphical high-level view on your EMR on EKS spend. The following screenshot shows an example dashboard.

emr-eks-compute-cost-quicksight-dashboard

You can now adapt this solution to your specific needs and build your custom analysis.

Clean up

Throughout this post, you deployed and configured the required infrastructure components to track cost for your EMR on EKS workloads. To avoid incurring additional charges for this solution, delete all the resources you created:

  1. Empty the S3 buckets cost-data-REGION-ACCOUNT_ID and aws-athena-query-results-cur-REGION-ACCOUNT_ID.
  2. Delete the Athena workgroup kubecost-cur-workgroup.
  3. Empty and delete the ECR repository emreks-compute-cost-exporter.
  4. Run the script destroy-emr-eks-cost-tracking.sh, which will delete the AWS CloudFormation deployment, uninstall Kubecost, delete the CronJob, and delete the Cost and Usage Reports.

Conclusion

In this post, we showed how you can use Kubecost capabilities alongside Cost and Usage Reports to closely monitor the costs for Amazon EMR on EKS per virtual cluster or per job. This solution allows you to achieve more granular costs for chargebacks using Athena, Amazon Managed Service for Prometheus, and QuickSight.

The solution presented steps to set up Cost and Usage Reports and Kubecost, and configure a CronJob on an hourly basis to get the cost of running pods spun by EMR on EKS. You can modify the presented solution to run at longer intervals or to collect data on different EKS clusters. You can also modify the Python script run by the CronJob to further clean data or reduce the amount of data stored by eliminating fields you don’t need. You can use the insights provided to drive cost optimization efforts over time, detect any increase of costs, and measure the impact of new deployments or particular events on resource usage and cost performance. For more information about integrating EMR on EKS in your existing Amazon EKS deployment, refer to Design considerations for Amazon EMR on EKS in a multi-tenant Amazon EKS environment


About the Authors

Lotfi Mouhib is a Senior Solutions Architect working for the Public Sector team with Amazon Web Services. He helps public sector customers across EMEA realize their ideas, build new services, and innovate for citizens. In his spare time, Lotfi enjoys cycling and running.

Hamza Mimi Principal Solutions Architect in the French Public sector team at Amazon Web Services (AWS). With a long experience in the telecommunications industry. He is currently working as a customer advisor on topics ranging from digital transformation to architectural guidance.

Introducing Amazon EMR on EKS job submission with Spark Operator and spark-submit

Post Syndicated from Lotfi Mouhib original https://aws.amazon.com/blogs/big-data/introducing-amazon-emr-on-eks-job-submission-with-spark-operator-and-spark-submit/

Amazon EMR on EKS provides a deployment option for Amazon EMR that allows organizations to run open-source big data frameworks on Amazon Elastic Kubernetes Service (Amazon EKS). With EMR on EKS, Spark applications run on the Amazon EMR runtime for Apache Spark. This performance-optimized runtime offered by Amazon EMR makes your Spark jobs run fast and cost-effectively. The EMR runtime provides up to 5.37 times better performance and 76.8% cost savings, when compared to using open-source Apache Spark on Amazon EKS.

Building on the success of Amazon EMR on EKS, customers have been running and managing jobs using the emr-containers API, creating EMR virtual clusters, and submitting jobs to the EKS cluster, either through the AWS Command Line Interface (AWS CLI) or Apache Airflow scheduler. However, other customers running Spark applications have chosen Spark Operator or native spark-submit to define and run Apache Spark jobs on Amazon EKS, but without taking advantage of the performance gains from running Spark on the optimized EMR runtime. In response to this need, starting from EMR 6.10, we have introduced a new feature that lets you use the optimized EMR runtime while submitting and managing Spark jobs through either Spark Operator or spark-submit. This means that anyone running Spark workloads on EKS can take advantage of EMR’s optimized runtime.

In this post, we walk through the process of setting up and running Spark jobs using both Spark Operator and spark-submit, integrated with the EMR runtime feature. We provide step-by-step instructions to assist you in setting up the infrastructure and submitting a job with both methods. Additionally, you can use the Data on EKS blueprint to deploy the entire infrastructure using Terraform templates.

Infrastructure overview

In this post, we walk through the process of deploying a comprehensive solution using eksctl, Helm, and AWS CLI. Our deployment includes the following resources:

  • A VPC, EKS cluster, and managed node group, set up with the eksctl tool
  • Essential Amazon EKS managed add-ons, such as the VPC CNI, CoreDNS, and KubeProxy set up with the eksctl tool
  • Cluster Autoscaler and Spark Operator add-ons, set up using Helm
  • A Spark job execution AWS Identity and Access Management (IAM) role, IAM policy for Amazon Simple Storage Service (Amazon S3) bucket access, service account, and role-based access control, set up using the AWS CLI and eksctl

Prerequisites

Verify that the following prerequisites are installed on your machine:

Set up AWS credentials

Before proceeding to the next step and running the eksctl command, you need to set up your local AWS credentials profile. For instructions, refer to Configuration and credential file settings.

Deploy the VPC, EKS cluster, and managed add-ons

The following configuration uses us-west-1 as the default Region. To run in a different Region, update the region and availabilityZones fields accordingly. Also, verify that the same Region is used in the subsequent steps throughout the post.

Enter the following code snippet into the terminal where your AWS credentials are set up. Make sure to update the publicAccessCIDRs field with your IP before you run the command below. This will create a file named eks-cluster.yaml:

cat <<EOF >eks-cluster.yaml
---
apiVersion: eksctl.io/v1alpha5
kind: ClusterConfig
metadata:
  name: emr-spark-operator
  region: us-west-1 # replace with your region
  version: "1.25"
vpc:
  clusterEndpoints:
    publicAccess: true
    privateAccess: true
  publicAccessCIDRs: ["YOUR-IP/32"]
availabilityZones: ["us-west-1a","us-west-1b"] # replace with your region
iam:
  withOIDC: true
  serviceAccounts:
  - metadata:
      name: cluster-autoscaler
      namespace: kube-system
    wellKnownPolicies:
      autoScaler: true
    roleName: eksctl-cluster-autoscaler-role
managedNodeGroups:
  - name: m5x
    instanceType: m5.xlarge
    availabilityZones: ["us-west-1a"]
    volumeSize: 100
    volumeType: gp3
    minSize: 2
    desiredCapacity: 2
    maxSize: 10
    tags:
      k8s.io/cluster-autoscaler/enabled: "true"
      k8s.io/cluster-autoscaler/eks-nvme: "owned" 
addons:
  - name: vpc-cni
    version: latest
  - name: coredns
    version: latest
  - name: kube-proxy
    version: latest
cloudWatch:
  clusterLogging:
    enableTypes: ["*"]
EOF

Use the following command to create the EKS cluster : eksctl create cluster -f eks-cluster.yaml

Deploy Cluster Autoscaler

Cluster Autoscaler is crucial for automatically adjusting the size of your Kubernetes cluster based on the current resource demands, optimizing resource utilization and cost. Create an autoscaler-helm-values.yaml file and install the Cluster Autoscaler using Helm:

cat <<EOF >autoscaler-helm-values.yaml
---
autoDiscovery:
    clusterName: emr-spark-operator
    tags:
      - k8s.io/cluster-autoscaler/enabled
      - k8s.io/cluster-autoscaler/{{ .Values.autoDiscovery.clusterName }}
awsRegion: us-west-1 # Make sure the region same as the EKS Cluster
rbac:
  serviceAccount:
    create: false
    name: cluster-autoscaler
EOF
helm repo add autoscaler https://kubernetes.github.io/autoscaler
helm install nodescaler autoscaler/cluster-autoscaler \
--namespace kube-system \
--values autoscaler-helm-values.yaml --debug

You can also set up Karpenter as a cluster autoscaler to automatically launch the right compute resources to handle your EKS cluster’s applications. You can follow this blog on how to setup and configure Karpenter.

Deploy Spark Operator

Spark Operator is an open-source Kubernetes operator specifically designed to manage and monitor Spark applications running on Kubernetes. It streamlines the process of deploying and managing Spark jobs, by providing a Kubernetes custom resource to define, configure and run Spark applications, as well as manage the job life cycle through Kubernetes API. Some customers prefer using Spark Operator to manage Spark jobs because it enables them to manage Spark applications just like other Kubernetes resources.

Currently, customers are building their open-source Spark images and using S3a committers as part of job submissions with Spark Operator or spark-submit. However, with the new job submission option, you can now benefit from the EMR runtime in conjunction with EMRFS. Starting with Amazon EMR 6.10 and for each upcoming version of the EMR runtime, we will release the Spark Operator and its Helm chart to use the EMR runtime.

In this section, we show you how to deploy a Spark Operator Helm chart from an Amazon Elastic Container Registry (Amazon ECR) repository and submit jobs using EMR runtime images, benefiting from the performance enhancements provided by the EMR runtime.

Install Spark Operator with Helm from Amazon ECR

The Spark Operator Helm chart is stored in an ECR repository. To install the Spark Operator, you first need to authenticate your Helm client with the ECR repository. The charts are stored under the following path: ECR_URI/spark-operator.

Authenticate your Helm client and install the Spark Operator:

aws ecr get-login-password \
--region us-west-1 | helm registry login \
--username AWS \
--password-stdin 608033475327.dkr.ecr.us-west-1.amazonaws.com

You can authenticate to other EMR on EKS supported Regions by obtaining the AWS account ID for the corresponding Region. For more information, refer to how to select a base image URI.

Install Spark Operator

You can now install Spark Operator using the following command:

helm install spark-operator-demo \
oci://608033475327.dkr.ecr.us-west-1.amazonaws.com/spark-operator \
--set emrContainers.awsRegion=us-west-1 \
--version 1.1.26-amzn-0 \
--set serviceAccounts.spark.create=false \
--namespace spark-operator \
--create-namespace

To verify that the operator has been installed correctly, run the following command:

helm list --namespace spark-operator -o yaml

Set up the Spark job execution role and service account

In this step, we create a Spark job execution IAM role and a service account, which will be used in Spark Operator and spark-submit job submission examples.

First, we create an IAM policy that will be used by the IAM Roles for Service Accounts (IRSA). This policy enables the driver and executor pods to access the AWS services specified in the policy. Complete the following steps:

  1. As a prerequisite, either create an S3 bucket (aws s3api create-bucket --bucket <ENTER-S3-BUCKET> --create-bucket-configuration LocationConstraint=us-west-1 --region us-west-1) or use an existing S3 bucket. Replace <ENTER-S3-BUCKET> in the following code with the bucket name.
  2. Create a policy file that allows read and write access to an S3 bucket:
    cat >job-execution-policy.json <<EOL
    {
        "Version": "2012-10-17",
        "Statement": [
            {
                "Effect": "Allow",
                "Action": [
                    "s3:GetObject",
                    "s3:ListBucket",
                    "s3:PutObject",
                    "s3:DeleteObject",
                    "s3:AbortMultipartUpload",
                    "s3:ListMultipartUploadParts"
                ],
                "Resource": [
                    "arn:aws:s3:::<ENTER-S3-BUCKET>",
                    "arn:aws:s3:::<ENTER-S3-BUCKET>/*",
                    "arn:aws:s3:::aws-data-lake-workshop/*",
                    "arn:aws:s3:::nyc-tlc",
                    "arn:aws:s3:::nyc-tlc/*"
                ]
            }
        ]
    }
    EOL

  3. Create the IAM policy with the following command:
    aws iam create-policy --policy-name emr-job-execution-policy --policy-document file://job-execution-policy.json

  4. Next, create the service account named emr-job-execution-sa-role as well as the IAM roles. The following eksctl command creates a service account scoped to the namespace and service account defined to be used by the executor and driver. Make sure to replace <ENTER_YOUR_ACCOUNT_ID> with your account ID before running the command:
    eksctl create iamserviceaccount \
    --cluster=emr-spark-operator \
    --region us-west-1 \
    --name=emr-job-execution-sa \
    --attach-policy-arn=arn:aws:iam::<ENTER_YOUR_ACCOUNT_ID>:policy/emr-job-execution-policy \
    --role-name=emr-job-execution-irsa \
    --namespace=data-team-a \
    --approve

  5. Create an S3 bucket policy to allow only the execution role create in step 4 to write and read from the S3 bucket create in step 1. Make sure to replace <ENTER_YOUR_ACCOUNT_ID> with your account ID before running the command:
    cat > bucketpolicy.json<<EOL
    {
        "Version": "2012-10-17",
        "Statement": [
            {
                "Effect": "Allow",
                "Action": [
                    "s3:GetObject",
                    "s3:ListBucket",
                    "s3:PutObject",
                    "s3:DeleteObject",
                    "s3:AbortMultipartUpload",
                    "s3:ListMultipartUploadParts"
                ], "Principal": {
                    "AWS": "arn:aws:iam::<ENTER_YOUR_ACCOUNT_ID>:role/emr-job-execution-irsa"
                },
                "Resource": [
                    "arn:aws:s3:::<ENTER-S3-BUCKET>",
                    "arn:aws:s3:::<ENTER-S3-BUCKET>/*"
                ]
            }
        ]
    }
    EOL
    
    aws s3api put-bucket-policy --bucket ENTER-S3-BUCKET-NAME --policy file://bucketpolicy.json

  6. Create a Kubernetes role and role binding required for the service account used in the Spark job run:
    cat <<EOF >emr-job-execution-rbac.yaml
    ---
    apiVersion: rbac.authorization.k8s.io/v1
    kind: Role
    metadata:
      name: emr-job-execution-sa-role
      namespace: data-team-a
    rules:
      - apiGroups: ["", "batch","extensions"]
        resources: ["configmaps","serviceaccounts","events","pods","pods/exec","pods/log","pods/portforward","secrets","services","persistentvolumeclaims"]
        verbs: ["create","delete","get","list","patch","update","watch"]
    ---
    apiVersion: rbac.authorization.k8s.io/v1
    kind: RoleBinding
    metadata:
      name: emr-job-execution-sa-rb
      namespace: data-team-a
    roleRef:
      apiGroup: rbac.authorization.k8s.io
      kind: Role
      name: emr-job-execution-sa-role
    subjects:
      - kind: ServiceAccount
        name: emr-job-execution-sa
        namespace: data-team-a
    EOF

  7. Apply the Kubernetes role and role binding definition with the following command:
kubectl apply -f emr-job-execution-rbac.yaml

So far, we have completed the infrastructure setup, including the Spark job execution roles. In the following steps, we run sample Spark jobs using both Spark Operator and spark-submit with the EMR runtime.

Configure the Spark Operator job with the EMR runtime

In this section, we present a sample Spark job that reads data from public datasets stored in S3 buckets, processes them, and writes the results to your own S3 bucket. Make sure that you update the S3 bucket in the following configuration by replacing <ENTER_S3_BUCKET> with the URI to your own S3 bucket refered in step 2 of the “Set up the Spark job execution role and service account section. Also, note that we are using data-team-a as a namespace and emr-job-execution-sa as a service account, which we created in the previous step. These are necessary to run the Spark job pods in the dedicated namespace, and the IAM role linked to the service account is used to access the S3 bucket for reading and writing data.

Most importantly, notice the image field with the EMR optimized runtime Docker image, which is currently set to emr-6.10.0. You can change this to a newer version when it’s released by the Amazon EMR team. Also, when configuring your jobs, make sure that you include the sparkConf and hadoopConf settings as defined in the following manifest. These configurations enable you to benefit from EMR runtime performance, AWS Glue Data Catalog integration, and the EMRFS optimized connector.

  1. Create the file (emr-spark-operator-example.yaml) locally and update the S3 bucket location so that you can submit the job as part of the next step:
    cat <<EOF >emr-spark-operator-example.yaml
    ---
    apiVersion: "sparkoperator.k8s.io/v1beta2"
    kind: SparkApplication
    metadata:
      name: taxi-example
      namespace: data-team-a
    spec:
      type: Scala
      mode: cluster
      # EMR optimized runtime image
      image: "483788554619.dkr.ecr.eu-west-1.amazonaws.com/spark/emr-6.10.0:latest"
      imagePullPolicy: Always
      mainClass: ValueZones
      mainApplicationFile: s3://aws-data-lake-workshop/spark-eks/spark-eks-assembly-3.3.0.jar
      arguments:
        - s3://nyc-tlc/csv_backup
        - "2017"
        - s3://nyc-tlc/misc/taxi _zone_lookup.csv
        - s3://<ENTER_S3_BUCKET>/emr-eks-results
        - emr_eks_demo
      hadoopConf:
        # EMRFS filesystem config
        fs.s3.customAWSCredentialsProvider: com.amazonaws.auth.WebIdentityTokenCredentialsProvider
        fs.s3.impl: com.amazon.ws.emr.hadoop.fs.EmrFileSystem
        fs.AbstractFileSystem.s3.impl: org.apache.hadoop.fs.s3.EMRFSDelegate
        fs.s3.buffer.dir: /mnt/s3
        fs.s3.getObject.initialSocketTimeoutMilliseconds: "2000"
        mapreduce.fileoutputcommitter.algorithm.version.emr_internal_use_only.EmrFileSystem: "2"
        mapreduce.fileoutputcommitter.cleanup-failures.ignored.emr_internal_use_only.EmrFileSystem: "true"
      sparkConf:
        spark.eventLog.enabled: "true"
        spark.eventLog.dir: "s3://<ENTER_S3_BUCKET>/"
        spark.kubernetes.driver.pod.name: driver-nyc-taxi-etl
        # Required for EMR Runtime and Glue Catalogue
        spark.driver.extraClassPath: /usr/lib/hadoop-lzo/lib/*:/usr/lib/hadoop/hadoop-aws.jar:/usr/share/aws/aws-java-sdk/*:/usr/share/aws/emr/emrfs/conf:/usr/share/aws/emr/emrfs/lib/*:/usr/share/aws/emr/emrfs/auxlib/*:/usr/share/aws/emr/security/conf:/usr/share/aws/emr/security/lib/*:/usr/share/aws/hmclient/lib/aws-glue-datacatalog-spark-client.jar:/usr/share/java/Hive-JSON-Serde/hive-openx-serde.jar:/usr/share/aws/sagemaker-spark-sdk/lib/sagemaker-spark-sdk.jar:/home/hadoop/extrajars/*
        spark.driver.extraLibraryPath: /usr/lib/hadoop/lib/native:/usr/lib/hadoop-lzo/lib/native:/docker/usr/lib/hadoop/lib/native:/docker/usr/lib/hadoop-lzo/lib/native
        spark.executor.extraClassPath: /usr/lib/hadoop-lzo/lib/*:/usr/lib/hadoop/hadoop-aws.jar:/usr/share/aws/aws-java-sdk/*:/usr/share/aws/emr/emrfs/conf:/usr/share/aws/emr/emrfs/lib/*:/usr/share/aws/emr/emrfs/auxlib/*:/usr/share/aws/emr/security/conf:/usr/share/aws/emr/security/lib/*:/usr/share/aws/hmclient/lib/aws-glue-datacatalog-spark-client.jar:/usr/share/java/Hive-JSON-Serde/hive-openx-serde.jar:/usr/share/aws/sagemaker-spark-sdk/lib/sagemaker-spark-sdk.jar:/home/hadoop/extrajars/*
        spark.executor.extraLibraryPath: /usr/lib/hadoop/lib/native:/usr/lib/hadoop-lzo/lib/native:/docker/usr/lib/hadoop/lib/native:/docker/usr/lib/hadoop-lzo/lib/native
        # EMRFS commiter
        spark.sql.parquet.output.committer.class: com.amazon.emr.committer.EmrOptimizedSparkSqlParquetOutputCommitter
        spark.sql.parquet.fs.optimized.committer.optimization-enabled: "true"
        spark.sql.emr.internal.extensions: com.amazonaws.emr.spark.EmrSparkSessionExtensions
        spark.executor.defaultJavaOptions: -verbose:gc -XX:+PrintGCDetails -XX:+PrintGCDateStamps -XX:+UseParallelGC -XX:InitiatingHeapOccupancyPercent=70 -XX:OnOutOfMemoryError='kill -9 %p'
        spark.driver.defaultJavaOptions:  -XX:OnOutOfMemoryError='kill -9 %p' -XX:+UseParallelGC -XX:InitiatingHeapOccupancyPercent=70
      sparkVersion: "3.3.1"
      restartPolicy:
        type: Never
      driver:
        cores: 1
        memory: "4g"
        serviceAccount: emr-job-execution-sa
      executor:
        cores: 1
        instances: 4
        memory: "4g"
        serviceAccount: emr-job-execution-sa
    EOF

  2. Run the following command to submit the job to the EKS cluster:
    kubectl apply -f emr-spark-operator-example.yaml

    The job may take 4–5 minutes to complete, and you can verify the successful message in the driver pod logs.

  3. Verify the job by running the following command:
kubectl get pods -n data-team-a

Enable access to the Spark UI

The Spark UI is an important tool for data engineers because it allows you to track the progress of tasks, view detailed job and stage information, and analyze resource utilization to identify bottlenecks and optimize your code. For Spark jobs running on Kubernetes, the Spark UI is hosted on the driver pod and its access is restricted to the internal network of Kubernetes. To access it, we need to forward the traffic to the pod with kubectl. The following steps take you through how to set it up.

Run the following command to forward traffic to the driver pod:

kubectl port-forward <driver-pod-name> 4040:4040

You should see text similar to the following:

Forwarding from 127.0.0.1:4040 -> 4040
Forwarding from [::1]:4040 → 4040

If you didn’t specify the driver pod name at the submission of the SparkApplication, you can get it with the following command:

kubectl get pods -l spark-role=driver,spark-app-name=<your-spark-app-name> -o jsonpath='{.items[0].metadata.name}'

Open a browser and enter http://localhost:4040 in the address bar. You should be able to connect to the Spark UI.

spark-ui-screenshot

Spark History Server

If you want to explore your job after its run, you can view it through the Spark History Server. The preceding SparkApplication definition has the event log enabled and stores the events in an S3 bucket with the following path: s3://YOUR-S3-BUCKET/. For instructions on setting up the Spark History Server and exploring the logs, refer to Launching the Spark history server and viewing the Spark UI using Docker.

spark-submit

spark-submit is a command line interface for running Apache Spark applications on a cluster or locally. It allows you to submit applications to Spark clusters. The tool enables simple configuration of application properties, resource allocation, and custom libraries, streamlining the deployment and management of Spark jobs.

Beginning with Amazon EMR 6.10, spark-submit is supported as a job submission method. This method currently only supports cluster mode as the submission mechanism. To submit jobs using the spark-submit method, we reuse the IAM role for the service account we set up earlier. We also use the S3 bucket used for the Spark Operator method. The steps in this section take you through how to configure and submit jobs with spark-submit and benefit from EMR runtime improvements.

  1. In order to submit a job, you need to use the Spark version that matches the one available in Amazon EMR. For Amazon EMR 6.10, you need to download the Spark 3.3 version.
  2. You also need to make sure you have Java installed in your environment.
  3. Unzip the file and navigate to the root of the Spark directory.
  4. In the following code, replace the EKS endpoint as well as the S3 bucket then run the script:
./bin/spark-submit \
--class ValueZones \
--master k8s://EKS-ENDPOINT \
--conf spark.kubernetes.namespace=data-team-a \
--conf spark.kubernetes.container.image=608033475327.dkr.ecr.us-west-1.amazonaws.com/spark/emr-6.10.0:latest \
--conf spark.kubernetes.authenticate.driver.serviceAccountName=emr-job-execution-sa \
--conf spark.kubernetes.authenticate.executor.serviceAccountName=emr-job-execution-sa \
--conf spark.driver.extraClassPath="/usr/lib/hadoop-lzo/lib/*:/usr/lib/hadoop/hadoop-aws.jar:/usr/share/aws/aws-java-sdk/*:/usr/share/aws/emr/emrfs/conf:/usr/share/aws/emr/emrfs/lib/*:/usr/share/aws/emr/emrfs/auxlib/*:/usr/share/aws/emr/security/conf:/usr/share/aws/emr/security/lib/*:/usr/share/aws/hmclient/lib/aws-glue-datacatalog-spark-client.jar:/usr/share/java/Hive-JSON-Serde/hive-openx-serde.jar:/usr/share/aws/sagemaker-spark-sdk/lib/sagemaker-spark-sdk.jar:/home/hadoop/extrajars/*" \
--conf spark.driver.extraLibraryPath="/usr/lib/hadoop/lib/native:/usr/lib/hadoop-lzo/lib/native:/docker/usr/lib/hadoop/lib/native:/docker/usr/lib/hadoop-lzo/lib/native" \
--conf spark.executor.extraClassPath="/usr/lib/hadoop-lzo/lib/*:/usr/lib/hadoop/hadoop-aws.jar:/usr/share/aws/aws-java-sdk/*:/usr/share/aws/emr/emrfs/conf:/usr/share/aws/emr/emrfs/lib/*:/usr/share/aws/emr/emrfs/auxlib/*:/usr/share/aws/emr/security/conf:/usr/share/aws/emr/security/lib/*:/usr/share/aws/hmclient/lib/aws-glue-datacatalog-spark-client.jar:/usr/share/java/Hive-JSON-Serde/hive-openx-serde.jar:/usr/share/aws/sagemaker-spark-sdk/lib/sagemaker-spark-sdk.jar:/home/hadoop/extrajars/*" \
--conf spark.executor.extraLibraryPath="/usr/lib/hadoop/lib/native:/usr/lib/hadoop-lzo/lib/native:/docker/usr/lib/hadoop/lib/native:/docker/usr/lib/hadoop-lzo/lib/native" \
--conf spark.hadoop.fs.s3.customAWSCredentialsProvider=com.amazonaws.auth.WebIdentityTokenCredentialsProvider \
--conf spark.hadoop.fs.s3.impl=com.amazon.ws.emr.hadoop.fs.EmrFileSystem \
--conf spark.hadoop.fs.AbstractFileSystem.s3.impl=org.apache.hadoop.fs.s3.EMRFSDelegate \
--conf spark.hadoop.fs.s3.buffer.dir=/mnt/s3 \
--conf spark.hadoop.fs.s3n.impl=com.amazon.ws.emr.hadoop.fs.EmrFileSystem \
--deploy-mode cluster \
s3://aws-data-lake-workshop/spark-eks/spark-eks-assembly-3.3.0.jar s3://nyc-tlc/csv_backup 2017 s3://nyc-tlc/misc/taxi_zone_lookup.csv s3://S3_BUCKET/emr-eks-results emr_eks_demo

The job takes about 7 minutes to complete with two executors of one core and 1 G of memory.

Using custom kubernetes schedulers

Customers running a large volume of jobs concurrently might face challenges related to providing fair access to compute capacity that they aren’t able to solve with the standard scheduling and resource utilization management Kubernetes offers. In addition, customers that are migrating from Amazon EMR on Amazon Elastic Compute Cloud (Amazon EC2) and are managing their scheduling with YARN queues will not be able to transpose them to Kubernetes scheduling capabilities.

To overcome this issue, you can use custom schedulers like Apache Yunikorn or Volcano.Spark Operator natively supports these schedulers, and with them you can schedule Spark applications based on factors such as priority, resource requirements, and fairness policies, while Spark Operator simplifies application deployment and management. To set up Yunikorn with gang scheduling and use it in Spark applications submitted through Spark Operator, refer to Spark Operator with YuniKorn.

Clean up

To avoid unwanted charges to your AWS account, delete all the AWS resources created during this deployment:

eksctl delete cluster -f eks-cluster.yaml

Conclusion

In this post, we introduced the EMR runtime feature for Spark Operator and spark-submit, and explored the advantages of using this feature on an EKS cluster. With the optimized EMR runtime, you can significantly enhance the performance of your Spark applications while optimizing costs. We demonstrated the deployment of the cluster using the eksctl tool, , you can also use the Data on EKS blueprints for deploying a production-ready EKS which you can use for EMR on EKS and leverage these new deployment methods in addition to the EMR on EKS API job submission method. By running your applications on the optimized EMR runtime, you can further enhance your Spark application workflows and drive innovation in your data processing pipelines.


About the Authors

Lotfi Mouhib is a Senior Solutions Architect working for the Public Sector team with Amazon Web Services. He helps public sector customers across EMEA realize their ideas, build new services, and innovate for citizens. In his spare time, Lotfi enjoys cycling and running.

Vara Bonthu is a dedicated technology professional and Worldwide Tech Leader for Data on EKS, specializing in assisting AWS customers ranging from strategic accounts to diverse organizations. He is passionate about open-source technologies, data analytics, AI/ML, and Kubernetes, and boasts an extensive background in development, DevOps, and architecture. Vara’s primary focus is on building highly scalable data and AI/ML solutions on Kubernetes platforms, helping customers harness the full potential of cutting-edge technology for their data-driven pursuits.

Improve operational efficiencies of Apache Iceberg tables built on Amazon S3 data lakes

Post Syndicated from Avijit Goswami original https://aws.amazon.com/blogs/big-data/improve-operational-efficiencies-of-apache-iceberg-tables-built-on-amazon-s3-data-lakes/

Apache Iceberg is an open table format for large datasets in Amazon Simple Storage Service (Amazon S3) and provides fast query performance over large tables, atomic commits, concurrent writes, and SQL-compatible table evolution. When you build your transactional data lake using Apache Iceberg to solve your functional use cases, you need to focus on operational use cases for your S3 data lake to optimize the production environment. Some of the important non-functional use cases for an S3 data lake that organizations are focusing on include storage cost optimizations, capabilities for disaster recovery and business continuity, cross-account and multi-Region access to the data lake, and handling increased Amazon S3 request rates.

In this post, we show you how to improve operational efficiencies of your Apache Iceberg tables built on Amazon S3 data lake and Amazon EMR big data platform.

Optimize data lake storage

One of the major advantages of building modern data lakes on Amazon S3 is it offers lower cost without compromising on performance. You can use Amazon S3 Lifecycle configurations and Amazon S3 object tagging with Apache Iceberg tables to optimize the cost of your overall data lake storage. An Amazon S3 Lifecycle configuration is a set of rules that define actions that Amazon S3 applies to a group of objects. There are two types of actions:

  • Transition actions – These actions define when objects transition to another storage class; for example, Amazon S3 Standard to Amazon S3 Glacier.
  • Expiration actions – These actions define when objects expire. Amazon S3 deletes expired objects on your behalf.

Amazon S3 uses object tagging to categorize storage where each tag is a key-value pair. From an Apache Iceberg perspective, it supports custom Amazon S3 object tags that can be added to S3 objects while writing and deleting into the table. Iceberg also let you configure a tag-based object lifecycle policy at the bucket level to transition objects to different Amazon S3 tiers. With the s3.delete.tags config property in Iceberg, objects are tagged with the configured key-value pairs before deletion. When the catalog property s3.delete-enabled is set to false, the objects are not hard-deleted from Amazon S3. This is expected to be used in combination with Amazon S3 delete tagging, so objects are tagged and removed using an Amazon S3 lifecycle policy. This property is set to true by default.

The example notebook in this post shows an example implementation of S3 object tagging and lifecycle rules for Apache Iceberg tables to optimize storage cost.

Implement business continuity

Amazon S3 gives any developer access to the same highly scalable, reliable, fast, inexpensive data storage infrastructure that Amazon uses to run its own global network of web sites. Amazon S3 is designed for 99.999999999% (11 9’s) of durability, S3 Standard is designed for 99.99% availability, and Standard – IA is designed for 99.9% availability. Still, to make your data lake workloads highly available in an unlikely outage situation, you can replicate your S3 data to another AWS Region as a backup. With S3 data residing in multiple Regions, you can use an S3 multi-Region access point as a solution to access the data from the backup Region. With Amazon S3 multi-Region access point failover controls, you can route all S3 data request traffic through a single global endpoint and directly control the shift of S3 data request traffic between Regions at any time. During a planned or unplanned regional traffic disruption, failover controls let you control failover between buckets in different Regions and accounts within minutes. Apache Iceberg supports access points to perform S3 operations by specifying a mapping of bucket to access points. We include an example implementation of an S3 access point with Apache Iceberg later in this post.

Increase Amazon S3 performance and throughput

Amazon S3 supports a request rate of 3,500 PUT/COPY/POST/DELETE or 5,500 GET/HEAD requests per second per prefix in a bucket. The resources for this request rate aren’t automatically assigned when a prefix is created. Instead, as the request rate for a prefix increases gradually, Amazon S3 automatically scales to handle the increased request rate. For certain workloads that need a sudden increase in the request rate for objects in a prefix, Amazon S3 might return 503 Slow Down errors, also known as S3 throttling. It does this while it scales in the background to handle the increased request rate. Also, if supported request rates are exceeded, it’s a best practice to distribute objects and requests across multiple prefixes. Implementing this solution to distribute objects and requests across multiple prefixes involves changes to your data ingress or data egress applications. Using Apache Iceberg file format for your S3 data lake can significantly reduce the engineering effort through enabling the ObjectStoreLocationProvider feature, which adds an S3 hash [0*7FFFFF] prefix in your specified S3 object path.

Iceberg by default uses the Hive storage layout, but you can switch it to use the ObjectStoreLocationProvider. This option is not enabled by default to provide flexibility to choose the location where you want to add the hash prefix. With ObjectStoreLocationProvider, a deterministic hash is generated for each stored file and a subfolder is appended right after the S3 folder specified using the parameter write.data.path (write.object-storage-path for Iceberg version 0.12 and below). This ensures that files written to Amazon S3 are equally distributed across multiple prefixes in your S3 bucket, thereby minimizing the throttling errors. In the following example, we set the write.data.path value as s3://my-table-data-bucket, and Iceberg-generated S3 hash prefixes will be appended after this location:

CREATE TABLE my_catalog.my_ns.my_table
( id bigint,
data string,
category string)
USING iceberg OPTIONS
( 'write.object-storage.enabled'=true,
'write.data.path'='s3://my-table-data-bucket')
PARTITIONED BY (category);

Your S3 files will be arranged under MURMUR3 S3 hash prefixes like the following:

2021-11-01 05:39:24 809.4 KiB 7ffbc860/my_ns/my_table/00328-1642-5ce681a7-dfe3-4751-ab10-37d7e58de08a-00015.parquet
2021-11-01 06:00:10 6.1 MiB 7ffc1730/my_ns/my_table/00460-2631-983d19bf-6c1b-452c-8195-47e450dfad9d-00001.parquet
2021-11-01 04:33:24 6.1 MiB 7ffeeb4e/my_ns/my_table/00156-781-9dbe3f08-0a1d-4733-bd90-9839a7ceda00-00002.parquet

Using Iceberg ObjectStoreLocationProvider is not a foolproof mechanism to avoid S3 503 errors. You still need to set appropriate EMRFS retries to provide additional resiliency. You can adjust your retry strategy by increasing the maximum retry limit for the default exponential backoff retry strategy or enabling and configuring the additive-increase/multiplicative-decrease (AIMD) retry strategy. AIMD is supported for Amazon EMR releases 6.4.0 and later. For more information, refer to Retry Amazon S3 requests with EMRFS.

In the following sections, we provide examples for these use cases.

Storage cost optimizations

In this example, we use Iceberg’s S3 tags feature with the write tag as write-tag-name=created and delete tag as delete-tag-name=deleted. This example is demonstrated on an EMR version emr-6.10.0 cluster with installed applications Hadoop 3.3.3, Jupyter Enterprise Gateway 2.6.0, and Spark 3.3.1. The examples are run on a Jupyter Notebook environment attached to the EMR cluster. To learn more about how to create an EMR cluster with Iceberg and use Amazon EMR Studio, refer to Use an Iceberg cluster with Spark and the Amazon EMR Studio Management Guide, respectively.

The following examples are also available in the sample notebook in the aws-samples GitHub repo for quick experimentation.

Configure Iceberg on a Spark session

Configure your Spark session using the %%configure magic command. You can use either the AWS Glue Data Catalog (recommended) or a Hive catalog for Iceberg tables. In this example, we use a Hive catalog, but we can change to the Data Catalog with the following configuration:

spark.sql.catalog.my_catalog.catalog-impl=org.apache.iceberg.aws.glue.GlueCatalog

Before you run this step, create a S3 bucket and an iceberg folder in your AWS account with the naming convention <your-iceberg-storage-blog>/iceberg/.

Update your-iceberg-storage-blog in the following configuration with the bucket that you created to test this example. Note the configuration parameters s3.write.tags.write-tag-name and s3.delete.tags.delete-tag-name, which will tag the new S3 objects and deleted objects with corresponding tag values. We use these tags in later steps to implement S3 lifecycle policies to transition the objects to a lower-cost storage tier or expire them based on the use case.

%%configure -f { "conf":{ "spark.sql.extensions":"org.apache.iceberg.spark.extensions.IcebergSparkSessionExtensions", "spark.sql.catalog.dev":"org.apache.iceberg.spark.SparkCatalog", "spark.sql.catalog.dev.catalog-impl":"org.apache.iceberg.hive.HiveCatalog", "spark.sql.catalog.dev.io-impl":"org.apache.iceberg.aws.s3.S3FileIO", "spark.sql.catalog.dev.warehouse":"s3://&amp;amp;lt;your-iceberg-storage-blog&amp;amp;gt;/iceberg/", "spark.sql.catalog.dev.s3.write.tags.write-tag-name":"created", "spark.sql.catalog.dev.s3.delete.tags.delete-tag-name":"deleted", "spark.sql.catalog.dev.s3.delete-enabled":"false" } }

Create an Apache Iceberg table using Spark-SQL

Now we create an Iceberg table for the Amazon Product Reviews Dataset:

spark.sql(""" DROP TABLE if exists dev.db.amazon_reviews_iceberg""")
spark.sql(""" CREATE TABLE dev.db.amazon_reviews_iceberg (
marketplace string,
customer_id string,
review_id string,
product_id string,
product_parent string,
product_title string,
star_rating int,
helpful_votes int,
total_votes int,
vine string,
verified_purchase string,
review_headline string,
review_body string,
review_date date,
year int)
USING iceberg
location 's3://<your-iceberg-storage-blog>/iceberg/db/amazon_reviews_iceberg'
PARTITIONED BY (years(review_date))""")

In the next step, we load the table with the dataset using Spark actions.

Load data into the Iceberg table

While inserting the data, we partition the data by review_date as per the table definition. Run the following Spark commands in your PySpark notebook:

df = spark.read.parquet("s3://amazon-reviews-pds/parquet/product_category=Electronics/*.parquet")

df.sortWithinPartitions("review_date").writeTo("dev.db.amazon_reviews_iceberg").append()

Insert a single record into the same Iceberg table so that it creates a partition with the current review_date:

spark.sql("""insert into dev.db.amazon_reviews_iceberg values ("US", "99999999","R2RX7KLOQQ5VBG","B00000JBAT","738692522","Diamond Rio Digital",3,0,0,"N","N","Why just 30 minutes?","RIO is really great",date("2023-04-06"),2023)""")

You can check the new snapshot is created after this append operation by querying the Iceberg snapshot:

spark.sql("""SELECT * FROM dev.db.amazon_reviews_iceberg.snapshots""").show()

You will see an output similar to the following showing the operations performed on the table.

Check the S3 tag population

You can use the AWS Command Line Interface (AWS CLI) or the AWS Management Console to check the tags populated for the new writes. Let’s check the tag corresponding to the object created by a single row insert.

On the Amazon S3 console, check the S3 folder s3://your-iceberg-storage-blog/iceberg/db/amazon_reviews_iceberg/data/ and point to the partition review_date_year=2023/. Then check the Parquet file under this folder to check the tags associated with the data file in Parquet format.

From the AWS CLI, run the following command to see that the tag is created based on the Spark configuration spark.sql.catalog.dev.s3.write.tags.write-tag-name":"created":

xxxx@3c22fb1238d8 ~ % aws s3api get-object-tagging --bucket your-iceberg-storage-blog --key iceberg/db/amazon_reviews_iceberg/data/review_date_year=2023/00000-43-2fb892e3-0a3f-4821-a356-83204a69fa74-00001.parquet

You will see an output, similar to the below, showing the associated tags for the file

{ "VersionId": "null", "TagSet": [{ "Key": "write-tag-name", "Value": "created" } ] }

Delete a record and expire a snapshot

In this step, we delete a record from the Iceberg table and expire the snapshot corresponding to the deleted record. We delete the new single record that we inserted with the current review_date:

spark.sql("""delete from dev.db.amazon_reviews_iceberg where review_date = '2023-04-06'""")

We can now check that a new snapshot was created with the operation flagged as delete:

spark.sql("""SELECT * FROM dev.db.amazon_reviews_iceberg.snapshots""").show()

This is useful if we want to time travel and check the deleted row in the future. In that case, we have to query the table with the snapshot-id corresponding to the deleted row. However, we don’t discuss time travel as part of this post.

We expire the old snapshots from the table and keep only the last two. You can modify the query based on your specific requirements to retain the snapshots:

spark.sql ("""CALL dev.system.expire_snapshots(table => 'dev.db.amazon_reviews_iceberg', older_than => DATE '2024-01-01', retain_last => 2)""")

If we run the same query on the snapshots, we can see that we have only two snapshots available:

spark.sql("""SELECT * FROM dev.db.amazon_reviews_iceberg.snapshots""").show()

From the AWS CLI, you can run the following command to see that the tag is created based on the Spark configuration spark.sql.catalog.dev.s3. delete.tags.delete-tag-name":"deleted":

xxxxxx@3c22fb1238d8 ~ % aws s3api get-object-tagging --bucket avijit-iceberg-storage-blog --key iceberg/db/amazon_reviews_iceberg/data/review_date_year=2023/00000-43-2fb892e3-0a3f-4821-a356-83204a69fa74-00001.parquet

You will see output similar to below showing the associated tags for the file

{ "VersionId": "null", "TagSet": [ { "Key": "delete-tag-name", "Value": "deleted" }, { "Key": "write-tag-name", "Value": "created" } ] }

You can view the existing metadata files from the metadata log entries metatable after the expiration of snapshots:

spark.sql("""SELECT * FROM dev.db.amazon_reviews_iceberg.metadata_log_entries""").show()

The snapshots that have expired show the latest snapshot ID as null.

Create S3 lifecycle rules to transition the buckets to a different storage tier

Create a lifecycle configuration for the bucket to transition objects with the delete-tag-name=deleted S3 tag to the Glacier Instant Retrieval class. Amazon S3 runs lifecycle rules one time every day at midnight Universal Coordinated Time (UTC), and new lifecycle rules can take up to 48 hours to complete the first run. Amazon S3 Glacier is well suited to archive data that needs immediate access (with milliseconds retrieval). With S3 Glacier Instant Retrieval, you can save up to 68% on storage costs compared to using the S3 Standard-Infrequent Access (S3 Standard-IA) storage class, when the data is accessed once per quarter.

When you want to access the data back, you can bulk restore the archived objects. After you restore the objects back in S3 Standard class, you can register the metadata and data as an archival table for query purposes. The metadata file location can be fetched from the metadata log entries metatable as illustrated earlier. As mentioned before, the latest snapshot ID with Null values indicates expired snapshots. We can take one of the expired snapshots and do the bulk restore:

spark.sql("""CALL dev.system.register_table(table => 'db.amazon_reviews_iceberg_archive', metadata_file => 's3://avijit-iceberg-storage-blog/iceberg/db/amazon_reviews_iceberg/metadata/00000-a010f15c-7ac8-4cd1-b1bc-bba99fa7acfc.metadata.json')""").show()

Capabilities for disaster recovery and business continuity, cross-account and multi-Region access to the data lake

Because Iceberg doesn’t support relative paths, you can use access points to perform Amazon S3 operations by specifying a mapping of buckets to access points. This is useful for multi-Region access, cross-Region access, disaster recovery, and more.

For cross-Region access points, we need to additionally set the use-arn-region-enabled catalog property to true to enable S3FileIO to make cross-Region calls. If an Amazon S3 resource ARN is passed in as the target of an Amazon S3 operation that has a different Region than the one the client was configured with, this flag must be set to ‘true‘ to permit the client to make a cross-Region call to the Region specified in the ARN, otherwise an exception will be thrown. However, for the same or multi-Region access points, the use-arn-region-enabled flag should be set to ‘false’.

For example, to use an S3 access point with multi-Region access in Spark 3.3, you can start the Spark SQL shell with the following code:

spark-sql --conf spark.sql.catalog.my_catalog=org.apache.iceberg.spark.SparkCatalog \
--conf spark.sql.catalog.my_catalog.warehouse=s3://my-bucket2/my/key/prefix \
--conf spark.sql.catalog.my_catalog.catalog-impl=org.apache.iceberg.aws.glue.GlueCatalog \
--conf spark.sql.catalog.my_catalog.io-impl=org.apache.iceberg.aws.s3.S3FileIO \
--conf spark.sql.catalog.my_catalog.s3.use-arn-region-enabled=false \
--conf spark.sql.catalog.test.s3.access-points.my-bucket1=arn:aws:s3::123456789012:accesspoint:mfzwi23gnjvgw.mrap \
--conf spark.sql.catalog.test.s3.access-points.my-bucket2=arn:aws:s3::123456789012:accesspoint:mfzwi23gnjvgw.mrap

In this example, the objects in Amazon S3 on my-bucket1 and my-bucket2 buckets use the arn:aws:s3::123456789012:accesspoint:mfzwi23gnjvgw.mrap access point for all Amazon S3 operations.

For more details on using access points, refer to Using access points with compatible Amazon S3 operations.

Let’s say your table path is under mybucket1, so both mybucket1 in Region 1 and mybucket2 in Region have paths of mybucket1 inside the metadata files. At the time of the S3 (GET/PUT) call, we replace the mybucket1 reference with a multi-Region access point.

Handling increased S3 request rates

When using ObjectStoreLocationProvider (for more details, see Object Store File Layout), a deterministic hash is generated for each stored file, with the hash appended directly after the write.data.path. The problem with this is that the default hashing algorithm generates hash values up to Integer MAX_VALUE, which in Java is (2^31)-1. When this is converted to hex, it produces 0x7FFFFFFF, so the first character variance is restricted to only [0-8]. As per Amazon S3 recommendations, we should have the maximum variance here to mitigate this.

Starting from Amazon EMR 6.10, Amazon EMR added an optimized location provider that makes sure the generated prefix hash has uniform distribution in the first two characters using the character set from [0-9][A-Z][a-z].

This location provider has been recently open sourced by Amazon EMR via Core: Improve bit density in object storage layout and should be available starting from Iceberg 1.3.0.

To use, make sure the iceberg.enabled classification is set to true, and write.location-provider.impl is set to org.apache.iceberg.emr.OptimizedS3LocationProvider.

The following is a sample Spark shell command:

spark-shell --conf spark.driver.memory=4g \
--conf spark.executor.cores=4 \
--conf spark.dynamicAllocation.enabled=true \
--conf spark.sql.catalog.my_catalog=org.apache.iceberg.spark.SparkCatalog \
--conf spark.sql.catalog.my_catalog.warehouse=s3://my-bucket/iceberg-V516168123 \
--conf spark.sql.catalog.my_catalog.catalog-impl=org.apache.iceberg.aws.glue.GlueCatalog \
--conf spark.sql.catalog.my_catalog.io-impl=org.apache.iceberg.aws.s3.S3FileIO \
--conf spark.sql.catalog.my_catalog.table-override.write.location-provider.impl=org.apache.iceberg.emr.OptimizedS3LocationProvider

The following example shows that when you enable the object storage in your Iceberg table, it adds the hash prefix in your S3 path directly after the location you provide in your DDL.

Define the table write.object-storage.enabled parameter and provide the S3 path, after which you want to add the hash prefix using write.data.path (for Iceberg Version 0.13 and above) or write.object-storage.path (for Iceberg Version 0.12 and below) parameters.

Insert data into the table you created.

The hash prefix is added right after the /current/ prefix in the S3 path as defined in the DDL.

Clean up

After you complete the test, clean up your resources to avoid any recurring costs:

  1. Delete the S3 buckets that you created for this test.
  2. Delete the EMR cluster.
  3. Stop and delete the EMR notebook instance.

Conclusion

As companies continue to build newer transactional data lake use cases using Apache Iceberg open table format on very large datasets on S3 data lakes, there will be an increased focus on optimizing those petabyte-scale production environments to reduce cost, improve efficiency, and implement high availability. This post demonstrated mechanisms to implement the operational efficiencies for Apache Iceberg open table formats running on AWS.

To learn more about Apache Iceberg and implement this open table format for your transactional data lake use cases, refer to the following resources:


About the Authors

Avijit Goswami is a Principal Solutions Architect at AWS specialized in data and analytics. He supports AWS strategic customers in building high-performing, secure, and scalable data lake solutions on AWS using AWS managed services and open-source solutions. Outside of his work, Avijit likes to travel, hike in the San Francisco Bay Area trails, watch sports, and listen to music.

Rajarshi Sarkar is a Software Development Engineer at Amazon EMR/Athena. He works on cutting-edge features of Amazon EMR/Athena and is also involved in open-source projects such as Apache Iceberg and Trino. In his spare time, he likes to travel, watch movies, and hang out with friends.

Prashant Singh is a Software Development Engineer at AWS. He is interested in Databases and Data Warehouse engines and has worked on Optimizing Apache Spark performance on EMR. He is an active contributor in open source projects like Apache Spark and Apache Iceberg. During his free time, he enjoys exploring new places, food and hiking.
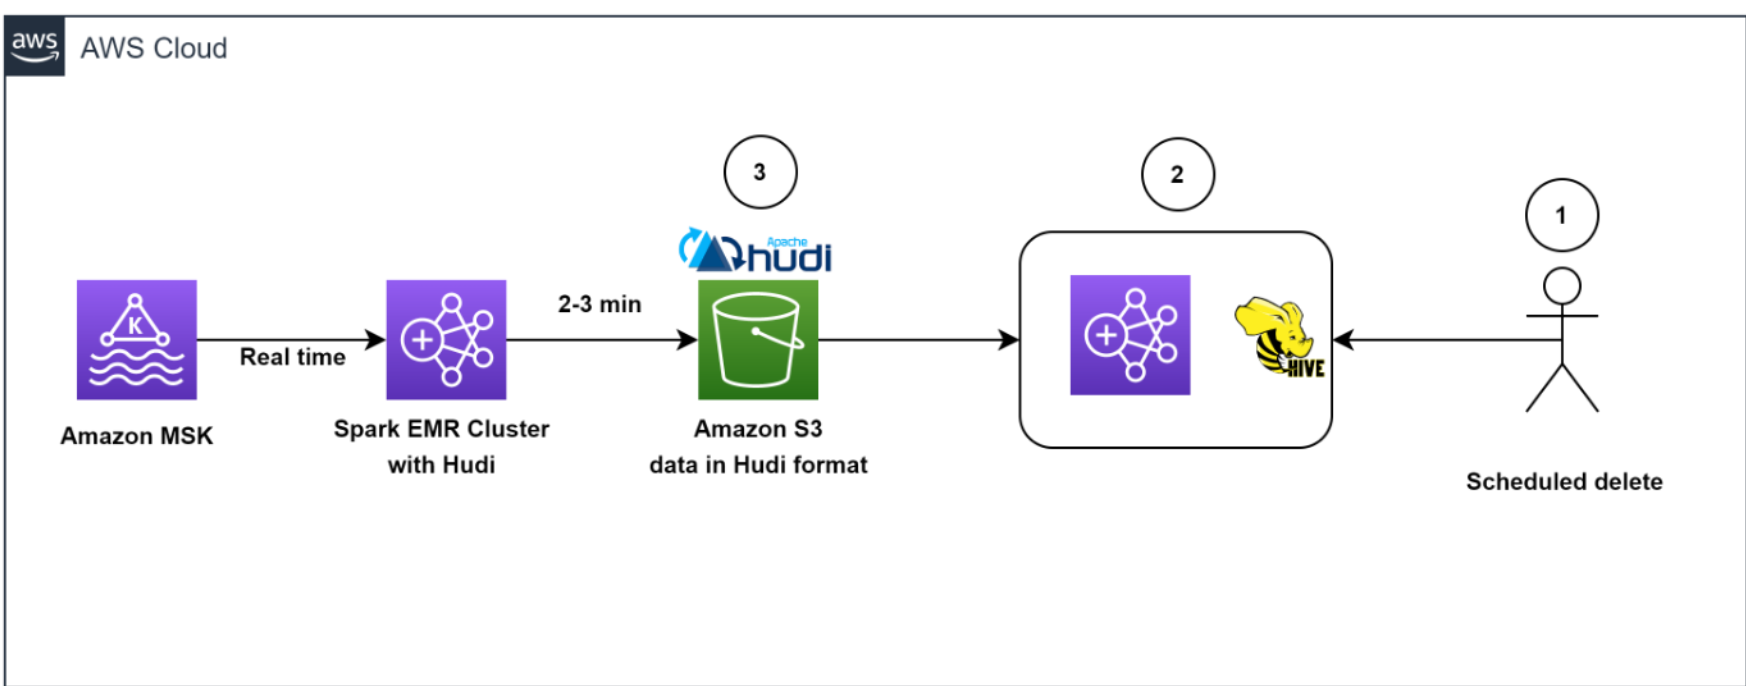
How Zoom implemented streaming log ingestion and efficient GDPR deletes using Apache Hudi on Amazon EMR

Post Syndicated from Sekar Srinivasan original https://aws.amazon.com/blogs/big-data/how-zoom-implemented-streaming-log-ingestion-and-efficient-gdpr-deletes-using-apache-hudi-on-amazon-emr/

In today’s digital age, logging is a critical aspect of application development and management, but efficiently managing logs while complying with data protection regulations can be a significant challenge. Zoom, in collaboration with the AWS Data Lab team, developed an innovative architecture to overcome these challenges and streamline their logging and record deletion processes. In this post, we explore the architecture and the benefits it provides for Zoom and its users.

Application log challenges: Data management and compliance

Application logs are an essential component of any application; they provide valuable information about the usage and performance of the system. These logs are used for a variety of purposes, such as debugging, auditing, performance monitoring, business intelligence, system maintenance, and security. However, although these application logs are necessary for maintaining and improving the application, they also pose an interesting challenge. These application logs may contain personally identifiable data, such as user names, email addresses, IP addresses, and browsing history, which creates a data privacy concern.

Laws such as the General Data Protection Regulation (GDPR) and the California Consumer Privacy Act (CCPA) require organizations to retain application logs for a specific period of time. The exact length of time required for data storage varies depending on the specific regulation and the type of data being stored. The reason for these data retention periods is to ensure that companies aren’t keeping personal data longer than necessary, which could increase the risk of data breaches and other security incidents. This also helps ensure that companies aren’t using personal data for purposes other than those for which it was collected, which could be a violation of privacy laws. These laws also give individuals the right to request the deletion of their personal data, also known as the “right to be forgotten.” Individuals have the right to have their personal data erased, without undue delay.

So, on one hand, organizations need to collect application log data to ensure the proper functioning of their services, and keep the data for a specific period of time. But on the other hand, they may receive requests from individuals to delete their personal data from the logs. This creates a balancing act for organizations because they must comply with both data retention and data deletion requirements.

This issue becomes increasingly challenging for larger organizations that operate in multiple countries and states, because each country and state may have their own rules and regulations regarding data retention and deletion. For example, the Personal Information Protection and Electronic Documents Act (PIPEDA) in Canada and the Australian Privacy Act in Australia are similar laws to GDPR, but they may have different retention periods or different exceptions. Therefore, organizations big or small must navigate this complex landscape of data retention and deletion requirements, while also ensuring that they are in compliance with all applicable laws and regulations.

Zoom’s initial architecture

During the COVID-19 pandemic, the use of Zoom skyrocketed as more and more people were asked to work and attend classes from home. The company had to rapidly scale its services to accommodate the surge and worked with AWS to deploy capacity across most Regions globally. With a sudden increase in the large number of application endpoints, they had to rapidly evolve their log analytics architecture and worked with the AWS Data Lab team to quickly prototype and deploy an architecture for their compliance use case.

At Zoom, the data ingestion throughput and performance needs are very stringent. Data had to be ingested from several thousand application endpoints that produced over 30 million messages every minute, resulting in over 100 TB of log data per day. The existing ingestion pipeline consisted of writing the data to Apache Hadoop HDFS storage through Apache Kafka first and then running daily jobs to move the data to persistent storage. This took several hours while also slowing the ingestion and creating the potential for data loss. Scaling the architecture was also an issue because HDFS data would have to be moved around whenever nodes were added or removed. Furthermore, transactional semantics on billions of records were necessary to help meet compliance-related data delete requests, and the existing architecture of daily batch jobs was operationally inefficient.

It was at this time, through conversations with the AWS account team, that the AWS Data Lab team got involved to assist in building a solution for Zoom’s hyper-scale.

Solution overview

The AWS Data Lab offers accelerated, joint engineering engagements between customers and AWS technical resources to create tangible deliverables that accelerate data, analytics, artificial intelligence (AI), machine learning (ML), serverless, and container modernization initiatives. The Data Lab has three offerings: the Build Lab, the Design Lab, and Resident Architect. During the Build and Design Labs, AWS Data Lab Solutions Architects and AWS experts supported Zoom specifically by providing prescriptive architectural guidance, sharing best practices, building a working prototype, and removing technical roadblocks to help meet their production needs.

Zoom and the AWS team (collectively referred to as “the team” going forward) identified two major workflows for data ingestion and deletion.

Data ingestion workflow

The following diagram illustrates the data ingestion workflow.

Data Ingestion Workflow

The team needed to quickly populate millions of Kafka messages in the dev/test environment to achieve this. To expedite the process, we (the team) opted to use Amazon Managed Streaming for Apache Kafka (Amazon MSK), which makes it simple to ingest and process streaming data in real time, and we were up and running in under a day.

To generate test data that resembled production data, the AWS Data Lab team created a custom Python script that evenly populated over 1.2 billion messages across several Kafka partitions. To match the production setup in the development account, we had to increase the cloud quota limit via a support ticket.

We used Amazon MSK and the Spark Structured Streaming capability in Amazon EMR to ingest and process the incoming Kafka messages with high throughput and low latency. Specifically, we inserted the data from the source into EMR clusters at a maximum incoming rate of 150 million Kafka messages every 5 minutes, with each Kafka message holding 7–25 log data records.

To store the data, we chose to use Apache Hudi as the table format. We opted for Hudi because it’s an open-source data management framework that provides record-level insert, update, and delete capabilities on top of an immutable storage layer like Amazon Simple Storage Service (Amazon S3). Additionally, Hudi is optimized for handling large datasets and works well with Spark Structured Streaming, which was already being used at Zoom.

After 150 million messages were buffered, we processed the messages using Spark Structured Streaming on Amazon EMR and wrote the data into Amazon S3 in Apache Hudi-compatible format every 5 minutes. We first flattened the message array, creating a single record from the nested array of messages. Then we added a unique key, known as the Hudi record key, to each message. This key allows Hudi to perform record-level insert, update, and delete operations on the data. We also extracted the field values, including the Hudi partition keys, from incoming messages.

This architecture allowed end-users to query the data stored in Amazon S3 using Amazon Athena with the AWS Glue Data Catalog or using Apache Hive and Presto.

Data deletion workflow

The following diagram illustrates the data deletion workflow.

Data Deletion Workflow

Our architecture allowed for efficient data deletions. To help comply with the customer-initiated data retention policy for GDPR deletes, scheduled jobs ran daily to identify the data to be deleted in batch mode.

We then spun up a transient EMR cluster to run the GDPR upsert job to delete the records. The data was stored in Amazon S3 in Hudi format, and Hudi’s built-in index allowed us to efficiently delete records using bloom filters and file ranges. Because only those files that contained the record keys needed to be read and rewritten, it only took about 1–2 minutes to delete 1,000 records out of the 1 billion records, which had previously taken hours to complete as entire partitions were read.

Overall, our solution enabled efficient deletion of data, which provided an additional layer of data security that was critical for Zoom, in light of its GDPR requirements.

Architecting to optimize scale, performance, and cost

In this section, we share the following strategies Zoom took to optimize scale, performance, and cost:

  • Optimizing ingestion
  • Optimizing throughput and Amazon EMR utilization
  • Decoupling ingestion and GDPR deletion using EMRFS
  • Efficient deletes with Apache Hudi
  • Optimizing for low-latency reads with Apache Hudi
  • Monitoring

Optimizing ingestion

To keep the storage in Kafka lean and optimal, as well as to get a real-time view of data, we created a Spark job to read incoming Kafka messages in batches of 150 million messages and wrote to Amazon S3 in Hudi-compatible format every 5 minutes. Even during the initial stages of the iteration, when we hadn’t started scaling and tuning yet, we were able to successfully load all Kafka messages consistently under 2.5 minutes using the Amazon EMR runtime for Apache Spark.

Optimizing throughput and Amazon EMR utilization

We launched a cost-optimized EMR cluster and switched from uniform instance groups to using EMR instance fleets. We chose instance fleets because we needed the flexibility to use Spot Instances for task nodes and wanted to diversify the risk of running out of capacity for a specific instance type in our Availability Zone.

We started experimenting with test runs by first changing the number of Kafka partitions from 400 to 1,000, and then changing the number of task nodes and instance types. Based on the results of the run, the AWS team came up with the recommendation to use Amazon EMR with three core nodes (r5.16xlarge (64 vCPUs each)) and 18 task nodes using Spot fleet instances (a combination of r5.16xlarge (64 vCPUs), r5.12xlarge (48 vCPUs), r5.8xlarge (32 vCPUs)). These recommendations helped Zoom to reduce their Amazon EMR costs by more than 80% while meeting their desired performance goals of ingesting 150 million Kafka messages under 5 minutes.

Decoupling ingestion and GDPR deletion using EMRFS

A well-known benefit of separation of storage and compute is that you can scale the two independently. But a not-so-obvious advantage is that you can decouple continuous workloads from sporadic workloads. Previously data was stored in HDFS. Resource-intensive GDPR delete jobs and data movement jobs would compete for resources with the stream ingestion, causing a backlog of more than 5 hours in upstream Kafka clusters, which was close to filling up the Kafka storage (which only had 6 hours of data retention) and potentially causing data loss. Offloading data from HDFS to Amazon S3 allowed us the freedom to launch independent transient EMR clusters on demand to perform data deletion, helping to ensure that the ongoing data ingestion from Kafka into Amazon EMR is not starved for resources. This enabled the system to ingest data every 5 minutes and complete each Spark Streaming read in 2–3 minutes. Another side effect of using EMRFS is a cost-optimized cluster, because we removed reliance on Amazon Elastic Block Store (Amazon EBS) volumes for over 300 TB storage that was used for three copies (including two replicas) of HDFS data. We now pay for only one copy of the data in Amazon S3, which provides 11 9s of durability and is relatively inexpensive storage.

Efficient deletes with Apache Hudi

What about the conflict between ingest writes and GDPR deletes when running concurrently? This is where the power of Apache Hudi stands out.

Apache Hudi provides a table format for data lakes with transactional semantics that enables the separation of ingestion workloads and updates when run concurrently. The system was able to consistently delete 1,000 records in less than a minute. There were some limitations in concurrent writes in Apache Hudi 0.7.0, but the Amazon EMR team quickly addressed this by back-porting Apache Hudi 0.8.0, which supports optimistic concurrency control, to the current (at the time of the AWS Data Lab collaboration) Amazon EMR 6.4 release. This saved time in testing and allowed for a quick transition to the new version with minimal testing. This enabled us to query the data directly using Athena quickly without having to spin up a cluster to run ad hoc queries, as well as to query the data using Presto, Trino, and Hive. The decoupling of the storage and compute layers provided the flexibility to not only query data across different EMR clusters, but also delete data using a completely independent transient cluster.

Optimizing for low-latency reads with Apache Hudi

To optimize for low-latency reads with Apache Hudi, we needed to address the issue of too many small files being created within Amazon S3 due to the continuous streaming of data into the data lake.

We utilized Apache Hudi’s features to tune file sizes for optimal querying. Specifically, we reduced the degree of parallelism in Hudi from the default value of 1,500 to a lower number. Parallelism refers to the number of threads used to write data to Hudi; by reducing it, we were able to create larger files that were more optimal for querying.

Because we needed to optimize for high-volume streaming ingestion, we chose to implement the merge on read table type (instead of copy on write) for our workload. This table type allowed us to quickly ingest the incoming data into delta files in row format (Avro) and asynchronously compact the delta files into columnar Parquet files for fast reads. To do this, we ran the Hudi compaction job in the background. Compaction is the process of merging row-based delta files to produce new versions of columnar files. Because the compaction job would use additional compute resources, we adjusted the degree of parallelism for insertion to a lower value of 1,000 to account for the additional resource usage. This adjustment allowed us to create larger files without sacrificing performance throughput.

Overall, our approach to optimizing for low-latency reads with Apache Hudi allowed us to better manage file sizes and improve the overall performance of our data lake.

Monitoring

The team monitored MSK clusters with Prometheus (an open-source monitoring tool). Additionally, we showcased how to monitor Spark streaming jobs using Amazon CloudWatch metrics. For more information, refer to Monitor Spark streaming applications on Amazon EMR.

Outcomes

The collaboration between Zoom and the AWS Data Lab demonstrated significant improvements in data ingestion, processing, storage, and deletion using an architecture with Amazon EMR and Apache Hudi. One key benefit of the architecture was a reduction in infrastructure costs, which was achieved through the use of cloud-native technologies and the efficient management of data storage. Another benefit was an improvement in data management capabilities.

We showed that the costs of EMR clusters can be reduced by about 82% while bringing the storage costs down by about 90% compared to the prior HDFS-based architecture. All of this while making the data available in the data lake within 5 minutes of ingestion from the source. We also demonstrated that data deletions from a data lake containing multiple petabytes of data can be performed much more efficiently. With our optimized approach, we were able to delete approximately 1,000 records in just 1–2 minutes, as compared to the previously required 3 hours or more.

Conclusion

In conclusion, the log analytics process, which involves collecting, processing, storing, analyzing, and deleting log data from various sources such as servers, applications, and devices, is critical to aid organizations in working to meet their service resiliency, security, performance monitoring, troubleshooting, and compliance needs, such as GDPR.

This post shared what Zoom and the AWS Data Lab team have accomplished together to solve critical data pipeline challenges, and Zoom has extended the solution further to optimize extract, transform, and load (ETL) jobs and resource efficiency. However, you can also use the architecture patterns presented here to quickly build cost-effective and scalable solutions for other use cases. Please reach out to your AWS team for more information or contact Sales.


About the Authors

Sekar Srinivasan is a Sr. Specialist Solutions Architect at AWS focused on Big Data and Analytics. Sekar has over 20 years of experience working with data. He is passionate about helping customers build scalable solutions modernizing their architecture and generating insights from their data. In his spare time he likes to work on non-profit projects focused on underprivileged Children’s education.

Chandra DhandapaniChandra Dhandapani is a Senior Solutions Architect at AWS, where he specializes in creating solutions for customers in Analytics, AI/ML, and Databases. He has a lot of experience in building and scaling applications across different industries including Healthcare and Fintech. Outside of work, he is an avid traveler and enjoys sports, reading, and entertainment.

Amit Kumar Agrawal is a Senior Solutions Architect at AWS, based out of San Francisco Bay Area. He works with large strategic ISV customers to architect cloud solutions that address their business challenges. During his free time he enjoys exploring the outdoors with his family.

Viral Shah is a Analytics Sales Specialist working with AWS for 5 years helping customers to be successful in their data journey. He has over 20+ years of experience working with enterprise customers and startups, primarily in the data and database space. He loves to travel and spend quality time with his family.
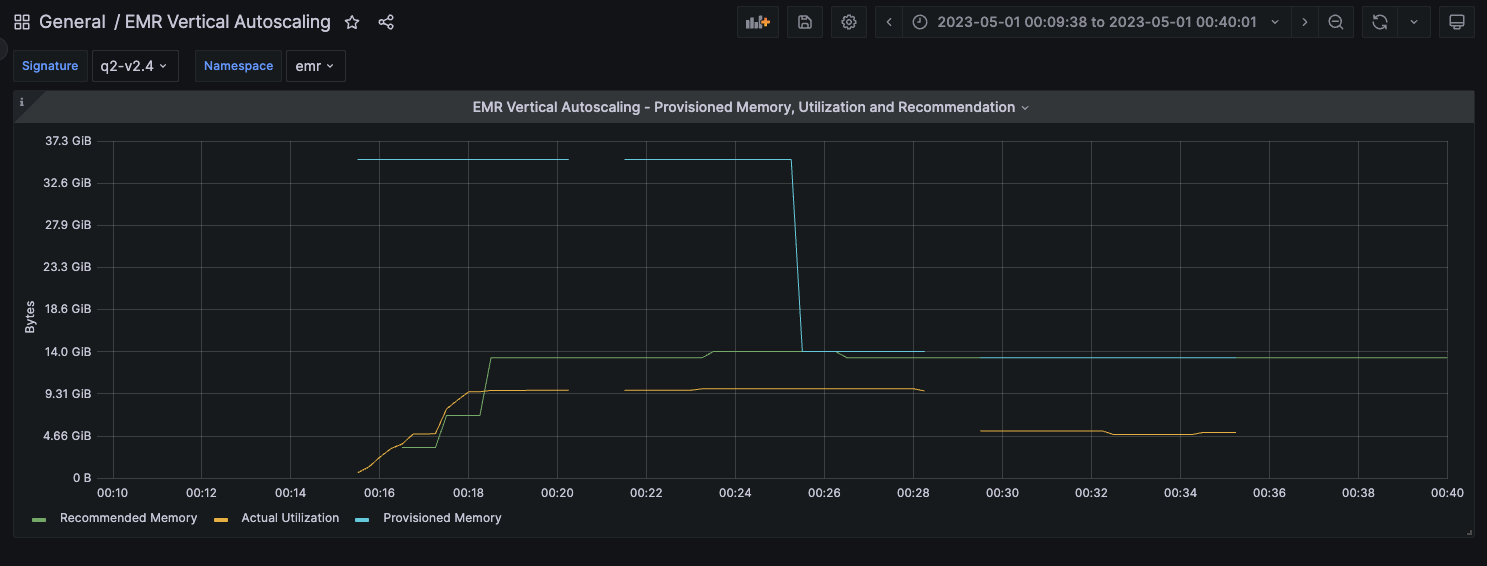
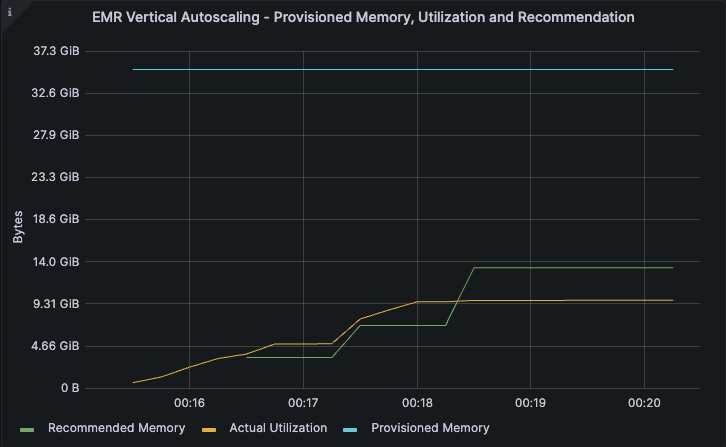
Improve reliability and reduce costs of your Apache Spark workloads with vertical autoscaling on Amazon EMR on EKS

Post Syndicated from Rajkishan Gunasekaran original https://aws.amazon.com/blogs/big-data/improve-reliability-and-reduce-costs-of-your-apache-spark-workloads-with-vertical-autoscaling-on-amazon-emr-on-eks/

Amazon EMR on Amazon EKS is a deployment option offered by Amazon EMR that enables you to run Apache Spark applications on Amazon Elastic Kubernetes Service (Amazon EKS) in a cost-effective manner. It uses the EMR runtime for Apache Spark to increase performance so that your jobs run faster and cost less.

Apache Spark allows you to configure the amount of Memory and vCPU cores that a job will utilize. However, tuning these values is a manual process that can be complex and ripe with pitfalls. For example, allocating too little memory can result in out-of-memory exceptions and poor job reliability. On the other hand, too much can result in over-spending on idle resources, poor cluster utilization and high costs. Moreover, it’s hard to right-size these settings for some use cases such as interactive analytics due to lack of visibility into future requirements. In the case of recurring jobs, keeping these settings up to date taking into account changing load patterns (due to external seasonal factors for instance) remains a challenge.

To address this, Amazon EMR on EKS has recently announced support for vertical autoscaling, a feature that uses the Kubernetes Vertical Pod Autoscaler (VPA) to automatically tune the memory and CPU resources of EMR Spark applications to adapt to the needs of the provided workload, simplifying the process of tuning resources and optimizing costs for these applications. You can use vertical autoscaling’s ability to tune resources based on historic data to keep memory and CPU settings up to date even when the profile of the workload varies over time. Additionally, you can use its ability to react to real-time signals to enable applications recover from out-of-memory (OOM) exceptions, helping improve job reliability.

Vertical autoscaling vs existing autoscaling solutions

Vertical autoscaling complements existing Spark autoscaling solutions such as Dynamic Resource Allocation (DRA) and Kubernetes autoscaling solutions such as Karpenter.

Features such as DRA typically work on the horizontal axis, where an increase in load results in an increase in the number of Kubernetes pods that will process the load. In the case of Spark, this results in data being processed across additional executors. When DRA is enabled, Spark starts with an initial number of executors and scales this up if it observes that there are tasks sitting and waiting for executors to run on. DRA works at the pod level and would need an underlying cluster-level auto-scaler such as Karpenter to bring in additional nodes or scale down unused nodes in response to these pods getting created and deleted.

However, for a given data profile and a query plan, sometimes the parallelism and the number of executors can’t be easily changed. As an example, if you’re attempting to join two tables that store data already sorted and bucketed by the join keys, Spark can efficiently join the data by using a fixed number of executors that equals the number of buckets in the source data. Since the number of executors cannot be changed, vertical autoscaling can help here by offering additional resources or scaling down unused resources at the executor level. This has a few advantages:

  • If a pod is optimally sized, the Kubernetes scheduler can efficiently pack in more pods in a single node, leading to better utilization of the underlying cluster.
  • The Amazon EMR on EKS uplift is charged based on the vCPU and memory resources consumed by a Kubernetes pod.This means an optimally sized pod is cheaper.

How vertical autoscaling works

Vertical autoscaling is a feature that you can opt into at the time of submitting an EMR on EKS job. When enabled, it uses VPA to track the resource utilization of your EMR Spark jobs and derive recommendations for resource assignments for Spark executor pods based on this data. The data, fetched from the Kubernetes Metric Server, feeds into statistical models that VPA constructs in order to build recommendations. When new executor pods spin up belonging to a job that has vertical autoscaling enabled, they’re autoscaled based on this recommendation, ignoring the usual sizing done via Spark’s executor memory configuration (controlled by the spark.executor.memory Spark setting).

Vertical autoscaling does not impact pods that are running, since in-place resizing of pods remains unsupported as of Kubernetes version 1.26, the latest supported version of Kubernetes on Amazon EKS as of this writing. However, it’s useful in the case of a recurring job where we can perform autoscaling based on historic data as well as scenarios when some pods go out-of-memory and get re-started by Spark, where vertical autoscaling can be used to selectively scale up the re-started pods and facilitate automatic recovery.

Data tracking and recommendations

To recap, vertical autoscaling uses VPA to track resource utilization for EMR jobs. For a deep-dive into the functionality, refer to the VPA Github repo. In short, vertical autoscaling sets up VPA to track the container_memory_working_set_bytes metric for the Spark executor pods that have vertical autoscaling enabled.

Real-time metric data is fetched from the Kubernetes Metric Server. By default, vertical autoscaling tracks the peak memory working set size for each pod and makes recommendations based on the p90 of the peak with a 40% safety margin added in. It also listens to pod events such as OOM events and reacts to these events. In the case of OOM events, VPA automatically bumps up the recommended resource assignment by 20%.

The statistical models, which also represent historic resource utilization data are stored as custom resource objects on your EKS cluster. This means that deleting these objects also purges old recommendations.

Customized recommendations through job signature

One of the major use-cases of vertical autoscaling is to aggregate usage data across different runs of EMR Spark jobs to derive resource recommendations. To do so, you need to provide a job signature. This can be a unique name or identifier that you configure at the time of submitting your job. If your job recurs at a fixed schedule (such as daily or weekly), it’s important that your job signature doesn’t change for each new instance of the job in order for VPA to aggregate and compute recommendations across different runs of the job.

A job signature can be the same even across different jobs if you believe they’ll have similar resource profiles. You can therefore use the signature to combine tracking and resource modeling across different jobs that you expect to behave similarly. Conversely, if a job’s behavior is changing at some point in time, such as due to a change in the upstream data or the query pattern, you can easily purge the old recommendations by either changing your signature or deleting the VPA custom resource for this signature (as explained later in this post).

Monitoring mode

You can use vertical autoscaling in a monitoring mode where no autoscaling is actually performed. Recommendations are reported to Prometheus if you have that setup on your cluster and you can monitor the recommendations through Grafana dashboards and use that to debug and make manual changes to the resource assignments. Monitoring mode is the default but you can override and use one of the supported autoscaling modes as well at the time of submitting a job. Refer to documentation for usage and a walkthrough on how to get started.

Monitoring vertical autoscaling through kubectl

You can use the Kubernetes command-line tool kubectl to list active recommendations on your cluster, view all the job signatures that are being tracked as well as purge resources associated with signatures that aren’t relevant anymore. In this section, we provide some example code to demonstrate listing, querying, and deleting recommendations.

List all vertical autoscaling recommendations on a cluster

You can use kubectl to get the verticalpodautoscaler resource in order to view the current status and recommendations. The following sample query lists all resources currently active on your EKS cluster:

kubectl get verticalpodautoscalers \
-o custom-columns='NAME:.metadata.name,'\
'SIGNATURE:.metadata.labels.emr-containers\.amazonaws\.com/dynamic\.sizing\.signature,'\
'MODE:.spec.updatePolicy.updateMode,'\
'MEM:.status.recommendation.containerRecommendations[0].target.memory' \
--all-namespaces

This produces output similar to the following

NAME               SIGNATURE           MODE      MEM
ds-<some-id>-vpa   <some-signature>    Off       930143865
ds-<some-id>-vpa   <some-signature>    Initial   14291063673

Query and delete a recommendation

You can also use kubectl to purge recommendation for a job based on the signature. Alternately, you can use the --all flag and skip specifying the signature to purge all the resources on your cluster. Note that in this case you’ll actually be deleting the EMR vertical autoscaling job-run resource. This is a custom resource managed by EMR, deleting it automatically deletes the associated VPA object that tracks and stores recommendations. See the following code:

kubectl delete jobrun -n emr \
-l='emr-containers.amazonaws.com/dynamic.sizing.signature=<some-signature>'
jobrun.dynamicsizing.emr.services.k8s.aws "ds-<some-id>" deleted

You can use the --all and --all-namespaces to delete all vertical autoscaling related resources

kubectl delete jobruns --all --all-namespaces
jobrun.dynamicsizing.emr.services.k8s.aws "ds-<some-id>" deleted

Monitor vertical autoscaling through Prometheus and Grafana

You can use Prometheus and Grafana to monitor the vertical autoscaling functionality on your EKS cluster. This includes viewing recommendations that evolve over time for different job signatures, monitoring the autoscaling functionality etc. For this setup, we assume Prometheus and Grafana are already installed on your EKS cluster using the official Helm charts. If not, refer to the Setting up Prometheus and Grafana for monitoring the cluster section of the Running batch workloads on Amazon EKS workshop to get them up and running on your cluster.

Modify Prometheus to collect vertical autoscaling metrics

Prometheus doesn’t track vertical autoscaling metrics by default. To enable this, you’ll need to start gathering metrics from the VPA custom resource objects on your cluster. This can be easily done by patching your Helm chart with the following configuration:

helm upgrade -f prometheus-helm-values.yaml prometheus prometheus-community/prometheus -n prometheus

Here, prometheus-helm-values.yaml is the vertical autoscaling specific customization that tells Prometheus to gather vertical autoscaling related recommendations from the VPA resource objects, along with the minimal required metadata such as the job’s signature.

You can verify if this setup is working by running the following Prometheus queries for the newly created custom metrics:

  • kube_customresource_vpa_spark_rec_memory_target
  • kube_customresource_vpa_spark_rec_memory_lower
  • kube_customresource_vpa_spark_rec_memory_upper

These represent the lower bound, upper bound and target memory for EMR Spark jobs that have vertical autoscaling enabled. The query can be grouped or filtered using the signature label similar to the following Prometheus query:

kube_customresource_vpa_spark_rec_memory_target{signature=”<some-signature>”}

Use Grafana to visualize recommendations and autoscaling functionality

You can use our sample Grafana dashboard by importing the EMR vertical autoscaling JSON model into your Grafana deployment. The dashboard visualizes vertical autoscaling recommendations alongside the memory provisioned and actually utilized by EMR Spark applications as shown in the following screenshot.

Grafana Dashboard

Results are presented categorized by your Kubernetes namespace and job signature. When you choose a certain namespace and signature combination, you’re presented with a pane. The pane represents a comparison of the vertical autoscaling recommendations for jobs belonging to the chosen signature, compared to the actual resource utilization of that job and the amount of Spark executor memory provisioned to the job. If autoscaling is enabled, the expectation is that the Spark executor memory would track the recommendation. If you’re in monitoring mode however, the two won’t match but you can still view the recommendations from this dashboard or use them to better understand the actual utilization and resource profile of your job.

Illustration of provisioned memory, utilization and recommendations

To better illustrate vertical autoscaling behavior and usage for different workloads, we executed query 2 of the TPC-DS benchmark for 5 iterations — The first two iterations in monitoring mode and the last 3 in autoscaling mode and visualized the results in the Grafana dashboard shared in the previous section.

Monitoring mode

This particular job was provisioned to run with 32GB of executor memory (the blue line in the image) but the actual utilization hovered at around the 10 GB mark (amber line). Vertical autoscaling computes a recommendation of approximately 14 GB based on this run (the green line). This recommendation is based on the actual utilization with a safety margin added in.

Cost optimization example 1

The second iteration of the job was also run in the monitoring mode and the utilization and the recommendations remained unchanged.

cost optimization example 2

Autoscaling mode

Iterations 3 through 5 were run in autoscaling mode. In this case, the provisioned memory drops from 32GB to match the recommended value of 14GB (the blue line).

cost optimization example 3

The utilization and recommendations remained unchanged for subsequent iterations in the case of this example. Furthermore, we observed that all the iterations of the job completed in around 5 minutes, both with and without autoscaling. This example illustrates the successful scaling down of the job’s executor memory allocation by about 56% (a drop from 32GB to approximately 14 GB) which also translates to an equivalent reduction in the EMR memory uplift costs of the job, with no impact to the job’s performance.

Automatic OOM recovery

In the earlier example, we didn’t observe any OOM events as a result of autoscaling. In the rare occasion where autoscaling results in OOM events, jobs should usually be scaled back up automatically. On the other hand, if a job that has autoscaling enabled is under-provisioned and as a result experiences OOM events, vertical autoscaling can scale up resources to facilitate automatic recovery.

In the following example, a job was provisioned with 2.5 GB of executor memory and experienced OOM exceptions during its execution. Vertical autoscaling responded to the OOM events by automatically scaling up failed executors when they were re-started. As seen in the following image, when the amber line representing memory utilization started approaching the blue line representing the provisioned memory, vertical autoscaling kicked in to increase the amount of provisioned memory for the re-started executors, allowing the automatic recovery and successful completion of the job without any intervention. The recommended memory converged to approximately 5 GB before the job completed.

OOM recovery example

All subsequent runs of jobs with the same signature will now start-up with the recommended settings computed earlier, preventing OOM events right from the start.

Cleanup

Refer to documentation for information on cleaning up vertical autoscaling related resources from your cluster. To cleanup your EMR on EKS cluster after trying out the vertical autoscaling feature, refer to the clean-up section of the EMR on EKS workshop.

Conclusion

You can use vertical autoscaling to easily monitor resource utilization for one or more EMR on EKS jobs without any impact to your production workloads. You can use standard Kubernetes tooling including Prometheus, Grafana and kubectl to interact with and monitor vertical autoscaling on your cluster. You can also autoscale your EMR Spark jobs using recommendations that are derived based on the needs of your job, allowing you to realize cost savings and optimize cluster utilization as well as build resiliency to out-of-memory errors. Additionally, you can use it in conjunction with existing autoscaling mechanisms such as Dynamic Resource Allocation and Karpenter to effortlessly achieve optimal vertical resource assignment. Looking ahead, when Kubernetes fully supports in-place resizing of pods, vertical autoscaling will be able to take advantage of it to seamlessly scale your EMR jobs up or down, further facilitating optimal costs and cluster utilization.

To learn more about EMR on EKS vertical autoscaling and getting started with it, refer to documentation. You can also use the EMR on EKS Workshop to try out the EMR on EKS deployment option for Amazon EMR.


About the author

Rajkishan Gunasekaran is a Principal Engineer for Amazon EMR on EKS at Amazon Web Services.

Build, deploy, and run Spark jobs on Amazon EMR with the open-source EMR CLI tool

Post Syndicated from Damon Cortesi original https://aws.amazon.com/blogs/big-data/build-deploy-and-run-spark-jobs-on-amazon-emr-with-the-open-source-emr-cli-tool/

Today, we’re pleased to introduce the Amazon EMR CLI, a new command line tool to package and deploy PySpark projects across different Amazon EMR environments. With the introduction of the EMR CLI, you now have a simple way to not only deploy a wide range of PySpark projects to remote EMR environments, but also integrate with your CI/CD solution of choice.

In this post, we show how you can use the EMR CLI to create a new PySpark project from scratch and deploy it to Amazon EMR Serverless in one command.

Overview of solution

The EMR CLI is an open-source tool to help improve the developer experience of developing and deploying jobs on Amazon EMR. When you’re just getting started with Apache Spark, there are a variety of options with respect to how to package, deploy, and run jobs that can be overwhelming or require deep domain expertise. The EMR CLI provides simple commands for these actions that remove the guesswork from deploying Spark jobs. You can use it to create new projects or alongside existing PySpark projects.

In this post, we walk through creating a new PySpark project that analyzes weather data from the NOAA Global Surface Summary of Day open dataset. We’ll use the EMR CLI to do the following:

  1. Initialize the project.
  2. Package the dependencies.
  3. Deploy the code and dependencies to Amazon Simple Storage Service (Amazon S3).
  4. Run the job on EMR Serverless.

Prerequisites

For this walkthrough, you should have the following prerequisites:

  • An AWS account
  • An EMR Serverless application in the us-east-1 Region
  • An S3 bucket for your code and logs in the us-east-1 Region
  • An AWS Identity and Access Management (IAM) job role that can run EMR Serverless jobs and access S3 buckets
  • Python version >= 3.7
  • Docker

If you don’t already have an existing EMR Serverless application, you can use the following AWS CloudFormation template or use the emr bootstrap command after you’ve installed the CLI.

BDB-2063-launch-cloudformation-stack

Install the EMR CLI

You can find the source for the EMR CLI in the GitHub repo, but it’s also distributed via PyPI. It requires Python version >= 3.7 to run and is tested on macOS, Linux, and Windows. To install the latest version, use the following command:

pip3 install emr-cli

You should now be able to run the emr --help command and see the different subcommands you can use:

❯ emr --help                                                                                                
Usage: emr [OPTIONS] COMMAND [ARGS]...                                                                      
                                                                                                            
  Package, deploy, and run PySpark projects on EMR.                                                         
                                                                                                            
Options:                                                                                                    
  --help  Show this message and exit.                                                                       
                                                                                                            
Commands:                                                                                                   
  bootstrap  Bootstrap an EMR Serverless environment.                                                       
  deploy     Copy a local project to S3.                                                                    
  init       Initialize a local PySpark project.                                                            
  package    Package a project and dependencies into dist/                                                  
  run        Run a project on EMR, optionally build and deploy                                              
  status 

If you didn’t already create an EMR Serverless application, the bootstrap command can create a sample environment for you and a configuration file with the relevant settings. Assuming you used the provided CloudFormation stack, set the following environment variables using the information on the Outputs tab of your stack. Set the Region in the terminal to us-east-1 and set a few other environment variables we’ll need along the way:

export AWS_REGION=us-east-1
export APPLICATION_ID=<YOUR_EMR_SERVERLESS_APPLICATION_ID>
export JOB_ROLE_ARN=<YOUR_EMR_SERVERLESS_JOB_ROLE_ARN>
export S3_BUCKET=<YOUR_S3_BUCKET_NAME>

We use us-east-1 because that’s where the NOAA GSOD data bucket is. EMR Serverless can access S3 buckets and other AWS resources in the same Region by default. To access other services, configure EMR Serverless with VPC access.

Initialize a project

Next, we use the emr init command to initialize a default PySpark project for us in the provided directory. The default templates create a standard Python project that uses pyproject.toml to define its dependencies. In this case, we use Pandas and PyArrow in our script, so those are already pre-populated.

❯ emr init my-project
[emr-cli]: Initializing project in my-project
[emr-cli]: Project initialized.

After the project is initialized, you can run cd my-project or open the my-project directory in your code editor of choice. You should see the following set of files:

my-project  
├── Dockerfile  
├── entrypoint.py  
├── jobs  
│ └── extreme_weather.py  
└── pyproject.toml

Note that we also have a Dockerfile here. This is used by the package command to ensure that our project dependencies are built on the right architecture and operating system for Amazon EMR.

If you use Poetry to manage your Python dependencies, you can also add a --project-type poetry flag to the emr init command to create a Poetry project.

If you already have an existing PySpark project, you can use emr init --dockerfile to create the Dockerfile necessary to package things up.

Run the project

Now that we’ve got our sample project created, we need to package our dependencies, deploy the code to Amazon S3, and start a job on EMR Serverless. With the EMR CLI, you can do all of that in one command. Make sure to run the command from the my-project directory:

emr run \
--entry-point entrypoint.py \
--application-id ${APPLICATION_ID} \
--job-role ${JOB_ROLE_ARN} \
--s3-code-uri s3://${S3_BUCKET}/tmp/emr-cli-demo/ \
--build \
--wait

This command performs several actions:

  1. Auto-detects the type of Spark project in the current directory.
  2. Initiates a build for your project to package up dependencies.
  3. Copies your entry point and resulting build files to Amazon S3.
  4. Starts an EMR Serverless job.
  5. Waits for the job to finish, exiting with an error status if it fails.

You should now see the following output in your terminal as the job begins running in EMR Serverless:

[emr-cli]: Job submitted to EMR Serverless (Job Run ID: 00f8uf1gpdb12r0l)
[emr-cli]: Waiting for job to complete...
[emr-cli]: Job state is now: SCHEDULED
[emr-cli]: Job state is now: RUNNING
[emr-cli]: Job state is now: SUCCESS
[emr-cli]: Job completed successfully!

And that’s it! If you want to run the same code on Amazon EMR on Amazon Elastic Compute Cloud (Amazon EC2), you can replace --application-id with --cluster-id j-11111111. The CLI will take care of sending the right spark-submit commands to your EMR cluster.

Now let’s walk through some of the other commands.

emr package

PySpark projects can be packaged in numerous ways, from a single .py file to a complex Poetry project with various dependencies. The EMR CLI can help consistently package your projects without having to worry about the details.

For example, if you have a single .py file in your project directory, the package command doesn’t need to do anything. If, however, you have multiple .py files in a typical Python project style, the emr package command will zip these files up as a package that can later be uploaded to Amazon S3 and provided to your PySpark job using the --py-files option. If you have third party dependencies defined in pyproject.toml, emr package will create a virtual environment archive and start your EMR job with the spark.archive option.

The EMR CLI also supports Poetry for dependency management and packaging. If you have a Poetry project with a corresponding poetry.lock file, there’s nothing else you need to do. The emr package command will detect your poetry.lock file and automatically build the project using the Poetry Bundle plugin. You can use a Poetry project in two ways:

  • Create a project using the emr init command. The commands take a --project-type poetry option that create a Poetry project for you:
    ❯ emr init --project-type poetry emr-poetry  
    [emr-cli]: Initializing project in emr-poetry  
    [emr-cli]: Project initialized.
    ❯ cd emr-poetry
    ❯ poetry install

  • If you have a pre-existing project, you can use the emr init --dockerfile option, which creates a Dockerfile that is automatically used when you run emr package.

Finally, as noted earlier, the EMR CLI provides you a default Dockerfile based on Amazon Linux 2 that you can use to reliably build package artifacts that are compatible with different EMR environments.

emr deploy

The emr deploy command takes care of copying the necessary artifacts for your project to Amazon S3, so you don’t have to worry about it. Regardless of how the project is packaged, emr deploy will copy the resulting files to your Amazon S3 location of choice.

One use case for this is with CI/CD pipelines. Sometimes you want to deploy a specific version of code to Amazon S3 to be used in your data pipelines. With emr deploy, this is as simple as changing the --s3-code-uri parameter.

For example, let’s assume you’ve already packaged your project using the emr package command. Most CI/CD pipelines allow you to access the git tag. You can use that as part of the emr deploy command to deploy a new version of your artifacts. In GitHub actions, this is github.ref_name, and you can use this in an action to deploy a versioned artifact to Amazon S3. See the following code:

emr deploy \
    --entry-point entrypoint.py \
    --s3-code-uri s3://<BUCKET_NAME>/<PREFIX>/${{github.ref_name}}/

In your downstream jobs, you could then update the location of your entry point files to point to this new location when you’re ready, or you can use the emr run command discussed in the next section.

emr run

Let’s take a quick look at the emr run command. We’ve used it before to package, deploy, and run in one command, but you can also use it to run on already-deployed artifacts. Let’s look at the specific options:

❯ emr run --help                                                                                            
Usage: emr run [OPTIONS]                                                                                    
                                                                                                            
  Run a project on EMR, optionally build and deploy                                                         
                                                                                                            
Options:                                                                                                    
  --application-id TEXT     EMR Serverless Application ID                                                   
  --cluster-id TEXT         EMR on EC2 Cluster ID                                                           
  --entry-point FILE        Python or Jar file for the main entrypoint                                      
  --job-role TEXT           IAM Role ARN to use for the job execution                                       
  --wait                    Wait for job to finish                                                          
  --s3-code-uri TEXT        Where to copy/run code artifacts to/from                                        
  --job-name TEXT           The name of the job                                                             
  --job-args TEXT           Comma-delimited string of arguments to be passed                                
                            to Spark job                                                                    
                                                                                                            
  --spark-submit-opts TEXT  String of spark-submit options                                                  
  --build                   Package and deploy job artifacts                                                
  --show-stdout             Show the stdout of the job after it's finished                                  
  --help                    Show this message and exit.

If you want to run your code on EMR Serverless, the emr run command takes an --application-id and --job-role parameters. If you want to run on EMR on EC2, you only need the --cluster-id option.

Required for both options are --entry-point and --s3-code-uri. --entry-point is the main script that will be called by Amazon EMR. If you have any dependencies, --s3-code-uri is where they get uploaded to using the emr deploy command, and the EMR CLI will build the relevant spark-submit properties pointing to these artifacts.

There are a few different ways to customize the job:

  • –job-name – Allows you to specify the job or step name
  • –job-args – Allows you to provide command line arguments to your script
  • –spark-submit-opts – Allows you to add additional spark-submit options like --conf spark.jars or others
  • –show-stdout – Currently only works with single-file .py jobs on EMR on EC2, but will display stdout in your terminal after the job is complete

As we’ve seen before, --build invokes both the package and deploy commands. This makes it easier to iterate on local development when your code still needs to run remotely. You can simply use the same emr run command over and over again to build, deploy, and run your code in your environment of choice.

Future updates

The EMR CLI is under active development. Updates are currently in progress to support Amazon EMR on EKS and allow for the creation of local development environments to make local iteration of Spark jobs even easier. Feel free to contribute to the project in the GitHub repository.

Clean up

To avoid incurring future charges, stop or delete your EMR Serverless application. If you used the CloudFormation template, be sure to delete your stack.

Conclusion

With the release of the EMR CLI, we’ve made it easier for you to deploy and run Spark jobs on EMR Serverless. The utility is available as open source on GitHub. We’re planning a host of new functionalities; if there are specific requests you have, feel free to file an issue or open a pull request!


About the author

Damon is a Principal Developer Advocate on the EMR team at AWS. He’s worked with data and analytics pipelines for over 10 years and splits his team between splitting service logs and stacking firewood.

Accelerate HiveQL with Oozie to Spark SQL migration on Amazon EMR

Post Syndicated from Vinay Kumar Khambhampati original https://aws.amazon.com/blogs/big-data/accelerate-hiveql-with-oozie-to-spark-sql-migration-on-amazon-emr/

Many customers run big data workloads such as extract, transform, and load (ETL) on Apache Hive to create a data warehouse on Hadoop. Apache Hive has performed pretty well for a long time. But with advancements in infrastructure such as cloud computing and multicore machines with large RAM, Apache Spark started to gain visibility by performing better than Apache Hive.

Customers now want to migrate their Apache Hive workloads to Apache Spark in the cloud to get the benefits of optimized runtime, cost reduction through transient clusters, better scalability by decoupling the storage and compute, and flexibility. However, migration from Apache Hive to Apache Spark needs a lot of manual effort to write migration scripts and maintain different Spark job configurations.

In this post, we walk you through a solution that automates the migration from HiveQL to Spark SQL. The solution was used to migrate Hive with Oozie workloads to Spark SQL and run them on Amazon EMR for a large gaming client. You can also use this solution to develop new jobs with Spark SQL and process them on Amazon EMR. This post assumes that you have a basic understanding of Apache Spark, Hive, and Amazon EMR.

Solution overview

In our example, we use Apache Oozie, which schedules Apache Hive jobs as actions to collect and process data on a daily basis.

We migrate these Oozie workflows with Hive actions by extracting the HQL files, and dynamic and static parameters, and converting them to be Spark compliant. Manual conversion is both time consuming and error prone. To convert the HQL to Spark SQL, you’ll need to sort through existing HQLs, replace the parameters, and change the syntax for a bunch of files.

Instead, we can use automation to speed up the process of migration and reduce heavy lifting tasks, costs, and risks.

We split the solution into two primary components: generating Spark job metadata and running the SQL on Amazon EMR. The first component (metadata setup) consumes existing Hive job configurations and generates metadata such as number of parameters, number of actions (steps), and file formats. The second component consumes the generated metadata from the first component and prepares the run order of Spark SQL within a Spark session. With this solution, we support basic orchestration and scheduling with the help of AWS services like Amazon DynamoDB and Amazon Simple Storage Service (Amazon S3). We can validate the solution by running queries in Amazon Athena.

In the following sections, we walk through these components and how to use these automations in detail.

Generate Spark SQL metadata

Our batch job consists of Hive steps scheduled to run sequentially. For each step, we run HQL scripts that extract, transform, and aggregate input data into one final Hive table, which stores data in HDFS. We use the following Oozie workflow parser script, which takes the input of an existing Hive job and generates configurations artifacts needed for running SQL using PySpark.

Oozie workflow XML parser

We create a Python script to automatically parse the Oozie jobs, including workflow.xml, co-ordinator.xml, job properties, and HQL files. This script can handle many Hive actions in a workflow by organizing the metadata at the step level into separate folders. Each step includes the list of SQLs, SQL paths, and their static parameters, which are input for the solution in the next step.

The process consists of two steps:

  1. The Python parser script takes input of the existing Oozie Hive job and its configuration files.
  2. The script generates a metadata JSON file for each step.

The following diagram outlines these steps and shows sample output.

Prerequisites

You need the following prerequisites:

  • Python 3.8
  • Python packages:
    • sqlparse==0.4.2
    • jproperties==2.1.1
    • defusedxml== 0.7.1

Setup

Complete the following steps:

  1. Install Python 3.8.
  2. Create a virtual environment:
python3 -m venv /path/to/new/virtual/environment
  1. Activate the newly created virtual environment:
source /path/to/new/virtual/environment/bin/activate
  1. Git clone the project:
git clone https://github.com/aws-samples/oozie-job-parser-extract-hive-sql
  1. Install dependent packages:
cd oozie-job-parser-extract-hive-sql
pip install -r requirements.txt

Sample command

We can use the following sample command:

python xml_parser.py --base-folder ./sample_jobs/ --job-name sample_oozie_job_name --job-version V3 --hive-action-version 0.4 --coordinator-action-version 0.4 --workflow-version 0.4 --properties-file-name job.coordinator.properties

The output is as follows:

{'nameNode': 'hdfs://@{{/cluster/${{cluster}}/namenode}}:54310', 'jobTracker': '@{{/cluster/${{cluster}}/jobtracker}}:54311', 'queueName': 'test_queue', 'appName': 'test_app', 'oozie.use.system.libpath': 'true', 'oozie.coord.application.path': '${nameNode}/user/${user.name}/apps/${appName}', 'oozie_app_path': '${oozie.coord.application.path}', 'start': '${{startDate}}', 'end': '${{endDate}}', 'initial_instance': '${{startDate}}', 'job_name': '${appName}', 'timeOut': '-1', 'concurrency': '3', 'execOrder': 'FIFO', 'throttle': '7', 'hiveMetaThrift': '@{{/cluster/${{cluster}}/hivemetastore}}', 'hiveMySQL': '@{{/cluster/${{cluster}}/hivemysql}}', 'zkQuorum': '@{{/cluster/${{cluster}}/zookeeper}}', 'flag': '_done', 'frequency': 'hourly', 'owner': 'who', 'SLA': '2:00', 'job_type': 'coordinator', 'sys_cat_id': '6', 'active': '1', 'data_file': 'hdfs://${nameNode}/hive/warehouse/test_schema/test_dataset', 'upstreamTriggerDir': '/input_trigger/upstream1'}
('./sample_jobs/development/sample_oozie_job_name/step1/step1.json', 'w')

('./sample_jobs/development/sample_oozie_job_name/step2/step2.json', 'w')

Limitations

This method has the following limitations:

  • The Python script parses only HiveQL actions from the Oozie workflow.xml.
  • The Python script generates one file for each SQL statement and uses the sequence ID for file names. It doesn’t name the SQL based on the functionality of the SQL.

Run Spark SQL on Amazon EMR

After we create the SQL metadata files, we use another automation script to run them with Spark SQL on Amazon EMR. This automation script supports custom UDFs by adding JAR files to spark submit. This solution uses DynamoDB for logging the run details of SQLs for support and maintenance.

Architecture overview

The following diagram illustrates the solution architecture.

Prerequisites

You need the following prerequisites:

  • Version:
    • Spark 3.X
    • Python 3.8
    • Amazon EMR 6.1

Setup

Complete the following steps:

  1. Install the AWS Command Line Interface (AWS CLI) on your workspace by following the instructions in Installing or updating the latest version of the AWS CLI. To configure AWS CLI interaction with AWS, refer to Quick setup.
  2. Create two tables in DynamoDB: one to store metadata about jobs and steps, and another to log job runs.
    • Use the following AWS CLI command to create the metadata table in DynamoDB:
aws dynamodb create-table --region us-east-1 --table-name dw-etl-metadata --attribute-definitions '[ { "AttributeName": "id","AttributeType": "S" } , { "AttributeName": "step_id","AttributeType": "S" }]' --key-schema '[{"AttributeName": "id", "KeyType": "HASH"}, {"AttributeName": "step_id", "KeyType": "RANGE"}]' --billing-mode PROVISIONED --provisioned-throughput ReadCapacityUnits=5,WriteCapacityUnits=5

You can check on the DynamoDB console that the table dw-etl-metadata is successfully created.

The metadata table has the following attributes.

Attributes Type Comments
id String partition_key
step_id String sort_key
step_name String Step description
sql_base_path string Base path
sql_info list List of SQLs in ETL pipeline
. sql_path SQL file name
. sql_active_flag y/n
. sql_load_order Order of SQL
. sql_parameters Parameters in SQL and values
spark_config Map Spark configs
    • Use the following AWS CLI command to create the log table in DynamoDB:
aws dynamodb create-table --region us-east-1 --table-name dw-etl-pipelinelog --attribute-definitions '[ { "AttributeName":"job_run_id", "AttributeType": "S" } , { "AttributeName":"step_id", "AttributeType": "S" } ]' --key-schema '[{"AttributeName": "job_run_id", "KeyType": "HASH"},{"AttributeName": "step_id", "KeyType": "RANGE"}]' --billing-mode PROVISIONED --provisioned-throughput ReadCapacityUnits=5,WriteCapacityUnits=5

You can check on the DynamoDB console that the table dw-etl-pipelinelog is successfully created.

The log table has the following attributes.

Attributes Type Comments
job_run_id String partition_key
id String sort_key (UUID)
end_time String End time
error_description String Error in case of failure
expire Number Time to Live
sql_seq Number SQL sequence number
start_time String Start time
Status String Status of job
step_id String Job ID SQL belongs

The log table can grow quickly if there are too many jobs or if they are running frequently. We can archive them to Amazon S3 if they are no longer used or use the Time to Live feature of DynamoDB to clean up old records.

  1. Run the first command to set the variable in case you have an existing bucket that can be reused. If not, create a S3 bucket to store the Spark SQL code, which will be run by Amazon EMR.
export s3_bucket_name=unique-code-bucket-name # Change unique-code-bucket-name to a valid bucket name
aws s3api create-bucket --bucket $s3_bucket_name --region us-east-1
  1. Enable secure transfer on the bucket:
aws s3api put-bucket-policy --bucket $s3_bucket_name --policy '{"Version": "2012-10-17", "Statement": [{"Effect": "Deny", "Principal": {"AWS": "*"}, "Action": "s3:*", "Resource": ["arn:aws:s3:::unique-code-bucket-name", "arn:aws:s3:::unique-code-bucket-name/*"], "Condition": {"Bool": {"aws:SecureTransport": "false"} } } ] }' # Change unique-code-bucket-name to a valid bucket name

  1. Clone the project to your workspace:
git clone https://github.com/aws-samples/pyspark-sql-framework.git
  1. Create a ZIP file and upload it to the code bucket created earlier:
cd pyspark-sql-framework/code
zip code.zip -r *
aws s3 cp ./code.zip s3://$s3_bucket_name/framework/code.zip
  1. Upload the ETL driver code to the S3 bucket:
cd $OLDPWD/pyspark-sql-framework
aws s3 cp ./code/etl_driver.py s3://$s3_bucket_name/framework/

  1. Upload sample job SQLs to Amazon S3:
aws s3 cp ./sample_oozie_job_name/ s3://$s3_bucket_name/DW/sample_oozie_job_name/ --recursive

  1. Add a sample step (./sample_oozie_job_name/step1/step1.json) to DynamoDB (for more information, refer to Write data to a table using the console or AWS CLI):
{
  "name": "step1.q",
  "step_name": "step1",
  "sql_info": [
    {
      "sql_load_order": 5,
      "sql_parameters": {
        "DATE": "${coord:formatTime(coord:nominalTime(), 'yyyy-MM-dd')}",
        "HOUR": "${coord:formatTime(coord:nominalTime(), 'HH')}"
      },
      "sql_active_flag": "Y",
      "sql_path": "5.sql"
    },
    {
      "sql_load_order": 10,
      "sql_parameters": {
        "DATE": "${coord:formatTime(coord:nominalTime(), 'yyyy-MM-dd')}",
        "HOUR": "${coord:formatTime(coord:nominalTime(), 'HH')}"
      },
      "sql_active_flag": "Y",
      "sql_path": "10.sql"
    }
  ],
  "id": "emr_config",
  "step_id": "sample_oozie_job_name#step1",
  "sql_base_path": "sample_oozie_job_name/step1/",
  "spark_config": {
    "spark.sql.parser.quotedRegexColumnNames": "true"
  }
}

  1. In the Athena query editor, create the database base:
create database base;
  1. Copy the sample data files from the repo to Amazon S3:
    1. Copy us_current.csv:
aws s3 cp ./sample_data/us_current.csv s3://$s3_bucket_name/covid-19-testing-data/base/source_us_current/;

  1. Copy states_current.csv:
aws s3 cp ./sample_data/states_current.csv s3://$s3_bucket_name/covid-19-testing-data/base/source_states_current/;

  1. To create the source tables in the base database, run the DDLs present in the repo in the Athena query editor:
    1. Run the ./sample_data/ddl/states_current.q file by modifying the S3 path to the bucket you created.
    1. Run the ./sample_data/ddl/us_current.q file by modifying the S3 path to the bucket you created.

The ETL driver file implements the Spark driver logic. It can be invoked locally or on an EMR instance.

  1. Launch an EMR cluster.
    1. Make sure to select Use for Spark table metadata under AWS Glue Data Catalog settings.

  1. Add the following steps to EMR cluster.
aws emr add-steps --cluster-id <<cluster id created above>> --steps 'Type=CUSTOM_JAR,Name="boto3",ActionOnFailure=CONTINUE,Jar=command-runner.jar,Args=[bash,-c,"sudo pip3 install boto3"]'
aws emr add-steps --cluster-id <<cluster id created above>> --steps 'Name="sample_oozie_job_name",Jar="command-runner.jar",Args=[spark-submit,--py-files,s3://unique-code-bucket-name-#####/framework/code.zip,s3://unique-code-bucket-name-#####/framework/etl_driver.py,--step_id,sample_oozie_job_name#step1,--job_run_id,sample_oozie_job_name#step1#2022-01-01-12-00-01,  --code_bucket=s3://unique-code-bucket-name-#####/DW,--metadata_table=dw-etl-metadata,--log_table_name=dw-etl-pipelinelog,--sql_parameters,DATE=2022-02-02::HOUR=12::code_bucket=s3://unique-code-bucket-name-#####]' # Change unique-code-bucket-name to a valid bucket name

The following table summarizes the parameters for the spark step.

Step type Spark Application
Name Any Name
Deploy mode Client
Spark-submit options --py-files s3://unique-code-bucket-name-#####/framework/code.zip
Application location s3://unique-code-bucket-name-####/framework/etl_driver.py
Arguments --step_id sample_oozie_job_name#step1 --job_run_id sample_oozie_job_name#step1#2022-01-01-12-00-01 --code_bucket=s3://unique-code-bucket-name-#######/DW --metadata_table=dw-etl-metadata --log_table_name=dw-etl-pipelinelog --sql_parameters DATE=2022-02-02::HOUR=12::code_bucket=s3://unique-code-bucket-name-#######
Action on failure Continue

The following table summarizes the script arguments.

Script Argument Argument Description
deploy-mode Spark deploy mode. Client/Cluster.
name <jobname>#<stepname> Unique name for the Spark job. This can be used to identify the job on the Spark History UI.
py-files <s3 path for code>/code.zip S3 path for the code.
<s3 path for code>/etl_driver.py S3 path for the driver module. This is the entry point for the solution.
step_id <jobname>#<stepname> Unique name for the step. This refers to the step_id in the metadata entered in DynamoDB.
job_run_id <random UUID> Unique ID to identify the log entries in DynamoDB.
log_table_name <DynamoDB Log table name> DynamoDB table for storing the job run details.
code_bucket <s3 bucket> S3 path for the SQL files that are uploaded in the job setup.
metadata_table <DynamoDB Metadata table name> DynamoDB table for storing the job metadata.
sql_parameters DATE=2022-07-04::HOUR=00 Any additional or dynamic parameters expected by the SQL files.

Validation

After completion of EMR step you should have data on S3 bucket for the table base.states_daily. We can validate the data by querying the table base.states_daily in Athena.

Congratulations, you have converted an Oozie Hive job to Spark and run on Amazon EMR successfully.

Solution highlights

This solution has the following benefits:

  • It avoids boilerplate code for any new pipeline and offers less maintenance of code
  • Onboarding any new pipeline only needs the metadata set up—the DynamoDB entries and SQL to be placed in the S3 path
  • Any common modifications or enhancements can be done at the solution level, which will be reflected across all jobs
  • DynamoDB metadata provides insight into all active jobs and their optimized runtime parameters
  • For each run, this solution persists the SQL start time, end time, and status in a log table to identify issues and analyze runtimes
  • It supports Spark SQL and UDF functionality. Custom UDFs can be provided externally to the spark submit command

Limitations

This method has the following limitations:

  • The solution only supports SQL queries on Spark
  • Each SQL should be a Spark action like insert, create, drop, and so on

In this post, we explained the scenario of migrating an existing Oozie job. We can use the PySpark solution independently for any new development by creating DynamoDB entries and SQL files.

Clean up

Delete all the resources created as part of this solution to avoid ongoing charges for the resources:

  1. Delete the DynamoDB tables:
aws dynamodb delete-table --table-name dw-etl-metadata --region us-east-1
aws dynamodb delete-table --table-name dw-etl-pipelinelog --region us-east-1
  1. Delete the S3 bucket:
aws s3 rm s3://$s3_bucket_name --region us-east-1 --recursive
aws s3api create-bucket --bucket $s3_bucket_name --region us-east-1

  1. Stop the EMR cluster if it wasn’t a transient cluster:
aws emr terminate-clusters --cluster-ids <<cluster id created above>> 

Conclusion

In this post, we presented two automated solutions: one for parsing Oozie workflows and HiveQL files to generate metadata, and a PySpark solution for running SQLs using generated metadata. We successfully implemented these solutions to migrate a Hive workload to EMR Spark for a major gaming customer and achieved about 60% effort reduction.

For a Hive with Oozie to Spark migration, these solutions help complete the code conversion quickly so you can focus on performance benchmark and testing. Developing a new pipeline is also quick—you only need to create SQL logic, test it using Spark (shell or notebook), add metadata to DynamoDB, and test via the PySpark SQL solution. Overall, you can use the solution in this post to accelerate Hive to Spark code migration.


About the authors

Vinay Kumar Khambhampati is a Lead Consultant with the AWS ProServe Team, helping customers with cloud adoption. He is passionate about big data and data analytics.

Sandeep Singh is a Lead Consultant at AWS ProServe, focused on analytics, data lake architecture, and implementation. He helps enterprise customers migrate and modernize their data lake and data warehouse using AWS services.

Amol Guldagad is a Data Analytics Consultant based in India. He has worked with customers in different industries like banking and financial services, healthcare, power and utilities, manufacturing, and retail, helping them solve complex challenges with large-scale data platforms. At AWS ProServe, he helps customers accelerate their journey to the cloud and innovate using AWS analytics services.

How CyberSolutions built a scalable data pipeline using Amazon EMR Serverless and the AWS Data Lab

Post Syndicated from Constantin Scoarță original https://aws.amazon.com/blogs/big-data/how-cybersolutions-built-a-scalable-data-pipeline-using-amazon-emr-serverless-and-the-aws-data-lab/

This post is co-written by Constantin Scoarță and Horațiu Măiereanu from CyberSolutions Tech.

CyberSolutions is one of the leading ecommerce enablers in Germany. We design, implement, maintain, and optimize award-winning ecommerce platforms end to end. Our solutions are based on best-in-class software like SAP Hybris and Adobe Experience Manager, and complemented by unique services that help automate the pricing and sourcing processes.

We have built data pipelines to process, aggregate, and clean our data for our forecasting service. With the growing interest in our services, we wanted to scale our batch-based data pipeline to process more historical data on a daily basis and yet remain performant, cost-efficient, and predictable. To meet our requirements, we have been exploring the use of Amazon EMR Serverless as a potential solution.

To accelerate our initiative, we worked with the AWS Data Lab team. They offer joint engineering engagements between customers and AWS technical resources to create tangible deliverables that accelerate data and analytics initiatives. We chose to work through a Build Lab, which is a 2–5-day intensive build with a technical customer team.

In this post, we share how we engaged with the AWS Data Lab program to build a scalable and performant data pipeline using EMR Serverless.

Use case

Our forecasting and recommendation algorithm is fed with historical data, which needs to be curated, cleaned, and aggregated. Our solution was based on AWS Glue workflows orchestrating a set of AWS Glue jobs, which worked fine for our requirements. However, as our use case developed, it required more computations and bigger datasets, resulting into unpredictable performance and cost.

This pipeline performs daily extracts from our data warehouse and a few other systems, curates the data, and does some aggregations (such as daily average). Those will be consumed by our internal tools and generate recommendations accordingly. Prior to the engagement, the pipeline was processing 28 days’ worth of historical data in approximately 70 minutes. We wanted to extend that to 100 days and 365 days of data without having to extend the extraction window or factor in the resources configured.

Solution overview

While working with the Data Lab team, we decided to structure our efforts into two approaches. As a short-term improvement, we were looking into optimizing the existing pipeline based on AWS Glue extract, transform, and load (ETL) jobs, orchestrated via AWS Glue workflows. However, for the mid-term to long-term, we looked at EMR Serverless to run our forecasting data pipeline.

EMR Serverless is an option in Amazon EMR that makes it easy and cost-effective for data engineers and analysts to run petabyte-scale data analytics in the cloud. With EMR Serverless, we could run applications built using open-source frameworks such as Apache Spark (as in our case) without having to configure, manage, optimize, or secure clusters. The following factors influenced our decision to use EMR Serverless:

  • Our pipeline had minimal dependency on the AWS Glue context and its features, instead running native Apache Spark
  • EMR Serverless offers configurable drivers and workers
  • With EMR Serverless, we were able to take advantage of its cost tracking feature for applications
  • The need for managing our own Spark History Server was eliminated because EMR Serverless automatically creates a monitoring Spark UI for each job

Therefore, we planned the lab activities to be categorized as follows:

  • Improve the existing code to be more performant and scalable
  • Create an EMR Serverless application and adapt the pipeline
  • Run the entire pipeline with different date intervals

The following solution architecture depicts the high-level components we worked with during the Build Lab.

In the following sections, we dive into the lab implementation in more detail.

Improve the existing code

After examining our code decisions, we identified a step in our pipeline that consumed the most time and resources, and we decided to focus on improving it. Our target job for this optimization was the “Create Moving Average” job, which involves computing various aggregations such as averages, medians, and sums on a moving window. Initially, this step took around 4.7 minutes to process an interval of 28 days. However, running the job for larger datasets proved to be challenging – it didn’t scale well and even resulted in errors in some cases.

While reviewing our code, we focused on several areas, including checking data frames at certain steps to ensure that they contained content before proceeding. Initially, we used the count() API to achieve this, but we discovered that head() was a better alternative because it returns the first n rows only and is faster than count() for large input data. With this change, we were able to save around 15 seconds when processing 28 days’ worth of data. Additionally, we optimized our output writing by using coalesce() instead of repartition().

These changes managed to shave off some time, down to 4 minutes per run. However, we could achieve a better performance by using cache() on data frames before performing the aggregations, which materializes the data frame upon the following transformation. Additionally, we used unpersist() to free up executors’ memory after we were done with the mentioned aggregations. This led to a runtime of approximately 3.5 minutes for this job.

Following the successful code improvements, we managed to extend the data input to 100 days, 1 year, and 3 years. For this specific job, the coalesce() function wasn’t avoiding the shuffle operation and caused uneven data distribution per executor, so we switched back to repartition() for this job. By the end, we managed to get successful runs in 4.7, 12, and 57 minutes, using the same number of workers in AWS Glue (10 standard workers).

Adapt code to EMR Serverless

To observe if running the same job in EMR Serverless would yield better results, we configured an application that uses a comparable number of executors as in AWS Glue jobs. In the job configurations, we used 2 cores and 6 GB of memory for the driver and 20 executors with 4 cores and 16 GB of memory. However, we didn’t use additional ephemeral storage (by default, workers come with free 20 GB).

By the time we had the Build Lab, AWS Glue supported Apache Spark 3.1.1; however, we opted to use Spark 3.2.0 (Amazon EMR version 6.6.0) instead. Additionally, during the Build Lab, only x86_64 EMR Serverless applications were available, although it now also supports arm64-based architecture.

We adapted the code utilizing AWS Glue context to work with native Apache Spark. For instance, we needed to overwrite existing partitions and sync updates with the AWS Glue Data Catalog, especially when old partitions were replaced and new ones were added. We achieved this by setting spark.conf.set("spark.sql.sources.partitionOverwriteMode", "DYNAMIC") and using an MSCK REPAIR query to sync the relevant table. Similarly, we replaced the read and write operations to rely on Apache Spark APIs.

During the tests, we intentionally disabled the fine-grained auto scaling feature of EMR Serverless while running jobs, in order to observe how the code would perform with the same number of workers but different date intervals. We achieved that by setting spark.dynamicAllocation.enabled to disabled (the default is true).

For the same code, number of workers, and data inputs, we managed to get better performance results with EMR Serverless, which were 2.5, 2.9, 6, and 16 minutes for 28 days, 100 days, 1 year, and 3 years, respectively.

Run the entire pipeline with different date intervals

Because the code for our jobs was implemented in a modular fashion, we were able to quickly test all of them with EMR Serverless and then link them together to orchestrate the pipeline via Amazon Managed Workflows for Apache Airflow (Amazon MWAA).

Regarding performance, our previous pipeline using AWS Glue took around 70 minutes to run with our regular workload. However, our new pipeline, powered by Amazon MWAA-backed EMR Serverless, achieved similar results in approximately 60 minutes. Although this is a notable improvement, the most significant benefit was our ability to scale up to process larger amounts of data using the same number of workers. For instance, processing 1 year’s worth of data only took around 107 minutes to complete.

Conclusion and key takeaways

In this post, we outlined the approach taken by the CyberSolutions team in conjunction with the AWS Data Lab to create a high-performing and scalable demand forecasting pipeline. By using optimized Apache Spark jobs on customizable EMR Serverless workers, we were able to surpass the performance of our previous workflow. Specifically, the new setup resulted in 50–72% better performance for most jobs when processing 100 days of data, resulting in an overall cost savings of around 38%.

EMR Serverless applications’ features helped us have better control over cost. For example, we configured the pre-initialized capacity, which resulted in job start times of 1–4 seconds. And we set up the application behavior to start with the first submitted job and automatically stop after a configurable idle time.

As a next step, we are actively testing AWS Graviton2-based EMR applications, which come with more performance gains and lower cost.


About the Authors

 Constantin Scoarță is a Software Engineer at CyberSolutions Tech. He is mainly focused on building data cleaning and forecasting pipelines. In his spare time, he enjoys hiking, cycling, and skiing.

Horațiu Măiereanu is the Head of Python Development at CyberSolutions Tech. His team builds smart microservices for ecommerce retailers to help them improve and automate their workloads. In his free time, he likes hiking and traveling with his family and friends.

Ahmed Ewis is a Solutions Architect at the AWS Data Lab. He helps AWS customers design and build scalable data platforms using AWS database and analytics services. Outside of work, Ahmed enjoys playing with his child and cooking.
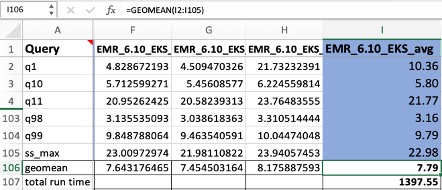
Amazon EMR on EKS widens the performance gap: Run Apache Spark workloads 5.37 times faster and at 4.3 times lower cost

Post Syndicated from Melody Yang original https://aws.amazon.com/blogs/big-data/amazon-emr-on-eks-widens-the-performance-gap-run-apache-spark-workloads-5-37-times-faster-and-at-4-3-times-lower-cost/

Amazon EMR on EKS provides a deployment option for Amazon EMR that allows organizations to run open-source big data frameworks on Amazon Elastic Kubernetes Service (Amazon EKS). With EMR on EKS, Spark applications run on the Amazon EMR runtime for Apache Spark. This performance-optimized runtime offered by Amazon EMR makes your Spark jobs run fast and cost-effectively. Also, you can run other types of business applications, such as web applications and machine learning (ML) TensorFlow workloads, on the same EKS cluster. EMR on EKS simplifies your infrastructure management, maximizes resource utilization, and reduces your cost.

We have been continually improving the Spark performance in each Amazon EMR release to further shorten job runtime and optimize users’ spending on their Amazon EMR big data workloads. As of the Amazon EMR 6.5 release in January 2022, the optimized Spark runtime was 3.5 times faster than OSS Spark v3.1.2 with up to 61% lower costs. Amazon EMR 6.10 is now 1.59 times faster than Amazon EMR 6.5, which has resulted in 5.37 times better performance than OSS Spark v3.3.1 with 76.8% cost savings.

In this post, we describe the benchmark setup and results on top of the EMR on EKS environment. We also share a Spark benchmark solution that suits all Amazon EMR deployment options, so you can replicate the process in your environment for your own performance test cases. The solution uses the TPC-DS dataset and unmodified data schema and table relationships, but derives queries from TPC-DS to support the SparkSQL test cases. It is not comparable to other published TPC-DS benchmark results.

Benchmark setup

To compare with the EMR on EKS 6.5 test result detailed in the post Amazon EMR on Amazon EKS provides up to 61% lower costs and up to 68% performance improvement for Spark workloads, this benchmark for the latest release (Amazon EMR 6.10) uses the same approach: a TPC-DS benchmark framework and the same size of TPC-DS input dataset from an Amazon Simple Storage Service (Amazon S3) location. For the source data, we chose the 3 TB scale factor, which contains 17.7 billion records, approximately 924 GB compressed data in Parquet file format. The setup instructions and technical details can be found in the aws-sample repository.

In summary, the entire performance test job includes 104 SparkSQL queries and was completed in approximately 24 minutes (1,397.55 seconds) with an estimated running cost of $5.08 USD. The input data and test result outputs were both stored on Amazon S3.

The job has been configured with the following parameters that match with the previous Amazon EMR 6.5 test:

  • EMR release – EMR 6.10.0
  • Hardware:
    • Compute – 6 X c5d.9xlarge instances, 216 vCPU, 432 GiB memory in total
    • Storage – 6 x 900 NVMe SSD build-in storage
    • Amazon EBS root volume – 6 X 20GB gp2
  • Spark configuration:
    • Driver pod – 1 instance among other 7 executors on a shared Amazon Elastic Compute Cloud (Amazon EC2) node:
      • spark.driver.cores=4
      • spark.driver.memory=5g
      • spark.kubernetes.driver.limit.cores=4.1
    • Executor pod – 47 instances distributed over 6 EC2 nodes
      • spark.executor.cores=4
      • spark.executor.memory=6g
      • spark.executor.memoryOverhead=2G
      • spark.kubernetes.executor.limit.cores=4.3
  • Metadata store – We use Spark’s in-memory data catalog to store metadata for TPC-DS databases and tables—spark.sql.catalogImplementation is set to the default value in-memory. The fact tables are partitioned by the date column, which consists of partitions ranging from 200–2,100. No statistics are pre-calculated for these tables.

Results

A single test session consists of 104 Spark SQL queries that were run sequentially. We ran each Spark runtime session (EMR runtime for Apache Spark, OSS Apache Spark) three times. The Spark benchmark job produces a CSV file to Amazon S3 that summarizes the median, minimum, and maximum runtime for each individual query.

The way we calculate the final benchmark results (geomean and the total job runtime) are based on arithmetic means. We take the mean of the median, minimum, and maximum values per query using the formula of AVERAGE(), for example AVERAGE(F2:H2). Then we take a geometric mean of the average column I by the formula GEOMEAN(I2:I105) and SUM(I2:I105) for the total runtime.

Previously, we observed that EMR on EKS 6.5 is 3.5 times faster than OSS Spark on EKS, and costs 2.6 times less. From this benchmark, we found that the gap has widened: EMR on EKS 6.10 now provides a 5.37 times performance improvement on average and up to 11.61 times improved performance for individual queries over OSS Spark 3.3.1 on Amazon EKS. From the running cost perspective, we see the significant reduction by 4.3 times.

The following graph shows the performance improvement of Amazon EMR 6.10 compared to OSS Spark 3.3.1 at the individual query level. The X-axis shows the name of each query, and the Y-axis shows the total runtime in seconds on logarithmic scale. The most significant performance gains for eight queries (q14a, q14b, q23b, q24a, q24b, q4, q67, q72) demonstrated over 10 times faster for the runtime.

Job cost estimation

The cost estimate doesn’t account for Amazon S3 storage, or PUT and GET requests. The Amazon EMR on EKS uplift calculation is based on the hourly billing information provided by AWS Cost Explorer.

  • c5d.9xlarge hourly price – $1.728
  • Number of EC2 instances – 6
  • Amazon EBS storage per GB-month – $0.10
  • Amazon EBS gp2 root volume – 20GB
  • Job run time (hour)
    • OSS Spark 3.3.1 – 2.09
    • EMR on EKS 6.5.0 – 0.68
    • EMR on EKS 6.10.0 – 0.39
Cost component OSS Spark 3.3.1 on EKS EMR on EKS 6.5.0 EMR on EKS 6.10.0
Amazon EC2 $21.67 $7.05 $4.04
EMR on EKS $ – $1.57 $0.99
Amazon EKS $0.21 $0.07 $0.04
Amazon EBS root volume $0.03 $0.01 $0.01
Total $21.88 $8.70 $5.08

Performance enhancements

Although we improve on Amazon EMR’s performance with each release, Amazon EMR 6.10 contained many performance optimizations, making it 5.37 times faster than OSS Spark v3.3.1 and 1.59 times faster than our first release of 2022, Amazon EMR 6.5. This additional performance boost was achieved through the addition of multiple optimizations, including:

  • Enhancements to join performance, such as the following:
    • Shuffle-Hash Joins (SHJ) are more CPU and I/O efficient than Shuffle-Sort-Merge Joins (SMJ) when the costs of building and probing the hash table, including the availability of memory, are less than the cost of sorting and performing the merge join. However, SHJs have drawbacks, such as risk of out of memory errors due to its inability to spill to disk, which prevents them from being aggressively used across Spark in place of SMJs by default. We have optimized our use of SHJs so that they can be applied to more queries by default than in OSS Spark.
    • For some query shapes, we have eliminated redundant joins and enabled the use of more performant join types.
  • We have reduced the amount of data shuffled before joins and the potential for data explosions after joins by selectively pushing down aggregates through joins.
  • Bloom filters can improve performance by reducing the amount of data shuffled before the join. However, there are cases where bloom filters are not beneficial and can even regress performance. For example, the bloom filter introduces a dependency between stages that reduces query parallelism, but may end up filtering out relatively little data. Our enhancements allow bloom filters to be safely applied to more query plans than OSS Spark.
  • Aggregates with high-precision decimals are computationally intensive in OSS Spark. We optimized high-precision decimal computations to increasing their performance.

Summary

With version 6.10, Amazon EMR has further enhanced the EMR runtime for Apache Spark in comparison to our previous benchmark tests for Amazon EMR version 6.5. When running EMR workloads with the the equivalent Apache Spark version 3.3.1, we observed 1.59 times better performance with 41.6% cheaper costs than Amazon EMR 6.5.

With our TPC-DS benchmark setup, we observed a significant performance increase of 5.37 times and a cost reduction of 4.3 times using EMR on EKS compared to OSS Spark.

To learn more and get started with EMR on EKS, try out the EMR on EKS Workshop and visit the EMR on EKS Best Practices Guide page.


About the Authors

Melody YangMelody Yang is a Senior Big Data Solution Architect for Amazon EMR at AWS. She is an experienced analytics leader working with AWS customers to provide best practice guidance and technical advice in order to assist their success in data transformation. Her areas of interests are open-source frameworks and automation, data engineering and DataOps.

Ashok Chintalapati is a software development engineer for Amazon EMR at Amazon Web Services.

Push Amazon EMR step logs from Amazon EC2 instances to Amazon CloudWatch logs

Post Syndicated from Nausheen Sayed original https://aws.amazon.com/blogs/big-data/push-amazon-emr-step-logs-from-amazon-ec2-instances-to-amazon-cloudwatch-logs/

Amazon EMR is a big data service offered by AWS to run Apache Spark and other open-source applications on AWS to build scalable data pipelines in a cost-effective manner. Monitoring the logs generated from the jobs deployed on EMR clusters is essential to help detect critical issues in real time and identify root causes quickly.

Pushing those logs into Amazon CloudWatch enables you to centralize and drive actionable intelligence from your logs to address operational issues without needing to provision servers or manage software. You can instantly begin writing queries with aggregations, filters, and regular expressions. In addition, you can visualize time series data, drill down into individual log events, and export query results to CloudWatch dashboards.

To ingest logs that are persisted on the Amazon Elastic Compute Cloud (Amazon EC2) instances of an EMR cluster into CloudWatch, you can use the CloudWatch agent. This provides a simple way to push logs from an EC2 instance to CloudWatch.

The CloudWatch agent is a software package that autonomously and continuously runs on your servers. You can install and configure the CloudWatch agent to collect system and application logs from EC2 instances, on-premises hosts, and containerized applications. CloudWatch processes and stores the logs collected by the CloudWatch agent, which further helps with the performance and health monitoring of your infrastructure and applications.

In this post, we create an EMR cluster and centralize the EMR step logs of the jobs in CloudWatch. This will make it easier for you to manage your EMR cluster, troubleshoot issues, and monitor performance. This solution is particularly helpful if you want to use CloudWatch to collect and visualize real-time logs, metrics, and event data, streamlining your infrastructure and application maintenance.

Overview of solution

The solution presented in this post is based on a specific configuration where the EMR step concurrency level is set to 1. This means that only one step is run at a time on the cluster. It’s important to note that if the EMR step concurrency level is set to a value greater than 1, the solution may not work as expected. We highly recommend verifying your EMR step concurrency configuration before implementing the solution presented in this post.

The following diagram illustrates the solution architecture.

Solution Architecture Diagram

The workflow includes the following steps:

  1. Users start an Apache Spark EMR job, creating a step on the EMR cluster. Using Apache Spark, the workload is distributed across the different nodes of the EMR cluster.
  2. In each node (EC2 instance) of the cluster, a CloudWatch agent watches different logs directories, capturing new entries in the log files and pushing them to CloudWatch.
  3. Users can view the step logs accessing the different log groups from the CloudWatch console. The step logs written by Amazon EMR are as follows:
    • controller — Information about the processing of the step. If your step fails while loading, you can find the stack trace in this log.
    • stderr — The standard error channel of Spark while it processes the step.
    • stdout — The standard output channel of Spark while it processes the step.

We provide an AWS CloudFormation template in this post as a general guide. The template demonstrates how to configure a CloudWatch agent on Amazon EMR to push Spark logs to CloudWatch. You can review and customize it as needed to include your Amazon EMR security configurations. As a best practice, we recommend including your Amazon EMR security configurations in the template to encrypt data in transit.

You should also be aware that some of the resources deployed by this stack incur costs when they remain in use.

In the next sections, we go through the following steps:

  1. Create and upload the bootstrap script to an Amazon Simple Storage Service (Amazon S3) bucket.
  2. Use the CloudFormation template to create the following resources:
  3. Monitor the Spark logs on the CloudWatch console.

Prerequisites

This post assumes that you have the following:

Create and upload the bootstrap script to an S3 bucket

For more information, see Uploading objects and Installing and running the CloudWatch agent on your servers.

To create and the upload the bootstrap script, complete the following steps:

  1. Create a local file named bootstrap_cloudwatch_agent.sh with the following content:
    #!/bin/bash
    
    echo -e 'Installing CloudWatch Agent... \n'
    sudo rpm -Uvh --force https://s3.amazonaws.com/amazoncloudwatch-agent/amazon_linux/amd64/latest/amazon-cloudwatch-agent.rpm
    
    echo -e 'Starting CloudWatch Agent... \n'
    sudo amazon-cloudwatch-agent-ctl -a fetch-config -m ec2 -c ssm:AmazonCloudWatch-Config.json -s

  2. On the Amazon S3 console, choose your S3 bucket.
  3. On the Objects tab, choose Upload.
  4. Choose Add files, then choose the bootstrap script.
  5. Choose Upload, then choose the file name: bootstrap_cloudwatch_agent.sh.
  6. Choose Copy S3 URI. We use this value in a later step.

Provision resources with the CloudFormation template

Choose Launch Stack to launch a CloudFormation stack in your account and deploy the template:

This template creates an IAM role, IAM instance profile, Systems Manager parameter, and EMR cluster. The cluster starts the Spark PI estimation example application. You will be billed for the AWS resources used if you create a stack from this template.

The CloudFormation wizard will ask you to modify or provide these parameters:

  • InstanceType – The type of instance for all instance groups. The default is m4.xlarge.
  • InstanceCountCore – The number of instances in the core instance group. The default is 2.
  • EMRReleaseLabel – The Amazon EMR release label you want to use. The default is emr-6.9.0.
  • BootstrapScriptPath – The S3 path of your CloudWatch agent installation bootstrap script that you copied earlier.
  • Subnet – The EC2 subnet where the cluster launches. You must provide this parameter.
  • EC2KeyPairName – An optional EC2 keypair for connecting to cluster nodes, as an alternative to Session Manager.

Monitor the log streams

After the CloudFormation stack deploys successfully, on the CloudWatch console, choose Log groups in the navigation pane. Then filter the log groups by the prefix /aws/emr/master.

choose Log groups in the navigation pane

The ID in the log group corresponds to the EC2 instance ID of the EMR primary node. If you have multiple EMR clusters, you can use this ID to identify a particular EMR cluster, based on the primary node ID.

In the log group, you will find the three different log streams.

In the log group, you will find the three different log streams.

The log streams contain the following information:

  • step-stdout – The standard output channel of Spark while it processes the step.
    The standard output channel of Spark while it processes the step
  • step-stderr – The standard error channel of Spark while it processes the step.
    The standard error channel of Spark while it processes the step.
  • step-controller – Information about the processing of the step. If your step fails while loading, you can find the stack trace in this log.
    Information about the processing of the step.

Clean up

To avoid future charges in your account, delete the resources you created in this walkthrough. The EMR cluster will incur charges as long as the cluster is active, so stop it when you’re done.

  1. On the CloudFormation console, in the navigation pane, choose Stacks.
  2. Choose the stack you launched (EMR-CloudWatch-Demo), then choose Delete.
  3. Empty the S3 bucket you created.
  4. Delete the S3 bucket you created.

Conclusion

Now that you have completed the steps in this walkthrough, you have the CloudWatch agent running on your cluster hosts and configured to push EMR step logs to CloudWatch. With this feature, you can effectively monitor the health and performance of your Spark jobs running on Amazon EMR, detecting critical issues in real time and identifying root causes quickly.

You can package and deploy this solution through a CloudFormation template like this example template, which creates the IAM instance profile role, Systems Manager parameter, and EMR cluster.

To take this further, consider using these logs in CloudWatch alarms for alerts on a log group-metric filter. You could collect them with other alarms into a composite alarm or configure alarm actions such as sending Amazon Simple Notification Service (Amazon SNS) notifications to trigger event-driven processes such as AWS Lambda functions.


About the Author

Ennio Pastore is a Senior Data Architect on the AWS Data Lab team. He is an enthusiast of everything related to new technologies that have a positive impact on businesses and general livelihood. Ennio has over 10 years of experience in data analytics. He helps companies define and implement data platforms across industries, such as telecommunications, banking, gaming, retail, and insurance.

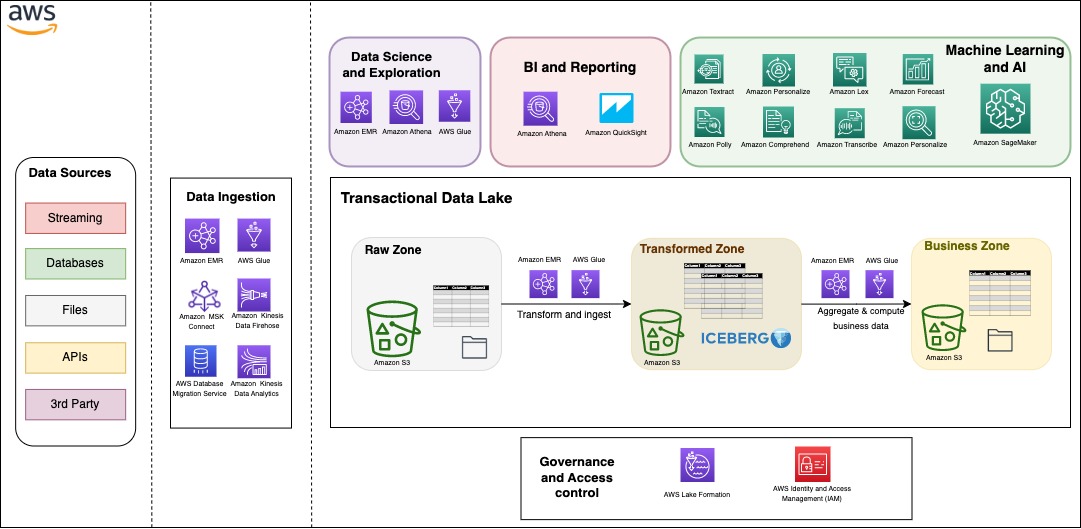
AWS Week in Review – March 20, 2023

Post Syndicated from Danilo Poccia original https://aws.amazon.com/blogs/aws/aws-week-in-review-march-20-2023/

This post is part of our Week in Review series. Check back each week for a quick roundup of interesting news and announcements from AWS!

A new week starts, and Spring is almost here! If you’re curious about AWS news from the previous seven days, I got you covered.

Last Week’s Launches
Here are the launches that got my attention last week:

Picture of an S3 bucket and AWS CEO Adam Selipsky.Amazon S3 – Last week there was AWS Pi Day 2023 celebrating 17 years of innovation since Amazon S3 was introduced on March 14, 2006. For the occasion, the team released many new capabilities:

Amazon Linux 2023 – Our new Linux-based operating system is now generally available. Sébastien’s post is full of tips and info.

Application Auto Scaling – Now can use arithmetic operations and mathematical functions to customize the metrics used with Target Tracking policies. You can use it to scale based on your own application-specific metrics. Read how it works with Amazon ECS services.

AWS Data Exchange for Amazon S3 is now generally available – You can now share and find data files directly from S3 buckets, without the need to create or manage copies of the data.

Amazon Neptune – Now offers a graph summary API to help understand important metadata about property graphs (PG) and resource description framework (RDF) graphs. Neptune added support for Slow Query Logs to help identify queries that need performance tuning.

Amazon OpenSearch Service – The team introduced security analytics that provides new threat monitoring, detection, and alerting features. The service now supports OpenSearch version 2.5 that adds several new features such as support for Point in Time Search and improvements to observability and geospatial functionality.

AWS Lake Formation and Apache Hive on Amazon EMR – Introduced fine-grained access controls that allow data administrators to define and enforce fine-grained table and column level security for customers accessing data via Apache Hive running on Amazon EMR.

Amazon EC2 M1 Mac Instances – You can now update guest environments to a specific or the latest macOS version without having to tear down and recreate the existing macOS environments.

AWS Chatbot – Now Integrates With Microsoft Teams to simplify the way you troubleshoot and operate your AWS resources.

Amazon GuardDuty RDS Protection for Amazon Aurora – Now generally available to help profile and monitor access activity to Aurora databases in your AWS account without impacting database performance

AWS Database Migration Service – Now supports validation to ensure that data is migrated accurately to S3 and can now generate an AWS Glue Data Catalog when migrating to S3.

AWS Backup – You can now back up and restore virtual machines running on VMware vSphere 8 and with multiple vNICs.

Amazon Kendra – There are new connectors to index documents and search for information across these new content: Confluence Server, Confluence Cloud, Microsoft SharePoint OnPrem, Microsoft SharePoint Cloud. This post shows how to use the Amazon Kendra connector for Microsoft Teams.

For a full list of AWS announcements, be sure to keep an eye on the What’s New at AWS page.

Other AWS News
A few more blog posts you might have missed:

Example of a geospatial query.Women founders Q&A – We’re talking to six women founders and leaders about how they’re making impacts in their communities, industries, and beyond.

What you missed at that 2023 IMAGINE: Nonprofit conference – Where hundreds of nonprofit leaders, technologists, and innovators gathered to learn and share how AWS can drive a positive impact for people and the planet.

Monitoring load balancers using Amazon CloudWatch anomaly detection alarms – The metrics emitted by load balancers provide crucial and unique insight into service health, service performance, and end-to-end network performance.

Extend geospatial queries in Amazon Athena with user-defined functions (UDFs) and AWS Lambda – Using a solution based on Uber’s Hexagonal Hierarchical Spatial Index (H3) to divide the globe into equally-sized hexagons.

How cities can use transport data to reduce pollution and increase safety – A guest post by Rikesh Shah, outgoing head of open innovation at Transport for London.

For AWS open-source news and updates, here’s the latest newsletter curated by Ricardo to bring you the most recent updates on open-source projects, posts, events, and more.

Upcoming AWS Events
Here are some opportunities to meet:

AWS Public Sector Day 2023 (March 21, London, UK) – An event dedicated to helping public sector organizations use technology to achieve more with less through the current challenging conditions.

Women in Tech at Skills Center Arlington (March 23, VA, USA) – Let’s celebrate the history and legacy of women in tech.

The AWS Summits season is warming up! You can sign up here to know when registration opens in your area.

That’s all from me for this week. Come back next Monday for another Week in Review!

Danilo

Build a serverless transactional data lake with Apache Iceberg, Amazon EMR Serverless, and Amazon Athena

Post Syndicated from Houssem Chihoub original https://aws.amazon.com/blogs/big-data/build-a-serverless-transactional-data-lake-with-apache-iceberg-amazon-emr-serverless-and-amazon-athena/

Since the deluge of big data over a decade ago, many organizations have learned to build applications to process and analyze petabytes of data. Data lakes have served as a central repository to store structured and unstructured data at any scale and in various formats. However, as data processing at scale solutions grow, organizations need to build more and more features on top of their data lakes. One important feature is to run different workloads such as business intelligence (BI), Machine Learning (ML), Data Science and data exploration, and Change Data Capture (CDC) of transactional data, without having to maintain multiple copies of data. Additionally, the task of maintaining and managing files in the data lake can be tedious and sometimes complex.

Table formats like Apache Iceberg provide solutions to these issues. They enable transactions on top of data lakes and can simplify data storage, management, ingestion, and processing. These transactional data lakes combine features from both the data lake and the data warehouse. You can simplify your data strategy by running multiple workloads and applications on the same data in the same location. However, using these formats requires building, maintaining, and scaling infrastructure and integration connectors that can be time-consuming, challenging, and costly.

In this post, we show how you can build a serverless transactional data lake with Apache Iceberg on Amazon Simple Storage Service (Amazon S3) using Amazon EMR Serverless and Amazon Athena. We provide an example for data ingestion and querying using an ecommerce sales data lake.

Apache Iceberg overview

Iceberg is an open-source table format that brings the power of SQL tables to big data files. It enables ACID transactions on tables, allowing for concurrent data ingestion, updates, and queries, all while using familiar SQL. Iceberg employs internal metadata management that keeps track of data and empowers a set of rich features at scale. It allows you to time travel and roll back to old versions of committed data transactions, control the table’s schema evolution, easily compact data, and employ hidden partitioning for fast queries.

Iceberg manages files on behalf of the user and unlocks use cases such as:

  • Concurrent data ingestion and querying, including streaming and CDC
  • BI and reporting with expressive simple SQL
  • Empowering ML feature stores and training sets
  • Compliance and regulations workloads, such as GDPR find and forget
  • Reinstating late-arriving data, which is dimensions data arriving later than the fact data. For example, the reason for a flight delay may arrive well after the fact that the fligh is delayed.
  • Tracking data changes and rollback

Build your transactional data lake on AWS

You can build your modern data architecture with a scalable data lake that integrates seamlessly with an Amazon Redshift powered cloud warehouse. Moreover, many customers are looking for an architecture where they can combine the benefits of a data lake and a data warehouse in the same storage location. In the following figure, we show a comprehensive architecture that uses the modern data architecture strategy on AWS to build a fully featured transactional data lake. AWS provides flexibility and a wide breadth of features to ingest data, build AI and ML applications, and run analytics workloads without having to focus on the undifferentiated heavy lifting.

Data can be organized into three different zones, as shown in the following figure. The first zone is the raw zone, where data can be captured from the source as is. The transformed zone is an enterprise-wide zone to host cleaned and transformed data in order to serve multiple teams and use cases. Iceberg provides a table format on top of Amazon S3 in this zone to provide ACID transactions, but also to allow seamless file management and provide time travel and rollback capabilities. The business zone stores data specific to business cases and applications aggregated and computed from data in the transformed zone.

One important aspect to a successful data strategy for any organization is data governance. On AWS, you can implement a thorough governance strategy with fine-grained access control to the data lake with AWS Lake Formation.

Serverless architecture overview

In this section, we show you how to ingest and query data in your transactional data lake in a few steps. EMR Serverless is a serverless option that makes it easy for data analysts and engineers to run Spark-based analytics without configuring, managing, and scaling clusters or servers. You can run your Spark applications without having to plan capacity or provision infrastructure, while paying only for your usage. EMR Serverless supports Iceberg natively to create tables and query, merge, and insert data with Spark. In the following architecture diagram, Spark transformation jobs can load data from the raw zone or source, apply the cleaning and transformation logic, and ingest data in the transformed zone on Iceberg tables. Spark code can run instantaneously on an EMR Serverless application, which we demonstrate later in this post.

The Iceberg table is synced with the AWS Glue Data Catalog. The Data Catalog provides a central location to govern and keep track of the schema and metadata. With Iceberg, ingestion, update, and querying processes can benefit from atomicity, snapshot isolation, and managing concurrency to keep a consistent view of data.

Athena is a serverless, interactive analytics service built on open-source frameworks, supporting open-table and file formats. Athena provides a simplified, flexible way to analyze petabytes of data where it lives. To serve BI and reporting analysis, it allows you to build and run queries on Iceberg tables natively and integrates with a variety of BI tools.

Sales data model

Star schema and its variants are very popular for modeling data in data warehouses. They implement one or more fact tables and dimension tables. The fact table stores the main transactional data from the business logic with foreign keys to dimensional tables. Dimension tables hold additional complementary data to enrich the fact table.

In this post, we take the example of sales data from the TPC-DS benchmark. We zoom in on a subset of the schema with the web_sales fact table, as shown in the following figure. It stores numeric values about sales cost, ship cost, tax, and net profit. Additionally, it has foreign keys to dimensional tables like date_dim, time_dim, customer, and item. These dimensional tables store records that give more details. For instance, you can show when a sale took place by which customer for which item.

Dimension-based models have been used extensively to build data warehouses. In the following sections, we show how to implement such a model on top of Iceberg, providing data warehousing features on top of your data lake, and run different workloads in the same location. We provide a complete example of building a serverless architecture with data ingestion using EMR Serverless and Athena using TPC-DS queries.

Prerequisites

For this walkthrough, you should have the following prerequisites:

  • An AWS account
  • Basic knowledge about data management and SQL

Deploy solution resources with AWS CloudFormation

We provide an AWS CloudFormation template to deploy the data lake stack with the following resources:

  • Two S3 buckets: one for scripts and query results, and one for the data lake storage
  • An Athena workgroup
  • An EMR Serverless application
  • An AWS Glue database and tables on external public S3 buckets of TPC-DS data
  • An AWS Glue database for the data lake
  • An AWS Identity and Access Management (IAM) role and polices

Complete the following steps to create your resources:

  1. Launch the CloudFormation stack:

Launch Button

This automatically launches AWS CloudFormation in your AWS account with the CloudFormation template. It prompts you to sign in as needed.

  1. Keep the template settings as is.
  2. Check the I acknowledge that AWS CloudFormation might create IAM resources box.
  3. Choose Submit

When the stack creation is complete, check the Outputs tab of the stack to verify the resources created.

Upload Spark scripts to Amazon S3

Complete the following steps to upload your Spark scripts:

  1. Download the following scripts: ingest-iceberg.py and update-item.py.
  2. On the Amazon S3 console, go to the datalake-resources-<AccountID>-us-east-1 bucket you created earlier.
  3. Create a new folder named scripts.
  4. Upload the two PySpark scripts: ingest-iceberg.py and update-item.py.

Create Iceberg tables and ingest TPC-DS data

To create your Iceberg tables and ingest the data, complete the following steps:

  1. On the Amazon EMR console, choose EMR Serverless in the navigation pane.
  2. Choose Manage applications.
  3. Choose the application datalake-app.

  1. Choose Start application.

Once started, it will provision the pre-initialized capacity as configured at creation (one Spark driver and two Spark executors). The pre-initialized capacity are resources that will be provisioned when you start your application. They can be used instantly when you submit jobs. However, they incur charges even if they’re not used when the application is in a started state. By default, the application is set to stop when idle for 15 minutes.

Now that the EMR application has started, we can submit the Spark ingest job ingest-iceberg.py. The job creates the Iceberg tables and then loads data from the previously created AWS Glue Data Catalog tables on TPC-DS data in an external bucket.

  1. Navigate to the datalake-app.
  2. On the Job runs tab, choose Submit job.

  1. For Name, enter ingest-data.
  2. For Runtime role, choose the IAM role created by the CloudFormation stack.
  3. For Script location, enter the S3 path for your resource bucket (datalake-resource-<####>-us-east-1>scripts>ingest-iceberg.py).

  1. Under Spark properties, choose Edit in text.
  2. Enter the following properties, replacing <BUCKET_NAME> with your data lake bucket name datalake-<####>-us-east-1 (not datalake-resources)
--conf spark.executor.cores=2 --conf spark.executor.memory=4g --conf spark.driver.cores=2 --conf spark.driver.memory=8g --conf spark.executor.instances=2 --conf spark.jars=/usr/share/aws/iceberg/lib/iceberg-spark3-runtime.jar --conf spark.sql.extensions=org.apache.iceberg.spark.extensions.IcebergSparkSessionExtensions --conf spark.sql.catalog.dev.warehouse=s3://<BUCKET_NAME>/warehouse --conf spark.sql.catalog.dev=org.apache.iceberg.spark.SparkCatalog --conf spark.sql.catalog.dev.catalog-impl=org.apache.iceberg.aws.glue.GlueCatalog --conf spark.sql.catalog.glue_catalog.lock-impl=org.apache.iceberg.aws.glue.DynamoLockManager --conf spark.sql.catalog.glue_catalog.lock.table=myIcebergLockTab --conf spark.dynamicAllocation.maxExecutors=8 --conf spark.driver.maxResultSize=1G --conf spark.hadoop.hive.metastore.client.factory.class=com.amazonaws.glue.catalog.metastore.AWSGlueDataCatalogHiveClientFactory

  1. Submit the job.

You can monitor the job progress.

Query Iceberg tables

In this section, we provide examples of data warehouse queries from TPC-DS on the Iceberg tables.

  1. On the Athena console, open the query editor.
  2. For Workgroup, switch to DatalakeWorkgroup.

  1. Choose Acknowledge.

The queries in DatalakeWorkgroup will run on Athena engine version 3.

  1. On the Saved queries tab, choose a query to run on your Iceberg tables.

The following queries are listed:
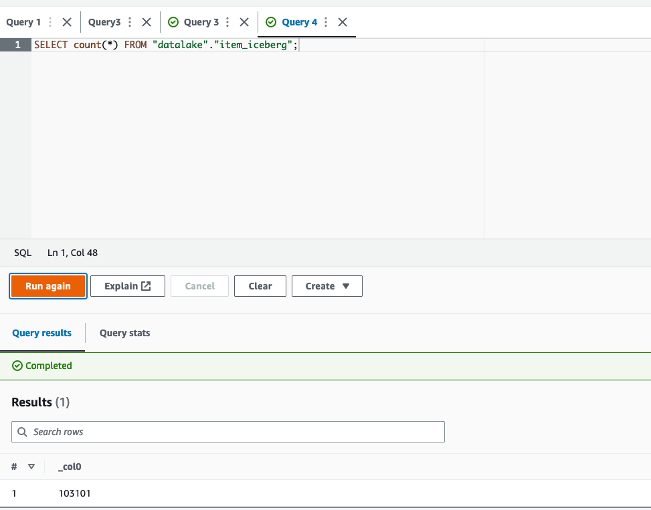
  • Query3 – Report the total extended sales price per item brand of a specific manufacturer for all sales in a specific month of the year.
  • Query45 – Report the total web sales for customers in specific zip codes, cities, counties, or states, or specific items for a given year and quarter.
  • Query52 – Report the total of extended sales price for all items of a specific brand in a specific year and month.
  • Query6 – List all the states with at least 10 customers who during a given month bought items with the price tag at least 20% higher than the average price of items in the same category.
  • Query75 – For 2 consecutive years, track the sales of items by brand, class, and category.
  • Query86a – Roll up the web sales for a given year by category and class, and rank the sales among peers within the parent. For each group, compute the sum of sales and location with the hierarchy and rank within the group.

These queries are examples of queries used in decision-making and reporting in an organization. You can run them in the order you want. For this post, we start with Query3.

  1. Before you run the query, confirm that Database is set to datalake.

  1. Now you can run the query.

  1. Repeat these steps to run the other queries.

Update the item table

After running the queries, we prepare a batch of updates and inserts of records into the item table.

  1. First, run the following query to count the number of records in the item Iceberg table:
SELECT count(*) FROM "datalake"."item_iceberg";

This should return 102,000 records.

  1. Select item records with a price higher than $90:
SELECT count(*) FROM "datalake"."item_iceberg" WHERE i_current_price > 90.0;

This will return 1,112 records.

The update-item.py job takes these 1,112 records, modifies 11 records to change the name of the brand to Unknown, and changes the remaining 1,101 records’ i_item_id key to flag them as new records. As a result, a batch of 11 updates and 1,101 inserts are merged into the item_iceberg table.

The 11 records to be updated are those with price higher than $90, and the brand name starts with corpnameless.

  1. Run the following query:
SELECT count(*) FROM "datalake"."item_iceberg" WHERE i_current_price > 90.0 AND i_brand LIKE 'corpnameless%';

The result is 11 records. The item_update.py job replaces the brand name with Unknown and merges the batch into the Iceberg table.

Now you can return to the EMR Serverless console and run the job on the EMR Serverless application.

  1. On the application details page, choose Submit job.
  2. For Name, enter update-item-job.
  3. For Runtime role¸ use the same role that you used previously.
  4. For S3 URI, enter the update-item.py script location.

  1. Under Spark properties, choose Edit in text.
  2. Enter the following properties, replacing the <BUCKET-NAME> with your own datalake-<####>-us-east-1:
--conf spark.executor.cores=2 --conf spark.executor.memory=8g --conf spark.driver.cores=4 --conf spark.driver.memory=8g --conf spark.executor.instances=2 --conf spark.jars=/usr/share/aws/iceberg/lib/iceberg-spark3-runtime.jar --conf spark.sql.extensions=org.apache.iceberg.spark.extensions.IcebergSparkSessionExtensions --conf spark.sql.catalog.dev=org.apache.iceberg.spark.SparkCatalog --conf spark.sql.catalog.dev.catalog-impl=org.apache.iceberg.aws.glue.GlueCatalog --conf spark.sql.catalog.glue_catalog.lock-impl=org.apache.iceberg.aws.glue.DynamoLockManager --conf spark.sql.catalog.glue_catalog.lock.table=myIcebergLockTab --conf spark.dynamicAllocation.maxExecutors=4 --conf spark.driver.maxResultSize=1G --conf spark.sql.catalog.dev.warehouse=s3://<BUCKET-NAME>/warehouse --conf spark.hadoop.hive.metastore.client.factory.class=com.amazonaws.glue.catalog.metastore.AWSGlueDataCatalogHiveClientFactory

  1. Then submit the job.

  1. After the job finishes successfully, return to the Athena console and run the following query:
SELECT count(*) FROM "datalake"."item_iceberg";

The returned result is 103,101 = 102,000 + (1,112 – 11). The batch was merged successfully.

Time travel

To run a time travel query, complete the following steps:

  1. Get the timestamp of the job run via the application details page on the EMR Serverless console, or the Spark UI on the History Server, as shown in the following screenshot.

This time could be just minutes before you ran the update Spark job.

  1. Convert the timestamp from the format YYYY/MM/DD hh:mm:ss to YYYY-MM-DDThh:mm:ss.sTZD with time zone. For example, from 2023/02/20 14:40:41 to 2023-02-20 14:40:41.000 UTC.
  2. On the Athena console, run the following query to count the item table records at a time before the update job, replacing <TRAVEL_TIME> with your time:
SELECT count(*) FROM "datalake"."item_iceberg" FOR TIMESTAMP AS OF TIMESTAMP <TRAVEL_TIME>;

The query will give 102,000 as a result, the expected table size before running the update job.

  1. Now you can run a query with a timestamp after the successful run of the update job (for example, 2023-02-20 15:06:00.000 UTC):
SELECT count(*) FROM "datalake"."item_iceberg" FOR TIMESTAMP AS OF TIMESTAMP <TRAVEL_TIME>;

The query will now give 103,101 as the size of the table at that time, after the update job successfully finished.

Additionally, you can query in Athena based on the version ID of a snapshot in Iceberg. However, for more advanced use cases, such as to roll back to a given version or to find version IDs, you can use Iceberg’s SDK or Spark on Amazon EMR.

Clean up

Complete the following steps to clean up your resources:

  1. On the Amazon S3 console, empty your buckets.
  2. On the Athena console, delete the workgroup DatalakeWorkgroup.
  3. On the EMR Studio console, stop the application datalake-app.
  4. On the AWS CloudFormation console, delete the CloudFormation stack.

Conclusion

In this post, we created a serverless transactional data lake with Iceberg tables, EMR Serverless, and Athena. We used TPC-DS sales data with 10 GB data and more than 7 million records in the fact table. We demonstrated how straightforward it is to rely on SQL and Spark to run serverless jobs for data ingestion and upserts. Moreover, we showed how to run complex BI queries directly on Iceberg tables from Athena for reporting.

You can start building your serverless transactional data lake on AWS today, and dive deep into the features and optimizations Iceberg provides to build analytics applications more easily. Iceberg can also help you in the future to improve performance and reduce costs.


About the Author

Houssem is a Specialist Solutions Architect at AWS with a focus on analytics. He is passionate about data and emerging technologies in analytics. He holds a PhD on data management in the cloud. Prior to joining AWS, he worked on several big data projects and published several research papers in international conferences and venues.