Tag Archives: Amazon EventBridge

Use AWS Step Functions to Monitor Services Choreography

Post Syndicated from Vito De Giosa original https://aws.amazon.com/blogs/architecture/use-aws-step-functions-to-monitor-services-choreography/

Organizations frequently need access to quick visual insight on the status of complex workflows. This involves collaboration across different systems. If your customer requires assistance on an order, you need an overview of the fulfillment process, including payment, inventory, dispatching, packaging, and delivery. If your products are expensive assets such as cars, you must track each item’s journey instantly.

Modern applications use event-driven architectures to manage the complexity of system integration at scale. These often use choreography for service collaboration. Instead of directly invoking systems to perform tasks, services interact by exchanging events through a centralized broker. Complex workflows are the result of actions each service initiates in response to events produced by other services. Services do not directly depend on each other. This increases flexibility, development speed, and resilience.

However, choreography can introduce two main challenges for the visibility of your workflow.

  1. It obfuscates the workflow definition. The sequence of events emitted by individual services implicitly defines the workflow. There is no formal statement that describes steps, permitted transitions, and possible failures.
  2. It might be harder to understand the status of workflow executions. Services act independently, based on events. You can implement distributed tracing to collect information related to a single execution across services. However, getting visual insights from traces may require custom applications. This increases time to market (TTM) and cost.

To address these challenges, we will show you how to use AWS Step Functions to model choreographies as state machines. The solution enables stakeholders to gain visual insights on workflow executions, identify failures, and troubleshoot directly from the AWS Management Console.

This GitHub repository provides a Quick Start and examples on how to model choreographies.

Modeling choreographies with Step Functions

Monitoring a choreography requires a formal representation of the distributed system behavior, such as state machines. State machines are mathematical models representing the behavior of systems through states and transitions. States model situations in which the system can operate. Transitions define which input causes a change from the current state to the next. They occur when a new event happens. Figure 1 shows a state machine modeling an order workflow.

Figure 1. Order workflow

Figure 1. Order workflow

The solution in this post uses Amazon State Language to describe a choreography as a Step Functions state machine. The state machine pauses, using Task states combined with a callback integration pattern. It then waits for the next event to be published on the broker. Choice states control transitions to the next state by inspecting event payloads. Figure 2 shows how the workflow in Figure 1 translates to a Step Functions state machine.

Figure 2. Order workflow translated into Step Functions state machine

Figure 2. Order workflow translated into Step Functions state machine

Figure 3 shows the architecture for monitoring choreographies with Step Functions.

Figure 3. Choreography monitoring with AWS Step Functions

Figure 3. Choreography monitoring with AWS Step Functions

  1. Services involved in the choreography publish events to Amazon EventBridge. There are two configured rules. The first rule matches the first event of the choreography sequence, Order Placed in the example. The second rule matches any other event of the sequence. Event payloads contain a correlation id (order_id) to group them by workflow instance.
  2. The first rule invokes an AWS Lambda function, which starts a new execution of the choreography state machine. The correlation id is passed in the name parameter, so you can quickly identify an execution in the AWS Management Console.
  3. The state machine uses Task states with AWS SDK service integrations, to directly call Amazon DynamoDB. Tasks are configured with a callback pattern. They issue a token, which is stored in DynamoDB with the execution name. Then, the workflow pauses.
  4. A service publishes another event on the event bus.
  5. The second rule invokes another Lambda function with the event payload.
  6. The function uses the correlation id to retrieve the task token from DynamoDB.
  7. The function invokes the Step Functions SendTaskSuccess API, with the token and the event payload as parameters.
  8. The state machine resumes the execution and uses Choice states to transition to the next state. If the choreography definition expects the received event payload, it selects the next state and the process will restart from Step # 3. The state machine transitions to a Fail state when it receives an unexpected event.

Increased visibility with Step Functions console

Modeling service choreographies as Step Functions Standard Workflows increases visibility with out-of-the-box features.

1. You can centrally track events produced by distributed components. Step Functions records full execution history for 90 days after the execution completes. You’ll be able to capture detailed information about the input and output of each state, including event payloads. Additionally, state machines integrate with Amazon CloudWatch to publish execution logs and metrics.

2. You can monitor choreographies visually. The Step Functions console displays a list of executions with information such as execution id, status, and start date (see Figure 4).

Figure 4. Step Functions workflow dashboard

Figure 4. Step Functions workflow dashboard

After you’ve selected an execution, a graph inspector is displayed (see Figure 5). It shows states, transitions, and marks individual states with colors. This identifies at a glance, successful tasks, failures, and tasks that are still in progress.

Figure 5. Step Functions graph inspector

Figure 5. Step Functions graph inspector

3. You can implement event-driven automation. Step Functions enables you to capture execution status changes emitting events directly to EventBridge (see Figure 6). Additionally, AWS gives you the ability to emit events by setting alarms on top of metrics. Step Functions publishes these to CloudWatch. You can respond to events by initiating corrective actions, sending notifications, or integrating with third-party solutions, such as issue tracking systems.

Figure 6. Automation with Step Functions, EventBridge, and CloudWatch alarms

Figure 6. Automation with Step Functions, EventBridge, and CloudWatch alarms

Enabling access to AWS Step Functions console

Stakeholders need secure access to the Step Functions console. This requires mechanisms to authenticate users and authorize read-only access to specific Step Functions workflows.

AWS Single Sign-On authenticates users by directly managing identities or through federation. SSO supports federation with Active Directory and SAML 2.0 compliant external identity providers (IdP). Users gain access to Step Functions state machines by assigning a permission set, which is a collection of AWS Identity and Access Management (IAM) policies. Additionally, with permission sets, you can configure a relay state, which is a URL to redirect the user after successful authentication. You can authenticate the user through the selected identity provider and immediately show the AWS Step Functions console with the workflow state machine already displayed. Figure 7 shows this process.

Figure 7. Access to Step Functions state machine with AWS SSO

Figure 7. Access to Step Functions state machine with AWS SSO

  1. The user logs in through the selected identity provider.
  2. The SSO user portal uses the SSO endpoint to send the response from the previous step. SSO uses AWS Security Token Service (STS) to get temporary security credentials on behalf of the user. It then creates a console sign-in URL using those credentials and the relay state. Finally, it sends the URL back as a redirect.
  3. The browser redirects the user to the Step Functions console.

When the identity provider does not support SAML 2.0, SSO is not a viable solution. In this case, you can create a URL with a sign-in token for users to securely access the AWS Management Console. This approach uses STS AssumeRole to get temporary security credentials. Then, it uses credentials to obtain a sign-in token from the AWS federation endpoint. Finally, it constructs a URL for the AWS Management Console, which includes the token. It then distributes this to users to grant access. This is similar to the SSO process. However, it requires custom development.

Conclusion

This post shows how you can increase visibility on choreographed business processes using AWS Step Functions. The solution provides detailed visual insights directly from the AWS Management Console, without requiring custom UI development. This reduces TTM and cost.

To learn more:

Find Public IPs of Resources – Use AWS Config for Vulnerability Assessment

Post Syndicated from Gurkamal Deep Singh Rakhra original https://aws.amazon.com/blogs/architecture/find-public-ips-of-resources-use-aws-config-for-vulnerability-assessment/

Systems vulnerability management is a key component of your enterprise security program. Its goal is to remediate OS, software, and applications vulnerabilities. Scanning tools can help identify and classify these vulnerabilities to keep the environment secure and compliant.

Typically, vulnerability scanning tools operate from internal or external networks to discover and report vulnerabilities. For internal scanning, the tools use private IPs of target systems in scope. For external scans, the public target system’s IP addresses are used. It is important that security teams always maintain an accurate inventory of all deployed resource’s IP addresses. This ensures a comprehensive, consistent, and effective vulnerability assessment.

This blog discusses a scalable, serverless, and automated approach to discover public IP addresses assigned to resources in a single or multi-account environment in AWS, using AWS Config.

Single account is when you have all your resources in a single AWS account. A multi-account environment refers to many accounts under the same AWS Organization.

Understanding scope of solution

You may have good visibility into the private IPs assigned to your resources: Amazon Elastic Compute Cloud (Amazon EC2), Amazon Elastic Kubernetes Service (EKS) clusters, Elastic Load Balancing (ELB), and Amazon Elastic Container Service (Amazon ECS). But it may require some effort to establish a complete view of the existing public IPs. And these IPs can change over time, as new systems join and exit the environment.

An elastic network interface is a logical networking component in a Virtual Private Cloud (VPC) that represents a virtual network card. The elastic network interface routes traffic to other destinations/resources. Usually, you have to make Describe* API calls for the specific resource with an elastic network interface to get information about its configuration and IP address. This may throttle the resource-specific API calls, and result in higher costs. Additionally, if there are tens or hundreds of accounts, it becomes exponentially more difficult to get the information into a single inventory.

AWS Config enables you to assess, audit, and evaluate the configurations of your AWS resources. The advanced query feature provides a single query endpoint and language to get current resource state metadata for a single account and Region, or multiple accounts and Regions. You can use configuration aggregators to run the same queries from a central account across multiple accounts and AWS Regions.

AWS Config supports a subset of structured query language (SQL) SELECT syntax, which enables you to perform property-based queries and aggregations on the current configuration item (CI) data. Advanced query is available at no additional cost to AWS Config customers in all AWS Regions (except China Regions) and AWS GovCloud (US).

AWS Organizations helps you centrally govern your environment. Its integration with other AWS services lets you define central configurations, security mechanisms, audit requirements, and resource sharing across accounts in your organization.

Choosing scope of advanced queries in AWS Config

When running advanced queries in AWS Config, you must choose the scope of the query. The scope defines the accounts you want to run the query against and is configured when you create an aggregator.

Following are the three possible scopes when running advanced queries:

  1. Single account and single Region
  2. Multiple accounts and multiple Regions
  3. AWS Organization accounts

Single account and single Region

Figure 1. AWS Config workflow for single account and single Region

Figure 1. AWS Config workflow for single account and single Region

The use case shown in Figure 1 addresses the need of customers operating within a single account and single Region. With AWS Config enabled for the individual account, you will use AWS Config advanced query feature to run SQL queries. These will give you resource metadata about associated public IPs. You do not require an aggregator for single-account and single Region.

In Figure 1.1, the advanced query returned results from a single account and all Availability Zones within the Region in which the query was run.

Figure 1.1 Advanced query returning results for a single account and single Region

Figure 1.1 Advanced query returning results for a single account and single Region

Query for reference

SELECT

  resouceId,

  resourceName,

  resourceType,

  configuration.association.publicIp,

  availabilityZone,

  awsRegion

WHERE

  resourceType='AWS::EC2::NetworkInterface'

  AND configuration.association.publicIp>'0.0.0.0'

This query is fetching the properties of all elastic network interfaces. The WHERE condition is used to list the elastic network interfaces using the resourceType property and find all public IPs greater than 0.0.0.0. This is because elastic network interfaces can exist with a private IP, in which case there will be no public IP assigned to it. For a list of supported resourceType, refer to supported resource types for AWS Config.

Multiple accounts and multiple Regions

Figure 2. AWS Config monitoring workflow for multiple account and multiple Regions. The figure shows EC2, EKS, and Amazon ECS, but it can be any AWS resource having a public elastic network interface.

Figure 2. AWS Config monitoring workflow for multiple account and multiple Regions. The figure shows EC2, EKS, and Amazon ECS, but it can be any AWS resource having a public elastic network interface.

AWS Config enables you to monitor configuration changes against multiple accounts and multiple Regions via an aggregator, see Figure 2. An aggregator is an AWS Config resource type that collects AWS Config data from multiple accounts and Regions. You can choose the aggregator scope when running advanced queries in AWS Config. Remember to authorize the aggregator accounts to collect AWS Config configuration and compliance data.

Figure 2.1 Advanced query returning results from multiple Regions (awsRegion column) as highlighted in the diagram

Figure 2.1 Advanced query returning results from multiple Regions (awsRegion column) as highlighted in the diagram

This use case applies when you have AWS resources in multiple accounts (or span multiple organizations) and multiple Regions. Figure 2.1 shows the query results being returned from multiple AWS Regions.

Accounts in AWS Organization

Figure 3. The workflow of accounts in an AWS Organization being monitored by AWS Config. This figure shows EC2, EKS, and Amazon ECS but it can be any AWS resource having a public elastic network interface.

Figure 3. The workflow of accounts in an AWS Organization being monitored by AWS Config. This figure shows EC2, EKS, and Amazon ECS but it can be any AWS resource having a public elastic network interface.

An aggregator also enables you to monitor all the accounts in your AWS Organization, see Figure 3. When this option is chosen, AWS Config enables you to run advanced queries against the configuration history in all the accounts in your AWS Organization. Remember that an aggregator will only aggregate data from the accounts and Regions that are specified when the aggregator is created.

Figure 3.1 Advanced query returning results from all accounts (accountId column) under an AWS Organization

Figure 3.1 Advanced query returning results from all accounts (accountId column) under an AWS Organization

In Figure 3.1, the query is run against all accounts in an AWS Organization. This scope of AWS Organization is accomplished by the aggregator and it automatically accumulates data from all accounts under a specific AWS Organization.

Common architecture workflow for discovering public IPs

Figure 4. High-level architecture pattern for discovering public IPs

Figure 4. High-level architecture pattern for discovering public IPs

The workflow shown in Figure 4 starts with Amazon EventBridge triggering an AWS Lambda function. You can configure an Amazon EventBridge schedule via rate or cron expressions, which define the frequency. This AWS Lambda function will host the code to make an API call to AWS Config that will run an advanced query. The advanced query will check for all elastic network interfaces in your account(s). This is because any public resource launched in your account will be assigned an elastic network interface.

When the results are returned, they can be stored on Amazon S3. These result files can be timestamped (via naming or S3 versioning) in order to keep a history of public IPs used in your account. The result set can then be fed into or accessed by the vulnerability scanning tool of your choice.

Note: AWS Config advanced queries can also be used to query IPv6 addresses. You can use the “configuration.ipv6Addresses” AWS Config property to get IPv6 addresses. When querying IPv6 addresses, remove “configuration.association.publicIp > ‘0.0.0.0’” condition from the preceding sample queries. For more information on available AWS Config properties and data types, refer to GitHub.

Conclusion

In this blog, we demonstrated how to extract public IP information from resources deployed in your account(s) using AWS Config and AWS Config advanced query. We discussed how you can support your vulnerability scanning process by identifying public IPs in your account(s) that can be fed into your scanning tool. This solution is serverless, automated, and scalable, which removes the undifferentiated heavy lifting required to manage your resources.

Learn more about AWS Config best practices:

Modernized Database Queuing using Amazon SQS and AWS Services

Post Syndicated from Scott Wainner original https://aws.amazon.com/blogs/architecture/modernized-database-queuing-using-amazon-sqs-and-aws-services/

A queuing system is composed of producers and consumers. A producer enqueues messages (writes messages to a database) and a consumer dequeues messages (reads messages from the database). Business applications requiring asynchronous communications often use the relational database management system (RDBMS) as the default message storage mechanism. But the increased message volume, complexity, and size, competes with the inherent functionality of the database. The RDBMS becomes a bottleneck for message delivery, while also impacting other traditional enterprise uses of the database.

In this blog, we will show how you can mitigate the RDBMS performance constraints by using Amazon Simple Queue Service (Amazon SQS), while retaining the intrinsic value of the stored relational data.

Problems with legacy queuing methods

Commercial databases such as Oracle offer Advanced Queuing (AQ) mechanisms, while SQL Server supports Service Broker for queuing. The database acts as a message queue system when incoming messages are captured along with metadata. A message stored in a database is often processed multiple times using a sequence of message extraction, transformation, and loading (ETL). The message is then routed for distribution to a set of recipients based on logic that is often also stored in the database.

The repetitive manipulation of messages and iterative attempts at distributing pending messages may create a backlog that interferes with the primary function of the database. This backpressure can propagate to other systems that are trying to store and retrieve data from the database and cause a performance issue (see Figure 1).

Figure 1. A relational database serving as a message queue.

Figure 1. A relational database serving as a message queue.

There are several scenarios where the database can become a bottleneck for message processing:

Message metadata. Messages consist of the payload (the content of the message) and metadata that describes the attributes of the message. The metadata often includes routing instructions, message disposition, message state, and payload attributes.

  • The message metadata may require iterative transformation during the message processing. This creates an inefficient sequence of read, transform, and write processes. This is especially inefficient if the message attributes undergo multiple transformations that must be reflected in the metadata. The iterative read/write process of metadata consumes the database IOPS, and forces the database to scale vertically (add more CPU and more memory).
  • A new paradigm emerges when message management processes exist outside of the database. Here, the metadata is manipulated without interacting with the database, except to write the final message disposition. Application logic can be applied through functions such as AWS Lambda to transform the message metadata.

Message large object (LOB). A message may contain a large binary object that must be stored in the payload.

  • Storing large binary objects in the RDBMS is expensive. Manipulating them consumes the throughput of the database with iterative read/write operations. If the LOB must be transformed, then it becomes wasteful to store the object in the database.
  • An alternative approach offers a more efficient message processing sequence. The large object is stored external to the database in universally addressable object storage, such as Amazon Simple Storage Service (Amazon S3). There is only a pointer to the object that is stored in the database. Smaller elements of the message can be read from or written to the database, while large objects can be manipulated more efficiently in object storage resources.

Message fan-out. A message can be loaded into the database and analyzed for routing, where the same message must be distributed to multiple recipients.

  • Messages that require multiple recipients may require a copy of the message replicated for each recipient. The replication creates multiple writes and reads from the database, which is inefficient.
  • A new method captures only the routing logic and target recipients in the database. The message replication then occurs outside of the database in distributed messaging systems, such as Amazon Simple Notification Service (Amazon SNS).

Message queuing. Messages are often kept in the database until they are successfully processed for delivery. If a message is read from the database and determined to be undeliverable, then the message is kept there until a later attempt is successful.

  • An inoperable message delivery process can create backpressure on the database where iterative message reads are processed for the same message with unsuccessful delivery. This creates a feedback loop causing even more unsuccessful work for the database.
  • Try a message queuing system such as Amazon MQ or Amazon SQS, which offloads the message queuing from the database. These services offer efficient message retry mechanisms, and reduce iterative reads from the database.

Sequenced message delivery. Messages may require ordered delivery where the delivery sequence is crucial for maintaining application integrity.

  • The application may capture the message order within database tables, but the sorting function still consumes processing capabilities. The order sequence must be sorted and maintained for each attempted message delivery.
  • Message order can be maintained outside of the database using a queue system, such as Amazon SQS, with first-in/first-out (FIFO) delivery.

Message scheduling. Messages may also be queued with a scheduled delivery attribute. These messages require an event driven architecture with initiated scheduled message delivery.

  • The database often uses trigger mechanisms to initiate message delivery. Message delivery may require a synchronized point in time for delivery (many messages at once), which can cause a spike in work at the scheduled interval. This impacts the database performance with artificially induced peak load intervals.
  • Event signals can be generated in systems such as Amazon EventBridge, which can coordinate the transmission of messages.

Message disposition. Each message maintains a message disposition state that describes the delivery state.

  • The database is often used as a logging system for message transmission status. The message metadata is updated with the disposition of the message, while the message remains in the database as an artifact.
  • An optimized technique is available using Amazon CloudWatch as a record of message disposition.

Modernized queuing architecture

Decoupling message queuing from the database improves database availability and enables greater message queue scalability. It also provides a more cost-effective use of the database, and mitigates backpressure created when database performance is constrained by message management.

The modernized architecture uses loosely coupled services, such as Amazon S3, AWS Lambda, Amazon Message Queue, Amazon SQS, Amazon SNS, Amazon EventBridge, and Amazon CloudWatch. This loosely coupled architecture lets each of the functional components scale vertically and horizontally independent of the other functions required for message queue management.

Figure 2 depicts a message queuing architecture that uses Amazon SQS for message queuing and AWS Lambda for message routing, transformation, and disposition management. An RDBMS is still leveraged to retain metadata profiles, routing logic, and message disposition. The ETL processes are handled by AWS Lambda, while large objects are stored in Amazon S3. Finally, message fan-out distribution is handled by Amazon SNS, and the queue state is monitored and managed by Amazon CloudWatch and Amazon EventBridge.

Figure 2. Modernized queuing architecture using Amazon SQS

Figure 2. Modernized queuing architecture using Amazon SQS

Conclusion

In this blog, we show how queuing functionality can be migrated from the RDMBS while minimizing changes to the business application. The RDBMS continues to play a central role in sourcing the message metadata, running routing logic, and storing message disposition. However, AWS services such as Amazon SQS offload queue management tasks related to the messages. AWS Lambda performs message transformation, queues the message, and transmits the message with massive scale, fault-tolerance, and efficient message distribution.

Read more about the diverse capabilities of AWS messaging services:

By using AWS services, the RDBMS is no longer a performance bottleneck in your business applications. This improves scalability, and provides resilient, fault-tolerant, and efficient message delivery.

Read our blog on modernization of common database functions:

Serverless Scheduling with Amazon EventBridge, AWS Lambda, and Amazon DynamoDB

Post Syndicated from Peter Grman original https://aws.amazon.com/blogs/architecture/serverless-scheduling-with-amazon-eventbridge-aws-lambda-and-amazon-dynamodb/

Many applications perform scheduled tasks. For instance, you might want to automatically publish an article at a given time, change prices for offers which were defined weeks in advance, or notify customers 8 hours before a flight. These might be one-off tasks, or recurring ones.

On Unix-like operating systems, you might have opted for the cron utility. There are also similar alternatives for many web application frameworks, as well as advanced libraries, to schedule future one-off tasks. In a single server environment, this might seem like a simple solution. However, when you run dozens of instances of your application server, it gets harder to rely on those libraries to schedule tasks reliably at least once, without taking up too many resources. If you decide to build a serverless application, you need a new approach all together.

This post shows how you can build a scalable serverless job scheduler. You can use this method to scale to thousands, or even millions, of distributed jobs per minute. Because you are using serverless technologies, the underlying infrastructure is fully managed by AWS and you only pay for what you use. You can use this solution as an addition to your existing applications, regardless if they already use serverless technologies.

Similarly to a cron job running on a single instance, this solution uses an Amazon EventBridge rule, which starts new events periodically on a schedule. For recurring jobs, you would use this capability to start specific actions directly. This will work if you have only a few dozen periodic tasks, whose execution cycle can be defined as a cron expression. However, remember that there are limits to how many rules can be defined per event bus, and rules with a scheduled expression can only be defined on the default event bus. This post describes a method to multiplex a single Amazon EventBridge rule via an AWS Lambda function and Amazon DynamoDB, to scale beyond thousands of jobs. While this example focuses on one-off tasks, you can use the same approach for recurring jobs as well.

Overview of solution

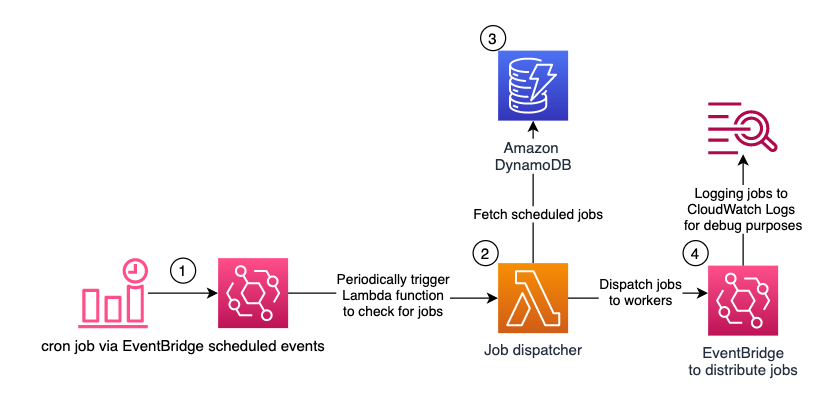
The following diagram shows the architecture of the serverless scheduling solution.

Figure 1 - Architecture diagram showing Serverless Scheduling with Amazon EventBridge, AWS Lambda, and Amazon DynamoDB

Figure 1 – Architecture diagram showing Serverless Scheduling with Amazon EventBridge, AWS Lambda, and Amazon DynamoDB

Amazon EventBridge with scheduled expressions periodically starts an AWS Lambda function. An Amazon DynamoDB table stores the future jobs. The Lambda function queries the table for due jobs and distributes them via Amazon EventBridge to the workers.

The following services are used:

Amazon EventBridge: to initiate the serverless scheduling solution. Amazon EventBridge is a serverless event bus that makes it easier to build event-driven applications at scale. It can also schedule events based on time intervals or cron expressions.

In this solution, you’ll use EventBridge for two things:

  1. to periodically start the AWS Lambda function, which checks for new jobs to be executed, and
  2. to distribute those jobs to the workers.

Here, you can control the granularity of your job executions. The fastest rate possible is once every minute. But if you don’t need a 1-minute precision, you can also opt for once every 5 minutes, or even once every hour. Remember that you cannot control at which second the event is started. It might be at the beginning of the minute, in the middle, or at the end.

AWS Lambda: to execute the scheduler logic. AWS Lambda is a serverless, event-driven compute service that lets you run code without provisioning or managing servers. The Lambda function queries the jobs from DynamoDB and distributes them via EventBridge. Based on your requirements, you can adjust this to use different mechanisms to notify the workers about the jobs, such as HTTP APIs, gRPC calls, or AWS services like Amazon Simple Notification Service (SNS) or Amazon Simple Queue Service (SQS).

Amazon DynamoDB: to store scheduled jobs. Amazon DynamoDB is a fully managed, serverless, key-value NoSQL database designed to run high-performance applications at any scale. Defining the right data model is important to be able to scale to thousands or even millions of scheduled and processed jobs per minute. The DynamoDB table in this solution has a partition key “pk” and a sort key “sk”. For the Lambda function, to be able to query all due jobs quickly and efficiently, jobs must be partitioned. For this, they are grouped together based on their scheduled times in intervals of 5 minutes. This value is the partition key “pk”. How to calculate this value is explained in detail, when you will test the solution.

The sort key “sk” contains the precise execution time concatenated with a unique identifier, such as a job ID, because the combination of “pk” and “sk” must be unique. To schedule a job in this example, you write it manually into the DynamoDB table. In your production code you can abstract the synchronous DynamoDB access, by implementing it in a shared library, or using Amazon API Gateway. You could also schedule jobs from a Lambda function reacting to events in your system.

Amazon EventBridge: to distribute the jobs. The Lambda function uses Amazon EventBridge as an example to distribute the jobs. The workers which should receive the jobs, must configure the corresponding rules upfront. For testing purposes, this solution comes with a rule which logs all events from the Lambda function into Amazon CloudWatch Logs.

Walkthrough

In this section, you will deploy the solution and test it.

Deploying the solution

To deploy it in your account:

1.  Select Launch Stack.

Launch Stack

2. Select the Region where you want to launch your serverless scheduler.

3. Define a name for your stack. Leave the parameters with the default values for now and select Next.

parameters table

4. At the bottom of the page, acknowledge the required Capabilities and select Create stack.

5.  Wait until the status of the stack is CREATE_COMPLETE, this can take a minute or two.

Testing the solution

In this section, you test the serverless scheduler. First, you’ll schedule a job for some time in the near future. Afterwards you will check that the job has been logged in CloudWatch Logs at the time, it was scheduled.

1. In the AWS Management Console, navigate to the DynamoDB service and select the Items sub-menu on the left side, between Tables and PartiQL editor.

2. Select the JobsTable which you created via the CloudFormation Stack; it should be empty for now:

Jobstable

3. Select Create item. Make sure you switch to the JSON editor at the top, and disable View DynamoDB JSON. Now copy this item into the editor:

{
  "pk": "j#2015-03-20T09:45",
  "sk": "2015-03-20T09:46:47.123Z#564ade05-efda-4a2e-a7db-933ad3c89a83",
  "detail": {
    "action": "send-reminder",
    "userId": "16f3a019-e3a5-47ed-8c46-f668347503d1",
    "taskId": "6d2f710d-99d8-49d8-9f52-92a56d0c6b81",
    "params": {
      "can_skip": false,
      "reminder_volume": 0.5
    }
  },
  "detail_type": "job-reminder"
}

Create table DynamoDB table

This is a sample job definition. You will need to adjust it, to be started a few minutes from now. For this you need to adjust the first 2 attributes, the partition key “pk” and the sort key “sk”. Start with “sk”, this is the UTC timestamp for the due date of the job in ISO 8601 format (YYYY-MM-DDTHH:MM:SS), followed by a separator (“#”) and a unique identifier, to make sure that multiple jobs can have the same due timestamp.

Afterwards adjust “pk”. The “pk” looks like the ISO 8601 timestamp in the “sk” reduced to date and time in hours and minutes. The minutes for the partition key must be an integer multiple of 5. This value represents the grouping of the jobs, so they can be queried quickly and efficiently by the Lambda function. For instance, for me 2021-11-26T13:31:55.000Z is in the future and the corresponding partition would be 2021-11-26T13:30.

Note: your local time zone might not be UTC. You can get the current UTC time on timeanddate.com.

You can find in the following table for every “sk” minute the corresponding “pk” minute:

SK and PK table

The corresponding python code would be:

f'{(sk_minutes – sk_minutes % 5):02d}'

Create table DynamoDB table

4. Now that you defined your event in the near future, you can optionally adjust the content of the “detail” and “detail_type” attributes. These are forwarded to EventBridge as “detail” and “detail-type” and should be used by your workers to understand which task they are supposed to perform. You can find more details on EventBridge event structure in our documentation. After you configured the job correctly, select Create item.

5. It is time to navigate to CloudWatch Log groups and wait for the item to be due and to show up in the debug logs.

CloudWatch log groups

For now, the log streams should be empty:

Log streams sceenshot

After the item was due, you should see a new log stream with the item “detail” and “detail_type” attributes logged.

If you don’t see a new log stream with the item, check back in your DynamoDB table, if the “sk” is in the UTC time zone and the minutes of the “pk” are a multiple of 5. You can consult the table at the end of step 3, to check for the correct “pk” minutes based on your “sk” minutes.

Log events screenshot

You might notice that the timestamp of the message is within a minute after the job was scheduled. In my example, I scheduled the job for 2021-11-26T13:31:55.000Z and it was put into EventBridge at 2021-11-26T13:32:33Z. The delay comes from the Lambda function only starting once per minute. As I mentioned in the beginning, the function also isn’t started at second 00 but at a random second within that minute.

Exploring the Lambda function

Now, let’s have a look at the core logic. For this, navigate to AWS Lambda in the AWS Management console and open the SchedulerFunction.

AWS Lambda screenshot

In the function configuration, you can see that it is triggered by EventBridge via a scheduled expression at the rate, which was defined in the CloudFormation Stack.

Function Configuration in Cloudformation Stack

When you open the Code tab, you can see that it is less than 100 lines of python code. The main part is the lambda_handler function:

def lambda_handler(event, context):
    event_time_in_utc = event['time']
    previous_partition, current_partition = get_partitions(event_time_in_utc)

    previous_jobs = query_jobs(previous_partition, event_time_in_utc)
    current_jobs = query_jobs(current_partition, event_time_in_utc)
    all_jobs = previous_jobs + current_jobs

    print('dispatching {} jobs'.format(len(all_jobs)))

    put_all_jobs_into_event_bridge(all_jobs)
    delete_all_jobs(all_jobs)

    print('dispatched and deleted {} jobs'.format(len(all_jobs)))

The function starts by calculating the current and previous partitions. This is done to ensure that no jobs stay unprocessed in the old partition, when a new one starts. Afterwards, jobs from these partitions are queried up to the current time, so no future jobs will be fetched from the current partition. Lastly, all jobs are put into EventBridge and deleted from the table.

Instead of pushing the jobs into EventBridge, they could be started via HTTP(S), gRPC, or pushed into other AWS services, like Amazon Simple Notification Service (SNS) or Amazon Simple Queue Service (SQS). Also remember that the communication with other AWS services is synchronous and does not use batching options when putting jobs into EventBridge or deleting them from the DynamoDB table. This is to keep the function simpler and easier to understand. When you plan to distribute thousands of jobs per minute, you’d want to adjust this, to improve the throughput of the Lambda function.

Cleaning up

To avoid incurring future charges, delete the CloudFormation Stack and all resources you created.

Conclusion

In this post, you learned how to build a serverless scheduling solution. Using only serverless technologies which scale automatically, don’t require maintenance, and offer a pay as you go pricing model, this scheduler solution can be implemented for use cases with varying throughput requirements for their scheduled jobs. These could range from publishing articles at a scheduled time to notifying hundreds of passengers per minute about their upcoming flight.

You can adjust the Lambda function to distribute the jobs with a technology more fitting to your application, as well as to handle recurring tasks. The grouping interval of 5 minutes for the partition key, can be also adjusted based on your throughput requirements. It’s important to note that for this solution to work, the interval by which the jobs are grouped must be longer than the rate at which the Lambda function is started.

Give it a try and let us know your thoughts in the comments!

New – Use Amazon S3 Event Notifications with Amazon EventBridge

Post Syndicated from Jeff Barr original https://aws.amazon.com/blogs/aws/new-use-amazon-s3-event-notifications-with-amazon-eventbridge/

We launched Amazon EventBridge in mid-2019 to make it easy for you to build powerful, event-driven applications at any scale. Since that launch, we have added several important features including a Schema Registry, the power to Archive and Replay Events, support for Cross-Region Event Bus Targets, and API Destinations to allow you to send events to any HTTP API. With support for a very long list of destinations and the ability to do pattern matching, filtering, and routing of events, EventBridge is an incredibly powerful and flexible architectural component.

S3 Event Notifications
Today we are making it even easier for you to use EventBridge to build applications that react quickly and efficiently to changes in your S3 objects. This is a new, “directly wired” model that is faster, more reliable, and more developer-friendly than ever. You no longer need to make additional copies of your objects or write specialized, single-purpose code to process events.

At this point you might be thinking that you already had the ability to react to changes in your S3 objects, and wondering what’s going on here. Back in 2014 we launched S3 Event Notifications to SNS Topics, SQS Queues, and Lambda functions. This was (and still is) a very powerful feature, but using it at enterprise-scale can require coordination between otherwise-independent teams and applications that share an interest in the same objects and events. Also, EventBridge can already extract S3 API calls from CloudTrail logs and use them to do pattern matching & filtering. Again, very powerful and great for many kinds of apps (with a focus on auditing & logging), but we always want to do even better.

Net-net, you can now configure S3 Event Notifications to directly deliver to EventBridge! This new model gives you several benefits including:

Advanced Filtering – You can filter on many additional metadata fields, including object size, key name, and time range. This is more efficient than using Lambda functions that need to make calls back to S3 to get additional metadata in order to make decisions on the proper course of action. S3 only publishes events that match a rule, so you save money by only paying for events that are of interest to you.

Multiple Destinations – You can route the same event notification to your choice of 18 AWS services including Step Functions, Kinesis Firehose, Kinesis Data Streams, and HTTP targets via API Destinations. This is a lot easier than creating your own fan-out mechanism, and will also help you to deal with those enterprise-scale situations where independent teams want to do their own event processing.

Fast, Reliable Invocation – Patterns are matched (and targets are invoked) quickly and directly. Because S3 provides at-least-once delivery of events to EventBridge, your applications will be more reliable.

You can also take advantage of other EventBridge features, including the ability to archive and then replay events. This allows you to reprocess events in case of an error or if you add a new target to an event bus.

Getting Started
I can get started in minutes. I start by enabling EventBridge notifications on one of my S3 buckets (jbarr-public in this case). I open the S3 Console, find my bucket, open the Properties tab, scroll down to Event notifications, and click Edit:

I select On, click Save changes, and I’m ready to roll:

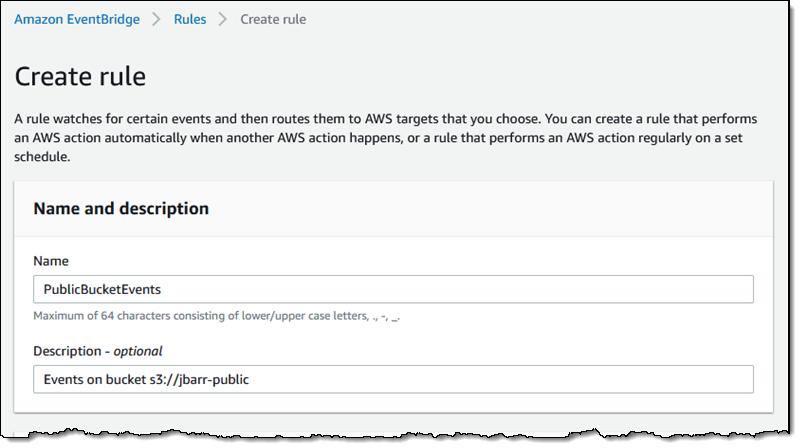
Now I use the EventBridge Console to create a rule. I start, as usual, by entering a name and a description:

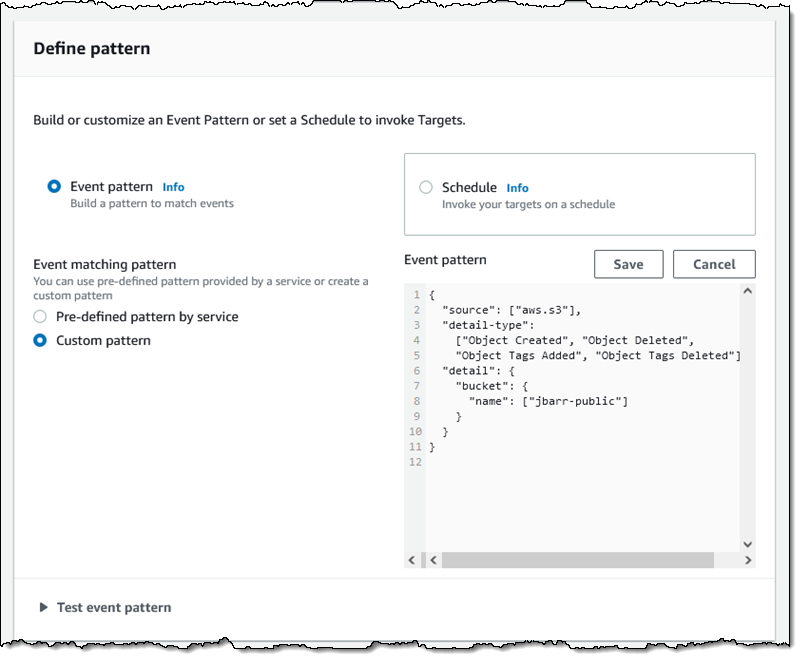
Then I define a pattern that matches the bucket and the events of interest:

One pattern can match one or more buckets and one or more events; the following events are supported:

  • Object Created
  • Object Deleted
  • Object Restore Initiated
  • Object Restore Completed
  • Object Restore Expired
  • Object Tags Added
  • Object Tags Deleted
  • Object ACL Updated
  • Object Storage Class Changed
  • Object Access Tier Changed

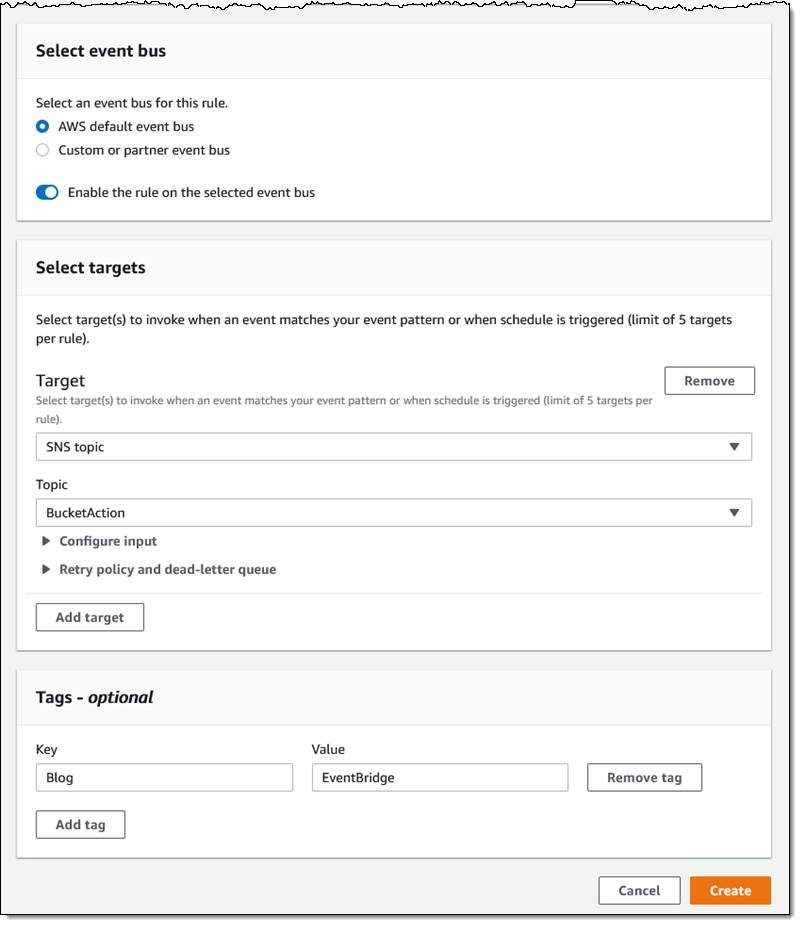
Then I choose the default event bus, and set the target to an SNS topic (BucketAction) which publishes the messages to my Amazon email address:

I click Create, and I am all set. To test it out, I simply upload some files to my bucket and await the messages:

The message contains all of the interesting and relevant information about the event, and (after some unquoting and formatting), looks like this:

{
    "version": "0",
    "id": "2d4eba74-fd51-3966-4bfa-b013c9da8ff1",
    "detail-type": "Object Created",
    "source": "aws.s3",
    "account": "348414629041",
    "time": "2021-11-13T00:00:59Z",
    "region": "us-east-1",
    "resources": [
        "arn:aws:s3:::jbarr-public"
    ],
    "detail": {
        "version": "0",
        "bucket": {
            "name": "jbarr-public"
        },
        "object": {
            "key": "eb_create_rule_mid_1.png",
            "size": 99797,
            "etag": "7a72374e1238761aca7778318b363232",
            "version-id": "a7diKodKIlW3mHIvhGvVphz5N_ZcL3RG",
            "sequencer": "00618F003B7286F496"
        },
        "request-id": "4Z2S00BKW2P1AQK8",
        "requester": "348414629041",
        "source-ip-address": "72.21.198.68",
        "reason": "PutObject"
    }

My initial event pattern was very simple, and matched only the bucket name. I can use content-based filtering to write more complex and more interesting patterns. For example, I could use numeric matching to set up a pattern that matches events for objects that are smaller than 1 megabyte:

{
    "source": [
        "aws.s3"
    ],
    "detail-type": [
        "Object Created",
        "Object Deleted",
        "Object Tags Added",
        "Object Tags Deleted"
    ],

    "detail": {
        "bucket": {
            "name": [
                "jbarr-public"
            ]
        },
        "object" : {
            "size": [{"numeric" :["<=", 1048576 ] }]
        }
    }
}

Or, I could use prefix matching to set up a pattern that looks for objects uploaded to a “subfolder” (which doesn’t really exist) of a bucket:

"object": {
  "key" : [{"prefix" : "uploads/"}]
  }]
}

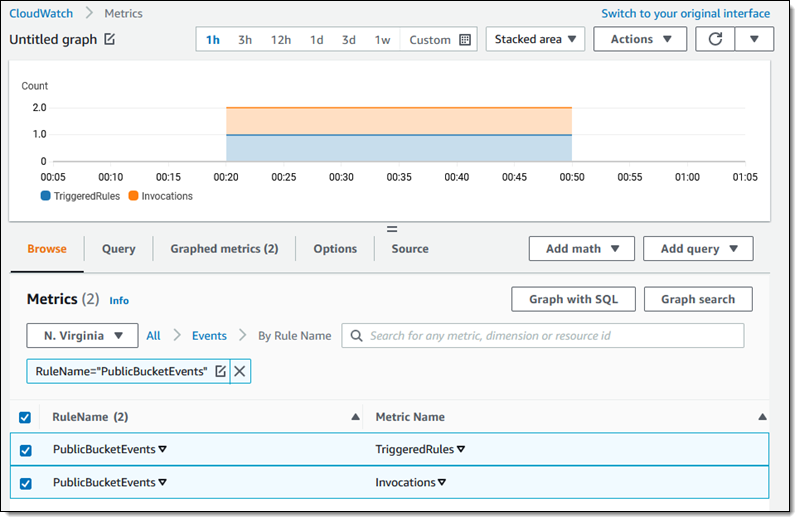
You can use all of this in conjunction with all of the existing EventBridge features, including Archive/Replay. You can also access the CloudWatch metrics for each of your rules:

Available Now
This feature is available now and you can start using it today in all commercial AWS Regions. You pay $1 for every 1 million events that match a rule; check out the EventBridge Pricing page for more information.

Jeff;

Expanding cross-Region event routing with Amazon EventBridge

Post Syndicated from James Beswick original https://aws.amazon.com/blogs/compute/expanding-cross-region-event-routing-with-amazon-eventbridge/

This post is written by Stephen Liedig, Sr Serverless Specialist SA.

In April 2021, AWS announced a new feature for Amazon EventBridge that allows you to route events from any commercial AWS Region to US East (N. Virginia), US West (Oregon), and Europe (Ireland). From today, you can now route events between any AWS Regions, except AWS GovCloud (US) and China.

EventBridge enables developers to create event-driven applications by routing events between AWS services, integrated software as a service (SaaS) applications, and your own applications. This helps you produce loosely coupled, distributed, and maintainable architectures. With these new capabilities, you can now route events across Regions and accounts using the same model used to route events to existing targets.

Cross-Region event routing with Amazon EventBridge makes it easier for customers to develop multi-Region workloads to:

  • Centralize your AWS events into one Region for auditing and monitoring purposes, such as aggregating security events for compliance reasons in a single account.
  • Replicate events from source to destinations Regions to help synchronize data in cross-Region data stores.
  • Invoke asynchronous workflows in a different Region from a source event. For example, you can load balance from a target Region by routing events to another Region.

A previous post shows how cross-Region routing works. This blog post expands on these concepts and discusses a common use case for cross-Region event delivery – event auditing. This example explores how you can manage resources using AWS CloudFormation and EventBridge resource policies.

Multi-Region event auditing example walkthrough

Compliance is an important part of building event-driven applications and reacting to any potential policy or security violations. Customers use EventBridge to route security events from applications and globally distributed infrastructure into a single account for analysis. In many cases, they share specific AWS CloudTrail events with security teams. Customers also audit events from their custom-built applications to monitor sensitive data usage.

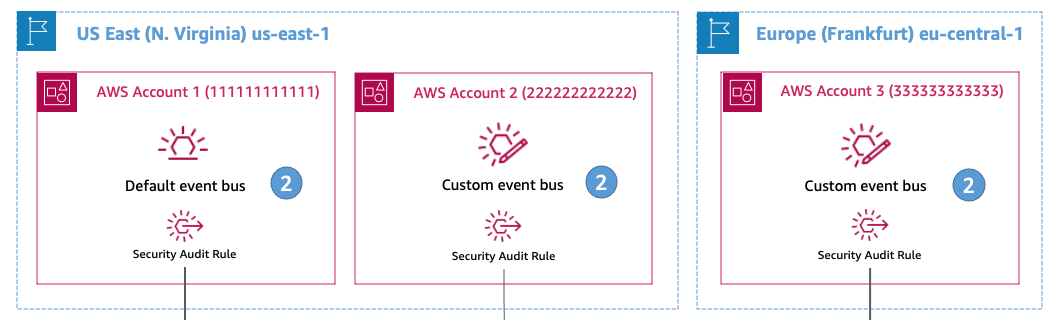
In this scenario, a company has their base of operations located in Asia Pacific (Singapore) with applications distributed across US East (N. Virginia) and Europe (Frankfurt). The applications in US East (N. Virginia) and Europe (Frankfurt) are using EventBridge for their respective applications and services. The security team in Asia Pacific (Singapore) wants to analyze events from the applications and CloudTrail events for specific API calls to monitor infrastructure security.

Reference architecture

To create the rules to receive these events:

  1. Create a new set of rules directly on all the event buses across the global infrastructure. Alternatively, delegate the responsibility of managing security rules to distributed teams that manage the event bus resources.
  2. Provide the security team with the ability to manage rules centrally, and control the lifecycle of rules on the global infrastructure.

Allowing the security team to manage the resources centrally provides more scalability. It is more consistent with the design principle that event consumers own and manage the rules that define how they process events.

Deploying the example application

The following code snippets are shortened for brevity. The full source code of the solution is in the GitHub repository. The solution uses AWS Serverless Application Model (AWS SAM) for deployment. Clone the repo and navigate to the solution directory:

git clone https://github.com/aws-samples/amazon-eventbridge-resource-policy-samples
cd ./patterns/ cross-region-cross-account-pattern/

To allow the security team to start receiving accounts from any of the cross-Region accounts:

1. Create a security event bus in the Asia Pacific (Singapore) Region with a rule that processes events from the respective event sources.

ap-southest-1 architecture

For simplicity, this example uses an Amazon CloudWatch Logs target to visualize the events arriving from cross-Region accounts:

 SecurityEventBus:
  Type: AWS::Events::EventBus
  Properties:
   Name: !Ref SecurityEventBusName

 # This rule processes events coming in from cross-Region accounts
 SecurityAnalysisRule:
  Type: AWS::Events::Rule
  Properties:
   Name: SecurityAnalysisRule
   Description: Analyze events from cross-Region event buses
   EventBusName: !GetAtt SecurityEventBus.Arn
   EventPattern:
    source:
     - anything-but: com.company.security
   State: ENABLED
   RoleArn: !GetAtt WriteToCwlRole.Arn
   Targets:
    - Id: SendEventToSecurityAnalysisRule
     Arn: !Sub "arn:aws:logs:${AWS::Region}:${AWS::AccountId}:log-group:${SecurityAnalysisRuleTarget}"

In this example, you set the event pattern to process any event from a source that is not from the security team’s own domain. This allows you to process events from any account in any Region. You can filter this further as needed.

2. Set an event bus policy on each default and custom event bus that the security team must receive events from.

Event bus policy

This policy allows the security team to create rules to route events to its own security event bus in the Asia Pacific (Singapore) Region. The following policy defines a custom event bus in Account 2 in US East (N. Virginia) and an AWS::Events::EventBusPolicy that sets the Principal as the security team account.

This allows the security team to manage rules on the CustomEventBus:

 CustomEventBus: 
  Type: AWS::Events::EventBus
  Properties: 
    Name: !Ref EventBusName

 SecurityServiceRuleCreationStatement:
  Type: AWS::Events::EventBusPolicy
  Properties:
   EventBusName: !Ref CustomEventBus # If you omit this, the default event bus is used.
   StatementId: "AllowCrossRegionRulesForSecurityTeam"
   Statement:
    Effect: "Allow"
    Principal:
     AWS: !Sub "arn:aws:iam::${SecurityAccountNo}:root"
    Action:
     - "events:PutRule"
     - "events:DeleteRule"
     - "events:DescribeRule"
     - "events:DisableRule"
     - "events:EnableRule"
     - "events:PutTargets"
     - "events:RemoveTargets"
    Resource:
     - !Sub 'arn:aws:events:${AWS::Region}:${AWS::AccountId}:rule/${CustomEventBus.Name}/*'
    Condition:
     StringEqualsIfExists:
      "events:creatorAccount": "${aws:PrincipalAccount}"

3. With the policies set on the cross-Region accounts, now create the rules. Because you cannot create CloudFormation resources across Regions, you must define the rules in separate templates. This also gives the ability to expand to other Regions.

Once the template is deployed to the cross-Region accounts, use EventBridge resource policies to propagate rule definitions across accounts in the same Region. The security account must have permission to create CloudFormation resources in the cross-Region accounts to deploy the rule templates.

Resource policies

There are two parts to the rule templates. The first specifies a role that allows EventBridge to assume a role to send events to the target event bus in the security account:

 # This IAM role allows EventBridge to assume the permissions necessary to send events
 # from the source event buses to the destination event bus.
 SourceToDestinationEventBusRole:
  Type: "AWS::IAM::Role"
  Properties:
   AssumeRolePolicyDocument:
    Version: 2012-10-17
    Statement:
     - Effect: Allow
      Principal:
       Service:
        - events.amazonaws.com
      Action:
       - "sts:AssumeRole"
   Path: /
   Policies:
    - PolicyName: PutEventsOnDestinationEventBus
     PolicyDocument:
      Version: 2012-10-17
      Statement:
       - Effect: Allow
        Action: "events:PutEvents"
        Resource:
         - !Ref SecurityEventBusArn

The second is the definition of the rule resource. This requires the Amazon Resource Name (ARN) of the event bus where you want to put the rule, the ARN of the target event bus in the security account, and a reference to the SourceToDestinationEventBusRole role:

 SecurityAuditRule2:
  Type: AWS::Events::Rule
  Properties:
   Name: SecurityAuditRuleAccount2
   Description: Audit rule for the Security team in Singapore
   EventBusName: !Ref EventBusArnAccount2 # ARN of the custom event bus in Account 2
   EventPattern:
    source:
     - com.company.marketing
   State: ENABLED
   Targets:
    - Id: SendEventToSecurityEventBusArn
     Arn: !Ref SecurityEventBusArn
     RoleArn: !GetAtt SourceToDestinationEventBusRole.Arn

You can use the AWS SAM CLI to deploy this:

sam deploy -t us-east-1-rules.yaml \
  --stack-name us-east-1-rules \
  --region us-east-1 \
  --profile default \
  --capabilities=CAPABILITY_IAM \
  --parameter-overrides SecurityEventBusArn="arn:aws:events:ap-southeast-1:111111111111:event-bus/SecurityEventBus" EventBusArnAccount1="arn:aws:events:us-east-1:111111111111:event-bus/default" EventBusArnAccount2="arn:aws:events:us-east-1:222222222222:event-bus/custom-eventbus-account-2"

Testing the example application

With the rules deployed across the Regions, you can test by sending events to the event bus in Account 2:

  1. Navigate to the applications/account_2 directory. Here you find an events.json file, which you use as input for the put-events API call.
  2. Run the following command using the AWS CLI. This sends messages to the event bus in us-east-1 which are routed to the security event bus in ap-southeast-1:
    aws events put-events \
     --region us-east-1 \
     --profile [NAMED PROFILE FOR ACCOUNT 2] \
     --entries file://events.json
    

    If you have run this successfully, you see:
    Entries:
    - EventId: a423b35e-3df0-e5dc-b854-db9c42144fa2
    - EventId: 5f22aea8-51ea-371f-7a5f-8300f1c93973
    - EventId: 7279fa46-11a6-7495-d7bb-436e391cfcab
    - EventId: b1e1ecc1-03f7-e3ef-9aa4-5ac3c8625cc7
    - EventId: b68cea94-28e2-bfb9-7b1f-9b2c5089f430
    - EventId: fc48a303-a1b2-bda8-8488-32daa5f809d8
    FailedEntryCount: 0

  3. Navigate to the Amazon CloudWatch console to see a collection of log entries with the events you published. The log group is /aws/events/SecurityAnalysisRule.CloudWatch Logs

Congratulations, you have successfully sent your first events across accounts and Regions!

Conclusion

With cross-Region event routing in EventBridge, you can now route events to and from any AWS Region. This post explains how to manage and configure cross-Region event routing using CloudFormation and EventBridge resource policies to simplify rule propagation across your global event bus infrastructure. Finally, I walk through an example you can deploy to your AWS account.

For more serverless learning resources, visit Serverless Land.

Create a serverless event-driven workflow to ingest and process Microsoft data with AWS Glue and Amazon EventBridge

Post Syndicated from Venkata Sistla original https://aws.amazon.com/blogs/big-data/create-a-serverless-event-driven-workflow-to-ingest-and-process-microsoft-data-with-aws-glue-and-amazon-eventbridge/

Microsoft SharePoint is a document management system for storing files, organizing documents, and sharing and editing documents in collaboration with others. Your organization may want to ingest SharePoint data into your data lake, combine the SharePoint data with other data that’s available in the data lake, and use it for reporting and analytics purposes. AWS Glue is a serverless data integration service that makes it easy to discover, prepare, and combine data for analytics, machine learning, and application development. AWS Glue provides all the capabilities needed for data integration so that you can start analyzing your data and putting it to use in minutes instead of months.

Organizations often manage their data on SharePoint in the form of files and lists, and you can use this data for easier discovery, better auditing, and compliance. SharePoint as a data source is not a typical relational database and the data is mostly semi structured, which is why it’s often difficult to join the SharePoint data with other relational data sources. This post shows how to ingest and process SharePoint lists and files with AWS Glue and Amazon EventBridge, which enables you to join other data that is available in your data lake. We use SharePoint REST APIs with a standard open data protocol (OData) syntax. OData advocates a standard way of implementing REST APIs that allows for SQL-like querying capabilities. OData helps you focus on your business logic while building RESTful APIs without having to worry about the various approaches to define request and response headers, query options, and so on.

AWS Glue event-driven workflows

Unlike a traditional relational database, SharePoint data may or may not change frequently, and it’s difficult to predict the frequency at which your SharePoint server generates new data, which makes it difficult to plan and schedule data processing pipelines efficiently. Running data processing frequently can be expensive, whereas scheduling pipelines to run infrequently can deliver cold data. Similarly, triggering pipelines from an external process can increase complexity, cost, and job startup time.

AWS Glue supports event-driven workflows, a capability that lets developers start AWS Glue workflows based on events delivered by EventBridge. The main reason to choose EventBridge in this architecture is because it allows you to process events, update the target tables, and make information available to consume in near-real time. Because frequency of data change in SharePoint is unpredictable, using EventBridge to capture events as they arrive enables you to run the data processing pipeline only when new data is available.

To get started, you simply create a new AWS Glue trigger of type EVENT and place it as the first trigger in your workflow. You can optionally specify a batching condition. Without event batching, the AWS Glue workflow is triggered every time an EventBridge rule matches, which may result in multiple concurrent workflows running. AWS Glue protects you by setting default limits that restrict the number of concurrent runs of a workflow. You can increase the required limits by opening a support case. Event batching allows you to configure the number of events to buffer or the maximum elapsed time before firing the particular trigger. When the batching condition is met, a workflow run is started. For example, you can trigger your workflow when 100 files are uploaded in Amazon Simple Storage Service (Amazon S3) or 5 minutes after the first upload. We recommend configuring event batching to avoid too many concurrent workflows, and optimize resource usage and cost.

To illustrate this solution better, consider the following use case for a wine manufacturing and distribution company that operates across multiple countries. They currently host all their transactional system’s data on a data lake in Amazon S3. They also use SharePoint lists to capture feedback and comments on wine quality and composition from their suppliers and other stakeholders. The supply chain team wants to join their transactional data with the wine quality comments in SharePoint data to improve their wine quality and manage their production issues better. They want to capture those comments from the SharePoint server within an hour and publish that data to a wine quality dashboard in Amazon QuickSight. With an event-driven approach to ingest and process their SharePoint data, the supply chain team can consume the data in less than an hour.

Overview of solution

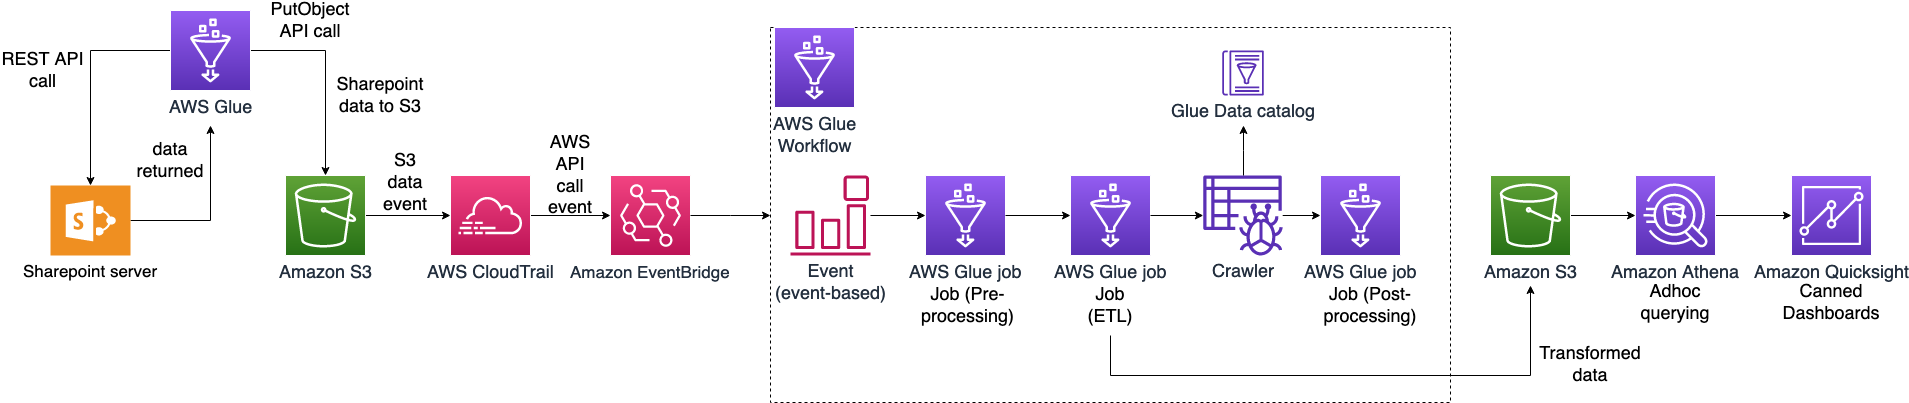
In this post, we walk through a solution to set up an AWS Glue job to ingest SharePoint lists and files into an S3 bucket and an AWS Glue workflow that listens to S3 PutObject data events captured by AWS CloudTrail. This workflow is configured with an event-based trigger to run when an AWS Glue ingest job adds new files into the S3 bucket. The following diagram illustrates the architecture.

To make it simple to deploy, we captured the entire solution in an AWS CloudFormation template that enables you to automatically ingest SharePoint data into Amazon S3. SharePoint uses ClientID and TenantID credentials for authentication and uses Oauth2 for authorization.

The template helps you perform the following steps:

  1. Create an AWS Glue Python shell job to make the REST API call to the SharePoint server and ingest files or lists into Amazon S3.
  2. Create an AWS Glue workflow with a starting trigger of EVENT type.
  3. Configure CloudTrail to log data events, such as PutObject API calls to CloudTrail.
  4. Create a rule in EventBridge to forward the PutObject API events to AWS Glue when they’re emitted by CloudTrail.
  5. Add an AWS Glue event-driven workflow as a target to the EventBridge rule. The workflow gets triggered when the SharePoint ingest AWS Glue job adds new files to the S3 bucket.

Prerequisites

For this walkthrough, you should have the following prerequisites:

Configure SharePoint server authentication details

Before launching the CloudFormation stack, you need to set up your SharePoint server authentication details, namely, TenantID, Tenant, ClientID, ClientSecret, and the SharePoint URL in AWS Systems Manager Parameter Store of the account you’re deploying in. This makes sure that no authentication details are stored in the code and they’re fetched in real time from Parameter Store when the solution is running.

To create your AWS Systems Manager parameters, complete the following steps:

  1. On the Systems Manager console, under Application Management in the navigation pane, choose Parameter Store.
    systems manager
  2. Choose Create Parameter.
  3. For Name, enter the parameter name /DATALAKE/GlueIngest/SharePoint/tenant.
  4. Leave the type as string.
  5. Enter your SharePoint tenant detail into the value field.
  6. Choose Create parameter.
  7. Repeat these steps to create the following parameters:
    1. /DataLake/GlueIngest/SharePoint/tenant
    2. /DataLake/GlueIngest/SharePoint/tenant_id
    3. /DataLake/GlueIngest/SharePoint/client_id/list
    4. /DataLake/GlueIngest/SharePoint/client_secret/list
    5. /DataLake/GlueIngest/SharePoint/client_id/file
    6. /DataLake/GlueIngest/SharePoint/client_secret/file
    7. /DataLake/GlueIngest/SharePoint/url/list
    8. /DataLake/GlueIngest/SharePoint/url/file

Deploy the solution with AWS CloudFormation

For a quick start of this solution, you can deploy the provided CloudFormation stack. This creates all the required resources in your account.

The CloudFormation template generates the following resources:

  • S3 bucket – Stores data, CloudTrail logs, job scripts, and any temporary files generated during the AWS Glue extract, transform, and load (ETL) job run.
  • CloudTrail trail with S3 data events enabled – Enables EventBridge to receive PutObject API call data in a specific bucket.
  • AWS Glue Job – A Python shell job that fetches the data from the SharePoint server.
  • AWS Glue workflow – A data processing pipeline that is comprised of a crawler, jobs, and triggers. This workflow converts uploaded data files into Apache Parquet format.
  • AWS Glue database – The AWS Glue Data Catalog database that holds the tables created in this walkthrough.
  • AWS Glue table – The Data Catalog table representing the Parquet files being converted by the workflow.
  • AWS Lambda function – The AWS Lambda function is used as an AWS CloudFormation custom resource to copy job scripts from an AWS Glue-managed GitHub repository and an AWS Big Data blog S3 bucket to your S3 bucket.
  • IAM roles and policies – We use the following AWS Identity and Access Management (IAM) roles:
    • LambdaExecutionRole – Runs the Lambda function that has permission to upload the job scripts to the S3 bucket.
    • GlueServiceRole – Runs the AWS Glue job that has permission to download the script, read data from the source, and write data to the destination after conversion.
    • EventBridgeGlueExecutionRole – Has permissions to invoke the NotifyEvent API for an AWS Glue workflow.
    • IngestGlueRole – Runs the AWS Glue job that has permission to ingest data into the S3 bucket.

To launch the CloudFormation stack, complete the following steps:

  1. Sign in to the AWS CloudFormation console.
  2. Choose Launch Stack:
  3. Choose Next.
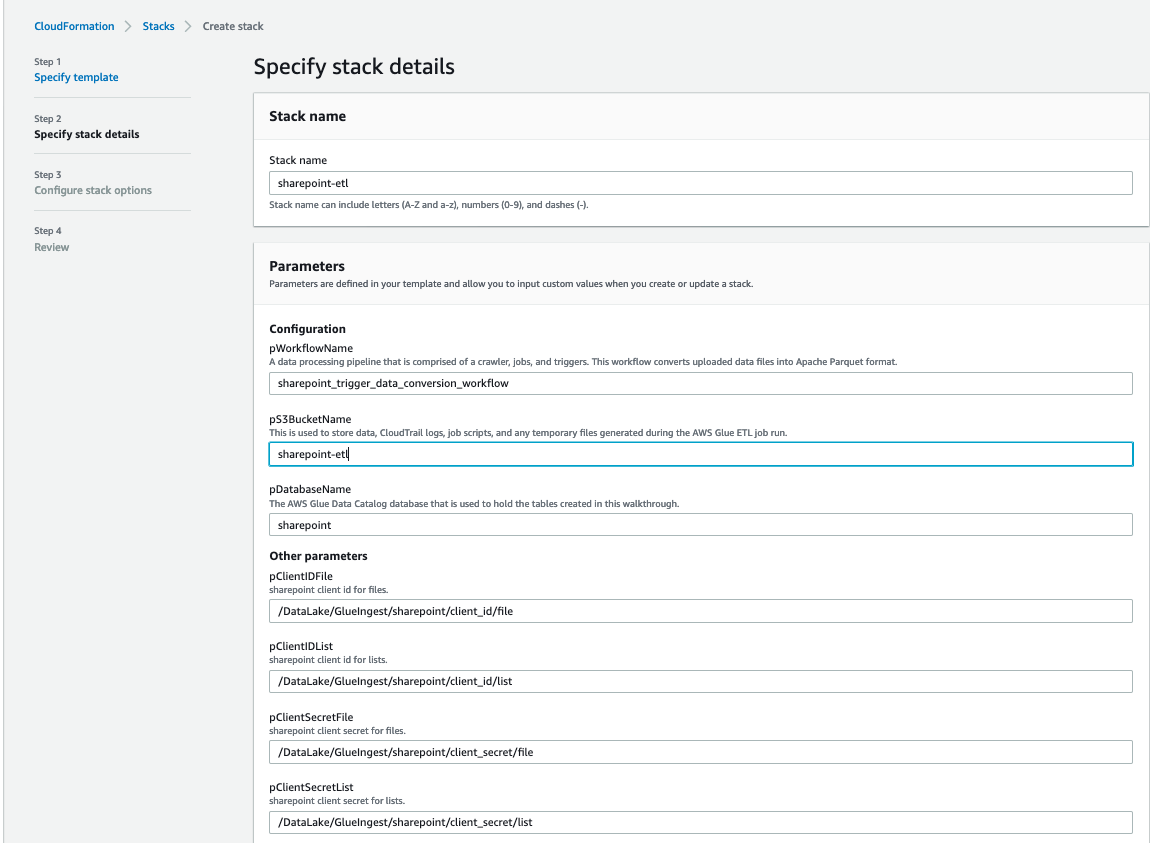
  4. For pS3BucketName, enter the unique name of your new S3 bucket.
  5. Leave pWorkflowName and pDatabaseName as the default.

cloud formation 1

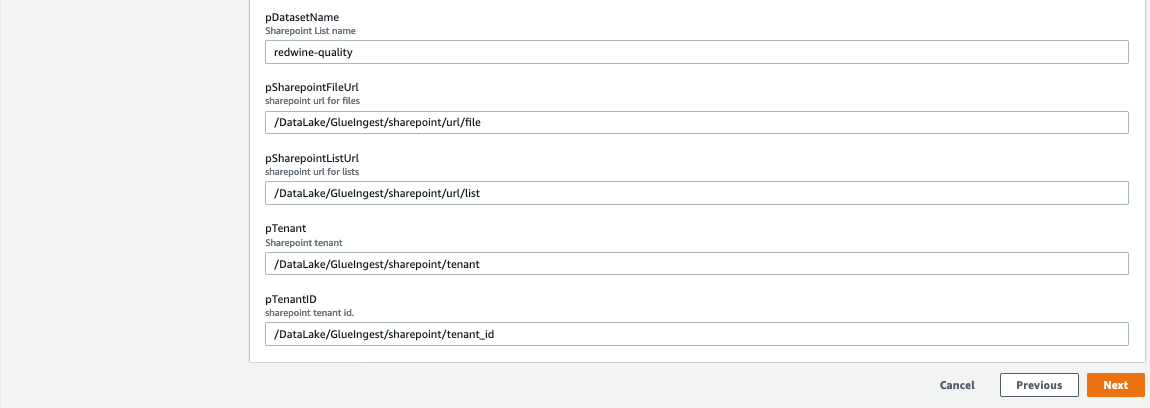
  1. For pDatasetName, enter the SharePoint list name or file name you want to ingest.
  2. Choose Next.

cloud formation 2

  1. On the next page, choose Next.
  2. Review the details on the final page and select I acknowledge that AWS CloudFormation might create IAM resources.
  3. Choose Create.

It takes a few minutes for the stack creation to complete; you can follow the progress on the Events tab.

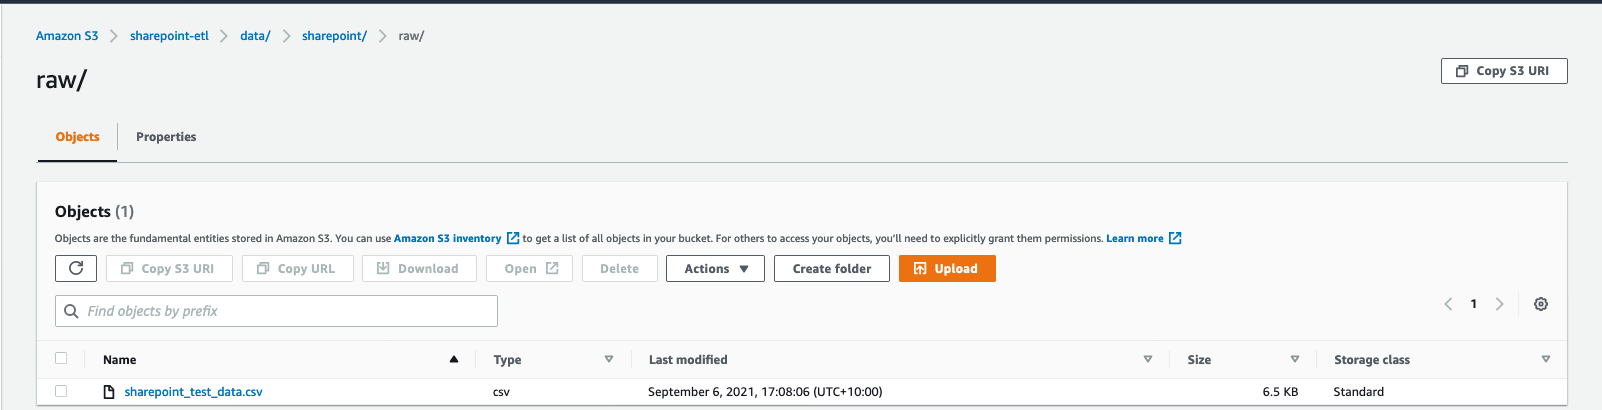
You can run the ingest AWS Glue job either on a schedule or on demand. As the job successfully finishes and ingests data into the raw prefix of the S3 bucket, the AWS Glue workflow runs and transforms the ingested raw CSV files into Parquet files and loads them into the transformed prefix.

Review the EventBridge rule

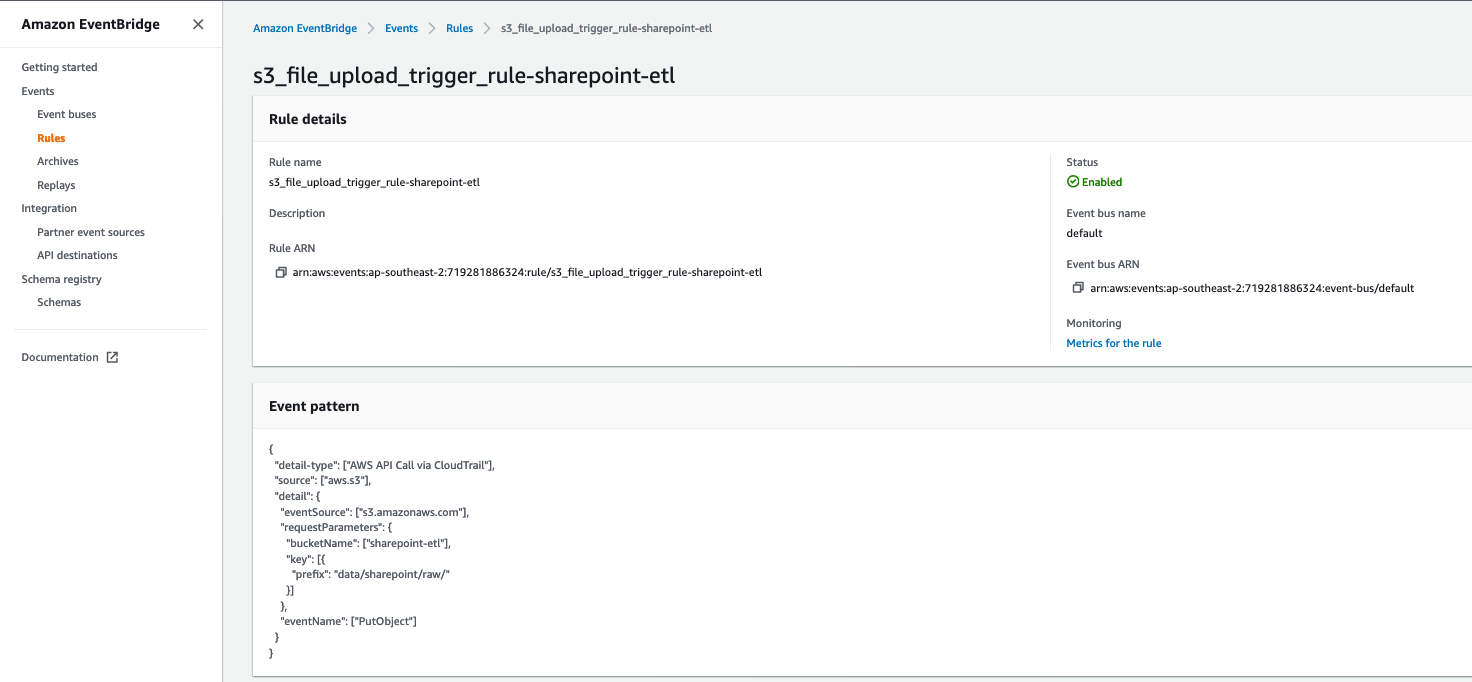
The CloudFormation template created an EventBridge rule to forward S3 PutObject API events to AWS Glue. Let’s review the configuration of the EventBridge rule:

  1. On the EventBridge console, under Events, choose Rules.
  2. Choose the rule s3_file_upload_trigger_rule-<CloudFormation-stack-name>.
  3. Review the information in the Event pattern section.

event bridge

The event pattern shows that this rule is triggered when an S3 object is uploaded to s3://<bucket_name>/data/SharePoint/tablename_raw/. CloudTrail captures the PutObject API calls made and relays them as events to EventBridge.

  1. In the Targets section, you can verify that this EventBridge rule is configured with an AWS Glue workflow as a target.

event bridge target section

Run the ingest AWS Glue job and verify the AWS Glue workflow is triggered successfully

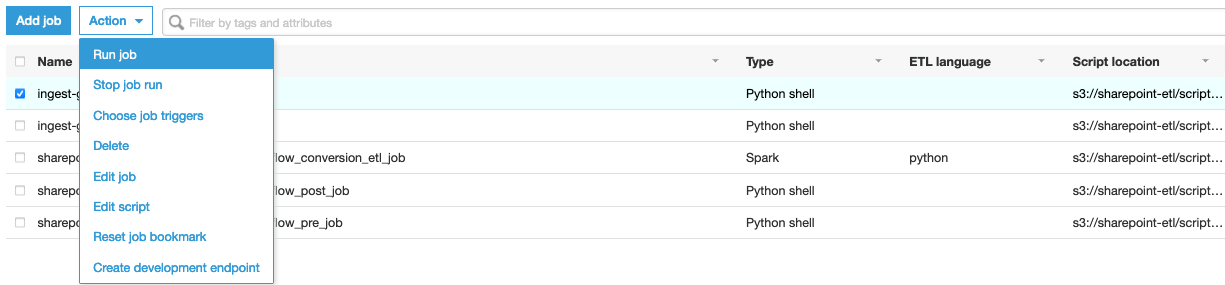
To test the workflow, we run the ingest-glue-job-SharePoint-file job using the following steps:

  1. On the AWS Glue console, select the ingest-glue-job-SharePoint-file job.

glue job

  1. On the Action menu, choose Run job.

glue job action menu

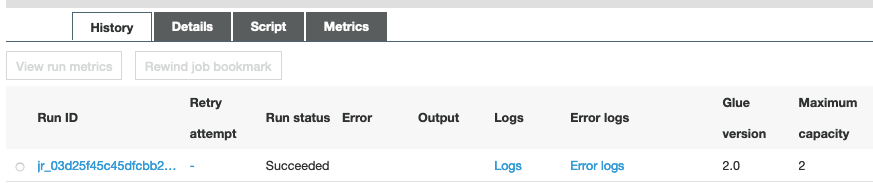
  1. Choose the History tab and wait until the job succeeds.

glue job history tab

You can now see the CSV files in the raw prefix of your S3 bucket.

csv file s3 location

Now the workflow should be triggered.

  1. On the AWS Glue console, validate that your workflow is in the RUNNING state.

glue workflow running status

  1. Choose the workflow to view the run details.
  2. On the History tab of the workflow, choose the current or most recent workflow run.
  3. Choose View run details.

glue workflow visual

When the workflow run status changes to Completed, let’s check the converted files in your S3 bucket.

  1. Switch to the Amazon S3 console, and navigate to your bucket.

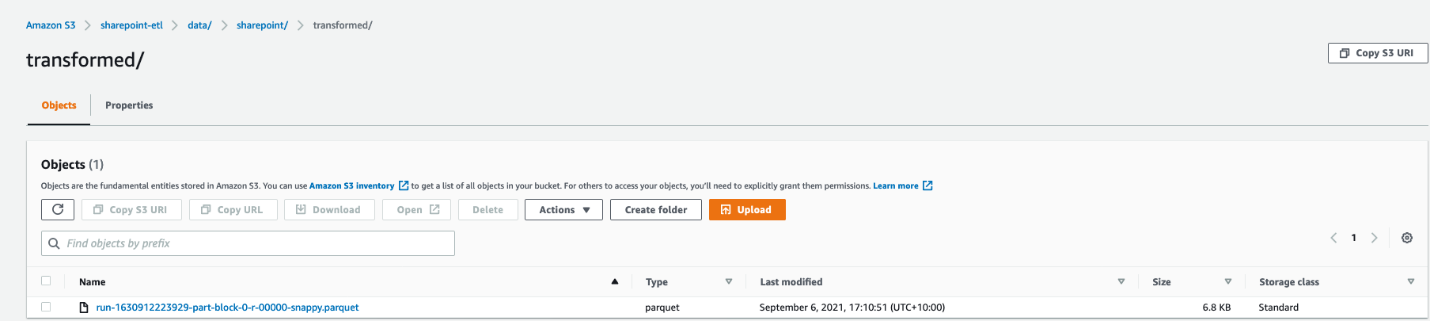
You can see the Parquet files under s3://<bucket_name>/data/SharePoint/tablename_transformed/.

parquet file s3 location

Congratulations! Your workflow ran successfully based on S3 events triggered by uploading files to your bucket. You can verify everything works as expected by running a query against the generated table using Amazon Athena.

Sample wine dataset

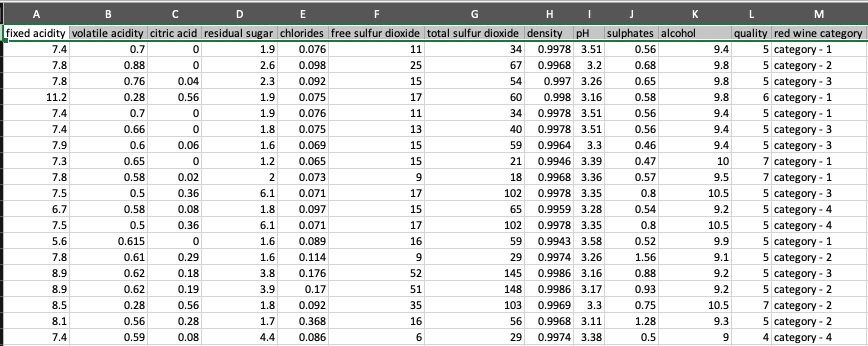
Let’s analyze a sample red wine dataset. The following screenshot shows a SharePoint list that contains various readings that relate to the characteristics of the wine and an associated wine category. This is populated by various wine tasters from multiple countries.

redwine dataset

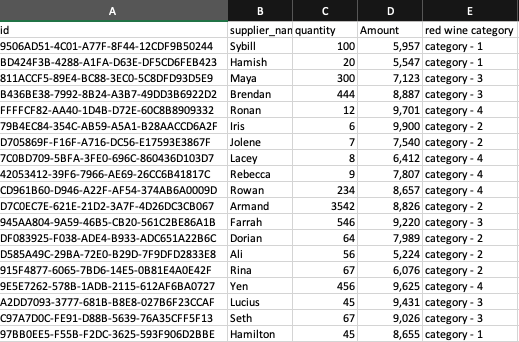
The following screenshot shows a supplier dataset from the data lake with wine categories ordered per supplier.

supplier dataset

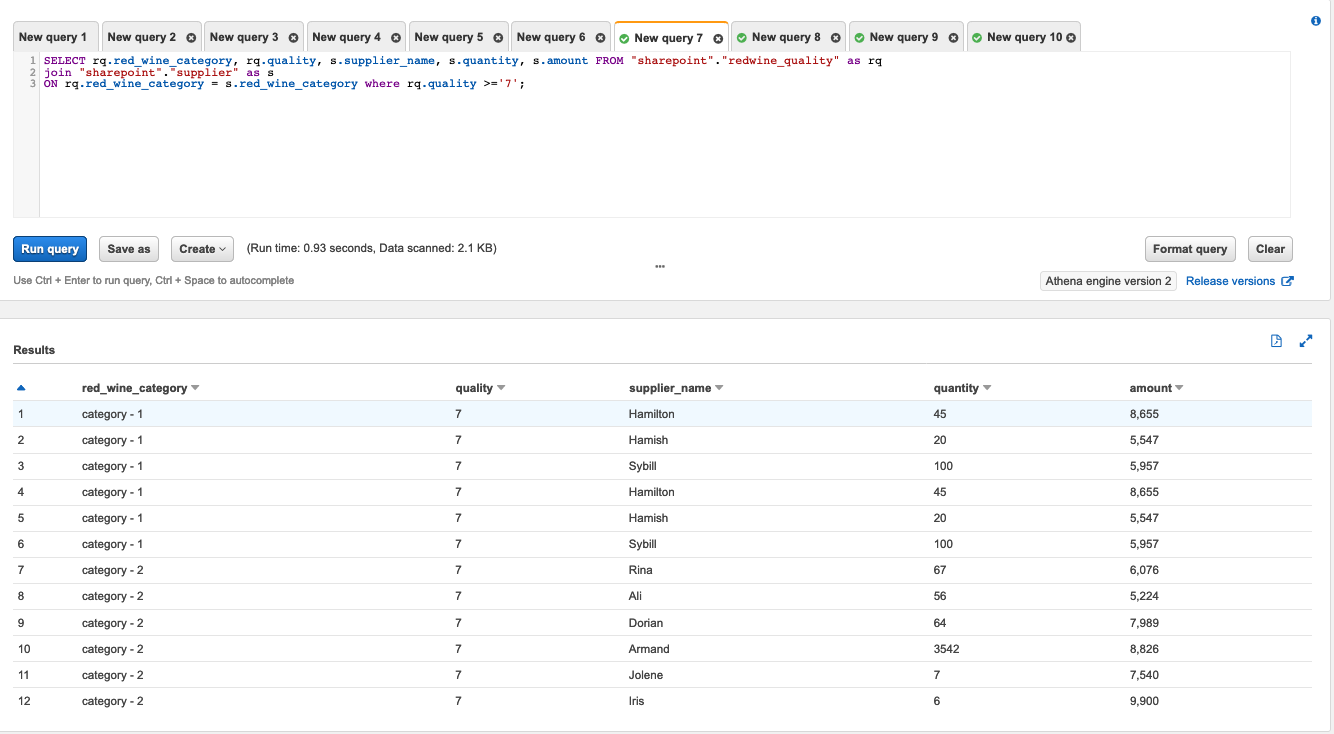
We process the red wine dataset using this solution and use Athena to query the red wine data and supplier data where wine quality is greater than or equal to 7.

athena query and results

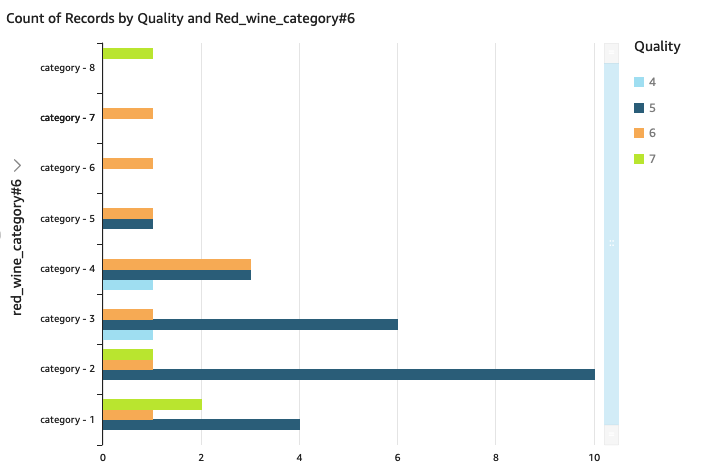
We can visualize the processed dataset using QuickSight.

Clean up

To avoid incurring unnecessary charges, you can use the AWS CloudFormation console to delete the stack that you deployed. This removes all the resources you created when deploying the solution.

Conclusion

Event-driven architectures provide access to near-real-time information and help you make business decisions on fresh data. In this post, we demonstrated how to ingest and process SharePoint data using AWS serverless services like AWS Glue and EventBridge. We saw how to configure a rule in EventBridge to forward events to AWS Glue. You can use this pattern for your analytical use cases, such as joining SharePoint data with other data in your lake to generate insights, or auditing SharePoint data and compliance requirements.


About the Author

Venkata Sistla is a Big Data & Analytics Consultant on the AWS Professional Services team. He specializes in building data processing capabilities and helping customers remove constraints that prevent them from leveraging their data to develop business insights.

Correlate security findings with AWS Security Hub and Amazon EventBridge

Post Syndicated from Marshall Jones original https://aws.amazon.com/blogs/security/correlate-security-findings-with-aws-security-hub-and-amazon-eventbridge/

In this blog post, we’ll walk you through deploying a solution to correlate specific AWS Security Hub findings from multiple AWS services that are related to a single AWS resource, which indicates an increased possibility that a security incident has happened.

AWS Security Hub ingests findings from multiple AWS services, including Amazon GuardDuty, Amazon Inspector, Amazon Macie, AWS Firewall Manager, AWS Identity and Access Management (IAM) Access Analyzer, and AWS Systems Manager Patch Manager. Findings from each service are normalized into the AWS Security Finding Format (ASFF), so that you can review findings in a standardized format and take action quickly. You can use AWS Security Hub to provide a single view of all security-related findings, where you can set up alerting, automatic remediation, and ingestion into third-party incident management systems for specific findings.

Although Security Hub can ingest a vast number of integrations and findings, it cannot create correlation rules like a Security Information and Event Management (SIEM) tool can. However, you can create such rules using EventBridge. It’s important to take a closer look when multiple AWS security services generate findings for a single resource, because this potentially indicates elevated risk. Depending on your environment, the initial number of findings in AWS Security Hub findings may be high, so you may need to prioritize which findings require immediate action. AWS Security Hub natively gives you the ability to filter findings by resource, account, and many other details. With the solution in this post, when one of these correlated sets of findings is detected, a new finding is created and pushed to AWS Security Hub by using the Security Hub BatchImportFindings API operation. You can then respond to these new security incident-oriented findings through ticketing, chat, or incident management systems.

Prerequisites

This solution requires that you have AWS Security Hub enabled in your AWS account. In addition to AWS Security Hub, the following services must be enabled and integrated to AWS Security Hub:

Solution overview

In this solution, you will use a combination of AWS Security Hub, Amazon EventBridge, AWS Lambda, and Amazon DynamoDB to ingest and correlate specific findings that indicate a higher likelihood of a security incident. Each correlation is focused on multiple specific AWS security service findings for a single AWS resource.

The following list shows the correlated findings that are detected by this solution. The Description section for each finding correlation provides context for that correlation, the Remediation section provides general recommendations for remediation, and the Prevention/Detection section provides guidance to either prevent or detect one or more findings within the correlation. With the code provided, you can also add more correlations than those listed here by modifying the Cloud Development Kit (CDK) code and AWS Lambda code. The Solution workflow section breaks down the flow of the solution. If you choose to implement automatic remediation, each finding correlation will be created with the following AWS Security Hub Finding Format (ASFF) fields:

- Severity: CRITICAL
- ProductArn: arn:aws:securityhub:<REGION>:<AWS_ACCOUNT_ID>:product/<AWS_ACCOUNT_ID>/default

These correlated findings are created as part of this solution:

  1. Any Amazon GuardDuty Backdoor findings and three critical common vulnerabilities and exposures (CVEs) from Amazon Inspector that are associated with the same Amazon Elastic Compute Cloud (Amazon EC2) instance.
    • Description: Amazon Inspector has found at least three critical CVEs on the EC2 instance. CVEs indicate that the EC2 instance is currently vulnerable or exposed. The EC2 instance is also performing backdoor activities. The combination of these two findings is a stronger indication of an elevated security incident.
    • Remediation: It’s recommended that you isolate the EC2 instance and follow standard protocol to triage the EC2 instance to verify if the instance has been compromised. If the instance has been compromised, follow your standard Incident Response process for post-instance compromise and forensics. Redeploy a backup of the EC2 instance by using an up-to-date hardened Amazon Machine Image (AMI) or apply all security-related patches to the redeployed EC2 instance.
    • Prevention/Detection: To mitigate or prevent an Amazon EC2 instance from missing critical security updates, consider using Amazon Systems Manager Patch Manager to automate installing security-related patching for managed instances. Alternatively, you can provide developers up-to-date hardened Amazon Machine Images (AMI) by using Amazon EC2 Image Builder. For detection, you can set the AMI property called ‘DeprecationTime’ to indicate when the AMI will become outdated and respond accordingly.
  2. An Amazon Macie sensitive data finding and an Amazon GuardDuty S3 exfiltration finding for the same Amazon Simple Storage Service (Amazon S3) bucket.
    • Description: Amazon Macie has scanned an Amazon S3 bucket and found a possible match for sensitive data. Amazon GuardDuty has detected a possible exfiltration finding for the same Amazon S3 bucket. The combination of these findings indicates a higher risk security incident.
    • Remediation: It’s recommended that you review the source IP and/or IAM principal that is making the S3 object reads against the S3 bucket. If the source IP and/or IAM principal is not authorized to access sensitive data within the S3 bucket, follow your standard Incident Response process for post-compromise plan for S3 exfiltration. For example, you can restrict an IAM principal’s permissions, revoke existing credentials or unauthorized sessions, restricting access via the Amazon S3 bucket policy, or using the Amazon S3 Block Public Access feature.
    • Prevention/Detection: To mitigate or prevent exposure of sensitive data within Amazon S3, ensure the Amazon S3 buckets are using least-privilege bucket policies and are not publicly accessible. Alternatively, you can use the Amazon S3 Block Public Access feature. Review your AWS environment to make sure you are following Amazon S3 security best practices. For detection, you can use Amazon Config to track and auto-remediate Amazon S3 buckets that do not have logging and encryption enabled or publicly accessible.
  3. AWS Security Hub detects an EC2 instance with a public IP and unrestricted VPC Security Group; Amazon GuardDuty unusual network traffic behavior finding; and Amazon GuardDuty brute force finding.
    • Description: AWS Security Hub has detected an EC2 instance that has a public IP address attached and a VPC Security Group that allows traffic for ports outside of ports 80 and 443. Amazon GuardDuty has also determined that the EC2 instance has multiple brute force attempts and is communicating with a remote host on an unusual port that the EC2 instance has not previously used for network communication. The correlation of these lower-severity findings indicates a higher-severity security incident.
    • Remediation: It’s recommended that you isolate the EC2 instance and follow standard protocol to triage the EC2 instance to verify if the instance has been compromised. If the instance has been compromised, follow your standard Incident Response process for post-instance compromise and forensics.
    • Prevention/Detection: To mitigate or prevent these events from occurring within your AWS environment, determine whether the EC2 instance requires a public-facing IP address and review the VPC Security Group(s) has only the required rules configured. Review your AWS environment to make sure you are following Amazon EC2 best practices. For detection, consider implementing AWS Firewall Manager to continuously audit and limit VPC Security Groups.

The solution workflow, shown in Figure 1, is as follows:

  1. Security Hub ingests findings from integrated AWS security services.
  2. An EventBridge rule is invoked based on Security Hub findings in GuardDuty, Macie, Amazon Inspector, and Security Hub security standards.
  3. The EventBridge rule invokes a Lambda function to store the Security Hub finding, which is passed via EventBridge, in a DynamoDB table for further analysis.
  4. After the new findings are stored in DynamoDB, another Lambda function is invoked by using Dynamo StreamSets and a time-to-live (TTL) set to delete finding entries that are older than 30 days.
  5. The second Lambda function looks at the resource associated with the new finding entry in the DynamoDB table. The Lambda function checks for specific Security Hub findings that are associated with the same resource.
Figure 1: Architecture diagram describing the flow of the solution

Figure 1: Architecture diagram describing the flow of the solution

Solution deployment

You can deploy the solution through either the AWS Management Console or the AWS Cloud Development Kit (AWS CDK).

To deploy the solution by using the AWS Management Console

In your account, launch the AWS CloudFormation template by choosing the following Launch Stack button. It will take approximately 10 minutes for the CloudFormation stack to complete.
Select the Launch Stack button to launch the template

To deploy the solution by using the AWS CDK

You can find the latest code in the aws-security GitHub repository where you can also contribute to the sample code. The following commands show how to deploy the solution by using the AWS CDK. First, the CDK initializes your environment and uploads the AWS Lambda assets to Amazon S3. Then, you can deploy the solution to your account. For <INSERT_AWS_ACCOUNT>, specify the account number, and for <INSERT_REGION>, specify the AWS Region that you want the solution deployed to.

cdk bootstrap aws://<INSERT_AWS_ACCOUNT>/<INSERT_REGION>

cdk deploy

Conclusion

In this blog post, we walked through a solution to use AWS services, including Amazon EventBridge, AWS Lambda, and Amazon DynamoDB, to correlate AWS Security Hub findings from multiple different AWS security services. The solution provides a framework to prioritize specific sets of findings that indicate a higher likelihood that a security incident has occurred, so that you can prioritize and improve your security response.

If you have feedback about this post, submit comments in the Comments section below. If you have any questions about this post, start a thread on the AWS Security Hub forum.

Want more AWS Security how-to content, news, and feature announcements? Follow us on Twitter.

Author

Marshall Jones

Marshall is a worldwide security specialist solutions architect at AWS. His background is in AWS consulting and security architecture, focused on a variety of security domains including edge, threat detection, and compliance. Today, he is focused on helping enterprise AWS customers adopt and operationalize AWS security services to increase security effectiveness and reduce risk.

Author

Jonathan Nguyen

Jonathan is a shared delivery team senior security consultant at AWS. His background is in AWS security, with a focus on threat detection and incident response. He helps enterprise customers develop a comprehensive AWS security strategy, deploy security solutions at scale, and train customers on AWS security best practices.

Building dynamic Amazon SNS subscriptions for auto scaling container workloads 

Post Syndicated from James Beswick original https://aws.amazon.com/blogs/compute/building-dynamic-amazon-sns-subscriptions-for-auto-scaling-container-workloads/

This post is written by Mithun Mallick, Senior Specialist Solutions Architect, App Integration.

Amazon Simple Notification Service (SNS) is a serverless publish subscribe messaging service. It supports a push-based subscriptions model where subscribers must register an endpoint to receive messages. Amazon Simple Queue Service (SQS) is one such endpoint, which is used by applications to receive messages published on an SNS topic.

With containerized applications, the container instances poll the queue and receive the messages. However, containerized applications can scale out for a variety of reasons. The creation of an SQS queue for each new container instance creates maintenance overhead for customers. You must also clean up the SNS-SQS subscription once the instance scales in.

This blog walks through a dynamic subscription solution, which automates the creation, subscription, and deletion of SQS queues for an Auto Scaling group of containers running in Amazon Elastic Container Service (ECS).

Overview

The solution is based on the use of events to achieve the dynamic subscription pattern. ECS uses the concept of tasks to create an instance of a container. You can find more details on ECS tasks in the ECS documentation.

This solution uses the events generated by ECS to manage the complete lifecycle of an SNS-SQS subscription. It uses the task ID as the name of the queue that is used by the ECS instance for pulling messages. More details on the ECS task ID can be found in the task documentation.

This also uses Amazon EventBridge to apply rules on ECS events and trigger an AWS Lambda function. The first rule detects the running state of an ECS task and triggers a Lambda function, which creates the SQS queue with the task ID as queue name. It also grants permission to the queue and creates the SNS subscription on the topic.

As the container instance starts up, it can send a request to its metadata URL and retrieve the task ID. The task ID is used by the container instance to poll for messages. If the container instance terminates, ECS generates a task stopped event. This event matches a rule in Amazon EventBridge and triggers a Lambda function. The Lambda function retrieves the task ID, deletes the queue, and deletes the subscription from the SNS topic. The solution decouples the container instance from any overhead in maintaining queues, applying permissions, or managing subscriptions. The security permissions for all SNS-SQS management are handled by the Lambda functions.

This diagram shows the solution architecture:

Solution architecture

Events from ECS are sent to the default event bus. There are various events that are generated as part of the lifecycle of an ECS task. You can find more on the various ECS task states in ECS task documentation. This solution uses ECS as the container orchestration service but you can also use Amazon Elastic Kubernetes Service.(EKS). For EKS, you must apply the rules for EKS task state events.

Walkthrough of the implementation

The code snippets are shortened for brevity. The full source code of the solution is in the GitHub repository. The solution uses AWS Serverless Application Model (AWS SAM) for deployment.

SNS topic

The SNS topic is used to send notifications to the ECS tasks. The following snippet from the AWS SAM template shows the definition of the SNS topic:

  SNSDynamicSubsTopic:
    Type: AWS::SNS::Topic
    Properties:
      TopicName: !Ref DynamicSubTopicName

Container instance

The container instance subscribes to the SNS topic using an SQS queue. The container image is a Java class that reads messages from an SQS queue and prints them in the logs. The following code shows some of the message processor implementation:

AmazonSQS sqs = AmazonSQSClientBuilder.defaultClient();
AmazonSQSResponder responder = AmazonSQSResponderClientBuilder.standard()
        .withAmazonSQS(sqs)
        .build();

SQSMessageConsumer consumer = SQSMessageConsumerBuilder.standard()
        .withAmazonSQS(responder.getAmazonSQS())
        .withQueueUrl(queue_url)
        .withConsumer(message -> {
            System.out.println("The message is " + message.getBody());
            sqs.deleteMessage(queue_url,message.getReceiptHandle());

        }).build();
consumer.start();

The queue_url highlighted is the task ID of the ECS task. It is retrieved in the constructor of the class:

String metaDataURL = map.get("ECS_CONTAINER_METADATA_URI_V4");

HttpGet request = new HttpGet(metaDataURL);
CloseableHttpResponse response = httpClient.execute(request);

HttpEntity entity = response.getEntity();
if (entity != null) {
    String result = EntityUtils.toString(entity);
    String taskARN = JsonPath.read(result, "$['Labels']['com.amazonaws.ecs.task-arn']").toString();
    String[] arnTokens = taskARN.split("/");
    taskId = arnTokens[arnTokens.length-1];
    System.out.println("The task arn : "+taskId);
}

queue_url = sqs.getQueueUrl(taskId).getQueueUrl();

The queue URL is constructed from the task ID of the container. Each queue is dedicated to each of the tasks or the instances of the container running in ECS.

EventBridge rules

The following event pattern on the default event bus captures events that match the start of the container instance. The rule triggers a Lambda function:

      EventPattern:
        source:
          - aws.ecs
        detail-type:
          - "ECS Task State Change"
        detail:
          desiredStatus:
            - "RUNNING"
          lastStatus:  
            - "RUNNING"

The start rule routes events to a Lambda function that creates a queue with the name as the task ID. It creates the subscription to the SNS topic and grants permission on the queue to receive messages from the topic.

This event pattern matches STOPPED events of the container task. It also triggers a Lambda function to delete the queue and the associated subscription:

      EventPattern:
        source:
          - aws.ecs
        detail-type:
          - "ECS Task State Change"
        detail:
          desiredStatus:
            - "STOPPED"
          lastStatus:  
            - "STOPPED"

Lambda functions

There are two Lambda functions that perform the queue creation, subscription, authorization, and deletion.

The SNS-SQS-Subscription-Service

The following code creates the queue based on the task id, applies policies, and subscribes it to the topic. It also stores the subscription ARN in a Amazon DynamoDB table:

# get the task id from the event
taskArn = event['detail']['taskArn']
taskArnTokens = taskArn.split('/')
taskId = taskArnTokens[len(taskArnTokens)-1]

create_queue_resp = sqs_client.create_queue(QueueName=queue_name)

response = sns.subscribe(TopicArn=topic_arn, Protocol="sqs", Endpoint=queue_arn)

ddbresponse = dynamodb.update_item(
    TableName=SQS_CONTAINER_MAPPING_TABLE,
    Key={
        'id': {
            'S' : taskId.strip()
        }
    },
    AttributeUpdates={
        'SubscriptionArn':{
            'Value': {
                'S': subscription_arn
            }
        }
    },
    ReturnValues="UPDATED_NEW"
)

The cleanup service

The cleanup function is triggered when the container instance is stopped. It fetches the subscription ARN from the DynamoDB table based on the taskId. It deletes the subscription from the topic and deletes the queue. You can modify this code to include any other cleanup actions or trigger a workflow. The main part of the function code is:

taskId = taskArnTokens[len(taskArnTokens)-1]

ddbresponse = dynamodb.get_item(TableName=SQS_CONTAINER_MAPPING_TABLE,Key={'id': { 'S' : taskId}})
snsresp = sns.unsubscribe(SubscriptionArn=subscription_arn)

queuedelresp = sqs_client.delete_queue(QueueUrl=queue_url)

Conclusion

This blog shows an event driven approach to handling dynamic SNS subscription requirements. It relies on the ECS service events to trigger appropriate Lambda functions. These create the subscription queue, subscribe it to a topic, and delete it once the container instance is terminated.

The approach also allows the container application logic to focus only on consuming and processing the messages from the queue. It does not need any additional permissions to subscribe or unsubscribe from the topic or apply any additional permissions on the queue. Although the solution has been presented using ECS as the container orchestration service, it can be applied for EKS by using its service events.

For more serverless learning resources, visit Serverless Land.

ICYMI: Serverless Q3 2021

Post Syndicated from James Beswick original https://aws.amazon.com/blogs/compute/icymi-serverless-q3-2021/

Welcome to the 15th edition of the AWS Serverless ICYMI (in case you missed it) quarterly recap. Every quarter, we share all of the most recent product launches, feature enhancements, blog posts, webinars, Twitch live streams, and other interesting things that you might have missed!

Q3 calendar

In case you missed our last ICYMI, check out what happened last quarter here.

AWS Lambda

You can now choose next-generation AWS Graviton2 processors in your Lambda functions. This Arm-based processor architecture can provide up to 19% better performance at 20% lower cost. You can configure functions to use Graviton2 in the AWS Management Console, API, CloudFormation, and CDK. We recommend using the AWS Lambda Power Tuning tool to see how your function compare and determine the price improvement you may see.

All Lambda runtimes built on Amazon Linux 2 support Graviton2, with the exception of versions approaching end-of-support. The AWS Free Tier for Lambda includes functions powered by both x86 and Arm-based architectures.

Create Lambda function with new arm64 option

You can also use the Python 3.9 runtime to develop Lambda functions. You can choose this runtime version in the AWS Management Console, AWS CLI, or AWS Serverless Application Model (AWS SAM). Version 3.9 includes a range of new features and performance improvements.

Lambda now supports Amazon MQ for RabbitMQ as an event source. This makes it easier to develop serverless applications that are triggered by messages in a RabbitMQ queue. This integration does not require a consumer application to monitor queues for updates. The connectivity with the Amazon MQ message broker is managed by the Lambda service.

Lambda has added support for up to 10 GB of memory and 6 vCPU cores in AWS GovCloud (US) Regions and in the Middle East (Bahrain), Asia Pacific (Osaka), and Asia Pacific (Hong Kong) Regions.

AWS Step Functions

Step Functions now integrates with the AWS SDK, supporting over 200 AWS services and 9,000 API actions. You can call services directly from the Amazon States Language definition in the resource field of the task state. This allows you to work with services like DynamoDB, AWS Glue Jobs, or Amazon Textract directly from a Step Functions state machine. To learn more, see the SDK integration tutorial.

AWS Amplify

The Amplify Admin UI now supports importing existing Amazon Cognito user pools and identity pools. This allows you to configure multi-platform apps to use the same user pools with different client IDs.

Amplify CLI now enables command hooks, allowing you to run custom scripts in the lifecycle of CLI commands. You can create bash scripts that run before, during, or after CLI commands. Amplify CLI has also added support for storing environment variables and secrets used by Lambda functions.

Amplify Geo is in developer preview and helps developers provide location-aware features to their frontend web and mobile applications. This uses the Amazon Location Service to provide map UI components.

Amazon EventBridge

The EventBridge schema registry now supports discovery of cross-account events. When schema registry is enabled on a bus, it now generates schemes for events originating from another account. This helps organize and find events in multi-account applications.

Amazon DynamoDB

DynamoDB console

The new DynamoDB console experience is now the default for viewing and managing DynamoDB tables. This makes it easier to manage tables from the navigation pane and also provided a new dedicated Items page. There is also contextual guidance and step-by-step assistance to help you perform common tasks more quickly.

API Gateway

API Gateway can now authenticate clients using certificate-based mutual TLS. Previously, this feature only supported AWS Certificate Manager (ACM). Now, customers can use a server certificate issued by a third-party certificate authority or ACM Private CA. Read more about using mutual TLS authentication with API Gateway.

The Serverless Developer Advocacy team built the Amazon API Gateway CORS Configurator to help you configure cross origin resource scripting (CORS) for REST and HTTP APIs. Fill in the information specific to your API and the AWS SAM configuration is generated for you.

Serverless blog posts

July

August

September

Tech Talks & Events

We hold AWS Online Tech Talks covering serverless topics throughout the year. These are listed in the Serverless section of the AWS Online Tech Talks page. We also regularly deliver talks at conferences and events around the world, speak on podcasts, and record videos you can find to learn in bite-sized chunks.

Here are some from Q3:

Videos

Serverless Land

Serverless Office Hours – Tues 10 AM PT

Weekly live virtual office hours. In each session we talk about a specific topic or technology related to serverless and open it up to helping you with your real serverless challenges and issues. Ask us anything you want about serverless technologies and applications.

July

August

September

DynamoDB Office Hours

Are you an Amazon DynamoDB customer with a technical question you need answered? If so, join us for weekly Office Hours on the AWS Twitch channel led by Rick Houlihan, AWS principal technologist and Amazon DynamoDB expert. See upcoming and previous shows

Still looking for more?

The Serverless landing page has more information. The Lambda resources page contains case studies, webinars, whitepapers, customer stories, reference architectures, and even more Getting Started tutorials.

You can also follow the Serverless Developer Advocacy team on Twitter to see the latest news, follow conversations, and interact with the team.

Detect Adversary Behavior in Milliseconds with CrowdStrike and Amazon EventBridge

Post Syndicated from Joby Bett original https://aws.amazon.com/blogs/architecture/detect-adversary-behavior-in-seconds-with-crowdstrike-and-amazon-eventbridge/

By integrating Amazon EventBridge with Falcon Horizon, CrowdStrike has developed a real-time, cloud-based solution that allows you to detect threats in less than a second. This solution uses AWS CloudTrail and EventBridge. CloudTrail allows governance, compliance, operational auditing, and risk auditing of your AWS account. EventBridge is a serverless event bus that makes it easier to build event-driven applications at scale.

In this blog post, we’ll cover the challenges presented by using traditional log file-based security monitoring. We will also discuss how CrowdStrike used EventBridge to create an innovative, real-time cloud security solution that enables high-speed, event-driven alerts that detect malicious actors in milliseconds.

Challenges of log file-based security monitoring

Being able to detect malicious actors in your environment is necessary to stay secure in the cloud. With the growing volume, velocity, and variety of cloud logs, log file-based monitoring makes it difficult to reveal adverse behaviors in time to stop breaches.

When an attack is in progress, a security operations center (SOC) analyst has an average of one minute to detect the threat, ten minutes to understand it, and one hour to contain it. If you cannot meet this 1/10/60 minute rule, you may have a costly breach that may move laterally and explode exponentially across the cloud estate.

Let’s look at a real-life scenario. When a malicious actor attempts a ransom attack that targets high-value data in an Amazon Simple Storage Service (Amazon S3) bucket, it can involve activities in various parts of the cloud services in a brief time window.

These example activities can involve:

  • AWS Identity and Access Management (IAM): account enumeration, disabling multi-factor authentication (MFA), account hijacking, privilege escalation, etc.
  • Amazon Elastic Compute Cloud (Amazon EC2): instance profile privilege escalation, file exchange tool installs, etc.
  • Amazon S3: bucket and object enumeration; impair bucket encryption and versioning; bucket policy manipulation; getObject, putObject, and deleteObject APIs, etc.

With siloed log file-based monitoring, detecting, understanding, and containing a ransom attack while still meeting the 1/10/60 rule is difficult. This is because log files are written in batches, and files are typically only created every 5 minutes. Once the log file is written, it still needs to be fetched and processed. This means that you lose the ability to dynamically correlate disparate activities.

To summarize, top-level challenges of log file-based monitoring are:

  1. Lag time between the breach and the detection
  2. Inability to correlate disparate activities to reveal sophisticated attack patterns
  3. Frequent false positive alarms that obscure true positives
  4. High operational cost of log file synchronizations and reprocessing
  5. Log analysis tool maintenance for fast growing log volume

Security and compliance is a shared responsibility between AWS and the customer. We protect the infrastructure that runs all of the services offered in the AWS Cloud. For abstracted services, such as  Amazon S3, we operate the infrastructure layer, the operating system, and platforms, and customers access the endpoints to store and retrieve data.

You are responsible for managing your data (including encryption options), classifying assets, and using IAM tools to apply the appropriate permissions.

Indicators of attack by CrowdStrike with Amazon EventBridge

In real-world cloud breach scenarios, timeliness of observation, detection, and remediation is critical. CrowdStrike Falcon Horizon IOA is built on an event-driven architecture based on EventBridge and operates at a velocity that can outpace attackers.

CrowdStrike Falcon Horizon IOA performs the following core actions:

  • Observe: EventBridge streams CloudTrail log files across accounts to the CrowdStrike platform as activity occurs. Parallelism is enabled via event bus rules, which enables CrowdStrike to avoid the five-minute lag in fetching the log files and dynamically correlate disparate activities. The CrowdStrike platform observes end-to-end activities from AWS services and infrastructure hosted in the accounts protected by CrowdStrike.
  • Detect: Falcon Horizon invokes indicators of attack (IOA) detection algorithms that reveal adversarial or anomalous activities from the log file streams. It correlates new and historical events in real time while enriching the events with CrowdStrike threat intelligence data. Each IOA is prioritized with the likelihood of activity being malicious via scoring and mapped to the MITRE ATT&CK framework.
  • Remediate: The detected IOA is presented with remediation steps. Depending on the score, applying the remediations quickly can be critical before the attack spreads.
  • Prevent: Unremediated insecure configurations are revealed via indicators of misconfiguration (IOM) in Falcon Horizon. Applying the remediation steps from IOM can prevent future breaches.

Key differentiators of IOA from Falcon Horizon are:

  • Observability of wider attack surfaces with heterogeneous event sources
  • Detection of sophisticated tactics, techniques, and procedures (TTPs) with dynamic event correlation
  • Event enrichment with threat intelligence that aids prioritization and reduces alert fatigue
  • Low latency between malicious activity occurrence and corresponding detection
  • Insight into attacks for each adversarial event from MITRE ATT&CK framework

High-level architecture

Event-driven architectures provide advantages for integrating varied systems over legacy log file-based approaches. For securing cloud attack surfaces against the ever-evolving TTPs, a robust event-driven architecture at scale is a key differentiator.

CrowdStrike maximizes the advantages of event-driven architecture by integrating with EventBridge, as shown in Figure 1. EventBridge allows observing CloudTrail logs in event streams. It also simplifies log centralization from a number of accounts with its direct source-to-target integration across accounts, as follows:

  1. CrowdStrike hosts an EventBridge with central event buses that consume the stream of CloudTrail log events from a multitude of customer AWS accounts.
  2. Within customer accounts, EventBridge rules listen to the local CloudTrail and stream each activity as an event to the centralized EventBridge hosted by CrowdStrike.
  3. CrowdStrike’s event-driven platform detects adversarial behaviors from the event streams in real time. The detection is performed against incoming events in conjunction with historical events. The context that comes from connecting new and historical events minimizes false positives and improves alert efficacy.
  4. Events are enriched with CrowdStrike threat intelligence data that provides additional insight of the attack to SOC analysts and incident responders.
CrowdStrike Falcon Horizon IOA architecture

Figure 1. CrowdStrike Falcon Horizon IOA architecture

As data is received by the centralized EventBridge, CrowdStrike relies on unique customer ID and AWS Region in each event to provide integrity and isolation.

EventBridge allows relatively hassle-free customer onboarding by using cross account rules to transfer customer CloudTrail data into one common event bus that can then be used to filter and selectively forward the data into the Falcon Horizon platform for analysis and mitigation.

Conclusion

As your organization’s cloud footprint grows, visibility into end-to-end activities in a timely manner is critical for maintaining a safe environment for your business to operate. EventBridge allows event-driven monitoring of CloudTrail logs at scale.

CrowdStrike Falcon Horizon IOA, powered by EventBridge, observes end-to-end cloud activities at high speeds at scale. Paired with targeted detection algorithms from in-house threat detection experts and threat intelligence data, Falcon Horizon IOA combats emerging threats against the cloud control plane with its cutting-edge event-driven architecture.

Related information

How to automate incident response to security events with AWS Systems Manager Incident Manager

Post Syndicated from Sumit Patel original https://aws.amazon.com/blogs/security/how-to-automate-incident-response-to-security-events-with-aws-systems-manager-incident-manager/

Incident response is a core security capability for organizations to develop, and a core element in the AWS Cloud Adoption Framework (AWS CAF). Responding to security incidents quickly is important to minimize their impacts. Automating incident response helps you scale your capabilities, rapidly reduce the scope of compromised resources, and reduce repetitive work by your security team.

In this post, I show you how to use Incident Manager, a capability of AWS Systems Manager, to build an effective automated incident management and response solution to security events.

You’ll walk through three common security-related events and how you can use Incident Manager to automate your response.

  • AWS account root user activity: An Amazon Web Services (AWS) account root user has full access to all your resources for all AWS services, including billing information. It’s therefore elemental to adhere to the best practice of using the root user only to create your first IAM user and securely lock away the root user credentials and use them to perform only a few account and service management tasks. And it is critical to be aware when root user activity occurs in your AWS account.
  • Amazon GuardDuty high severity findings: Amazon GuardDuty is a threat detection service that continuously monitors for malicious or unauthorized behavior to help protect your AWS accounts and workloads. In this blog post, you’ll learn how to initiate an incident response plan whenever a high severity finding is discovered.
  • AWS Config rule change and S3 bucket allowing public access: AWS Config enables continuous monitoring of your AWS resources, making it simple to assess, audit, and record resource configurations and changes. You will use AWS Config to monitor your Amazon Simple Storage Service (S3) bucket ACLs and policies for settings that allow public read or public write access.

Prerequisites

If this is your first time using Incident Manager, follow the initial onboarding steps in Getting prepared with Incident Manager.

Incident Manager can start managing incidents automatically using Amazon CloudWatch or Amazon EventBridge. For the solution in this blog post, you will use EventBridge to capture events and start an incident.

To complete the steps in this walkthrough, you need the following:

Create an Incident Manager response plan

A response plan ties together the contacts, escalation plan, and runbook. When an incident occurs, a response plan defines who to engage, how to engage, which runbook to initiate, and which metrics to monitor. By creating a well-defined response plan, you can save your security team time down the road.

Add contacts

Your contacts should include everyone who might be involved in the incident. Follow these steps to add a contact.

To add contacts

  1. Open the AWS Management Console, and then go to Systems Manager within the console, expand Operations Management, and then expand Incident Manager.
  2. Choose Contacts, and then choose Create contact.

    Figure 1: Adding contact details

    Figure 1: Adding contact details

  3. On Contact information, enter names and define contact channels for your contacts.
  4. Under Contact channel, you can select Email, SMS, or Voice. You can also add multiple contact channels.
  5. In Engagement plan, specify how fast to engage your responders. In the example illustrated below, the incident responder will be engaged through email immediately (0 minutes) when an incident is detected and then through SMS 10 minutes into an incident. Complete the fields and then choose Create.

    Figure 2: Engagement plan

    Figure 2: Engagement plan

Create a response plan

Once you’ve created your contacts, you can create a response plan to define how to respond to incidents. Refer to the Best Practices for Response Plans.

Note: (Optional) You can also create an escalation plan that lets you further define the escalation path for your contacts. You can learn more in Create an escalation plan.

To create a response plan

  1. Open the Incident Manager console, and choose Response plans in the left navigation pane.
  2. Choose Create response plan.
  3. Enter a unique and identifiable name for your response plan.
  4. Enter an incident title. The incident title helps to identify an incident on the incidents home page.
  5. Select an appropriate Impact based on the potential scope of the incident.

    Figure 3: Selecting your impact level

    Figure 3: Selecting your impact level

  6. (Optional) Choose a chat channel for the incident responders to interact in during an incident. For more information about chat channels, see Chat channels.
  7. (Optional) For Engagement, you can choose any number of contacts and escalation plans. For this solution, select the security team responder that you created earlier as one of your contacts.

    Figure 4: Adding engagements

    Figure 4: Adding engagements

  8. (Optional) You can also create a runbook that can drive the incident mitigation and response. For further information, refer to Runbooks and automation.
  9. Under Execution permissions, choose Create an IAM role using a template. Under Role name, select the IAM role you created in the prerequisites that allows Incident Manager to run SSM automation documents, and then choose Create response plan.

Monitor AWS account root activity

When you first create an AWS account, you begin with a single sign-in identity that has complete access to all AWS services and resources in the account. This identity is called the root user and is accessed by signing in with the email address and password that you used to create the account.

An AWS account root user has full access to all your resources for all AWS services, including billing information. It is critical to prevent root user access from unauthorized use and to be aware whenever root user activity occurs in your AWS account. For more information about AWS recommendations, see Security best practices in IAM.

To be certain that all root user activity is authorized and expected, it’s important to monitor root API calls to a given AWS account and to be notified when root user activity is detected.

Create an EventBridge rule

Create and validate an EventBridge rule to capture AWS account root activity.

To create an EventBridge rule

  1. Open the EventBridge console.
  2. In the navigation pane, choose Rules, and then choose Create rule.
  3. Enter a name and description for the rule.
  4. For Define pattern, choose Event pattern.
  5. Choose Custom pattern.
  6. Enter the following event pattern:
    {
      "detail-type": [
        "AWS API Call via CloudTrail",
        "AWS Console Sign In via CloudTrail"
      ],
      "detail": {
        "userIdentity": {
          "type": [
            "Root"
          ]
        }
      }
    }
    

  7. For Select targets, choose Incident Manager response plan.
  8. For Response plan, choose SecurityEventResponsePlan, which you created when you set up Incident Manager.
  9. To create an IAM role automatically, choose Create a new role for this specific resource. To use an existing IAM role, choose Use existing role.
  10. (Optional) Enter one or more tags for the rule.
  11. Choose Create.

To validate the rule

  1. Sign in using root credentials.
  2. This console login activity by a root user should invoke the Incident Manager response plan and show an open incident as illustrated below. The respective contact channels that you defined earlier in your Engagement Plan, will be engaged.
Figure 5: Incident Manager open incidents

Figure 5: Incident Manager open incidents

Watch for GuardDuty high severity findings

GuardDuty is a monitoring service that analyzes AWS CloudTrail management and Amazon S3 data events, Amazon Virtual Private Cloud (Amazon VPC) flow logs, and Amazon Route 53 DNS logs to generate security findings for your account. Once GuardDuty is enabled, it immediately starts monitoring your environment.

GuardDuty integrates with EventBridge, which can be used to send findings data to other applications and services for processing. With EventBridge, you can use GuardDuty findings to invoke automatic responses to your findings by connecting finding events to targets such as Incident Manager response plan.

Create an EventBridge rule

You’ll use an EventBridge rule to capture GuardDuty high severity findings.

To create an EventBridge rule

  1. Open the EventBridge console.
  2. In the navigation pane, select Rules, and then choose Create rule.
  3. Enter a name and description for the rule.
  4. For Define pattern, choose Event pattern.
  5. Choose Custom pattern
  6. Enter the following event pattern which will filter on GuardDuty high severity findings
    {
      "source": ["aws.guardduty"],
      "detail-type": ["GuardDuty Finding"],
      "detail": {
        "severity": [
          7.0,
          7.1,
          7.2,
          7.3,
          7.4,
          7.5,
          7.6,
          7.7,
          7.8,
          7.9,
          8,
          8.0,
          8.1,
          8.2,
          8.3,
          8.4,
          8.5,
          8.6,
          8.7,
          8.8,
          8.9
        ]
      }
    } 
    

  7. For Select targets, choose Incident Manager response plan.
  8. For Response plan, select SecurityEventResponsePlan, which you created when you set up Incident Manager.
  9. To create an IAM role automatically, choose Create a new role for this specific resource. To use an IAM role that you created before, choose Use existing role.
  10. (Optional) Enter one or more tags for the rule.
  11. Choose Create.

To validate the rule

To test and validate whether the above rule is now functional, you can generate sample findings within the GuardDuty console.

  1. Open the GuardDuty console.
  2. In the navigation pane, choose Settings.
  3. On the Settings page, under Sample findings, choose Generate sample findings.
  4. In the navigation pane, choose Findings. The sample findings are displayed on the Current findings page with the prefix [SAMPLE].

Once you have generated sample findings, your Incident Manager response plan will be invoked almost immediately and the engagement plan with your contacts will begin.

You can select an open incident in the Incident Manager console to see additional details from the GuardDuty finding. Figure 6 shows a high severity finding.

Figure 6: Incident Manager open incident for GuardDuty high severity finding

Figure 6: Incident Manager open incident for GuardDuty high severity finding

Monitor S3 bucket settings for public access

AWS Config enables continuous monitoring of your AWS resources, making it easier to assess, audit, and record resource configurations and changes. AWS Config does this through rules that define the desired configuration state of your AWS resources. AWS Config provides a number of AWS managed rules that address a wide range of security concerns such as checking that your Amazon Elastic Block Store (Amazon EBS) volumes are encrypted, your resources are tagged appropriately, and multi-factor authentication (MFA) is enabled for root accounts.

Set up AWS Config and EventBridge

You will use AWS Config to monitor your S3 bucket ACLs and policies for violations which could allow public read or public write access. If AWS Config finds a policy violation, it will initiate an AWS EventBridge rule to invoke your Incident Manager response plan.

To create the AWS Config rule to capture S3 bucket public access

  1. Sign in to the AWS Config console.
  2. If this is your first time in the AWS Config console, refer to the Getting Started guide for more information.
  3. Select Rules from the menu and choose Add Rule.
  4. On the AWS Config rules page, enter S3 in the search box and select the s3-bucket-public-read-prohibited and s3-bucket-public-write-prohibited rules, and then choose Next.

    Figure 7: AWS Config rules

    Figure 7: AWS Config rules

  5. Leave the Configure rules page as default and select Next.
  6. On the Review page, select Add Rule. AWS Config is now analyzing your S3 buckets, capturing their current configurations, and evaluating the configurations against the rules you selected.

To create the EventBridge rule

  1. Open the Amazon EventBridge console
  2. In the navigation pane, choose Rules, and then choose Create rule.
  3. Enter a name and description for the rule.
  4. For Define pattern, choose Event pattern.
  5. Choose Custom pattern
  6. Enter the following event pattern, which will filter on AWS Config rule s3-bucket-public-write-prohibited being non-compliant.
    {
      "source": ["aws.config"],
      "detail-type": ["Config Rules Compliance Change"],
      "detail": {
        "messageType": ["ComplianceChangeNotification"],
        "configRuleName": ["s3-bucket-public-write-prohibited", ""],
        "newEvaluationResult": {
          "complianceType": [
            "NON_COMPLIANT"
          ]
        }
      }
    }
    

  7. For Select targets, choose Incident Manager response plan.
  8. For Response plan, choose SecurityEventResponsePlan, which you created earlier when setting up Incident Manager.
  9. To create an IAM role automatically, choose Create a new role for this specific resource. To use an existing IAM role, choose Use existing role.
  10. (Optional) Enter one or more tags for the rule.
  11. Choose Create.

To validate the rule

  1. Create a compliant test S3 bucket with no public read or write access through either an ACL or a policy.
  2. Change the ACL of the bucket to allow public listing of objects so that the bucket is non-compliant.

    Figure 8: Amazon S3 console

    Figure 8: Amazon S3 console

  3. After a few minutes, you should see the AWS Config rule initiated which invokes the EventBridge rule and therefore your Incident Manager response plan.

Summary

In this post, I showed you how to use Incident Manager to monitor for security events and invoke a response plan via Amazon CloudWatch or Amazon EventBridge. AWS CloudTrail API activity (for a root account login), Amazon GuardDuty (for high severity findings), and AWS Config (to enforce policies like preventing public write access to an S3 bucket). I demonstrated how you can create an incident management and response plan to ensure you have used the power of cloud to create automations that respond to and mitigate security incidents in a timely manner. To learn more about Incident Manager, see What Is AWS Systems Manager Incident Manager in the AWS documentation.

If you have feedback about this post, submit comments in the comments section below. If you have questions about this post, start a new thread on the Systems Manager forum or contact AWS Support.

Want more AWS Security how-to content, news, and feature announcements? Follow us on Twitter.

Author

Sumit Patel

As a Senior Solutions Architect at AWS, Sumit works with large enterprise customers helping them create innovative solutions to address their cloud challenges. Sumit uses his more than 15 years of enterprise experience to help customers navigate their cloud transformation journey and shape the right dynamics between technology and business.

Building a serverless GIF generator with AWS Lambda: Part 2

Post Syndicated from James Beswick original https://aws.amazon.com/blogs/compute/building-a-serverless-gif-generator-with-aws-lambda-part-2/

In part 1 of this blog post, I explain how a GIF generation service can support a front-end application for video streaming. I compare the performance of a server-based and serverless approach and show how parallelization can significantly improve processing time. I introduce an example application and I walk through the solution architecture.

In this post, I explain the scaling behavior of the example application and consider alternative approaches. I also look at how to manage memory, temporary space, and files in this type of workload. Finally, I discuss the cost of this approach and how to determine if a workload can use parallelization.

To set up the example, visit the GitHub repo and follow the instructions in the README.md file. The example application uses the AWS Serverless Application Model (AWS SAM), enabling you to deploy the application more easily in your own AWS account. This walkthrough creates some resources covered in the AWS Free Tier but others incur cost.

Scaling up the AWS Lambda workers with Amazon EventBridge

There are two AWS Lambda functions in the example application. The first detects the length of the source video and then generates batches of events containing start and end times. These events are put onto the Amazon EventBridge default event bus.

An EventBridge rule matches the events and invokes the second Lambda function. This second function receives the events, which have the following structure:

{
    "version": "0",
    "id": "06a1596a-1234-1234-1234-abc1234567",
    "detail-type": "newVideoCreated",
    "source": "custom.gifGenerator",
    "account": "123456789012",
    "time": "2021-0-17T11:36:38Z",
    "region": "us-east-1",
    "resources": [],
    "detail": {
        "key": "long.mp4",
        "start": 2250,
        "end": 2279,
        "length": 3294.024,
        "tsCreated": 1623929798333
    }
}

The detail attribute contains the unique start and end time for the slice of work. Each Lambda invocation receives a different start and end time and works on a 30-second snippet of the whole video. The function then uses FFMPEG to download the original video from the source Amazon S3 bucket and perform the processing for its allocated time slice.

The EventBridge rule matches events and invokes the target Lambda function asynchronously. The Lambda service scales up the number of execution environments in response to the number of events:

Solution architecture

The first function produces batches of events almost simultaneously but the worker function takes several seconds to process a single request. If there is no existing environment available to handle the request, the Lambda scales up to process the work. As a result, you often see a high level of concurrency when running this application, which is how parallelization is achieved:

CloudWatch metrics

Lambda continues to scale up until it reaches the initial burst concurrency quotas in the current AWS Region. These quotas are between 500 and 3000 execution environments per minute initially. After the initial burst, concurrency scales by an additional 500 instances per minute.

If the number of events is higher, Lambda responds to EventBridge with a throttling error. The EventBridge service retries the events with exponential backoff for 24 hours. Once Lambda is scaled sufficiently or existing execution environments become available, the events are then processed.

This means that under exceptional levels of heavy load, this retry pattern adds latency to the overall GIF generation task. To manage this, you can use Provisioned Concurrency to ensure that more execution environments are available during periods of very high load.

Alternative ways to scale the Lambda workers

The asynchronous invocation mode for Lambda allows you to scale up worker Lambda functions quickly. This is the mode used by EventBridge when Lambda functions are defined as targets in rules. The other benefit of using EventBridge to decouple the two functions in this example is extensibility. Currently, the events have only a single consumer. However, you can add new capabilities to this application by building new event consumers, without changing the producer logic. Note that using EventBridge in this architecture costs $1 per million events put onto the bus (this cost varies by Region). Delivery to targets in EventBridge is free.

This design could similarly use Amazon SNS, which also invokes consuming Lambda functions asynchronously. This costs $0.50 per million messages and delivery to Lambda functions is free (this cost varies by Region). Depending on if you use EventBridge capabilities, SNS may be a better choice for decoupling the two Lambda functions.

Alternatively, the first Lambda function could invoke the second function by using the invoke method of the Lambda API. By using the AWS SDK for JavaScript, one Lambda function can invoke another directly from the handler code. When the InvocationType is set to ‘Event’, this invocation occurs asynchronously. That means that the calling function does not wait for the target function to finish before continuing.

This direct integration between two Lambda services is the lowest latency alternative. However, this limits the extensibility of the solution in the future without modifying code.

Managing memory, temp space, and files

You can configure the memory for a Lambda function up to 10,240 MB. However, the temporary storage available in /tmp is always 512 MB, regardless of memory. Increasing the memory allocation proportionally increases the amount of virtual CPU and network bandwidth available to the function. To learn more about how this works in detail, watch Optimizing Lambda performance for your serverless applications.

The original video files used in this workload may be several gigabytes in size. Since these may be larger than the /tmp space available, the code is designed to keep the movie file in memory. As a result, this solution works for any length of movie that can fit into the 10 GB memory limit.

The FFMPEG application expects to work with local file systems and is not designed to work with object stores like Amazon S3. It can also read video files from HTTP endpoints, so the example application loads the S3 object over HTTPS instead of downloading the file and using the /tmp space. To achieve this, the code uses the getSignedUrl method of the S3 class in the SDK:

 	// Configure S3
 	const AWS = require('aws-sdk')
 	AWS.config.update({ region: process.env.AWS_REGION })
 	const s3 = new AWS.S3({ apiVersion: '2006-03-01' }) 

 	// Get signed URL for source object
	const params = {
		Bucket: record.s3.bucket.name, 
		Key: record.s3.object.key, 
		Expires: 300
	}
	const url = s3.getSignedUrl('getObject', params)

The resulting URL contains credentials to download the S3 object over HTTPs. The Expires attributes in the parameters determines how long the credentials are valid for. The Lambda function calling this method must have appropriate IAM permissions for the target S3 bucket.

The GIF generation Lambda function stores the output GIF and JPG in the /tmp storage space. Since the function can be reused by subsequent invocations, it’s important to delete these temporary files before each invocation ends. This prevents the function from using all of the /tmp space available. This is handled by the tmpCleanup function:

const fs = require('fs')
const path = require('path')
const directory = '/tmp/'

// Deletes all files in a directory
const tmpCleanup = async () => {
    console.log('Starting tmpCleanup')
    fs.readdir(directory, (err, files) => {
        return new Promise((resolve, reject) => {
            if (err) reject(err)

            console.log('Deleting: ', files)                
            for (const file of files) {
                const fullPath = path.join(directory, file)
                fs.unlink(fullPath, err => {
                    if (err) reject (err)
                })
            }
            resolve()
        })
    })
}

When the GenerateFrames parameter is set to true in the AWS SAM template, the worker function generates one frame per second of video. For longer videos, this results in a significant number of files. Since one of the dimensions of S3 pricing is the number of PUTs, this function increases the cost of the workload when using S3.

For applications that are handling large numbers of small files, it can be more cost effective to use Amazon EFS and mount the file system to the Lambda function. EFS charges based upon data storage and throughput, instead of number of files. To learn more about using EFS with Lambda, read this Compute Blog post.

Calculating the cost of the worker Lambda function

While parallelizing Lambda functions significantly reduces the overall processing time in this case, it’s also important to calculate the cost. To process the 3-hour video example in part 1, the function uses 345 invocations with 4096 MB of memory. Each invocation has an average duration of 4,311 ms.

Using the AWS Pricing Calculator, and ignoring the AWS Free Tier allowance, the costs to process this video is approximately $0.10.

AWS Pricing Calculator configuration

There are additional charges for other services used in the example application, such as EventBridge and S3. However, in terms of compute cost, this may compare favorably with server-based alternatives that you may have to scale manually depending on traffic. The exact cost depends upon your implementation and latency needs.

Deciding if a workload can be parallelized

The GIF generation workload is a good candidate for parallelization. This is because each 30-second block of work is independent and there is no strict ordering requirement. The end result is not impacted by the order that the GIFs are generated in. Each GIF also takes several seconds to generate, which is why the time saving comparison with the sequential, server-based approach is so significant.

Not all workloads can be parallelized and in many cases the work duration may be much shorter. This workload interacts with S3, which can scale to any level of read or write traffic created by the worker functions. You may use other downstream services that cannot scale this way, which may limit the amount of parallel processing you can use.

To learn more about designing and operating Lambda-based applications, read the Lambda Operator Guide.

Conclusion

Part 2 of this blog post expands on some of the advanced topics around scaling Lambda in parallelized workloads. It explains how the asynchronous invocation mode of Lambda scales and different ways to scale the worker Lambda function.

I cover how the example application manages memory, files, and temporary storage space. I also explain how to calculate the compute cost of using this approach, and considering if you can use parallelization in a workload.

For more serverless learning resources, visit Serverless Land.

Building well-architected serverless applications: Optimizing application costs

Post Syndicated from Julian Wood original https://aws.amazon.com/blogs/compute/building-well-architected-serverless-applications-optimizing-application-costs/

This series of blog posts uses the AWS Well-Architected Tool with the Serverless Lens to help customers build and operate applications using best practices. In each post, I address the serverless-specific questions identified by the Serverless Lens along with the recommended best practices. See the introduction post for a table of contents and explanation of the example application.

COST 1. How do you optimize your serverless application costs?

Design, implement, and optimize your application to maximize value. Asynchronous design patterns and performance practices ensure efficient resource use and directly impact the value per business transaction. By optimizing your serverless application performance and its code patterns, you can directly impact the value it provides, while making more efficient use of resources.

Serverless architectures are easier to manage in terms of correct resource allocation compared to traditional architectures. Due to its pay-per-value pricing model and scale based on demand, a serverless approach effectively reduces the capacity planning effort. As covered in the operational excellence and performance pillars, optimizing your serverless application has a direct impact on the value it produces and its cost. For general serverless optimization guidance, see the AWS re:Invent talks, “Optimizing your Serverless applications” Part 1 and Part 2, and “Serverless architectural patterns and best practices”.

Required practice: Minimize external calls and function code initialization

AWS Lambda functions may call other managed services and third-party APIs. Functions may also use application dependencies that may not be suitable for ephemeral environments. Understanding and controlling what your function accesses while it runs can have a direct impact on value provided per invocation.

Review code initialization

I explain the Lambda initialization process with cold and warm starts in “Optimizing application performance – part 1”. Lambda reports the time it takes to initialize application code in Amazon CloudWatch Logs. As Lambda functions are billed by request and duration, you can use this to track costs and performance. Consider reviewing your application code and its dependencies to improve the overall execution time to maximize value.

You can take advantage of Lambda execution environment reuse to make external calls to resources and use the results for subsequent invocations. Use TTL mechanisms inside your function handler code. This ensures that you can prevent additional external calls that incur additional execution time, while preemptively fetching data that isn’t stale.

Review third-party application deployments and permissions

When using Lambda layers or applications provisioned by AWS Serverless Application Repository, be sure to understand any associated charges that these may incur. When deploying functions packaged as container images, understand the charges for storing images in Amazon Elastic Container Registry (ECR).

Ensure that your Lambda function only has access to what its application code needs. Regularly review that your function has a predicted usage pattern so you can factor in the cost of other services, such as Amazon S3 and Amazon DynamoDB.

Required practice: Optimize logging output and its retention

Considering reviewing your application logging level. Ensure that logging output and log retention are appropriately set to your operational needs to prevent unnecessary logging and data retention. This helps you have the minimum of log retention to investigate operational and performance inquiries when necessary.

Emit and capture only what is necessary to understand and operate your component as intended.

With Lambda, any standard output statements are sent to CloudWatch Logs. Capture and emit business and operational events that are necessary to help you understand your function, its integration, and its interactions. Use a logging framework and environment variables to dynamically set a logging level. When applicable, sample debugging logs for a percentage of invocations.

In the serverless airline example used in this series, the booking service Lambda functions use Lambda Powertools as a logging framework with output structured as JSON.

Lambda Powertools is added to the Lambda functions as a shared Lambda layer in the AWS Serverless Application Model (AWS SAM) template. The layer ARN is stored in Systems Manager Parameter Store.

Parameters:
  SharedLibsLayer:
    Type: AWS::SSM::Parameter::Value<String>
    Description: Project shared libraries Lambda Layer ARN
Resources:
    ConfirmBooking:
        Type: AWS::Serverless::Function
        Properties:
            FunctionName: !Sub ServerlessAirline-ConfirmBooking-${Stage}
            Handler: confirm.lambda_handler
            CodeUri: src/confirm-booking
            Layers:
                - !Ref SharedLibsLayer
            Runtime: python3.7
…

The LOG_LEVEL and other Powertools settings are configured in the Globals section as Lambda environment variable for all functions.

Globals:
    Function:
        Environment:
            Variables:
                POWERTOOLS_SERVICE_NAME: booking
                POWERTOOLS_METRICS_NAMESPACE: ServerlessAirline
                LOG_LEVEL: INFO 

For Amazon API Gateway, there are two types of logging in CloudWatch: execution logging and access logging. Execution logs contain information that you can use to identify and troubleshoot API errors. API Gateway manages the CloudWatch Logs, creating the log groups and log streams. Access logs contain details about who accessed your API and how they accessed it. You can create your own log group or choose an existing log group that could be managed by API Gateway.

Enable access logs, and selectively review the output format and request fields that might be necessary. For more information, see “Setting up CloudWatch logging for a REST API in API Gateway”.

API Gateway logging

API Gateway logging

Enable AWS AppSync logging which uses CloudWatch to monitor and debug requests. You can configure two types of logging: request-level and field-level. For more information, see “Monitoring and Logging”.

AWS AppSync logging

AWS AppSync logging

Define and set a log retention strategy

Define a log retention strategy to satisfy your operational and business needs. Set log expiration for each CloudWatch log group as they are kept indefinitely by default.

For example, in the booking service AWS SAM template, log groups are explicitly created for each Lambda function with a parameter specifying the retention period.

Parameters:
    LogRetentionInDays:
        Type: Number
        Default: 14
        Description: CloudWatch Logs retention period
Resources:
    ConfirmBookingLogGroup:
        Type: AWS::Logs::LogGroup
        Properties:
            LogGroupName: !Sub "/aws/lambda/${ConfirmBooking}"
            RetentionInDays: !Ref LogRetentionInDays

The Serverless Application Repository application, auto-set-log-group-retention can update the retention policy for new and existing CloudWatch log groups to the specified number of days.

For log archival, you can export CloudWatch Logs to S3 and store them in Amazon S3 Glacier for more cost-effective retention. You can use CloudWatch Log subscriptions for custom processing, analysis, or loading to other systems. Lambda extensions allows you to process, filter, and route logs directly from Lambda to a destination of your choice.

Good practice: Optimize function configuration to reduce cost

Benchmark your function using a different set of memory size

For Lambda functions, memory is the capacity unit for controlling the performance and cost of a function. You can configure the amount of memory allocated to a Lambda function, between 128 MB and 10,240 MB. The amount of memory also determines the amount of virtual CPU available to a function. Benchmark your AWS Lambda functions with differing amounts of memory allocated. Adding more memory and proportional CPU may lower the duration and reduce the cost of each invocation.

In “Optimizing application performance – part 2”, I cover using AWS Lambda Power Tuning to automate the memory testing process to balances performance and cost.

Best practice: Use cost-aware usage patterns in code

Reduce the time your function runs by reducing job-polling or task coordination. This avoids overpaying for unnecessary compute time.

Decide whether your application can fit an asynchronous pattern

Avoid scenarios where your Lambda functions wait for external activities to complete. I explain the difference between synchronous and asynchronous processing in “Optimizing application performance – part 1”. You can use asynchronous processing to aggregate queues, streams, or events for more efficient processing time per invocation. This reduces wait times and latency from requesting apps and functions.

Long polling or waiting increases the costs of Lambda functions and also reduces overall account concurrency. This can impact the ability of other functions to run.

Consider using other services such as AWS Step Functions to help reduce code and coordinate asynchronous workloads. You can build workflows using state machines with long-polling, and failure handling. Step Functions also supports direct service integrations, such as DynamoDB, without having to use Lambda functions.

In the serverless airline example used in this series, Step Functions is used to orchestrate the Booking microservice. The ProcessBooking state machine handles all the necessary steps to create bookings, including payment.

Booking service state machine

Booking service state machine

To reduce costs and improves performance with CloudWatch, create custom metrics asynchronously. You can use the Embedded Metrics Format to write logs, rather than the PutMetricsData API call. I cover using the embedded metrics format in “Understanding application health” – part 1 and part 2.

For example, once a booking is made, the logs are visible in the CloudWatch console. You can select a log stream and find the custom metric as part of the structured log entry.

Custom metric structured log entry

Custom metric structured log entry

CloudWatch automatically creates metrics from these structured logs. You can create graphs and alarms based on them. For example, here is a graph based on a BookingSuccessful custom metric.

CloudWatch metrics custom graph

CloudWatch metrics custom graph

Consider asynchronous invocations and review run away functions where applicable

Take advantage of Lambda’s event-based model. Lambda functions can be triggered based on events ingested into Amazon Simple Queue Service (SQS) queues, S3 buckets, and Amazon Kinesis Data Streams. AWS manages the polling infrastructure on your behalf with no additional cost. Avoid code that polls for third-party software as a service (SaaS) providers. Rather use Amazon EventBridge to integrate with SaaS instead when possible.

Carefully consider and review recursion, and establish timeouts to prevent run away functions.

Conclusion

Design, implement, and optimize your application to maximize value. Asynchronous design patterns and performance practices ensure efficient resource use and directly impact the value per business transaction. By optimizing your serverless application performance and its code patterns, you can reduce costs while making more efficient use of resources.

In this post, I cover minimizing external calls and function code initialization. I show how to optimize logging output with the embedded metrics format, and log retention. I recap optimizing function configuration to reduce cost and highlight the benefits of asynchronous event-driven patterns.

This post wraps up the series, building well-architected serverless applications, where I cover the AWS Well-Architected Tool with the Serverless Lens . See the introduction post for links to all the blog posts.

For more serverless learning resources, visit Serverless Land.


Field Notes: Creating Custom Analytics Dashboards with FireEye Helix and Amazon QuickSight

Post Syndicated from Karish Chowdhury original https://aws.amazon.com/blogs/architecture/field-notes-creating-custom-analytics-dashboards-with-fireeye-helix-and-amazon-quicksight/

FireEye Helix is a security operations platform that allows organizations to take control of any incident from detection to response. FireEye Helix detects security incidents by correlating logs and configuration settings from sources like VPC Flow Logs, AWS CloudTrail, and Security groups.

In this blog post, we will discuss an architecture that allows you to create custom analytics dashboards with Amazon QuickSight. These dashboards are based on the threat detection logs collected by FireEye Helix. We automate this process so that data can be pulled and ingested based on a provided schedule. This approach uses AWS Lambda, and Amazon Simple Storage Service (Amazon S3) in addition to QuickSight.

Architecture Overview

The solution outlines how to ingest the security log data from FireEye Helix to Amazon S3 and create QuickSight visualizations from the log data. With this approach, you need Amazon EventBridge to invoke a Lambda function to connect to the FireEye Helix API. There are two steps to this process:

  1. Download the log data from FireEye Helix and store it in Amazon S3.
  2. Create a visualization Dashboard in QuickSight.

The architecture shown in Figure 1 represents the process we will walk through in this blog post. To implement this solution, you will need the following AWS services and features involved:

Figure 1: Solution architecture

Figure 1: Solution architecture

Prerequisites to implement the solution:

The following items are required to get your environment set up for this walkthrough.

  1. AWS account.
  2. FireEye Helix search alerts API endpoint. This is available under the API documentation in the FireEye Helix console.
  3. FireEye Helix API key. This FireEye community page explains how to generate an API key with appropriate permissions (always follow least privilege principles). This key is used by the Lambda function to periodically fetch alerts.
  4. AWS Secrets Manager secret (to store the FireEye Helix API key). To set it up, follow the steps outlined in the Creating a secret.

Extract the data from FireEye Helix and load it into Amazon S3

You will use the following high-level steps to retrieve the necessary security log data from FireEye Helix and store it on Amazon S3 to make it available for QuickSight.

  1. Establish an AWS Identity and Access Management (IAM) role for the Lambda function. It must have permissions to access Secrets Manager and Amazon S3 so they can retrieve the FireEye Helix API key and store the extracted data, respectively.
  2. Create an Amazon S3 bucket to store the FireEye Helix security log data.
  3. Create a Lambda function that uses the API key from Secrets Manager, calls the FireEye Helix search alerts API to extract FireEye Helix’s threat detection logs, and stores the data in the S3 bucket.
  4. Establish a CloudWatch EventBridge rule to invoke the Lambda function on an automated schedule.

To simplify this deployment, we have developed a CloudFormation template to automate creating the preceding requirements. Follow the below steps to deploy the template:

  • Download the source code from the GitHub repository
  • Navigate to CloudFormation console and select Create Stack
  • Select “Upload a template file” radio button, click on “Choose file” button, and select “helix-dashboard.yaml” file in the downloaded Github repository. Click “Next” to proceed.
  • On “Specify stack details” screen enter the parameters shown in Figure 2.
Figure 2: CloudFormation stack creation with initial parameters

Figure 2: CloudFormation stack creation with initial parameters

The parameters in Figure 2 include:

  • HelixAPISecretName – Enter the Secrets Manager secret name where the FireEye Helix API key is stored.
  • HelixEndpointUrl – Enter the Helix search API endpoint URL.
  • Amazon S3 bucket – Enter the bucket prefix (a random suffix will be added to make it unique).
  • Schedule – Choose the default option that pulls logs once a day, or enter the CloudWatch event schedule expression.

Select the check box next to “I acknowledge that AWS CloudFormation might create IAM resources.” and then press the Create Stack button. After the CloudFormation stack completes, you will have a fully functional process that will retrieve the FireEye Helix security log data and store it on the S3 bucket.

You can also select the Lambda function from the CloudFormation stack outputs to navigate to the Lambda console. Review the following default code, and add any additional transformation logic according to your needs after fetching the results (line 32).

import boto3
from datetime import datetime
import requests
import os

region_name = os.environ['AWS_REGION']
secret_name = os.environ['APIKEY_SECRET_NAME']
bucket_name = os.environ['S3_BUCKET_NAME']
helix_api_url = os.environ['HELIX_ENDPOINT_URL']

def lambda_handler(event, context):

    now = datetime.now()
    # Create a Secrets Manager client to fetch API Key from Secrets Manager
    session = boto3.session.Session()
    client = session.client(
        service_name='secretsmanager',
        region_name=region_name
    )
    apikey = client.get_secret_value(
            SecretId=secret_name
        )['SecretString']
    
    datestr = now.strftime("%B %d, %Y")
    apiheader = {'x-fireeye-api-key': apikey}
    
    try:
        # Call Helix Rest API to fetch the Alerts
        helixalerts = requests.get(
            f'{helix_api_url}?format=csv&query=start:"{datestr}" end:"{datestr}" class=alerts', headers=apiheader)
    
        # Optionally transform the content according to your needs..
        
        # Create a S3 client to upload the CSV file
        s3 = boto3.client('s3')
        path = now.strftime("%Y/%m/%d")+'/alerts-'+now.strftime("%H-%M-%S")+'.csv'
        response = s3.put_object(
            Body=helixalerts.content,
            Bucket=bucket_name,
            Key=path,
        )
        print('S3 upload response:', response)
    except Exception as e:
        print('error while fetching the alerts', e)
        raise e
        
    return {
        'statusCode': 200,
        'body': f'Successfully fetched alerts from Helix and uploaded to {path}'
    }

Creating a visualization in QuickSight

Once the FireEye data is ingested into an S3 bucket, you can start creating custom reports and dashboards using QuickSight. Following is a walkthrough on how to create a visualization in QuickSight based on the data that was ingested from FireEye Helix.

Step 1 – When placing the FireEye data into Amazon S3, ensure you have a clean directory structure so you can partition your data. By partitioning your data, you can restrict the amount of data scanned by each query, thus improving performance and reducing cost. The following is a sample directory structure you could use.

      ssw-fireeye-logs

           2021

               04

               05

The following is an example of what the data will look like after it is ingested from FireEye Helix into your Amazon S3 bucket. In this blog post, we will use the Alert_Desc column to report on the types of common attacks.

Step 2 – Next, you must create a manifest file that will instruct QuickSight how to read the FireEye log files on Amazon S3. The preceding example is a manifest file that instructs QuickSight to recursively search for files in the ssw-fireeye-logs bucket, and can be seen in the URIPrefixes section. The GlobalUploadSettings section informs QuickSight the type and format of files it will read.

"fileLocations": [
	{
		"URIPrefixes": [
			"s3://ssw-fireeye-logs/"
		]
	},
	],
	"globalUploadSettings": {
		"format": "CSV",
		"delimiter": ",",
		"textqalifier": "'",
		"containsHeader": "true"
	}
}

Step 3 – Open Amazon QuickSight. Use the AWS Management Console and search for QuickSight.

Step 4 – Below the QuickSight logo, find and select Datasets.

Step 5 – Push the blue New dataset button.


Step 6 – Now you are on Create a Dataset page which enables you to select a data source you would like QuickSight to ingest. Because we have stored the FireEye Helix data on S3, you should choose the S3 data source.


Step 7 – A pop-up box will appear called New S3 data source. Type a data source name, and upload the manifest file you created. Next, push the Connect button.

Step 8 – You are now directed to the Visualize screen. For this exercise let’s choose a Pie chart, you can find this in the Visual types section by hovering over each icon and reading each tool tip that comes up. Look for the tool tip that says Pie chart. After selecting the Pie Chart visual type, two entries in the Field wells section at the top of the screen will show up called Group/Color and Value. Click the drop down in Group/Color and select the Alert_Desc column. Now click the drop down in Value and also select Alter_Desc column but choose count as an aggregate. This will create an informative visualization of the most common attacks based on the sample data shown previously in Step 1.

Figure 3: Visualization screen in QuickSight

Figure 3: Visualization screen in QuickSight

Clean up

If you created any resources in AWS for this solution, consider removing them and any example resources you deployed. This includes the FireEye Helix API keys, S3 buckets, Lambda functions, and QuickSight visualizations. This helps ensure that there are no unwanted recurring charges. For more information, review how to delete the CloudFormation stack.

Conclusion

This blog post showed you how to ingest security log data from FireEye Helix and store that data in Amazon S3. We also showed you how to create your own visualizations in QuickSight to better understand the overall security posture of your AWS environment. With this solution, you can perform deep analysis and share these insights among different audiences in your organization (such as, operations, security, and executive management).


Field Notes provides hands-on technical guidance from AWS Solutions Architects, consultants, and technical account managers, based on their experiences in the field solving real-world business problems for customers.


Building well-architected serverless applications: Building in resiliency – part 2

Post Syndicated from Julian Wood original https://aws.amazon.com/blogs/compute/building-well-architected-serverless-applications-building-in-resiliency-part-2/

This series of blog posts uses the AWS Well-Architected Tool with the Serverless Lens to help customers build and operate applications using best practices. In each post, I address the serverless-specific questions identified by the Serverless Lens along with the recommended best practices. See the introduction post for a table of contents and explanation of the example application.

Reliability question REL2: How do you build resiliency into your serverless application?

This post continues part 1 of this reliability question. Previously, I cover managing failures using retries, exponential backoff, and jitter. I explain how DLQs can isolate failed messages. I show how to use state machines to orchestrate long running transactions rather than handling these in application code.

Required practice: Manage duplicate and unwanted events

Duplicate events can occur when a request is retried or multiple consumers process the same message from a queue or stream. A duplicate can also happen when a request is sent twice at different time intervals with the same parameters. Design your applications to process multiple identical requests to have the same effect as making a single request.

Idempotency refers to the capacity of an application or component to identify repeated events and prevent duplicated, inconsistent, or lost data. This means that receiving the same event multiple times does not change the result beyond the first time the event was received. An idempotent application can, for example, handle multiple identical refund operations. The first refund operation is processed. Any further refund requests to the same customer with the same payment reference should not be processes again.

When using AWS Lambda, you can make your function idempotent. The function’s code must properly validate input events and identify if the events were processed before. For more information, see “How do I make my Lambda function idempotent?

When processing streaming data, your application must anticipate and appropriately handle processing individual records multiple times. There are two primary reasons why records may be delivered more than once to your Amazon Kinesis Data Streams application: producer retries and consumer retries. For more information, see “Handling Duplicate Records”.

Generate unique attributes to manage duplicate events at the beginning of the transaction

Create, or use an existing unique identifier at the beginning of a transaction to ensure idempotency. These identifiers are also known as idempotency tokens. A number of Lambda triggers include a unique identifier as part of the event:

You can also create your own identifiers. These can be business-specific, such as transaction ID, payment ID, or booking ID. You can use an opaque random alphanumeric string, unique correlation identifiers, or the hash of the content.

A Lambda function, for example can use these identifiers to check whether the event has been previously processed.

Depending on the final destination, duplicate events might write to the same record with the same content instead of generating a duplicate entry. This may therefore not require additional safeguards.

Use an external system to store unique transaction attributes and verify for duplicates

Lambda functions can use Amazon DynamoDB to store and track transactions and idempotency tokens to determine if the transaction has been handled previously. DynamoDB Time to Live (TTL) allows you to define a per-item timestamp to determine when an item is no longer needed. This helps to limit the storage space used. Base the TTL on the event source. For example, the message retention period for SQS.

Using DynamoDB to store idempotent tokens

Using DynamoDB to store idempotent tokens

You can also use DynamoDB conditional writes to ensure a write operation only succeeds if an item attribute meets one of more expected conditions. For example, you can use this to fail a refund operation if a payment reference has already been refunded. This signals to the application that it is a duplicate transaction. The application can then catch this exception and return the same result to the customer as if the refund was processed successfully.

Third-party APIs can also support idempotency directly. For example, Stripe allows you to add an Idempotency-Key: <key> header to the request. Stripe saves the resulting status code and body of the first request made for any given idempotency key, regardless of whether it succeeded or failed. Subsequent requests with the same key return the same result.

Validate events using a pre-defined and agreed upon schema

Implicitly trusting data from clients, external sources, or machines could lead to malformed data being processed. Use a schema to validate your event conforms to what you are expecting. Process the event using the schema within your application code or at the event source when applicable. Events not adhering to your schema should be discarded.

For API Gateway, I cover validating incoming HTTP requests against a schema in “Implementing application workload security – part 1”.

Amazon EventBridge rules match event patterns. EventBridge provides schemas for all events that are generated by AWS services. You can create or upload custom schemas or infer schemas directly from events on an event bus. You can also generate code bindings for event schemas.

SNS supports message filtering. This allows a subscriber to receive a subset of the messages sent to the topic using a filter policy. For more information, see the documentation.

JSON Schema is a tool for validating the structure of JSON documents. There are a number of implementations available.

Best practice: Consider scaling patterns at burst rates

Load testing your serverless application allows you to monitor the performance of an application before it is deployed to production. Serverless applications can be simpler to load test, thanks to the automatic scaling built into many of the services. For more information, see “How to design Serverless Applications for massive scale”.

In addition to your baseline performance, consider evaluating how your workload handles initial burst rates. This ensures that your workload can sustain burst rates while scaling to meet possibly unexpected demand.

Perform load tests using a burst strategy with random intervals of idleness

Perform load tests using a burst of requests for a short period of time. Also introduce burst delays to allow your components to recover from unexpected load. This allows you to future-proof the workload for key events when you do not know peak traffic levels.

There are a number of AWS Marketplace and AWS Partner Network (APN) solutions available for performance testing, including Gatling FrontLine, BlazeMeter, and Apica.

In regulating inbound request rates – part 1, I cover running a performance test suite using Gatling, an open source tool.

Gatling performance results

Gatling performance results

Amazon does have a network stress testing policy that defines which high volume network tests are allowed. Tests that purposefully attempt to overwhelm the target and/or infrastructure are considered distributed denial of service (DDoS) tests and are prohibited. For more information, see “Amazon EC2 Testing Policy”.

Review service account limits with combined utilization across resources

AWS accounts have default quotas, also referred to as limits, for each AWS service. These are generally Region-specific. You can request increases for some limits while other limits cannot be increased. Service Quotas is an AWS service that helps you manage your limits for many AWS services. Along with looking up the values, you can also request a limit increase from the Service Quotas console.

Service Quotas dashboard

Service Quotas dashboard

As these limits are shared within an account, review the combined utilization across resources including the following:

  • Amazon API Gateway: number of requests per second across all APIs. (link)
  • AWS AppSync: throttle rate limits. (link)
  • AWS Lambda: function concurrency reservations and pool capacity to allow other functions to scale. (link)
  • Amazon CloudFront: requests per second per distribution. (link)
  • AWS IoT Core message broker: concurrent requests per second. (link)
  • Amazon EventBridge: API requests and target invocations limit. (link)
  • Amazon Cognito: API limits. (link)
  • Amazon DynamoDB: throughput, indexes, and request rates limits. (link)

Evaluate key metrics to understand how workloads recover from bursts

There are a number of key Amazon CloudWatch metrics to evaluate and alert on to understand whether your workload recovers from bursts.

  • AWS Lambda: Duration, Errors, Throttling, ConcurrentExecutions, UnreservedConcurrentExecutions. (link)
  • Amazon API Gateway: Latency, IntegrationLatency, 5xxError, 4xxError. (link)
  • Application Load Balancer: HTTPCode_ELB_5XX_Count, RejectedConnectionCount, HTTPCode_Target_5XX_Count, UnHealthyHostCount, LambdaInternalError, LambdaUserError. (link)
  • AWS AppSync: 5XX, Latency. (link)
  • Amazon SQS: ApproximateAgeOfOldestMessage. (link)
  • Amazon Kinesis Data Streams: ReadProvisionedThroughputExceeded, WriteProvisionedThroughputExceeded, GetRecords.IteratorAgeMilliseconds, PutRecord.Success, PutRecords.Success (if using Kinesis Producer Library), GetRecords.Success. (link)
  • Amazon SNS: NumberOfNotificationsFailed, NumberOfNotificationsFilteredOut-InvalidAttributes. (link)
  • Amazon Simple Email Service (SES): Rejects, Bounces, Complaints, Rendering Failures. (link)
  • AWS Step Functions: ExecutionThrottled, ExecutionsFailed, ExecutionsTimedOut. (link)
  • Amazon EventBridge: FailedInvocations, ThrottledRules. (link)
  • Amazon S3: 5xxErrors, TotalRequestLatency. (link)
  • Amazon DynamoDB: ReadThrottleEvents, WriteThrottleEvents, SystemErrors, ThrottledRequests, UserErrors. (link)

Conclusion

This post continues from part 1 and looks at managing duplicate and unwanted events with idempotency and an event schema. I cover how to consider scaling patterns at burst rates by managing account limits and show relevant metrics to evaluate

Build resiliency into your workloads. Ensure that applications can withstand partial and intermittent failures across components that may only surface in production. In the next post in the series, I cover the performance efficiency pillar from the Well-Architected Serverless Lens.

For more serverless learning resources, visit Serverless Land.

Classifying Millions of Amazon items with Machine Learning, Part I: Event Driven Architecture

Post Syndicated from Mahmoud Abid original https://aws.amazon.com/blogs/architecture/classifying-millions-of-amazon-items-with-machine-learning-part-i-event-driven-architecture/

As part of AWS Professional Services, we work with customers across different industries to understand their needs and supplement their teams with specialized skills and experience.

Some of our customers are internal teams from the Amazon retail organization who request our help with their initiatives. One of these teams, the Global Environmental Affairs team, identifies the number of electronic products sold. Then they classify these products according to local laws and accurately report this data to regulators. This process covers the products’ end-of-life costs and ensures a high quality of recycling.

These electronic products have classification codes that differ from country to country, and these codes change according to each country’s latest regulations. This poses a complex technical problem. How do we automate our compliance teams’ work to efficiently and accurately classify over three million product classifications every month, in more than 38 countries, while also complying with evolving classification regulations?

To solve this problem, we used Amazon Machine Learning (Amazon ML) capabilities to build a resilient architecture. It ingests and processes data, trains ML models, and predicts (also known as inference workflow) monthly sales data for all countries concurrently.

In this post, we outline how we used AWS Lambda, Amazon EventBridge, and AWS Step Functions to build a scalable and cost-effective solution. We’ll also show you how to keep the data secure while processing it in Amazon ML flows.

Solution overview

Our solution consists of three main parts, which are summarized here and detailed in the following sections:

  1. Training the ML models
  2. Evaluating their performance
  3. Using them to run an inference workflow (in other words, label) the sold items with the correct classification codes

Training the Amazon ML model

For training our Amazon ML model, we use the architecture in Figure 1. It starts with a periodic query against the Amazon.com data warehouse in Amazon Redshift.

Training workflow

Figure 1. Training workflow

  1. A labeled dataset containing pre-recorded classification codes is extracted from Amazon Redshift. This dataset is stored in an Amazon Simple Storage Service (Amazon S3) bucket and split up by country. The data is encrypted at rest with server-side encryption using an AWS Key Management Service (AWS KMS) key. This is also known as server-side encryption with AWS KMS (SSE-KMS). The extraction query uses the AWS KMS key to encrypt the data when storing it in the S3 bucket.
  2. Each time a country’s dataset is uploaded to the S3 bucket, a message is sent to an Amazon Simple Queue Service (Amazon SQS) queue. This prompts a Lambda function. We use Amazon SQS to ensure resiliency. If the Lambda function fails, the message will be tried again automatically. Overall, the message is either processed successfully, or ends up in a dead letter queue that we monitor (not displayed in Figure 1).
  3. If the message is processed successfully, the Lambda function generates necessary input parameters. Then it starts a Step Functions workflow execution for the training process.
  4. The training process involves orchestrating Amazon SageMaker Processing jobs to prepare the data. Once the data is prepared, a hyperparameter optimization job invokes multiple training jobs. These run in parallel with different values from a range of hyperparameters. The model that performs the best is chosen to move forward.
  5. After the model is trained successfully, an EventBridge event is prompted, which will be used to invoke the performance comparison process.

Comparing performance of Amazon ML models

Because Amazon ML models are automatically trained periodically, we want to assess their performance automatically too. Newly created models should perform better than their predecessors. To measure this, we use the flow in Figure 2.

Model performance comparison workflow

Figure 2. Model performance comparison workflow

  1. The flow is activated by the EventBridge event at the end of the training flow.
  2. A Lambda function gathers the necessary input parameters and uses them to start an inference workflow, implemented as a Step Function.
  3. The inference workflow use SageMaker Processing jobs to prepare a new test dataset. It performs predictions using SageMaker Batch Transform jobs with the new model. The test dataset is a labeled subset that was not used in model training. Its prediction gives an unbiased estimation of the model’s performance, proving that the model can generalize.
  4. After the inference workflow is completed and the results are stored on Amazon S3, an EventBridge event is performed, which prompts another Lambda function. This function runs the performance comparison Step Function.
  5. The performance comparison workflow uses a SageMaker Processing job to analyze the inference results and calculate its performance score based on ground truth. For each country, the job compares the performance of the new model with the performance of the last used model to determine which one was best, otherwise known as the “winner model.” The metadata of the winner model is saved in an Amazon DynamoDB table so it can be queried and used in the next production inference job.
  6. At the end of the performance comparison flow, an informational notification is sent to an Amazon Simple Notification Service (Amazon SNS) topic, which will be received by the MLOps team.

Running inference

The inference flow starts with a periodic query against the Amazon.com data warehouse in Amazon Redshift, as shown in Figure 3.

Inference workflow

Figure 3. Inference workflow

  1. As with training, the dataset is extracted from Amazon Redshift, split up by country, and stored in an S3 bucket and encrypted at rest using the AWS KMS key.
  2. Every country dataset upload prompts a message to an SQS queue, which invokes a Lambda function.
  3. The Lambda function gathers necessary input parameters and starts a workflow execution for the inference process. This is the same Step Function we used in the performance comparison. Now it runs against the real dataset instead of the test set.
  4. The inference Step Function orchestrates the data preparation and prediction using the winner model for each country, as stored in the model performance DynamoDB table. The predictions are uploaded back to the S3 bucket to be further consumed for reporting.
  5. Lastly, an Amazon SNS message is sent to signal completion of the inference flow, which will be received by different stakeholders.

Data encryption

One of the key requirements of this solution was to provide least privilege access to all data. To achieve this, we use AWS KMS to encrypt all data as follows:

Restriction of data decryption permissions

Figure 4. Restriction of data decryption permissions

Conclusion

In this post, we outline how we used a serverless architecture to handle the end-to-end flow of data extraction, processing, and storage. We also talk about how we use this data for model training and inference.

With this solution, our customer team onboarded 38 countries and brought 60 Amazon ML models to production to classify 3.3 million items on a monthly basis.

In the next post, we show you how we use AWS Developer Tools to build a comprehensive continuous integration/continuous delivery (CI/CD) pipeline that safeguards the code behind this solution.


Building well-architected serverless applications: Building in resiliency – part 1

Post Syndicated from Julian Wood original https://aws.amazon.com/blogs/compute/building-well-architected-serverless-applications-building-in-resiliency-part-1/

This series of blog posts uses the AWS Well-Architected Tool with the Serverless Lens to help customers build and operate applications using best practices. In each post, I address the serverless-specific questions identified by the Serverless Lens along with the recommended best practices. See the introduction post for a table of contents and explanation of the example application.

Reliability question REL2: How do you build resiliency into your serverless application?

Evaluate scaling mechanisms for serverless and non-serverless resources to meet customer demand. Build resiliency into your workload to make your serverless application resilient to withstand partial and intermittent failures across components that may only surface in production.

Required practice: Manage transaction, partial, and intermittent failures

Whenever one service or system calls another, there is a chance that failures can happen. Services or systems often don’t fail as a single unit, but rather suffer partial or transient failures. Applications should be designed to handle component failures as part of the architecture. The system should be designed to detect failure and, ideally, automatically heal itself.

Transaction failures can occur when a component is unavailable or under high load. Partial failures can occur when a percentage of requests succeeds, including during batch processing. Intermittent failures might occur when a request fails for a short period of time due to network or other transient issues.

AWS serverless services, including AWS Lambda, are fault-tolerant and designed to handle failures. If a service invokes a Lambda function and there is a service disruption, Lambda invokes the function in a different Availability Zone.

When you invoke a function directly, you determine the strategy for handling errors. You can retry, send the event to a destination or queue for debugging, or ignore the error. Clients such as the AWS Command Line Interface (CLI) and the AWS SDK retry on client timeouts, throttling errors (429), and other errors that are not caused by a bad request.

When you invoke a function indirectly, you must be aware of the retry behavior of the invoker and any service that the request encounters along the way. For more information, see “Error handling and automatic retries in AWS Lambda”. You can configure Maximum Retry Attempts and Maximum Event Age for asynchronous invocations.

When reading from Amazon Kinesis Data Streams and Amazon DynamoDB Streams, Lambda retries the entire batch of items. Retries continue until the records expire or exceed the maximum age that you configure on the event source mapping. You can also configure the event source mapping to split a failed batch into two batches. Retrying with smaller batches isolates bad records and works around timeout issues.

Partial failures can occur in non-atomic operations. PutRecords for Kinesis and BatchWriteItem for DynamoDB return a successful response if at least one record is ingested successfully. Always inspect the response when using such operations and programmatically deal with partial failures.

Use exponential backoff with jitter

The simplest technique for dealing with failures in a networked environment is to retry calls until they succeed. This technique increases the reliability of the application and reduces operational costs for the developer.

However, it is not always safe to retry. A retry can further increase the load on the system being called if the system is already failing due to an overload. To avoid this problem, use backoff. Instead of retrying immediately and aggressively, the client waits some amount of time between tries. The most common pattern is an exponential backoff, which uses exponentially longer wait times between retries. This is typically capped to a maximum delay and number of retries.

If all backoff retries are still happening at the same time, this can still overload a system or cause contention. To avoid this problem, use jitter. Jitter adds some amount of randomness to the backoff to spread the retries around in time. This can help prevent large bursts by spreading out the rate when clients connect. For more information see the Amazon Builders’ Library article “Timeouts, retries, and backoff with jitter” and AWS Architecture blog post “Exponential Backoff And Jitter”.

Exponential backoff and jitter

Exponential backoff and jitter

When your application responds to callers in fail-fast scenarios and when performance is degraded, inform the caller via headers or metadata when they can retry.

Each AWS SDK implements automatic retry logic including exponential backoff. For downstream calls, you can adjust AWS and third-party SDK retries, backoffs, TCP, and HTTP timeouts. This helps you decide when to stop retrying. For more information, see the documentation and troubleshooting steps for Lambda and the AWS SDK.

Use a dead-letter queue mechanism to retain, investigate and retry failed transactions

There are a number of ways to handle message failures including destinations and dead-letter queues.

You can configure Lambda to send records of asynchronous invocations to another destination service. These include Amazon Simple Queue Service (SQS), Amazon Simple Notification Service (SNS), Lambda, and Amazon EventBridge. You can configure separate destinations for events that fail processing and events that are successfully processed. The invocation record contains details about the event, the response, and the reason that the record was sent.

The following example shows a function that sends a record of a successful invocation to an EventBridge event bus. When an event fails all processing attempts, Lambda sends an invocation record to an SQS queue. It includes the function’s response in the invocation record.

AWS Lambda destinations for asynchronous invocation

AWS Lambda destinations for asynchronous invocation

SNS, SQS, Lambda, and EventBridge support dead-letter queues (DLQs). DLQs make your applications more resilient and durable by storing messages or events that can’t be processed correctly into a dedicated SQS queue. This helps you debug your application by isolating the problematic messages to determine why their processing failed. One you have resolved the issue, re-process the failed message. For more information, see “When should I use a dead-letter queue?” There is an example serverless application to redrive the messages from an SQS DLQ back to its source SQS queue.

For Lambda, DLQs provide an alternative to a failure destination. Lambda destinations is preferable for asynchronous invocations.

Good practice: Orchestrate long-running transactions

Long-running transactions can be processed by one or multiple components. Consider implementing the saga pattern using state machines for these types of transactions.

The saga pattern coordinates transactions between multiple microservices as part of a state machine. Each service that performs a transaction publishes an event to trigger the next transaction in the saga. This continues until the transaction chain is complete. If a transaction fails, saga orchestrates a series of compensating transactions that undo the changes that were made by the preceding transactions.

This is preferable to handling complex or long-running transactions within application code. State machines prevent cascading failures and avoid tightly coupling components with orchestrating logic and business logic.

Use a state machine to visualize distributed transactions, and to separate business logic from orchestration logic.

AWS Step Functions lets you coordinate multiple AWS services into serverless workflows via state machines. Within Step Functions, you can set separate retries, backoff rates, max attempts, intervals, and timeouts. These are set for every step of your state machine using a declarative language.

In the serverless airline example used in this series, Step Functions is used to orchestrate the Booking microservice. The ProcessBooking state machine handles all the necessary steps to create bookings, including payment.

Booking service Step Functions state machine

Booking service Step Functions state machine

The state machine uses a combination of service integrations using DynamoDB, SQS, and Lambda functions to coordinate transactions and handle failures.

For example, the Reserve Booking task invokes a Lambda function. The task has retry and error handling configured as part of the task definition.

"Reserve Booking": {
	"Type": "Task",
	"Resource": "${ReserveBooking.Arn}",
	"TimeoutSeconds": 5,
	"Retry": [
		{
			"ErrorEquals": [
				"BookingReservationException"
			],
			"IntervalSeconds": 1,
			"BackoffRate": 2,
			"MaxAttempts": 2
		}
	],
	"Catch": [
		{
			"ErrorEquals": [
				"States.ALL"
			],
			"ResultPath": "$.bookingError",
			"Next": "Cancel Booking"
		}
	],
	"ResultPath": "$.bookingId",
	"Next": "Collect Payment"
},

Step Functions supports direct service integrations, including DynamoDB. The Reserve Flight task directly updates the flightTable without requiring a Lambda function.

"Reserve Flight": {
	"Type": "Task",
	"Resource": "arn:aws:states:::dynamodb:updateItem",
	"Parameters": {
		"TableName.$": "$.flightTable",
		"Key": {
			"id": {
				"S.$": "$.outboundFlightId"
			}
		},
		"UpdateExpression": "SET seatCapacity = seatCapacity - :dec",
		"ExpressionAttributeValues": {
			":dec": {
				"N": "1"
			},
			":noSeat": {
				"N": "0"
			}
		},
		"ConditionExpression": "seatCapacity > :noSeat"
	},

By default, when a state reports an error, Step Functions causes the execution to fail entirely.

Utilize dead-letter queues in response to failed state machine executions

Any state within the Step Functions workflow can encounter runtime errors. These include state machine definition issues, task failures such as Lambda function exceptions, or transient issues such as network connectivity issues. For more information, see “Error handling in Step Functions”.

Use the Step Functions service integration with SQS to send failed transactions to a DLQ as the final step. This adds a higher level of durability within your state machines.

For example, the airline Notify Failed Booking final task catches failed states from four previous steps. It sends the results to the Booking DLQ.

Booking service Step Functions DLQ

Booking service Step Functions DLQ

The message includes the output of the previous failed states for further troubleshooting.

"Booking DLQ": {
	"Type": "Task",
	"Resource": "arn:aws:states:::sqs:sendMessage",
	"Parameters": {
		"QueueUrl": "${BookingsDLQ}",
		"MessageBody.$": "$"
	},
	"ResultPath": "$.deadLetterQueue",
	"Next": "Booking Failed"
},

The Step Functions documentation has more information on calling SQS.

Conclusion

Build resiliency into your workloads. This makes sure that your application can withstand partial and intermittent failures across components that may only surface in production.

In this post, I cover managing failures using retries, exponential backoff, and jitter. I explain how DLQs can isolate failed messages. I show how to use state machines to orchestrate long running transactions rather than handling these in application code.

This well-architected question continues in part 2 where I look at managing duplicate and unwanted events with idempotency and an event schema. I cover how to consider scaling patterns at burst rates by managing account limits and show relevant metrics to evaluate.

For more serverless learning resources, visit Serverless Land.

Building a serverless multiplayer game that scales: Part 2

Post Syndicated from James Beswick original https://aws.amazon.com/blogs/compute/building-a-serverless-multiplayer-game-that-scales-part-2/

This post is written by Vito De Giosa, Sr. Solutions Architect and Tim Bruce, Sr. Solutions Architect, Developer Acceleration.

This series discusses solutions for scaling serverless games, using the Simple Trivia Service, a game that relies on user-generated content. Part 1 describes the overall architecture, how to deploy to your AWS account, and different communications methods.

This post discusses how to scale via automation and asynchronous processes. You can use automation to minimize the need to scale personnel to review player-generated content for acceptability. It also introduces asynchronous processing, which allows you to run non-critical processes in the background and batch data together. This helps to improve resource usage and game performance. Both scaling techniques can also reduce overall spend.

To set up the example, see the instructions in the GitHub repo and the README.md file. This example uses services beyond the AWS Free Tier and incurs charges. Instructions to remove the example application from your account are also in the README.md file.

Technical implementation

Games require a mechanism to support auto-moderated avatars. Specifically, this is an upload process to allow the player to send the content to the game. There is a content moderation process to remove unacceptable content and a messaging process to provide players with a status regarding their content.

Here is the architecture for this feature in Simple Trivia Service, which is combined within the avatar workflow:

Architecture diagram

This architecture processes images uploaded to Amazon S3 and notifies the user of the processing result via HTTP WebPush. This solution uses AWS Serverless services and the Amazon Rekognition moderation API.

Uploading avatars

Players start the process by uploading avatars via the game client. Using presigned URLs, the client allows players to upload images directly to S3 without sharing AWS credentials or exposing the bucket publicly.

The URL embeds all the parameters of the S3 request. It includes a SignatureV4 generated with AWS credentials from the backend allowing S3 to authorize the request.

S3 upload process

  1. The front end retrieves the presigned URL invoking an AWS Lambda function through an Amazon API Gateway HTTP API endpoint.
  2. The front end uses the URL to send a PUT request to S3 with the image.

Processing avatars

After the upload completes, the backend performs a set of activities. These include content moderation, generating the thumbnail variant, and saving the image URL to the player profile. AWS Step Functions orchestrates the workflow by coordinating tasks and integrating with AWS services, such as Lambda and Amazon DynamoDB. Step Functions enables creating workflows without writing code and handles errors, retries, and state management. This enables traffic control to avoid overloading single components when traffic surges.

The avatar processing workflow runs asynchronously. This allows players to play the game without being blocked and enables you to batch the requests. The Step Functions workflow is triggered from an Amazon EventBridge event. When the user uploads an image to S3, an event is published to EventBridge. The event is routed to the avatar processing Step Functions workflow.

The single avatar feature runs in seconds and uses Step Functions Express Workflows, which are ideal for high-volume event-processing use cases. Step Functions can also support longer running processes and manual steps, depending on your requirements.

To keep performance at scale, the solution adopts four strategies. First, it moderates content automatically, requiring no human intervention. This is done via Amazon Rekognition moderation API, which can discover inappropriate content in uploaded avatars. Developers do not need machine learning expertise to use this API. If it identifies unacceptable content, the Step Functions workflow deletes the uploaded picture.

Second, it uses avatar thumbnails on the top navigation bar and on leaderboards. This speeds up page loading and uses less network bandwidth. Image-editing software runs in a Lambda function to modify the uploaded file and store the result in S3 with the original.

Third, it uses Amazon CloudFront as a content delivery network (CDN) with the S3 bucket hosting images. This improves performance by implementing caching and serving static content from locations closer to the player. Additionally, using CloudFront allows you to keep the bucket private and provide greater security for the content stored within S3.

Finally, it stores profile picture URLs in DynamoDB and replicates the thumbnail URL in an Amazon Cognito user attribute named picture. This allows the game to retrieve the avatar URL as part of the login process, saving an HTTP GET request for the player profile.

The last step of the workflow publishes the result via an event to EventBridge for downstream systems to consume. The service routes the event to the notification component to inform the player about the moderation status.

Notifying users of the processing result

The result of the avatar workflow to the player is important but not urgent. Players want to know the result but not impact their gameplay experience. A solution for this challenge is to use HTTP web push. It uses the HTTP protocol and does not require a constant communication channel between backend and front end. This allows players to play games without being blocked or by introducing latency to the game communications channel.

Applications requiring low latency fully bidirectional communication, such as highly interactive multi-player games, typically use WebSockets. This creates a persistent two-way channel for front end and backend to exchange information. The web push mechanism can provide non-urgent data and messages to the player without interrupting the WebSockets channel.

The web push protocol describes how to use a consolidated push service as a broker between the web-client and the backend. It accepts subscriptions from the client and receives push message delivery requests from the backend. Each browser vendor provides a push service implementation that is compliant with the W3C Push API specification and is external to both client and backend.

The web client is typically a browser where a JavaScript application interacts with the push service to subscribe and listen for incoming notifications. The backend is the application that notifies the front end. Here is an overview of the protocol with all the parties involved.

Notification process

  1. A component on the client subscribes to the configured push service by sending an HTTP POST request. The client keeps a background connection waiting for messages.
  2. The push service returns a URL identifying a push resource that the client distributes to backend applications that are allowed to send notifications.
  3. Backend applications request a message delivery by sending an HTTP POST request to the previously distributed URL.
  4. The push service forwards the information to the client.

This approach has four advantages. First, it reduces the effort to manage the reliability of the delivery process by off-loading it to an external and standardized component. Second, it minimizes cost and resource consumption. This is because it doesn’t require the backend to keep a persistent communication channel or compute resources to be constantly available. Third, it keeps complexity to a minimum because it relies on HTTP only without requiring additional technologies. Finally, HTTP web push addresses concepts such as message urgency and time-to-live (TTL) by using a standard.

Serverless HTTP web push

The implementation of the web push protocol requires the following components, per the Push API specification. First, the front end is required to create a push subscription. This is implemented through a service worker, a script running in the origin of the application. The service worker exposes operations to access the push service either creating subscriptions or listening for push events.

Serverless HTTP web push

  1. The client uses the service worker to subscribe to the push service via the Push API.
  2. The push service responds with a payload including a URL, which is the client’s push endpoint. The URL is used to create notification delivery requests.
  3. The browser enriches the subscription with public cryptographic keys, which are used to encrypt messages ensuring confidentiality.
  4. The backend must receive and store the subscription for when a delivery request is made to the push service. This is provided by API Gateway, Lambda, and DynamoDB. API Gateway exposes an HTTP API endpoint that accepts POST requests with the push service subscription as payload. The payload is stored in DynamoDB alongside the player identifier.

This front end code implements the process:

//Once service worker is ready
navigator.serviceWorker.ready
  .then(function (registration) {
    //Retrieve existing subscription or subscribe
    return registration.pushManager.getSubscription()
      .then(async function (subscription) {
        if (subscription) {
          console.log('got subscription!', subscription)
          return subscription;
        }
        /*
         * Using Public key of our backend to make sure only our
         * application backend can send notifications to the returned
         * endpoint
         */
        const convertedVapidKey = self.vapidKey;
        return registration.pushManager.subscribe({
          userVisibleOnly: true,
          applicationServerKey: convertedVapidKey
        });
      });
  }).then(function (subscription) {
    //Distributing the subscription to the application backend
    console.log('register!', subscription);
    const body = JSON.stringify(subscription);
    const parms = {jwt: jwt, playerName: playerName, subscription: body};
    //Call to the API endpoint to save the subscription
    const res = DataService.postPlayerSubscription(parms);
    console.log(res);
  });


Next, the backend reacts to the avatar workflow completed custom event to create a delivery request. This is accomplished with EventBridge and Lambda.

Backend process after avater workflow completed

  1. EventBridge routes the event to a Lambda function.
  2. The function retrieves the player’s agent subscriptions, including push endpoint and encryption keys, from DynamoDB.
  3. The function sends an HTTP POST to the push endpoint with the encrypted message as payload.
  4. When the push service delivers the message, the browser activates the service worker updating local state and displaying the notification.

The push service allows creating delivery requests based on the knowledge of the endpoint and the front end allows the backend to deliver messages by distributing the endpoint. HTTPS provides encryption for data in transit while DynamoDB encrypts all your data at rest to provide confidentiality and security for the endpoint.

Security of WebPush can be further improved by using Voluntary Application Server Identification (VAPID). With WebPush, the clients authenticate messages at delivery time. VAPID allows the push service to perform message authentication on behalf of the web client avoiding denial-of-service risk. Without the additional security of VAPID, any application knowing the push service endpoint might successfully create delivery requests with an invalid payload. This can cause the player’s agent to accept messages from unauthorized services and, possibly, cause a denial-of-service to the client by overloading its capabilities.

VAPID requires backend applications to own a key pair. In Simple Trivia Service, a Lambda function, which is an AWS CloudFormation custom resource, generates the key pair when deploying the stack. It securely saves values in AWS System Manager (SSM) Parameter Store.

Here is a representation of VAPID in action:

VAPID process architecture

  1. The front end specifies which backend the push service can accept messages from. It does this by including the public key from VAPID in the subscription request.
  2. When requesting a message delivery, the backend self-identifies by including the public key and a token signed with the private key in the HTTP Authorization header. If the keys match and the client uses the public key at subscription, the message is sent. If not, the message is blocked by the push service.

The Lambda function that sends delivery requests to the push service reads the key values from SSM. It uses them to generate the Authorization header to include in the request, allowing for successful delivery to the client endpoint.

Conclusion

This post shows how you can add scaling support for a game via automation. The example uses Amazon Rekognition to check images for unacceptable content and uses asynchronous architecture patterns with Step Functions and HTTP WebPush. These scaling approaches can help you to maximize your technical and personnel investments.

For more serverless learning resources, visit Serverless Land.
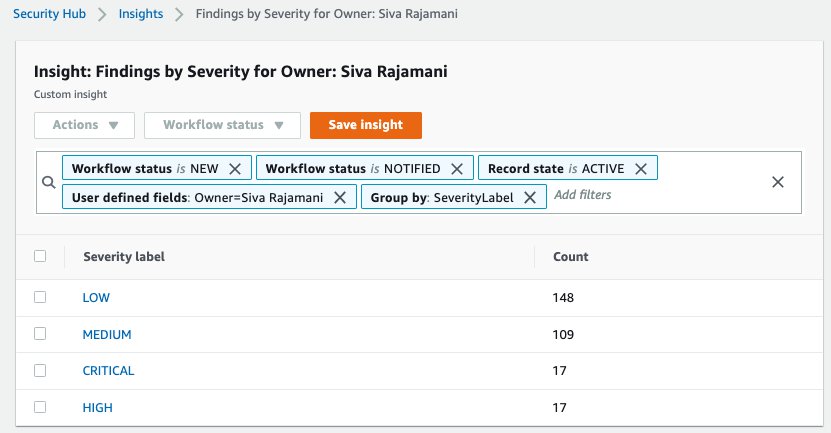
Using Amazon Macie to Validate S3 Bucket Data Classification

Post Syndicated from Bill Magee original https://aws.amazon.com/blogs/architecture/using-amazon-macie-to-validate-s3-bucket-data-classification/

Securing sensitive information is a high priority for organizations for many reasons. At the same time, organizations are looking for ways to empower development teams to stay agile and innovative. Centralized security teams strive to create systems that align to the needs of the development teams, rather than mandating how those teams must operate.

Security teams who create automation for the discovery of sensitive data have some issues to consider. If development teams are able to self-provision data storage, how does the security team protect that data? If teams have a business need to store sensitive data, they must consider how, where, and with what safeguards that data is stored.

Let’s look at how we can set up Amazon Macie to validate data classifications provided by decentralized software development teams. Macie is a fully managed service that uses machine learning (ML) to discover sensitive data in AWS. If you are not familiar with Macie, read New – Enhanced Amazon Macie Now Available with Substantially Reduced Pricing.

Data classification is part of the security pillar of a Well-Architected application. Following the guidelines provided in the AWS Well-Architected Framework, we can develop a resource-tagging scheme that fits our needs.

Overview of decentralized data validation system

In our example, we have multiple levels of data classification that represent different levels of risk associated with each classification. When a software development team creates a new Amazon Simple Storage Service (S3) bucket, they are responsible for labeling that bucket with a tag. This tag represents the classification of data stored in that bucket. The security team must maintain a system to validate that the data in those buckets meets the classification specified by the development teams.

This separation of roles and responsibilities for development and security teams who work independently requires a validation system that’s decoupled from S3 bucket creation. It should automatically detect new buckets or data in the existing buckets, and validate the data against the assigned classification tags. It should also notify the appropriate development teams of misclassified or unclassified buckets in a timely manner. These notifications can be through standard notification channels, such as email or Slack channel notifications.

Validation and alerts with AWS services

Figure 1. Validation system for Data Classification

Figure 1. Validation system for data classification

We assume that teams are permitted to create S3 buckets and we will use AWS Config to enforce the following required tags: DataClassification and SupportSNSTopic. The DataClassification tag indicates what type of data is allowed in the bucket. The SupportSNSTopic tag indicates an Amazon Simple Notification Service (SNS) topic. If there are issues found with the data in the bucket, a message is published to the topic, and Amazon SNS will deliver an alert. For example, if there is personally identifiable information (PII) data in a bucket that is classified as non-sensitive, the system will alert the owners of the bucket.
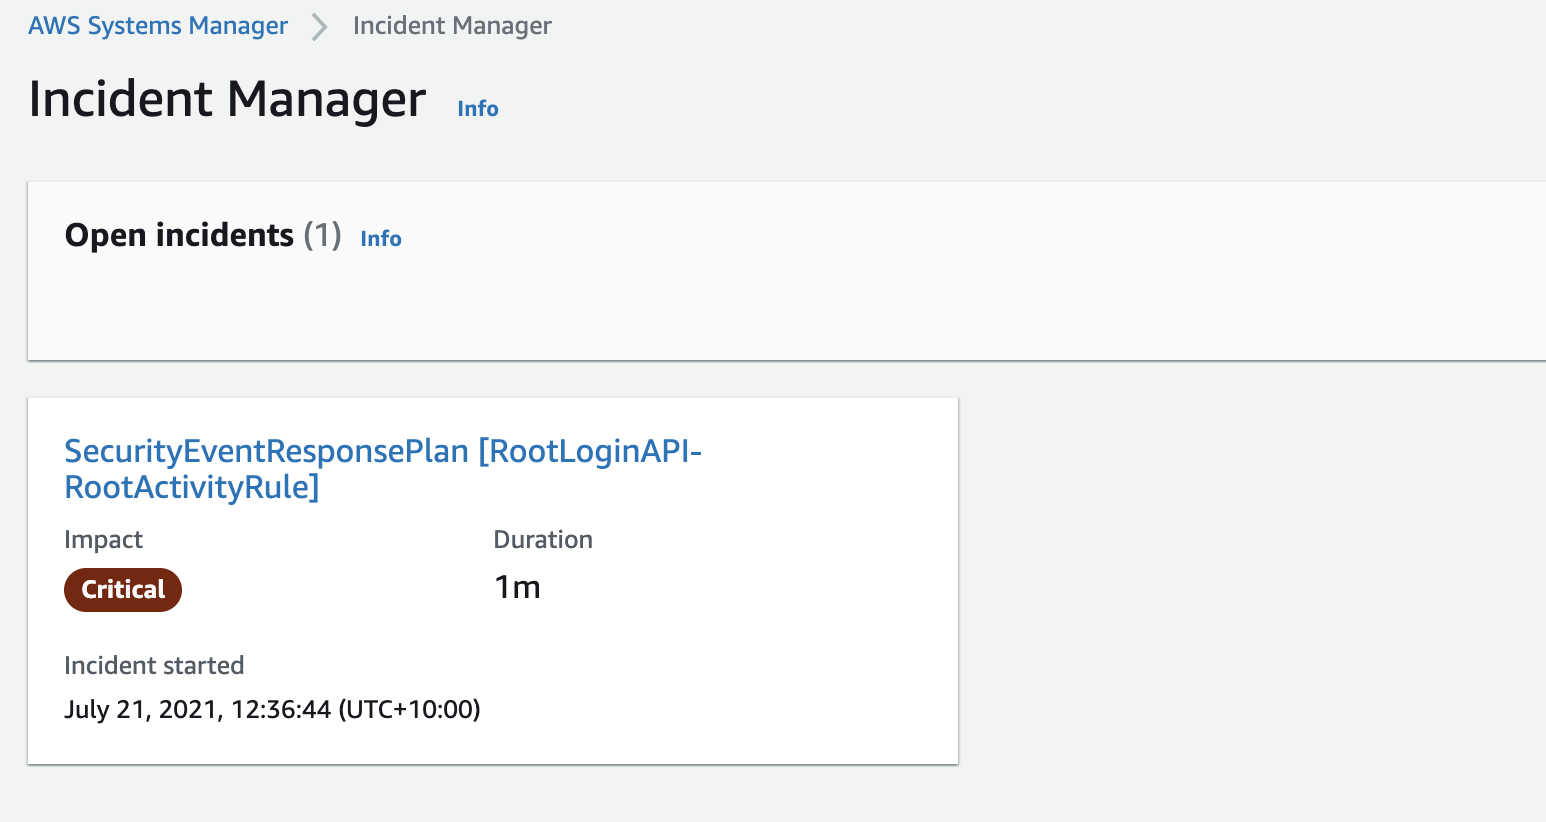
Macie is configured to scan all S3 buckets on a scheduled basis. This configuration ensures that any new bucket and data placed in the buckets is analyzed the next time the Macie job runs.

Macie provides several managed data identifiers for discovering and classifying the data. These include bank account numbers, credit card information, authentication credentials, PII, and more. You can also create custom identifiers (or rules) to gather information not covered by the managed identifiers.

Macie integrates with Amazon EventBridge to allow us to capture data classification events and route them to one or more destinations for reporting and alerting needs. In our configuration, the event initiates an AWS Lambda. The Lambda function is used to validate the data classification inferred by Macie against the classification specified in the DataClassification tag using custom business logic. If a data classification violation is found, the Lambda then sends a message to the Amazon SNS topic specified in the SupportSNSTopic tag.

The Lambda function also creates custom metrics and sends those to Amazon CloudWatch. The metrics are organized by engineering team and severity. This allows the security team to create a dashboard of metrics based on the Macie findings. The findings can also be filtered per engineering team and severity to determine which teams need to be contacted to ensure remediation.

Conclusion

This solution provides a centralized security team with the tools it needs. The team can validate the data classification of an Amazon S3 bucket that is self-provisioned by a development team. New Amazon S3 buckets are automatically included in the Macie jobs and alerts. These are only sent out if the data in the bucket does not conform to the classification specified by the development team. The data auditing process is loosely coupled with the Amazon S3 Bucket creation process, enabling self-service capabilities for development teams, while ensuring proper data classification. Your teams can stay agile and innovative, while maintaining a strong security posture.

Learn more about Amazon Macie and Data Classification.