Post Syndicated from Ashutosh Pateriya original https://aws.amazon.com/blogs/architecture/optimize-cost-by-automating-the-start-stop-of-resources-in-non-production-environments/
Co-authored with Nirmal Tomar, Principal Consultant, Infosys Technologies Ltd.
Ease of creating on-demand resources on AWS can sometimes lead to over-provisioning or under-utilization of AWS resources like Amazon EC2 and Amazon RDS. This can lead to higher costs that can often be avoided with proper planning and monitoring. Non-critical environments, like development and test are often not monitored on a regular basis and can result in under-utilization of AWS resources.
In this blog, we discuss a common AWS cost optimization strategy, which is an automated and deployable solution to schedule the start/stop of AWS resources. For this example, we are considering non-production environments because in most scenarios these do not need to be available at all time. By following this solution, cloud architects can automate the start/stop of services per their usage pattern and can save up to 70% of costs while running their non-production environment.
The solution outlined here is designed to automatically stop and start the following AWS services based on your needs; Amazon RDS, Amazon Aurora, Amazon EC2, Auto Scaling groups, AWS Beanstalk, and Amazon EKS. The solution is automated using AWS Step functions, AWS Lambda, AWS CloudFormation Templates, Amazon EventBridge and AWS Identity and Access Management (IAM).
In this solution, we also provide an option to exclude specific Amazon Resource Names (ARNs) of the aforementioned services. This helps cloud architects to exclude the start/stop function for various use cases like in a QA environment when they don’t want to stop Aurora or they want to start RDS in a Development environment. The solution can be used to start/stop the services mentioned previously on a scheduled interval but can also be used for other applicable services like Amazon ECS, Amazon SageMaker Notebook Instances, Amazon Redshift and many more.
Note – Don’t set up this solution in a production or other environment where you require continuous service availability.
Prerequisites
For this walkthrough, you should have the following prerequisites:
- An AWS account with permission to spin up required resources.
- A running Amazon Aurora instance in the source AWS account.
Walkthrough
To set up this solution, proceed with the following two steps:
- Set up the step function workflow to stop services using a CloudFormation template. On a scheduled interval, this workflow will run and stop the chosen services.
- Set up the step function workflow to start services using a CloudFormation template. On a scheduled interval, this workflow will run and start services as configured during the CloudFormation setup.
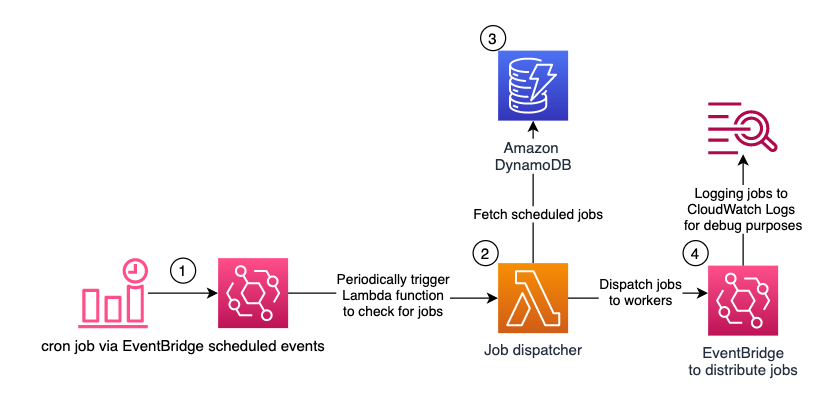
1. Stop Services using the Step Function workflow for a predefined duration

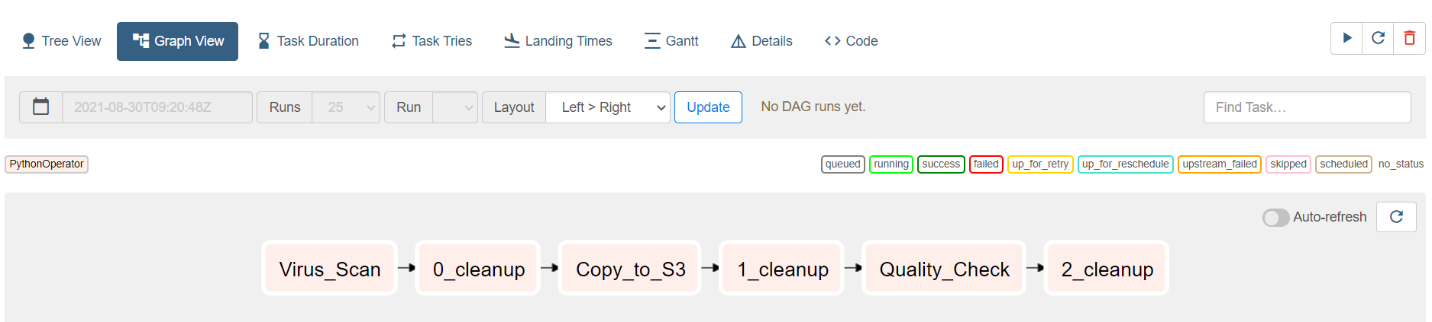
Figure 1 – Architecture showing the AWS Step Functions Workflow to stop services
The AWS Lambda functions involved in this workflow:
- StopAuroraCluster: This Lambda function will stop all Aurora Cluster setup across Region including read replica.
- StopRDSInstances: This Lambda function will stop all RDS Instances except the Aurora setup across the Region.
- ScaleDownEKSNodeGroups: This Lambda function will downsize all nodegroups to zero instance across the Region.
- ScaleDownASG: This Lambda function will downsize all Auto Scaling groups including the Elastic Beanstalk Auto Scaling group to zero instance across Region. We can edit CloudFormation templates to include the custom value.
- StopEC2Instances: This Lambda function will stop all EC2 instances set up across the Region.
Using the following AWS CloudFormation Template, we set up the required services and workflow:
a. Launch the template in the source account and source Region:


b. Fill out the preceding form with the following details and select Next.
Stack name: Stack Name which you want to create.
ExcludeAuroraClusterArnListInCommaSeprated: Comma separated Aurora clusters ARN which enterprises don’t want to stop, keep the default value if there is no exclusion list.
e.g. arn:aws:rds:us-east-1:111111111111:cluster:aurorcluster1, arn:aws:rds:us-east-2:111111111111:cluster:auroracluster2
ExcludeRDSDBInstancesArnListInCommaSeprated: Comma separated DB instances ARN which enterprises don’t want to stop, keep the default value if there is no exclusion list.
e.g. arn:aws:rds:us-east-1:111111111111:db:rds-instance-1, arn:aws:rds:us-east-2:111111111111:db:rds-instance-2
ExcludeEKSClusterNodeGroupsArnListInCommaSeprated: Comma separated EKS Clusters ARN which enterprises don’t want to stop, leave it with default value if there is no exclusion list.
e.g. arn:aws:eks:us-east-2:111111111111:cluster/testcluster
ExcludeAutoScalingGroupIncludingBeanstalkListInCommaSeprated: Comma separated Beanstalk and other Auto Clusters groups ARN (except Amazon EKS) which enterprises don’t want to stop, keep the default value if there is no exclusion list.
e.g. arn:aws:autoscaling:us-east-1:111111111111:autoScalingGroup:6d5af669-eb3b-4530-894b-e314a667f2e7:autoScalingGroupName/test-0-ASG
ExcludeEC2InstancesIdListInCommaSeprated: Comma separated EC2 instance ID’s which you don’t want to stop, keep the default value if there is no exclusion list.
e.g. i-02185df0872f0f852, 0775f7e39513c50dd
ScheduleExpression: Schedule a cron expression when you want to run this workflow. Sample expressions are available in this guide, Schedule expressions using rate or cron.
c. Select IAM role to launch this template. As a best practice, select the AWS CloudFormation service role to manage AWS services and resources available to each user.

d. Acknowledge that you want to create various resources including IAM roles/policies and select Create Stack.

2. Start Services using the Step Function workflow in pre-configured time

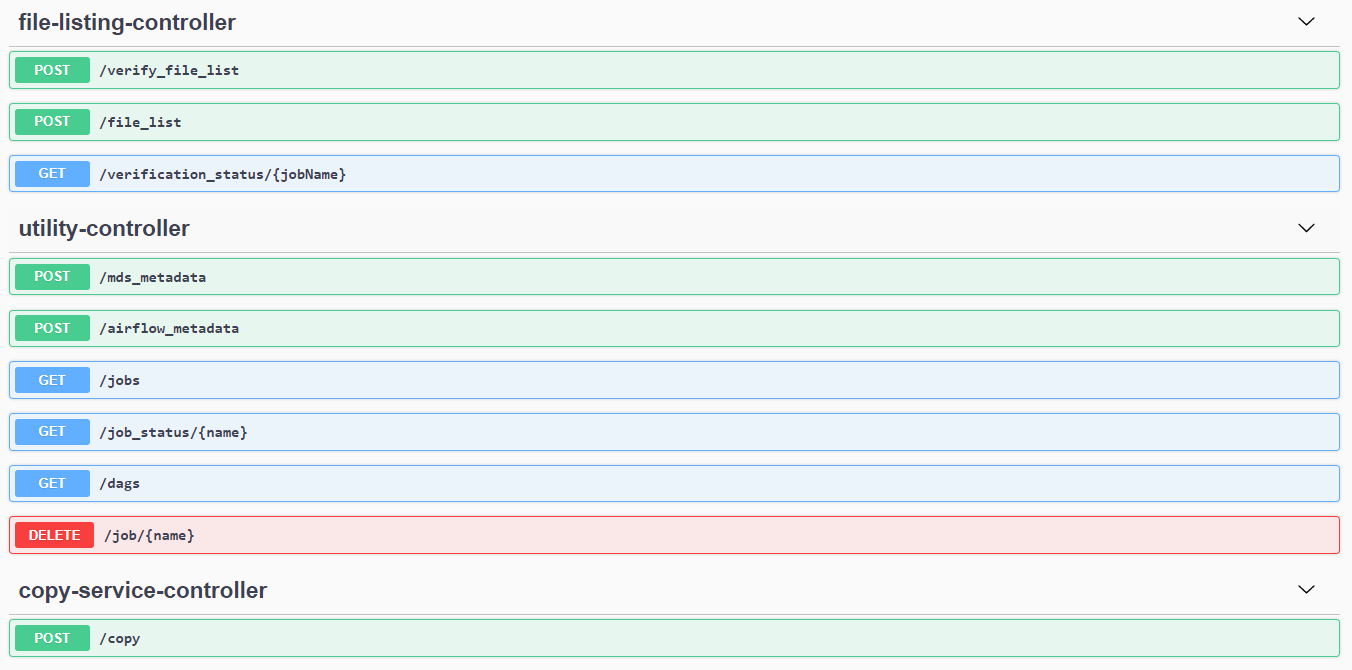
Figure 2 – Architecture showing the AWS Step Functions Workflow to start services
The Lambda functions involved in this workflow:
- StartAuroraCluster: This Lambda function will start all Aurora Cluster setup across Region including read-replica.
- StartRDSInstances: This Lambda function will start all RDS Instances except for the Aurora setup across the Region.
- ScaleUpEKSNodeGroups: This Lambda function will upsize all nodegroups to minimum 2 and maximum 4 instances across Region. We can edit CloudFormation templates for custom value.
- ScaleUpASG: This Lambda function will Scale up all Auto Scaling group including Elastic Beanstalk Auto Scaling group to minimum 2 and maximum 4 instances across the Region. We can edit CloudFormation templates for custom value.
- StartEC2Instances: This Lambda function will start all EC2 instances setup across the Region.
Using the following AWS CloudFormation template, we set up the required services and workflow:
a. Launch the template in the source account and source Region:
b. Fill out the preceding form with the following details and select Next.

Stack name: Stack Name which you want to create.
ExcludeAuroraClusterArnListInCommaSeprated: Comma separated Aurora clusters the ARN which you don’t want to start, keep the default value if there is no exclusion list.
For example: arn:aws:rds:us-east-1:111111111111:cluster:aurorcluster1, arn:aws:rds:us-east-2:111111111111:cluster:auroracluster2
ExcludeRDSDBInstancesArnListInCommaSeprated: Comma separated databaseinstances ARN which you don’t want to start, keep default value if there is no exclusion list.
For example: arn:aws:rds:us-east-1:111111111111:db:rds-instance-1, arn:aws:rds:us-east-2:111111111111:db:rds-instance-2
ExcludeEKSClusterNodeGroupsArnListInCommaSeprated: Comma separated EKS Clusters ARN which you don’t want to start, keep the default value if there is no exclusion list.
For example: arn:aws:eks:us-east-2:111111111111:cluster/testcluster
ExcludeAutoScalingGroupIncludingBeanstalkListInCommaSeprated: Comma separated Beanstalk and other Auto Clusters groups ARN (except EKS) which you don’t want to start, keep the default value if there is no exclusion list.
For example: arn:aws:autoscaling:us-east-1:111111111111:autoScalingGroup:6d5af669-eb3b-4530-894b-e314a667f2e7:autoScalingGroupName/test-0-ASG
ExcludeEC2InstancesIdListInCommaSeprated: Comma separated EC2 instance ID s you don’t want to start, keep the default value if there is no exclusion list.
For example: i-02185df0872f0f852, 0775f7e39513c50dd
ScheduleExpression: Schedule a cron expression when you want to run this workflow. Sample expressions are available in this guide, Schedule expressions using rate or cron.
c. Select IAM role to launch this template. As a best practice, select the AWS CloudFormation service role to manage AWS services and resources available to each user.

d. Acknowledge that you want to create various resources including IAM roles and policies and select Create Stack.

Cleaning up
Delete any unused resources to avoid incurring future charges.
Conclusion
In this blog post, we outlined a solution to help you optimize cost by automating the stop/start of AWS services in non-production environments. Cost Optimization and Cloud Financial Management are ongoing initiatives. We hope you found this solution helpful and encourage you to explore additional ways to optimize cost on the AWS Architecture Center.


 Hari Ohm Prasath is a Senior Modernization Architect at AWS, helping customers with their modernization journey to become cloud native. Hari loves to code and actively contributes to the open source initiatives. You can find him in Medium, Github & Twitter @hariohmprasath.
 Ballu Singh is a Principal Solutions Architect at AWS. He lives in the San Francisco Bay area and helps customers architect and optimize applications on AWS. In his spare time, he enjoys reading and spending time with his family.