Tag Archives: Architecture

Insights for CTOs: Part 2 – Enable Good Decisions at Scale with Robust Security

Post Syndicated from Syed Jaffry original https://aws.amazon.com/blogs/architecture/insights-for-ctos-part-2-enable-good-decisions-at-scale-with-robust-security/

In my role as a Senior Solutions Architect, I have spoken to chief technology officers (CTOs) and executive leadership of large enterprises like big banks, software as a service (SaaS) businesses, mid-sized enterprises, and startups.

In this 6-part series, I share insights gained from various CTOs during their cloud adoption journeys at their respective organizations. I have taken these lessons and summarized architecture best practices to help you build and operate applications successfully in the cloud. This series will also cover topics on building and operating cloud applications, security, cloud financial management, modern data and artificial intelligence (AI), cloud operating models, and strategies for cloud migration.

In part 2, my colleague Paul Hawkins and I will show you how to effectively communicate organization-wide security processes. This will ensure you can make informed decisions to scale effectively. We also describe how to establish robust security controls using best practices from the Security Pillar of the Well-Architected Framework.

Effectively establish and communicate security processes

To ensure your employees, customers, contractors, etc., understand your organization’s security goals, make sure that people know the what, how, and why behind your security objectives:

  • What are the overall objectives they need to meet?
  • How do you intend for the organization and your customers to work together to meet these goals?
  • Why are meeting these goals important to your organization and customers?

Having well communicated security principles gives a common understanding of overall objectives. Once you communicate these goals, you can get more specific in terms of how those objectives can be achieved.

The next sections discuss best practices to establish your organization’s security processes.

Create a “path to production” process

A “path to production” process is a set of consistent and reusable engineering standards and steps that each new cloud workload must adhere to prior to production deployment. Using this process will increase delivery velocity while reducing business risk by ensuring strong compliance to standards.

Classify your data for better access control

Understanding the type of data that you are handling and where it is being handled is critical to understanding what you need to do to appropriately protect it. For example, the requirements for a public website are different than a payment processing workload. By knowing where and when sensitive data is being accessed or used, you can more easily assess and establish the appropriate controls.

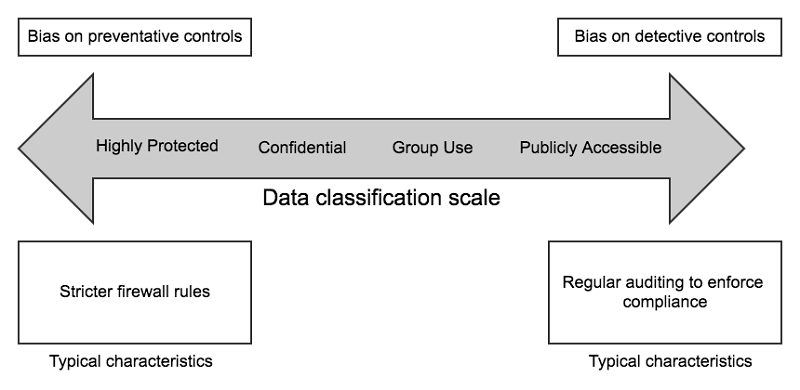
Figure 1 shows a scale that will help you determine when and how to protect sensitive data. It shows that you would apply stricter access controls for more sensitive data to reduce the risk of inappropriate access. Detective controls allow you to audit and respond to unexpected access.

By simplifying the baseline control posture across all environments and layering on stricter controls where appropriate, you will make it easier to deliver change more swiftly while maintaining the right level of security.

Data classification and control scale

Figure 1. Data classification and control scale

Identify and prioritize how to address risks using a threat model

As shown in the How to approach threat modeling blog post, threat modeling helps workload teams identify potential threats and develop or implement security controls to address those threats.

Threat modeling is most effective when it’s done at the workload (or workload feature) level. We recommend creating reusable threat modeling templates. This will help ensure quicker time to production and a consistent security control posture for your systems.

Create feedback cycles

Security, like other areas of architecture and design, is not static. You don’t implement security processes and walk away, just like you wouldn’t ship an application and never improve its availability, performance, or ease of operation.

Implementation of feedback cycles will vary depending on your organizational structure and processes. However, one common way we have seen feedback cycles being implemented is with a collaborative, blame-free root cause analysis (RCA) process. It allows you to understand how many issues you have been able to prevent or effectively respond to and apply that knowledge to make your systems more secure. It also demonstrates organizational support for an objective discussion where people are not penalized for asking questions.

Security controls

Protect your applications and infrastructure

To secure your organization, build automation that delivers robust answers to the following questions:

  1. Preventative controls – how well can you block unauthorized access?
  2. Detective controls – how well can you identify unexpected activity or unwanted configuration?
  3. Incident response – how quickly and effectively can you respond and recover from issues?
  4. Data protection – how well is the data protected while being used and stored?

Preventative controls

Start with robust identity and access management (IAM). For human access, avoid having to maintain separate credentials between cloud and on-premises systems. It does not scale and creates threat vectors such as long-lived credentials and credential leaks.

Instead, use federated authentication within a centralized system for provisioning and deprovisioning organization-wide access to all your systems, including the cloud. For AWS access, you can do this with AWS Single Sign-On (AWS SSO), direct federation to IAM, or integration with partner solutions, such as Okta or Active Directory.

Enhance your trust boundary with the principles of “zero trust.” Traditionally, organizations tend to rely on the network as the primary point of control. This can create a “hard shell, soft core” model, which doesn’t consider context for access decisions. Zero trust is about increasing your use of identity as a means to grant access in addition to traditional controls that rely on network being private.

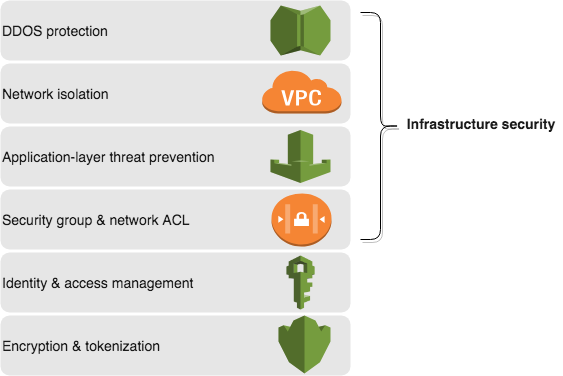
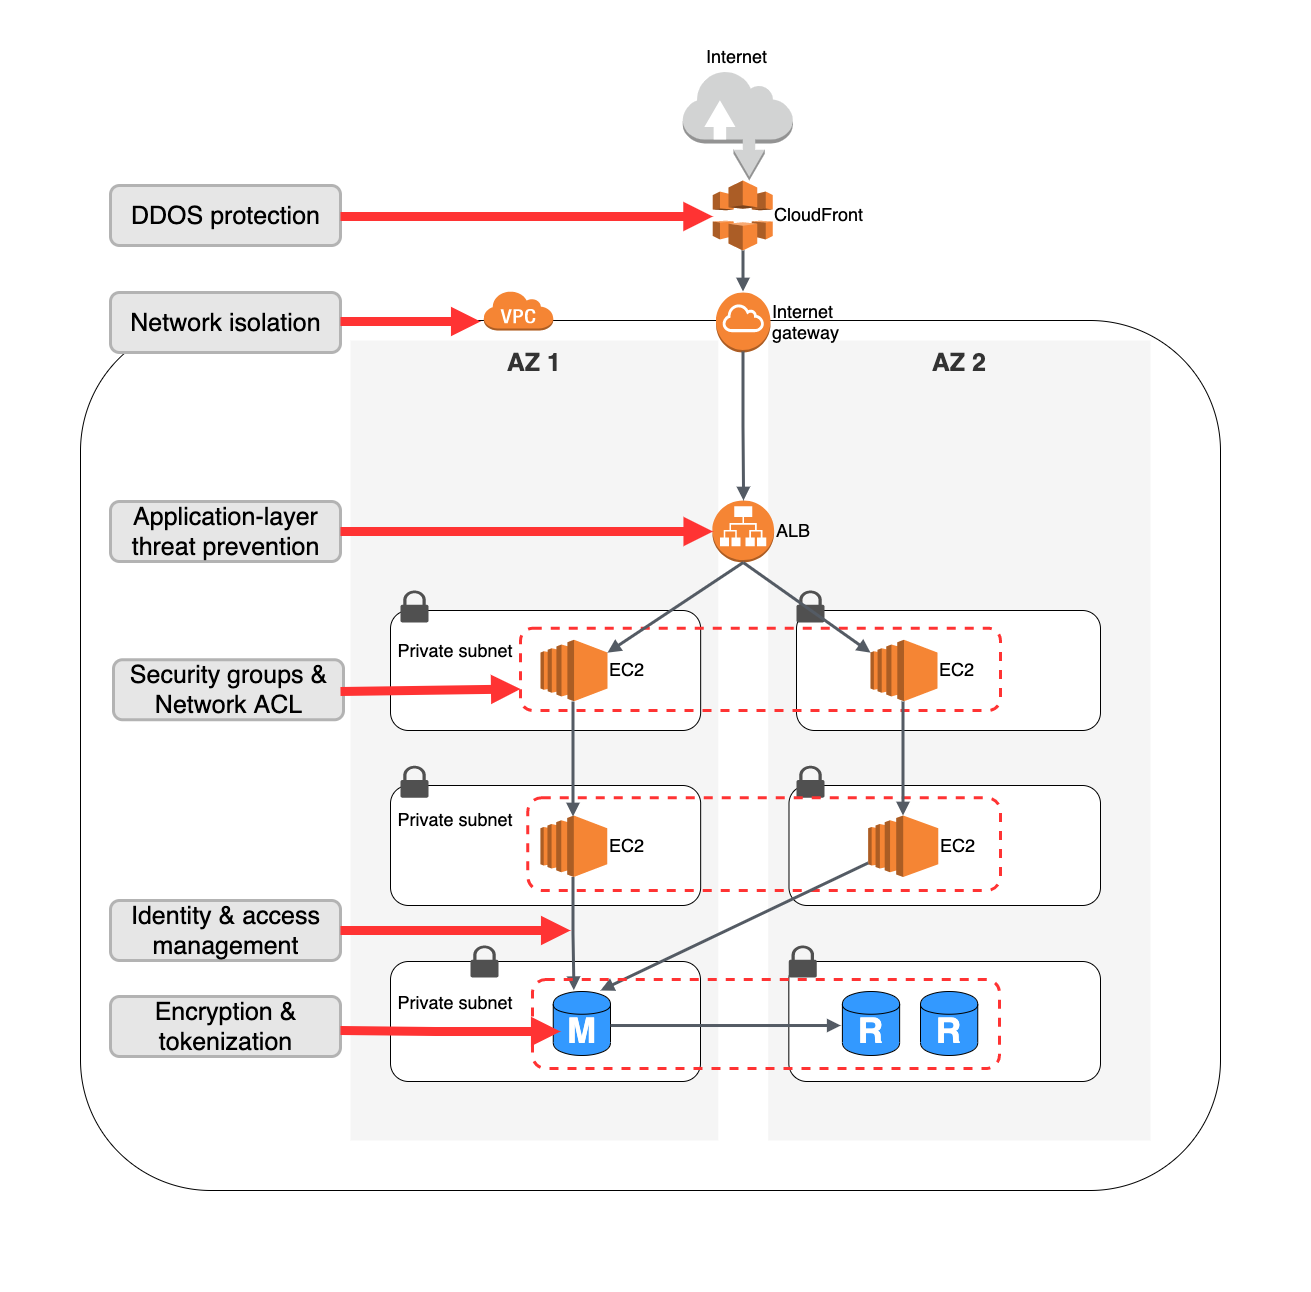
Apply “defense in depth” to your application infrastructure with a layered security architecture. The sequence in which you layer the controls together can depend on your use case. For example, you can apply IAM controls either at the database layer or at the start of user activity—or both. Figure 2 shows a conceptual view of layering controls to help secure access to your data. Figure 3 shows the implementation view for a web-facing application.

Defense in depth

Figure 2. Defense in depth

Defense in depth applied to a web application

Figure 3. Defense in depth applied to a web application

Detective controls

Detective controls allow you to get the information you need to respond to unexpected changes and incidents. Tools like Amazon GuardDuty and AWS Config can integrate with your security information and event monitoring (SIEM) system so you can respond to incidents using human and automated intervention.

Incident response

When security incidents are detected, timely and appropriate response is critical to minimize business impact. A robust incident response process is a combination of human intervention steps and automation. The AWS Security Hub Automated Response and Remediation solution provides an example of how you can build incident response automation.

Protect data with robust controls

Restrict access to your databases with private networking and strong identity and access control. Apply data encryption in transit (TLS) and at rest. A common mistake that organizations make is not enabling encryption at rest in databases at the time of initial deployment.

It is difficult to enable database encryption after the fact without time-consuming data migration. Therefore, enable database encryption from the start and minimize direct human access to data by applying principles of least privilege. This reduces the likelihood of accidental disclosure of information or misconfiguration of systems.

Ready to get started?

As a CTO, understanding the overall posture of your security processes against the foundational security controls is beneficial. Tracking key metrics on the effectiveness of the decision-making process, overall security objectives, and the improvement in posture over time should be regularly evaluated by the CTO and CISO organizations.

Embedding the principles of robust security processes and controls into the way your organization designs, develops, and operates workloads makes it easier to consistently make good decisions quickly.

To get started, look at workloads where engineering and security are already working together or bootstrap an initiative for this. Use the Well Architected Tool’s Security Pillar to create and communicate a set of objectives that demonstrate value.

Other blogs in this series

Looking for more architecture content? AWS Architecture Center provides reference architecture diagrams, vetted architecture solutions, Well-Architected best practices, patterns, icons, and more!

Serverless Scheduling with Amazon EventBridge, AWS Lambda, and Amazon DynamoDB

Post Syndicated from Peter Grman original https://aws.amazon.com/blogs/architecture/serverless-scheduling-with-amazon-eventbridge-aws-lambda-and-amazon-dynamodb/

Many applications perform scheduled tasks. For instance, you might want to automatically publish an article at a given time, change prices for offers which were defined weeks in advance, or notify customers 8 hours before a flight. These might be one-off tasks, or recurring ones.

On Unix-like operating systems, you might have opted for the cron utility. There are also similar alternatives for many web application frameworks, as well as advanced libraries, to schedule future one-off tasks. In a single server environment, this might seem like a simple solution. However, when you run dozens of instances of your application server, it gets harder to rely on those libraries to schedule tasks reliably at least once, without taking up too many resources. If you decide to build a serverless application, you need a new approach all together.

This post shows how you can build a scalable serverless job scheduler. You can use this method to scale to thousands, or even millions, of distributed jobs per minute. Because you are using serverless technologies, the underlying infrastructure is fully managed by AWS and you only pay for what you use. You can use this solution as an addition to your existing applications, regardless if they already use serverless technologies.

Similarly to a cron job running on a single instance, this solution uses an Amazon EventBridge rule, which starts new events periodically on a schedule. For recurring jobs, you would use this capability to start specific actions directly. This will work if you have only a few dozen periodic tasks, whose execution cycle can be defined as a cron expression. However, remember that there are limits to how many rules can be defined per event bus, and rules with a scheduled expression can only be defined on the default event bus. This post describes a method to multiplex a single Amazon EventBridge rule via an AWS Lambda function and Amazon DynamoDB, to scale beyond thousands of jobs. While this example focuses on one-off tasks, you can use the same approach for recurring jobs as well.

Overview of solution

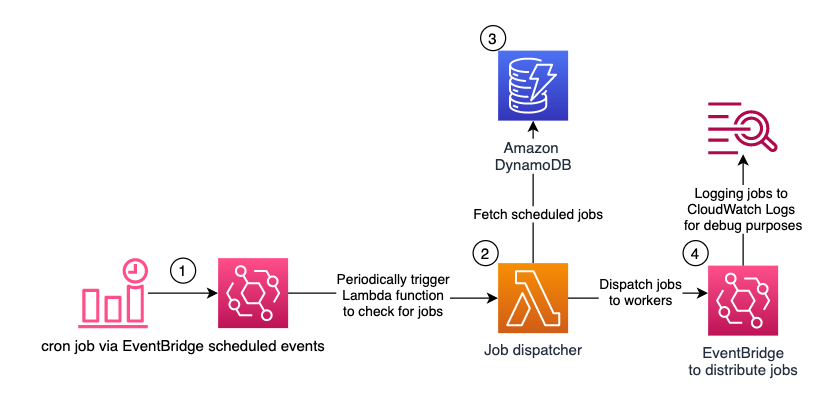
The following diagram shows the architecture of the serverless scheduling solution.

Figure 1 - Architecture diagram showing Serverless Scheduling with Amazon EventBridge, AWS Lambda, and Amazon DynamoDB

Figure 1 – Architecture diagram showing Serverless Scheduling with Amazon EventBridge, AWS Lambda, and Amazon DynamoDB

Amazon EventBridge with scheduled expressions periodically starts an AWS Lambda function. An Amazon DynamoDB table stores the future jobs. The Lambda function queries the table for due jobs and distributes them via Amazon EventBridge to the workers.

The following services are used:

Amazon EventBridge: to initiate the serverless scheduling solution. Amazon EventBridge is a serverless event bus that makes it easier to build event-driven applications at scale. It can also schedule events based on time intervals or cron expressions.

In this solution, you’ll use EventBridge for two things:

  1. to periodically start the AWS Lambda function, which checks for new jobs to be executed, and
  2. to distribute those jobs to the workers.

Here, you can control the granularity of your job executions. The fastest rate possible is once every minute. But if you don’t need a 1-minute precision, you can also opt for once every 5 minutes, or even once every hour. Remember that you cannot control at which second the event is started. It might be at the beginning of the minute, in the middle, or at the end.

AWS Lambda: to execute the scheduler logic. AWS Lambda is a serverless, event-driven compute service that lets you run code without provisioning or managing servers. The Lambda function queries the jobs from DynamoDB and distributes them via EventBridge. Based on your requirements, you can adjust this to use different mechanisms to notify the workers about the jobs, such as HTTP APIs, gRPC calls, or AWS services like Amazon Simple Notification Service (SNS) or Amazon Simple Queue Service (SQS).

Amazon DynamoDB: to store scheduled jobs. Amazon DynamoDB is a fully managed, serverless, key-value NoSQL database designed to run high-performance applications at any scale. Defining the right data model is important to be able to scale to thousands or even millions of scheduled and processed jobs per minute. The DynamoDB table in this solution has a partition key “pk” and a sort key “sk”. For the Lambda function, to be able to query all due jobs quickly and efficiently, jobs must be partitioned. For this, they are grouped together based on their scheduled times in intervals of 5 minutes. This value is the partition key “pk”. How to calculate this value is explained in detail, when you will test the solution.

The sort key “sk” contains the precise execution time concatenated with a unique identifier, such as a job ID, because the combination of “pk” and “sk” must be unique. To schedule a job in this example, you write it manually into the DynamoDB table. In your production code you can abstract the synchronous DynamoDB access, by implementing it in a shared library, or using Amazon API Gateway. You could also schedule jobs from a Lambda function reacting to events in your system.

Amazon EventBridge: to distribute the jobs. The Lambda function uses Amazon EventBridge as an example to distribute the jobs. The workers which should receive the jobs, must configure the corresponding rules upfront. For testing purposes, this solution comes with a rule which logs all events from the Lambda function into Amazon CloudWatch Logs.

Walkthrough

In this section, you will deploy the solution and test it.

Deploying the solution

To deploy it in your account:

1.  Select Launch Stack.

Launch Stack

2. Select the Region where you want to launch your serverless scheduler.

3. Define a name for your stack. Leave the parameters with the default values for now and select Next.

parameters table

4. At the bottom of the page, acknowledge the required Capabilities and select Create stack.

5.  Wait until the status of the stack is CREATE_COMPLETE, this can take a minute or two.

Testing the solution

In this section, you test the serverless scheduler. First, you’ll schedule a job for some time in the near future. Afterwards you will check that the job has been logged in CloudWatch Logs at the time, it was scheduled.

1. In the AWS Management Console, navigate to the DynamoDB service and select the Items sub-menu on the left side, between Tables and PartiQL editor.

2. Select the JobsTable which you created via the CloudFormation Stack; it should be empty for now:

Jobstable

3. Select Create item. Make sure you switch to the JSON editor at the top, and disable View DynamoDB JSON. Now copy this item into the editor:

{
  "pk": "j#2015-03-20T09:45",
  "sk": "2015-03-20T09:46:47.123Z#564ade05-efda-4a2e-a7db-933ad3c89a83",
  "detail": {
    "action": "send-reminder",
    "userId": "16f3a019-e3a5-47ed-8c46-f668347503d1",
    "taskId": "6d2f710d-99d8-49d8-9f52-92a56d0c6b81",
    "params": {
      "can_skip": false,
      "reminder_volume": 0.5
    }
  },
  "detail_type": "job-reminder"
}

Create table DynamoDB table

This is a sample job definition. You will need to adjust it, to be started a few minutes from now. For this you need to adjust the first 2 attributes, the partition key “pk” and the sort key “sk”. Start with “sk”, this is the UTC timestamp for the due date of the job in ISO 8601 format (YYYY-MM-DDTHH:MM:SS), followed by a separator (“#”) and a unique identifier, to make sure that multiple jobs can have the same due timestamp.

Afterwards adjust “pk”. The “pk” looks like the ISO 8601 timestamp in the “sk” reduced to date and time in hours and minutes. The minutes for the partition key must be an integer multiple of 5. This value represents the grouping of the jobs, so they can be queried quickly and efficiently by the Lambda function. For instance, for me 2021-11-26T13:31:55.000Z is in the future and the corresponding partition would be 2021-11-26T13:30.

Note: your local time zone might not be UTC. You can get the current UTC time on timeanddate.com.

You can find in the following table for every “sk” minute the corresponding “pk” minute:

SK and PK table

The corresponding python code would be:

f'{(sk_minutes – sk_minutes % 5):02d}'

Create table DynamoDB table

4. Now that you defined your event in the near future, you can optionally adjust the content of the “detail” and “detail_type” attributes. These are forwarded to EventBridge as “detail” and “detail-type” and should be used by your workers to understand which task they are supposed to perform. You can find more details on EventBridge event structure in our documentation. After you configured the job correctly, select Create item.

5. It is time to navigate to CloudWatch Log groups and wait for the item to be due and to show up in the debug logs.

CloudWatch log groups

For now, the log streams should be empty:

Log streams sceenshot

After the item was due, you should see a new log stream with the item “detail” and “detail_type” attributes logged.

If you don’t see a new log stream with the item, check back in your DynamoDB table, if the “sk” is in the UTC time zone and the minutes of the “pk” are a multiple of 5. You can consult the table at the end of step 3, to check for the correct “pk” minutes based on your “sk” minutes.

Log events screenshot

You might notice that the timestamp of the message is within a minute after the job was scheduled. In my example, I scheduled the job for 2021-11-26T13:31:55.000Z and it was put into EventBridge at 2021-11-26T13:32:33Z. The delay comes from the Lambda function only starting once per minute. As I mentioned in the beginning, the function also isn’t started at second 00 but at a random second within that minute.

Exploring the Lambda function

Now, let’s have a look at the core logic. For this, navigate to AWS Lambda in the AWS Management console and open the SchedulerFunction.

AWS Lambda screenshot

In the function configuration, you can see that it is triggered by EventBridge via a scheduled expression at the rate, which was defined in the CloudFormation Stack.

Function Configuration in Cloudformation Stack

When you open the Code tab, you can see that it is less than 100 lines of python code. The main part is the lambda_handler function:

def lambda_handler(event, context):
    event_time_in_utc = event['time']
    previous_partition, current_partition = get_partitions(event_time_in_utc)

    previous_jobs = query_jobs(previous_partition, event_time_in_utc)
    current_jobs = query_jobs(current_partition, event_time_in_utc)
    all_jobs = previous_jobs + current_jobs

    print('dispatching {} jobs'.format(len(all_jobs)))

    put_all_jobs_into_event_bridge(all_jobs)
    delete_all_jobs(all_jobs)

    print('dispatched and deleted {} jobs'.format(len(all_jobs)))

The function starts by calculating the current and previous partitions. This is done to ensure that no jobs stay unprocessed in the old partition, when a new one starts. Afterwards, jobs from these partitions are queried up to the current time, so no future jobs will be fetched from the current partition. Lastly, all jobs are put into EventBridge and deleted from the table.

Instead of pushing the jobs into EventBridge, they could be started via HTTP(S), gRPC, or pushed into other AWS services, like Amazon Simple Notification Service (SNS) or Amazon Simple Queue Service (SQS). Also remember that the communication with other AWS services is synchronous and does not use batching options when putting jobs into EventBridge or deleting them from the DynamoDB table. This is to keep the function simpler and easier to understand. When you plan to distribute thousands of jobs per minute, you’d want to adjust this, to improve the throughput of the Lambda function.

Cleaning up

To avoid incurring future charges, delete the CloudFormation Stack and all resources you created.

Conclusion

In this post, you learned how to build a serverless scheduling solution. Using only serverless technologies which scale automatically, don’t require maintenance, and offer a pay as you go pricing model, this scheduler solution can be implemented for use cases with varying throughput requirements for their scheduled jobs. These could range from publishing articles at a scheduled time to notifying hundreds of passengers per minute about their upcoming flight.

You can adjust the Lambda function to distribute the jobs with a technology more fitting to your application, as well as to handle recurring tasks. The grouping interval of 5 minutes for the partition key, can be also adjusted based on your throughput requirements. It’s important to note that for this solution to work, the interval by which the jobs are grouped must be longer than the rate at which the Lambda function is started.

Give it a try and let us know your thoughts in the comments!

Unify log aggregation and analytics across compute platforms

Post Syndicated from Hari Ohm Prasath original https://aws.amazon.com/blogs/big-data/unify-log-aggregation-and-analytics-across-compute-platforms/

Our customers want to make sure their users have the best experience running their application on AWS. To make this happen, you need to monitor and fix software problems as quickly as possible. Doing this gets challenging with the growing volume of data needing to be quickly detected, analyzed, and stored. In this post, we walk you through an automated process to aggregate and monitor logging-application data in near-real time, so you can remediate application issues faster.

This post shows how to unify and centralize logs across different computing platforms. With this solution, you can unify logs from Amazon Elastic Compute Cloud (Amazon EC2), Amazon Elastic Container Service (Amazon ECS), Amazon Elastic Kubernetes Service (Amazon EKS), Amazon Kinesis Data Firehose, and AWS Lambda using agents, log routers, and extensions. We use Amazon OpenSearch Service (successor to Amazon Elasticsearch Service) with OpenSearch Dashboards to visualize and analyze the logs, collected across different computing platforms to get application insights. You can deploy the solution using the AWS Cloud Development Kit (AWS CDK) scripts provided as part of the solution.

Customer benefits

A unified aggregated log system provides the following benefits:

  • A single point of access to all the logs across different computing platforms
  • Help defining and standardizing the transformations of logs before they get delivered to downstream systems like Amazon Simple Storage Service (Amazon S3), Amazon OpenSearch Service, Amazon Redshift, and other services
  • The ability to use Amazon OpenSearch Service to quickly index, and OpenSearch Dashboards to search and visualize logs from its routers, applications, and other devices

Solution overview

In this post, we use the following services to demonstrate log aggregation across different compute platforms:

  • Amazon EC2 – A web service that provides secure, resizable compute capacity in the cloud. It’s designed to make web-scale cloud computing easier for developers.
  • Amazon ECS – A web service that makes it easy to run, scale, and manage Docker containers on AWS, designed to make the Docker experience easier for developers.
  • Amazon EKS – A web service that makes it easy to run, scale, and manage Docker containers on AWS.
  • Kinesis Data Firehose – A fully managed service that makes it easy to stream data to Amazon S3, Amazon Redshift, or Amazon OpenSearch Service.
  • Lambda – A compute service that lets you run code without provisioning or managing servers. It’s designed to make web-scale cloud computing easier for developers.
  • Amazon OpenSearch Service – A fully managed service that makes it easy for you to perform interactive log analytics, real-time application monitoring, website search, and more.

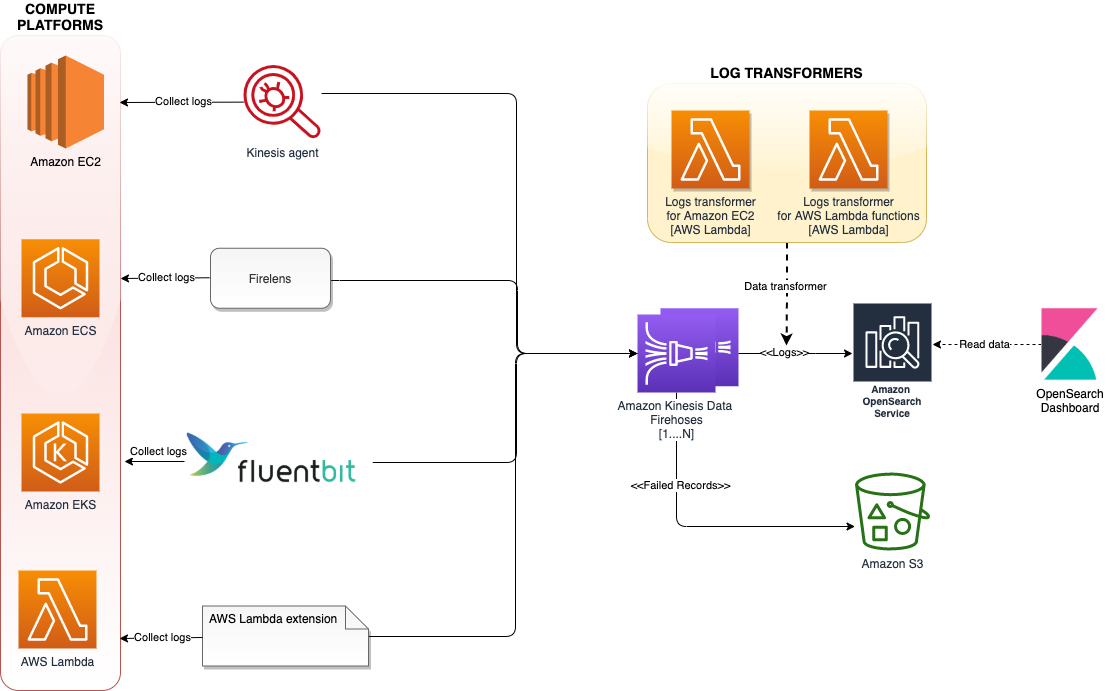
The following diagram shows the architecture of our solution.

The architecture uses various log aggregation tools such as log agents, log routers, and Lambda extensions to collect logs from multiple compute platforms and deliver them to Kinesis Data Firehose. Kinesis Data Firehose streams the logs to Amazon OpenSearch Service. Log records that fail to get persisted in Amazon OpenSearch service will get written to AWS S3. To scale this architecture, each of these compute platforms streams the logs to a different Firehose delivery stream, added as a separate index, and rotated every 24 hours.

The following sections demonstrate how the solution is implemented on each of these computing platforms.

Amazon EC2

The Kinesis agent collects and streams logs from the applications running on EC2 instances to Kinesis Data Firehose. The agent is a standalone Java software application that offers an easy way to collect and send data to Kinesis Data Firehose. The agent continuously monitors files and sends logs to the Firehose delivery stream.

BDB-1742-Ec2

The AWS CDK script provided as part of this solution deploys a simple PHP application that generates logs under the /etc/httpd/logs directory on the EC2 instance. The Kinesis agent is configured via /etc/aws-kinesis/agent.json to collect data from access_logs and error_logs, and stream them periodically to Kinesis Data Firehose (ec2-logs-delivery-stream).

Because Amazon OpenSearch Service expects data in JSON format, you can add a call to a Lambda function to transform the log data to JSON format within Kinesis Data Firehose before streaming to Amazon OpenSearch Service. The following is a sample input for the data transformer:

46.99.153.40 - - [29/Jul/2021:15:32:33 +0000] "GET / HTTP/1.1" 200 173 "-" "Mozilla/5.0 (Windows NT 6.1; WOW64) AppleWebKit/537.36 (KHTML, like Gecko) Chrome/51.0.2704.103 Safari/537.36"

The following is our output:

{
    "logs" : "46.99.153.40 - - [29/Jul/2021:15:32:33 +0000] \"GET / HTTP/1.1\" 200 173 \"-\" \"Mozilla/5.0 (Windows NT 6.1; WOW64) AppleWebKit/537.36 (KHTML, like Gecko) Chrome/51.0.2704.103 Safari/537.36\"",
}

We can enhance the Lambda function to extract the timestamp, HTTP, and browser information from the log data, and store them as separate attributes in the JSON document.

Amazon ECS

In the case of Amazon ECS, we use FireLens to send logs directly to Kinesis Data Firehose. FireLens is a container log router for Amazon ECS and AWS Fargate that gives you the extensibility to use the breadth of services at AWS or partner solutions for log analytics and storage.

BDB-1742-ECS

The architecture hosts FireLens as a sidecar, which collects logs from the main container running an httpd application and sends them to Kinesis Data Firehose and streams to Amazon OpenSearch Service. The AWS CDK script provided as part of this solution deploys a httpd container hosted behind an Application Load Balancer. The httpd logs are pushed to Kinesis Data Firehose (ecs-logs-delivery-stream) through the FireLens log router.

Amazon EKS

With the recent announcement of Fluent Bit support for Amazon EKS, you no longer need to run a sidecar to route container logs from Amazon EKS pods running on Fargate. With the new built-in logging support, you can select a destination of your choice to send the records to. Amazon EKS on Fargate uses a version of Fluent Bit for AWS, an upstream conformant distribution of Fluent Bit managed by AWS.

BDB-1742-EKS

The AWS CDK script provided as part of this solution deploys an NGINX container hosted behind an internal Application Load Balancer. The NGINX container logs are pushed to Kinesis Data Firehose (eks-logs-delivery-stream) through the Fluent Bit plugin.

Lambda

For Lambda functions, you can send logs directly to Kinesis Data Firehose using the Lambda extension. You can deny the records being written to Amazon CloudWatch.

BDB-1742-Lambda

After deployment, the workflow is as follows:

  1. On startup, the extension subscribes to receive logs for the platform and function events. A local HTTP server is started inside the external extension, which receives the logs.
  2. The extension buffers the log events in a synchronized queue and writes them to Kinesis Data Firehose via PUT records.
  3. The logs are sent to downstream systems.
  4. The logs are sent to Amazon OpenSearch Service.

The Firehose delivery stream name gets specified as an environment variable (AWS_KINESIS_STREAM_NAME).

For this solution, because we’re only focusing on collecting the run logs of the Lambda function, the data transformer of the Kinesis Data Firehose delivery stream filters out the records of type function ("type":"function") before sending it to Amazon OpenSearch Service.

The following is a sample input for the data transformer:

[
   {
      "time":"2021-07-29T19:54:08.949Z",
      "type":"platform.start",
      "record":{
         "requestId":"024ae572-72c7-44e0-90f5-3f002a1df3f2",
         "version":"$LATEST"
      }
   },
   {
      "time":"2021-07-29T19:54:09.094Z",
      "type":"platform.logsSubscription",
      "record":{
         "name":"kinesisfirehose-logs-extension-demo",
         "state":"Subscribed",
         "types":[
            "platform",
            "function"
         ]
      }
   },
   {
      "time":"2021-07-29T19:54:09.096Z",
      "type":"function",
      "record":"2021-07-29T19:54:09.094Z\tundefined\tINFO\tLoading function\n"
   },
   {
      "time":"2021-07-29T19:54:09.096Z",
      "type":"platform.extension",
      "record":{
         "name":"kinesisfirehose-logs-extension-demo",
         "state":"Ready",
         "events":[
            "INVOKE",
            "SHUTDOWN"
         ]
      }
   },
   {
      "time":"2021-07-29T19:54:09.097Z",
      "type":"function",
      "record":"2021-07-29T19:54:09.097Z\t024ae572-72c7-44e0-90f5-3f002a1df3f2\tINFO\tvalue1 = value1\n"
   },   
   {
      "time":"2021-07-29T19:54:09.098Z",
      "type":"platform.runtimeDone",
      "record":{
         "requestId":"024ae572-72c7-44e0-90f5-3f002a1df3f2",
         "status":"success"
      }
   }
]

Prerequisites

To implement this solution, you need the following prerequisites:

Build the code

Check out the AWS CDK code by running the following command:

mkdir unified-logs && cd unified-logs
git clone https://github.com/aws-samples/unified-log-aggregation-and-analytics .

Build the lambda extension by running the following command:

cd lib/computes/lambda/extensions
chmod +x extension.sh
./extension.sh
cd ../../../../

Make sure to replace default AWS region specified under the value of firehose.endpoint attribute inside lib/computes/ec2/ec2-startup.sh.

Build the code by running the following command:

yarn install && npm run build

Deploy the code

If you’re running AWS CDK for the first time, run the following command to bootstrap the AWS CDK environment (provide your AWS account ID and AWS Region):

cdk bootstrap \
    --cloudformation-execution-policies arn:aws:iam::aws:policy/AdministratorAccess \
    aws://<AWS Account Id>/<AWS_REGION>

You only need to bootstrap the AWS CDK one time (skip this step if you have already done this).

Run the following command to deploy the code:

cdk deploy --requires-approval

You get the following output:

 ✅  CdkUnifiedLogStack

Outputs:
CdkUnifiedLogStack.ec2ipaddress = xx.xx.xx.xx
CdkUnifiedLogStack.ecsloadbalancerurl = CdkUn-ecsse-PY4D8DVQLK5H-xxxxx.us-east-1.elb.amazonaws.com
CdkUnifiedLogStack.ecsserviceLoadBalancerDNS570CB744 = CdkUn-ecsse-PY4D8DVQLK5H-xxxx.us-east-1.elb.amazonaws.com
CdkUnifiedLogStack.ecsserviceServiceURL88A7B1EE = http://CdkUn-ecsse-PY4D8DVQLK5H-xxxx.us-east-1.elb.amazonaws.com
CdkUnifiedLogStack.eksclusterClusterNameCE21A0DB = ekscluster92983EFB-d29892f99efc4419bc08534a3d253160
CdkUnifiedLogStack.eksclusterConfigCommand515C0544 = aws eks update-kubeconfig --name ekscluster92983EFB-d29892f99efc4419bc08534a3d253160 --region us-east-1 --role-arn arn:aws:iam::xxx:role/CdkUnifiedLogStack-clustermasterroleCD184EDB-12U2TZHS28DW4
CdkUnifiedLogStack.eksclusterGetTokenCommand3C33A2A5 = aws eks get-token --cluster-name ekscluster92983EFB-d29892f99efc4419bc08534a3d253160 --region us-east-1 --role-arn arn:aws:iam::xxx:role/CdkUnifiedLogStack-clustermasterroleCD184EDB-12U2TZHS28DW4
CdkUnifiedLogStack.elasticdomainarn = arn:aws:es:us-east-1:xxx:domain/cdkunif-elasti-rkiuv6bc52rp
CdkUnifiedLogStack.s3bucketname = cdkunifiedlogstack-logsfailederrcapturebucket0bcc-xxxxx
CdkUnifiedLogStack.samplelambdafunction = CdkUnifiedLogStack-LambdatransformerfunctionFA3659-c8u392491FrW

Stack ARN:
arn:aws:cloudformation:us-east-1:xxxx:stack/CdkUnifiedLogStack/6d53ef40-efd2-11eb-9a9d-1230a5204572

AWS CDK takes care of building the required infrastructure, deploying the sample application, and collecting logs from different sources to Amazon OpenSearch Service.

The following is some of the key information about the stack:

  • ec2ipaddress – The public IP address of the EC2 instance, deployed with the sample PHP application
  • ecsloadbalancerurl – The URL of the Amazon ECS Load Balancer, deployed with the httpd application
  • eksclusterClusterNameCE21A0DB – The Amazon EKS cluster name, deployed with the NGINX application
  • samplelambdafunction – The sample Lambda function using the Lambda extension to send logs to Kinesis Data Firehose
  • opensearch-domain-arn – The ARN of the Amazon OpenSearch Service domain

Generate logs

To visualize the logs, you first need to generate some sample logs.

  1. To generate Lambda logs, invoke the function using the following AWS CLI command (run it a few times):
aws lambda invoke \
--function-name "<<samplelambdafunction>>" \
--payload '{"payload": "hello"}' /tmp/invoke-result \
--cli-binary-format raw-in-base64-out \
--log-type Tail

Make sure to replace samplelambdafunction with the actual Lambda function name. The file path needs to be updated based on the underlying operating system.

The function should return "StatusCode": 200, with the following output:

{
    "StatusCode": 200,
    "LogResult": "<<Encoded>>",
    "ExecutedVersion": "$LATEST"
}
  1. Run the following command a couple of times to generate Amazon EC2 logs:
curl http://ec2ipaddress:80

Make sure to replace ec2ipaddress with the public IP address of the EC2 instance.

  1. Run the following command a couple of times to generate Amazon ECS logs:
curl http://ecsloadbalancerurl:80

Make sure to replace ecsloadbalancerurl with the public ARN of the AWS Application Load Balancer.

We deployed the NGINX application with an internal load balancer, so the load balancer hits the health checkpoint of the application, which is sufficient to generate the Amazon EKS access logs.

Visualize the logs

To visualize the logs, complete the following steps:

  1. On the Amazon OpenSearch Service console, choose the hyperlink provided for the OpenSearch Dashboard 7URL.
  2. Configure access to the OpenSearch Dashboard.
  3. Under OpenSearch Dashboard, on the Discover menu, start creating a new index pattern for each compute log.

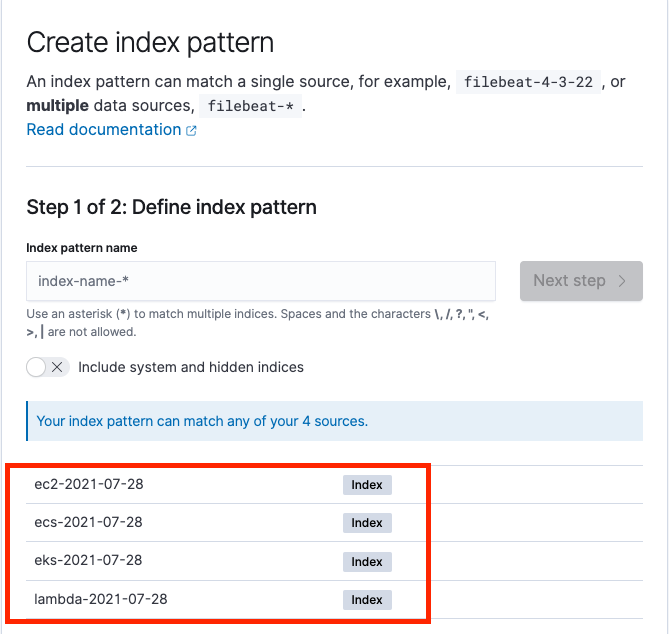
We can see separate indexes for each compute log partitioned by date, as in the following screenshot.

BDB-1742-create-index

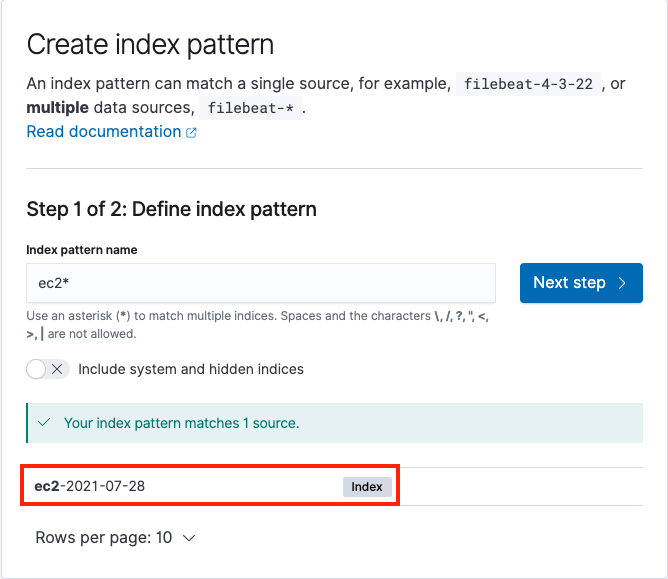
The following screenshot shows the process to create index patterns for Amazon EC2 logs.

BDB-1742-ec2

After you create the index pattern, we can start analyzing the logs using the Discover menu under OpenSearch Dashboard in the navigation pane. This tool provides a single searchable and unified interface for all the records with various compute platforms. We can switch between different logs using the Change index pattern submenu.

BDB-1742-unified

Clean up

Run the following command from the root directory to delete the stack:

cdk destroy

Conclusion

In this post, we showed how to unify and centralize logs across different compute platforms using Kinesis Data Firehose and Amazon OpenSearch Service. This approach allows you to analyze logs quickly and the root cause of failures, using a single platform rather than different platforms for different services.

If you have feedback about this post, submit your comments in the comments section.

Resources

For more information, see the following resources:


About the author

HariHari Ohm Prasath is a Senior Modernization Architect at AWS, helping customers with their modernization journey to become cloud native. Hari loves to code and actively contributes to the open source initiatives. You can find him in Medium, Github & Twitter @hariohmprasath.

balluBallu Singh is a Principal Solutions Architect at AWS. He lives in the San Francisco Bay area and helps customers architect and optimize applications on AWS. In his spare time, he enjoys reading and spending time with his family.

Modernize your Penetration Testing Architecture on AWS Fargate

Post Syndicated from Conor Walsh original https://aws.amazon.com/blogs/architecture/modernize-your-penetration-testing-architecture-on-aws-fargate/

Organizations in all industries are innovating their application stack through modernization. Developers have found that modular architecture patterns, serverless operational models, and agile development processes provide great benefits. They offer faster innovation, reduced risk, and reduction in total cost of ownership.

Security organizations must evolve and innovate as well. But security practitioners often find themselves stuck between using powerful yet inflexible open-source tools with little support, and monolithic software with expensive and restrictive licenses.

This post describes how you can use modern cloud technologies to build a scalable penetration testing platform, with no infrastructure to manage.

The penetration testing monolith

AWS operates under the shared responsibility model, where AWS is responsible for the security of the cloud, and the customer is responsible for securing workloads in the cloud. This includes validating the security of your internal and external attack surface. Following the AWS penetration testing policy, customers can run tests against their AWS accounts, except for denial of service (DoS).

A legacy model commonly involves a central server for running a scanning application among the team. The server must be powerful enough for peak load and likely runs 24/7. Common licensing for scanner software is capped on the number of targets you can scan. This model does not scale, and incurs cost when no assessments are being performed.

Penetration testers must constantly reinvent their toolkit. Many one-off tools or scripts are built during engagements when encountering a unique problem. These tools and their environments are often customized, making standardization between machines and software difficult. Building, maintaining, and testing UI/UX and platform compatibility can be expensive and difficult to scale. This often leads to these tools being discarded and the value lost when the analyst moves on to the next engagement. Later, other analysts may run into the same scenario and need to rebuild the tool all over again, resulting in duplicated effort.

Network security scanning using modern cloud infrastructure

By using modern cloud container technologies, we can redesign this monolithic architecture to one that scales to meet increased demand, yet incurs no cost when idle. Containerization provides flexibility and secure isolation.

Figure 1. Overview of the serverless security scanning architecture

Figure 1. Overview of the serverless security scanning architecture

Scanning task flow

This workflow is based on the architecture shown in Figure 1:

  1. User authenticates to Amazon Cognito with their organization’s SSO.
  2. User makes authorized request to Amazon API Gateway.
  3. Request is forwarded to an AWS Lambda function that pulls configuration from Amazon Simple Storage Service (S3).
  4. Lambda function validates parameters, incorporates them into the task definition, and calls Amazon Elastic Container Service (ECS).
  5. ECS orchestrates worker nodes using AWS Fargate compute engine and initiates task.
  6. ECS asynchronously returns the task configuration to Lambda, which sanitizes sensitive data and sends response through API Gateway.
  7. The ECS task launches one or more containers, which run the tool.
  8. Scan results are stored in the ephemeral storage provided by Fargate.
  9. Final container in the ECS task copies the scan report to S3.

Now we’ll describe the different components of the architecture shown in Figure 1. Start by packaging one’s favorite tool into a container, and publish it to Amazon Elastic Container Registry (ECR). ECR provides your containers additional layers of security assurance with built-in dependency vulnerability scans.

AWS Fargate is a serverless compute engine powering Amazon ECS to orchestrate container tasks. Fargate scales up capacity to support the current load, and scales down once complete to reduce cost. By default, Fargate offers 20 GB of ephemeral storage to each ECS task for shared storage between containers as volume mounts.

Task input and output can be processed with custom code running on the serverless computing service AWS Lambda. For multi-stage Lambda functionality, you can use AWS Step Functions.

Amazon API Gateway can forward incoming requests to these Lambda functions. API Gateway provides serverless REST endpoints to handle requests processed by Lambda functions. Amazon Cognito authorizes users through API Gateway or your organization’s single-sign on (SSO) provider.

The final step of the ECS task can upload any resulting files to an Amazon S3 bucket. Amazon S3 offers industry-leading scalability, data availability, security, and performance with integration into other AWS services. This means that the results of your data can be consumed by other AWS services for processing, analytics, machine learning, and security controls.

Amazon CloudWatch Events are used to build an event-based workflow. The S3 upload initiates a CloudWatch Event, which can then invoke a Lambda function to process the file, or launch another ECS task.

This solution is completely serverless. It will scale on demand, yet cost nothing when not in use. This architecture can support anything that can be run in a container, regardless of tool function.

Network Mapper workflow

Figure 2. Network Mapper scanner task workflow

Figure 2. Network Mapper scanner task workflow

The example in Figure 2 was based on using a tool called Network Mapper, or Nmap. However, a variety of tools can be used, including nslookup/dig, Selenium, Nikto, recon-ng, SpiderFoot, Greenbone Vulnerability Manager (GVM), or OWASP ZAP. You can use anything that runs in a container! With some additional work, findings could be fed into AWS security services like AWS Security Hub, or Amazon GuardDuty. You can also use AWS Partner Network services like Splunk and Datadog, or open source frameworks like Metasploit and DefectDojo. The flexibility to add additional applications that integrate with AWS services means that this architecture can be easily deployed into a variety of AWS environments.

Remember, installation and use of software not included in an AWS-supported Amazon Machine Image (AMI) or container, falls into the customer side of the shared responsibility model. Make sure to do your due diligence in securing any software you decide to use in this or any workload. To reduce blast radius, run this in an isolated account and only provide least privilege access to targets.

Conclusion

In this blog post, we showed how to run a penetration testing workload on a modern platform, powered with serverless, and container-based services. Amazon API Gateway is the entry point for your architecture, which calls on AWS Lambda. Lambda builds a task definition to launch a fully orchestrated, on-demand container workload using AWS Fargate and Amazon ECS. The final stage of the ECS task copies the results of the scan to Amazon S3. This can be accessed by security analysts or other downstream containers, tools, or services.

We encourage you to go build this architecture in your own environment, and begin conducting your own tests! Construct your Nmap container and store it in Amazon ECR or use securecodebox/nmap, a Docker container built for the Open Web Application Security Project® (OWASP) SecureCodeBox project. Make sure to spend time securing this workload, especially when using open-source software you’re not familiar with. Now go get scanning!

Architecture Monthly Magazine: Agriculture

Post Syndicated from Bonnie McClure original https://aws.amazon.com/blogs/architecture/architecture-monthly-magazine-agriculture/

Amazon Web Services (AWS) helps agriculture customers forecast supply and demand and create and maintain responsive, resilient food systems. This edition of Architecture Monthly focuses on the agriculture industry and their role in providing products to the world that are nutritious, healthy, accessible, affordable, and sustainable.

We’d like to thank our expert, Karen Hildebrand, Worldwide Tech Lead for Agriculture at AWS, for her contributions to the Ask an Expert column.

Please give us your feedback! Include your comments on the Amazon Kindle page. You can view past issues and reach out to [email protected] any time with your questions and comments.

In this month’s issue:

  • Ask an Expert: Karen Hildebrand, PhD, Worldwide Tech Lead for Agriculture at AWS
  • Case Study: AGCO Lowers Costs, Boosts Speed, and Increases Retention Using Amazon Kinesis Services
  • Quick Start: Machine to Cloud Connectivity Framework
  • Blog: Building a Controlled Environment Agriculture Platform
  • Case Study: ProRefrigeration Extends Their AWS IoT Capabilities to the Edge with CEI America
  • Quick Start: Genomics Tertiary Analysis and Machine Learning Using Amazon SageMaker
  • Solution: Improving Forecast Accuracy with Machine Learning
  • Blog: Building Machine Learning at the Edge Applications using Amazon SageMaker Edge Manager and IoT Greengrass v2
  • Blog: Processing satellite imagery with serverless architecture
  • Videos:
    • The Future of Fresh Fruit Harvest: A Talk with FFRobotics
    • Seeing is Believing – the Rise of Data & Analytics in Agriculture
    • The Season for Vintner Innovation: Viticulture & More with E.J. Gallo Winery
    • Farming Innovation in Ireland: A Talk with Herdwatch
    • Voice Activated Agriculture
    • Amazon Prime – Clarkson’s Farm Season 1

How to access the magazine

We hope you’re enjoying Architecture Monthly, and we’d like to hear from you—leave us a star rating and comment on the Kindle Newsstand page or contact us anytime at [email protected].

This month, we’re also asking you to take a 10-question survey about your experiences with this magazine. Please take a few moments to give us your opinions.

Use Amazon EKS and Argo Rollouts for Progressive Delivery

Post Syndicated from Srinivasa Shaik original https://aws.amazon.com/blogs/architecture/use-amazon-eks-and-argo-rollouts-for-progressive-delivery/

A common hurdle to DevOps strategies is the manual testing, sign-off, and deployment steps required to deliver new or enhanced feature sets. If an application is updated frequently, these actions can be time-consuming and error prone. You can address these challenges by incorporating progressive delivery concepts along with the Amazon Elastic Kubernetes Service (Amazon EKS) container platform and Argo Rollouts.

Progressive delivery deployments

Progressive delivery is a deployment paradigm in which new features are gradually rolled out to an expanding set of users. Real-time measurements of key performance indicators (KPIs) enable deployment teams to measure customer experience. These measurements can detect any negative impact during deployment and perform an automated rollback before it impacts a larger group of users. Since predefined KPIs are being measured, the rollout can continue autonomously and alleviate the bottleneck of manual approval or rollbacks.

These progressive delivery concepts can be applied to common deployment strategies such as blue/green and canary deployments. A blue/green deployment is a strategy where separate environments are created that are identical to one another. One environment (blue) runs the current application version, while the other environment (green) runs the new version. This enables teams to test on the new environment and move application traffic to the green environment when validated. Canary deployments slowly release your new application to the production environment so that you can build confidence while it is being deployed. Gradually, the new version will replace the current version in its entirety.

Using Kubernetes, you already can perform a rolling update, which can incrementally replace your resource’s Pods with new ones. However, you have limited control of the speed of the rollout, and can’t automatically revert a deployment. KPIs are also difficult to measure in this scenario, resulting in more manual work validating the integrity of the deployment.

To exert more granular control over the deployments, a progressive delivery controller such as Argo Rollouts can be implemented. By using a progressive delivery controller in conjunction with AWS services, you can tune the speed of your deployments and measure your success with KPIs. During the deployment, Argo Rollouts will query metric providers such as Prometheus to perform analysis. (You can find the complete list of the supported metric providers at Argo Rollouts.) If there is an issue with the deployment, automatic rollback actions can be taken to minimize any type of disruption.

Using blue/green deployments for progressive delivery

Blue/green deployments provide zero downtime during deployments and an ability to test your application in production without impacting the stable version. In a typical blue/green deployment on EKS using Kubernetes native resources, a new deployment will be spun up. This includes the new feature version in parallel with the stable deployment (see Figure 1). The new deployment will be tested by a QA team.

Figure 1. Blue/green deployment in progress

Figure 1. Blue/green deployment in progress

Once all the tests have been successfully conducted, the traffic must be directed from the live version to the new version (Figure 2). At this point, all live traffic is funneled to the new version. If there are any issues, a rollback can be conducted by swapping the pointer back to the previous stable version.

Figure 2. Blue/green deployment post-promotion

Figure 2. Blue/green deployment post-promotion

Keeping this process in mind, there are several manual interactions and decisions involved during a blue/green deployment. Using Argo Rollouts you can replace these manual steps with automation. It automatically creates a preview service for testing out a green service. With Argo Rollouts, test metrics can be captured by using a monitoring service, such as Amazon Managed Service for Prometheus (Figure 3).

Prometheus is a monitoring software that can be used to collect metrics from your application. With PromQL (Prometheus Query Language), you can write queries to obtain KPIs. These KPIs can then be used to define the success or failure of the deployment. Argo Rollout deployment includes stages to analyze the KPIs before and after promoting the new version. During the prePromotionAnalysis stage, you can validate the new version using preview endpoint. This stage can verify smoke tests or integration tests. Upon meeting the desired success (KPIs), the live traffic will be routed to the new version. In the postPromotionAnalysis stage, you can verify KPIs from the production environment. After promoting the new version, failure of the KPIs during any analysis stage will automatically shut down the deployment and revert to the previous stable version.

Figure 3. Blue/green deployment using KPIs

Figure 3. Blue/green deployment using KPIs

Using canary deployment for progressive delivery

Unlike in a blue/green deployment strategy, in a canary deployment a subset of the traffic is gradually shifted to the new version in your production environment. Since the new version is being deployed in a live environment, feedback can be obtained in real-time, and adjustments can be made accordingly (Figure 4).

Figure 4. An example of a canary deployment

Figure 4. An example of a canary deployment

Argo Rollouts supports integration with an Application Load Balancer to manipulate the flow of traffic to different versions of an application. Argo Rollouts can gradually and automatically increase the amount of traffic to the canary service at specific intervals. You can also fully automate the promotion process by using KPIs and metrics from Prometheus as discussed in the blue/green strategy. The analysis will run while the canary deployment is progressing. The success of the KPIs will gradually increase the traffic on the canary service. Any failure will stop the deployment and stop routing live traffic.

Conclusion

Implementing progressive delivery in your application can help you deploy new versions of applications with confidence. This approach mitigates the risk of rolling out new application versions by providing visibility into live error rate and performance. You can measure KPIs and automate rollout and rollback procedures. By leveraging Argo Rollouts, you can have more granular control over how your application is deployed in an EKS cluster.

For additional information on progressive delivery or Argo Rollouts:

Migrating a Database Workflow to Modernized AWS Workflow Services

Post Syndicated from Scott Wainner original https://aws.amazon.com/blogs/architecture/migrating-a-database-workflow-to-modernized-aws-workflow-services/

The relational database is a critical resource in application architecture. Enterprise organizations often use relational database management systems (RDBMS) to provide embedded workflow state management. But this can present problems, such as inefficient use of data storage and compute resources, performance issues, and decreased agility. Add to this the responsibility of managing workflow states through custom triggers and job-based algorithms, which further exacerbate the performance constraints of the database. The complexity of modern workflows, frequency of runtime, and external dependencies encourages us to seek alternatives to using these database mechanisms.

This blog describes how to use modernized workflow methods that will mitigate database scalability constraints. We’ll show how transitioning your workflow state management from a legacy database workflow to AWS services enables new capabilities with scale.

A workflow system is composed of an ordered set of tasks. Jobs are submitted to the workflow where tasks are initiated in the proper sequence to achieve consistent results. Each task is defined with a task input criterion, task action, task output, and task disposition, see Figure 1.

Figure 1. Task with input criteria, an action, task output, and task disposition

Figure 1. Task with input criteria, an action, task output, and task disposition

Embedded Workflow

Figure 2 depicts the database serving as the workflow state manager where an external entity submits a job for execution into the database workflow. This can be challenging, as the embedded workflow definition requires the use of well-defined database primitives. In addition, any external tasks require tight coupling with database primitives that constrains workflow agility.

Figure 2. Embedded database workflow mechanisms with internal and external task entities

Figure 2. Embedded database workflow mechanisms with internal and external task entities

Externalized workflow

A paradigm change is made with use of a modernized workflow management system, where the workflow state exists external to the relational database. A workflow management system is essentially a modernized database specifically designed to manage the workflow state (depicted in Figure 3.)

Figure 3. External task manager extracting workflow state, job data, performing the task, and re-inserting the job data back into the database

Figure 3. External task manager extracting workflow state, job data, performing the task, and re-inserting the job data back into the database

AWS offers two workflow state management services: Amazon Simple Workflow Service (Amazon SWF) and AWS Step Functions. The workflow definition and workflow state are no longer stored in a relational database; these workflow attributes are incorporated into the AWS service. The AWS services are highly scalable, enable flexible workflow definition, and integrate tasks from many other systems, including relational databases. These capabilities vastly expand the types of tasks available in a workflow. Migrating the workflow management to an AWS service reduces demand placed upon the database. In this way, the database’s primary value of representing structured and relational data is preserved. AWS Step Functions offers a well-defined set of task  primitives for the workflow designer. The designer can still incorporate tasks that leverage the inherent relational database capabilities.

Pull and push workflow models

First, we must differentiate between Amazon SWF and AWS Step Functions to determine which service is optimal for your workflow. Amazon SWF uses an HTTPS API pull model where external Workers and Deciders execute Tasks and assert the Next-Step, respectively. The workflow state is captured in the Amazon SWF history table. This table tracks the state of jobs and tasks so a common reference exists for all the candidate Workers and Deciders.

Amazon SWF does require development of external entities that make the appropriate API calls into Amazon SWF. It inherently supports external tasks that require human intervention. This workflow can tolerate long lead times for task execution. The Amazon SWF pull model is represented in the Figure 4.

Figure 4. ‘Pull model’ for workflow definition when using Amazon SWF

Figure 4. ‘Pull model’ for workflow definition when using Amazon SWF

In contrast, AWS Step Functions uses a push model, shown in Figure 5, that initiates workflow tasks and integrates seamlessly with other AWS services. AWS Step Functions may also incorporate mechanisms that enable long-running tasks that require human intervention. AWS Step Functions provides the workflow state management, requires minimal coding, and provides traceability of all transactions.

Figure 5. ‘Push model’ for workflow definition when using AWS Step Functions

Figure 5. ‘Push model’ for workflow definition when using AWS Step Functions

Workflow optimizations

The introduction of an external workflow manager such as AWS Step Functions or Amazon SWF, can effectively handle long-running tasks, computationally complex processes, or large media files. AWS workflow managers support asynchronous call-back mechanisms to track task completion. The state of the workflow is intrinsically captured in the service, and the logging of state transitions is automatically captured. Computationally expensive tasks are addressed by invoking high-performance computational resources.

Finally, the AWS workflow manager also improves the handling of large data objects. Previously, jobs would transfer large data objects (images, videos, or audio) into a database’s embedded workflow manager. But this impacts the throughput capacity and consumes database storage.

In the new paradigm, large data objects are no longer transferred to the workflow as jobs, but as job pointers. These are transferred to the workflow whenever tasks must reference external object storage systems. The sequence of state transitions can be traced through CloudWatch Events. This verifies workflow completion, diagnostics of task execution (start, duration, and stop) and metrics on the number of jobs entering the various workflows.

Large data objects are best captured in more cost-effective object storage solutions such as Amazon Simple Storage Service (Amazon S3). Data records may be conveyed via a variety of NoSQL storage mechanisms including:

The workflow manager stores pointer references so tasks can directly access these data objects and perform transformation on the data. It provides pointers to the results without transferring the data objects to the workflow. Transferring pointers in the workflow as opposed to transferring large data objects significantly improves the performance, reduces costs, and dramatically improves scalability. You may continue to use the RDBMS for the storage of structured data and use its SQL capabilities with structured tables, joins, and stored procedures. AWS Step Functions enable indirect integration with relational databases using tools such as the following:

  • AWS Lambda: Short-lived execution of custom code to handle tasks
  • AWS Glue: Data integration enabling combination and preparation of data including SQL

AWS Step Functions can be coupled with AWS Lambda, a serverless compute capability. Lambda code can manipulate the job data and incorporate many other AWS services. AWS Lambda can also interact with any relational database including Amazon Relational Database Service (RDS) or Amazon Aurora as the executor of a task.

The modernized architecture shown in Figure 6 offers more flexibility in creating new workflows that can evolve with your business requirements.

Figure 6. Using Step Functions as workflow state manager

Figure 6. Using Step Functions as workflow state manager

Summary

Several key advantages are highlighted with this modernized architecture using either Amazon SWF or AWS Step Functions:

  • You can manage multiple versions of a workflow. Backwards compatibility is maintained as capability expands. Previous business requirements using metadata interpretation on job submission is preserved.
  • Tasks leverage loose coupling of external systems. This provides far more data processing and data manipulation capabilities in a workflow.
  • Upgrades can happen independently. A loosely coupled system enables independent upgrade capabilities of the workflow or the external system executing the task.
  • Automatic scaling. Serverless architecture scales automatically with the growth in job submissions.
  • Managed services. AWS provides highly resilient and fault tolerant managed services
  • Recovery. Instance recovery mechanisms can manage workflow state machines.

The modernized workflow using Amazon SWF or AWS Step Functions offers many key advantages. It enables application agility to adapt to changing business requirements. By using a managed service, the enterprise architect can focus on the workflow requirements and task actions, rather than building out a workflow management system. Finally, critical intellectual property developed in the RDBMS system can be preserved as tasks in the modernized workflow using AWS services.

Further reading:

Applying Federated Learning for ML at the Edge

Post Syndicated from Randy DeFauw original https://aws.amazon.com/blogs/architecture/applying-federated-learning-for-ml-at-the-edge/

Federated Learning (FL) is an emerging approach to machine learning (ML) where model training data is not stored in a central location. During ML training, we typically need to access the entire training dataset on a single machine. For purposes of performance scaling, we divide the training data between multiple CPUs, multiple GPUs, or a cluster of machines. But in actuality, the training data is available in a single place. This poses challenges when we gather data from many distributed devices, like mobile phones or industrial sensors. For privacy reasons, we may not be able to collect training data from mobile phones. In an industrial setting, we may not have the network connectivity to push a large volume of sensor data to a central location. In addition, raw sensor data may contain sensitive information about a plant’s operation.

In this blog, we will demonstrate a working example of federated learning on AWS. We’ll also discuss some design challenges you may face when implementing FL for your own use case.

Federated learning challenges

In FL, all data stays on the devices. A training coordinator process invokes a training round or epoch, and the devices update a local copy of the model using local data. When complete, the devices each send their updated copy of the model weights to the coordinator. The coordinator combines these weights using an approach like federated averaging, and sends the new weights to each device. Figures 1 and 2 compare traditional ML with federated learning.

Traditional ML training:

Figure 1. Traditional ML training

Figure 1. Traditional ML training

Federated Learning:

Figure 2. Federated learning. Note that in federated learning, all data stays on the devices, as compared to traditional ML.

Figure 2. Federated learning. Note that in federated learning, all data stays on the devices, as compared to traditional ML.

Compared to traditional ML, federated learning poses several challenges.

Unpredictable training participants. Mobile and industrial devices may have intermittent connectivity. We may have thousands of devices, and the communication with these devices may be asynchronous. The training coordinator needs a way to discover and communicate with these devices.

Asynchronous communication. As previously noted, devices like IoT sensors may use communication protocols like MQTT, and rely on IoT frameworks with asynchronous pub/sub messaging. For example, the training coordinator cannot simply make a synchronous call to a device to send updated weights.

Passing large messages. The model weights can be several MB in size, making them too large for typical MQTT payloads. This can be problematic when network connections are not high bandwidth.

Emerging frameworks. Deep learning frameworks like TensorFlow and PyTorch do not yet fully support FL. Each has emerging options for edge-oriented ML, but they are not yet production-ready, and are intended mostly for simulation work.

Solving for federated learning challenges

Let’s begin by discussing the framework used for FL. This framework should work with any of the major deep learning systems like PyTorch and TensorFlow. It should clearly separate what happens on the training coordinator versus what happens on the devices. The Flower framework satisfies these requirements. In the simplest cases, Flower only requires that a device or client implement four methods: get model weights, set model weights, run a training round, and return metrics (like accuracy). Flower provides a default weight combination strategy, federated averaging, although we could design our own.

Next, let’s consider the challenges of devices and coordinator-to-device communication. Here it helps to have a specific use case in mind. Let’s focus on an industrial use case using the AWS IoT services. The IoT services will provide device discovery and asynchronous messaging tools. Running Flower code in tasks running on Amazon ECS on AWS Fargate containers orchestrated by an AWS Step Functions workflow, bridges the gap between the synchronous training process and the asynchronous device communication.

Devices: Our devices are registered with the AWS IoT Core, which gives access to MQTT communication. We use an AWS IoT Greengrass device, which lets us push AWS Lambda functions on the core device to run the actual ML training code. Greengrass also provides access to other AWS services and provides a streaming capability for pushing large payloads to the AWS Lambdacloud. Devices publish heartbeat messages to an MQTT topic to facilitate device discovery by the training coordinator.

Flower processes: The Flower framework requires a server and one or more clients. The clients communicate with the server synchronously over gRPC, so we cannot directly run the Flower client code on the devices. Rather, we use Amazon ECS Fargate containers to run the Flower server and client code. The client container acts as a proxy and communicates with the devices using MQTT messaging, Greengrass streaming, and direct Amazon S3 file transfer. Since the devices cannot send responses directly to the proxy containers, we use IoT rules to push responses to an Amazon DynamoDB bookkeeping table.

Orchestration: We use a Step Functions workflow to launch a training run. It performs device discovery, launches the server container, and then launches one proxy client container for each Greengrass core.

Metrics: The Flower server and proxy containers emit useful data to logs. We use Amazon CloudWatch log metric filters to collect this information on a CloudWatch dashboard.

Figure 3 shows the high-level design of the prototype.

Figure 3. FL prototype deployed on Amazon ECS Fargate containers and AWS IoT Greengrass cores.

Figure 3. FL prototype deployed on Amazon ECS Fargate containers and AWS IoT Greengrass cores

Production considerations

As you move into production with FL, you must design for a new set of challenges compared to traditional ML.

What type of devices do you have? Mobile and IoT devices are the most common candidates for FL.

How do the devices communicate with the coordinator? Devices come and go, and don’t always support synchronous communication. How will you discover devices that are available for FL and manage asynchronous communication? IoT frameworks are designed to work with large fleets of devices with intermittent connectivity. But mobile devices will find it easier to push results back to a training coordinator using regular API endpoints.

How will you integrate FL into your ML practice? As you saw in this example, we built a working FL prototype using AWS IoT, container, database, and application integration services. A data science team is likely to work in Amazon SageMaker or an equivalent ML environment that provides model registries, experiment tracking, and other features. How will you bridge this gap? (We may need to invent a new term – “MLEdgeOps.”)

Conclusion

In this blog, we gave a working example of federated learning in an IoT scenario using the Flower framework. We discussed the challenges involved in FL compared to traditional ML when building your own FL solution. As FL is an important and emerging topic in edge ML scenarios, we invite you to try our GitHub sample code. Please give us feedback as GitHub issues, particularly if you see additional federated learning challenges that we haven’t covered yet.

Optimize your IoT Services for Scale with IoT Device Simulator

Post Syndicated from Ajay Swamy original https://aws.amazon.com/blogs/architecture/optimize-your-iot-services-for-scale-with-iot-device-simulator/

The IoT (Internet of Things) has accelerated digital transformation for many industries. Companies can now offer smarter home devices, remote patient monitoring, connected and autonomous vehicles, smart consumer devices, and many more products. The enormous volume of data emitted from IoT devices can be used to improve performance, efficiency, and develop new service and business models. This can help you build better relationships with your end consumers. But you’ll need an efficient and affordable way to test your IoT backend services without incurring significant capex by deploying test devices to generate this data.

IoT Device Simulator (IDS) is an AWS Solution that manufacturing companies can use to simulate data, test device integration, and improve the performance of their IoT backend services. The solution enables you to create hundreds of IoT devices with unique attributes and properties. You can simulate data without configuring and managing physical devices.

An intuitive UI to create and manage devices and simulations

IoT Device Simulator comes with an intuitive user interface that enables you to create and manage device types for data simulation. The solution also provides you with a pre-built autonomous car device type to simulate a fleet of connected vehicles. Once you create devices, you can create simulations and generate data (see Figure 1.)

Figure 1. The landing page UI enables you to create devices and simulation

Figure 1. The landing page UI enables you to create devices and simulation

Create devices and simulate data

With IDS, you can create multiple device types with varying properties and data attributes (see Figure 2.) Each device type has a topic where simulation data is sent. The supported data types are object, array, sinusoidal, location, Boolean, integer, float, and more. Refer to this full list of data types. Additionally, you can import device types via a specific JSON format or use the existing automotive demo to pre-populate connected vehicles.

Figure 2. Create multiple device types and their data attributes

Figure 2. Create multiple device types and their data attributes

Create and manage simulations

With IDS, you can create simulations with one device or multiple device types (see Figure 3.) In addition, you can specify the number of devices to simulate for each device type and how often data is generated and sent.

Figure 3. Create simulations for multiple devices

Figure 3. Create simulations for multiple devices

You can then run multiple simulations (see Figure 4) and use the data generated to test your IoT backend services and infrastructure. In addition, you have the flexibility to stop and restart the simulation as needed.

Figure 4. Run and stop multiple simulations

Figure 4. Run and stop multiple simulations

You can view the simulation in real time and observe the data messages flowing through. This way you can ensure that the simulation is working as expected (see Figure 5.) You can stop the simulation or add a new simulation to the mix at any time.

Figure 5. Observe your simulation in real time

Figure 5. Observe your simulation in real time

IoT Device Simulator architecture

Figure 6. IoT Device Simulator architecture

Figure 6. IoT Device Simulator architecture

The AWS CloudFormation template for this solution deploys the following architecture, shown in Figure 6:

  1. Amazon CloudFront serves the web interface content from an Amazon Simple Storage Service (Amazon S3) bucket.
  2. The Amazon S3 bucket hosts the web interface.
  3. Amazon Cognito user pool authenticates the API requests.
  4. An Amazon API Gateway API provides the solution’s API layer.
  5. AWS Lambda serves as the solution’s microservices and routes API requests.
  6. Amazon DynamoDB stores simulation and device type information.
  7. AWS Step Functions include an AWS Lambda simulator function to simulate devices and send messages.
  8. An Amazon S3 bucket stores pre-defined routes that are used for the automotive demo (which is a pre-built example in the solution).
  9. AWS IoT Core serves as the endpoint to which messages are sent.
  10. Amazon Location Service provides the map display showing the location of automotive devices for the automotive demo.

The IoT Device Simulator console is hosted on an Amazon S3 bucket, which is accessed via Amazon CloudFront. It uses Amazon Cognito to manage access. API calls, such as retrieving or manipulating information from the databases or running simulations, are routed through API Gateway. API Gateway calls the microservices, which will call the relevant service.

For example, when creating a new device type, the request is sent to API Gateway, which then routes the request to the microservices Lambda function. Based on the request, the microservices Lambda function recognizes that it is a request to create a device type and saves the device type to DynamoDB.

Running a simulation

When running a simulation, the microservices Lambda starts a Step Functions workflow. First, the request contains information about the simulation to be run, including the unique device type ID. Then, using the unique device type ID, Step Functions retrieves all the necessary information about each device type to run the simulation. Once all the information has been retrieved, the simulator Lambda function is run. The simulator Lambda function uses the device type information, including the message payload template. The Lambda function uses this template to build the message sent to the IoT topic specified for the device type.

When running a custom device type, the simulator generates random information based on the values provided for each attribute. For example, when the automotive simulation is run, the simulation runs a series of calculations to simulate an automobile moving along a series of pre-defined routes. Pre-defined routes are created and stored in an S3 bucket, when the solution is launched. The simulation retrieves the routes at random each time the Lambda function runs. Automotive demo simulations also show a map generated from Amazon Location Service and display the device locations as they move.

The simulator exits once the Lambda function has completed or has reached the fifteen-minute execution limit. It then passes all the necessary information back to the Step Function. Step Functions then enters a choice state and restarts the Lambda function if it has not yet surpassed the duration specified for the simulation. It then passes all the pertinent information back to the Lambda function so that it can resume where it left off. The simulator Lambda function also checks DynamoDB every thirty seconds to see if the user has manually stopped the simulation. If it has, it will end the simulation early. Once the simulation is complete, the Step Function updates the DynamoDB table.

The solution enables you to launch hundreds of devices to test backend infrastructure in an IoT workflow. The solution contains an Import/Export feature to share device types. Exporting a device type generates a JSON file that represents the device type. The JSON file can then be imported to create the same device type automatically. The solution allows the viewing of up to 100 messages while the solution is running. You can also filter the messages by topic and device and see what data each device emits.

Conclusion

IoT Device Simulator is designed to help customers test device integration and IoT backend services more efficiently without incurring capex for physical devices. This solution provides an intuitive web-based graphic user interface (GUI) that enables customers to create and simulate hundreds of connected devices. It is not necessary to configure and manage physical devices or develop time-consuming scripts. Although we’ve illustrated an automotive application in this post, this simulator can be used for many different industries, such as consumer electronics, healthcare equipment, utilities, manufacturing, and more.

Get started with IoT Device Simulator today.

Use a City Planning Analogy to Visualize and Create your Cloud Architecture

Post Syndicated from Marwan Al Shawi original https://aws.amazon.com/blogs/architecture/use-a-city-planning-analogy-to-visualize-and-create-your-cloud-architecture/

If you are new to creating cloud architectures, you might find it a daunting undertaking. However, there is an approach that can help you define a cloud architecture pattern by using a similar construct. In this blog post, I will show you how to envision your cloud architecture using this structured and simplified approach.

Such an approach helps you to envision the architecture as a whole. You can then create reusable architecture patterns that can be used for scenarios with similar requirements. It also will help you define the more detailed technological requirements and interdependencies of the different architecture components.

First, I will briefly define what is meant by an architecture pattern and an architecture component.

Architecture pattern and components

An architecture pattern can be defined as a mechanism used to structure multiple functional components of a software or a technology solution to address predefined requirements. It can be characterized by use case and requirements, and should be tested and reusable whenever possible.

Architecture patterns can be composed of three main elements: the architecture components, the specific functions or capabilities of each component, and the connectivity among those components.

A component in the context of a technology solution architecture is a building block. Modular architecture is composed of a collection of these building blocks.

To think modularly, you must look at the overall technology solution. What is its intended function as a complete system? Then, break it down into smaller parts or components. Think about how each component communicates with others. Identify and define each block or component and its specific roles and function. Consider the technical operational responsibilities each is expected to deliver.

Cloud architecture patterns and the city planning analogy

Let’s assume a content marketing company wants to provide marketing analytics to its partners. It proposes a SaaS solution, by offering an analytics dashboard on Amazon Web Services (AWS). This company may offer the same solution in other locations in the future.

How would you create a reusable architecture pattern for such a solution? To simplify the concept of a component and the architecture pattern, let’s use city planning as a frame of reference.

Subarchitectures or components

A city can be imagined as consisting of three organizing contexts or components:

  1. Overall City Architecture (the big picture)
  2. District Architecture
  3. Building Architecture

Let’s define each of these components or subarchitectures, and see how they correlate to an enterprise cloud architecture.

I. City Architecture consists of the city structures and the integrations of services required by the population, see Figure 1.

Figure 1. Oversimplified city layout

Figure 1. Oversimplified city layout

The overall anticipated capacity within a certain period must be calculatedfor roads, sewage, water, electricity grids, and overall city layout. Typically, this structure should be built from the intended purpose or vision of the city. This can be the type of services it will offer, and the function of each district.

Think of City Architecture as the overall cloud architecture for your enterprise. Include the anticipated capacity, the layout (single Region, multi-Region), type, and number of Amazon Virtual Private Cloud (VPC)s. Decide how you will connect and integrate all these different architecture components.

The initial workflow that can be used to define the high-level architecture pattern layout of the SaaS solution example is analogous to the overall city architecture. We can define its three primary elements: architecture components, specific functions of each component, and the connectivity among those components.

  1. Production environment. The front and backend of your application. It provides the marketing data analytics dashboard.
  2. Testing and development environment. A replica of, but isolated from the Production app. Users’ traffic doesn’t pass through security inspection layer.
  3. Security layer. Provides perimeter security inspection. Users’ traffic passes through security inspection layer.

Translating this workflow into an AWS architecture, Figure 2 shows the analogous structure.

  • Single AWS Region (to be offered in a specific geographical area)
  • Amazon VPC to host the production application
  • Amazon VPC to host the test/dev application
  • Separate VPC (or a layer within a VPC) to provide security services for perimeter security inspection
  • Customer’s connectivity (for example, over public internet, or VPN)
  • AWS Transit Gateway (TGW) to connect and isolate the different components (VPCs and VPN)
Figure 2. Architecture pattern (high-level layout)

Figure 2. Architecture pattern (high-level layout)

Domain-driven design

At this stage, you may also consider a domain-driven design (DDD). This is an approach to software development that centers on a domain model. With your DDD, you can break the solution into different bounded contexts. You can translate the business functions/capabilities into logical domains, and then define how they communicate.

Let’s use the same SaaS example and further analyze the requirements of the solution with the DDD approach in mind. The SaaS solution is offered based on two types of industries: regulated with specific security compliance, and non-regulated. By translating this into logical domains, we can optimize the design to offer a more modular architecture. This will minimize the blast radius of the solution, as illustrated in Figure 3. Watch How AWS Minimizes the Blast Radius of Failures.

Figure 3. DDD-based architecture pattern (high-level layout)

Figure 3. DDD-based architecture pattern (high-level layout)

Now let’s think of governmental boundaries within a city and among its districts. This can be analogous to AWS accounts structures and the trust boundaries among them. By applying this to the example preceding, the VPC with the security compliance requirements can be placed in a separate AWS account. Read Design principles for organizing your AWS accounts.

II. District Architecture consists of the structures and integrations required within a district to manage its buildings, see Figure 4.

Figure 4. City structure with districts

Figure 4. City structure with districts

It illustrates how to connect/integrate back to the city-wide architecture. It should consider the overall anticipated capacity within each district.

For instance, a district can be designed based on the type of function/service it provides, such as residential district, leisure district, or business district.

Mapping this to cloud architecture, you can envision it as the more specific functions/services you are expecting from a certain block, component, or domain. Your architecture can be within one or multiple VPCs, as shown in Figure 5. The structure of a domain or block can vary by number of Availability Zones and VPCs, type of external access, compliance requirements, and the hosted application requirements. Each of these blocks serves a different function and requires different specifications. However, they all need to integrate back to the overall cloud and network architecture to provide a cohesive design.

The architect must define and specify clearly the communication model among the architecture components. You may further break the application architecture at the module level into microservices using the DDD approach. An example is the use of Micro-frontend Architectures on AWS.

Figure 5. Architecture module structure

Figure 5. Architecture module structure

III. Building Architecture refers to the buildings’ structures and standards required to deliver the specific properties/services within a district. It also must integrate back with the district architecture.

To apply this to your architecture, envision the specialized functions/capabilities you are expecting from your application within a module (subcomponents). What are the requirements needed for the application tiers? In this example, let’s assume that the VPC without security compliance requirements will use a frontend web tier on Amazon EC2. Its backend database will be Amazon Relational Database Service (RDS).

Each of these subcomponents must integrate with other components and modules, as well as to the public internet. For example, an AWS Application Load Balancer could handle connections requests from external users, and AWS Web Application Firewall (AWS WAF) used as the perimeter security layer. AWS Transit Gateway could connect to other modules (VPCs). NAT gateways could provide connectivity to the internet for the internal systems in a VPC (shown in Figure 6.)

Figure 6. Architecture module and its subcomponents structure

Figure 6. Architecture module and its subcomponents structure

Conclusion

The vision and goal of a city architecture can set the basis for districts’ architectures. In turn, the district architecture sets the basis of the building architecture within a district. Similarly, the targeted enterprise cloud architecture goal should set the key requirements of the building blocks (or functional components) of the architecture.

Each architecture block sets the requirements of the subcomponents. They collectively construct a system or module of a system, as illustrated in Figure 7.

Figure 7. Structure of cloud architecture requirements and interdependencies

Figure 7. Structure of cloud architecture requirements and interdependencies

As a next step, assess your architecture from both a scale and reliability perspective. Designing for scale alone is not enough. Reliable scalability should be always the targeted architectural attribute. Read Architecting for Reliable Scalability.

Integrate Okta to Extend Active Directory Infrastructure into AWS

Post Syndicated from Pavankumar Kasani original https://aws.amazon.com/blogs/architecture/integrate-okta-to-extend-active-directory-infrastructure-into-aws/

Are you ready to extend your on-premises Active Directory to Amazon Web Services (AWS) to remove undifferentiated heavy lifting? Would you like to maintain a highly available Directory Service for your applications? Companies who have already set up integration with Okta Identity Cloud for external or internal applications require Active Directory objects to be synced to Okta for authentication. To achieve centralized access for on-premises and cloud applications, you can extend your on-premises Active Directory to AWS Managed Microsoft Active Directory (AD) using a trust relationship.

This blog shows an architecture pattern that you can use to synchronize your on-premises AD and AWS Managed AD objects. You can use Okta Identity Cloud using an Okta AD agent for syncing users and groups. The Okta AD agent can be installed and configured on a domain-joined on-premises server or an Amazon EC2 instance on AWS (see Figure 1).

AWS Directory Service lets you run Microsoft Active Directory (AD) as a managed service, and is powered by Windows Server 2012 R2. When you select and launch this directory type, it is created as a highly available pair of domain controllers connected to your Amazon Virtual Private Cloud (VPC). The domain controllers run in different Availability Zones in an AWS Region of your choice.

Okta is an enterprise-grade identity management service, which is compatible with many on-premises and cloud applications. The Okta AD agent enables you to integrate Okta with your on-premises AD. This way you can integrate your SaaS applications and your AD instances with Okta. You can simplify and centralize user management and share user credentials with other integrated cloud and on-premises applications.

Figure 1. Active Directory objects synchronization to Okta identity cloud

Figure 1. Active Directory objects synchronization to Okta identity cloud

Network connectivity between corporate data center and AWS Regions

Before getting started with configuring a trust relationship with on-premises AD and AWS managed AD, be sure you’ve read and understand the prerequisites for setting up trust. For example, it is highly recommended to have a VPN or AWS Direct Connect circuit in place between your VPC and your on-premises environment. To create a resilient VPN connection, refer to the Site-to-Site VPN User Guide.

AWS Site-to-Site VPN is a fully managed service that uses IP security (IPsec) tunnels to create a secure connection between your data center or branch office, and your AWS resources. When using Site-to-Site VPN, you can connect to Amazon VPC and also AWS Transit Gateway. Two tunnels per connection are used for increased redundancy. You can also create a dedicated or a hosted connection using AWS Direct Connect.

Trust relationship between on-premises AD and AWS Managed AD

A trust relationship is a link between two different domains. For example, a one-way trust scenario allows the user accounts from the trusted domain to access resources in the trusting domain. In a two-way trust scenario, user accounts and resources can be passed between the two domains bidirectionally. A two-way trust relationship is commonly set up between on-premises AD and AWS Managed AD to extend authentication. This is used for any directory-aware workloads in the AWS Cloud, providing users and groups access to resources in either domain using single sign-on (SSO).

AWS Managed Microsoft Active Directory (AD) supports external and forest trust relationships with your existing on-premises domain in all three trust relationship directions:

  • One-way incoming
  • One-way outgoing
  • Two-way bidirectional

To create a trust relationship, follow these steps:

  1. Prepare your on-premises domain for the trust relationship. This includes preparing your firewall configuration, enable Kerberos pre-authentication, and configuring conditional forwarders.
  2. Prepare your AWS Managed Microsoft AD for the trust relationship. This includes configuring your VPC subnets, security groups, and enabling Kerberos pre-authentication.
  3. Create the trust relationship between your on-premises AD and your AWS Managed Microsoft Active Directory (AD).

Install and configure Okta agent

Download and install Okta AD agent on your Amazon EC2 instance, which should be domain-joined with AWS Managed AD. One Okta AD agent can associate with multiple domains. Once the trust has been set up between on-premises AD and AWS Managed AD, you can associate multiple domains under the same Okta AD agent on Amazon EC2, instead of hosting and managing separate Okta AD agent servers in your own data center and AWS.

For a highly available architecture, a redundant Okta AD agent running in your corporate data center is recommended. This will help you avoid the impact of network connectivity failure between data centers and AWS Regions. Okta recommends installing multiple Okta AD agents on each domain server to achieve high availability and failover protection.

Read Okta AD integration step-by-step setup for installing and configuring Okta agent.

Validate AD objects

Once the Okta agent is installed and configured on the Amazon EC2 instance, log in to the Okta admin console. Under the provisioning to Okta tab, do a full import of users from AWS Managed AD (see Figure 2, Figure 3). The subsequent objects synchronization will be done through scheduled import with a minimum interval of one hour. After the import is done, if there are any user account overlaps between AWS Managed AD and Okta, manually assign the AD users to Okta users. You can create matching rules to automatically map the users from AD to Okta. Read Import AD users to Okta.

Figure 2. Import users under Okta admin console

Figure 2. Import users under Okta admin console

Figure 3. Import users results under Okta admin console

Figure 3. Import users results under Okta admin console

Matching rules are used in the import of users from all apps and directories that provide importing. If there is an existing Okta account, AD allows you to import and confirm users automatically (see Figure 4).

Figure 4. User creation and matching under Okta admin console

Figure 4. User creation and matching under Okta admin console

You can import groups from any forest or domain connected to Okta. The Okta AD Agent detects all groups in the domain or the organizational units (OUs) that you select. If you register an Okta AD Agent for more than one domain and you have the root OU selected for all domains, all groups will be imported. Read Import AD Groups to Okta to synchronize groups from AD to Okta.

Synchronize passwords to Okta

When you sign in to Okta using your organization’s AD credentials, the authentication process is delegated to the connected on-premises AD. Okta does not see or store the credentials.

In some cases, the credentials must be synchronized from a directory across Okta to an application. If a user changes the password stored in Active Directory and then tries to access applications using the same single sign-on session, they will receive a password error message. This is because the new password has not been synchronized to the application, so a new sign-in process is required for password validation.

To avoid a disruptive user experience, use the Okta AD Password Sync Agent to synchronize passwords from AD to Okta and to integrated apps. The Okta AD Password Sync Agent will track password changes in AD and then synchronize to Okta.

For more details on the password synchronization and password reset workflow, you can read step-by-step instructions on Synchronize passwords from Active Directory to Okta.

Summary

In this blog post, we discussed a way for synchronizing users and credentials from on-premises Active Directory and AWS Managed AD to Okta Identity Cloud. With synchronization, you can centralize access of cloud and on-premises applications and provide seamless access to AD-aware services within AWS.

Customers can also migrate on-premises AD to AWS using Active Directory Migration Tool (ADMT) along with the Password Export Server (PES) service.

Read more:

Field Notes: Building an Industrial Data Platform to Gather Insights from Operational Data

Post Syndicated from Shailaja Suresh original https://aws.amazon.com/blogs/architecture/field-notes-building-an-industrial-data-platform-to-gather-insights-from-operational-data/

Co-authored with Russell de Pina, former Sr. Partner Solutions Architect at AWS

Manufacturers looking to achieve greater operational efficiency need actionable insights from their operational data. Traditionally, operational technology (OT) and enterprise information technology (IT) existed in silos with various manual processes to clean and process data. Leveraging insights at a process level requires converging data across silos and abstracting the right data for the right use case in a scalable fashion.

The AWS Industrial Data Platform (IDP) facilitates the convergence of enterprise and operational data for gathering insights that lead to overall operational efficiency of the plant. In this blog, we demonstrate a sample AWS IDP architecture along with the steps to gather data across multiple data sources on the shop floor.

Overview of solution

With the IDP Reference Architecture as the backdrop, let us walk through the steps to implement this solution. Let us say we have gas compressors being used in our factory. The Operations Team has identified an anomaly in the wear of the bearings used in some of these compressors. Currently the bearings are supplied by two manufacturers, ABC and XYZ.

The graphs in Figures 1 and 2 show the expected and actual performance data of the bearings with respect to the vibration (actual and expected) against time. The points represent a cluster of plots which are represented as single dots here. The Mean Time Between Maintenance (MTBM) per the manufacturer for these bearings is five years. The factory has detected that for ABC bearings, the actual vibrations detected during its half-life is much more than the normal (expected) as shown. This clearly requires further analysis to identify the root cause for this discrepancy to prevent compressor breakdowns, unplanned downtime and cost.

ABC Bearings Anomoly

Figure 1 – ABC Bearings Anomaly

XYZ Bearings Vibration

Figure 2 – XYZ Bearings Vibration

Although the deviation observed from expected is much less in XYZ bearings, there is still a deviation which needs to be understood. This blog provides an overview of how the various AWS services of the IDP architecture help with this analysis. Figure 3, shows the AWS architecture used for this specific use case.

IDP AWS Architecture to solve for the Bearings Anomaly 

Figure 3 – IDP AWS Architecture to solve for the Bearings Anomaly

Tracking Anomaly Data

The sensors on the compressor bearings send the vibration/chatter data to AWS through AWS IoT core. Amazon Lookout for Equipment is configured as detailed out in the user guide with the necessary data formatting guidelines.

The raw sensor data from IoT Core which is in a JSON format is converted into a CSV format with the necessary headers to match the schema (one schema for each sensor) in Figure 7 using AWS Lambda. This CSV conversion is needed for the data to be processed by Amazon Lookout for Equipment. A sample sensor data from the ABC sensor, the AWS Lambda code snippet to convert this JSON to CSV and the output CSV which is to be ingested into Lookout for Equipment are shown in Figure 4,5 and 6 respectively. For detailed steps on how a dataset is created to be ingested into Lookout For Equipment, please refer the user guide.

Figure 4: Sample Sensor Data from ABC Bearings’ Sensor

Figure 4: Sample Sensor Data from ABC Bearings’ Sensor

import boto3
import botocore
import csv
import json

def lambda_handler(event, context):
    BUCKET_NAME = 'L4EData' 
    OUTPUT_KEY = 'csv/ABCSensor.csv' # OUTPUT FILE 
    INPUT_KEY = 'ABCSensor.json'# INPUT FILE 
    s3client = boto3.client('s3')
    s3 = boto3.resource('s3') 
    
    obj = s3.Object(BUCKET_NAME, INPUT_KEY)
    data = obj.get()['Body'].read().decode('utf-8')
    json_data = json.loads(data)
    print(json_data)

    
    output_file_path = "/tmp/data.csv"
    
    with open(output_file_path, "w") as file:
        csv_file = csv.writer(file)
        csv_file.writerow(['TIMESTAMP', 'Sensor'])
        for item in json_data:
            csv_file.writerow([item.get('TIMESTAMP'),item.get('Sensor')])
    
    csv_binary = open(output_file_path, 'rb').read()
    
    
    try:
        obj = s3.Object(BUCKET_NAME, OUTPUT_KEY)
        obj.put(Body=csv_binary)
    except botocore.exceptions.ClientError as e:
        if e.response['Error']['Code'] == "404":
            print("The object does not exist.")
        else:
            raise
    
    try:
        download_url = s3client.generate_presigned_url(
                         'get_object',
                          Params={
                              'Bucket': BUCKET_NAME,
                              'Key': OUTPUT_KEY
                              },
                          ExpiresIn=3600
        )
        return json.dumps(download_url)
    except Exception as e:
        raise utils_exception.ErrorResponse(400, e, Log)

Figure 5 –  AWS Lambda Python Code snippet to Convert CSV to JSON

Figure 6: Output CSV from AWS Lambda with Timestamp and Vibration values from Sensor

Figure 6 – Output CSV from AWS Lambda with Timestamp and Vibration values from Sensor

Figure 7: Data Schema used for Dataset Ingestion in Amazon Lookout for Equipment for ABC Vibration Sensor

Figure 7 – Data Schema used for Dataset Ingestion in Amazon Lookout for Equipment for ABC Vibration Sensor

Once the model is trained the anomaly is detected on bearing ABC as already stated.

Analyze Factory Environment Data

For our analysis, it is important to factor in the factory environment conditions. There are variables like factory humidity, machine temperature, bearing lubrication levels that could attribute to increased vibration. We have all the environment data gathered from factory sensors made available through AWS IoT Core as shown in Figure 3. Since the number of parameters measured through the factory sensors can change over time, the architecture uses a no-SQL database, Amazon DynamoDB, to persist this data for downstream analysis.

Since we only need sensor events that exceed a particular threshold, we set rules under AWS IoT Core to capture those events that could potentially cause increased vibration on the bearings. For example, we just want only those events that exceed a temperature threshold, say anything above 75-degree Fahrenheit along with the timestamp in Amazon DynamoDB. This is beyond the normal operating temperature for the bearings and certainly demands our interest.

So, we set a rule trigger as shown in Figure 8 in the Rule query statement while defining an action under IoT Core. The flow of events from an IoT sensor to Amazon DynamoDB is illustrated in Figure 9.

Figure 8 - Define a Rule in IoT Core

Figure 8 – Define a Rule in IoT Core

The events are received on a minute basis. So, if there are 3 records inserted in Amazon DynamoDB on a day, it means that there has been a temperature threshold breach for a maximum of 3 minutes.

We set up similar rules and actions to DynamoDB for humidity and compressor lubrication levels.

Figure 9: Event from IoT factory sensor to Amazon DynamoDB

Figure 9: Event from IoT factory sensor to Amazon DynamoDB

1)      Factory Data Storage

It is required to factor in both the factory data like machine id, shift number, shop floor and the operator data like the operator name, machine-operator relationships, operator’s shift, etc., for this analysis since we are drilling down to the granular details of which operators where working on the machines which have ABC bearings. Since this data is relational, it is stored in Amazon Aurora. We opt for the serverless option of the Aurora database since the operations team requires a database that is fully managed.

The  data of the vendors who supply ABC and XYZ bearings and their contracts  are stored in Amazon S3. We also have the operators’ performance scores pre-calculated and stored in Amazon S3.

2)      Querying the Data Lake

Now that we have data ingested and stored in various channels – Amazon S3, AWS IoT Core, Amazon DynamoDB and Amazon Aurora, it is required that we collate this data for further analysis and querying. We use Athena Federated Query  under Amazon Athena for querying across these multiple data sources and store the results in Amazon S3 as shown in Figure 10. It is required that we create a workgroup and configure connectors to set up Amazon S3, Amazon DynamoDB and Amazon Aurora as the data sources under Amazon Athena. The detailed steps to create and connect the data sources are provided in the user guide.

Figure 10: Athena Federated Query across Data Sources

Figure 10: Athena Federated Query across Data Sources

We are now interested to gather some insights across the three different data sources. Let us find all those machines and their corresponding operators with performance scores in factory shop floor 1 which have the lubrication levels as demonstrated in Figure 11.

Figure 11: Query to Determine Operators and their Performance

Figure 11: Query to Determine Operators and their Performance

From the output in Table 1, we see that operators on these machines which have the machine temperature levels of above the threshold to be having good scores (above 5, which is the average) based on past performance. Hence, we could conclude for now that they have been operating these machines under the normal expected conditions with the right controls and settings.

Table 1: Operators and their Scores

Table 1: Operators and their Scores

We would then want to find all those machines which have ABC Bearings and the vendors who supplied them as demonstrated in Figure 12.

Figure 12: Vendors Supplying ABC Bearings

Figure 12: Vendors Supplying ABC Bearings

Table 2: Names of Vendors Who Supply ABC Bearings

Table 2: Names of Vendors Who Supply ABC Bearings

As a next step, we would want to reach out to the vendors, Jane Doe Enterprises and Scott Inc.(see Table 2) to report the issue with ABC Bearings. The next step is to potentially modify the supply contracts and purchase only from XYZ manufacturer and/or to look for other bearing manufacturers in the vendor supply chain.

Conclusion

In this blog, we covered a sample use case to demonstrate how the AWS Industrial Data Platform can help gather actionable insights from factory floor data to gain operation efficiencies. We also did a walkthrough of a sample use case to demonstrate how the various AWS services can be used to build a scalable data platform for seamless querying and processing of data coming in with various formats.

Top 5: Featured Architecture Content for November

Post Syndicated from Ellen Crowley original https://aws.amazon.com/blogs/architecture/top-5-featured-architecture-content-for-november/

The AWS Architecture Center provides new and notable reference architecture diagrams, vetted architecture solutions, AWS Well-Architected best practices, whitepapers, and more. This blog post features some of our best picks from November’s new and updated content.

1. Game Industry Lens for the AWS Well-Architected Framework

This new Lens specifies best practices for the unique characteristics of building and operating games in the cloud, based on our experience working with game developers and publishers around the world. It provides guidance on how to design and operate your environment so that it is cost-optimized and scalable for fluctuations in global player demand. This Lens also provides guidance for securing your game infrastructure and tuning performance in order to deliver a positive player experience.

GameLift with Serverless backend reference architecture diagram

GameLift with Serverless backend reference architecture diagram

2. SAP Lens for the Well-Architected Framework

Another new Lens is aimed at SAP technology architects, cloud architects, and others who build, operate, and maintain SAP systems on AWS. This lens provides insights that AWS has gathered from customers, AWS Partners, and our SAP specialist community. You will learn how to adopt a cloud-native approach when running SAP software including SAP Business Suite, SAP S/4HANA, and supporting products. Use it to evaluate SAP on AWS workloads before, during, and after implementation.

3. Data Analytics Lens for the Well-Architected Framework

The AWS Well-Architected Data Analytics Lens is a collection of customer-proven best practices for designing analytics workloads. The newly updated Lens contains insights that AWS has gathered from real-world case studies, and helps you learn the key design elements of analytics workloads along with recommendations for improvement. The document cover 6 scenarios that are common in many analytics applications, including modern data architecture, batch data processing, and data visualization.

4. Availability and Beyond: Understanding and improving the resilience of distributed systems on AWS

What does it mean to build a highly available workload? How do you measure availability? What can I do to increase my workload’s availability? This new whitepaper will help you answer these questions for workloads operating on complex, distributed systems both in the cloud and on-premises. It outlines a common understanding for availability as a measure of resilience, establishes rules for building highly available workloads, and offers guidance on how to improve workload availability.

5. Content Localization on AWS

This Solutions Implementation provides automated video content transcription, subtitling and translation. It helps you create accurate, multi-language subtitles for video-on-demand (VOD) content, which can help all customers better understand the content. However, localizing (translating) video subtitles is both complex and labor-intensive. Learn how AWS artificial intelligence (AI) services can assist with the subtitle creation process to save manual time spent transcribing, subtitling, translating, and reviewing media assets.

Field Notes: Building a Data Service for Autonomous Driving Systems Development using Amazon EKS

Post Syndicated from Ajay Vohra original https://aws.amazon.com/blogs/architecture/field-notes-building-a-data-service-for-autonomous-driving-systems-development-using-amazon-eks/

Many aspects of autonomous driving (AD) system development are based on data that capture real-life driving scenarios. Therefore, research and development professionals working on AD systems need to handle an ever-changing array of interesting datasets composed from the real-life driving data.  In this blog post, we address a key problem in AD system development, which is how to dynamically compose interesting datasets from real-life driving data and serve them at scale in near real-time.

The first challenge in composing large interesting datasets is high latency. If you have to wait for the entire dataset to be composed before you can start consuming the dataset, you may have to wait for several minutes, or even hours. This latency slows down AD system research and development. The second challenge is creating a data service that can cost-efficiently serve the dynamically composed datasets at scale. In this blog post, we propose solutions to both these challenges.

For the challenge of high latency, we propose dynamically composing the data sets as chunked data streams, and serving them using a Amazon FSx for Lustre high-performance file-system. Chunked data streams immediately solve the latency issue, because you do not need to compose the entire stream before it can be consumed. For the challenge of cost-efficiently serving the datasets at scale, we propose using Amazon EKS with auto-scaling features.

Overview of the Data Service Architecture

The data service described in this post dynamically composes and serves data streams of selected sensor modalities for a specified drive scene selected from the A2D2 driving dataset. The data stream is dynamically composed from the extracted A2D2 drive scene data stored in Amazon S3 object data store, and the accompanying meta-data stored in an Amazon Redshift data warehouse. While the data service described in this post uses the Robot Operating System (ROS), the data service can be easily adapted for use with other robotic systems.

The data service runs in Kubernetes Pods in an Amazon EKS cluster configured to use a Horizontal Pod Autoscaler and EKS Cluster Autoscaler. An Amazon Managed Service For Apache Kafka (MSK) cluster provides the communication channel between the data service, and the data clients. The data service implements a request-response paradigm over Apache Kafka topics. However, the response data is not sent back over the Kafka topics. Instead, the data service stages the response data in Amazon S3, Amazon FSx for Lustre, or Amazon EFS, as specified in the data client request, and only the location of the staged response data is sent back to the data client over the Kafka topics. The data client directly reads the response data from its staged location.

The data client running in a ROS enabled Amazon EC2 instance plays back the received data stream into ROS topics, whereby it can be nominally consumed by any ROS node subscribing to the ROS topics. The solution architecture diagram for the data service is shown in Figure 1.

Figure 1. Data service solution architecture with default configuration

Figure 1 – Data service solution architecture with default configuration

Data Client Request

Imagine the data client wants to request drive scene data in ROS bag file format from A2D2 autonomous driving dataset for vehicle id a2d2, drive scene id 20190401145936, starting at timestamp 1554121593909500 (microseconds) , and stopping at timestamp 1554122334971448 (microseconds). The data client wants the response to include data only from the camera/front_left sensor encoded in sensor_msgs/Image ROS data type, and the lidar/front_left  sensor encoded in sensor_msgs/PointCloud2 ROS data type. The data client wants the response data to be streamed back chunked in series of rosbag files, each file spanning 1000000 microseconds of the drive scene. The data client wants the chunked response rosbag files to be staged on a shared Amazon FSx for Lustre file system.

Finally, the data client wants the camera/front_left sensor data to be played back on /a2d2/camera/front_left ROS topic, and the lidar/front_left  sensor data to be played back on /a2d2/lidar/front_left ROS topic.

The data client can encode such a data request using the following JSON object, and send it to the Kafka bootstrap servers  b-1.msk-cluster-1:9092,b-2.msk-cluster-1:9092 on the Apache Kafka topic named a2d2.

{
 "servers": "b-1.msk-cluster-1:9092,b-2.msk-cluster-1:9092",
 "requests": [{
    "kafka_topic": "a2d2", 
    "vehicle_id": "a2d2",
    "scene_id": "20190401145936",
    "sensor_id": ["lidar/front_left", "camera/front_left"],
    "start_ts": 1554121593909500, 
    "stop_ts": 1554122334971448,
    "ros_topic": {"lidar/front_left": "/a2d2/lidar/front_left", 
    "camera/front_left": "/a2d2/camera/front_left"},
    "data_type": {"lidar/front_left": "sensor_msgs/PointCloud2",
    "camera/front_left": "sensor_msgs/Image"},
    "step": 1000000,
    "accept": "fsx/multipart/rosbag",
    "preview": false
 }]
}

At any given time, one or more EKS pods in the data service are listening for messages on the Kafka topic a2d2. The EKS pod that picks the request message responds to the request by composing the requested data as a series of rosbag files, and staging them on FSx for Lustre, as requested in the  "accept": "fsx/multipart/rosbag" field.

Each rosbag in the response is dynamically composed from the drive scene data stored in Amazon S3, using the meta-data stored in Amazon Redshift. Each rosbag contains drive scene data for a single time step. In the preceding example, the time step is specified as "step": 1000000 (microseconds).

Visualizing the Data Service Response

If a human is interested in visualizing the data response, one can use any ROS visualization tool. One such tool is rviz. This tool can be run on the ROS desktop. In the following screenshot, we show the visualization of the response using rviz tool for the example data request shown previously.

Figure 2. Visualization of response using rviz tool

Figure 2 – Visualization of response using rviz tool

Dynamically Transforming the Coordinate Frames

The data service supports dynamically transforming the composed data from one coordinate frame to another frame. A typical use case is to transform the data from a sensor specific coordinate frame to AV (ego) coordinate frame. Such transformation request can be included in the data client request.

For example, imagine the data client wants to compose a data stream from all the LiDAR sensors, and transform the point cloud  data into the vehicle’s coordinate frame. The example configuration c-config-lidar.json allows you to do that. Following is a visualization of the LiDAR point cloud data transformed to the vehicle coordinate frame and visualized in the rviz tool  from a top-down perspective.

Figure 3. Top-down rviz visualization of point-cloud data transformed to ego vehicle view

Figure 3 –  Top-down rviz visualization of point-cloud data transformed to ego vehicle view

Walkthrough

In this walkthrough, we use the A2D2 autonomous driving dataset. The complete code for this walk-through and reference documentation is available in the associated Github repository. So before we get into the walk-through, clone the  Github repository on your laptop using the Git clone command. Next, ensure these prerequisites are satisfied.

The approximate cost of the walk-through of this tutorial with default configuration is US $2,000. The actual cost may vary considerably based on actual configuration, and the duration used for the walk-through.

Configure the data service

To configure the data service, we need to create a new AWS CloudFormation stack in the AWS console using the cfn/mozart.yml template from the cloned repository on your laptop.

This template creates AWS Identity and Access Management (IAM) resources, so when you create the CloudFormation Stack using the console, in the review step, you must check I acknowledge that AWS CloudFormation might create IAM resources. The stack input parameters you must specify are the following:

Parameter Name table

For all other stack input parameters, default values are recommended during the first walkthrough. Review the complete list of all the template input parameters in the Github repository reference.

  • Once the stack status in CloudFormation console is CREATE_COMPLETE, find the ROS desktop instance launched in your stack in the Amazon EC2 console, and connect to the instance using SSH as user ubuntu, using your SSH key pair. The ROS desktop instance is named as <name-of-stack>-desktop.
  • When you connect to the ROS desktop using SSH, and you see the message "Cloud init in progress. Machine will REBOOT after cloud init is complete!!", disconnect and try later after about 20 minutes. The desktop installs the NICE DCV server on first-time startup, and reboots after the install is complete.
  • If the message NICE DCV server is enabled!appears, run the command sudo passwd ubuntu to set a new strong password for user ubuntu. Now you are ready to connect to the desktop using the NICE DCV client.
  • Download and install the NICE DCV client on your laptop.
  • Use the NICE DCV Client to login to the desktop as user ubuntu
  • When you first login to the desktop using the NICE DCV client, you may be asked if you would like to upgrade the OS version. Do not upgrade the OS version.

Now you are ready to proceed with the following steps. For all the commands in this blog, we assume the working directory to be ~/amazon-eks-autonomous-driving-data-service on the ROS desktop.

If you used an IAM role to create the stack above, you must manually configure the credentials associated with the IAM role in the ~/.aws/credentials file with the following fields:

aws_access_key_id=

aws_secret_access_key=

aws_session_token=

If you used an IAM user to create the stack, you do not have to manually configure the credentials. In the working directory, run the command:

    ./scripts/configure-eks-auth.sh

When successfully running this command, the following confirmation appears AWS Credentials Removed.

Configure the EKS cluster environment

In this step, we configure the EKS cluster environment by running the command:

    ./scripts/setup-dev.sh

This step also builds and pushes the data service container image into Amazon ECR.

Prepare the A2D2 data

Before we can run the A2D2 data service, we need to extract the raw A2D2 data into your S3 bucket, extract the metadata from the raw data, and upload the metadata into the Redshift cluster. We execute these three steps using an AWS Step Functions state machine. To create and run the AWS Step Functions state machine, run the following command in the working directory:

    ./scripts/a2d2-etl-steps.sh

Note the executionArn of the state machine execution in the output of the previous command. To check the status of the execution, use following command, replacing executionArn below with your value:

The state machine execution time depends on many variable factors, and may take anywhere from 4 – 24 hours, or possibly longer. All the AWS Batch jobs started as part of the state machine automatically reattempt in case of failure.

Run the data service

The data service is deployed using a Helm Chart, and runs as a kubernetes deployment in EKS. To start the data service, execute the following command in the working directory:

    kubectl get pods -n a2d2

Run the data service client

To visualize the response data requested by the A2D2 data client, we will use the rviz tool on the ROS desktop. Open a terminal on the desktop, and run rviz.

In the rviz tool, use File>Open Config to select /home/ubuntu/amazon-eks-autonomous-driving-data-service/a2d2/config/a2d2.rviz as the rviz config. You should notice that the rviz tool is now configured with two areas, one for visualizing image data, and the other for visualizing point cloud data.

To run the data client, open a new terminal on the desktop, and execute the following command in the root directory of the cloned Github repository on the ROS desktop:

python ./a2d2/src/data_client.py --config ./a2d2/config/c-config-ex1.json 1>/tmp/a.out 2>&1 & 

After a brief delay, you should be able to preview the response data in the rviz tool. You can set "preview": false in the data client config file, ./a2d2/config/c-config-ex1.json, and rerun the preceding command to view the complete response. For maximum performance, pre-load S3 data to FSx for Lustre.

Hard reset of the data service

This step is for reference purposes. If at any time you need to do a hard reset of the data service, you can do so by executing:

    helm delete a2d2-data-service

This will delete all data service EKS pods immediately. All in-flight service responses will be aborted. Because the connection between the data client and data service is asynchronous, the data clients may wait indefinitely, and you may need to cleanup the data client processes manually on the ROS desktop using operating system tools. Note, each data client instance spawns multiple Python processes. You may also want to cleanup /fsx/rosbag directory.

Clean Up

When you no longer need the data service,  delete the AWS CloudFormation stack from the AWS CloudFormation console. Deleting the stack will shut down the desktop instance, and delete the EFS and FSx for Lustre file-systems created in the stack. The Amazon S3 bucket is not deleted.

Conclusion

In this post, we demonstrated how to build a data service that can dynamically compose near real-time chunked data streams at scale using EKS, Redshift, MSK, and FSx for Lustre. By using a data service, you increase agility, flexibility and cost-efficiency in AD system research and development.

Related reading: Field Notes: Deploy and Visualize ROS Bag Data on AWS using rviz and Webviz for Autonomous Driving

Field Notes provides hands-on technical guidance from AWS Solutions Architects, consultants, and technical account managers, based on their experiences in the field solving real-world business problems for customers.

Volotea MRO Modernization in AWS

Post Syndicated from Albert Capdevila original https://aws.amazon.com/blogs/architecture/volotea-mro-modernization-in-aws/

Volotea is one of the fastest growing independent airlines in Europe, and has increased its fleet, routes, and number of available seats year over year. Volotea has already transported more than 30 million passengers across Europe since 2012, and has bases in 16 European capitals.

The maintenance, repair, and overhaul (MRO) application is a critical system for every airline. It’s used to manage the maintenance, repair, service, and inspection of aircraft. The main goal of an MRO application is to ensure the safety and airworthiness of the aircraft. Traditionally, those systems have been based on monolithic, packaged applications. However, these are difficult to scale and do not offer the benefit of elasticity to adapt to changing demand. Volotea migrated to Amazon Web Services (AWS) to modernize their MRO without refactoring the code. In this blog post, we’ll show you an architecture solution that can be applied to modernize an MRO (or similarly packaged monolithic application) without refactoring, and discuss some considerations.

The challenges with an on-premises MRO solution

Volotea’s MRO software previously ran in an on-premises data center. The system was based on Windows, an outdated database engine, and a virtual desktop system based on Citrix. Costs were fixed, yet MRO usage is typically seasonal. All the interfaces with other systems were based on an outdated communications protocol. This presented security concerns, especially considering that ransomware attacks are an increasing threat.

The main challenge for Volotea was adapting the MRO system to changing business requirements. Seasonal workloads and high impact projects, like changing fleets from Boeing to Airbus, require flexibility. The company also needed to adapt to the changing protocols necessitated by the COVID-19 pandemic, as airlines are one of the most impacted industries in Europe.

Volotea needed to modernize the operating system (OS) and database, simplify the end user application access, and increase the overall platform security, including integration with other applications.

Modernizing the MRO without refactoring

Following Volotea’s cloud strategy, the MRO system was migrated in 2 months to AWS to reduce technology costs and gain higher operational performance, availability, security, and flexibility. The migration was not simply based on a lift-and-shift approach, but used an existing AWS reference architecture for the MRO system. This reference architecture incorporates AWS managed services to modernize the application without incurring refactoring costs.

Figure 1. Volotea MRO deployment in a multi-account architecture

Figure 1. Volotea MRO deployment in a multi-account architecture

As shown in the high-level architecture in Figure 1:

  1. Volotea migrated their servers to Amazon EC2 instances based on Linux, to minimize the OS costs. The database management system is now using an open source engine. Those changes have permitted saving more than €10K yearly in licenses.
  2. The user access technology was migrated to Amazon AppStream 2.0. This is a managed service with increased security, elasticity, and flexibility compared to traditional virtual desktop infrastructure (VDI) solutions. Volotea aligned the cost with the real usage and decreased the TCO by configuring Auto Scaling fleets, reducing the workplace costs by 50%.
  3. AWS Transfer Family was used to centralize the information exchanged with third-party applications, while increasing the security of the communication channel. This managed service enabled the migration of the SFTP, FTPS, and FTP interfaces without the need to manage servers.
  4. To modernize the access of the MRO administrators, AWS Systems Manager Session Manager was used. This provided an ideal browser-based shell access without requiring bastion hosts or opening SSH ports in the Amazon EC2 instances.
  5. The AWS services were linked to Volotea’s user directory using AWS Single Sign-On. This allowed users to authenticate with their corporate credentials, decreasing maintenance costs, and increasing the security.

The application was deployed in Volotea’s AWS Landing Zone, which included the following services:

To make the systems management homogeneous, AWS Systems Manager and AWS Backup offered a single management point for the backup policies, system inventory, and patching.

Incorporating high availability to the MRO

Once this initial modernization is finished, Volotea will use the AWS reference architecture for high availability (HA) to increase resiliency. They’ll configure Amazon EC2 Auto Scaling with application failover to another Availability Zone and the DB native replication mechanisms. This will use Elastic IP addresses to remap the endpoints in a failover scenario. This architecture can be easily implemented in AWS to incorporate HA to applications that do not natively support horizontal scaling.

Conclusion

Volotea successfully modernized its MRO software, which has given them greater flexibility, elasticity, and the increased security of AWS services. They intend to continue with their digital transformation journey. Volotea is increasing its capacity to innovate faster to deliver new digital services more efficiently and with reduced IT costs. The AWS services and strategies discussed in this blog post can be applied to other similarly packaged applications to implement a first level of modernization with little effort and low migration risk.

References:

Field Notes: Monitor IBM Db2 for Errors Using Amazon CloudWatch and Send Notifications Using Amazon SNS

Post Syndicated from Sai Parthasaradhi original https://aws.amazon.com/blogs/architecture/field-notes-monitor-ibm-db2-for-errors-using-amazon-cloudwatch-and-send-notifications-using-amazon-sns/

Monitoring a is crucial function to be able to detect any unanticipated or unknown access to your data in an IBM Db2 database running on AWS.  You also need to monitor any specific errors which might have an impact on the system stability and get notified immediately in case such an event occurs. Depending on the severity of the events, either manual or automatic intervention is needed to avoid issues.

While it is possible to access the database logs directly from the Amazon EC2 instances on which the database is running, you may need additional privilege to access the instance, in a production environment. Also, you need to write custom scripts to extract the required information from the logs and share with the relevant team members.

In this post, we use Amazon CloudWatch log Agent to export the logs to Amazon CloudWatch Logs and monitor the errors and activities in the Db2 database. We provide email notifications for the configured metric alerts which may need attention using Amazon Simple Notification Service (Amazon SNS).

Overview of solution

This solution covers the steps to configure a Db2 Audit policy on the database to capture the SQL statements which are being run on a particular table. This is followed by installing and configuring Amazon CloudWatch log Agent to export the logs to Amazon CloudWatch Logs. We set up metric filters to identify any suspicious activity on the table like unauthorized access from a user or permissions being granted on the table to any unauthorized user. We then use Amazon Simple Notification Service (Amazon SNS) to notify of events needing attention.

Similarly, we set up the notifications in case of any critical errors in the Db2 database by exporting the Db2 Diagnostics Logs to Amazon CloudWatch Logs.

Solution Architecture diagram

Figure 1 – Solution Architecture

Prerequisites

You should have the following prerequisites:

  • Ensure you have access to the AWS console and CloudWatch
  • Db2 database running on Amazon EC2 Linux instance. Refer to the Db2 Installation methods from the IBM documentation for more details.
  • A valid email address for notifications
  • A SQL client or Db2 Command Line Processor (CLP) to access the database
  • Amazon CloudWatch Logs agent installed on the EC2 instances

Refer to the Installing CloudWatch Agent documentation and install the agent. The setup shown in this post is based on a RedHat Linux operating system.  You can run the following commands as a root user to install the agent on the EC2 instance, if your OS is also based on the RedHat Linux operating system.

cd /tmp
wget https://s3.amazonaws.com/amazoncloudwatch-agent/redhat/amd64/latest/amazon-cloudwatch-agent.rpm
sudo rpm -U ./amazon-cloudwatch-agent.rpm
  • Create an IAM role with policy CloudWatchAgentServerPolicy.

This IAM role/policy is required to run CloudWatch agent on EC2 instance. Refer to the documentation CloudWatch Agent IAM Role for more details. Once the role is created, attach it to the EC2 instance profile.

Setting up a Database audit

In this section, we set up and activate the db2 audit at the database level. In order to run the db2audit command, the user running it needs SYSADM authority on the database.

First, let’s configure the path to store an active audit log where the main audit file will be created, and archive path where it will be archived using the following commands.

db2audit configure datapath /home/db2inst1/dbaudit/active/
db2audit configure archivepath /home/db2inst1/dbaudit/archive/

Now, let’s set up the static configuration audit_buf_sz size to write the audit records asynchronously in 64 4K pages. This will ensure that the statement generating the corresponding audit record does not wait until the record is written to disk.

db2 update dbm cfg using audit_buf_sz 64

Now, create an audit policy on the WORKER table, which contains sensitive employee data to log all the SQL statements being executed against the table and attach the policy to the table as follows.

db2 connect to testdb
db2 "create audit policy worktabpol categories execute status both error type audit"
db2 "audit table sample.worker using policy worktabpol"

Finally, create an audit policy to audit and log the SQL queries run by the admin user authorities. Attach this policy to dbadm, sysadm and secadm authorities as follows.

db2 "create audit policy adminpol categories execute status both,sysadmin status both error type audit"
db2 "audit dbadm,sysadm,secadm using policy adminpol"
db2 terminate

The following SQL statement can be issued to verify if the policies are created and attached to the WORKER table and the admin authorities properly.

db2 "select trim(substr(p.AUDITPOLICYNAME,1,10)) AUDITPOLICYNAME, EXECUTESTATUS, ERRORTYPE,substr(OBJECTSCHEMA,1,10) as OBJECTSCHEMA, substr(OBJECTNAME,1,10) as OBJECTNAME from SYSCAT.AUDITPOLICIES p,SYSCAT.AUDITUSE u where p.AUDITPOLICYNAME=u.AUDITPOLICYNAME and p.AUDITPOLICYNAME in ('WORKTABPOL','ADMINPOL')"
Figure 2. Audit policy setup in the database

Figure 2. Audit policy setup in the database

Once the audit setup is complete, you need to extract the details into a readable file. This contains all the execution logs whenever the WORKER table is accessed by any user from any SQL statement. You can run the following bash script periodically using CRON scheduler. This identifies events where the WORKER table is being accessed as part of any SQL statement by any user to populate worker_audit.log file which will be in a readable format.

#!/bin/bash
. /home/db2inst1/sqllib/db2profile
cd /home/db2inst1/dbaudit/archive
db2audit flush
db2audit archive database testdb
if ls db2audit.db.TESTDB.log* 1> /dev/null 2>&1; then
latest_audit=`ls db2audit.db.TESTDB.log* | tail -1`
db2audit extract file worker_audit.log from files $latest_audit
rm -f db2audit.db.TESTDB.log*
fi

Publish database audit and diagnostics Logs to CloudWatch Logs

The CloudWatch Log agent uses a JSON configuration file located at /opt/aws/amazon-cloudwatch-agent/bin/config.json. You can edit the JSON configuration as a root user and provide the following configuration details manually.  For more information, refer to the CloudWatch Agent configuration file documentation. Based on the setup in your environment, modify the file_path location in the following configuration along with any custom values for the log group and log stream names which you specify.

{
     "agent": {
         "run_as_user": "root"
     },
     "logs": {
         "logs_collected": {
             "files": {
                 "collect_list": [
                     {
                         "file_path": "/home/db2inst1/dbaudit/archive/worker_audit.log",
                         "log_group_name": "db2-db-worker-audit-log",
                         "log_stream_name": "Db2 - {instance_id}"
                     },
                   {
                       "file_path": "/home/db2inst1/sqllib/db2dump/DIAG0000/db2diag.log",
                       "log_group_name": "db2-diagnostics-logs",
                       "log_stream_name": "Db2 - {instance_id}"
                   }
                 ]
             }
         }
     }
 }

This configuration specifies the file path which needs to be published to CloudWatch Logs along with the CloudWatch Logs group and stream name details as provided in the file. We publish the audit log which was created earlier as well as the Db2 Diagnostics log which gets generated on the Db2 server, generally used to troubleshoot database issues. Based on the config file setup, we publish the worker audit log file with log group name db2-db-worker-audit-log and the Db2 diagnostics log with db2-diagnostics-logs log group name respectively.

You can now run the following command to start the CloudWatch Log agent which was installed on the EC2 instance as part of the Prerequisites.

sudo /opt/aws/amazon-cloudwatch-agent/bin/amazon-cloudwatch-agent-ctl -a fetch-config -m ec2 -c file:/opt/aws/amazon-cloudwatch-agent/bin/config.json -s

Create SNS Topic and subscription

To create an SNS topic, complete the following steps:

  • On the Amazon SNS console, choose Topics in the navigation pane.
  • Choose Create topic.
  • For Type, select Standard.
  • Provide the Topic name and other necessary details as per your requirements.
  • Choose Create topic.

After you create your SNS topic, you can create a subscription. Following are the steps to create the subscription.

  • On the Amazon SNS console, choose Subscriptions in the navigation pane.
  • Choose Create subscription.
  • For Topic ARN, choose the SNS topic you created earlier.
  • For Protocol, choose Email. Other options are available, but for this post we create an email notification.
  • For Endpoint, enter the email address to receive event notifications.
  • Choose Create subscription. Refer to the following screenshot for an example:
Figure 3. Create SNS subscription

Figure 3. Create SNS subscription

Create metric filters and CloudWatch alarm

You can use a metric filter in CloudWatch to create a new metric in a custom namespace based on a filter pattern.  Create a metric filter for db2-db-worker-audit-log log using the following steps.

To create a metric filter for the db2-db-worker-audit-log log stream:

  • On the CloudWatch console, under CloudWatch Logs, choose Log groups.
  • Select the Log group db2-db-worker-audit-log.
  • Choose Create metric filter from the Actions drop down as shown in the following screenshot.
Figure 4. Create Metric filter

Figure 4. Create Metric filter

  • For Filter pattern, enter “worker – appusr” to filter any user access on the WORKER table in the database except the authorized user appusr.

This means that only appusr user is allowed to query WORKER table to access the data. If there is an attempt to grant permissions on the table to any other user or access is being attempted by any other user, these actions are monitored. Choose Next to navigate to Assign metric step as shown in the following screenshot.

Figure 5. Define Metric filter

Figure 5. Define Metric filter

  • Enter Filter name, Metric namespace, Metric name and Metric value as provided and choose Next as shown in the following screenshot.
Figure 6. Assign Metric

Figure 6. Assign Metric

  • Choose Create Metric Filter from the next page.
  • Now, select the new Metric filter you just created from the Metric filters tab and choose Create alarm as shown in the following screenshot.
Figure 7. Create alarm

Figure 7. Create alarm

  • Choose Minimum under Statistic, Period as per your choice, say 10 seconds and Threshold value as 0 as shown in the following screenshot.
Figure 8. Configure actions

Figure 8. Configure actions

  • Choose Next and under Notification screen. select In Alarm under Alarm state trigger option.
  • Under Send a notification to search box, select the SNS Topic you have created earlier to send notifications and choose Next.
  • Enter the Filter name and choose Next and then finally choose Create alarm.

To create metric filter for db2-diagnostics-logs log stream:

Follow the same steps as earlier to create the Metric filter and alarm for the CloudWatch Log group db2-diagnostics-logs. While creating the Metric filter, enter the Filter pattern “?Error?Severe” to monitor Log level that are ‘Error’ or ‘Severe’ in nature from the diagnostics file and get notified during such events.

Testing the solution

Let’s test the solution by running a few commands and validate if notifications are being sent appropriately.

To test audit notifications, run the following grant statement against the WORKER table as system admin user or database admin user or the security admin user, depending on the user authorization setup in your environment. For this post, we use db2inst1 (system admin) to run the commands. Since the WORKER table has sensitive data, the DBA does not issue grants against the table to any other user apart from the authorized appusr user.

Alternatively, you can also issue a SELECT SQL statement against the WORKER table from any user other than appusr for testing.

db2 "grant select on table sample.worker to user abcuser, role trole"
Figure 9. Email notification for audit monitoring

Figure 9. Email notification for audit monitoring

To test error notifications, we can simulate db2 database manager failure by issuing db2_kill from the instance owner login.

Figure 10. Issue db2_kill on the database server

Figure 10. Issue db2_kill on the database server

Figure 11. Email notification for error monitoring

Figure 11. Email notification for error monitoring

Clean up

Shut down the Amazon EC2 instance which was created as part of the setup outlined in this blog post to avoid any incurring future charges.

Conclusion

In this post, we showed you how to set up Db2 database auditing on AWS and set up metric alerts and alarms to get notified in case of any unknown access or unauthorized actions. We used the audit logs and monitor errors from Db2 diagnostics logs by publishing to CloudWatch Logs.

If you have a good understanding on specific error patterns in your system, you can use the solution to filter out specific errors and get notified to take the necessary action. Let us know if you have any comments or questions. We value your feedback!

Field Notes provides hands-on technical guidance from AWS Solutions Architects, consultants, and technical account managers, based on their experiences in the field solving real-world business problems for customers.

AWS Cloud Adoption Framework (CAF) 3.0 is Now Available

Post Syndicated from Jeff Barr original https://aws.amazon.com/blogs/aws/aws-cloud-adoption-framework-caf-3-0-is-now-available/

The AWS Cloud Adoption Framework (AWS CAF) is designed to help you to build and then execute a comprehensive plan for your digital transformation. Taking advantage of AWS best practices and lessons learned from thousands of customer engagements, the AWS CAF will help you to identify and prioritize transformation opportunities, evaluate and improve your cloud readiness, and iteratively evolve the roadmaps that you follow to guide your transformation.

Version 3.0 Now Available
I am happy to announce the version 3.0 of the AWS CAF is now available. This version represents what we have learned since we released version 2.0, with a focus on digital transformation and an emphasis on the use of data & analytics.

The framework starts by identifying six groups of foundational perspectives (Business, People, Governance, Platform, Security, and Operations), totaling 47 discrete capabilities, up from 31 in the previous version.

From there it identifiers four transformation domains (Technology, Process, Organization, and Product) that must participate in a successful digital transformation.

With the capabilities and the transformation domains as a base, the AWS Cloud Adoption Framework then recommends a set of four iterative and incremental cloud transformation phases:

Envision – Demonstrate how the cloud will accelerate business outcomes. This phase is delivered as a facilitator-led interactive workshop that will help you to identify transformation opportunities and create a foundation for your digital transformation.

Align – Identify capability gaps across the foundational capabilities. This phase also takes the form of a facilitator-led workshop and results in an action plan.

Launch – Build and deliver pilot initiatives in production, while demonstrating incremental business value.

Scale – Expand pilot initiatives to the desired scale while realizing the anticipated & desired business benefits.

All in all, the AWS Cloud Adoption Framework is underpinned by hundreds of AWS offerings and programs that help you achieve specific business and technical outcomes.

Getting Started with the AWS Cloud Adoption Framework
You can use the following resources to learn more and to get started:

Web Page – Visit the AWS Cloud Adoption Framework web page.

White Paper – Download and read the AWS CAF Overview.

AWS Account Team – Your AWS account team stands ready to assist you with any and all of the phases of the AWS Cloud Adoption Framework.

Jeff;

Field Notes: Building On-Demand Disaster Recovery for IBM DB2 on AWS

Post Syndicated from João Bozelli original https://aws.amazon.com/blogs/architecture/field-notes-building-on-demand-disaster-recovery-for-ibm-db2-on-aws/

With the increased adoption of critical applications running in the cloud, customers often find themselves revisiting traditional strategies that were adopted for on-premises workloads. When it comes to IBM DB2, one of the first decisions to make is to decide what backup and restore method will be used.

In this blog post, we will show you how IT architects, database administrators, and cloud administrators can use AWS services such as Amazon Machine Images (AMIs) and Amazon Simple Storage Service (Amazon S3) to build on-demand disaster recovery. This is useful for organizations who are flexible in their Recovery Time Objective (RTO) to reduce cost by only provisioning the target environment when needed.

Architecture overview

Figure 1. Architecture of AWS services used in this blog post

Figure 1 shows the Amazon Elastic Compute Cloud (Amazon EC2) instance running the DB2 database in the primary Region (São Paulo, in this example) and performing backups to Amazon S3 by a script initiated by AWS Systems Manager. The backups in Amazon S3 are then replicated to the secondary Region (N. Virginia, in this example) by the S3 Cross-Region Replication (CRR) feature of Amazon S3.

AWS Backup provides automation by performing the AMI copy and in a similar fashion to the database backups, the AMIs are copied to the secondary Region as well. You can further enhance the backup mechanism by activating monitoring through Amazon CloudWatch and using Amazon Simple Notification Service (Amazon SNS) to send out alerts in the event of failures. The architectural considerations will be outlined in detail.

Configuring IBM DB2 native data backup to Amazon S3

Database backups are stored in Amazon S3, which replicates the backups inside a Region by default and can be replicated to another Region using CRR. Since version 11.1, IBM DB2 running on Linux natively supports data backups to Amazon S3. To create this architecture, follow these steps:

  1. Log in to the Linux server and create a PKCS keystore to store the key and create a secret access key that will be used to transfer the data to Amazon S3. The remote storage credentials will be stored in this keystore.
cd /db2/db2<sid>/
mkdir .keystore
gsk8capicmd_64 -keydb -create -db "/db2/db2<sid>/.keystore/db6-s3.p12" -pw "<password>" -type pkcs12 -stash
  1. Configure IBM DB2 to use the keystore with the KEYSTORE_LOCATION and KEYSTORE_TYPE parameters.
db2 "update dbm cfg using keystore_location /db2/db2<sid>/.keystore/db6-s3.p12 keystore_type pkcs12"
  1. Validate that the parameters were successfully updated.
db2 get dbm cfg |grep -i KEYSTORE
 Keystore type                           (KEYSTORE_TYPE) = PKCS12
 Keystore location                   (KEYSTORE_LOCATION) = /db2/db2<sid>/.keystore/db6-s3.p12
  1. Create an S3 bucket in the same Region where your EC2 instance running the IBM DB2 database is located. Ensure that all security best practices are followed for the creation of the bucket. This bucket will store the backup images. You can create different folders to store different objects. For example, you can store the configuration files in a different path, or separate backups from different IBM DB2 instances by folders inside one bucket.

Figure 2. Example bucket for storing backups

In this example, the primary folder for this database is SBX. The folder data will store the data backups, the folder config will store the configuration parameters, the folder keystore will store the backup of the keystore, and the folder logs will store the database logs.

  1. A user with programmatic access is required, because the only method of authentication available is using an access key (access key ID and secret access key). Create the user with the proper S3 permissions (the best practice is to use the principle of least privilege) and note the access key ID and secret access key. Then, create an IBM DB2 storage access alias using the following syntax:
db2 "catalog storage access alias <alias_name> vendor S3 server <S3 endpoint> user '<access_key>' password '<secret_access_key>' container '<bucket_name>'"
  1. Set the staging path to where the backups will be stored before moving to Amazon S3. This is done by defining the environment variable. Ensure this is set to avoid that the backup is written to an unwanted path.
db2set DB2_OBJECT_STORAGE_LOCAL_STAGING_PATH=/backup/staging/data
  1. To validate if variable was properly set, check that the IBM DB2 variable DB2_OBJECT_STORAGE_LOCAL_STAGING_PATH is set as follows:
db2set |grep -i STAGING

DB2_OBJECT_STORAGE_LOCAL_STAGING_PATH=/backup/staging/data
  1. Initiate the database backup either by the following command or with your backup script.

Note: make sure that the target is DB2REMOTE as follows:

db2 BACKUP DATABASE <instance> TO DB2REMOTE://<alias>//<path>/<additional path> compress without prompting

While the backup is running, you will see data being stored in the staging directory (for this example: /backup/staging/data), and then uploaded to Amazon S3.

The backup script can be integrated with AWS Systems Manager maintenance windows to run on schedule to allow control and visibility. When combined with Amazon SNS, you can send out notifications in case of success, failures, or both.

Set log and DB2 config backup to Amazon S3

There are different options when it comes to storing the database logs into Amazon S3. In this example, we’re using a very simple script initiated by AWS Systems Manager to sync the logs from the staging disk to Amazon S3. This, combined with CRR, increases the durability of the backup by replicating the logs to another Region of your choice. The same backup method for the logs is applied to the IBM DB2 configuration files (parameters and variables) and the keystore. Figure 3 shows the CRR configured on the target bucket, which is then automatically replicating the data to a secondary Region (us-east-1).

Figure 3. Example buckets for IBM DB2 backup and disaster recovery, respectively

Figure 4. Amazon S3 Replication rules configured from sa-east-1 to us-east-1 (São Paulo to N. Virginia)

Figure 5. IBM DB2 logs backed up in São Paulo (sa-east-1) and replicated to N. Virginia (us-east-1)

Amazon S3 Lifecycle policy

For this use case, we have defined a lifecycle policy to maintain the objects (full and log backups) stored as Amazon S3 Standard for 30 days, afterwards they will be moved from Amazon S3 Standard to Amazon S3 Standard-IA. After 30 days, any objects stored as Amazon S3 Standard-IA will be deleted. When used in the context of a database, this allows you to automatically manage the lifecycle of your backups. If you have compliance needs to store specific backups with longer retention times, you can backup to a separate folder (prefix) with a different lifecycle rule.

Figure 6. Amazon S3 Lifecycle policy configure for buckets in São Paulo (sa-east-1) and N. Virginia (us-east-1)

AMI to aid with automation

Up to this point, this blog post has covered how you can manage the backups for a better Recovery Point Objective (RPO). However, let’s consider what happens in case of a disaster or if you have issues with the server running the IBM DB2 database. The Recovery Time Objective (RTO) will be higher because you will have to launch an EC2 instance, prepare the server, install the IBM DB2 database, and restore the full data and log backups.

To reduce your RTO, we recommend using automated AMI backups for your EC2 instance. AWS Backup helps you generate automated AMIs based on tags and resource IDs. AWS Backup can ship the AMI backup generated from your instance to another Region, for a multi-Region disaster recovery strategy.

In this example, we have created an AWS Backup plan to run twice a day and to ship a copy of the AMI from São Paulo (sa-east-1) to N. Virginia (sa-east-1).

Figure 7. Automated AMIs copied from São Paulo (sa-east-1) to N. Virginia (us-east-1) by AWS Backup

Performance considerations

It is important to discuss the factors that impact overall backup and restore performance, and ultimately the RTO.

We recommend using VPC endpoints to ensure that the traffic from your EC2 to Amazon S3 does not traverse the internet, and to provide improved throughput for data upload. Another important factor is the type of EBS volumes used for storing the IBM DB2 data files. In this example, to cover a 170 GB database, the disk used was GP2 not striped in Logical Volume Manager (LVM). Because the degree of parallelism (number of tablespaces read in parallel by the IBM DB2 backup process) can increase CPU usage, caution is warranted when running online backups so as not to cause too much overhead on your database server. When considering optimization for EBS volumes, note the maximum throughput and IOPS that can be reached by instance type.

A test was run using AWS Command Line Interface to sync 100 GB of logs (100 files of 1 GB) from Amazon S3 to the newly created instance. It took 16 minutes. The amount of logs will vary depending on the backup schedule implemented. The Amazon S3 costs will vary depending on the lifecycle policies implemented. For further details, refer to Amazon S3 pricing.

Results

In our tests, the backup time for a 170 GB database took 38 minutes, with a restore time of 14 minutes.

The restore time can vary depending on the backup size, the amount of logs to roll forward, and disk type (mentioned previously in the Performance considerations section).

With the results of this test, the RTO was the restore time plus the time taken to launch the new server based off the AMI backup taken.

Table 1. Recovery test
Disk Type DB Size Instance Type (Backup) Parallel Channels (Backup) Backup Time Instance Type (Restore) Parallel Channels (Restore) Restore Time
GP2 170 GB m5.4xlarge 12 38 Minutes m5.4xlarge 12 14 Minutes

Conclusion

To summarize, in this blog post we described how to configure IBM DB2 backups to Amazon S3, to build an on-demand strategy for backup and disaster recovery. By following these architecture design principles, you will continue to develop resilient business continuity. Let us know if you have any comments or questions. We value your feedback!

Field Notes provides hands-on technical guidance from AWS Solutions Architects, consultants, and technical account managers, based on their experiences in the field solving real-world business problems for customers.

Ingesting PI Historian data to AWS Cloud using AWS IoT Greengrass and PI Web Services

Post Syndicated from Piyush Batwal original https://aws.amazon.com/blogs/architecture/ingesting-pi-historian-data-to-aws-cloud-using-aws-iot-greengrass-and-pi-web-services/

In process manufacturing, it’s important to fetch real-time data from data historians to support decisions-based analytics. Most manufacturing use cases require real-time data for early identification and mitigation of manufacturing issues. A limited set of commercial off-the-shelf (COTS) tools integrate with OSIsoft’s PI Historian for real-time data. However, each integration requires months of development effort, can lack full data integrity, and often doesn’t address data loss issues. In addition, these tools may not provide native connectivity to the Amazon Web Services (AWS) Cloud. Leveraging legacy COTS applications can limit your agility, both in initial setup and ongoing updates. This can impact time to value (TTV) for critical analytics.

In this blog post, we’ll illustrate how you can integrate your on-premises PI Historian with AWS services for your real-time manufacturing use cases. We will highlight the key connector features and a common deployment architecture for your multiple manufacturing use cases.

Scope of OSIsoft PI data historian use

OSIsoft’s PI System is a plant process historian. It collects machine data from various sensors and operational technology (OT) systems during the manufacturing process. PI Historian is the most widely used data historian in process industries such as Healthcare & Life Sciences (HCLS), Chemicals, and Food & Beverage. Large HCLS companies use the PI system extensively in their manufacturing plants.

The PI System usually contains years of historical data ranging from terabytes to petabytes. The data from the PI system can be used in preventive maintenance, bioreactor yield improvement, golden batch analysis, and other machine learning (ML) use cases. It can be a powerful tool when paired with AWS compute, storage, and AI/ML services.

Analyzing real-time and historical data can garner many business benefits. For example, your batch yield could improve by optimizing inputs or you could reduce downtime by proactive intervention and maintenance. You could improve overall equipment effectiveness (OEE) by improving productivity and reducing waste. This could give you the ability to conduct key analysis and deliver products to your end customers in a timely manner.

PI integration options

The data from the PI System can be ingested to AWS services in a variety of ways:

PI Connector for AWS IoT Greengrass

The PI Connector was developed by the AWS ProServe team as an extended AWS IoT Greengrass connector. The connector collects real-time and historical data from the PI system using PI Web Services. It publishes the data to various AWS services such as local ML models running at the edge, AWS IoT Core / AWS IoT SiteWise, and Amazon S3.

Connector requirements and design considerations

Specific requirements and design considerations were gathered in collaboration with various customers. These are essential for the most effective integration:

  • The connector should support reliable connectivity to the PI system for fetching real-time and historical data from the PI.
  • The connector should support subscription to various PI data modes like real-time, compressed/recorded, and interpolated, to support various use cases.
  • The initial setup and incremental updates to the PI tag configuration should be seamless without requiring any additional development effort.
  • The connector should support data contextualization in terms of asset/equipment hierarchy and process batch runs.
  • The connector should ensure full data integrity, reliable real-time data access, and support re-usability.
  • The connector should have support for handling data loss prevention scenarios for connectivity loss and/or maintenance/configuration updates.
  • The setup, deployment, and incremental updates should be fully automated.

Deployment architecture for PI Connector

The connector has been developed as part of AWS IoT Greengrass Connectivity Framework and can be deployed remotely on an edge machine. This can be running on-premises or in the AWS Cloud with access to the on-premises PI system. This machine can be run on a virtual machine (VM), a physical server, or a smaller device like a Raspberry Pi.

The connector incorporates a configuration file. You can specify connector functions such as authentication type, data access modes (polling or subscription), batch contextualization and validation on the data, or historical data access timeframe. It integrates with the PI Web APIs for subscription to real-time data for defined PI tags using secure WebSockets (wss). It can also invoke WebAPI calls for polling data with configured interval time.

The connector can be deployed as an AWS IoT Greengrass V1 AWS Lambda function or a Greengrass V2 component.

Figure 1. PI Connector architecture

Figure 1. PI Connector architecture

Connector features and benefits

  • The connector supports subscription to real-time and recorded data to track tag value changes in streaming mode. This is useful in situations where process parameter changes must be closely monitored for decision support, actions, and notifications. The connector supports data subscription for individual PI event tags, PI Asset Framework (AF), and PI Event Frames (EF).
  • The connector supports fetching recorded/compressed or interpolated data based on recorded timestamps or defined intervals, to sample all tags associated with an asset at those intervals.
  • The connector helps define asset hierarchy and batch tags as part of configuration, and contextualizes all asset data with hierarchy and batch context at the event level. This offloads heavy data post-processing for real-time use cases.
  • The connector initiates event processing at the edge and provides configurable options to push data to the Cloud. This occurs only when a valid batch is running and/or when a reported tag data quality attribute is good.
  • The connector ensures availability and data integrity by doing graceful reconnects in case of session closures from the PI side. It fetches, contextualizes, and pushes any missed data due to disconnections, maintenance, or update scenarios.
  • The connector accelerates the TTV for business by providing a reusable no-code, configuration-only PI integration capability.

Summary

The PI Connector developed by AWS Proserve makes your real-time, data ingestion from PI historian into AWS services fast, secure, scalable, and reliable. The connector can be configured and deployed into your edge network quickly.

With this connector, you can ingest data into many AWS services such as Amazon S3, AWS IoT Core, AWS IoT SiteWise, Amazon Timestream, and more. Try the PI Connector for your manufacturing use cases, and realize the full potential of OSI PI Historian data.

Further reading:

Scale Up Language Detection with Amazon Comprehend and S3 Batch Operations

Post Syndicated from Ameer Hakme original https://aws.amazon.com/blogs/architecture/scale-up-language-detection-with-amazon-comprehend-and-s3-batch-operations/

Organizations have been collecting text data for years. Text data can help you intelligently address a range of challenges, from customer experience to analytics. These mixed language, unstructured datasets can contain a wealth of information within business documents, emails, and webpages. If you’re able to process and interpret it, this information can provide insight that can help guide your business decisions.

Amazon Comprehend is a natural language processing (NLP) service that extracts insights from text datasets. Amazon Comprehend asynchronous batch operations provides organizations with the ability to detect dominant languages from text documents stored in Amazon Simple Storage Service (S3) buckets. The asynchronous operations support a maximum document size of 1 MB for language detection. They can process up to one million documents per batch, for a total size of 5 GB.

But what if your organization has millions, or even billions of documents stored in an S3 bucket waiting for language detection processing? What if your language detection process requires customization to let you organize your documents based on language? What if you need to create a search index that can help you quickly audit your text document repositories?

In this blog post, we walk through a solution using Amazon S3 Batch Operations to initiate language detection jobs with AWS Lambda and Amazon Comprehend.

Real world language detection solution architecture

In our example, we have tens of millions of text objects stored in a single S3 bucket. These need to be processed to detect the dominant language. To create a language detection job, we must supply the S3 Batch Operations with a manifest file that lists all text objects. We can use an Amazon S3 Inventory report as an input to the manifest file to create S3 bucket object lists.

One of the supported S3 Batch Operations is invoking an AWS Lambda function. The S3 Batch Operations job uses LambdaInvoke to run a Lambda function on every object listed in a manifest. Lambda jobs are subject to overall Lambda concurrency limits for the account and each Lambda invocation will have a defined runtime. Organizations can request a service quota increase if necessary. Lambda functions in a single AWS account and in one Region share the concurrency limit. You can set reserved capacity for Lambda functions to ensure that they can be invoked even when overall capacity has been exhausted.

The Lambda function can be customized to take further actions based on the output received from Amazon Comprehend. The following diagram shows an architecture for language detection with S3 Batch Operations and Amazon Comprehend.

Figure 1. Language detection with S3 Batch Operations and Amazon Comprehend

Figure 1. Language detection with S3 Batch Operations and Amazon Comprehend

Here is the architecture flow, as shown in Figure 1:

  1. S3 Batch Operations will pull the manifest file from the source S3 bucket.
  2. The S3 Batch Operations job will invoke the language detection Lambda function for each object listed in the manifest file. Lambda function code will perform a preliminary scan to check the file size, file extension, or any other requirements before calling Amazon Comprehend API. The Lambda function will then read the text object from S3 and then call the Amazon Comprehend API to detect the dominant language.
  3. The Language Detection API automatically identifies text written in over 100 languages. The API response contains the dominant language with a confidence score supporting the interpretation. An example API response would be: {‘LanguageCode’: ‘fr’, ‘Score’: 0.9888556003570557}. Once the Lambda function receives the API response, Lambda will return a message back to S3 Batch Operations with a result code.
  4. The Lambda function will then publish a message to an Amazon Simple Notification Service (SNS) topic.
  5. An Amazon Simple Queue Service (SQS) queue subscribed to the SNS topic will receive the message with all required information related to each processed text object.
  6. The SQS queue will invoke a Lambda function to process the message.
  7. The Lambda function will move the targeted S3 object to a destination S3 bucket.
  8. S3 Batch Operations will generate a completion report and will store it in an S3 bucket. The completion report will contain additional information for each task, including the object key name and version, status, error codes, and error descriptions.

Leverage SNS fanout pattern for more complex use cases

This blog post describes the basic building blocks for the solution, but it can be extended for more complex use cases, as illustrated in Figure 2. Using an SNS fanout application integration pattern would enable many SQS queues to subscribe to the same SNS topic. These SQS queues would receive identical notifications for the processed text objects, and you could implement downstream services for additional evaluation. For example, you can store text object metadata in an Amazon DynamoDB table. You can further analyze the number of processed text objects, dominant languages, object size, word count, and more.

Your source S3 bucket may have objects being uploaded in real time in addition to the existing batch processes. In this case, you could process these objects in a new batch job, or process them individually during upload by using S3 event triggers and Lambda.

Figure 2. Extending the solution

Figure 2. Extending the solution

Conclusion

You can implement a language detection job in a number of ways. All the Amazon Comprehend single document and synchronous API batch operations can be used for real-time analysis. Asynchronous batch operations can analyze large documents and large collections of documents. However, by using S3 Batch Operations, you can scale language detection batch operations to billions of text objects stored in S3. This solution has the flexibility to add customized functionality. This may be useful for more complex jobs, or when you want to capture different data points from your S3 objects.

For further reading: