Tag Archives: Architecture

Author Spotlight: Vittorio Denti, Machine Learning Engineer at Amazon

Post Syndicated from Elise Chahine original https://aws.amazon.com/blogs/architecture/author-spotlight-vittorio-denti-machine-learning-engineer-at-amazon/

The Author Spotlight series pulls back the curtain on some of AWS and Amazon’s most prolific authors. Read on to find out more about our very own Vittorio Denti’s journey, in his own words!


I’m Vittorio, and I work as a Machine Learning Engineer at Amazon. My journey in the engineering world began when I started studying Computer Engineering at Politecnico di Milano during my bachelor’s degree. It continued during the master’s degree, when I started focusing on data and artificial intelligence. During my master’s, I spent one year in Stockholm, at the KTH Royal Institute of Technology, where I studied machine learning and deep learning. I joined Amazon Web Services (AWS) in 2020 through Tech U, a graduate program for technical roles in AWS, where I started working in the area of cloud architecture. During my time in AWS, I have had the opportunity to become familiar with software architectures, the AWS cloud, and develop system design skills for distributed systems.

At AWS, I was able to grow from a technical standpoint by learning new technologies and architectural patterns for distributed systems. I’ve also had the opportunity to grow my personal perspective. I found amazing mentors: people with years of experience that were always available to talk with me, compare ideas, and explain complex topics. When I was studying at university, I developed a vertical set of technical skills, which I’m still using every day at work, and I’m now able to boost those skills by taking advantage of the pragmatism and mindset acquired through mentoring.

With AWS, I was mainly working on cloud architectures for customers but also on internal projects and blog posts. I had the opportunity to support customers in designing their machine learning architectures for model training and for serving real-time traffic, as well as working on different challenges like query optimization for databases or asynchronous communication patterns for microservices. This breadth of scenarios was fundamental to build horizontal skills outside of the machine learning domain and learning how to navigate unexplored areas.

At the end of 2022, I moved from AWS to Amazon, where I started working as a Machine Learning Engineer on Amazon Sponsored Display, a self-service solution from Amazon Ads. In this new role, I work as an engineer developing and productionizing some of the machine learning algorithms used in advertising. I really like this role because there are many opportunities to explore and build. Also, working on a product and understanding the long-term impact of architectural and engineering decisions is extremely valuable to grow as a professional.

By working at Amazon’s scale, there are many factors to consider before coming up with a solution. All of this is an amazing opportunity to learn more, experiment, and satisfy my curiosity. As you have understood by now, I always like facing new challenges, pushing myself out of the comfort zone, and being able to learn about new areas and technologies.

Some of my favorite moments so far are related to public and internal conferences that I have attended both with AWS and Amazon. In 2021, I had the opportunity to go to re:Invent 2021 in Las Vegas—the annual AWS cloud conference. In 2023, I went to Madrid for DevCon, the internal engineering conference for Amazon employees. These experiences have been extremely valuable to discover more about new technical content as well as for networking and learning from peers.

Vittorio (on the right) with his colleague Darren (on the left) at re:Invent 2021. They attended the conference and supported the AWS Game Day.

Vittorio (on the right) with his colleague Darren (on the left) at re:Invent 2021, supporting AWS Game Day

What’s on my mind

Machine learning is a growing area: it’s still fairly new and there is a lot of innovation happening. Engineers work to find the “optimal” way for running machine learning in production and balance all the different trade-offs that consistently arise. Machine learning engineering faces the complexities of software engineering and adds extra challenges deriving from working with data and models. It’s not only about developing software! We also have to work to explore, monitor, and (in some cases) build datasets and training models, plus productionize them. There are two main entities to consider (datasets and models) that do not usually appear in software engineering, and this brings extra complexity.

Some stimulating challenges are about increasing model performance without impacting latency, working with unbalanced datasets, and detecting model or data drift automatically and solving for it. This is just a set of fascinating engineering areas to explore for machine learning. While for some of these problems, the industry already has some answers or directions, the question is: how can we do this at scale and create mature and reliable solutions? In the next few years I would like to answer these questions. For instance, car manufacturers have well-established supply chains and mature manufacturing processes. To the best of my knowledge, we don’t have something comparable in the area of machine learning engineering… yet! We have a set of excellent artisans working at scale, good processes to ensure quality (like code reviews and testing), but the risk of failures or inefficiencies is still high because of the stochastic nature of the domain.

Other topics I’m passionate about are machine learning science and software architecture. I like reading research papers, understanding the latest innovations, and learn not only from their contributions, but also from the processes that the authors followed to achieve those results. There are many opportunities to transfer knowledge from other domains to machine learning engineering, and I’m always inquiring to learn more about science and engineering to run the latest innovations in production.

Favorite blog posts and resources

Design a data mesh with event streaming for real-time recommendations on AWS

Data architectures were mainly designed around technologies rather than business domains in the past. This changed in 2019, when Zhamak Dehghani introduced the data mesh. Data mesh is an application of the Domain-Driven-Design (DDD) principles to data architectures: data is organized into data domains, and the data is the product that the team owns and offers for consumption.

Designing a data architecture for working with machine learning at scale requires careful thought. You may have different data sources, consumers, and data coming from different areas of the organization. Also, your organization may grow and evolve throughout time, so you may have some domains coming up and others disappearing. In 2022, I published an AWS Big Data blog on designing a data mesh architecture with event streaming for machine learning.

In the blog, we design a data mesh with event streaming for a scenario that requires real-time music recommendations on AWS. Because ML applications may have multiple types of input data, we propose a solution that works both for data at rest as well as real-time streaming.

The complete data mesh with event streaming architecture uses two different data planes: one is dedicated for sharing data at rest (blue); the other one is for data in motion (red). Check the original blog to see how it was built step-by-step.

The complete data mesh with event-streaming architecture uses two different data planes: one is dedicated for sharing data at rest (blue), the other one is for data in motion (red)

The Let’s Architect! series on the Architecture Blog

Let’s Architect! is an editorial initiative that publishes a bi-weekly post on a specific topic since January 2022. Some of the most recent topics include event-driven architectures, microservices, data mesh and machine learning. We gather four or five different AWS content pieces that provide a perspective on why that content is relevant. Content can be an AWS blog post, a whitepaper, any hands-on workshop with architectural patterns, or a video. We focus on architectural content that can be valuable for software architects as well as software engineers willing to learn more about system design and distributed systems.

This is not only a way to learn and stay familiar with different technical areas but also to contribute and share resources with the community. The initiative has had a strong influence, and we now have customers and even many of our colleagues waiting for the upcoming posts. I have been working on this initiative with Luca Mezzalira, Zamira Jaupaj, Federica Ciuffo and Laura Hyatt, and with the support of the AWS Architecture Blog.

The Let's Architect! series

The Let’s Architect! series

Amazon Builder’s Library

One of most inspiring resources to learn from is the Amazon Builder’s Library. Its mission is to share with customers our experience of building secure and highly available services, and successful durable businesses, at Amazon and AWS.

I think it’s extremely valuable because we can learn directly from the Amazon’s experience of running distributed systems at scale. It’s not only about the content itself or how they solved a specific challenge, but also about learning how they were able to formalize a problem and the journey that they followed to achieve the solution. Also, if you wonder how some AWS services are designed under the hood… you can learn about typical patterns used to implement them by navigating through the resources in the library.

What you'll find on the Amazon Builder's Library

What you’ll find on the Amazon Builder’s Library

Let’s Architect! Designing microservices architectures

Post Syndicated from Luca Mezzalira original https://aws.amazon.com/blogs/architecture/lets-architect-designing-microservices-architectures/

In 2022, we published Let’s Architect! Architecting microservices with containers. We covered integrations patterns and some approaches for implementing microservices using containers. In this Let’s Architect! post, we want to drill down into microservices only, by focusing on the main challenges that software architects and engineers face while working on large distributed systems structured as a set of independent services.

There are many considerations to cover in detail within a broad topic like microservices. We should reflect on the organizational structure, automation pipelines, multi-account strategy, testing, communication, and many other areas. With this post we dive deep into the topic by analyzing the options for discoverability and connectivity available through Amazon VPC Lattice; then, we focus on architectural patterns for communication, mainly on asynchronous communication, as it fits very well into the paradigm. Finally, we explore how to work with serverless microservices and analyze a case study from Amazon, coming directly from the Amazon Builder’s Library.

AWS Container Day featuring Kubernetes

Modern applications are often built using a microservice distributed approach, which involves dividing the application into smaller, specialized services. Each of these services implement their own subset of functionalities or business logic. To facilitate communication between these services, it is essential to have a method to authorize, route, and monitor network traffic. It is also important, in case of issues, to have the ability of identifying the root cause of an issue, whether it originates at the application, service, or network level.

Amazon VPC Lattice can offer a consistent way to connect, secure, and monitor communication between instances, containers, and serverless functions. With Amazon VPC Lattice, you can define policies for traffic management, network access, advanced routing, implement discoverability, and, at the same time, monitor how the traffic is flowing inside complex applications in near real time.

Take me to this video!

Amazon VPC Lattice service gives you a consistent way to connect, secure, and monitor communication between your services

Amazon VPC Lattice service gives you a consistent way to connect, secure, and monitor communication between your services

Application integration patterns for microservices

Loosely coupled integration can help you design independent systems that can be developed and operated individually, plus increase the availability and reliability of the overall system landscape—particularly by using asynchronous communication. While there are many approaches for integration and conversation scenarios, it’s not always clear which approach is best for a given situation.

Join this re:Invent 2022 session to learn about foundational patterns for integration and conversation scenarios with an emphasis on loose coupling and asynchronous communication. Explore real-world use cases architected with cloud-native and serverless services, and receive guidance on choosing integration technology.

Take me to this re:Invent 2022 video!

Loosely coupled integration can help you design independent systems that can be developed and operated individually and can also increase the availability and reliability of the overall system

Loosely coupled integration can help you design independent systems that can be developed and operated individually and can also increase the availability and reliability of the overall system

Design patterns for success in serverless microservices

Software engineers love patterns—proven approaches to well-known problems that make software development easier and set our projects up for success. In complex, distributed systems, such as microservices, patterns like CQRS and Event Sourcing help decouple and scale systems.

The first part of the video is all about introducing architectural patterns and their applications, while the second part contains a set of demos and examples from the AWS console.
In this session, we examine at some typical patterns for building robust and performant serverless microservices, and how data access patterns can drive polyglot persistence.

Take me to this AWS Summit video!

With Event Sourcing data is stored as a series of events, instead of direct updates to data stores. Microservices replay events from an event store to compute the appropriate state of their own data stores

With event sourcing data is stored as a series of events, instead of direct updates to data stores; microservices replay events from an event store to compute the appropriate state of their own data stores

Avoiding overload in distributed systems by putting the smaller service in control

If we don’t pay attention to the relative scale of a service and its clients, distributed systems with microservices can be at risk of overload. A common architecture pattern adopted by many AWS services consists of splitting the system in a control plane and a data plane.

This article drills down into this scenario to understand what could happen if the data plane fleet exceeds the scale of the control plane fleet by a factor of 100 or more. This can happen in a microservices-based architecture when service X recovers from an outage and starts sending a large amount of request to service Y. Without careful fine-tuning, this shift in behavior can overwhelm the smaller callee. With this resource, we want to share some mental models and design strategies that are beneficial for distributed systems and teams working on microservices architectures.

Take me to the Amazon Builders’ Library!

To stay up to date on the data plane’s operational state, the control plane can poll an Amazon S3 bucket into which data plane servers periodically write that information

To stay updated on the data plane’s operational state, the control plane can poll an Amazon S3 bucket into which data plane servers periodically write that information

See you next time!

Thanks for stopping by! Join us in two weeks when we’ll discuss multi-tenancy and patterns for SaaS on AWS.

To find all the blogs from this series, you can check out the Let’s Architect! list of content on the AWS Architecture Blog.

dApp authentication with Amazon Cognito and Web3 proxy with Amazon API Gateway

Post Syndicated from Nicolas Menciere original https://aws.amazon.com/blogs/architecture/dapp-authentication-with-amazon-cognito-and-web3-proxy-with-amazon-api-gateway/

If your decentralized application (dApp) must interact directly with AWS services like Amazon S3 or Amazon API Gateway, you must authorize your users by granting them temporary AWS credentials. This solution uses Amazon Cognito in combination with your users’ digital wallet to obtain valid Amazon Cognito identities and temporary AWS credentials for your users. It also demonstrates how to use Amazon API Gateway to secure and proxy API calls to third-party Web3 APIs.

In this blog, you will build a fully serverless decentralized application (dApp) called “NFT Gallery”. This dApp permits users to look up their own non-fungible token (NFTs) or any other NFT collections on the Ethereum blockchain using one of the following two Web3 providers HTTP APIs: Alchemy or Moralis. These APIs help integrate Web3 components in any web application without Blockchain technical knowledge or access.

Solution overview

The user interface (UI) of your dApp is a single-page application (SPA) written in JavaScript using ReactJS, NextJS, and Tailwind CSS.

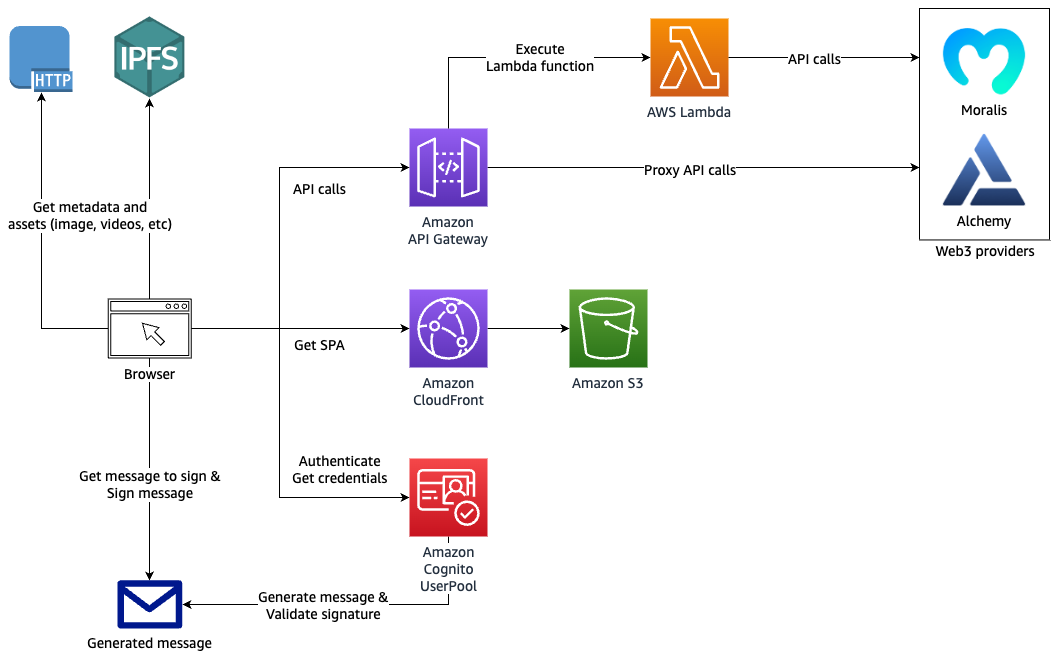
The dApp interacts with Amazon Cognito for authentication and authorization, and with Amazon API Gateway to proxy data from the backend Web3 providers’ APIs.

Architecture diagram

Architecture diagram showing authentication and API request proxy solution for Web3

Figure 1. Architecture diagram showing authentication and API request proxy solution for Web3

Prerequisites

Using the AWS SAM framework

You’ll use AWS SAM as your framework to define, build, and deploy your backend resources. AWS SAM is built on top of AWS CloudFormation and enables developers to define serverless components using a simpler syntax.

Walkthrough

Clone this GitHub repository.

Build and deploy the backend

The source code has two top level folders:

  • backend: contains the AWS SAM Template template.yaml. Examine the template.yaml file for more information about the resources deployed in this project.
  • dapp: contains the code for the dApp

1. Go to the backend folder and copy the prod.parameters.example file to a new file called prod.parameters. Edit it to add your Alchemy and Moralis API keys.

2. Run the following command to process the SAM template (review the sam build Developer Guide).

sam build

3. You can now deploy the SAM Template by running the following command (review the sam deploy Developer Guide).

sam deploy --parameter-overrides $(cat prod.parameters) --capabilities CAPABILITY_NAMED_IAM --guided --confirm-changeset

4. SAM will ask you some questions and will generate a samconfig.toml containing your answers.

You can edit this file afterwards as desired. Future deployments will use the .toml file and can be run using sam deploy. Don’t commit the samconfig.toml file to your code repository as it contains private information.

Your CloudFormation stack should be deployed after a few minutes. The Outputs should show the resources that you must reference in your web application located in the dapp folder.

Run the dApp

You can now run your dApp locally.

1. Go to the dapp folder and copy the .env.example file to a new file named .env. Edit this file to add the backend resources values needed by the dApp. Follow the instructions in the .env.example file.

2. Run the following command to install the JavaScript dependencies:

yarn

3. Start the development web server locally by running:

yarn dev

Your dApp should now be accessible at http://localhost:3000.

Deploy the dApp

The SAM template creates an Amazon S3 bucket and an Amazon CloudFront distribution, ready to serve your Single Page Application (SPA) on the internet.

You can access your dApp from the internet with the URL of the CloudFront distribution. It is visible in your CloudFormation stack Output tab in the AWS Management Console, or as output of the sam deploy command.

For now, your S3 bucket is empty. Build the dApp for production and upload the code to the S3 bucket by running these commands:

cd dapp
yarn build
cd out
aws s3 sync . s3://${BUCKET_NAME}

Replace ${BUCKET_NAME} by the name of your S3 bucket.

Automate deployment using SAM Pipelines

SAM Pipelines automatically generates deployment pipelines for serverless applications. If changes are committed to your Git repository, it automates the deployment of your CloudFormation stack and dApp code.

With SAM Pipeline, you can choose a Git provider like AWS CodeCommit, and a build environment like AWS CodePipeline to automatically provision and manage your deployment pipeline. It also supports GitHub Actions.

Read more about the sam pipeline bootstrap command to get started.

Host your dApp using Interplanetary File System (IPFS)

IPFS is a good solution to host dApps in a decentralized way. IPFS Gateway can serve as Origin to your CloudFront distribution and serve IPFS content over HTTP.

dApps are often hosted on IPFS to increase trust and transparency. With IPFS, your web application source code and assets are not tied to a DNS name and a specific HTTP host. They will live independently on the IPFS network.

Read more about hosting a single-page website on IPFS, and how to run your own IPFS cluster on AWS.

Secure authentication and authorization

In this section, we’ll demonstrate how to:

  • Authenticate users via their digital wallet using Amazon Cognito user pool
  • Protect your API Gateway from the public internet by authorizing access to both authenticated and unauthenticated users
  • Call Alchemy and Moralis third party APIs securely using API Gateway HTTP passthrough and AWS Lambda proxy integrations
  • Use the JavaScript Amplify Libraries to interact with Amazon Cognito and API Gateway from your web application

Authentication

Your dApp is usable by both authenticated and unauthenticated users. Unauthenticated users can look up NFT collections while authenticated users can also look up their own NFTs.

In your dApp, there is no login/password combination or Identity Provider (IdP) in place to authenticate your users. Instead, users connect their digital wallet to the web application.

To capture users’ wallet addresses and grant them temporary AWS credentials, you can use Amazon Cognito user pool and Amazon Cognito identity pool.

You can create a custom authentication flow by implementing an Amazon Cognito custom authentication challenge, which uses AWS Lambda triggers. This challenge requires your users to sign a generated message using their digital wallet. If the signature is valid, it confirms that the user owns this wallet address. The wallet address is then used as a user identifier in the Amazon Cognito user pool.

Figure 2 details the Amazon Cognito authentication process. Three Lambda functions are used to perform the different authentication steps.

Amazon Cognito authentication process

Figure 2. Amazon Cognito authentication process

  1. To define the authentication success conditions, the Amazon Cognito user pool calls the “Define auth challenge” Lambda function (defineAuthChallenge.js).
  2. To generate the challenge, Amazon Cognito calls the “Create auth challenge” Lambda function (createAuthChallenge.js). In this case, it generates a random message for the user to sign. Amazon Cognito forwards the challenge to the dApp, which prompts the user to sign the message using their digital wallet and private key. The dApp then returns the signature to Amazon Cognito as a response.
  3. To verify if the user’s wallet effectively signed the message, Amazon Cognito forwards the user’s response to the “Verify auth challenge response” Lambda function (verifyAuthChallengeResponse.js). If True, then Amazon Cognito authenticates the user and creates a new identity in the user pool with the wallet address as username.
  4. Finally, Amazon Cognito returns a JWT Token to the dApp containing multiple claims, one of them being cognito:username, which contains the user’s wallet address. These claims will be passed to your AWS Lambda event and Amazon API Gateway mapping templates allowing your backend to securely identify the user making those API requests.

Authorization

Amazon API Gateway offers multiple ways of authorizing access to an API route. This example showcases three different authorization methods:

  • AWS_IAM: Authorization with IAM Roles. IAM roles grant access to specific API routes or any other AWS resources. The IAM Role assumed by the user is granted by Amazon Cognito identity pool.
  • COGNITO_USER_POOLS: Authorization with Amazon Cognito user pool. API routes are protected by validating the user’s Amazon Cognito token.
  • NONE: No authorization. API routes are open to the public internet.

API Gateway backend integrations

HTTP proxy integration

The HTTP proxy integration method allows you to proxy HTTP requests to another API. The requests and responses can passthrough as-is, or you can modify them on the fly using Mapping Templates.

This method is a cost-effective way to secure access to any third-party API. This is because your third-party API keys are stored in your API Gateway and not on the frontend application.

You can also activate caching on API Gateway to reduce the amount of API calls made to the backend APIs. This will increase performance, reduce cost, and control usage.

Inspect the GetNFTsMoralisGETMethod and GetNFTsAlchemyGETMethod resources in the SAM template to understand how you can use Mapping Templates to modify the headers, path, or query string of your incoming requests.

Lambda proxy integration

API Gateway can use AWS Lambda as backend integration. Lambda functions enable you to implement custom code and logic before returning a response to your dApp.

In the backend/src folder, you will find two Lambda functions:

  • getNFTsMoralisLambda.js: Calls Moralis API and returns raw response
  • getNFTsAlchemyLambda.js: Calls Alchemy API and returns raw response

To access your authenticated user’s wallet address from your Lambda function code, access the cognito:username claim as follows:

var wallet_address = event.requestContext.authorizer.claims["cognito:username"];

Using Amplify Libraries in the dApp

The dApp uses the AWS Amplify Javascript Libraries to interact with Amazon Cognito user pool, Amazon Cognito identity pool, and Amazon API Gateway.

With Amplify Libraries, you can interact with the Amazon Cognito custom authentication flow, get AWS credentials for your frontend, and make HTTP API calls to your API Gateway endpoint.

The Amplify Auth library is used to perform the authentication flow. To sign up, sign in, and respond to the Amazon Cognito custom challenge, use the Amplify Auth library. Examine the ConnectButton.js and user.js files in the dapp folder.

To make API calls to your API Gateway, you can use the Amplify API library. Examine the api.js file in the dApp to understand how you can make API calls to different API routes. Note that some are protected by AWS_IAM authorization and others by COGNITO_USER_POOL.

Based on the current authentication status, your users will automatically assume the CognitoAuthorizedRole or CognitoUnAuthorizedRole IAM Roles referenced in the Amazon Cognito identity pool. AWS Amplify will automatically use the credentials associated with your AWS IAM Role when calling an API route protected by the AWS_IAM authorization method.

Amazon Cognito identity pool allows anonymous users to assume the CognitoUnAuthorizedRole IAM Role. This allows secure access to your API routes or any other AWS services you configured, even for your anonymous users. Your API routes will then not be publicly available to the internet.

Cleaning up

To avoid incurring future charges, delete the CloudFormation stack created by SAM. Run the sam delete command or delete the CloudFormation stack in the AWS Management Console directly.

Conclusion

In this blog, we’ve demonstrated how to use different AWS managed services to run and deploy a decentralized web application (dApp) on AWS. We’ve also shown how to integrate securely with Web3 providers’ APIs, like Alchemy or Moralis.

You can use Amazon Cognito user pool to create a custom authentication challenge and authenticate users using a cryptographically signed message. And you can secure access to third-party APIs, using API Gateway and keep your secrets safe on the backend.

Finally, you’ve seen how to host a single-page application (SPA) using Amazon S3 and Amazon CloudFront as your content delivery network (CDN).

Enable transparent connectivity to Oracle Data Guard environments using Amazon Route 53 CNAME records

Post Syndicated from Sudip Acharya original https://aws.amazon.com/blogs/architecture/enable-transparent-connectivity-to-oracle-data-guard-environments-using-amazon-route-53-cname-records/

Customers choose AWS for running their Oracle database workload to help increase resiliency, performance, and scalability of the database layer. A high availability (HA) solution for the database stack is an important aspect to consider when migrating or deploying Oracle databases in AWS to help ensure that the architecture can meet the service level agreement (SLA) of the application. Customers who run their Oracle databases on Amazon Elastic Compute Cloud (Amazon EC2) commonly choose Oracle Data Guard physical standby databases to help meet the HA and disaster recovery (DR) for their Oracle database workloads.

As discussed in this Oracle documentation, role-based services with multiple listener endpoints in the connection URL or tnsnames.ora entry is the preferred way to transparently connect to the database layer that is part of a Data Guard configuration. However, some application components and driver configurations don’t support multiple hostnames in the connection URL. Those applications require a single hostname or IP for the clients to connect to the Data Guard environment.

This post talks about the concept of using an Amazon Route 53 CNAME record in a Data Guard environment on EC2 and lists the artifacts to automatically route the connection between primary and standby environments in a Data Guard configuration based on the database role.

Solution overview

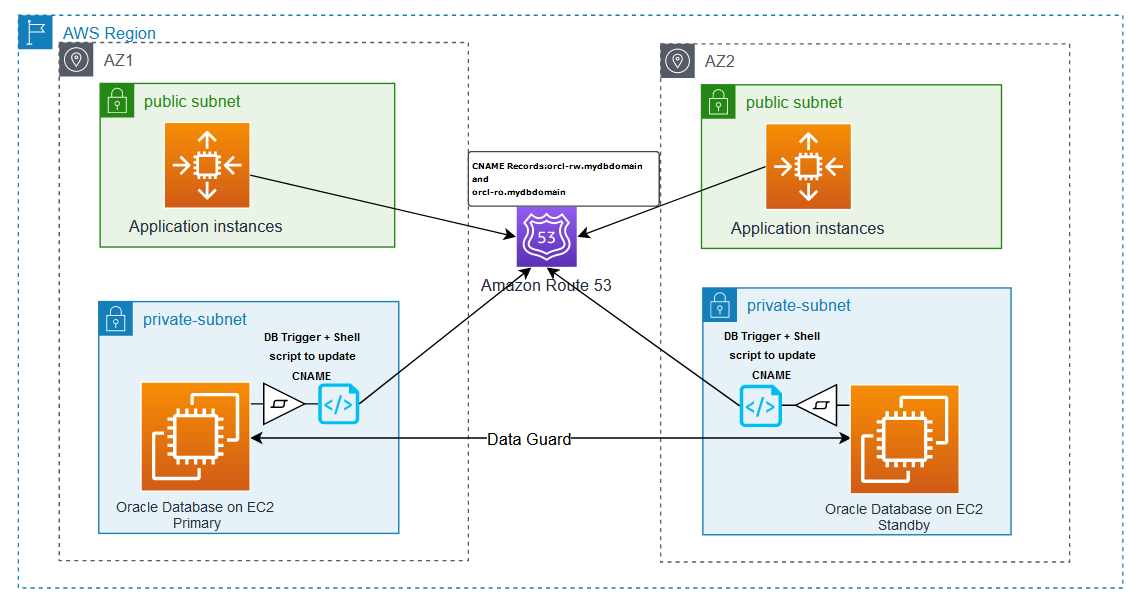
To help avoid the manual efforts to update DNS entries or tnsnames.ora file after a failover or switchover operation in a Data Guard environment, the solution uses an AFTER DB_ROLE_CHANGE trigger to automate the DNS failover process. This trigger runs a shell script on the database host, which in turn updates the CNAME record in Route 53 to point the CNAME records to reflect the role transition. The following diagram illustrates the solution architecture (Figure 1).

Figure 1. Solution architecture

Figure 1. Solution architecture

The solution discussed in this post covers routing new database connection requests to the right database post a Data Guard switchover activity. However, other factors such as application/client TTL settings and behavior of the connection pool to invalidate the connection handles created prior to the switchover activity can cause the application to connect to the database with a different role (like read-write workloads are connected to standby after switchover) and can generate errors, such as ORA-16000: database or pluggable database open for read-only access. It is a best practice to verify the database role before using the connection handles for transactions to verify that the application is connected to the database with the expected role.

The following workflow depicts the sequence of events that happens during a failover or switchover activity in a Data Guard environment to enable seamless connectivity for the application:

  1. A role transition event occurs in the Data Guard environment.
  2. The event triggers the AFTER DB_ROLE_CHANGE trigger.
  3. The trigger runs the shell script on the EC2 instance using a scheduler job.
  4. The shell script updates Route 53 to point the CNAME records to reflect the role transition.

Prerequisites

This post assumes the following prerequisites:

  • You should have an existing Data Guard configuration with one primary and one standby DB instance within a single VPC. Refer to the Oracle quick start template to deploy a Data Guard environment on Amazon EC2.
  • The steps discussed here are for self-managed Data Guard configuration on Amazon EC2 with Red Hat Linux AMI.
  • The scenario discussed in the post involves one primary and one standby database in the Data Guard configuration. For any other configurations, the scripts shown in this example require additional changes.
  • A private or public Route 53 hosted zone should be configured in the VPC where the DB environment exists.
  • The shell script uses the instance profile of the EC2 instance to run the AWS Command Line Interface (AWS CLI) commands. Make sure that the instance profile of the EC2 instances hosting the primary and standby databases has a policy attached that allows changing the record set in the hosted zone such as the following:
{
"Version": "2012-10-17",
"Statement": [
{
"Sid": "DBCnameFlipPloicy",
"Effect": "Allow",
"Action": [
"route53:ChangeResourceRecordSets",
"route53:ListResourceRecordSets"
],
"Resource": "arn:aws:route53:::hostedzone/<<YourHostedZoneId>>"
}
]
}
  • Nslookup, jq, and curl utilities must be installed on all of the DB hosts. If not installed, you can install the utility on RHEL Linux using the following command:
yum install -y bind-utils
yum install -y curl
yum install -y jq

Environment details

This post assumes a Data Guard configuration with two instances within a single VPC, one primary and one standby, with the following details and naming conventions:

  • Oracle database version – 19.10 configured in maximum performance mode with Active Data Guard
  • Route 53 domain name – mydbdomain
  • Database name – orcl
  • DB_UNIQUE_NAME – orcl_a and orcl_b
  • Instance names – orcl
  • Route 53 A record for the host in AZ1 – orcl-a-db.mydbdomain
  • Route 53 A record for the host in AZ2 – orcl-b-db.mydbdomain

Route 53 configuration

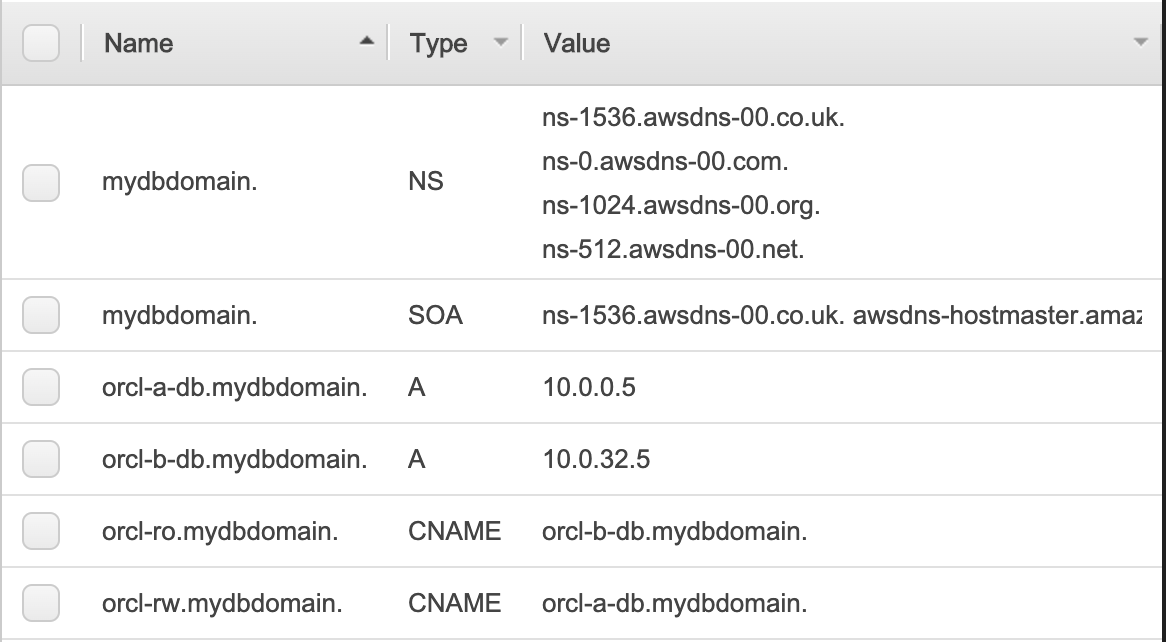
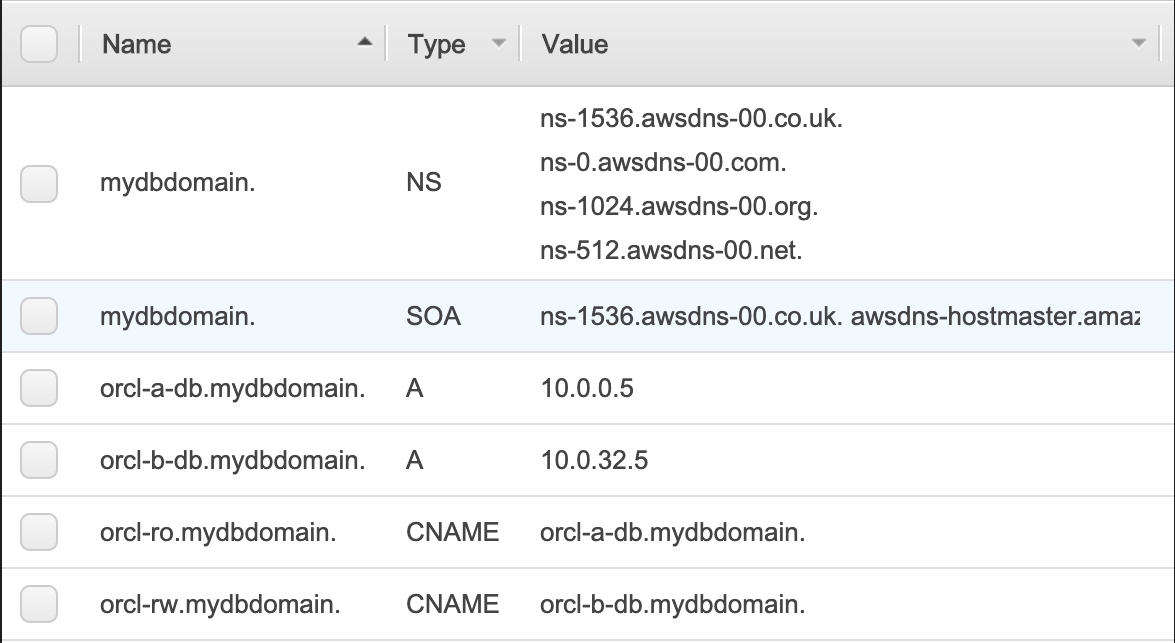
Two A records are created in Route 53 to point to the IPs of the primary and standby hosts. Two CNAME records are also created in Route 53, which are automatically updated during the Data Guard switchover and failover scenarios. The CNAME record orcl-rw.mydbdomain points to the instance in the primary role that can accept read/write transactions, and orcl-ro.mydbdomain points to the instance in the standby role that accepts read-only queries.

The A records configuration is as follows:

  • DB host IP in AZ1 (10.0.0.5 in this example) – orcl-a-db.mydbdomain
  • DB host IP in AZ2 (10.0.32.5 in this example) – orcl-b-db.mydbdomain

The CNAME records configuration is as follows:

  • orcl-a-db.mydbdomain – orcl-rw.mydbdomain
  • orcl-b-db.mydbdomain – orcl-ro.mydbdomain

The following screenshot shows the Route 53 console view of the domain mydbdomain.

The Route 53 console view of the domain mydbdomain

Figure 2. The Route 53 console view of the domain mydbdomain

TNS configuration

The following tnsnames.ora file entries show how connections can be made to primary and standby databases using the CNAME records without a dependency on the actual IP address of the EC2 instances that host primary and standby databases. The entry orcl_a always points to the instance on orcl-a-db.mydbdomain, and orcl_b always points to the instance on orcl-b-db.mydbdomain, regardless of their roles. The entries orclrw and orclro direct the connection to the databases playing primary and standby roles, respectively.

orcl_a =
(description =
(address = (protocol = tcp)(host = orcl-a-db.mydbdomain)(port = 1525))
(connect_data =
(server = dedicated)
(service_name = orcl_a)
)
)

orcl_b =
(description =
(address = (protocol = tcp)(host = orcl-b-db.mydbdomain)(port = 1525))
(connect_data =
(server = dedicated)
(service_name = orcl_b)
)
)

orclrw =
(description =
(address = (protocol = tcp)(host = orcl-rw.mydbdomain)(port = 1525))
(connect_data =
(server = dedicated)
(service_name = orcl)
)
)

orclro =
(description =
(address = (protocol = tcp)(host = orcl-ro.mydbdomain)(port = 1525))
(connect_data =
(server = dedicated)
(service_name = orcl)
)
)

To enable connectivity using orclrw and orclro TNS entries, you can use either a role-based service or a static listener registration entry in both the primary and standby listener, as shown in the following code:

SID_DESC =
      (GLOBAL_DBNAME = orcl)
      (ORACLE_HOME = /opt/oracle/product/19c/dbhome_1)
      (SID_NAME = orcl)
    )

Implement the solution

To implement an automated DNS update during an Oracle switchover or failover, we use an Oracle database trigger and a shell script. The following are the high-level steps for the entire workflow:

  1. Create a DB_ROLE_CHANGE ON DATABASE trigger on the primary database
  2. The trigger in turn creates a DBMS job that calls a shell script with the cname_switch.sh.
  3. The shell script updates the Route 53 CNAME entries.

Database trigger

Use the following code for the database trigger:

CREATE OR REPLACE TRIGGER sys.cname_flip_post_role_change 
AFTER DB_ROLE_CHANGE ON DATABASE
DECLARE
  v_db_name VARCHAR2(9);
  v_db_role VARCHAR2(16);
BEGIN
  SELECT DATABASE_ROLE  INTO v_db_role FROM V$DATABASE;
  SELECT DB_UNIQUE_NAME INTO v_db_name FROM V$DATABASE;

  IF v_db_role = 'PRIMARY' THEN
    BEGIN
      dbms_scheduler.drop_job('RW_CNAME_FLIP');
    EXCEPTION
      WHEN OTHERS THEN NULL;
    END;

    dbms_scheduler.create_job(
      job_name   => 'RW_CNAME_FLIP',
      job_type   => 'EXECUTABLE',
      number_of_arguments => 1,
      job_action => '/home/oracle/admin/bin/cname_switch.sh',
      enabled    => false,
      auto_drop  => true);

    dbms_scheduler.set_job_argument_value(
      job_name          => 'RW_CNAME_FLIP',
      argument_position => 1,
      argument_value    => v_db_name);

    BEGIN
      dbms_scheduler.run_job('RW_CNAME_FLIP');
    EXCEPTION
    WHEN OTHERS THEN
      raise_application_error(-20101, 'CNAME flip failed, check script error');
    END;

  END IF;

EXCEPTION
  WHEN OTHERS THEN
    raise_application_error(-20102, 'CNAME flip failed due to error: ' || SQLERR
M);
END;
/

Shell script

This script determines the current CNAME, identifies the dependent A records, and maps the CNAME to the correct A records accordingly. This shell script is provided for reference assuming the naming conventions for db_name and db_unique_name as used in the sample configuration. You should review and modify the script to meet your specific requirements and organization standards.

As per the example shown earlier, the shell script is placed in the location /home/oracle/admin/bin/cname_switch.sh.

Note: it’s common to see production databases that are restored or cloned to lower environments.

If the script is run in those environments, it can potentially change the CNAME entries unexpectedly. To mitigate this, the shell script has the function restore_safeguard. This function checks that the IP assigned to the EC2 instance is actually matching with the A records configured for this database in Route 53. If no match is found, this will not perform CNAME failover.

#! /bin/bash
#set -x
​
# Variables may need to be changed to suit your environment
​
DB_NAME=$1
DB_IN=$1
echo "Orginal Input : ${DB_NAME}"
DB_NAME=`echo "${DB_NAME::-2}"`  # removing last 2 characters from DB_UNIQUE_NAME
DB_NAME=`echo "${DB_NAME}" | tr '[:upper:]' '[:lower:]'`
echo "Modified Input : ${DB_NAME}"
​
DB_DOMAIN=<<YOUR_AWS_ROUTE53_DOMAIN_NAME>>    # Update as per your AWS Route53 domian name
ZONE_ID=<<YOUR_AWS_ROUTE53_HOSTED_ZONE_ID>>   # Update as per your AWS Route53 hosted zone ID
EC2_METADATA='http://169.254.169.254/latest/dynamic/instance-identity/document'
​
# CNAME and A-Records related varables :
​
RW_CNAME=`echo "${DB_NAME}-rw.${DB_DOMAIN}"`
RO_CNAME=`echo "${DB_NAME}-ro.${DB_DOMAIN}"`
A_CNAME=`echo "${DB_NAME}-a-db.${DB_DOMAIN}"`
B_CNAME=`echo "${DB_NAME}-b-db.${DB_DOMAIN}"`
​
REGION=`curl -s ${EC2_METADATA}|grep region|awk -F\" '{print $4}'`
​
# Logfile configuration and file initilization
​
TS=`date +%Y%m%d_%H%M%S`
LOG_DIR=/tmp
CHANGE_SET_FILE=`echo "${LOG_DIR}/${DB_NAME}-CnameFlip-${TS}.json"`
LOG_FILE=`echo "${LOG_DIR}/${DB_NAME}-CnameFlip-${TS}.log"`
CONF_FILE=`echo "file://${CHANGE_SET_FILE}"`
​
# Function to check if current host IP matching with Route 53 configuration
​
IS_SAFE='Unsafe'
​
function restore_safeguard()
{
    AWS_TOKEN=`curl -X PUT "http://169.254.169.254/latest/api/token" -H "X-aws-ec2-metadata-token-ttl-seconds: 21600"`
    LOCAL_IPV4=`curl -sH "X-aws-ec2-metadata-token: $AWS_TOKEN" -v http://169.254.169.254/latest/meta-data/local-ipv4`
    PUBLIC_IPV4=`curl -sH "X-aws-ec2-metadata-token: $AWS_TOKEN" -v http://169.254.169.254/latest/meta-data/public-ipv4`
    NOT_FOUND=`echo ${PUBLIC_IPV4} | grep '404 - Not Found' | wc -l`
​
    if [ ${NOT_FOUND} == 1 ]; then
       PUBLIC_IPV4='No Public IP Assigned'
    fi
​
    A_IP=$(aws route53 list-resource-record-sets --hosted-zone-id ${ZONE_ID} \
           --query 'ResourceRecordSets[?Type==`A`].{Name: Name, Value:ResourceRecords[0].Value}' | \
           jq -cr --arg DB_NAME "${DB_NAME}-a" '.[] | select( .Name | contains($DB_NAME)).Value')
​
    B_IP=$(aws route53 list-resource-record-sets --hosted-zone-id ${ZONE_ID} \
           --query 'ResourceRecordSets[?Type==`A`].{Name: Name, Value:ResourceRecords[0].Value}' | \
           jq -cr --arg DB_NAME "${DB_NAME}-b" '.[] | select( .Name | contains($DB_NAME)).Value')
​
    PREVIOUS_RW_ID=$(aws route53 list-resource-record-sets --hosted-zone-id ${ZONE_ID} \
           --query 'ResourceRecordSets[?Type==`CNAME`].{Name: Name, Value:ResourceRecords[0].Value}' | \
           jq -cr --arg DB_NAME "${DB_NAME}-rw" '.[] | select( .Name | contains($DB_NAME)).Value' | cut -d'-' -f2)
​
    if [ ${PREVIOUS_RW_ID} == 'a' ]; then
       RW_NODE_IP=${A_IP}
       RO_NODE_IP=${B_IP}
    else
       RW_NODE_IP=${B_IP}
       RO_NODE_IP=${A_IP}
    fi
​
    # Looging Input values
​
    echo "Orginal Input   : ${DB_IN}"          | tee -a ${LOG_FILE}
    echo "Modified Input  : ${DB_NAME}"        | tee -a ${LOG_FILE}
    echo "Current RW ID   : ${PREVIOUS_RW_ID}" | tee -a ${LOG_FILE}
    echo "Host Private IP : ${LOCAL_IPV4}"     | tee -a ${LOG_FILE}
    echo "Host Public IP  : ${PUBLIC_IPV4}"    | tee -a ${LOG_FILE}
    echo "A Node IP       : ${A_IP}"           | tee -a ${LOG_FILE}
    echo "A Node IP       : ${B_IP}"           | tee -a ${LOG_FILE}
    echo "RW Node IP      : ${RW_NODE_IP}"     | tee -a ${LOG_FILE}
    echo "RO Node IP      : ${RO_NODE_IP}"     | tee -a ${LOG_FILE}
​
    if [ "${LOCAL_IPV4}" == "${RO_NODE_IP}" -o "${PUBLIC_IPV4}" == "${RO_NODE_IP}" ]; then
       IS_SAFE='Safe'
    else
       IS_SAFE='Unsafe'
    fi
}
​
restore_safeguard
​
if [ ${IS_SAFE} == 'Safe' ]; then
   echo "Safe for CNAME faliover..." | tee -a ${LOG_FILE}
else
   echo "Unsafe for CNAME faliover..." | tee -a ${LOG_FILE}
   echo "Aborting..."
   exit 1
fi
​
PRI_DB_ID=`nslookup ${RW_CNAME}|grep "canonical name"|cut -d'=' -f2|cut -d'-' -f2`
​
# Looging Input values :
echo "Orginal Input      : ${DB_IN}"     | tee    ${LOG_FILE}
echo "Modified Input     : ${DB_NAME}"   | tee -a ${LOG_FILE}
echo "Current RW host ID : ${PRI_DB_ID}" | tee -a ${LOG_FILE}
​
echo -e "\nChange to be done : \n" | tee -a ${LOG_FILE}
​
if [ ${PRI_DB_ID} == 'a' ]; then
   echo "Changing ${RW_CNAME} from ${A_CNAME} to ${B_CNAME}" | tee -a ${LOG_FILE}
   echo "Changing ${RO_CNAME} from ${B_CNAME} to ${A_CNAME}" | tee -a ${LOG_FILE}
   TO_BE_RW_CNAME=${B_CNAME}
   TO_BE_RO_CNAME=${A_CNAME}
else
   echo "Changing ${RW_CNAME} from ${B_CNAME} to ${A_CNAME}" | tee -a ${LOG_FILE}
   echo "Changing ${RO_CNAME} from ${A_CNAME} to ${B_CNAME}" | tee -a ${LOG_FILE}
   TO_BE_RW_CNAME=${A_CNAME}
   TO_BE_RO_CNAME=${B_CNAME}
fi
​
R53_CHANGE=`echo -e "
{
  \"Comment\": \"Flip CNAMEs\",
  \"Changes\": [
    {
      \"Action\" : \"UPSERT\",
      \"ResourceRecordSet\" : {
        \"Name\" : \"${RW_CNAME}.\",
        \"Type\" : \"CNAME\",
        \"TTL\"  : 60,
        \"ResourceRecords\" : [{ \"Value\": \"${TO_BE_RW_CNAME}.\" }]
      }
    },
    {
      \"Action\" : \"UPSERT\",
      \"ResourceRecordSet\" : {
        \"Name\" : \"${RO_CNAME}\",
        \"Type\" : \"CNAME\",
        \"TTL\"  : 60,
        \"ResourceRecords\" : [{ \"Value\": \"${TO_BE_RO_CNAME}.\" }]
      }
    }
  ]
}
"`
​
echo -e "\nRoute53 Change Set :\n" | tee -a ${LOG_FILE}
echo ${R53_CHANGE} | tee -a ${LOG_FILE}
echo ${R53_CHANGE} > ${CHANGE_SET_FILE}
​
echo -e "\nCommand to Execute : " | tee -a ${LOG_FILE}
echo -e "\naws route53 change-resource-record-sets --hosted-zone-id ${ZONE_ID} \
         --change-batch ${CONF_FILE} \n" | tee -a ${LOG_FILE}
​
echo -e "\nExecution Result :\n"
aws route53 change-resource-record-sets --hosted-zone-id ${ZONE_ID} \
--change-batch ${CONF_FILE} | tee -a ${LOG_FILE}
​
echo -e "\nAfter Change :\n "
aws route53 list-resource-record-sets --hosted-zone-id ${ZONE_ID} | tee -a ${LOG_FILE}

Test the solution

The following screenshot shows the Route 53 console view of the domain mydbdomain before the switchover. The primary database is running on orcl-a-db.mydomain because orcl-rw.mydomain is pointing to that.

Route 53 console view of the domain mydbdomain before the switchover

Figure 3. Route 53 console view of the domain mydbdomain before the switchover

The following SQL displays the current role of both primary and standby databases and host_name they are currently running on.

[oracle@ip-10-0-0-5 sql]$ cat db_info.sql

ALTER SESSION SET NLS_DATE_FORMAT='YYYY-MM-DD:HH24:MI';
set lines 150 pages 200
col HOST_NAME for a30 trunc

select d.NAME, d.db_unique_name, d.DATABASE_ROLE, d.OPEN_MODE, i.INSTANCE_NAME, 
i.HOST_NAME, i.STARTUP_TIME
from v$instance i, v$database d;

[oracle@ip-10-0-0-5 sql]$ sqlplus system@orclrw

SQL> @db_info

NAME  DB_UNIQUE_NAME DATABASE_ROLE OPEN_MODE INSTANCE_NAME HOST_NAME STARTUP_TIME
------ ---------------- -------------- ---------------- ------------------------------ ----------------
ORCL orcl_a PRIMARY READ WRITE orcl ip-10-0-0-5.us-west-2.compute. 2020-05-24:01:47

[oracle@ip-10-0-0-5 sql]$ sqlplus system@orclro

SQL> @db_info

NAME DB_UNIQUE_NAME DATABASE_ROLE OPEN_MODE INSTANCE_NAME HOST_NAME STARTUP_TIME
------ ---------------- -------------------- -------------- ------------------------------- ----------------
ORCL orcl_b PHYSICAL STANDBY READ ONLY WITH APPLY orcl ip-10-0-32-5.us-west-2.compute. 2020-05-24:05:50

Let’s initiate the switchover:

[oracle@ip-10-0-0-5 sql]$ dgmgrl /
DGMGRL for Linux: Release 12.2.0.1.0 - Production on Wed May 27 06:42:51 2020

Copyright (c) 1982, 2017, Oracle and/or its affiliates.  All rights reserved.

Welcome to DGMGRL, type "help" for information.
Connected to "orcl_a"
Connected as SYSDG.
DGMGRL> show configuration;

Configuration - awsguard

  Protection Mode: MaxPerformance
  Members:
  orcl_a - Primary database
    orcl_b - Physical standby database

Fast-Start Failover: DISABLED

Configuration Status:
SUCCESS   (status updated 39 seconds ago)

DGMGRL> switchover to orcl_b;
Performing switchover NOW, please wait...
Operation requires a connection to database "orcl_b"
Connecting ...
Connected to "orcl_b"
Connected as SYSDBA.
New primary database "orcl_b" is opening...
Oracle Clusterware is restarting database "orcl_a" ...
Switchover succeeded, new primary is "orcl_b"
DGMGRL>
DGMGRL> show configuration;

Configuration - awsguard

  Protection Mode: MaxPerformance
  Members:
  orcl_b - Primary database
    orcl_a - Physical standby database

Fast-Start Failover: DISABLED

Configuration Status:
SUCCESS   (status updated 67 seconds ago)

DGMGRL>

Now that the switchover is complete, let’s connect to the database using the orclrw and orclro TNS entries using the following code:

[oracle@ip-10-0-0-5 sql]$ sqlplus system@orclrw

SQL> @db_info

NAME DB_UNIQUE_NAME  DATABASE_ROLE  OPEN_MODE     INSTANCE_NAME  HOST_NAME                      STARTUP_TIME
----- -------------- ------------- -------------- ------------------------------ ----------------
ORCL  orcl_b PRIMARY        READ WRITE    orcl          ip-10-0-32-5.us-west-2.compute 2020-05-24:05:50


[oracle@ip-10-0-0-5 sql]$ sqlplus system@orclro

SQL> @db_info

NAME  DATABASE_ROLE     OPEN_MODE            INSTANCE_NAME  HOST_NAME            STARTUP_TIME
----- ----------------- -------------------- -------------- ------------------------------ ----------------
ORCL orcl_a PHYSICAL STANDBY  READ ONLY WITH APPLY orcl          ip-10-0-0-5.us-west-2.compute. 2020-05-27:06:43

The following screenshot shows the Route 53 console view of the domain mydbdomain after the switchover. The primary database is now running on orcl-b-db.mydomain because orcl-rw.mydomain is pointing to that.

Route 53 console view of the domain mydbdomain after the switchover

Figure 4. Route 53 console view of the domain mydbdomain after the switchover

Conclusion

Application connectivity to a Data Guard environment can be challenging, especially when the application configuration doesn’t support multiple hostnames or listener endpoints. In this post, we discussed step-by-step details to enable seamless connectivity to Data Guard environments using Route 53 CNAME records, a database trigger, and a shell script. You can use these artifacts to direct the DB connections to the database with the right role seamlessly without application changes. If you are using Data Guard Observer for automated failover, another blog, Setup a high availability design for Oracle Data Guard (Fast-Start Failover) using Amazon Route 53 discusses an alternate mechanism to achieve the same result.

Let’s Architect! Designing serverless solutions

Post Syndicated from Luca Mezzalira original https://aws.amazon.com/blogs/architecture/lets-architect-designing-serverless-solutions/

During his re:Invent 2022 keynote, Werner Vogels, AWS Vice President and Chief Technology Officer, emphasized the asynchronous nature of our world and the challenges associated with incorporating asynchronicity into our architectures. AWS serverless services can help users concentrate on the asynchronous aspects of their workloads, easing the execution of event-driven architectures and enabling the adoption of effective integration patterns for communication both within and beyond a bounded context.

In this edition of Let’s Architect!, we offer an in-depth exploration of the architecture of serverless AWS services, such as AWS Lambda. We also present a new workshop centered on design patterns employing serverless AWS services, which ultimately delivers valuable insights on implementing event-driven architectures within systems.

A closer look at AWS Lambda

This video is the perfect companion for those seeking to learn and master a Lambda architecture, empowering you to effectively leverage its capabilities in your workloads.

With the knowledge gained from this video, you will be well-equipped to design your functions’ code in a highly optimized manner, ensuring efficient performance and resource utilization. Furthermore, a comprehensive understanding of Lambda functions can help identify and apply the most suitable approach to cloud workloads, resulting in an agile and robust cloud infrastructure that meets a project’s unique requirements.

Take me to this video!

Discover how AWS Lambda functions work under the hood

Discover how AWS Lambda functions work under the hood

Implementing an event-driven serverless story generation application with ChatGPT and DALL-E

This example of an event-driven serverless architecture showcases the power of leveraging AWS services and AI technologies to develop innovative solutions. Built upon a foundation of serverless services, including Amazon EventBridge, Amazon DynamoDB, Lambda, Amazon Simple Storage Service, and managed artificial intelligence (AI ) services like Amazon Polly, this architecture demonstrates the seamless capacity to create daily stories with a scheduled launch. By utilizing EventBridge scheduler, an Lambda function is initiated every night to generate new content. The integration of AI services, like ChatGPT and DALL-E, further elevates the solution, as their compatibility with the serverless model enables efficient and dynamic content creation. This case serves as a testament to the potential of combining event-driven serverless architectures, with cutting-edge AI technologies for inventive and impactful applications.

Take me to this Compute Blog post!

How to build an event-driven architecture with serverless AWS services integrating ChatGPT and DALL-E

How to build an event-driven architecture with serverless AWS services integrating ChatGPT and DALL-E

AWS Workshop Studio: Serverless Patterns

The AWS Serverless Patterns workshop offers a comprehensive learning experience to enhance your understanding of architectural patterns applicable to serverless projects. Throughout the workshop, participants will delve into various patterns, such as synchronous and asynchronous implementations, tailored to meet the demands of modern serverless applications. This hands-on approach ensures a production-ready understanding, encompassing crucial topics like testing serverless workloads, establishing automation pipelines, and more. Take this workshop to elevate your serverless architecture knowledge!

Take me to the serverless workshop!

The high-level architecture of the workshops modules

The high-level architecture of the workshops modules

Building Serverlesspresso: Creating event-driven architectures

Serverlesspresso is an event-driven, serverless workload that uses EventBridge and AWS Step Functions to coordinate events across microservices and support thousands of orders per day. This comprehensive session delves into design considerations, development processes, and valuable lessons learned from creating a production-ready solution. Discover practical patterns and extensibility options that contribute to a robust, scalable, and cost-effective application. Gain insights into combining EventBridge and Step Functions to address complex architectural challenges in larger applications.

Take me to this video!

How to leverage AWS Step Functions for orchestrating your workflows

How to leverage AWS Step Functions for orchestrating your workflows

See you next time!

Thanks for joining our conversation on serverless solutions! We’ll see you next time when we talk about AWS microservices.

Can’t get enough of the Let’s Architect! series? Visit the Let’s Architect! page of the AWS Architecture Blog!

Optimizing data with automated intelligent document processing solutions

Post Syndicated from Deependra Shekhawat original https://aws.amazon.com/blogs/architecture/optimizing-data-with-automated-intelligent-document-processing-solutions/

Many organizations struggle to effectively manage and derive insights from the large amount of unstructured data locked in emails, PDFs, images, scanned documents, and more. The variety of formats, document layouts, and text makes it difficult for any standard Optical Character Recognition (OCR) to extract key insights from these data sources.

To help organizations overcome these document management and information extraction challenges, AWS offers connected, pre-trained artificial intelligence (AI) service APIs that help drive business outcomes from these document-based rich data sources.

This blog post describes a cost-effective, scalable automated intelligent document processing solution that leverages a Natural Processing Language (NLP) engine using Amazon Textract and Amazon Comprehend. This solution helps customers take advantage of industry leading machine learning (ML) technology in their document workflows without the need for in-house ML expertise.

Customer document management challenges

Customers across industry verticals experience the following document management challenges:

  • Extraction process accuracy varies significantly when applied to diverse sources; specifically handwritten text, images, and scanned documents.
  • Existing scripting and rule-based solutions cannot provide customer domain or problem-specific classifiers.
  • Traditional document management systems cannot consider feedback from domain experts to improve the learning process.
  • The Personally Identifiable Information (PII) data-handling is not robust or customizable, causing data privacy leakage concern.
  • Many manual interventions are required to complete the entire process.

Automated intelligent document processing solution

We introduced an automated intelligent document processing implementation to address key document management challenges. At the heart of the solution is a NLP engine that combines:

The full solution also leverages other AWS services as described in the following diagram (Figure 1) and steps to develop and operate a cost-effective and scalable architecture for document processing. It effectively extracts text from document types including PDFs, images, scanned documents, Microsoft Excel workbooks, and more.

AI-based intelligent document processing engine

Figure 1: AI-based intelligent document processing engine

Solution overview

Let’s explore the automated intelligent document processing solution step by step.

  1. The document upload engine or business users upload the respective files or documents through a custom web application to the designated Amazon Simple Storage Service (Amazon S3) bucket.
  2. The event-based architecture signals an Amazon S3 push event to invoke the respective AWS Lambda function to start document pre-processing.
  3. The Lambda function evaluates the document payload, leverages Amazon Simple Queue Service (Amazon SQS) for async processing, prepares document metadata, stores it in Amazon DynamoDB, and calls the NLP engine to perform the information extraction process.
  4. The NLP engine leverages Amazon Textract for text extraction from a variety of sources and leverages document metadata to optimize the appropriate API calls (for example, form, tabular, or PDF).
    • Amazon Textract output is fed into Amazon Comprehend which consumes the extracted text and performs entity parsing, line/paragraph-based sentiment analysis, and document/paragraph classification. For better accuracy, we leverage a custom classifier within Amazon Comprehend.
    • Amazon Comprehend also provides key APIs to mask PII data before it is used for any further consumption. The solution offers the ability to configure masking rules for each PII entity per masking requirements.
    • To ensure the solution has capability to handle data from Microsoft Excel workbooks, we developed a custom parser using Python running inside an AWS Lambda function. Depending on the document metadata, this function can be invoked.
  5. Output of Amazon Comprehend is then fed to ML models deployed using Amazon SageMaker depending on additional use cases configured by the customer to complement the overall process with ML-based recommendations, predictions, and personalization.
  6. Once the NLP engine completes its processing, the job completion notification event signals another AWS Lambda function and updates the status in the respective Amazon SQS queue.
  7. The Lambda post-processing function parses the resultant content generated by the NLP engine and stores it in the Amazon DynamoDB and Amazon S3 bucket. This step is responsible for the required data augmentation, key entities validation, and default value assignment to create a data structure that could be consumed by the presentation/visualization layer.
  8. Users get the flexibility to see the extracted information and compare it with the original document extract in the custom user interface (UI). They can provide their feedback on extraction and entity parsing accuracy. From a user access management perspective, Amazon Cognito provides authorization and authentication.

Customer benefits

The automated intelligent document processing solution helps customers:

  • Increase overall document management efficiency by 50-60%, leveraging automation and nullifying manual interventions
  • Reduce in-house team involvement in administrative activities by up to 70% using integrated and connected processing workflows
  • Gain better visibility into key contractual obligations with features such as Document Classification (helps properly route documents to the respective process/team) and Obligation Extraction
  • Utilize a UI-based feedback mechanism for in-house domain experts/reviewers to see and validate the extracted information and offer feedback to inform further model training

From a cost-optimization perspective, depending on document type and required information, only the respective Amazon Textract APIs calls are submitted. (For example, it is not worth using form/table-based Textract API calls for a Know Your Customer (KYC) document such as a driver’s license or passport when the AnalyzeID API is the most efficient solution.)

To maximize solution benefits, customers should invest time in building well-defined taxonomies ahead of using the document processing solution to accommodate their own use cases or industry domain-specific requirements. Their taxonomy input highlights only relevant keys and takes respective actions in case the requires keys are not extracted.

Vertical industry use cases

As mentioned, this document processing solution can be used across industry segments. Let’s explore some practical use cases. For example, it can help insurance industry professionals to accelerate claim processing and customer KYC-related processes. By extracting the key entities from the claim documents, mapping them against the customer defined taxonomy, and integrating with Amazon SageMaker models for anomaly detection (anomalous claims), insurance providers can improve claim management and customer satisfaction.

In the healthcare industry, the solution can help with medical records and report processing, key medical entity extraction, and customer data masking.

The document processing solution can help the banking industry by automating check processing and delivering the ability to extract key entities like payer, payee, date, and amount from the checks.

Conclusion

Manual document processing is resource-intensive, time consuming, and costly. Customers need to allocate resources to process large volume documents, lowering business agility. Their employees are performing manual “stare and compare” tasks, potentially reducing worker morale and preventing them from focusing where their efforts are better placed.

Intelligent document processing helps businesses overcome these challenges by automating the classification, extraction, and analysis of data. This expedites decision cycles, allocates resources to high-value tasks, and reduces costs.

Pre-trained APIs of AWS AI services allow for quick classification, extraction, and data analyzation from scores of documents. This solution also has industry specific features that can quickly process specialized industry specific documents. This blog discussed the foundational architecture to helps to accelerate implementation of any specific document processing use case.

How Huron built an Amazon QuickSight Asset Catalogue with AWS CDK Based Deployment Pipeline

Post Syndicated from Corey Johnson original https://aws.amazon.com/blogs/big-data/how-huron-built-an-amazon-quicksight-asset-catalogue-with-aws-cdk-based-deployment-pipeline/

This is a guest blog post co-written with Corey Johnson from Huron.

Having an accurate and up-to-date inventory of all technical assets helps an organization ensure it can keep track of all its resources with metadata information such as their assigned oners, last updated date, used by whom, how frequently and more. It helps engineers, analysts and businesses access the most up-to-date release of the software asset that bring accuracy to the decision-making process. By keeping track of this information, organizations will be able to identify technology gaps, refresh cycles, and expire assets as needed for archival.

In addition, an inventory of all assets is one of the foundational elements of an organization that facilitates the security and compliance team to audit the assets for improving privacy, security posture and mitigate risk to ensure the business operations run smoothly. Organizations may have different ways of maintaining an asset inventory, that may be an Excel spreadsheet or a database with a fully automated system to keep it up-to-date, but with a common objective of keeping it accurate. Even if organizations can follow manual approaches to update the inventory records but it is recommended to build automation, so that it is accurate at any point of time.

The DevOps practices which revolutionized software engineering in the last decade have yet to come to the world of Business Intelligence solutions. Business intelligence tools by their nature use a paradigm of UI driven development with code-first practices being secondary or nonexistent. As the need for applications that can leverage the organizations internal and client data increases, the same DevOps practices (BIOps) can drive and delivery quality insights more reliably

In this post, we walk you through a solution that Huron and manage lifecycle for all Amazon QuickSight resources across the organization by collaborating with AWS Data Lab Resident Architect & AWS Professional Services team.

About Huron

Huron is a global professional services firm that collaborates with clients to put possible into practice by creating sound strategies, optimizing operations, accelerating digital transformation, and empowering businesses and their people to own their future. By embracing diverse perspectives, encouraging new ideas, and challenging the status quo, Huron creates sustainable results for the organizations we serve. To help address its clients’ growing cloud needs, Huron is an AWS Partner.

Use Case Overview

Huron’s Business Intelligence use case represents visualizations as a service, where Huron has core set of visualizations and dashboards available as products for its customers. The products exist in different industry verticals (healthcare, education, commercial) with independent development teams. Huron’s consultants leverage the products to provide insights as part of consulting engagements. The insights from the product help Huron’s consultants accelerate their customer’s transformation. As part of its overall suite of offerings, there are product dashboards that are featured in a software application following a standardized development lifecycle. In addition, these product dashboards may be forked for customer-specific customization to support a consulting engagement while still consuming from Huron’s productized data assets and datasets. In the next stage of the cycle, Huron’s consultants experiment with new data sources and insights that in turn fed back into the product dashboards.

When changes are made to a product analysis, challenges arise when a base reference analysis gets updated because of new feature releases or bug fixes, and all the customer visualizations that are created from it also need to be updated. To maintain the integrity of embedded visualizations, all metadata and lineage must be available to the parent application. This access to the metadata supports the need for updating visuals based on changes as well as automating row and column level security ensuring customer data is properly governed.

In addition, few customers request customizations on top of the base visualizations, for which Huron team needs to create a replica of the base reference and then customize it for the customer. These are maintained by Huron’s in the field consultants rather than the product development team. These customer specific visualizations create operational overhead because they require Huron to keep track of new customer specific visualizations and maintain them for future releases when the product visuals change.

Huron leverages Amazon QuickSight for their Business Intelligence (BI) reporting needs, enabling them to embed visualizations at scale with higher efficiency and lower cost. A large attraction for Huron to adopt QuickSight came from the forward-looking API capabilities that enable and set the foundation for a BIOps culture and technical infrastructure. To address the above requirement, Huron Global Product team decided to build a QuickSight Asset Tracker and QuickSight Asset Deployment Pipeline.

The QuickSight Asset tracker serves as a catalogue of all QuickSight resources (datasets, analysis, templates, dashboards etc.) with its interdependent relationship. It will help;

  • Create an inventory of all QuickSight resources across all business units
  • Enable dynamic embedding of visualizations and dashboards based on logged in user
  • Enable dynamic row and column level security on the dashboards and visualizations based on the logged-in user
  • Meet compliance and audit requirements of the organization
  • Maintain the current state of all customer specific QuickSight resources

The solution integrates an AWS CDK based pipeline to deploy QuickSight Assets that:

  • Supports Infrastructure-as-a-code for QuickSight Asset Deployment and enables rollbacks if required.
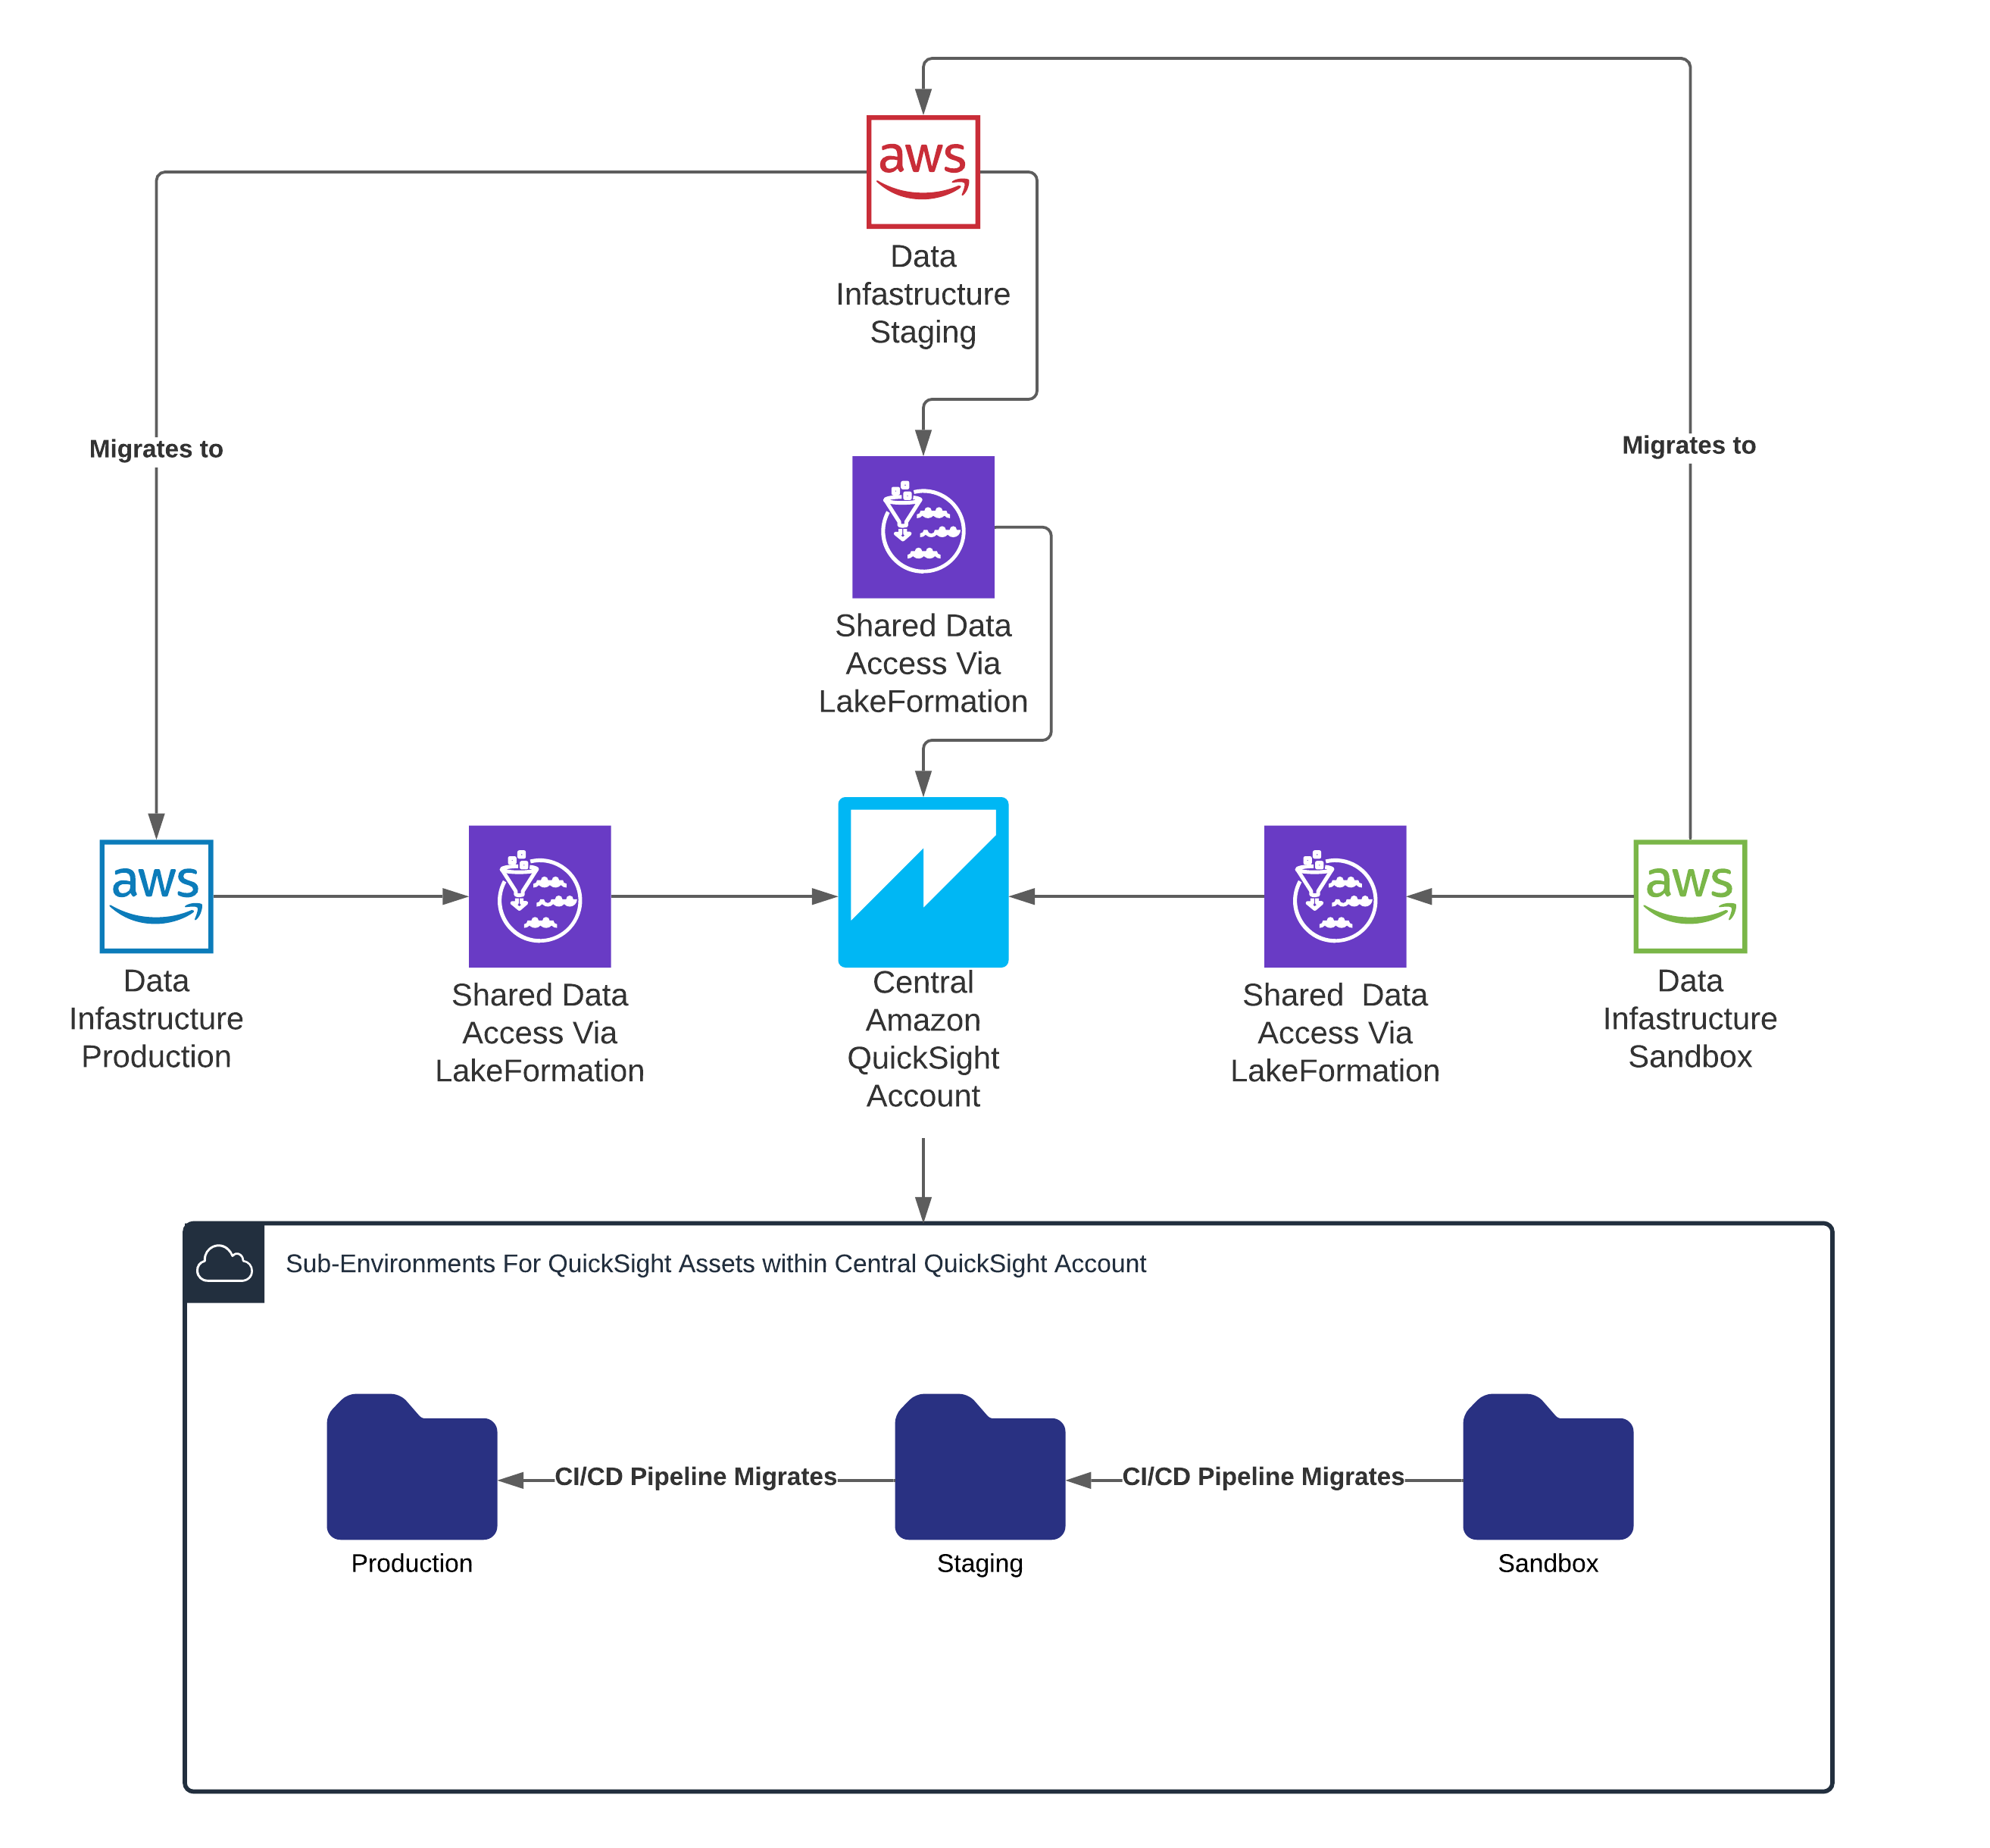
  • Enables separation of development, staging and production environments using QuickSight folders that reduces the burden of multi-account management of QuickSight resources.
  • Enables a hub-and-spoke model for Data Access in multiple AWS accounts in a data mesh fashion.

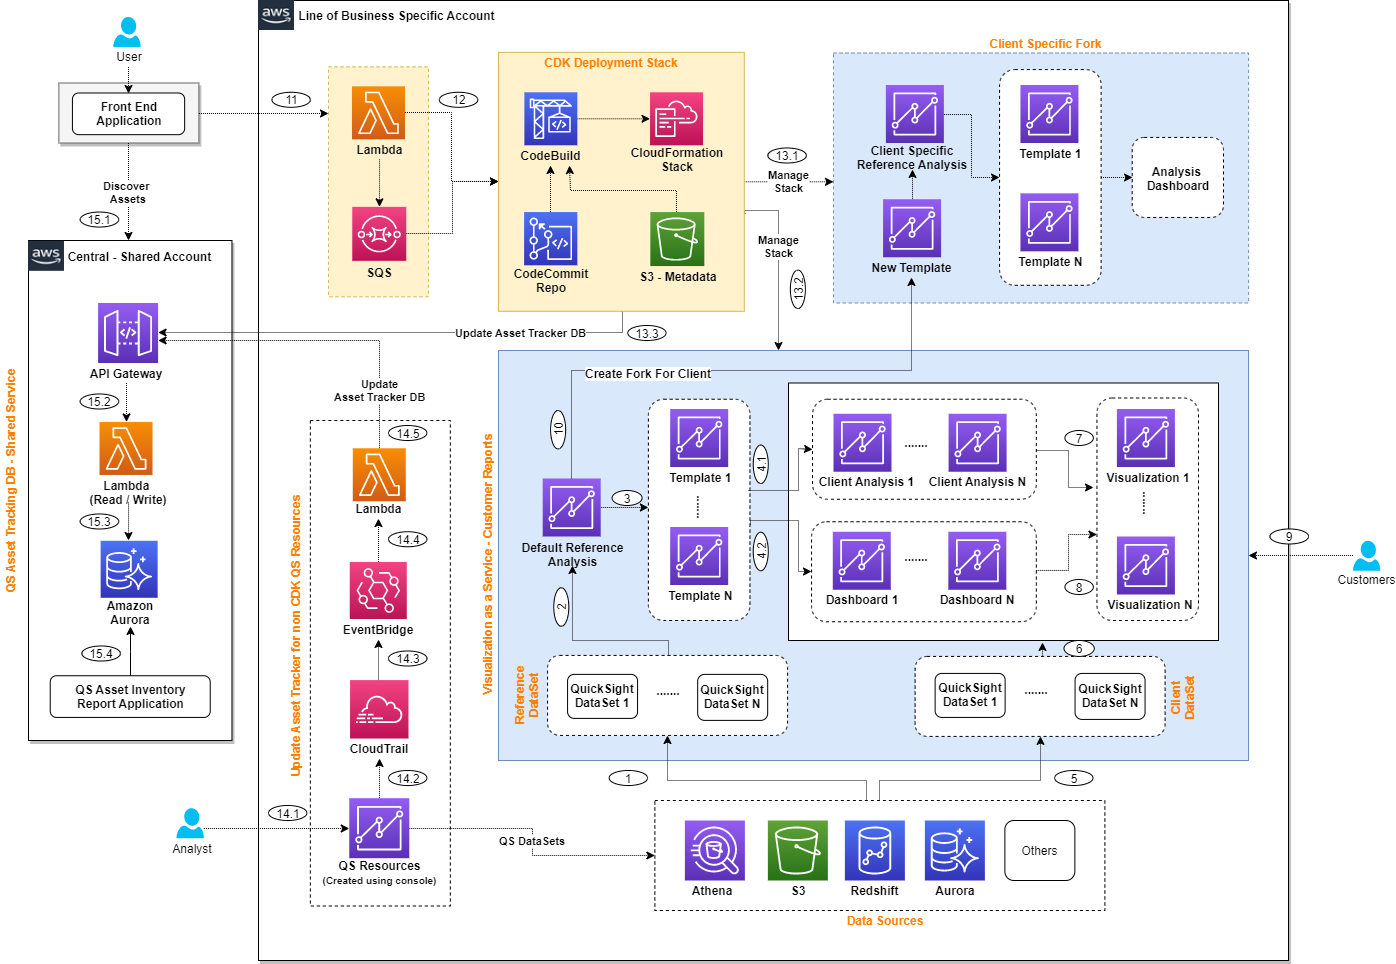
QuickSight Asset Tracker and QuickSight Asset Management Pipeline – Architecture Overview

The QuickSight Asset Tracker was built as an independent service, which was deployed in a shared AWS service account that integrated Amazon Aurora Serverless PostgreSQL to store metadata information, AWS Lambda as the serverless compute and Amazon API Gateway to provide the REST API layer.

It also integrated AWS CDK and AWS CloudFormation to deploy the product and customer specific QuickSight resources and keep them in consistent and stable state. The metadata of QuickSight resources, created using either AWS console or the AWS CDK based deployment were maintained in Amazon Aurora database through the QuickSight Asset Tracker REST API service.

The CDK based deployment pipeline is triggered via a CI/CD pipeline which performs the following functions:

  1. Takes the ARN of the QuickSight assets (dataset, analysis, etc.)
  2. Describes the asset and dependent resources (if selected)
  3. Creates a copy of the resource in another environment (in this case a QuickSight folder) using CDK

The solution architecture integrated the following AWS services.

  • Amazon Aurora Serverless integrated as the backend database to store metadata information of all QuickSight resources with customer and product information they are related to.
  • Amazon QuickSight as the BI service using which visualization and dashboards can be created and embedded into the online applications.
  • AWS Lambda as the serverless compute service that gets invoked by online applications using Amazon API Gateway service.
  • Amazon SQS to store customer request messages, so that the AWS CDK based pipeline can read from it for processing.
  • AWS CodeCommit is integrated to store the AWS CDK deployment scripts and AWS CodeBuild, AWS CloudFormation integrated to deploy the AWS resources using an infrastructure as a code approach.
  • AWS CloudTrail is integrated to audit user actions and trigger Amazon EventBridge rules when a QuickSight resource is created, updated or deleted, so that the QuickSight Asset Tracker is up-to-date.
  • Amazon S3 integrated to store metadata information, which is used by AWS CDK based pipeline to deploy the QuickSight resources.
  • AWS LakeFormation enables cross-account data access in support of the QuickSight Data Mesh

The following provides a high-level view of the solution architecture.

Architecture Walkthrough:

The following provides a detailed walkthrough of the above architecture.

  • QuickSight Dataset, Template, Analysis, Dashboard and visualization relationships:
    • Steps 1 to 2 represent QuickSight reference analysis reading data from different data sources that may include Amazon S3, Amazon Athena, Amazon Redshift, Amazon Aurora or any other JDBC based sources.
    • Step 3 represents QuickSight templates being created from reference analysis when a customer specific visualization needs to be created and step 4.1 to 4.2 represents customer analysis and dashboards being created from the templates.
    • Steps 7 to 8 represent QuickSight visualizations getting generated from analysis/dashboard and step 6 represents the customer analysis/dashboard/visualizations referring their own customer datasets.
    • Step 10 represents a new fork being created from the base reference analysis for a specific customer, which will create a new QuickSight template and reference analysis for that customer.
    • Step 9 represents end users accessing QuickSight visualizations.
  • Asset Tracker REST API service:
    • Step 15.2 to 15.4 represents the Asset Tracker service, which is deployed in a shared AWS service account, where Amazon API Gateway provides the REST API layer, which invokes AWS Lambda function to read from or write to backend Aurora database (Aurora Serverless v2 – PostgreSQL engine). The database captures all relationship metadata between QuickSight resources, its owners, assigned customers and products.
  • Online application – QuickSight asset discovery and creation
    • Step 15.1 represents the front-end online application reading QuickSight metadata information from the Asset Tracker service to help customers or end users discover visualizations available and be able to dynamically render based on the user login.
    • Step 11 to 12 represents the online application requesting creation of new QuickSight resources, which pushes requests to Amazon SQS and then AWS Lambda triggers AWS CodeBuild to deploy new QuickSight resources. Step 13.1 and 13.2 represents the CDK based pipeline maintaining the QuickSight resources to keep them in a consistent state. Finally, the AWS CDK stack invokes the Asset Tracker service to update its metadata as represented in step 13.3.
  • Tracking QuickSight resources created outside of the AWS CDK Stack
    • Step 14.1 represents users creating QuickSight resources using the AWS Console and step 14.2 represents that activity getting logged into AWS CloudTrail.
    • Step 14.3 to 14.5 represents triggering EventBridge rule for CloudTrail activities that represents QuickSight resource being created, updated or deleted and then invoke the Asset Tracker REST API to register the QuickSight resource metadata.

Architecture Decisions:

The following are few architecture decisions we took while designing the solution.

  • Choosing Aurora database for Asset Tracker: We have evaluated Amazon Neptune for the Asset Tracker database as most of the metadata information we capture are primarily maintaining relationship between QuickSight resources. But when we looked at the query patterns, we found the query pattern is always just one level deep to find who is the parent of a specific QuickSight resource and that can be solved with a relational database’s Primary Key / Foreign Key relationship and with simple self-join SQL query. Knowing the query pattern does not require a graph database, we decided to go with Amazon Aurora to keep it simple, so that we can avoid introducing a new database technology and can reduce operational overhead of maintaining it. In future as the use case evolve, we can evaluate the need for a Graph database and plan for integrating it. For Amazon Aurora, we choose Amazon Aurora Serverless as the usage pattern is not consistent to reserve a server capacity and the serverless tech stack will help reduce operational overhead.
  • Decoupling Asset Tracker as a common REST API service: The Asset Tracker has future scope to be a centralized metadata layer to keep track of all the QuickSight resources across all business units of Huron. So instead of each business unit having its own metadata database, if we build it as a service and deploy it in a shared AWS service account, then we will get benefit from reduced operational overhead, duplicate infrastructure cost and will be able to get a consolidated view of all assets and their integrations. The service provides the ability of applications to consume metadata about the QuickSight assets and then apply their own mapping of security policies to the assets based on their own application data and access control policies.
  • Central QuickSight account with subfolder for environments: The choice was made to use a central account which reduces developer friction of having multiple accounts with multiple identities, end users having to manage multiple accounts and access to resources. QuickSight folders allow for appropriate permissions for separating “environments”. Furthermore, by using folder-based sharing with QuickSight groups, users with appropriate permissions already have access to the latest versions of QuickSight assets without having to share their individual identities.

The solution included an automated Continuous Integration (CI) and Continuous Deployment (CD) pipeline to deploy the resources from development to staging and then finally to production. The following provides a high-level view of the QuickSight CI/CD deployment strategy.

Aurora Database Tables and Reference Analysis update flow

The following are the database tables integrated to capture the QuickSight resource metadata.

  • QS_Dataset: This captures metadata of all QuickSight datasets that are integrated in the reference analysis or customer analysis. This includes AWS ARN (Amazon Resource Name), data source type, ID and more.
  • QS_Template: This table captures metadata of all QuickSight templates, from which customer analysis and dashboards will be created. This includes AWS ARN, parent reference analysis ID, name, version number and more.
  • QS_Folder: This table captures metadata about QuickSight folders which logically groups different visualizations. This includes AWS ARN, name, and description.
  • QS_Analysis: This table captures metadata of all QuickSight analysis that includes AWS ARN, name, type, dataset IDs, parent template ID, tags, permissions and more.
  • QS_Dashboard: This table captures metadata information of QuickSight dashboards that includes AWS ARN, parent template ID, name, dataset IDs, tags, permissions and more.
  • QS_Folder_Asset_Mapping: This table captures folder to QuickSight asset mapping that includes folder ID, Asset ID, and asset type.

As the solution moves to the next phase of implementation, we plan to introduce additional database tables to capture metadata information about QuickSight sheets and asset mapping to customers and products. We will extend the functionality to support visual based embedding to enable truly integrated customer data experiences where embedded visuals mesh with the native content on a web page.

While explaining the use case, we have highlighted it creates a challenge when a base reference analysis gets updated and we need to track the templates that are inherited from it make sure the change is pushed to the linked customer analysis and dashboards. The following example scenarios explains, how the database tables change when a reference analysis is updated.

Example Scenario: When “reference analysis” is updated with a new release

When a base reference analysis is updated because of a new feature release, then a new QuickSight reference analysis and template needs to be created. Then we need to update all customer analysis and dashboard records to point to the new template ID to form the lineage.

The following sequential steps represent the database changes that needs to happen.

  • Insert a new record to the “Analysis” table to represent the new reference analysis creation.
  • Insert a new record to the “Template” table with new reference analysis ID as parent, created in step 1.
  • Retrieve “Analysis” and “Dashboard” table records that points to previous template ID and then update those records with the new template ID, created in step 2.

How will it enable a more robust embedding experience

The QuickSight asset tracker integration with Huron’s products provide users with a personalized, secure and modern analytics experience. When user’s login through Huron’s online application, it will use logged in user’s information to dynamically identify the products they are mapped to and then render the QuickSight visualizations & dashboards that the user is entitled to see. This will improve user experience, enable granular permission management and will also increase performance.

How AWS collaborated with Huron to help build the solution

AWS team collaborated with Huron team to design and implement the solution. AWS Data Lab Resident Architect collaborated with Huron’s lead architect for initial architecture design that compared different options for integration and deriving tradeoffs between them, before finalizing the final architecture. Then with the help of AWS Professional service engineer, we could build the base solution that can be extended by Huron team to roll it out to all business units and integrate additional reporting features on top of it.

The AWS Data Lab Resident Architect program provides AWS customers with guidance in refining and executing their data strategy and solutions roadmap. Resident Architects are dedicated to customers for 6 months, with opportunities for extension, and help customers (Chief Data Officers, VPs of Data Architecture, and Builders) make informed choices and tradeoffs about accelerating their data and analytics workloads and implementation.

The AWS Professional Services organization is a global team of experts that can help customers realize their desired business outcomes when using the AWS Cloud. The Professional Services team work together with customer’s team and their chosen member of the AWS Partner Network (APN) to execute their enterprise cloud computing initiatives.

Next Steps

Huron has rolled out the solution for one business unit and as a next step we plan to roll it out to all business units, so that the asset tracker service is populated with assets available across all business units of the organization to provide consolidated view.

In addition, Huron will be building a reporting layer on top of the Amazon Aurora asset tracker database, so that the leadership has a way to discover assets by business unit, by owner, created between specific date range or the reports that are not updated since a while.

Once the asset tracker is populated with all QuickSight assets, it will be integrated into the front-end online application that can help end users discover existing assets and request creation of new assets.

Newer QuickSight API’s such as assets-as-a-bundle and assets-as-code further accelerate the capabilities of the service by improving the development velocity and reliability of making changes.

Conclusion

This blog explained how Huron built an Asset Tracker to keep track of all QuickSight resources across the organization. This solution may provide a reference to other organizations who would like to build an inventory of visualization reports, ML models or other technical assets. This solution leveraged Amazon Aurora as the primary database, but if an organization would also like to build a detailed lineage of all the assets to understand how they are interrelated then they can consider integrating Amazon Neptune as an alternate database too.

If you have a similar use case and would like to collaborate with AWS Data Analytics Specialist Architects to brainstorm on the architecture, rapidly prototype it and implement a production ready solution then connect with your AWS Account Manager or AWS Solution Architect to start an engagement with AWS Data Lab team.


About the Authors

Corey Johnson is the Lead Data Architect at Huron, where he leads its data architecture for their Global Products Data and Analytics initiatives.

Sakti Mishra is a Principal Data Analytics Architect at AWS, where he helps customers modernize their data architecture, help define end to end data strategy including data security, accessibility, governance, and more. He is also the author of the book Simplify Big Data Analytics with Amazon EMR. Outside of work, Sakti enjoys learning new technologies, watching movies, and visiting places with family.

Let’s Architect! Getting started with containers

Post Syndicated from Luca Mezzalira original https://aws.amazon.com/blogs/architecture/lets-architect-getting-started-with-containers/

Most of AWS customers building cloud-native applications or modernizing applications choose containers to run their microservices applications to accelerate innovation and time to market while lowering their total cost of ownership (TCO). Using containers in AWS comes with other benefits, such as increased portability, scalability, and flexibility.

The combination of containers technologies and AWS services also provides features such as load balancing, auto scaling, and service discovery, making it easier to deploy and manage applications at scale.

In this edition of Let’s Architect! we share useful resources to help you to get started with containers on AWS.

Container Build Lens

This whitepaper describes the Container Build Lens for the AWS Well-Architected Framework. It helps customers review and improve their cloud-based architectures and better understand the business impact of their design decisions. The document describes general design principles for containers, as well as specific best practices and implementation guidance using the Six Pillars of the Well-Architected Framework.

Take me to explore the Containers Build Lens!

Follow Containers Build Lens Best practices to architect your containers-based workloads

Follow Containers Build Lens Best practices to architect your containers-based workloads.

EKS Workshop

The EKS Workshop is a useful resource to familiarize yourself with Amazon Elastic Kubernetes Service (Amazon EKS) by practicing on real use-cases. It is built to help users learn about Amazon EKS features and integrations with popular open-source projects. The workshop is abstracted into high-level learning modules, including Networking, Security, DevOps Automation, and more. These are further broken down into standalone labs focusing on a particular feature, tool, or use case.

Once you’re done experimenting with EKS Workshop, start building your environments with Amazon EKS Blueprints, a collection of Infrastructure as Code (IaC) modules that helps you configure and deploy consistent, batteries-included Amazon EKS clusters across accounts and regions following AWS best practices. Amazon EKS Blueprints are available in both Terraform and CDK.

Take me to this workshop!

The workshop is abstracted into high-level learning modules, including Networking, Security, DevOps Automation, and more.

The workshop is abstracted into high-level learning modules, including Networking, Security, DevOps Automation, and more.

Architecting for resiliency on AWS App Runner

Learn how to architect an highly available and resilient application using AWS App Runner. With App Runner, you can start with just the source code of your application or a container image. The complexity of running containerized applications is abstracted away, including the cloud resources needed for running your web application or API. App Runner manages load balancers, TLS certificates, auto scaling, logs, metrics, teachability and more, so you can focus on implementing your business logic in a highly scalable and elastic environment.

Take me to this blog post!

A high-level architecture for an available and resilient application with AWS App Runner.

A high-level architecture for an available and resilient application with AWS App Runner

Securing Kubernetes: How to address Kubernetes attack vectors

As part of designing any modern system on AWS, it is necessary to think about the security implications and what can affect your security posture. This session introduces the fundamentals of the Kubernetes architecture and common attack vectors. It also includes security controls provided by Amazon EKS and suggestions on how to address them. With these strategies, you can learn how to reduce risk for your Kubernetes-based workloads.

Take me to this video!

Some common attack vectors that need addressing with Kubernetes

Some common attack vectors that need addressing with Kubernetes

See you next time!

Thanks for exploring architecture tools and resources with us!

Next time we’ll talk about serverless.

To find all the posts from this series, check out the Let’s Architect! page of the AWS Architecture Blog.

Prioritizing sustainable cloud architectures: a how-to round up

Post Syndicated from Kate Brierley original https://aws.amazon.com/blogs/architecture/prioritizing-sustainable-cloud-architectures-a-how-to-round-up/

With Earth Month upon us and in celebration of Earth Day tomorrow, 4/22, sustainability is top-of-mind for individuals and organizations around the world. But it doesn’t take a certain time of year to act toward the urgent need to innovate and adopt smarter, more efficient solutions!

Sustainable cloud architectures are fundamental to sustainable workloads, and we’re spotlighting content that helps build solutions to meet and advance sustainability goals. Here’s our recent post round up to make sustainable architectures meaningful and actionable for customers of all kinds:

Architecting for Sustainability at AWS re:Invent 2022

This post spotlights the AWS re:Invent 2022 sustainability track and key conversations around sustainability of, in, and through the cloud. It covers key uses cases and breakout sessions, including AWS customers demonstrating best practices from the AWS Well-Architected Framework Sustainability Pillar. Hear about these and more:

  • The Amazon Prime Video experience using the AWS sustainability improvement process for Thursday Night Football streaming
  • Pinterest’s sustainability journey with AWS from Pinterest Chief Architect David Chaiken

David Chaiken, Chief Architect at Pinterest, describes Pinterest’s sustainability journey with AWS

Let’s Architect! Architecting for Sustainability

The most recent sustainability focused Let’s Architect! series post shares practical tips for making cloud applications more sustainable. It also covers the AWS customer carbon footprint tool to help organizations monitor, analyze, and reduce their AWS footprint, and details how Amazon Prime Video used these tools to establish baselines and drive significant efficiencies across their AWS usage.

Prime Video case study for understanding how the architecture can be designed for sustainability

Optimizing your Modern Data AWS Infrastructure for Sustainability Series

This two-part blog series explores more specific topics relating to the Sustainability Pillar of the AWS Well-Architected Framework as connected to the Modern Data Architecture on AWS. What’s covered includes:

  1. Integrating a data lake and purpose-built data services to efficiently build analytics workloads to provide speed and agility at scale in Part 1 – Data Ingestion and Data Lake
  2. Guidance and best practices to optimize the components within the unified data governance, data movement, and purpose-built analytics pillars in Part 2 – Unified Data Governance, Data Movement, and Purpose-built Analytics

Modern Data Analytics Reference Architecture on AWS

How to Select a Region for your Workload Based on Sustainability Goals

Did you know workload Region selection significantly affects KPIs including performance, cost, and carbon footprint? For example, when an AWS Region is chosen based on the market-based method, emissions are calculated using the electricity that business purchases. Contracting and purchasing electricity produced by renewable energy sources like solar and wind are more sustainable. Region selection is is another part of the Well-Architected Framework Sustainability Pillar, and this blog post covers key considerations for choosing AWS Regions per workload.

Carbon intensity of electricity for South Central Sweden

Check back soon for more earth-friendly advice from our experts!

Mitigating DDoS with data science using AWS Shield Advanced and AWS WAF

Post Syndicated from Jasmine Maheshwari original https://aws.amazon.com/blogs/architecture/mitigating-ddos-with-data-science-using-aws-shield-advanced-and-aws-waf/

This blog post helps customers in mitigating distributed denial-of-service (DDoS) using AWS Shield Advanced, AWS WAF, and data science. We explore how to use these services along with machine learning (ML) to detect and mitigate DDoS attacks.

Bad actors conduct DDoS attacks using botnets. Through botnets, attackers look for zero-day vulnerabilities—specifically on network devices such as routers—and make these devices a part of their network. Bots speared around the world are waiting for instructions from control servers.

This post examines a real-world use case. Online payment solutions company Razorpay has a business-to-business (B2B) model where merchants invoke APIs for payments. Given the complex nature of B2B payments, the traffic patterns between small-scale merchants and large-scale merchants needs to be distinguished. This business model puts the company at risk for DDoS attacks, and here is how AWS helps them address this ongoing concern.

First, we will introduce an initial DDoS architecture approach and then how it was modified to meet specific Razorpay needs, as is possible for cross-industry client with varying requirements.

Basic DDoS recommendations

Let’s explore some out-of-the-box DDoS business solution recommendations for different resource categories:

  • Static websites: Amazon CloudFront is a content delivery network (CDN) service that is used to host static websites. The AWS WAF rate-limiting rule can be used to limit traffic on a CDN.
  • Dynamic websites: In this scenario, a standard WAF Rate Limit rule can be used on Application Load Balancer (ALB).
  • APIs with customer context: APIs receive these assets on behalf of other merchants (for example, an end-user places a food order from a food-delivery application, completes a payment, and the request is sent to api.razorpay.com. Razorpay understands that the end user is trying to make a payment toward the food app).

Figure 1 represents the difficulty levels and solutions for each resource category.

DDoS business solution resource category recommendations

Figure 1. DDoS business solution resource category recommendations

DDoS response phases

We’ve discussed initial DDoS architectures, so now let’s explore the various DDoS response phases:

  • Phase 1 – Automated inventory: Creating an automated inventory system capturing the list of APIs or websites exposed. The APIs are ranked by exposure and risk of an outage to create a list of assets that is ranked on the basis of risk.
  • Phase 2 – Bucketing assets into groups: Bucketing APIs and websites (static or dynamic) into groups. This phase also subgroups the assets into unauthenticated or authenticated, users and more. As we will discuss later in this post, most Razorpay APIs have a customer context requiring a multilayered defense mechanism.
  • Phase 3 – Testing the solution: Simulating attack traffic to test the solution under different loads, origins, and more.

AWS DDoS solutions

AWS has two major out-of-the-box solutions when protecting against DDoS attacks: AWS Shield and AWS WAF.

AWS Shield has three important features for DDoS mitigation:

  1. Alarms: Triggers an alarm when a DDoS attack is suspected, customized based on metrics such as total volume, error rates at the ALB, and response latency
  2. Visibility: Provides top five important field values in real time, such as requesting client IPs, countries, user agents, referrer headers, and url routes to take action.
  3. On-call support: Provides on-call support from the Shield Response team (SRT) to understand attack vectors and create AWS WAF rules based on insights.

AWS WAF has two rule types:

  1. Blocking: Blocks requests matching expected variables, from individuals to a combination of fields such as IP, URL route, body, or country
  2. Rate limiting: Tracks the rate of requests for each originating IP address, and triggers the rule action on IPs with rates that go over the limit. A scope-down statement can also be added to the rule, to only track and rate limit requests that match the scope-down statement. (We will soon discuss how Razorpay relies heavily on rate limiting it the AWS WAF and other microservice architecture solutions.)

Razorpay microservices protection architecture

Razorpay has two main layers protecting their internal microservices. The request to payment API api.razorpay.com goes from Amazon Route 53 to ALB. AWS WAF and AWS Shield Advanced are deployed on ALB. Requests are then forwarded to microservices fronted by API Gateway as in Figure 2.

Razorpay’s internal microservices protection layers

Figure 2. Razorpay internal microservices protection layers

Razorpay API Gateway

An API Gateway is a critical piece of infrastructure for microservice architectures. Razorpay is a B2B organization that performs actions on behalf of merchants. To achieve this—and understand context about the merchants and end-users alike—a custom API Gateway:

  • Works at a high scale with very low latency
  • Understands merchant context to provide authentication and authorization
  • Provides security features around malicious traffic

Razorpay uses a self-managed API gateway called Edge. The API Gateway is the first system on the ingress path to understand Razorpay domain context that prior layers cannot. Every request goes through multiple layers of logic at the API Gateway before being forwarded to respective services.

Razorpay Edge and AWS solution insights

As Edge performs multiple computations on each request, Razorpay generates insights for each request to build intelligence and prevent DDoS attacks. These events are fed into a time-series database in near real time and generate insights using machine learning (ML) models. The insights:

  1. Identify malicious patterns: Generating confidence percentage that helps in defining further action, verifies consumer authenticity, and serves the request. It also blocks malicious requests at the edge.
  2. Derive pattern-based rate limits: Deriving rate limits based on a larger set of data—including consumer and IP address—by looking at weekly and monthly patterns.
    Once this information is available at Razorypay Edge, it can perform various operations to ensure only legit requests reach the service layer. Let’s explore the request flow to understand each stage’s contribution toward DDoS handling, as in Figure 3.
Razorpay Edge request flow for DDoS handling

Figure 3. Razorpay Edge request flow for DDoS handling

All Razorpay requests flow through API Gateway. Here are some key recommendations:

  • Based on feedback data available, the gateway checks if the given request pattern falls in the malicious category. If the confidence percentage is high for a malicious request, block the request. A block rule is applied at the AWS WAF layer. If the confidence percentage is low, use CAPTCHA to check user authenticity.
  • Apply rate limit on pre-existing data in the request object using feedback from an ML model.
  • Perform authentication/identification and authorization.
  • Apply rate limit on data derived from request object, also using feedback from a ML model.
  • Request user CAPTCHA verification if the request is identified as malicious with low confidence.

As a best practice, publish generated insights for each request to Apache Kafka out of the request flow to avoid latency impact and reduce blast radius.

Conclusion

In this post, you learned about addressing DDoS attacks with ML models.

Organizations can use the insights data generated by an API Gateway to identify request patterns, categorize the patterns into various buckets, and perform the following depending on category:

  • Send feedback to an API Gateway for immediate action
  • Update the rate limits for Edge-based historical patterns
  • Update WAF rule for blocking/reducing rate limits

As discussed, using AWS WAF and AWS Shield Advanced along with ML helps detect and mitigate DDoS attacks.

Let’s Architect! Monitoring production systems at scale

Post Syndicated from Vittorio Denti original https://aws.amazon.com/blogs/architecture/lets-architect-monitoring-production-systems-at-scale/

“Everything fails, all the time” is a famous quote from Amazon’s Chief Technology Officer Werner Vogels. This means that software and distributed systems may eventually fail because something can always go wrong. We have to accept this and design our systems accordingly, test our software and services, and think about all the possible edge cases.

With this in mind, we should also set our teams up for success by providing visibility in every environment for a quick turnaround when incidents happen. When a system serves traffic in production, we need to monitor it to make sure it behaves as expected and that all components are healthy. But questions arise such as:

  • How do we monitor a system?
  • What is monitoring?
  • What are some architectural and engineering approaches to implement in order to design a successful monitoring strategy?

All of these questions require complex answers. It’s not possible to cover everything in a blog post, but let’s start exploring the topic and sharing resources to guide you through this domain.

In this edition of Let’s Architect! we share some practices for monitoring used at Amazon and AWS, as well as more resources to discover how to build monitoring solutions for the workloads running on AWS.

Observability best practices at Amazon

Observability and monitoring are engineering tasks that also require putting a suitable cultural mindset in place. At Amazon, if a service doesn’t run as expected, the team writes a CoE (Correction of Errors) document to analyze the issue and answer critical questions to learn from it. There are also weekly operations meetings to analyze operational and performance dashboards for each service.

The session introduced here covers the full range of monitoring at Amazon, from how teams assess system health at a high level to how they understand the details of a single request. Use this resource to learn some best practices for metrics, logs, and tracing, and using these signals to achieve operational excellence.

Take me to this re:Invent video!

Observability is an iterative process which requires us to establish a feedback loop and improve based on the signals coming from the system.

Build an observability solution using managed AWS services and the OpenTelemetry standard

Visibility of what’s happening in a distributed system is key to operationalize workloads at scale. OpenTelemetry is the standard for observability and AWS services are fully integrated with that. The blog post introduced in this section shows you how AWS Distro for OpenTelemetry (ADOT) works under the hood and how to use it with a Kubernetes cluster. But keep in mind, this is just one of the many implementations available for AWS compute services and OpenTelemetry—so even if you’re not using Kubernetes right now, we’ve still got you covered!

Want more? Watch this re:Invent video for an understanding of how to think about logging, tracing, metrics, and monitoring with AWS services, and the possibilities to provide the observability your distributed systems need. This is a great learning resource with many demos and examples.

Take me to this blog post!

Flow of metrics and traces from Application services to the Observability Platform.

Optimizing your AWS Batch architecture for scale with observability dashboards

We’ve explored the mental models and strategies for monitoring in previous resources. Now let’s see how these principles can be applied in a scenario where we run batch and ML computing jobs at scale. In the blog post introduced in this section, you can learn how to use runtime metrics to understand an architecture designed on AWS Batch for running batch computing jobs. AWS Batch is a fully managed service enabling you to run jobs at any scale without needing to manage underlying compute resources. This blog explains how AWS Batch works and guides you through the process used to design a monitoring framework.

Since the solution is open-source, you are free to add other custom metrics you find useful. To get started with the AWS Batch open-source observability solution, visit the project page on GitHub. Several customers have used this monitoring tool to optimize their workload for scale by reshaping their jobs, refining their instance selection, and tuning their AWS Batch architecture.

Take me to this blog!

High-level structure of AWS Batch resources and interactions. This diagram depicts a user submitting jobs based on a job definition template to a job queue, which then communicates to a compute environment that resources are needed.

Observability workshop

This resource provides a hands-on experience for you on the variety of toolsets AWS offers to set up monitoring and observability on your applications. Whether your workload is on-premises or on AWS—or your application is a giant monolith or based on modern microservices-based architecture—the observability tools can provide deeper insights into application performance and health.

The monitoring tools covered in this workshop provide powerful capabilities that enable you to identify bottlenecks, issues, and defects without having to manually sift through various logs, metrics, and trace data.

Take me to this workshop!

The diagram illustrates the various components of the PetAdoptions architecture. In the workshop you will learn how to monitor this application.

See you next time!

Thanks for exploring architecture tools and resources with us!

Next time we’ll talk about containers on AWS.

To find all the posts from this series, check out the Let’s Architect! page of the AWS Architecture Blog.

Announcing updates to the AWS Well-Architected Framework

Post Syndicated from Haleh Najafzadeh original https://aws.amazon.com/blogs/architecture/announcing-updates-to-the-aws-well-architected-framework-2/

We are excited to announce the availability of improved AWS Well-Architected Framework guidance. In this update, we have made changes across all six pillars of the framework: Operational ExcellenceSecurityReliabilityPerformance EfficiencyCost Optimization, and Sustainability.

A brief history

The AWS Well-Architected Framework is a collection of best practices that allow customers to evaluate and improve the design, implementation, and operations of their workloads in the cloud.

In 2012, the first version of the framework was published, leading to the 2015 release of the guidance whitepaper. We added the operational excellence pillar in 2016. The pillar-specific whitepapers and AWS Well-Architected Lenses were released in 2017, and, the following year, the AWS Well-Architected Tool was launched.

In 2020, the content for the Well-Architected Framework received a major update, as well as more lenses, and API integration with the AWS Well-Architected Tool. The sixth pillar, Sustainability, was added in 2021. In 2022, dedicated pages were introduced for each consolidated best practice across all six pillars, with several best practices updated with improved prescriptive guidance.

AWS Well-Architected timeline

AWS Well-Architected timeline

What’s new

Well-Architected Framework content is consistently updated and improved in order to adapt to the constantly changing and innovating AWS environment, with new and evolved emerging services and technologies. This ensures cloud architects can build and operate secure, high-performing, resilient, efficient, and sustainable systems in the AWS Cloud.

The content updates and improvements in this release focus on providing more complete coverage across the AWS service portfolio to help customers make more informed decisions when developing implementation plans. Services that were added or expanded in coverage include: AWS Elastic Disaster Recovery, AWS Trusted Advisor, AWS Resilience Hub, AWS Config, AWS Security Hub, Amazon GuardDuty, AWS Organizations, AWS Control Tower, AWS Compute Optimizer, AWS Budgets, Amazon CodeWhisperer, and Amazon CodeGuru.

Pillar updates

The Operational Excellence Pillar has a new best practice on enabling support plans for production workloads. This Pillar also has a major update on defining a customer communication plan for outages.

In the Security Pillar, we added a new best practice area, Application Security (AppSec). AppSec is complete with eight new best practices to guide customers as they develop, test, and release software, providing guidance on how to consider the tools, testing, and organizational approach used to develop software.

The Reliability Pillar has a new best practice on architecting workloads to meet availability targets and uptime service-level agreements (SLAs). We also added the resilience shared responsibility model to its introduction section.

The Cost Optimization Pillar has new best practices on automating operations as a part of cost-optimization efforts and enforcing data-retention policies.

In the Sustainability Pillar, we introduced a clear process for selecting Regions, as well as tools for right-sizing services and improving the overall utilization of resources in the AWS Cloud.

Best practice updates

The implementation guidance and best practices have been updated in this release to be more prescriptive, including enhanced recommendations and steps on reusable architecture patterns targeting specific business outcomes in the AWS Cloud.

As many as 113 best practices are updated with more prescriptive guidance in Operational Excellence (22), Security (18), Reliability (14), Performance Efficiency (10), Cost Optimization (22), and Sustainability (27). Fourteen new best practices have been introduced in Operational Excellence (1), Security (9), Reliability (1), Cost Optimization (2), and Sustainability (1).

From a total of 127 new/updated best practices, 78% include explicit implementation steps as part of making them more prescriptive. The remaining 22% have been updated by improving their existing implementation steps. These changes are in addition to the 51 improved best practices released in 2022 (18 in Q3 2022, and 33 in Q4 2022), resulting in more than 50% of the existing Framework best practices having been updated recently.

The content is available in 11 languages: English, Spanish, French, German, Italian, Japanese, Korean, Indonesian, Brazilian Portuguese, Simplified Chinese, and Traditional Chinese.

Here is the list of best practices that are new or updated in this release:

  • Operational Excellence: OPS01-BP03, OPS01-BP04, OPS02-BP01, OPS02-BP06, OPS02-BP07, OPS03-BP04, OPS03-BP05, OPS04-BP01, OPS04-BP03, OPS04-BP04, OPS04-BP05, OPS05-BP02, OPS05-BP06, OPS05-BP07, OPS07-BP01, OPS07-BP05, OPS07-BP06, OPS08-BP02, OPS08-BP03, OPS08-BP04, OPS10-BP05, OPS11-BP01, OPS11-BP04
  • Security: SEC01-BP01, SEC01-BP02, SEC01-BP07, SEC02-BP01, SEC02-BP02, SEC02-BP03, SEC02-BP05, SEC03-BP02, SEC03-BP04, SEC03-BP07, SEC03-BP09, SEC04-BP01, SEC05-BP01, SEC06-BP01, SEC07-BP01, SEC08-BP04, SEC08-BP02, SEC09-BP02, SEC03-BP08, SEC11-BP01, SEC11-BP02, SEC11-BP03, SEC11-BP04, SEC11-BP05, SEC11-BP06, SEC11-BP07, SEC11-BP08
  • Reliability: REL01-BP01, REL01-BP02, REL01-BP03, REL01-BP04, REL01-BP06, REL02-BP01, REL09-BP01, REL09-BP02, REL09-BP03, REL09-BP04, REL10_BP04, REL10-BP03, REL11-BP07, REL13-BP02, REL13-BP03
  • Performance Efficiency: PERF02-BP06, PERF05_BP03, PERF05-BP02, PERF05-BP04, PERF05-BP05, PERF05-BP06, PERF05-BP07, PFRF04-BP04, PERF02_BP04, PERF02_BP05
  • Cost Optimization: COST02_BP01, COST02_BP02, COST02_BP03, COST02_BP05, COST03_BP02, COST03_BP04, COST03_BP05, COST04_BP01, COST04_BP02, COST04_BP03, COST04_BP04, COST04_BP05, COST05_BP03, COST05_BP05, COST05_BP06, COST06_BP01, COST06_BP03, COST07_BP01, COST07_BP02, COST07_BP05, COST09_BP03, COST10_BP01, COST10_BP02, COST11_BP01
  • Sustainability: SUS01_BP01, SUS02_BP01, SUS02_BP02, SUS02_BP03, SUS02_BP04, SUS02_BP05, SUS02_BP06, SUS03_BP01, SUS03_BP02, SUS03_BP03, SUS03_BP04, SUS03_BP05, SUS04_BP01, SUS04_BP02, SUS04_BP03, SUS04_BP04, SUS04_BP05, SUS04_BP06, SUS04_BP07, SUS04_BP08, SUS05_BP01, SUS05_BP02, SUS05_BP03, SUS05_BP04, SUS06_BP01, SUS06_BP02, SUS06_BP03, SUS06_BP04

Updates in this release are also available in the AWS Well-Architected Tool, which can be used to review your workloads, address important design considerations, and help ensure that you follow the best practices and guidance of the AWS Well-Architected Framework.

Ready to get started? Review the updated AWS Well-Architected Framework Pillar best practices, as well as pillar-specific whitepapers.

Have questions about some of the new best practices or most recent updates? Join our growing community on AWS re:Post.

Optimizing fleet utilization with Amazon Location Service and HERE Technologies

Post Syndicated from Mahesh Geeniga original https://aws.amazon.com/blogs/architecture/optimizing-fleet-utilization-with-amazon-location-service-and-here-technologies/

The fleet management market is expected to grow at a Compound Annual Growth Rate (CAGR) of 15.5 percent—from 25.5 billion US dollars in 2022 to USD 52.4 billion in 2027. Optimizing how your organization uses its vehicle fleet is important for logistics and service providers such as last mile, middle mile, and field services.

In this post, we demonstrate how to build and run a solution for many-to-many vehicle routing using HERE Tour Planning and Amazon Location Service. HERE Technologies is a data provider for Amazon Location Service and provides it with map rendering, geocoding, search, and routing. HERE Tour Planning expands on functionality such as geocoding, basic routing, and matrix routing to consider parameters such as time windows, job requirements or priorities, vehicle capabilities, range, and traffic information. They also support immediate re-planning when conditions change.

The architecture described in this post can help you optimize your fleets for delivering shipments, such as perishable items on pallets, from a central distribution center to multiple retail locations. The architecture uses the AWS Cloud Development Kit (AWS CDK) to help you provision and version control your infrastructure. The architecture also uses Event Driven Architecture (EDA) based on AWS Lambda and Amazon DynamoDB. It uses Amazon Simple Storage Service (Amazon S3) and DynamoDB to store the artifacts generated and integrates with Amazon Location Service to plot the routes visually on a map for each delivery driver.

Solution overview

This post will help you:

  • Configure the many-to-many vehicle routing architecture using HERE Tour Planning and Amazon Location Service
  • Submit a HERE Tour Planning problem
  • Generate an optimized solution file
  • Run a React app that:
    • Generates a list of routes for each vehicle in the fleet
    • Allows drivers to select and view routes in detail

The following diagram outlines how the architecture works.

Many-to-many vehicle routing architecture

Figure 1. Many-to-many vehicle routing architecture using HERE Tour Planning and Amazon Location Service

Let’s explore the steps in the diagram.

  1. The fleet operator uploads the tour requirements file to an Amazon S3 bucket.
  2. The upload invokes a Lambda function to process the new Tour Request. If the HERE API key is present, it calls the HERE Tour Planning API.
  3. The HERE Tour Planning API calculates the solution to the routing problem.
  4. The driver uses the React app to select a vehicle, which requests a route.
  5. The invoked Lambda function uses Amazon Location Service to calculate the route and render it in the React app.

Prerequisites

This walkthrough requires the following installations and resources:

  • Have an AWS account
  • Install the AWS Amplify CLI (command-line interface)
  • Install the AWS CDK CLI
  • Install the AWS CLI
    • Configure and authenticate the AWS CLI to interact with your AWS account.
  • Have your preferred integrated development environment (IDE), such as Visual Studio Code
  • Have GitHub repository access
    • git clone https://github.com/aws-samples/aws-here-optimize-fleet-utilization
  • Have a HERE API Key (optional)
    • This is needed to invoke the HERE Tour Planning API for generating solutions to new routing problems.
    • The GitHub sample repository includes a problem and pre-solved solution file, so you don’t need to acquire a HERE API key to learn about these offerings.
    • To acquire an API key, create a free account on the HERE Platform, then follow the instructions in the HERE Tour Planning documentation to create your API key.
    • There can be additional charges based on API key use. For more details, see the HERE Tour Planning section within HERE service rates.

Walkthrough

Provision the infrastructure

  1. The architecture uses NPM node modules. Run the following commands to install the dependencies:
    • # AWS Lambda function dependencies
      cd lib/lambda/calculate-route
      npm install
    • # Sample Frontend application dependencies
      cd frontend/here-driver-app
      npm install
  2. If you have never used AWS CDK in your AWS account, you must first bootstrap the solution, which creates Amazon S3 buckets and metadata to support AWS CDK operations. Note: Architectural components described in this article are covered under AWS Free Tier and HERE Free monthly usage, but additional charges can occur based on usage beyond the Free Tier limits. We recommend following the Cleanup instructions after completing the walkthrough.
      • From the root of the repository, run the following command to generate the needed infrastructure:
        • cdk bootstrap
      • Output similar to the following indicates that you successfully bootstrapped the AWS account with what AWS CDK requires.

        Successful bootstrap of AWS account with AWS CDK requirements

        Figure 2. Successful bootstrap of AWS account with AWS CDK requirements

  3. Deploy the infrastructure for this solution by running the following command. This provisions much of the infrastructure required for this solution such as DynamoDB, Lambda functions, and Amazon S3 buckets:
    • cdk deploy
  4. Next, Amplify provisions the remaining resources to complete the architecture. Navigate to the folder for the frontend by running the following command:
    • cd frontend/here-driver-app
  5. Run the following series of Amplify commands to create the remaining resources, Amazon API Gateway, Amazon Cognito, and Amazon Location Service. For additional details, see Clone sample Amplify project.
  6. To accept the defaults, run the following command:
    • amplify init
  7. To push the infrastructure out to the AWS account, run the following command:
    • amplify push
  8. To publish the environment, run the following command:
    • amplify publish

Create problem and generate architecture files

The next step is to create the HERE Tour Planning problem file and submit it to the HERE Tour Planning API to solve. Note: You can either sign up for the HERE Developer program to receive an API key to test this solution live or use the problem and pre-solved solution provided in the /data folder of the repository.

  1. Open the Amazon S3 bucket that the previous step created.
  2. Upload a problem file (in JSON format) to the bucket.
  3. An Amazon S3 event notification invokes a Lambda function that performs a synchronous call to the HERE Tour Planning API and generates vehicle routing problem solution file in JSON format.
  4. The Lambda function saves the solution file to the Amazon S3 bucket and additional details about the solution to a DynamoDB table.
  5. The delivery drivers can use the example React app to view the list of vehicles and the routes.
Creating a problem file and submitting it to HERE Tour Planning API

Figure 3. Creating a problem file and submitting it to HERE Tour Planning API

Frontend

The next step is to run the React Frontend app to see the results. Access to the app and the API Gateway is secured with Amazon Cognito.

  1. To run the web application, run the following command:
    • npm start
  2. A local web server runs on http://localhost:3000.
  3. To use the system, the user must authenticate. Amazon Cognito allows users to sign in or create a new account.
  4. After you authenticate, the Home screen displays a list of available vehicles and routes.

    Available vehicles and routes

    Figure 4. Available vehicles and routes

Choose a vehicle to see the detail of the route. Each red marker is a stop.

Vehicle route details

Figure 5. Vehicle route details

Cleanup

To avoid incurring future charges, delete all resources created.

  1. Run the following commands to delete the application in AWS Amplify. As an alternative, you can use the Amplify console to delete Amplify resources:
    • cd frontend/here-driver-app
      amplify pull
      amplify delete
  2. With AWS CDK, run the following command to delete the AWS CloudFormation stack that was used to provision the resources. Note: You can leave the AWS CLI, Amplify CLI, and CDK CLI installed on your computer for future development:
    • cdk destroy

Conclusion

In this post, using shipment delivery from a central distribution center use case, we’ve demonstrated how you can build your own serverless solution for optimizing middle and last mile operations. The solution uses multi-vehicle and multi-stop optimization services provided by HERE Tour Planning and Amazon Location Service to visualize the generated routes for each delivery vehicle driver. For additional details about HERE’s offerings on AWS Marketplace, see AWS Marketplace: HERE Technologies.

Software-defined edge architecture for connected vehicles

Post Syndicated from James Simon original https://aws.amazon.com/blogs/architecture/software-defined-edge-architecture-for-connected-vehicles/

To remain competitive in a marketplace that increasingly views transportation as a service emphasizing customer experience, vehicle capabilities and mobility applications need to improve and increase value over time, much like the internet of things and smart phones have done.

Vehicle manufacturers and fleet operators are responding to this change by using data to inform and operate their businesses, and by adopting software-defined vehicle features and capabilities. In the broader transportation community, insurance providers are evolving to usage-based insurance, which offers rates that are based on a customer’s risk profile rather than a general population. Telematics service providers are expanding their offerings to fleet operators to include machine learning (ML)-driven capabilities like driver coaching, compliance, and predictive maintenance. Rental car providers are developing apps that provide a personalized in-vehicle experience.

All of these features rely on in-vehicle data collection and processing, evolving vehicles from simple data gathering sensors to fully smart devices. To meet these demands, you can adopt cloud native architectures that use microservices, containers, and declarative application programming interfaces (APIs). This blog post explores a system architecture AWS and Luxsoft have developed together in order to help our customers reduce friction and accelerate time to market for the development, deployment and operation of edge applications required to make vehicles into smart devices.

Software-defined edge

Software is becoming more critical to vehicle function. A modern car has approximately 70-100 Electronic Control Units (ECUs), which control most core functions in the engine, transmission, Heating, ventilation, and air conditioning (HVAC) Automatic Brake System (ABS), body, and airbag hardware components. With new features such as infotainment systems, autonomous driving (AD), and advanced driver assistance systems (ADAS), modern cars use approximately 100 million lines of code, and this is increasing rapidly. ECU and software complexity produce challenges with portability of applications, this could be due to variations of the hardware, or CAN and other network communication differences, without an abstraction layer, application software must be conformed to the operating environment.

One difficulty presented by this increasing complexity and the multitude of integration points and communication interfaces at the edge is that applications typically must be re-developed, customized or at least cross-compiled to fit each hardware platform, often requiring a lengthy integration development and testing cycle for each new device. As a result, edge applications executing ML and other data-driven workloads can produce a pace that is slower than consumer expectations.

The development pace for software-defined vehicles (SDVs) relies on reusing and redeploying software applications. Software reuse is a challenge when target hardware and processing environments aren’t designed in a common way. Therefore, an early step in developing SDVs is to address these challenges at the vehicle edge, that is to say, the externally connected vehicle devices.

System architecture

To help address the challenges of creating reusable software and applications for the vehicle edge, we worked with AWS Partner DXC Luxsoft to create an end-to-end system architecture. The architecture in Figure 1 uses software-defined mobility devices at the vehicle edge to connect to multiple hardware components.

AWS Partner DXC Luxsoft to create an end-to-end system architecture

Figure 1. AWS Partner DXC Luxsoft to create an end-to-end system architecture

Let’s explore this architecture step by step.

  1. Edge application Developers check in source code to a CI/CD system for build and test. Applications are built as containers and tested on Amazon EC2 Elastic Compute Cloud (Amazon EC2) instances with target same Amazon Machine Images (AMI).
  2. Edge application containers are stored in Amazon Elastic Container Registry (Amazon ECR).
  3. Containers are registered as AWS IoT Greengrass components for target devices.
  4. Deploy edge applications to multiple target types using AWS IoT Greengrass.
  5. Data is published back to AWS through AWS IoT Core basic telemetry or AWS IoT Fleetwise.
  6. AWS IoT Core routes data to connected vehicle databases and services for further processing. Alternatively, AWS IoT Fleetwise-collected data is routed through AWS IoT Fleetwise.
  7. The Fleet Management portal allows fleet managers to view results produced by applications and services and data collected by AWS IoT Fleetwise. This can include geolocation, vehicle health, Usage Based Insurance (UBI), or other driver scores.
  8. Mobile clients can be created to allow end users and consumers to view application and service results and scores for applications like UBI.

How it works

This technology stack abstracts the specific hardware used, presenting a common run environment that you can deploy to devices that are based on ARM processors with ARM Sytem Ready firmware, including Amazon EC2 Graviton instances.

This architecture uses the following:

  • Device software stack with an ARM System Ready board support package
  • Yocto custom Linux build with the SOAFEE EWAOL layer(s) and AWS IoT Greengrass
  • Instance of the AWS IoT Fleetwise edge agent
  • Application containers for pre and post processing of data collected by AWS IoT Fleetwise or other applications

We paired this stack with AWS IoT Greengrass V2 and a container-based version of AWS IoT Fleetwise edge agent that we been modified to publish to a local broker first to allow pre and post-processing. This also makes AWS IoT Fleetwise-collected data available to other application containers running on the device. The pre- and post-processing containers prepare messages and data for use by other edge applications or exchange with the cloud services and will be available with the architecture source code.

Benefits

Because this architecture is container-based and abstracts the hardware, deploying and updating applications becomes more efficient. Because Amazon EC2 Graviton instances are ARM-based, you can deploy specific AMIs and configurations that contain this architecture’s technology stack as part of a continuous integration and continuous deployment (CI/CD) pipeline. This means that you can develop new applications and services entirely in the cloud, test them in the cloud with bit equivalent binaries and containers, and then deploy them to hardware components. This can save weeks to months of development and verification through the use of automation. The use of ARM based systems cloud native development and testing strategies can be applied, reducing the need for hardware test equipment and bringing new revenue streams and customer experiences to market at a pace that matches the current demand.

Conclusion

With this architecture, you can develop and deliver new edge processing applications to one or more vehicle device platforms. You can also develop, test, and deploy purpose-built edge compute applications as containerized AWS IoT Greengrass V2 components, including applications like Usage Based Insurance, over the air update agents, and driver distraction.

With this architecture alone in place, value can quickly be added by developing AWS IoT Fleetwise data campaigns targeting specific data required to fulfill business value for consumers, operators or fleet managers, such as vehicle battery state of charge or health indicators.

You can add value to this architecture by developing AWS IoT Fleetwise data campaigns for specific data required to fulfill business value for consumers, operators, or fleet managers. Examples of this data include vehicle battery state of charge and health indicators.

If you’re interested in creating or contributing to a common architecture that can accelerate developing and deploying edge applications to multiple hardware components, contact Connected Vehicle Tech Strategy Lead James Simon or AWS Partner DXC Luxsoft for a working demonstration or to start a proof of concept.

Creating scalable architectures with AWS IoT Greengrass stream manager

Post Syndicated from Neil Mehta original https://aws.amazon.com/blogs/architecture/creating-scalable-architectures-with-aws-iot-greengrass-stream-manager/

Designing a scalable, global, real-time, distributed system to process millions of messages from a variety of critical devices can complicate architectures. Collecting large data streams or image recognition from the edge also requires scalable solutions.

AWS IoT Core is designed to handle large numbers of Internet of things (IoT) devices sending a few messages per second. However, when IoT devices send large numbers of messages per second and processing occurs at the edge, managing large data streams is challenging. Further, data that is buffered or processed at the edge can increase latency.

This post describes how to create a scalable IoT architecture with AWS IoT Greengrass stream manager that can handle thousands of critical messages per second from a variety of IoT devices.

Relaying critical messages from high-throughput IoT devices

Let’s explore an example. Consider the architecture in Figure 1, where you have two types of IoT devices sending messages to AWS IoT Core. One set of IoT devices sends thousands of messages per second while the other set of devices sends tens of messages per second.

The IoT devices that are sending thousands of messages per second contain critical data that cannot be lost and must be processed at the edge. The IoT devices sending tens of messages per second are of less importance.

IoT devices sending messages to AWS IoT Core

Figure 1. IoT devices sending messages to AWS IoT Core

In considering this architecture, the critical IoT devices sending thousands of messages per second take the following path:

  1. IoT devices send data to an AWS IoT Greengrass component for processing with a Quality of Service (QoS) of 0.
  2. The AWS IoT Greengrass component processes the data and sends it to the AWS IoT Greengrass message broker.
  3. AWS IoT Greengrass message broker relays the data to AWS IoT Core with a QoS of 1.
  4. AWS IoT Core sends the data to Amazon Kinesis Data Streams for further processing.

In contrast, the IoT devices that send a few messages per second take the following path:

  1. IoT devices send data to the AWS IoT Greengrass message broker.
  2. The AWS IoT Greengrass message broker relays the data to AWS IoT Core.
  3. AWS IoT Core sends the data to Kinesis Data Streams for further processing.

Due to the critical nature of the messages being sent, the AWS IoT Greengrass message broker is configured to send messages to the AWS IoT Core with a QoS of 1. However, when you configure QoS to 1, the AWS IoT Greengrass message broker has to wait for an acknowledgement (ACK) before sending more data.

As you add more IoT devices, many choose to batch the messages before sending them to AWS IoT Core. This can be a good strategy when you are dealing with many IoT devices that send a small number of messages per second. But when you are adding IoT devices that send thousands of messages per second, the time waiting for an ACK can add latency and cause inconsistencies when reporting the data downstream.

This is because the AWS IoT Greengrass message broker is capable of sending 100 messages to AWS IoT Core before waiting for an ACK when QoS is set to 1. As a result, scaling this architecture to handle additional IoT devices can become challenging.

For more information about the AWS IoT Greengrass message broker’s limits, refer to the AWS IoT Core message broker and protocol limits and quotas section of the AWS General Reference Guide.

AWS IoT Greengrass stream manager for speed and reliability

To scale this type of architecture, you can use a pre-built AWS IoT Greengrass component called AWS IoT Greengrass stream manager to bypass the Greengrass message broker and AWS IoT Core to send your data directly to AWS IoT Analytics, AWS IoT SiteWise, Amazon Kinesis, or Amazon Simple Storage Service (Amazon S3).

For example, consider the earlier scenario where one set of IoT devices is sending thousands of critical messages per second and another set is sending data of less importance.

Instead, you can use AWS IoT Greengrass stream manager to create an architecture that can easily and reliably send large amounts of data from the edge directly to Kinesis, as in Figure 2.

AWS IoT Greengrass stream manager sending data directly to Kinesis

Figure 2. AWS IoT Greengrass stream manager sending data directly to Kinesis

As opposed to the Figure 1 configuration, the critical IoT devices that send thousands of messages per second can now take the following path:

  1. Critical IoT devices send data to an AWS IoT Greengrass component for processing.
  2. The AWS IoT Greengrass component processes the data and sends it to AWS IoT Core stream manager.
  3. AWS IoT Greengrass stream manager sends the data directly Amazon Kinesis Data Streams.

Note that the IoT devices sending a few messages per second can also be sent to AWS IoT Greengrass stream manager at a lower priority. You are still using AWS IoT Core, but it is no longer the main data path. By continuing to use AWS IoT Core, you can benefit from its control plane features such as managing updates, certificates, and policies. However, AWS IoT Core’s data plane features—like Rules Engine—are no longer used in this architecture, which can help reduce costs. If you choose to bypass the AWS IoT Greengrass message broker and use AWS IoT Core stream manager, any components that you have built must be moved so that processing occurs at the edge.

In the architecture in Figure 2, AWS IoT Greengrass stream manager is being used to bypass the main data path away from the AWS IoT Greengrass message broker and AWS IoT Core. Bypassing these services reduces the latency in Figure 1 caused by the AWS IoT Greengrass message broker waiting for an ACK from AWS IoT Core.

AWS IoT Greengrass stream manager can handle thousands of messages per second so you can:

  • Reliably scale your architecture
  • Create multiple data paths to send both critical and non-critical data to AWS IoT Core stream manager while still leveraging AWS IoT Core control plane features
  • Prioritize your critical data paths to have specific IoT devices take higher priority
  • Create configurations to handle situations where you have IoT devices with limited or intermittent connectivity. (For example, you can create configurations to use local storage or memory to cache your data when internet connectivity is lost, and then flush data when an ACK is received from the destination.)

All of these features can help you reduce latency, costs, data inconsistencies, and the potential loss of critical data. They also provide a mechanism to scale the number of devices that your architecture can reliably handle.

Get started with stream manager by using the AWS IoT Greengrass Core SDK or the AWS IoT console.

Conclusion

In this blog post, we discussed how to create a scalable IoT architecture that can handle thousands of critical messages per second from a variety of IoT devices. Incorporating AWS IoT Greengrass stream manager into your architecture can help reduce latency, data inconsistencies, and the potential loss of critical data by providing a way to bypass AWS IoT Core and send large amounts of data efficiently and reliably.

Let’s Architect! Streamlining business with migration and modernization

Post Syndicated from Luca Mezzalira original https://aws.amazon.com/blogs/architecture/lets-architect-streamlining-business-with-migration-and-modernization/

Many customers migrate their systems to Amazon Web Services (AWS) to increase their competitive edge and drive business value. To maximize the benefits of a cloud migration, companies tend to move their applications in conjunction with modernization initiatives. These joined efforts help your applications gain more agility, scalability, and resilience. Modernizing the portfolio of workloads with AWS means that you can re-platform, refactor, or replace these workloads by using containers, serverless technologies, purpose-built data stores, and software automation. These functionalities allow you to benefit from the best of the AWS agility and total cost optimization (TCO) benefits.

In this edition of Let’s Architect! we share hands-on activities, customer stories, and tips and tricks to migrate and modernize your applications with AWS.

Migrating to the cloud: What is the cost of doing nothing?

Would you think that small companies always migrate faster than large enterprises? Actually, cloud migration speed doesn’t necessarily depend on the size of the business! Company size is not a clear indicator of migration and modernization success, but a shift of culture and mindset is essential for successful company evolution.

When it comes to migration, the cost of doing nothing is not just financial: Businesses can also expect a slower pace of innovation and a higher security burden. This video analyzes the financial benefits of migration and shares mental models for approaching an AWS cloud migration, and Marriott team members explain how they planned their migration and the lessons learned along the way.

Take me to this re:Invent 2022 video!

Benefits of an early migration start

Benefits of an early migration start

Modernization pathways for a legacy .NET Framework monolithic application on AWS

Organizations aim to deliver the best technological solutions based on customer needs. At any stage in their cloud adoption journey, businesses often end up managing and building monolithic applications. Let’s explore a migration path for a monolithic .NET Framework application to a modern microservices-based stack on AWS, and discuss AWS tools to break the monolith into microservices and containerize applications.

Cost optimization is another key factor for modernizing your workloads and solutions include moving to Linux-based systems or using open-source database engines. This Migrate and Modernize enterprise workloads with AWS video walks you through the process of migrating and modernizing enterprise workloads with AWS.

Take me to this blog post with more detail!

A modernized microservices-based rearchitecture

A modernized microservices-based rearchitecture

Implementing a serverless-first strategy in an enterprise

Organizations of all sizes want to benefit from the agility, cost savings, and developer experience that serverless architectures can provide on AWS. For large enterprises, the return on investment (ROI) can be massive, but overcoming architecture inertia while ensuring security best practices and governance stay in place is a hurdle that many struggle with. In this lightning talk, learn how your organization can implement a serverless-first strategy to overcome these obstacles. Delta Air Lines shares the story of making serverless-first a reality as part of their AWS journey.

Take me to this video

Benefits of serverless

Benefits of serverless

Application Migration with AWS

This workshop shows you how to migrate and modernize a fictional application to the AWS Cloud by:

  1. Performing a database migration
  2. Migrating and modernizing your web server using different migration strategies (for example, breaking down the monolith into containers)
  3. Teaching you how to improve Operation excellence, Security, Performance efficiency, and Cost optimization of the deployed architecture by following these pillars of the AWS Well-Architected Framework.

Take me to this workshop!

Different migration strategies for web servers

Different migration strategies for web servers

See you next time!

Thanks for exploring architecture tools and resources with us!

Next time we’ll talk about distributed systems with containers.

To find all the posts from this series, check out the Let’s Architect! page of the AWS Architecture Blog.

How French Broadcaster TF1 Used AWS Cloud Technology and Expertise to Bring the FIFA World Cup to Millions

Post Syndicated from Sébastien Stormacq original https://aws.amazon.com/blogs/aws/how-french-broadcaster-tf1-used-aws-cloud-technology-and-expertise-to-bring-the-fifa-world-cup-to-millions/

Three years before millions of viewers saw, arguably, one of the most thrilling World Cup Finals ever broadcast, TF1, the leading private TV channel in France, started a project to redefine the foundations of its broadcasting platform, including adopting a new cloud-based architecture.

They, and all other broadcasters, have been observing diminishing audiences for traditional over-the-air broadcasting and increasing popularity of digital platforms, such as smart TVs, and boxes like FireTV, ChromeCast, and AppleTV, as well as laptops, tablets, and mobile phones. According to Thierry Bonhomme, CTO of eTF1 (the group within TF1 in charge of digital platforms) whom I recently interviewed for the AWS French Podcast, digital broadcasting now accounts for 20–25 percent of TF1’s total audience.

Image of a soccer ball in a large stadium This online and mobile usage drives very specific traffic patterns on IT systems: a huge peak of connections and authentications in the few minutes before the start of a game and millions of video streams that must be delivered reliably over a variety of changing network qualities. In addition to these technical challenges, there is also an economic challenge: to deliver advertisements at key moments, such as before a national anthem or during a 15-minute half-time. The digital platform sells its own set of commercials, which are different from the commercials broadcast over the air, and might also be different from region to region. All these video streams have to be delivered to millions of viewers on a wide range of devices and a variety of network conditions: from 1 Gbs fiber at home down to 3 G networks in remote areas.

TF1’s approach to readiness included redesigning its digital architecture, setting up metrics showing how the new system is performing, and defining processes, roles and responsibilities for people in the team. As part of this preparation, AWS helped TF1 prepare their system to meet their scalability, performance, and security requirements.

In my conversation with Thierry, he described the two main objectives the company had when designing its new technical architecture for the future of broadcasting: first, the scalability of the platform and second, meet the demand for performance. Scalability is key to absorbing the peaks of concurrent viewers. And performance is required to ensure that the video streams start quickly (in less than 3 seconds) and there is no interruption of the video player (known as re-buffering). After all, nobody wants to know their team just scored by hearing their neighbors yelling before seeing it happen on the screen they’re watching.

The Technology
Starting in 2019, TF1 started to redesign its digital broadcasting architecture and to rewrite significant parts of the code, such as the back-end API or the front-end applications running on set-top boxes, on Android, or on iOS devices. They adopted a micro service architecture, deployed on Amazon Elastic Kubernetes Service (EKS) and written in the Go programming language for maximum performance. They designed a set of REST and GraphQL APIs to define the contracts between front and back-end applications, and an event-driven architecture with Apache Kafka for maximum scalability. They adopted multiple content delivery networks, including Amazon CloudFront, to reliably distribute the video streams to client devices. In August 2020, TF1 got a chance to test the new platform on a large-scale sporting event when Bayern Munich beat Paris Saint Germain 1-0 at the UEFA European Champion League.

TF1 headquarters in paris

Here’s a peek at what happens from the moment the action is shot on the field to the moment you see it on your mobile device: The high-quality video stream first lands in the TF1 tower, located in Paris, where hardware encoders create the necessary videos streams adapted to your device. AWS Elemental Live hardware encoders are able to generate up to eight different encodings: 4K for TVs, high-definition (1080), standard definition (720), and a variety of other formats suited to a wide range of mobile devices and network bandwidth. (This extra video encoding step is one of the reasons why you might sometimes observe a extra latency between the video you receive on your traditional TV and the feed you receive on your mobile device.) The system sends the encoded videos to AWS Elemental Media Package for packaging and, finally, to the CDNs where the player applications fetch the video segments. The player applications select the best video encoding depending on your device size and current network bandwidth available.

At the end of 2021, one year before millions watched French player Kylian Mbappé score a hat trick (three goals) for the first time in a World Cup final since 1966, TF1 started preparing for the big event by identifying risks based on previous experiences and areas needing improvement. Thierry described how they built hypotheses of the likely audience size based on different game scenarios: the longer the French national team might stay in the competition, the higher the expected traffic. They classified risks for each phase of the tournament (selection pools, quarter-final, semi-final, and final). Based on these scenarios, they figured that the platform must be able to sustain 4.5 million viewers connecting to the platform 15 minutes before the start of a game (that’s 5,000 new viewers every second).

This level of scalability requires preparation from TF1’s team but also all external systems in use, such as the AWS cloud services, the authentication and authorization service, and the CDN services.

A viewer arrival triggers multiple flows and API calls. The viewer must authenticate, and some must create a new account or reset their passwords. Once authenticated, the viewer sees the homepage that, in turn, triggers multiple API calls, one of them to the catalog service. When the viewer selects a live stream, other API calls are made to receive the video stream URL. Then the video part kicks in. The client-side player connects to the chosen CDN and starts to download video segments. Once the video is playing, the platform must ensure the stream is delivered smoothly, with high quality and no drop that would cause a re-buffering. All these elements are key to ensuring the best possible viewer experience.

The Preparation
Six months before France made it to the final and squared off against Argentina, TF1 started to work closely with their vendors, including AWS, to define requirements, reserve capacity, and start to work on test and execution plans. At this point, TF1 engaged with AWS Infrastructure Event Management, a dedicated program of the AWS enterprise support plan. Our experts offer architecture and guidance and operational support during the preparation and execution of planned events, such as shopping holidays, product launches, migrations – and in this case, the largest football (soccer) event in the world. For these events, AWS helps customers assess operational readiness, identify and mitigate risks, and execute confidently with AWS experts by their side.

Special care was given to test the scalability of the API. The TF1 team developped a load-testing engine to simulate users connecting to the platform, authenticating, selecting a program, and starting a video stream. To closely simulate real traffic, TF1 used another hyperscale cloud provider to send requests to their AWS infrastructure. The testing allowed them to define the correct metrics to observe in their dashboards and the correct values to generate alarms. Thierry said the first time the load simulator ran full speed, simulating 5,000 new connections per second, it crashed the entire back end.

But like any world class team, TF1 used this to their advantage. They took 2–3 weeks to tune the system. They eliminated redundant API calls from client applications and applied aggressive caching strategies. They learned how to scale their back-end platform in response to such traffic. They also learned to identify the value of key metrics under load. After a couple of back-end deployments and new releases for their Android and iOS apps, the system successfully passed the load test. It was a month before the start of the event. At that moment, TF1 decided to freeze all new developments or deployments until the first kickoff in Qatar, unless critical bugs were found.

Monitoring and Planning
The technological platform was only one piece of the project, Thierry told me. They also designed metric dashboards using Datadog and Grafana to monitor key performance indicators and detect anomalies during the event. Thierry noted that when observing average values, they often miss parts of the picture. For example, he said, observing a P95 percentile value instead of an average shows the experience for five percent of your users. When you have three million of them, five percent represents 150K customers, so it is important to know what their experience is. (Incidentally, this percentile technique is used routinely at Amazon and AWS across all service teams, and Amazon CloudWatch has built-in support to measure percentile values.)

TF1 also prepared for the worst, he said, including the specter of having three million people staring at a black screen during a game. TF1 involved community managers and social media owners early on, and they prepared press releases and social media messages for multiple scenarios. The team also planned to gather all key team members together in a “war room” during each game to reduce communication and reaction time if something needed immediate action. This team included the AWS technical account manager, their counterpart from the authentication service, and other CDN vendors. AWS also had on-call engineers from service teams and premium support team monitoring the health of our services and ready to react in case something went wrong.

The Attacks Weren’t Just on the Field
Three key moments at the start of the tournament provided opportunities to test the platform for real: the opening ceremony, the first game, and particularly for TF1’s audience, the first game for the French team. As the tournament played out over the following weeks — with increased intensity, suspense, and load on IT systems as the French team progressed — the TF1 team would reevaluate its traffic estimates and conduct debriefs after each game. But while the intensity of the action was unfolding on the field, TF1’s team had some behind-the-scenes excitement of its own.

Starting in the quarter final, the team noticed unusual activity from a wide range of distributed IP addresses, and they determined that the system was under a large distributed denial of service (DDOS) attack from a network of compromised machines; someone was trying to take down the service and prevent millions of people from watching. TF1 is accustomed to these types of attacks, and their dashboard helped to identify the traffic patterns in real time. Services such as AWS Shield and AWS Web Application Firewall helped to mitigate the incident without impacting the viewer experience. The TF1 security team and AWS experts conducted further analysis to proactively block some patterns of traffic and IP addresses for the next game.

Still, the intensity of the attacks increased during the semi-finals and final game, when it peaked at 40 millions of requests for a ten-minute period. “These attacks are a cat-and-mouse game,” said Thierry: attackers try new strategies and apply new patterns, but the team in the war room detects them and dynamically updates the filtering rules to block them before viewers can even detect a change in the quality of the service. The long and detailed preparation served its purpose, and everybody knew what to do. Thierry reported that the attacks were successfully mitigated with no consequences.

The Thrilling Finale
France ArgentineBy the time France took to the pitch on Dec. 18, 2022, TF1 knew they would break records on the platform. Thierry said the traffic was higher than estimated, but the platform absorbed it. He also described that during the first part of the game, when Argentina was leading, the TF1 team observed a slow decline of connections… that is, until the first goal scored by MBappé 10 minutes before the end of the game. At that point, all dashboards showed a sudden return of viewers for the thrilling last moments of the game. At peak, more than 3.2 million digital players were connected at the same time, delivering 3.6 terabits per second of outgoing bandwidth through all four CDNs.
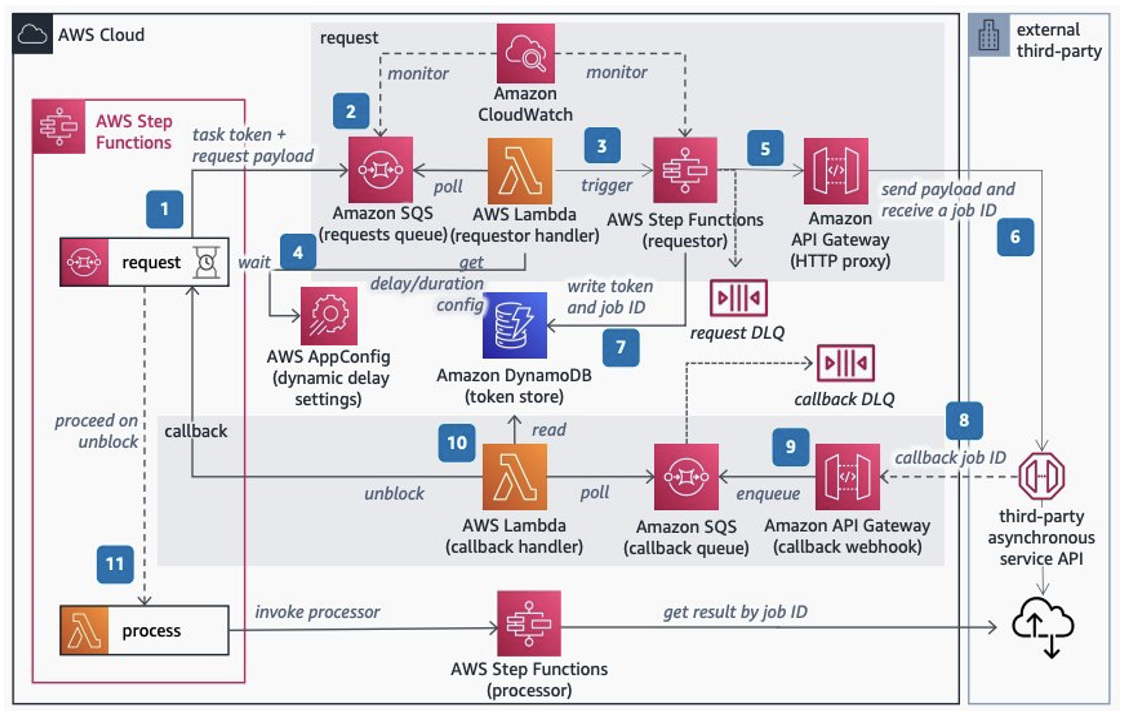
Across the globe, Amazon CloudFront also helped 18 broadcasters deliver video streams. In all, over 48 million unique client IPs connected to one of 450+ edge locations globally during the tournament, peaking at just under 23 terabits per second across these customer distributions during the final game of the tournament.

The Future
While Argentina ultimately triumphed and Lionel Messi achieved his long-sought World Cup win, the 2022 FIFA World Cup proved to the team at TF1 that their processes, their architecture, and their implementation are able to deliver a high-quality viewing experience to millions. The team is now confident the platform is ready to absorb the next planned large-scale events: the World Cup of Rugby in September 2023 and the next French presidential election in 2027. Thierry concluded our conversation predicting digital broadcasting will eventually attain a larger audience than over-the-air, and having 3+ millions simultaneous viewers will become the new normal.

If your company is also looking to transform its business using the power of cloud computing, consult with one of our AWS Enterprise support advisors today.

— seb

Invoking asynchronous external APIs with AWS Step Functions

Post Syndicated from Jorge Fonseca original https://aws.amazon.com/blogs/architecture/invoking-asynchronous-external-apis-with-aws-step-functions/

External vendor APIs can help organizations streamline operations, reduce costs, and provide better services to their customers. But many challenges exist in integrating with third-party services such as security, reliability, and cost.

Organizations must ensure their systems can handle performance issues or downtime. In some cases, calling an external API may have associated costs such as licensing fees. If a contract exists with the external API vendor to adhere to maximum Requests Per Second (RPS), the system needs to adapt accordingly.

In this blog post, we show you how to build an architecture to invoke an external vendor API using AWS Step Functions, with specific guidance on reliability.

This orchestration is applicable to any industry that relies on technology and data benefitting from external vendor API integration. Examples include e-commerce applications for online retailers integrating with third-party payment gateways, shipping carriers, or applications in the healthcare and banking sectors.

Invoking asynchronous external APIs overview

This solution outlines the use of AWS services to build an orchestrator controlling the invocation rate of third-party services that implement the service callback pattern to process long-running jobs. This architecture is also available in the AWS Reference Architecture Diagrams section of the AWS Architecture Center.

As in Figure 1, the architecture gives you the control to feed your calls to an external service according to its maximum RPS contract using Step Functions capabilities. Step Functions pauses main request workflows until you receive a callback from the external system indicating job completion.

Invoking Asynchronous External APIs architecture

Figure 1. Invoking Asynchronous External APIs architecture

Let’s explore each step.

  1. Set up Step Functions to handle the lifecycle of long-running requests to the third party. Inside the workflow, add a request step that pauses it using waitForTaskToken as a callback to continue. Set a timeout to throw a timeout error if a callback isn’t received.
  2. Send the task token and request payload to an Amazon Simple Queue Service (Amazon SQS) queue. Use Amazon CloudWatch to monitor its length. Consider adjusting the contract with the third-party service if the queue length grows beyond a soft limit determined on the maximum RPS with the third party.
  3. Use AWS Lambda to poll Amazon SQS and trigger an express Step Functions workflow. Control the invocation rate of Lambda using polling batch size, reserved concurrency, and maximum concurrency, discussed in more detail later in the blog.
  4. Optionally, add dynamic delay inside Lambda controlled by AWS AppConfig if the system still needs a lower invocation rate to comply with the contracted RPS.
  5. Step Functions invokes an Amazon API Gateway HTTP proxy API configured with rate limit to comply with the contracted RPS. API Gateway is a safeguard proxy to make sure your system is not breaking the RPS contract while dynamically adjusting the invocation rate parameters.
  6. Invoke the external third-party asynchronous service API sending the payload consumed from the requests queue and receiving the jobID from the service. Send failed requests to the Dead Letter Queue (DLQ) using Amazon SQS.
  7. Store the main workflow’s task token and jobID from the third-party service in an Amazon DynamoDB table. This is used as a mapping to correlate the jobID with the task token.
  8. When the external service completes, receive the completed jobID in a callback webhook endpoint implemented with API Gateway.
  9. Transform the external callbacks with API Gateway mapping templates, add the payload and jobID to an Amazon SQS queue, and respond immediately to the caller.
  10. Use Lambda to poll the callback Amazon SQS queue, then query the token stored. Use the token to unblock the waiting workflow by calling SendTaskSuccess and the callback DLQ to store failed messages.
  11. On the main workflow, pass the jobID to the next step and invoke a Step Functions processor to fetch the third-party results. Finally, process the external service’s results.

Controlling external API invocation rates

To comply with third-party RPS contracts, adopt a mechanism to control your system’s invocation rate. The rate of polling the messages from the request Amazon SQS (or step 3 in the architecture) directly impacts your invocation rate.

Different parameters can be used to control the invocation rate for Lambda with Amazon SQS as its trigger “event source,” such as:

  1. Batch size: The number of records to send to the function in each batch. For a standard queue, this can be up to 10,000 records. For a first-in, first-out (FIFO) queue, the maximum is 10. Using batch size on its own will not limit the invocation rate. It should be used in conjunction with other parameters such as reserved concurrency or maximum concurrency.
  2. Batch window: The maximum amount of time to gather records before invoking the function, in seconds. This applies only to standard queues.
  3. Maximum concurrency: Sets limits on the number of concurrent instances of the function that an Amazon SQS event source can invoke. Maximum concurrency is an event source-level setting.

Trigger configuration is shown in Figure 2.

Configuration parameters for triggering Lambda

Figure 2. Configuration parameters for triggering Lambda

Other Lambda configuration parameters can also be used to control the invocation rate, such as:

  1. Reserved concurrency: Guarantees the maximum number of concurrent instances for the function. When a function has reserved concurrency, no other function can use that concurrency. This can be used to limit and reduce the invocation rate.
  2. Provisioned concurrency: Initializes a requested number of execution environments so that they are prepared to respond immediately to your function’s invocations. Note that configuring provisioned concurrency incurs charges to your AWS account.

These additional Lambda configuration parameters are shown here in Figure 3.

Lambda concurrency configuration options - Reserved and Provisioned

Figure 3. Lambda concurrency configuration options – Reserved and Provisioned

Maximizing your external API architecture

During this architecture implementation, consider some use cases to ensure that you are building a mature orchestrator.

Let’s explore some examples:

  • If the external system fails to respond to the API request in step 8, a timeout exception will occur at step 1. A sensible timeout should be configured in the main state machine in step 1. The timeout value should consider the maximum response time of the external system.

The Error handling capabilities in Step Functions section of the AWS Step Functions Developer Guide provides the ability to implement your own logic for different error types. Configure timeout errors using the States.Timeout error state.

  • Dynamic delay inside the Lambda function—as mentioned in step 4—should only be used temporarily for burst traffic. If the external party has a very low RPS contract, consider other alternatives to introduce delay.

For example, Amazon EventBridge Scheduler can be used to trigger the Lambda function at regular intervals to consume the messages from Amazon SQS. This avoids costs for the idle/waiting state of your Lambda functions.

Conclusion

This blog post discusses how to build end-to-end orchestration to manage a request’s lifecycle, five different parameters to control invocation rate of third-party services, and throttle calls to external service API per maximum RPS contract.

We also consider use cases on using error handling capabilities in Step Functions and monitor systems with CloudWatch. In addition, this architecture adopts fully managed AWS Serverless services, removing the undifferentiated heavy lifting in building highly available, reliable, secure, and cost-effective systems in AWS.

Genomics workflows, Part 5: automated benchmarking

Post Syndicated from Rostislav Markov original https://aws.amazon.com/blogs/architecture/genomics-workflows-part-5-automated-benchmarking/

Launching and running genomics workflows can take hours and involves large pools of compute instances that process data at a petabyte scale. Benchmarking helps you evaluate workflow performance and discover faster and cheaper ways of running them.

In practice, performance evaluations happen irregularly because of the associated heavy lifting. In this blog post, we discuss how life-science research teams can automate evaluations.

Business Benefits

An automated benchmarking solution provides:

  • more accurate enterprise resource planning by performing historical analytics,
  • lower cost to the business by comparing performance on different resource types, and
  • cost transparency to the business by quantifying periodical chargeback.

We’ve used automated benchmarking to compare processing times on different services such as Amazon Elastic Compute Cloud (Amazon EC2), AWS Batch, AWS ParallelCluster, Amazon Elastic Kubernetes Service (Amazon EKS), and on-premises HPC clusters. Scientists, financiers, technical leaders, and other stakeholders can build reports and dashboards to compare consumption data by consumer, workflow type, and time period.

Design pattern

Our automated benchmarking solution measures performance on two dimensions:

  • Timing: measures the duration of a workflow launch on a specific dataset
  • Pricing: measures the associated cost

This solution can be extended to other performance metrics such as iterations per second or process/thread distribution across compute nodes.

Our requirements include the following:

  • Consistent measurement of timing based on workflow status (such as preparing, waiting, ready, running, failed, complete)
  • Extensible pricing models based on unit prices (the Amazon EC2 Spot price at a specific period of time compared to Amazon EC2 On-Demand pricing)
  • Scalable, cost-efficient, and flexible data store enabling historical benchmarking and estimations
  • Minimal infrastructure management overhead

We choose a serverless design pattern using AWS Step Functions orchestration, AWS Lambda for our application code, and Amazon DynamoDB to track workflow launch IDs and states (as described in Part 3). We assume that the genomics workflows run on AWS Batch with genomics data on Amazon FSx for Lustre (Part 1). AWS Step Functions allows us to break down processing into smaller steps and avoid monolithic application code. Our evaluation process runs in four steps:

  1. Monitor for completed workflow launches in the DynamoDB stream using an Amazon EventBridge pipe with a Step Functions workflow as target. This event-driven approach is more efficient than periodic polling and avoids custom code for parsing status and cost values in all records of the DynamoDB stream.
  2. Collect a list of all compute resources associated with the workflow launch. Design a Lambda function that queries the AWS Batch API (see Part 1) to describe compute environment parameters like the Amazon EC2 instance IDs and their details, such as processing times, instance family/size, and allocation strategy (for example, Spot Instances, Reserved Instances, On-Demand Instances).
  3. Calculate the cost of all consumed resources. We achieve this with another Lambda function, which calculates the total price based on unit prices from the AWS Price List Query API.
  4. Our state machine updates the total price in the DynamoDB table without the need for additional application code.

Figure 1 visualizes these steps.

Automated benchmarking of genomics workflows

Figure 1. Automated benchmarking of genomics workflows

Implementation considerations

AWS Step Functions orchestrates our benchmarking workflow reliably and makes our application code easy to maintain. Figure 2 summarizes the state machine transitions that we’ll describe.

AWS Step Functions state machine for automated benchmarking

Figure 2. AWS Step Functions state machine for automated benchmarking

Gather consumption details

Configure the DynamoDB stream view type to New image so that the entire item is passed through as it appears after it was changed. We set up an Amazon EventBridge pipe with event filtering and the DynamoDB stream as a source. Our event filter uses multiple matching on records with a status of COMPLETE, but no cost entry in order to avoid an infinite loop. Once our state machine has updated the DynamoDB item with the workflow price, the resulting record in the DynamoDB stream will not pass our event filter.

The syntax of our event filter is as follows:

{
  "dynamodb": {
    "NewImage": {
      "status": {
        "S": ["COMPLETE"]
      },
      "totalCost": {
        "S": [{
          "exists": false
        }]
      }
    }
  }
}

We use an input transformer to simplify follow-on parsing by removing unnecessary metadata from the event.

The consumed resources included in the stream record are the auto-scaling group ID for AWS Batch and the Amazon FSx for Lustre volume ID. We use the DescribeJobs API (describe_jobs in Boto3) to determine which compute resources were used. If the response is a list of EC2 instances, we then look up consumption information including start and end times using the ListJobs API (list_jobs in Boto3) for each compute node. We use describe_volumes with filters on the identified EC2 instances to obtain the size and type of Amazon Elastic Block Store (Amazon EBS) volumes.

Calculate prices

Another Lambda function obtains the associated unit prices of all consumed resources using the GetProducts request of AWS Price List Query API (get_products in Boto3) and then parsing the pricePerUnit value. For Spot Instances, we use describe_spot_price_history of the EC2 client in Boto3 and specify the time range and instance types for which we want to receive prices.

Calculate the price of workflow launches based on the following factors:

  • Number and size of EC2 instances in auto-scaling node groups
  • Size of EBS volumes and Amazon FSx for Lustre
  • Processing duration

Our Python-based Lambda function calculates the total, rounds it, and delivers the price breakdown in the following format:

total_cost: str, instance_cost: str, volume_cost: str, filesystem_cost: str

Lastly, we put the price breakdown to the DynamoDB table using UpdateItem directly from the Amazon States Language.

Note that AWS credits and enterprise discounts might not be reflected in the responses of the AWS Price List Query API unless applied to the particular AWS account. This is often considered best practice in light of least-privilege considerations.

In the past, we’ve also used AWS Cost Explorer instead of the AWS Price List API. AWS Cost Explorer data is updated at least once every 24 hours. You can denote the pending price status in the DynamoDB table item and use the Wait state to delay the calculation process.

The presented solution can be extended to other compute services such as Amazon Elastic Kubernetes Service (Amazon EKS). For Amazon EKS, events are enriched with the cluster ID from the DynamoDB table and the price calculation should also include control plane costs.

Conclusion

Life-science research teams use benchmarking to compare workflow performance and inform their architectural decisions. Such evaluations are effort-intensive and therefore done irregularly.

In this blog post, we showed how life-science research teams can automate benchmarking for their scientific workflows. The insights teams gain from automated benchmarking indicate continuous optimization opportunities, such as by adjusting compute node configuration. The evaluation data is also available on demand for other purposes including chargeback.

Stay tuned for our next post in which we show how to use historical benchmarking data for price estimations of future workflow launches.

Related information

Accelerating revenue growth with real-time analytics: Poshmark’s journey

Post Syndicated from Mahesh Pasupuleti original https://aws.amazon.com/blogs/big-data/accelerating-revenue-growth-with-real-time-analytics-poshmarks-journey/

This post was co-written by Mahesh Pasupuleti and Gaurav Shah from Poshmark.

Poshmark is a leading social marketplace for new and secondhand styles for women, men, kids, pets, home, and more. By combining the human connection of physical shopping with the scale, ease, and selection benefits of Ecommerce, Poshmark makes buying and selling simple, social, and sustainable. Its community of more than 80 million registered users across the US, Canada, Australia, and India is driving a more sustainable future for the fashion industry.

An important goal to achieve for any organization is to grow the top line revenue. Top line revenue refers to the total value of sales of an organization’s services or products. The two main approaches organizations employ to increase revenue are to expand geographically to enter new markets and to increase market share within a market by improving customer experience (CX).

Improving CX is a well-known guideline to attract and retain customers and thereby increase the market share. In this post, we share how Poshmark improved CX and accelerated revenue growth by using a real-time analytics solution. We discuss how to create such a solution using Amazon Kinesis Data Streams, Amazon Managed Streaming for Kafka (Amazon MSK), Amazon Kinesis Data Analytics for Apache Flink; the design decisions that went into the architecture; and the observed business benefits by Poshmark.

High-level challenge: The need for real-time analytics

Previous efforts at Poshmark for improving CX through analytics were based on batch processing of analytics data and using it on a daily basis to improve CX. Although these batch analytics-based efforts were successful to some extent, they saw opportunities to improve the customer experience with real-time personalization and security guidance during the customer’s interaction with the Poshmark app. The customer insights gathered from the batch analytics couldn’t be paired with the current customer activities in real time due to the latencies involved in enriching the current activities with the knowledge gained through batch processes. Therefore, the opportunity to provide tailored offers or showcase products based on customers’ preference and behaviors in near-real time, which contributes to a much better customer experience, was missing. Similarly, the opportunity to catch fraud within a second, before checkout, was also missing.

To improve the customer experience, Poshmark decided to invest in building a real-time analytics platform to enable real-time capabilities, as explained further in this post. Poshmark engineers worked closely with AWS architects through the AWS Data Lab program. The AWS Data Lab offers accelerated, joint engineering engagements between customers and AWS technical resources to create tangible deliverables that accelerate data and analytics modernization initiatives. The Design Lab is one half to two day engagement with customer team offering prescriptive guidance to arrive at the optimal solution architecture design before you embark on building the platform.

Designing the solution architecture through the AWS Data Lab process

The business and technical stakeholders from Poshmark and the AWS Data Lab architects discussed near-to-long-term business requirements along with the functional and non-functional capabilities required to decide on the architecture approach. They reviewed the current state architecture and constraints to understand data flow and technical integration points. The joint team discussed the pros and cons of various AWS services that already exist in Poshmark’s current architecture, as well as other AWS services that can meet the requirements.

Poshmark wanted to address the following business use cases via the real-time analytics platform:

  • Sessionization – Poshmark captures both server-side application events and client-side tracking events. They wanted to use these events to identify and analyze user sessions to track behavior.
  • Illegitimate sign-up and sign-in prevention – Poshmark wanted to detect and ban illegitimate sign-up or sign-in events from bots or non-human traffic in real time on the Poshmark application.
  • IP translation – The IP addresses present in events will be translated to city, state, and zip, and enriched with other information to implement near-real-time, location-aware services encompassing security-related functions as well as personalization functions.
  • Anonymization – Poshmark wanted to anonymize events and make the data available for internal users for querying in near-real time.
  • Personalized recommendations – User behavior based on clickstream events can be captured up to the last second before enriching it for personalization and sending it to the model to predict the recommendations.
  • Other use cases – Additional use cases relating to aggregations and machine learning (ML) inference use cases such as authorization to operate, listing spam detection, and avoiding account takeovers (ATOs), among others.

One common pattern identified for these use cases was the need for a central data enrichment pipeline to enrich incoming raw events before event data can be utilized for actual business processing. In the Design Lab, we focused on design for data enrichment pipelines aimed at enriching events with data from static files, dynamic data stores such as databases, APIs, or within the same event stream for the aforementioned streaming use cases. Later in this post, we cover the salient points discussed during the lab around design and architecture.

Batch analytics solution architecture

The following diagram shows the previous architecture at Poshmark. For brevity, only the flow pertaining to the real-time analytics platform is explained.

User interactions on Poshmark web and mobile applications generate server-side events. These events include add to cart, orders, transactions, and more on application servers, and the page view, clicks, and more on tracking servers. Fluentd with an Amazon Kinesis plugin is set up on both the application and tracking servers to send these events to Amazon Kinesis Data Streams. The Fluentd Kinesis plugin aggregates events before sending to Kinesis Data Streams. A single Kinesis data stream is currently set up to capture these events. A random partition key is configured in Fluentd for the events to allow even distribution of events across shards. The event data format is nested JSON. Poshmark maintains the same schema grammar at the first level of JSON for both server-side and client-side server events. The attributes at nested level can differ between server-side and client-side events.

Poshmark receives around 1 billion events per day (100 million per hour during peak hours, 10 million per hour during non-peak hours). The average size of the event record is 1.2 KB.

The data from the Kinesis data stream is consumed by two applications:

  • A Spark streaming application on Amazon EMR is used to write data from the Kinesis data stream to a data lake hosted on Amazon Simple Storage Service (Amazon S3) in a partitioned way. The data from the S3 data lake is used for batch processing and analytics through Amazon EMR and Amazon Redshift.
  • Druid hosted on Amazon Elastic Compute Cloud (Amazon EC2) integrates with the Kinesis data stream for streaming ingestion and allows users to run slice-and-dice OLAP queries. Operational dashboards are hosted on Grafana integrated with Druid.

Desired enhancements to the initial solution

The use cases discussed during the architecture sessions fall into one or more combinations of the following stream processing requirements:

  • Stateless event processing – For example, near-real-time anonymization.
  • External lookup – Looking up a value from external stores. For example, IP address, city, zip, state, or ID.
  • Stateful data processing – Accessing past events or aggregations or ML inferences.

To meet these requirements, the streaming platform is divided into two layers:

  • Central data enrichment – This layer runs enrichments commonly required by downstream streaming applications. This will help avoid replication of the same enrichment logic in each application and enable better operational maintenance. The enrichment should strive for per-record processing in most cases.
  • Specific streaming applications – This layer will house specific streaming applications with respect to use cases and utilize enriched data from the central data enrichment pipeline.

For central data enrichment, we made the following enhancements to the platform:

  • The total latency including ingestion and data enrichment was super critical and should be in the range of double-digit millisecond latency based on the overall latency budget of Poshmark to achieve real-time ML responses to events. The absolute lowest ingestion latency was achieved by Kafka, and the team decided to go with the managed version of Kafka, Amazon MSK.
  • Similarly, low-latency processing of data is also required, and appropriate framework should be considered accordingly.
  • Exactly-once delivery guarantees were required to avoid data duplication resulting in wrong calculations.
  • The enrichment source could be any source such as static files, databases, and APIs and latencies can vary between them. A number of server-side and client-side events are generated when a user interacts with a Poshmark application. As a result, the same information from the enrichment source is required to enrich each event. This frequently accessed information cached in a centralized cache will optimize fetch time.

Design decisions for the new solution

Poshmark made the following design decisions for central data enrichment:

  • Kafka can support double-digit millisecond latency from producer to consumer with appropriate performance tuning. Kafka can provide exactly-once semantics both at producers and consumer applications. AWS provides Kafka as part of its Amazon MSK offering, eliminating the operational overhead of maintaining and running Kafka cluster infrastructure on AWS, thereby allowing you to focus on developing and running Kafka-based applications. Poshmark decided to use Amazon MSK for their streaming ingestion and storage requirements.
  • We also decided to use Flink for streaming data enrichment applications for the following reasons:
    • Flink can provide low-latency processing even at higher throughput with exactly-once guarantees. Spark Structured Streaming on the other hand can provide low latency with low throughput due to microbatch-based processing. Spark Structured Streaming continuous processing is an experimental feature and provides at-least once guarantees.
    • The enrichment requests call to an external store if modeled in a map function (Spark’s map API or Flink’s MapFunction API) will make synchronous calls to the external store. The call will wait for a response from the external store before processing the next event, adding to delays and reducing overall throughput. The asynchronous interaction will allow sending requests and receiving responses concurrently from external stores. This will reduce wait time and improve overall throughput. Flink supports async I/O operators natively, allowing users to use asynchronous request clients with data streams. The API handles the integration with data streams, well as handling order, event time, fault tolerance, and more. Spark Structured Streaming doesn’t provide any such support natively and leaves it to users for custom implementation.
    • Poshmark selected Kinesis Data Analytics for Apache Flink to run the data enrichment application. Kinesis Data Analytics for Apache Flink provides the underlying infrastructure for your Apache Flink applications. It handles core capabilities like provisioning compute resources, parallel computation, automatic scaling, and application backups (implemented as checkpoints and snapshots).
  • An enrichment microservice accompanying Amazon ElastiCache for Redis was set up to abstract access from data enrichment applications. The AsyncFunction in the Flink async I/O operator isn’t multi-threaded and won’t work in a truly asynchronous way if the call is blocked or waiting for a response. The enrichment microservice handles requests and responses asynchronously coming from Flink async I/O operators. The data is also cached in ElastiCache for Redis to improve the latency of the microservice.
  • The Poshmark ML applications are the consumers of this enriched data. The team has built and deployed different ML models over time. These models include a learning to rank algorithm, fraud detection, personalization and recommendations, and online spam filtering. Previously, for deploying each model into production, the Poshmark team had to go through a series of infrastructure setup steps that involved data extraction from real-time sources, building real-time aggregate features from streaming data, storing these features in a low-latency database (Redis) for sub-millisecond inferences, and finally performing inferences via Amazon SageMaker hosted endpoints.
  • We also designed an ML feature storage pipeline that consumes data from the enriched streaming sources (Kinesis or Kafka), generate single-level and aggregated-level features, and ingest these generated features into a feature store repository with a very low latency of less than 80 milliseconds.
  • The ML models are now able to extract the needed features with latency less than 10 milliseconds from the feature repository and perform real-time model inferencing.

Real-time analytics solution architecture

The following diagram illustrates the solution architecture for real-time analytics with Amazon MSK and Kinesis Data Analytics for Apache Flink.

The workflow is as follows:

  1. Users interact on Poshmark’s web or mobile application.
  2. Server-side events are captured on application servers and client-side events are captured on tracking servers. These events are written in the downstream MSK cluster.
  3. The raw events will be ingested into the MSK cluster using the Fluentd plugin to produce data for Kafka.
  4. The enrichment microservice consists of reactive (asynchronous) enrichment lookup APIs fetching data from persistent data stores. ElastiCache for Redis caches frequently accessed data, reducing fetch time for enrichment lookup APIs.
  5. The Flink application running on Kinesis Data Analytics for Apache Flink consumes raw events from Amazon MSK and runs data enrichment on a per-record basis. The Flink data enrichment application uses Flink’s async I/O to read external data from the enrichment lookup store for enriching stream events.
  6. Enriched events are written in the MSK cluster under different enriched events topics.
  7. The existing Spark streaming application consumes from the enriched events topic (or raw events topic) in Amazon MSK and writes the data into an S3 data lake.
  8. Druid streaming ingestion now reads from the enriched events topic or raw events topic in Amazon MSK depending on the requirements.

Enrichment of the captured event data

In this section, we discuss the different steps to enrich the captured event data.

Enrichment processing

Kinesis Data Analytics for Apache Flink provides the underlying infrastructure for the Apache Flink applications. It handles core capabilities like provisioning compute resources, parallel computation, automatic scaling, and application backups (implemented as checkpoints and snapshots). You can use the high-level Flink programming features (such as operators, functions, sources, and sinks) in the same way that you use them when hosting the Flink infrastructure yourself.

Flink on Amazon EMR gives the flexibility to choose your Flink version, installation, configuration, instances, and storage. However, you also have to take care of cluster management and operational requirements such as scaling, application backup, and provisioning.

Enrichment lookup store

The AsyncFunction in the Flink async I/O operator isn’t multi-threaded and won’t work in a truly asynchronous way if the call is blocked or waiting for a response. The enrichment lookup API should handle requests and responses asynchronously coming from Flink async I/O operators. The enrichment lookup API can be hosted on Amazon EC2 or containers such as Amazon Elastic Container Service (Amazon ECS) or Amazon Elastic Kubernetes Service (Amazon EKS).

A number of server-side and client-side events are generated when a user interacts with a Poshmark application. As a result, the same information is required to enrich each event. This frequently accessed information cached in a centralized cache can optimize fetch time. The latency to the centralized cache can be further reduced by hosting the client (enrichment lookup API) and cache server in the same Availability Zone.

Reconciliation in case of pipeline errors

The event enrichment can fail in data enrichment applications for various reasons, such as the external store timing out or missing information in the store. The enriched fields may or may not be critical for downstream streaming applications. You should build your downstream streaming applications considering that these failures can occur and implement a fallback mechanism, for example retrying on-demand enrichment from the application. The failure handling will also be governed by latency tolerance of the application.

The processing of data is based on event time. In some situations, data can arrive late in the platform. Both Flink and Spark allow lateness and watermarks for users to handle late-arriving data by defining thresholds. Late-arriving data beyond the threshold is discarded from processing. It’s possible to get this discarded too-late data in Flink using a side output. There is no such provision in Spark Structured Streaming.

A few streaming applications require their batch counterpart to reconcile data hourly or daily to handle data mismatch or data discrepancy due to late-arriving data or missing data.

Improved customer experience

The new real-time architecture offered the following benefits for an improved customer experience:

  • Anonymization – Poshmark is now able to provide and utilize real-time anonymized data for multiple functions both internally and externally because anonymization happens in real time.
  • Fraud mitigation – Poshmark was previously able to detect and prevent 45% of ATOs with the batch-based solution. With the real-time system, Poshmark is able to prevent 80% of ATOs.
  • Personalization – By providing personalized search results, Poshmark achieved an 8% improvement on clickthrough rates for search. This is a significant increase in the top of the funnel, increasing overall search conversions.

Improvement in these three factors helped end-customers gain confidence in the Poshmark app and website, which in turn enabled customers to increase their interaction with the app and helped accelerate customer engagement and growth.

Conclusion

In this post, we discussed the ingestion of real-time clickstream and log event data into Amazon MSK. We showed how enrichment of the captured data can be performed through Kinesis Data Analytics for Apache Flink. We broke up the enrichment processing into multiple components, such as Kinesis Data Analytics for Apache Flink, the enrichment microservices and the enrichment lookup store, and an enrichment cache. We discussed the downstream applications that used this enriched customer information to perform real-time security checks and offer personalized recommendations to end-users. We also discussed some of the areas that may need attention in case there are failures in the pipeline. Lastly, we showed how Poshmark improved their customer experience and gained market share by implementing this real-time analytics pipeline.


About the authors

Mahesh Pasupuleti is a VP of Data & Machine Learning Engineering at Poshmark. He has helped several startups succeed in different domains, including media streaming, healthcare, the financial sector, and marketplaces. He loves software engineering, building high performance teams, and strategy, and enjoys gardening and playing badminton in his free time.

Gaurav Shah is Director of Data Engineering and ML at Poshmark. He and his team help build data-driven solutions to drive growth at Poshmark.

Raghu Mannam is a Sr. Solutions Architect at AWS in San Francisco. He works closely with late-stage startups, many of which have had recent IPOs. His focus is end-to-end solutioning including security, DevOps automation, resilience, analytics, machine learning, and workload optimization in the cloud.

Deepesh Malviya is Solutions Architect Manager on the AWS Data Lab team. He and his team help customers architect and build data, analytics, and machine learning solutions to accelerate their key initiatives as part of the AWS Data Lab.