Our customers use Cloudflare Calls, Stream, and Images to build live, interactive, and real-time experiences for their users. We want to reduce friction by making it easier to get data into our products. This also means providing transparent pricing, so customers can be confident that costs make economic sense for their business, especially as they scale.
Today, we’re introducing four new improvements to help you build media applications with Cloudflare:
Cloudflare Calls is in open beta with transparent pricing
Cloudflare Stream has a Live Clipping API to let your viewers instantly clip from ongoing streams
Cloudflare Images has a pre-built upload widget that you can embed in your application to accept uploads from your users
Cloudflare Images lets you crop and resize images of people at scale with automatic face cropping
Build real-time video and audio applications with Cloudflare Calls
Cloudflare Calls is now in open beta, and you can activate it from your dashboard. Your usage will be free until May 15, 2024. Starting May 15, 2024, customers with a Calls subscription will receive the first terabyte each month for free, with any usage beyond that charged at $0.05 per real-time gigabyte. Additionally, there are no charges for inbound traffic to Cloudflare.
Live Instant Clipping: create clips from live streams and recordings
Live broadcasts often include short bursts of highly engaging content within a longer stream. Creators and viewers alike enjoy being able to make a “clip” of these moments to share across multiple channels. Being able to generate that clip rapidly enables our customers to offer instant replays, showcase key pieces of recordings, and build audiences on social media in real-time.
Today, Cloudflare Stream is launching Live Instant Clipping in open beta for all customers. With the new Live Clipping API, you can let your viewers instantly clip and share moments from an ongoing stream – without re-encoding the video.
When planning this feature, we considered a typical user flow for generating clips from live events. Consider users watching a stream of a video game: something wild happens and users want to save and share a clip of it to social media. What will they do?
First, they’ll need to be able to review the preceding few minutes of the broadcast, so they know what to clip. Next, they need to select a start time and clip duration or end time, possibly as a visualization on a timeline or by scrubbing the video player. Finally, the clip must be available quickly in a way that can be replayed or shared across multiple platforms, even after the original broadcast has ended.
That ideal user flow implies some heavy lifting in the background. We now offer a manifest to preview recent live content in a rolling window, and we provide the timing information in that response to determine the start and end times of the requested clip relative to the whole broadcast. Finally, on request, we will generate on-the-fly that clip as a standalone video file for easy sharing as well as an HLS manifest for embedding into players.
Live Instant Clipping is available in beta to all customers starting today! Live clips are free to make; they do not count toward storage quotas, and playback is billed just like minutes of video delivered. To get started, check out the Live Clipping API in developer documentation.
Integrate Cloudflare Images into your application with only a few lines of code
Building applications with user-uploaded images is even easier with the upload widget, a pre-built, interactive UI that lets users upload images directly into your Cloudflare Images account.
Many developers use Cloudflare Images as an end-to-end image management solution to support applications that center around user-generated content, from AI photo editors to social media platforms. Our APIs connect the frontend experience – where users upload their images – to the storage, optimization, and delivery operations in the backend.
But building an application can take time. Our team saw a huge opportunity to take away as much extra work as possible, and we wanted to provide off-the-shelf integration to speed up the development process.
With the upload widget, you can seamlessly integrate Cloudflare Images into your application within minutes. The widget can be integrated in two ways: by embedding a script into a static HTML page or by installing a package that works with your favorite framework. We provide a ready-made Worker template that you can deploy directly to your account to connect your frontend application with Cloudflare Images and authorize users to upload through the widget.
Optimize images of people with automatic face cropping for Cloudflare Images
Cloudflare Images lets you dynamically manipulate images in different aspect ratios and dimensions for various use cases. With face cropping for Cloudflare Images, you can now crop and resize images of people’s faces at scale. For example, if you’re building a social media application, you can apply automatic face cropping to generate profile picture thumbnails from user-uploaded images.
Our existing gravity parameter uses saliency detection to set the focal point of an image based on the most visually interesting pixels, which determines how the image will be cropped. We expanded this feature by using a machine learning model called RetinaFace, which classifies images that have human faces. We’re also introducing a new zoom parameter that you can combine with face cropping to specify how closely an image should be cropped toward the face.
As we’re working to build the next set of media tools, we’d love to hear what you’re building for your users. Come say hi to us on Discord. You can also learn more by visiting our developer documentation for Calls, Stream, and Images.
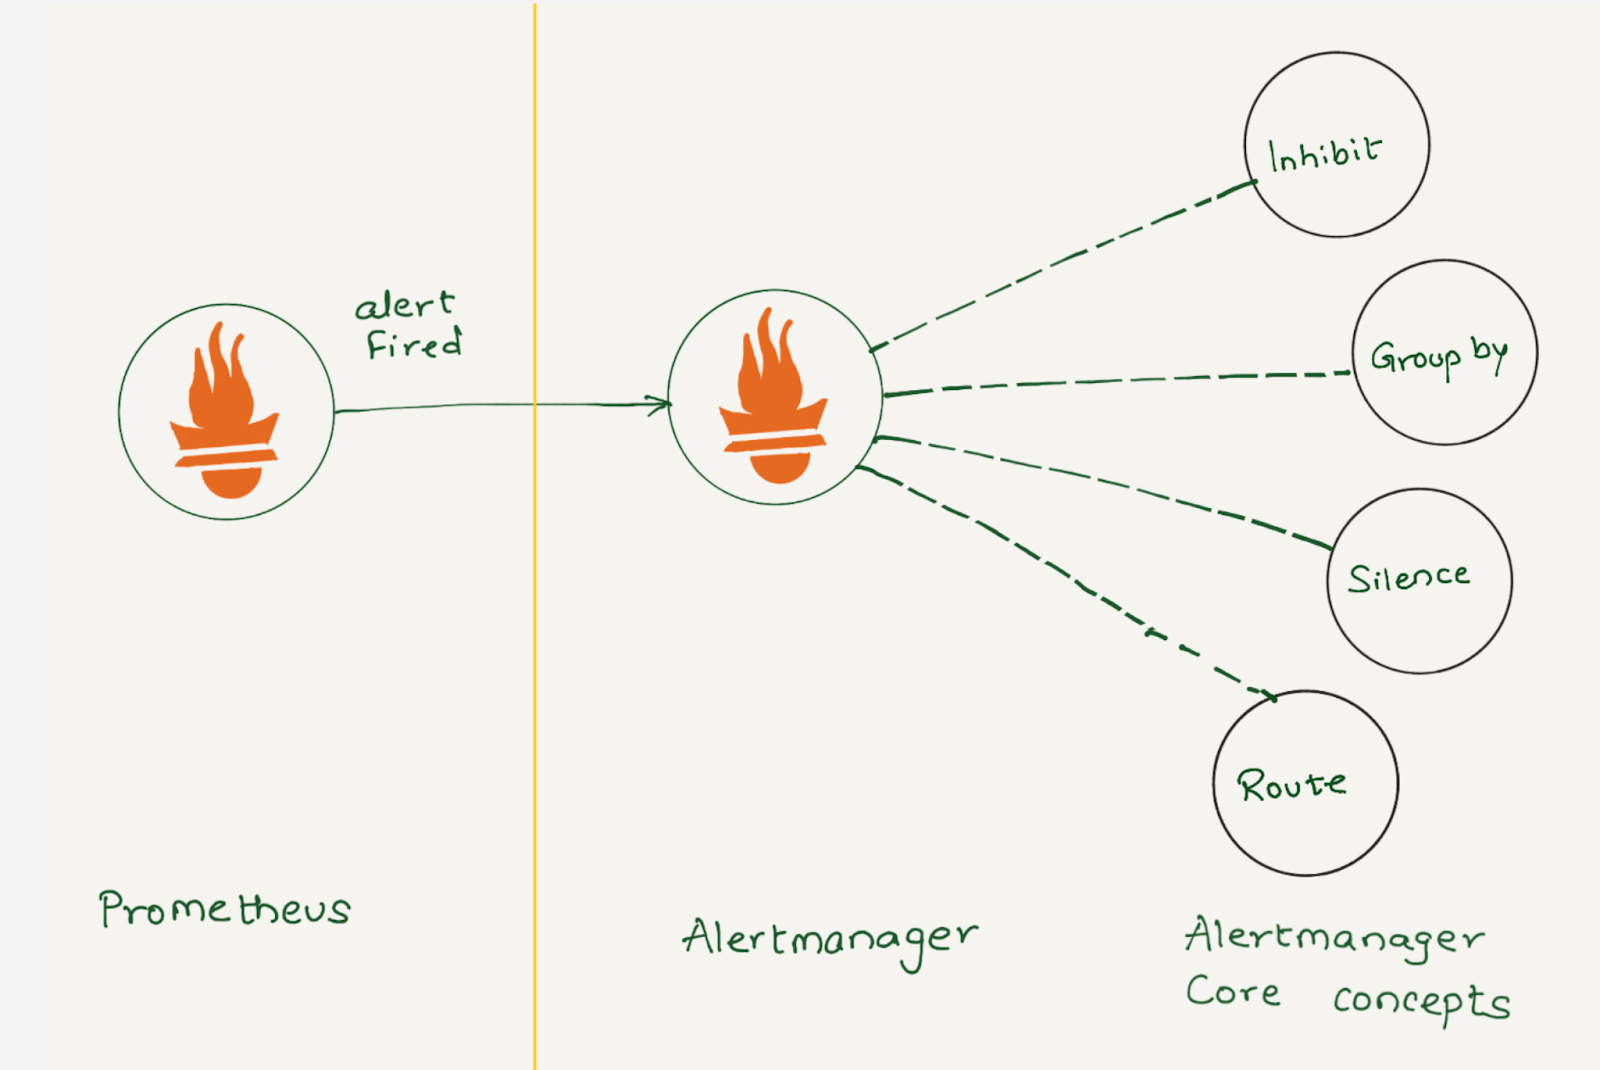
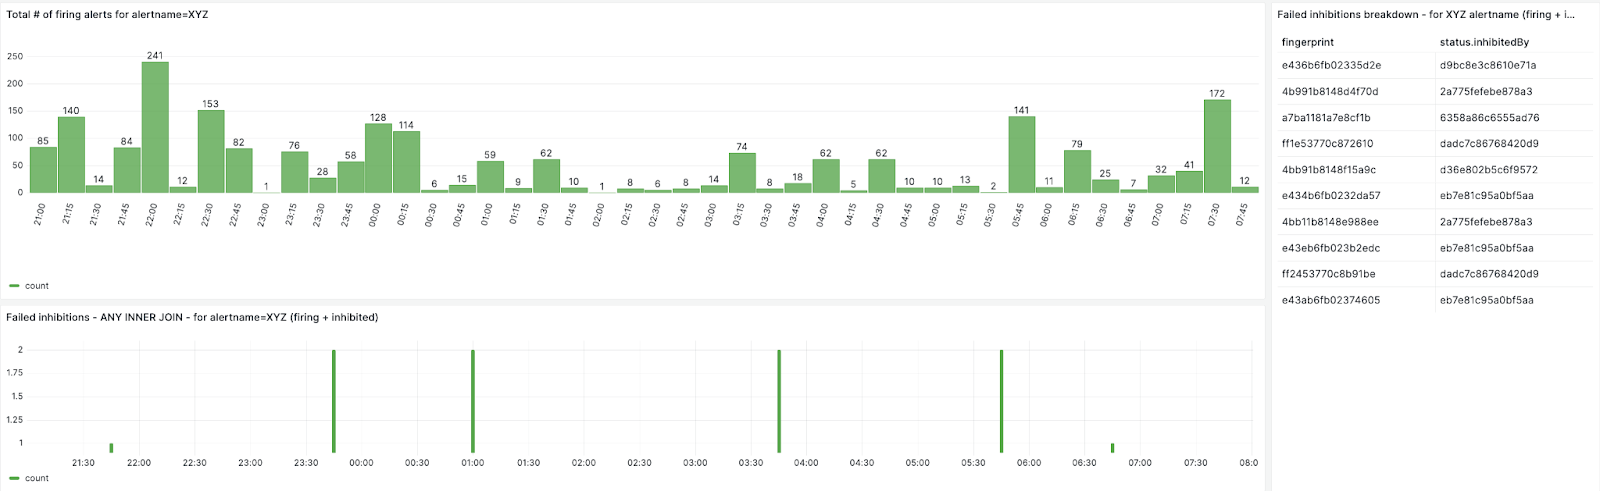
Following its initial announcement in September 2022, Cloudflare Calls is now in open beta and available in your Cloudflare Dashboard. Cloudflare Calls lets developers build real-time audio/video apps using WebRTC, and it abstracts away the complexity by turning the Cloudflare network into a singular SFU. In this post, we dig into how we make this possible.
WebRTC growing pains
WebRTC is the only way to send UDP traffic out of a web browser – everything else uses TCP.
As a developer, you need a UDP-based transport layer for applications demanding low latency and real-time feedback, such as audio/video conferencing and interactive gaming. This is because unlike WebSocket and other TCP-based solutions, UDP is not subject to head-of-line blocking, afrequenttopic on the Cloudflare Blog.
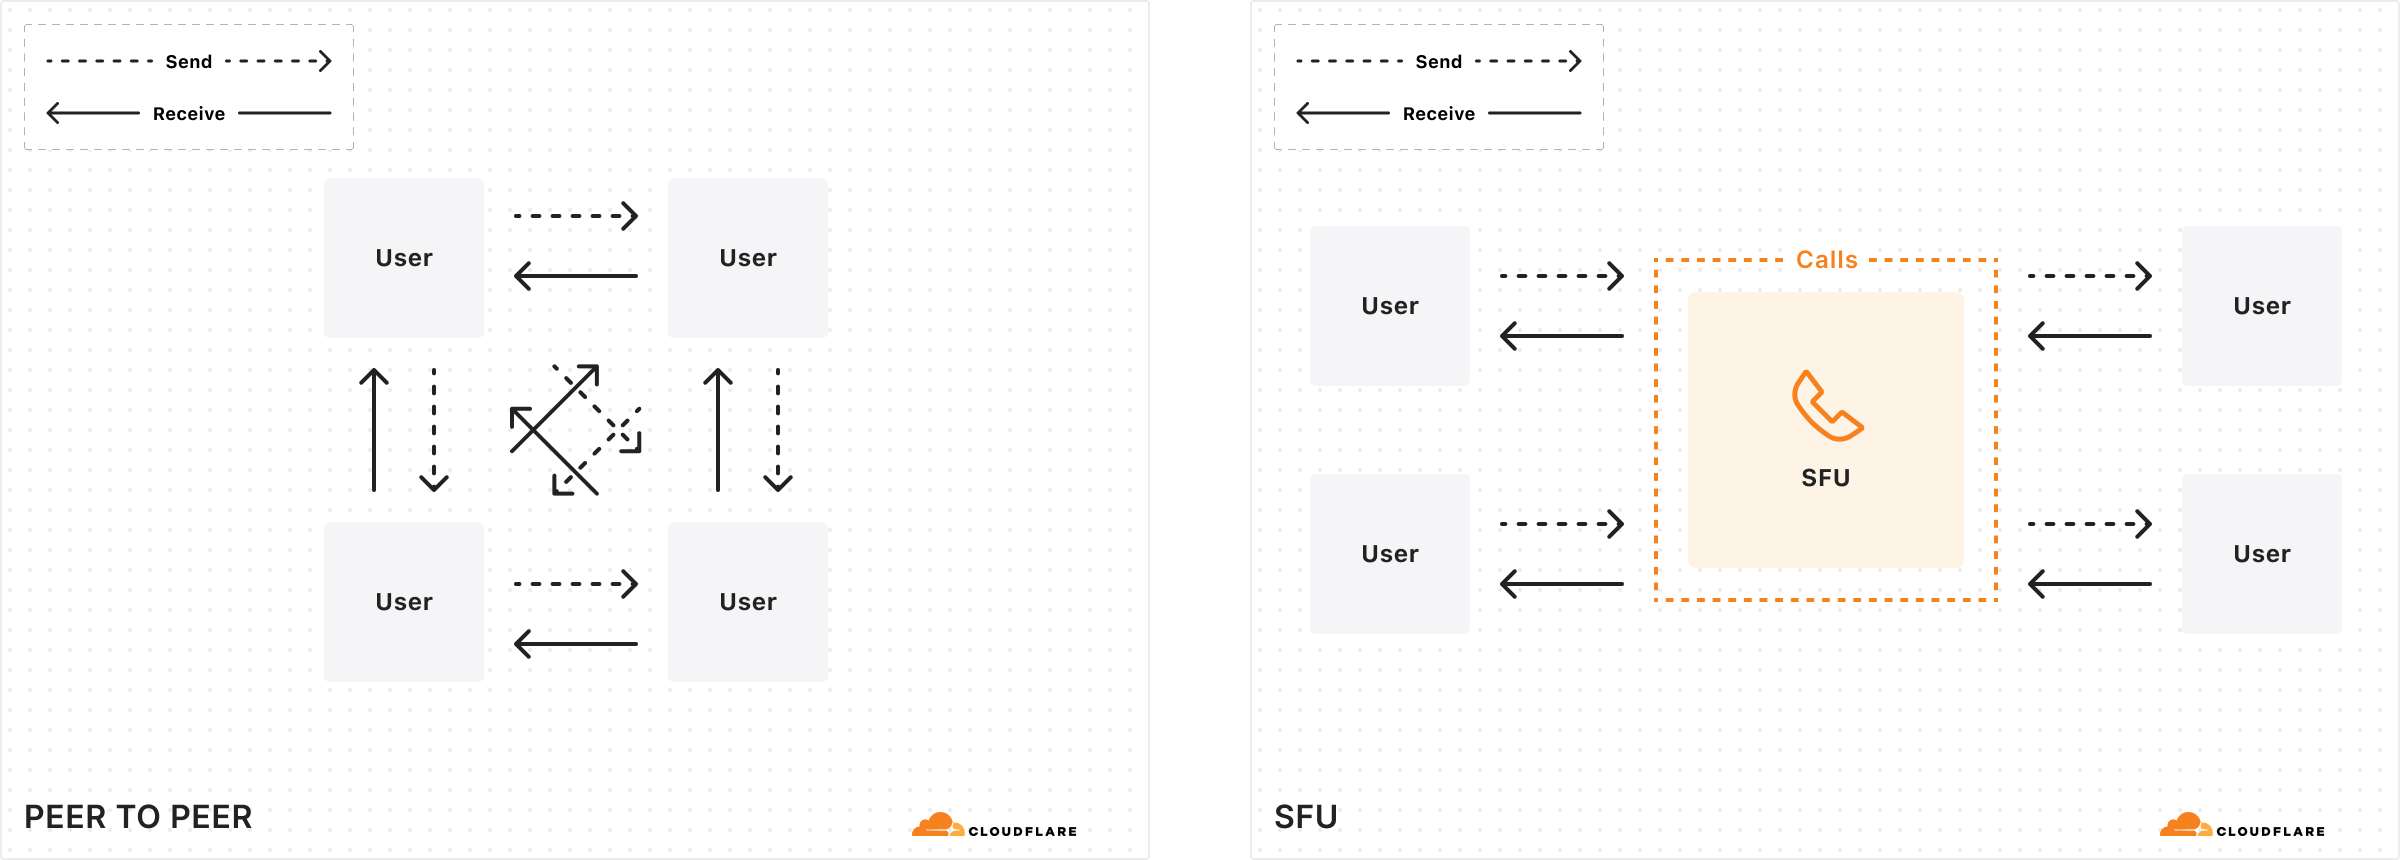
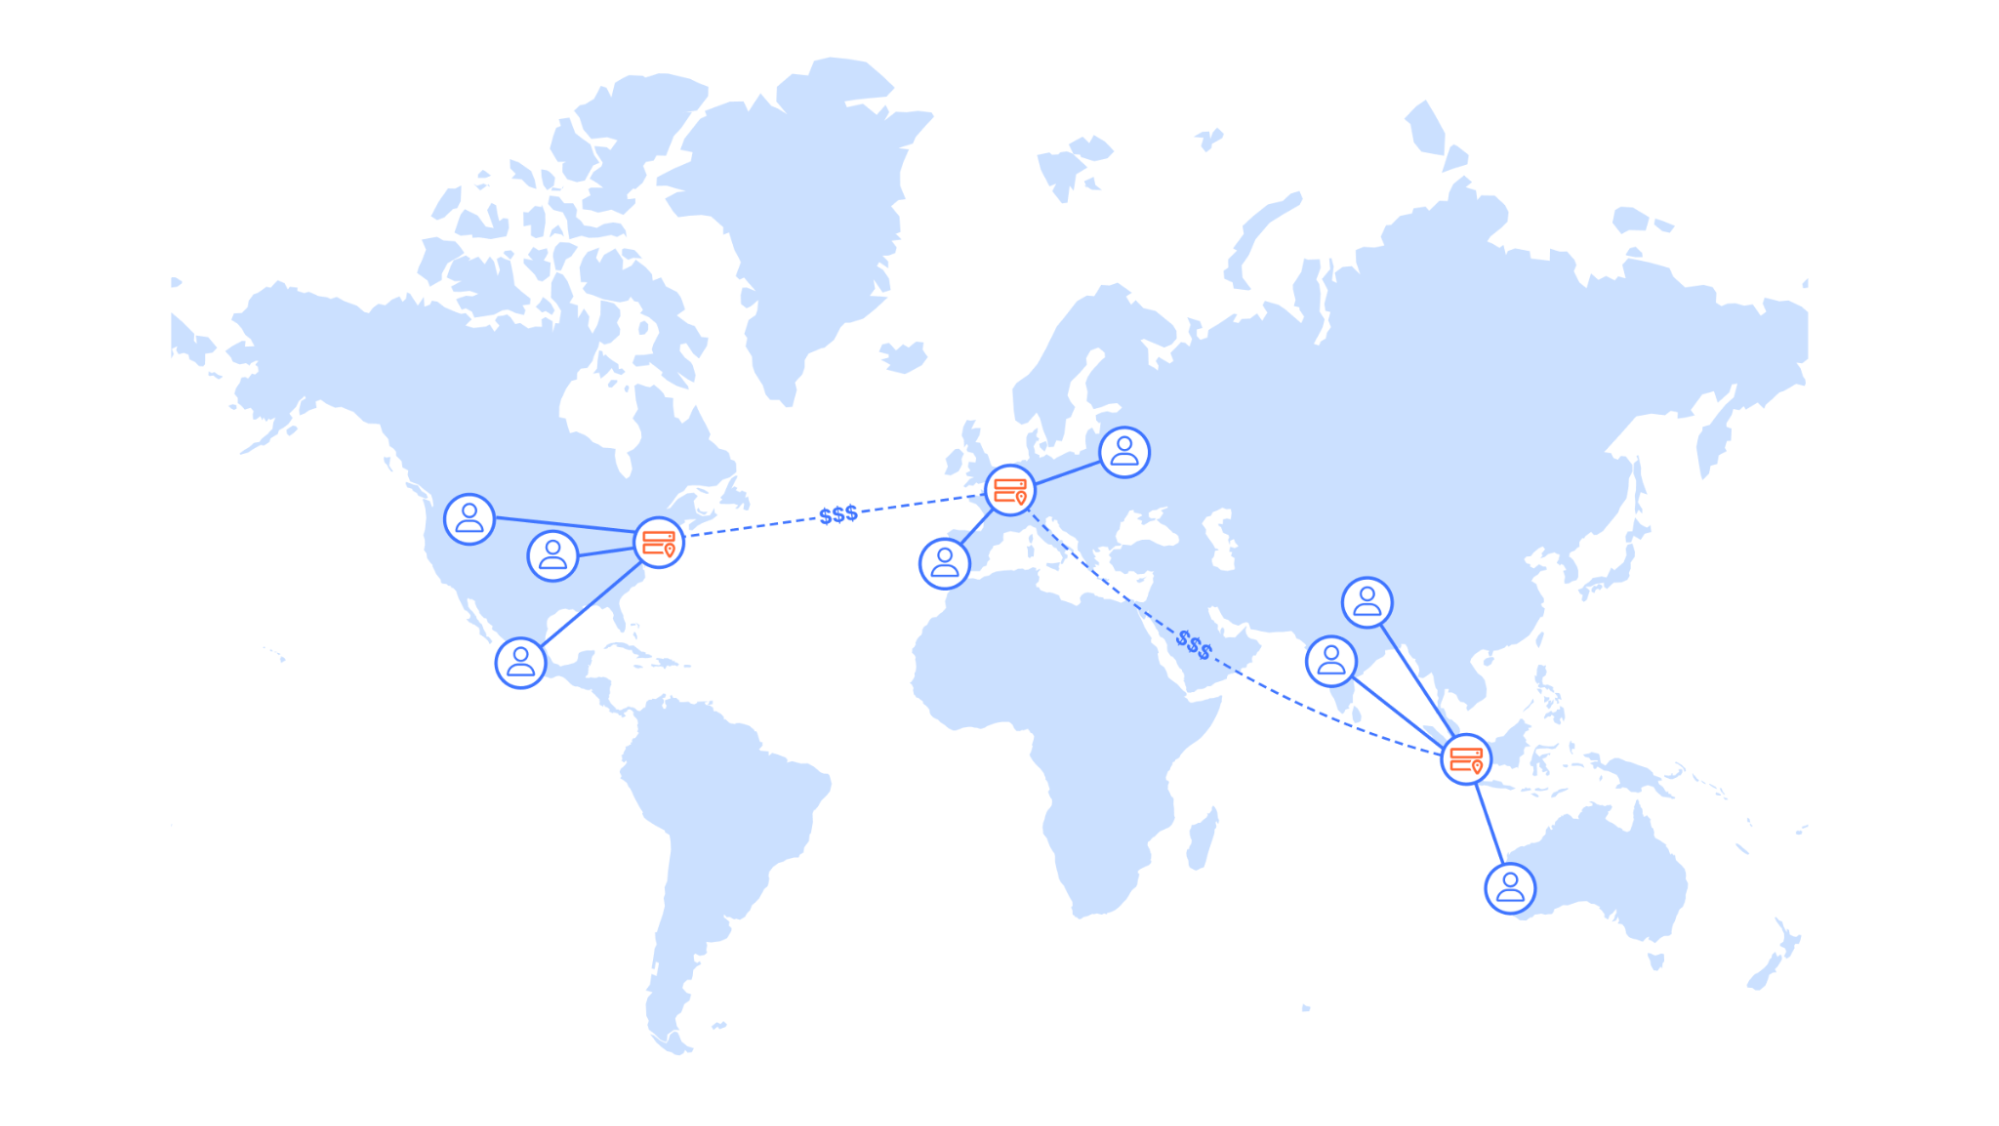
When building a new video conferencing app, you typically start with a peer-to-peer web application using WebRTC, where clients exchange data directly. This approach is efficient for small-scale demos, but scalability issues arise as the number of participants increases. This is because the amount of data each client must transmit grows substantially, following an almost exponential increase relative to the number of participants, as each client needs to send data to n-1 other clients.
Selective Forwarding Units (SFUs) play pivotal roles in scaling WebRTC applications. An SFU functions by receiving multiple media or data flows from participants and deciding which streams should be forwarded to other participants, thus acting as a media stream routing hub. This mechanism significantly reduces bandwidth requirements and improves scalability by managing stream distribution based on network conditions and participant needs. Even though it hasn’t always been this way from when video calling on computers first became popular, SFUs are often found in the cloud, rather than home computers of clients, because of superior connectivity offered in a data center.
A modern audio/video application thus quickly becomes complicated with the addition of this server side element. Since all clients connect to this central SFU server, there are numerous things to consider when you’re architecting and scaling a real-time application:
How close is the SFU server location(s) to the end user clients, how is a client assigned to a server?
Where is the SFU hosted, and if it’s hosted in the cloud, what are the egress costs from VMs?
How many participants can fit in a “room”? Are all participants sending and receiving data? With cameras on? Audio only?
Some SFUs require the use of custom SDKs. Which platforms do these run on and are they compatible with the application you’re trying to build?
Monitoring/reliability/other issues that come with running infrastructure
Some of these concerns, and the complexity of WebRTC infrastructure in general, has made the community look in different directions. However, it is clear that in 2024, WebRTC is alive and well with plenty of new and old uses. AI startups build characters that converse in real time, cars leverage WebRTC to stream live footage of their cameras to smartphones, and video conferencing tools are going strong.
WebRTC has been interesting to us for a while. Cloudflare Stream implemented WHIP and WHEP WebRTC video streaming protocols in 2022, which remain the lowest latency way to broadcast video. OBS Studio implemented WHIP broadcasting support as have a variety of software and hardware vendors alongside Cloudflare. In late 2022, we launched Cloudflare Calls in closed beta. When we blogged about it back then, we were very impressed with how WebRTC fared, and spoke to many customers about their pain points as well as creative ideas the existing browser APIs can foster. We also saw other WebRTC-based apps like Clubhouse rise in popularity and Twitter Spaces play a role in popular culture. Today, we see real-time applications of a different sort. Many AI projects have impressive demos with voice/video interactions. All of these apps are built with the same WebRTC APIs and system architectures.
We are confident that Cloudflare Calls is a new kind of WebRTC infrastructure you should try. When we set out to build Cloudflare Calls, we had a few ideas that we weren’t sure would work, but were worth trying:
Build every WebRTC component on Anycast with a single IP address for DTLS, ICE, STUN, SRTP, SCTP, etc.
Don’t force an SDK – WebRTC APIs by themselves are enough, and allow for the most novel uses to shine, because best developers always find ways to hit the limits of SDKs.
Deploy in all 310+ cities Cloudflare operates in – use every Cloudflare server, not just a subset
Exchange offer and answer over HTTP between Cloudflare and the WebRTC client. This way there is only a single PeerConnection to manage.
Now we know this is all possible, because we made it happen, and we think it’s the best experience a developer can get with pure WebRTC.
Is Cloudflare Calls a real SFU?
Cloudflare is in the business of having computers in numerous places. Historically, our core competency was operating a caching HTTP reverse proxy, and we are very good at this. With Cloudflare Calls, we asked ourselves “how can we build a large distributed system that brings together our global network to form one giant stateful system that feels like a single machine?”
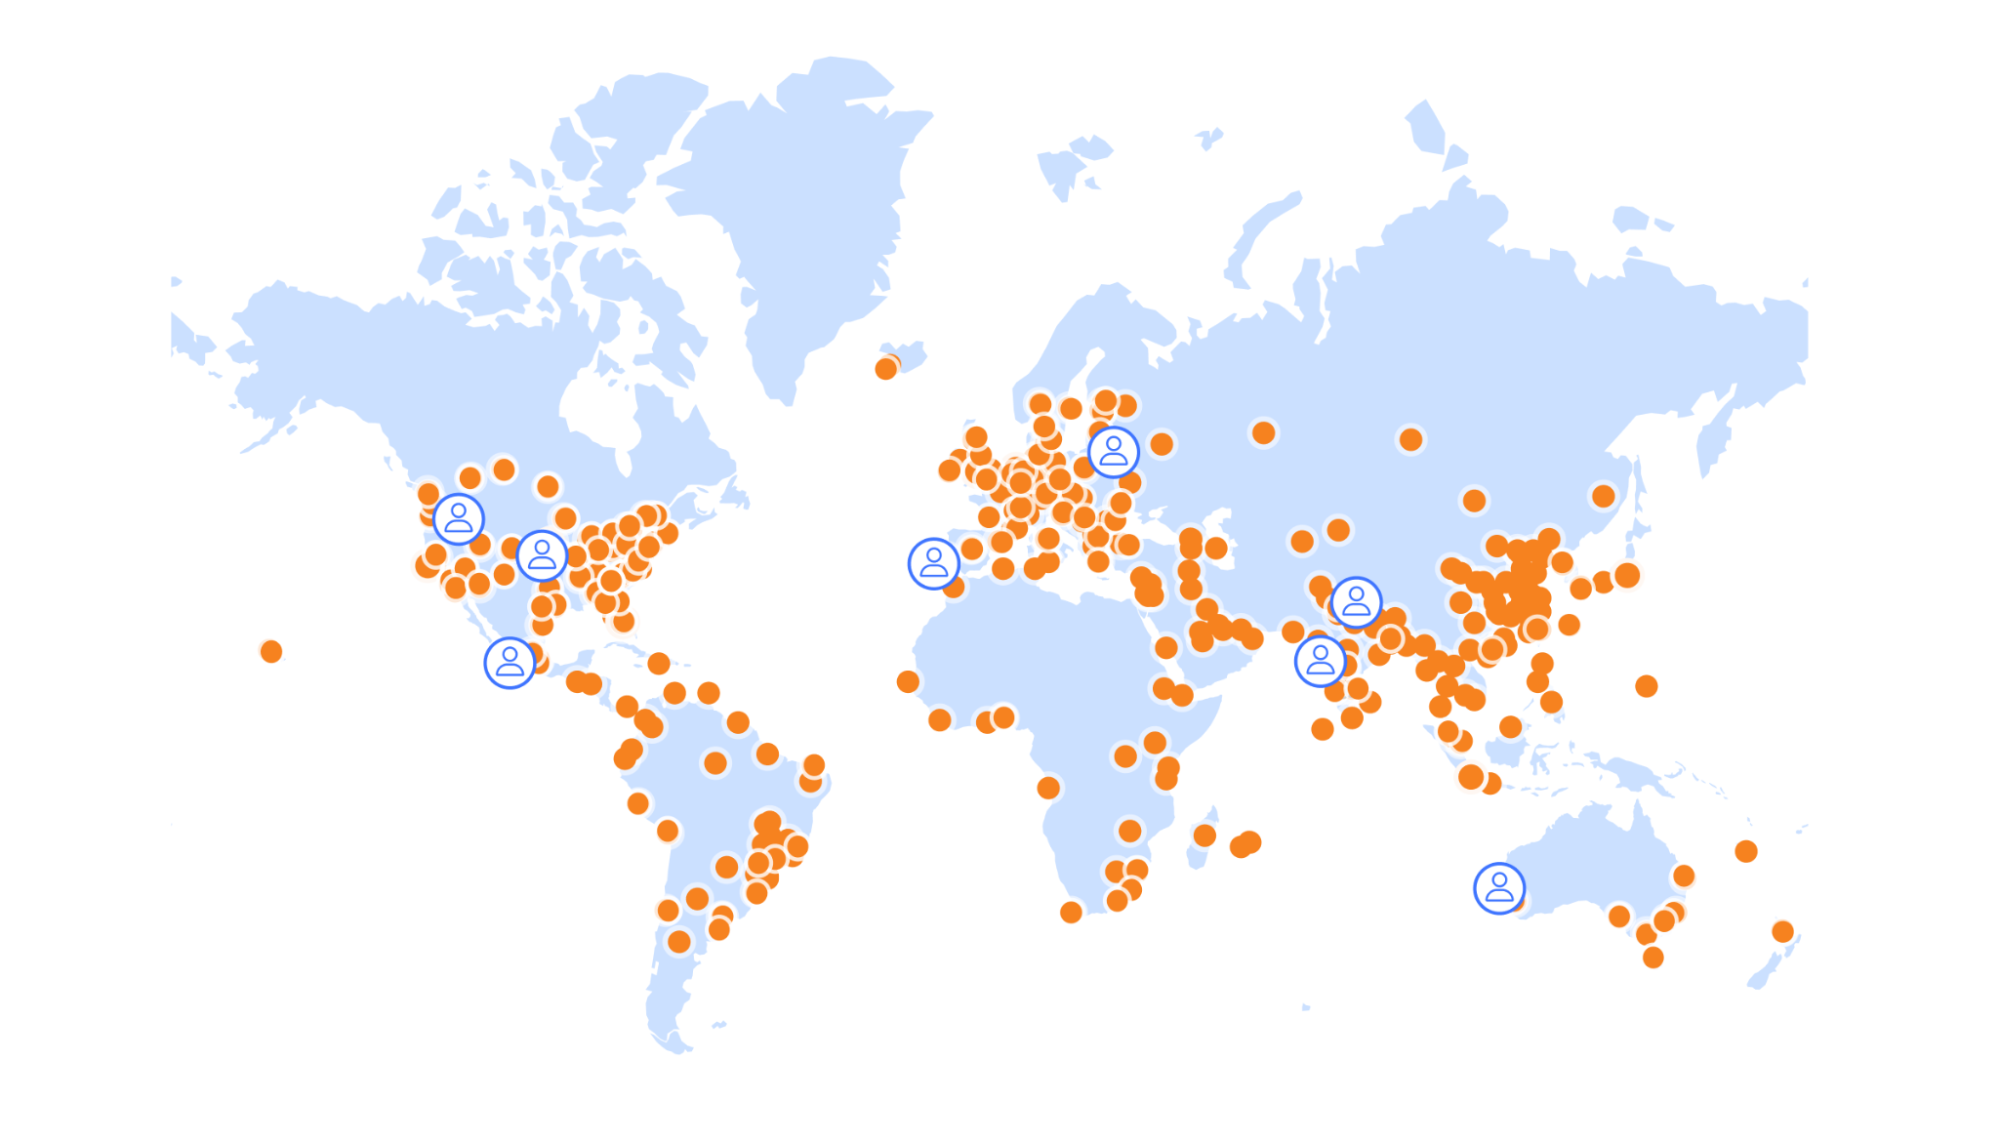
When using Calls, every PeerConnection automatically connects to the closest Cloudflare data center instead of a single server. Rather than connecting every client that needs to communicate with each other to a single server, anycast spreads out connections as much as possible to minimize last mile latency sourced from your ISP between your client and Cloudflare.
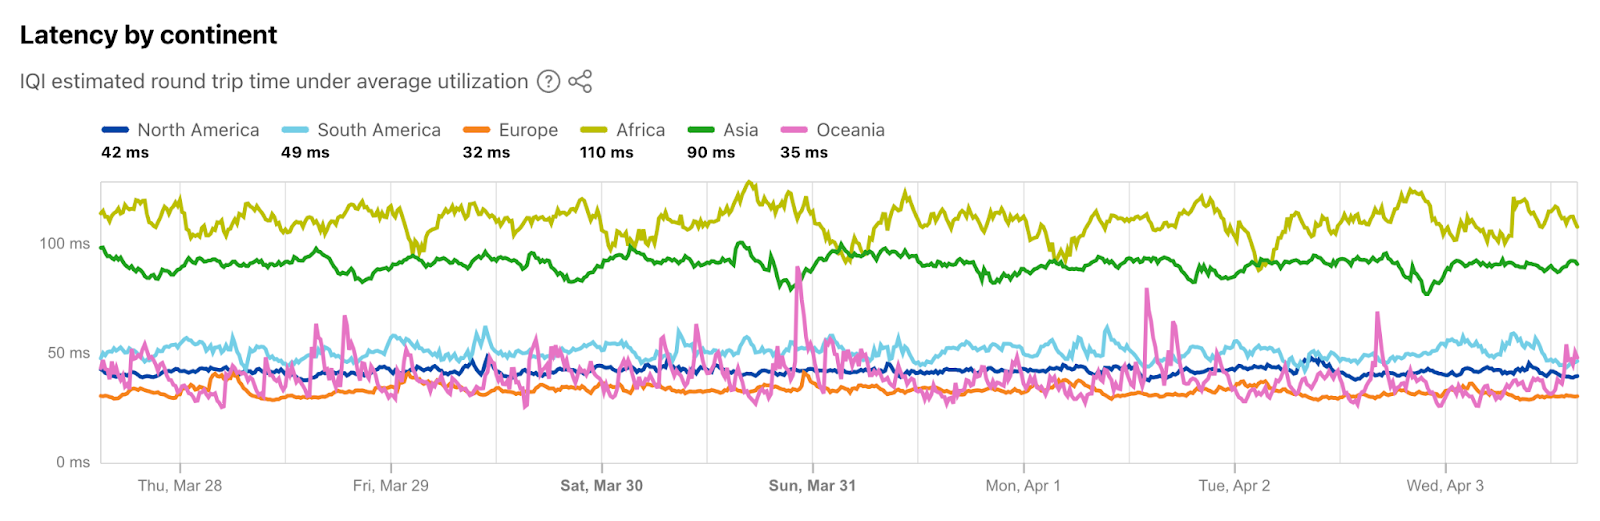
It’s good to minimize last mile latency because after the data enters Cloudflare’s control, the underlying media can be managed carefully and routed through the Cloudflare backbone. This is crucial for WebRTC applications where millisecond delays can significantly impact user experience. To give you a sense about latency between Cloudflare’s data centers and end-users, about 95% of the Internet connected population is within 50ms of a Cloudflare data center. As I write this, I am about 20ms away, but in the past, I have been lucky enough to be connected to a **great** home Wi-Fi network less than 1ms away in Manhattan. “But you are just one user!” you might be thinking, so here is a chart from Cloudflare Radar showing recent global latency measurements:
This setup allows more opportunities for packets lost to be replied with retransmissions closer to users, more opportunities for bandwidth adjustments.
Eliminating SFU region selection
A traditional challenge in WebRTC infrastructure involves the manual selection of Selective Forwarding Units (SFUs) based on geographic location to minimize latency. Some systems solve this problem by selecting a location for the SFU after the first user joins the “room”. This makes routing inefficient when the rest of the participants in the conversation are clustered elsewhere. The anycast architecture of Calls eliminates this issue. When a client initiates a connection, BGP dynamically determines the closest data center. Each selected server only becomes responsible for the PeerConnection of the clients closest to it.
One might see this is actually a simpler way of managing servers, as there is no need to maintain a layer of WebRTC load balancing for traffic or CPU capacity between servers. However, anycast has its own challenges, and we couldn’t take a laissez-faire approach.
Steps to establishing a PeerConnection
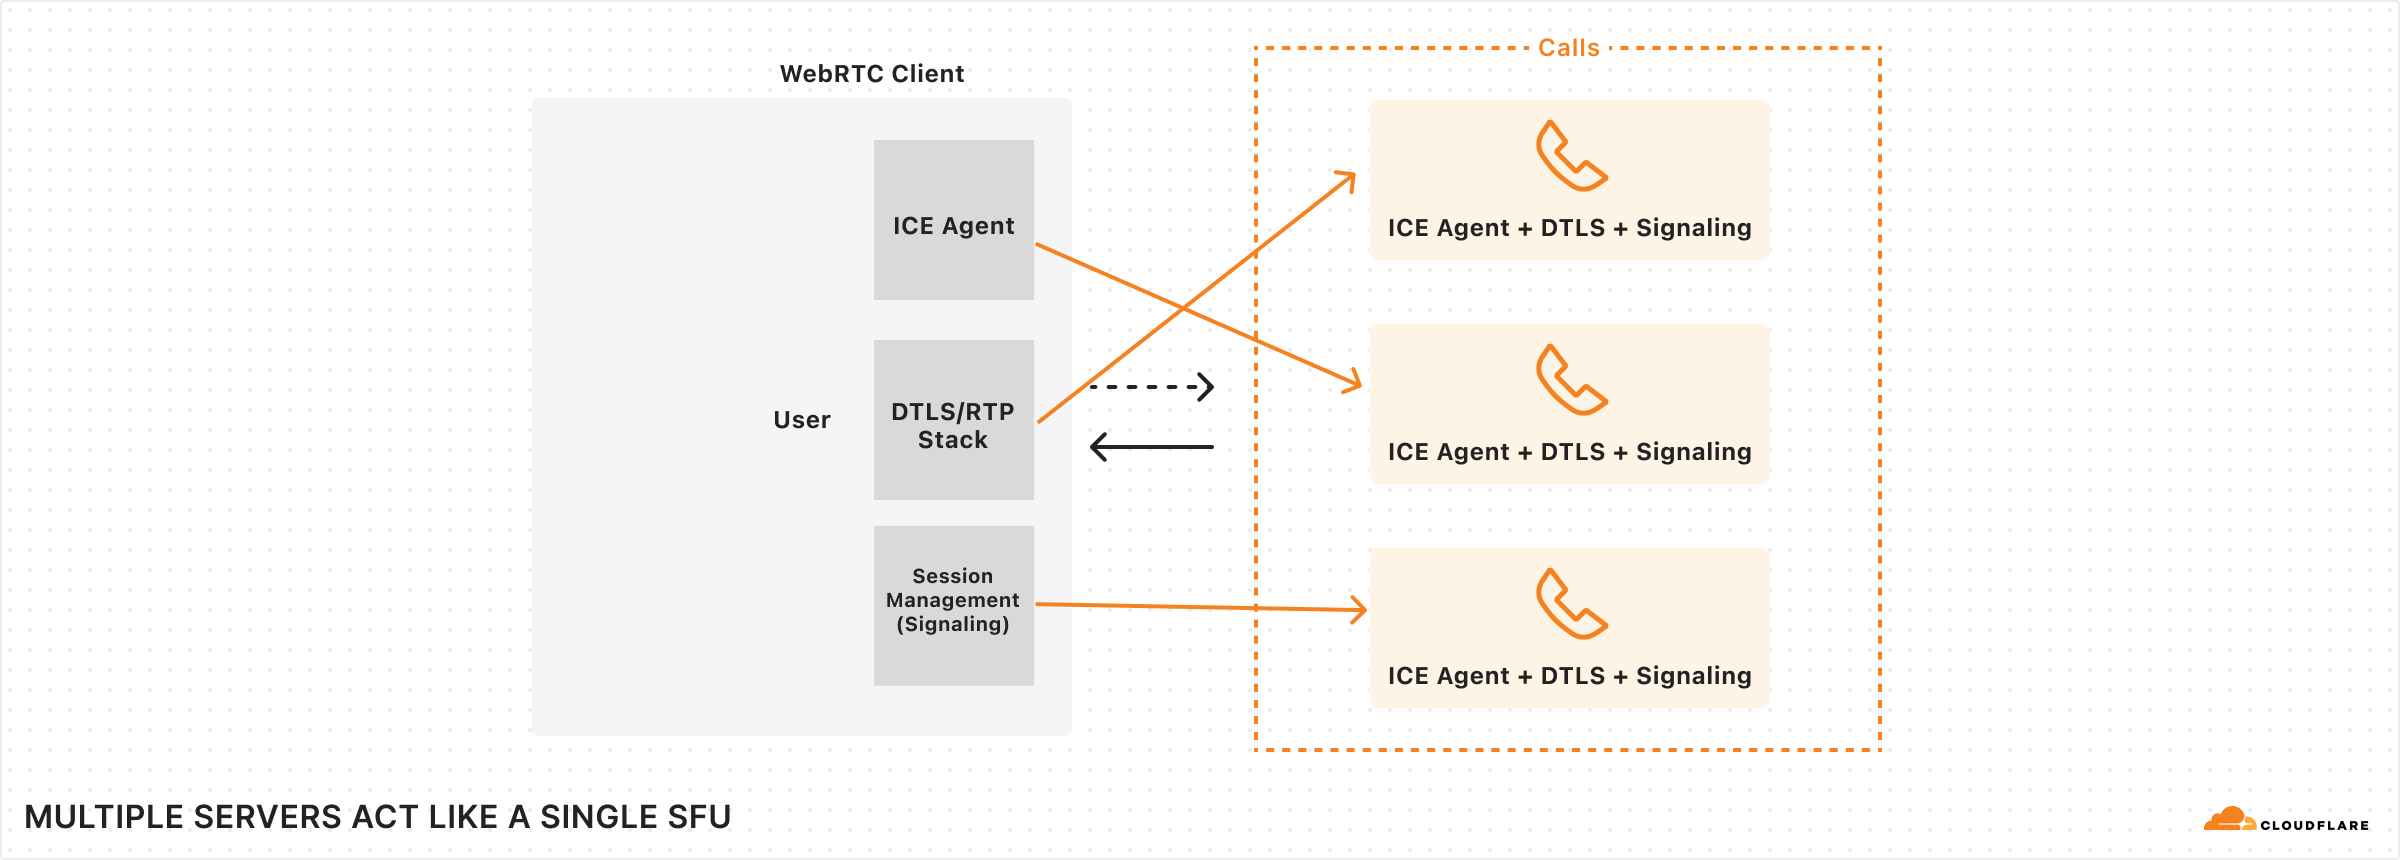
One of the challenging parts in assigning a server to a client PeerConnection is supporting dual stack networking for backwards compatibility with clients that only support the old version of the Internet Protocol, IPv4.
Cloudflare Calls uses a single IP address per protocol, and our L4 load balancer directs packets to a single server per client by using the 4-tuple {client IP, client port, destination IP, destination port} hashing. This means that every ICE connectivity check packet arrives at different servers: one for IPv4 and one for IPv6.
ICE is not the only protocol used for WebRTC; there is also STUN and TURN for connectivity establishment. Actual media bits are encrypted using DTLS, which carries most of the data during a session.
DTLS packets don’t have any identifiers in them that would indicate they belong to a specific connection (unlike QUIC’s connection ID field), so every server should be able to handle DTLS packets and get the necessary certificates to be able to decrypt them for processing. DTLS encryption is negotiated at the SDP layer using the HTTPS API.
The HTTPS API for Calls also lands on a different server than DTLS and ICE connectivity checks. Since DTLS packets need information from the SDP exchanged using the HTTPS API, and ICE connectivity checks depend on the HTTPS API for userFragment and password fields in the connectivity check packets, it would be very useful for all of these to be available in one server. Yet in our setup, they’re not.
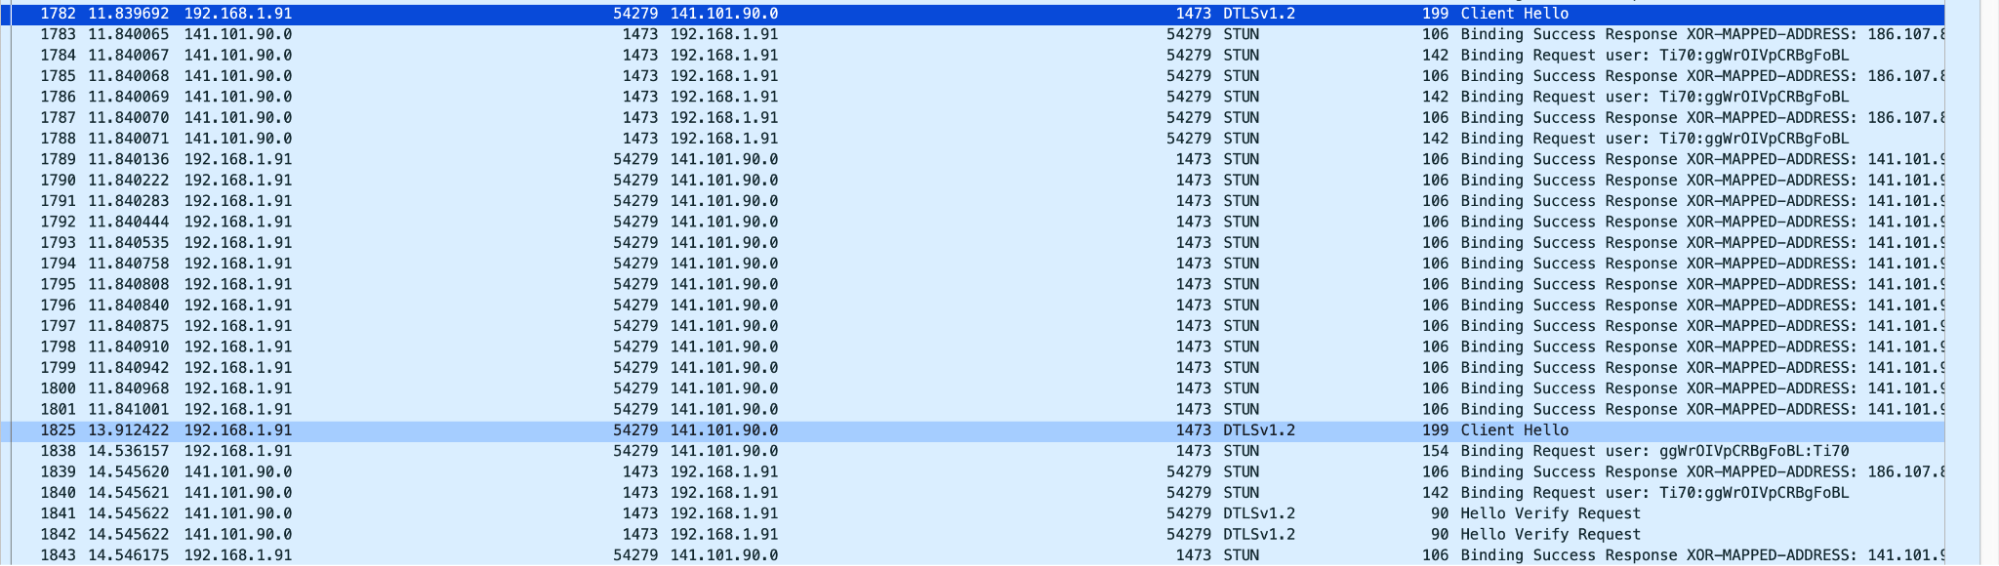
Fippo and Gustavo of WebRTCHacks complained (gracefully noted) about slow replies to ICE connectivity checks in their great article as they were digging into our WHIP implementation right around our announcement in 2022:
Looking at the Wireshark dumps we see a surprisingly large amount of time pass between the first STUN request and the first STUN response – it was 1.8 seconds in the screenshot below.
In other tests, it was shorter, but still 600ms long.
After that, the DTLS packets do not get an immediate response, requiring multiple attempts. This ultimately leads to a call setup time of almost three seconds – way above the global average of 800ms Fippo has measured previously (for the complete handshake, 200ms for the DTLS handshake). For Cloudflare with their extensive network, we expected this to be way below that average.
Gustavo and Fippo observed our solution to this problem of different parts of the WebRTC negotiation landing on different servers. Since Cloudflare Calls unbundles the WebRTC protocol to make the entire network act like a single computer, at this critical moment, we need to form consensus across the network. We form consensus by configuring every server to handle any incoming PeerConnection just in time. When a packet arrives, if the server doesn’t know about it, it quickly learns about the negotiated parameters from another server, such as the ufrag and the DTLS fingerprint from the SDP, and responds with the appropriate response.
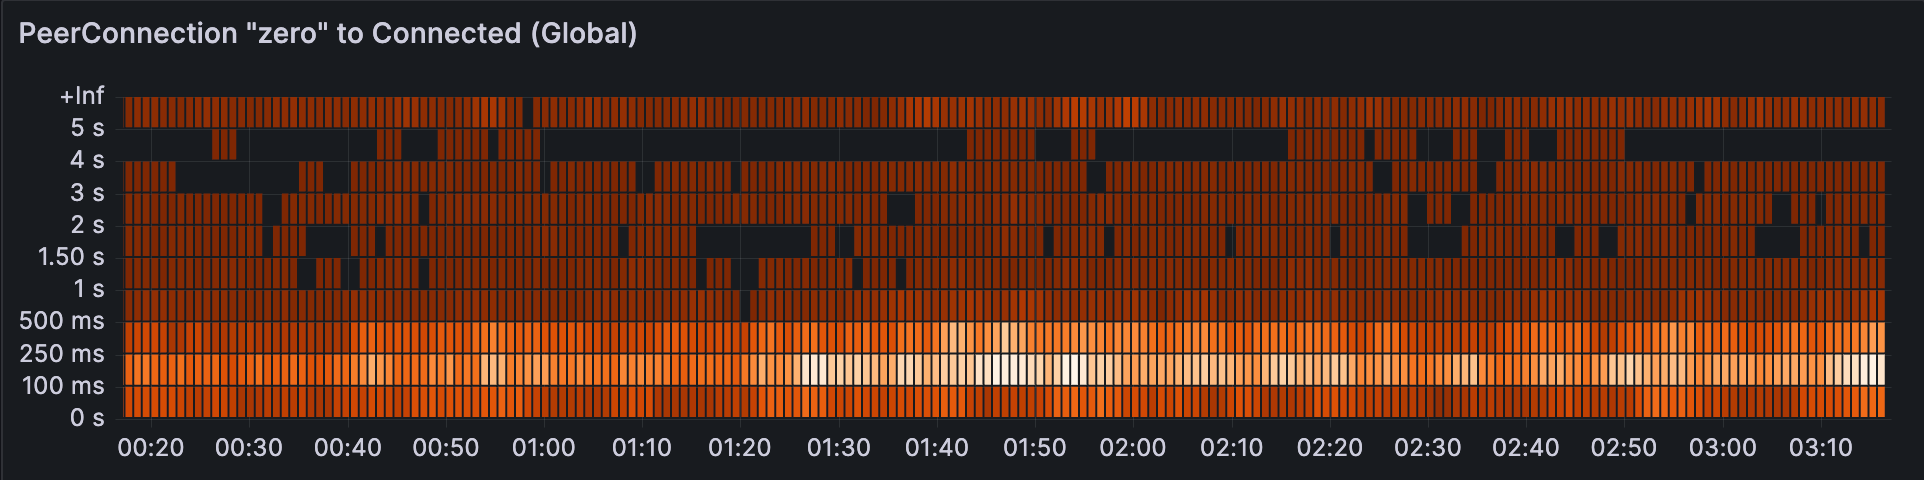
Getting faster
Even though we’ve sped up the process of forming consensus across the Cloudflare network, any delays incurred can still have weird side effects. For example, up until a few months ago, delays of a few hundred milliseconds caused slow connections in Chrome.
A connectivity check packet delayed by a few hundred milliseconds signals to Chrome that this is a high latency network, even though every other STUN message after that was replied to in less than 5-10ms. Chrome thus delays sending a USE-CANDIDATE attribute in the responses for a few seconds, degrading the user experience.
Fortunately, Chrome also sends DTLS ClientHello before USE-CANDIDATE (behavior we’ve seen only on Chrome), so to help speed up Chrome, Calls uses DTLS packets in place of STUN packets with USE-CANDIDATE attributes.
After solving this issue with Chrome, PeerConnections globally now take about 100-250ms to get connected. This includes all consensus management, STUN packets, and a complete DTLS handshake.
Sessions and Tracks are the building blocks of Cloudflare’s SFU, not rooms
Once a PeerConnection is established to Cloudflare, we call this a Session. Many media Tracks or DataChannels can be published using a single Session, which returns a unique ID for each. These then can be subscribed to over any other PeerConnection anywhere around the world using the unique ID. The tracks can be published or subscribed anytime during the lifecycle of the PeerConnection.
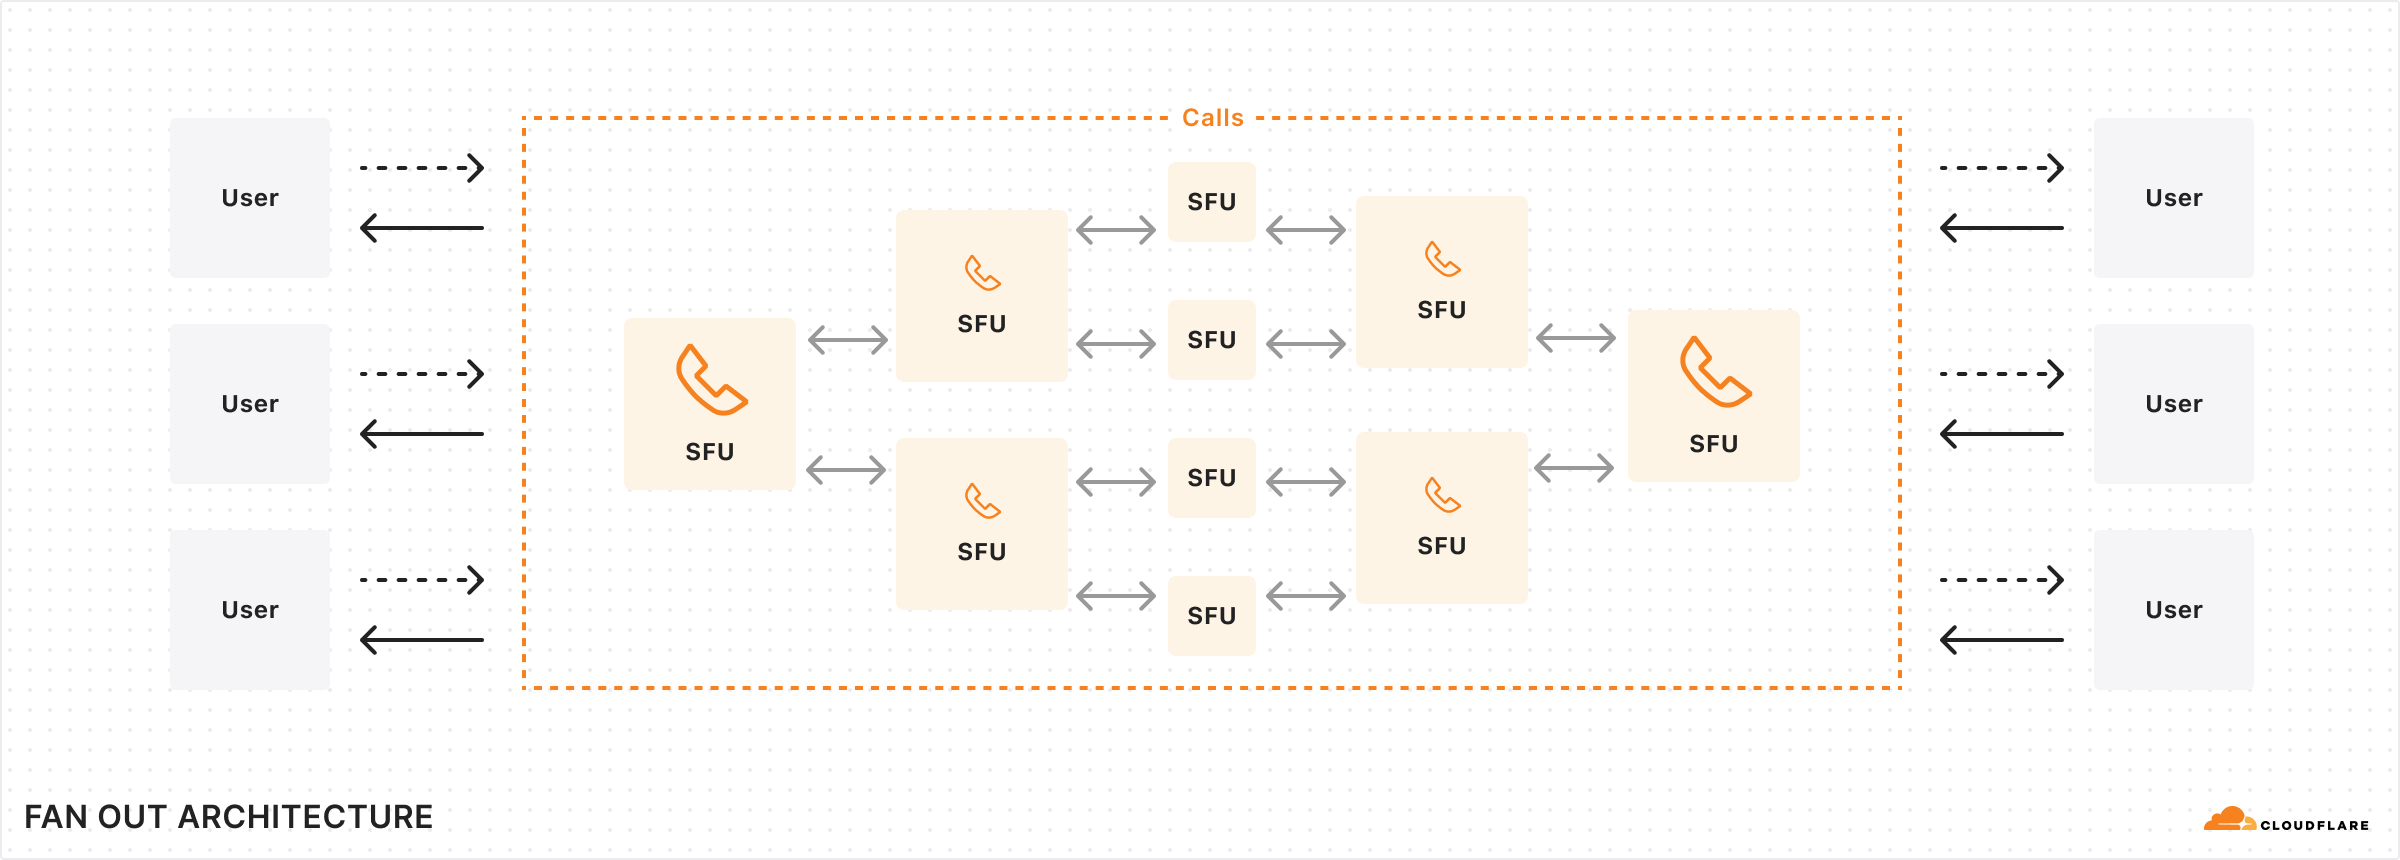
In the background, Cloudflare takes care of scaling through a fan-out architecture with cascading trees that are unique per track. This structure works by creating a hierarchy of nodes where the root node distributes the stream to intermediate nodes, which then fan out to end-users. This significantly reduces the bandwidth required at the source and ensures scalability by distributing the load across the network. This simple but powerful architecture allows developers to build anything from 1:1 video calls to large 1:many or many:many broadcasting scenarios with Calls.
There is no “room” concept in Cloudflare Calls. Each client can add as many tracks into a PeerConnection as they’d like. The limit is the bandwidth available between Cloudflare and the client, which is practically limited by the client side every time. The signaling or the concept of a “room” is left to the application developer, who can choose to pull as many tracks as they’d like from the tracks they have pushed elsewhere into a PeerConnection. This allows developers to move participants into breakout rooms and then back into a plenary room, and then 1:1 rooms while keeping the same PeerConnection and MediaTracks active.
Cloudflare offers an unopinionated approach to bandwidth management, allowing for greater control in customizing logic to suit your business needs. There is no active bandwidth management or restriction on the number of tracks. The WebRTC Stats API provides a standardized way to access data on packet loss and possible congestion, enabling you to incorporate client-side logic based on this information. For instance, if poor Wi-Fi connectivity leads to degraded service, your front-end could inform the user through a notice and automatically reduce the number of video tracks for that client.
“NACK shield” at the edge
The Internet can’t guarantee timely and orderly delivery of packets, leading to the necessity of retransmission mechanisms, particularly in protocols like TCP. This ensures data eventually reaches its destination, despite possible delays. Real-time systems, however, need special consideration of these delays. A packet that is delayed past its deadline for rendering on the screen is worthless, but a packet that is lost can be recovered if it can be retransmitted within a very short period of time, on the order of milliseconds. This is where NACKs come to play.
A WebRTC client receiving data constantly checks for packet loss. When one or more packets don’t arrive at the expected time or a sequence number discontinuity is seen on the receiving buffer, a special NACK packet is sent back to the source in order to ask for a packet retransmission.
In a peer-to-peer topology, if it receives a NACK packet, the source of the data has to retransmit packets for every participant. When an SFU is used, the SFU could send NACKs back to source, or keep a complex buffer for each client to handle retransmissions.
This gets more complicated with Cloudflare Calls, since both the publisher and the subscriber connect to Cloudflare, likely to different servers and also probably in different locations. In addition, there is a possibility of other Cloudflare data centers in the middle, either through Argo, or just as part of scaling to many subscribers on the same track.
It is common for SFUs to backpropagate NACK packets back to the source, losing valuable time to recover packets. Calls goes beyond this and can handle NACK packets in the location closest to the user, which decreases overall latency. The latency advantage gives more chance for the packet to be recovered compared to a centralized SFU or no NACK handling at all.
Since there is possibly a number of Cloudflare data centers between clients, packet loss within the Cloudflare network is also possible. We handle this by generating NACK packets in the network. With each hop that is taken with the packets, the receiving end can generate NACK packets. These packets are then recovered or backpropagated to the publisher to be recovered.
Cloudflare Calls does TURN over Anycast too
Separately from the SFU, Calls also offers a TURN service. TURN relays act as relay points for traffic between WebRTC clients like the browser and SFUs, particularly in scenarios where direct communication is obstructed by NATs or firewalls. TURN maintains an allocation of public IP addresses and ports for each session, ensuring connectivity even in restrictive network environments.
Cloudflare Calls’ TURN service supports a few ports to help with misbehaving middleboxes and firewalls:
TURN-over-UDP over port 3748 (standard), and also port 53
TURN-over-TCP over ports 3748 and 80
TURN-over-TLS over ports 5349 and 443
TURN works the same way as Calls, available over anycast and always connecting to the closest datacenter.
Pricing and how to get started
Cloudflare Calls is now in open beta and available in your Cloudflare Dashboard. Depending on your use case, you can set up an SFU application and/or a TURN service with only a few clicks.
To kick off its open beta phase, Calls is available at no cost for a limited time. Starting May 15, 2024, customers will receive the first terabyte each month for free, with any usage beyond that charged at $0.05 per real-time gigabyte. Beta customers will be provided at least 30 days to upgrade from the free beta to a paid subscription. Additionally, there are no charges for in-bound traffic to Cloudflare. For volume pricing, talk to your account manager.
Cloudflare Calls is ideal if you are building new WebRTC apps. If you have existing SFUs or TURN infrastructure, you may still consider using Calls alongside your existing infrastructure. Building a bridge to Calls from other places is not difficult as Cloudflare Calls supports standard WebRTC APIs and acts like just another WebRTC peer.
We understand that getting started with a new platform is difficult, so we’re also open sourcing our internal video conferencing app, Orange Meets. Orange Meets supports small and large conference calls by maintaining room state in Workers Durable Objects. It has screen sharing, client-side noise-canceling, and background blur. It is written with TypeScript and React and is available on GitHub.
We’re hiring
We think the current state of Cloudflare Calls enables many use cases. Calls already supports publishing and subscribing to media tracks and DataChannels. Soon, it will support features like simulcasting.
But we’re just scratching the surface and there is so much more to build on top of this foundation.
If you are passionate about WebRTC (and other real-time protocols!!), the Media Platform team building the Calls product at Cloudflare is hiring and would love to talk to you.
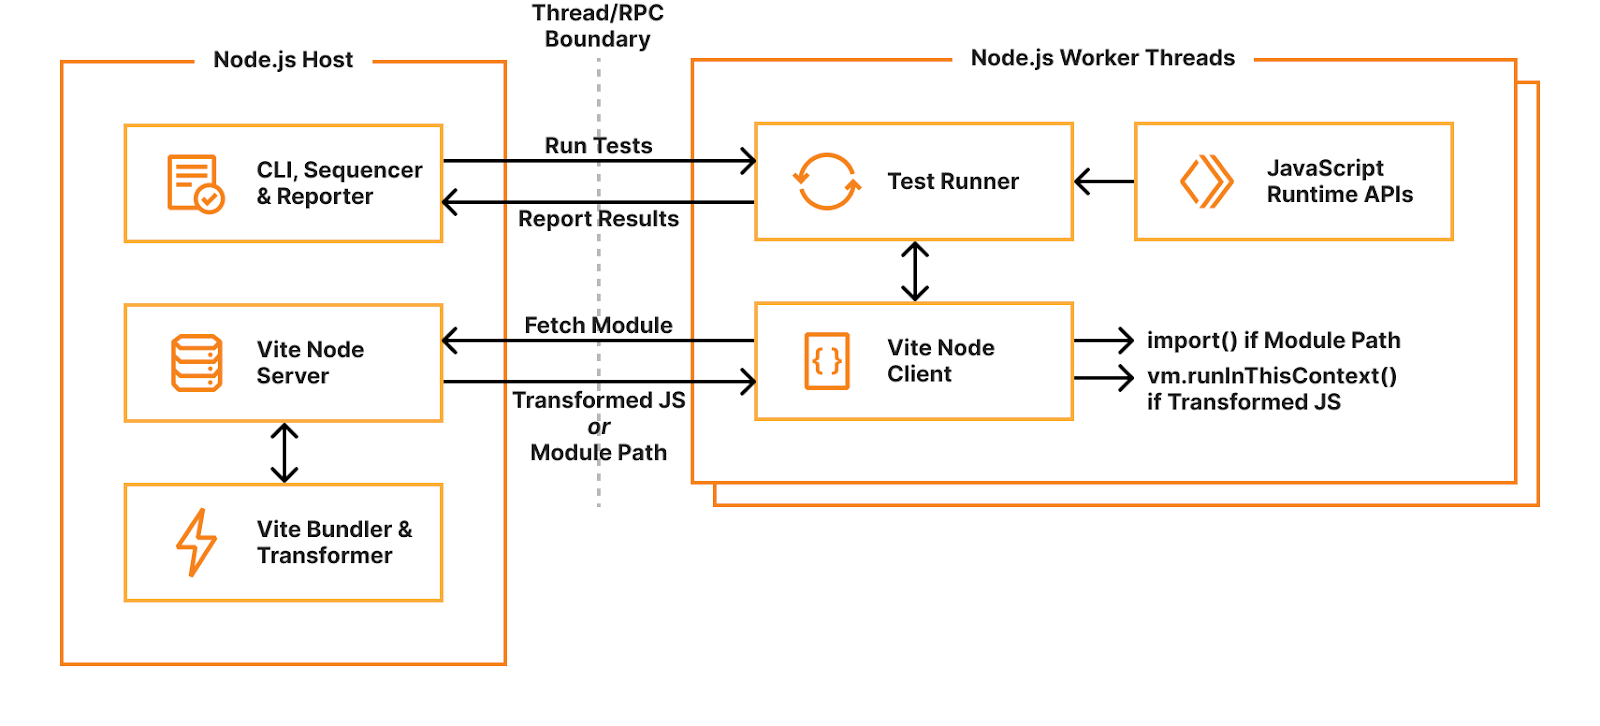
Working with databases can be difficult. Developers face increasing data complexity and needs beyond simple create, read, update, and delete (CRUD) operations. Unfortunately, these issues also compound on themselves: developers have a harder time iterating in an increasingly complex environment. Cloudflare Workers and D1 help by reducing time spent managing infrastructure and deploying applications, and Prisma provides a great experience for your team to work and interact with data.
Together, Cloudflare and Prisma make it easier than ever to deploy globally available apps with a focus on developer experience. To further that goal, Prisma Object Relational Mapper (ORM) now natively supports Cloudflare Workers and D1 in Preview. With version 5.12.0 of Prisma ORM you can now interact with your data stored in D1 from your Cloudflare Workers with the convenience of the Prisma Client API. Learn more and try it out now.
What is Prisma?
From writing to debugging, SQL queries take a long time and slow developer productivity. Even before writing queries, modeling tables can quickly become unwieldy, and migrating data is a nerve-wracking process. Prisma ORM looks to resolve all of these issues by providing an intuitive data modeling language, an automated migration workflow, and a developer-friendly and type-safe client for JavaScript and TypeScript, allowing developers to focus on what they enjoy: developing!
Prisma is focused on making working with data easy. Alongside an ORM, Prisma offers Accelerate and Pulse, products built on Cloudflare that cover needs from connection pooling, to query caching, to real-time type-safe database subscriptions.
How to get started with Prisma ORM, Cloudflare Workers, and D1
To get started with Prisma ORM and D1, first create a basic Cloudflare Workers app. This guide will start with the ”Hello World” Worker example app, but any Workers example app will work. If you don’t have a project yet, start by creating a new one. Name your project something memorable, like my-d1-prisma-app and select “Hello World” worker and TypeScript. For now, we will choose to not deploy and will wait until after we have set up D1 and Prisma ORM.
npm create cloudflare@latest
Next, move into your newly created project and make sure that dependencies are installed:
cd my-d1-prisma-app && npm install
After dependencies are installed, we can move on to the D1 setup.
First, create a new D1 database for your app.
npx wrangler d1 create prod-prisma-d1-app
.
.
.

[[d1_databases]]
binding = "DB" # i.e. available in your Worker on env.DB
database_name = "prod-prisma-d1-app"
database_id = "<unique-ID-for-your-database>"
The section starting with [[d1_databases]] is the binding configuration needed in your wrangler.toml for your Worker to communicate with D1. Add that now:
// wrangler.toml
name="my-d1-prisma-app"
main = "src/index.ts"
compatibility_date = "2024-03-20"
compatibility_flags = ["nodejs_compat"]

[[d1_databases]]
binding = "DB" # i.e. available in your Worker on env.DB
database_name = "prod-prisma-d1-app"
database_id = "<unique-ID-for-your-database>"
Your application now has D1 available! Next, add Prisma ORM to manage your queries, schema and migrations! To add Prisma ORM, first make sure the latest version is installed. Prisma ORM versions 5.12.0 and up support Cloudflare Workers and D1.
Now run npx prisma init in order to create the necessary files to start with. Since D1 uses SQLite’s SQL dialect, we set the provider to be sqlite.
npx prisma init --datasource-provider sqlite
This will create a few files, but the one to look at first is your Prisma schema file, available at prisma/schema.prisma
// schema.prisma
// This is your Prisma schema file,
// learn more about it in the docs: https://pris.ly/d/prisma-schema

generator client {
  provider = "prisma-client-js"
}

datasource db {
  provider = "sqlite"
  url  = env("DATABASE_URL")
}
Before you can create any models, first enable the driverAdapters Preview feature. This will allow the Prisma Client to use an adapter to communicate with D1.
// schema.prisma
// This is your Prisma schema file,
// learn more about it in the docs: https://pris.ly/d/prisma-schema

generator client {
  provider = "prisma-client-js"
+ previewFeatures = ["driverAdapters"]
}

datasource db {
  provider = "sqlite"
  url      = env("DATABASE_URL")
}
Now you are ready to create your first model! In this app, you will be creating a “ticker”, a mainstay of many classic Internet sites.
Add a new model to your schema, Visit, which will track that an individual visited your site. A Visit is a simple model that will have a unique ID and the time at which an individual visited your site.
// This is your Prisma schema file,
// learn more about it in the docs: https://pris.ly/d/prisma-schema

generator client {
  provider        = "prisma-client-js"
  previewFeatures = ["driverAdapters"]
}

datasource db {
  provider = "sqlite"
  url      = env("DATABASE_URL")
}

+ model Visit {
+   id        Int      @id @default(autoincrement())
+   visitTime DateTime @default(now())
+ }
Now that you have a schema and a model, let’s create a migration. First use wrangler to generate an empty migration file and prisma migrate to fill it. If prompted, select “yes” to create a migrations folder at the root of your project.
npx wrangler d1 migrations create prod-prisma-d1-app init
 ⛅️ wrangler 3.36.0
-------------------
✔ No migrations folder found. Set `migrations_dir` in wrangler.toml to choose a different path.
Ok to create /path/to/your/project/my-d1-prisma-app/migrations? … yes
✅ Successfully created Migration '0001_init.sql'!

The migration is available for editing here
/path/to/your/project/my-d1-prisma-app/migrations/0001_init.sql
The npx prisma migrate diff command takes the difference between your database (which is currently empty) and the Prisma schema. It then saves this difference to a new file in the migrations directory.
Make sure to import PrismaClient and PrismaD1, define the binding for your D1 database, and you’re ready to use Prisma in your application.
// src/index.ts
import { PrismaClient } from "@prisma/client";
import { PrismaD1 } from "@prisma/adapter-d1";

export interface Env {
  DB: D1Database,
}

export default {
  async fetch(request: Request, env: Env, ctx: ExecutionContext): Promise<Response> {
    const adapter = new PrismaD1(env.DB);
    const prisma = new PrismaClient({ adapter });
    const { pathname } = new URL(request.url);

    if (pathname === '/') {
      const numVisitors = await prisma.visit.count();
      return new Response(
        `You have had ${numVisitors} visitors!`
      );
    }

    return new Response('');
  },
};
You may notice that there’s always 0 visitors. Add another route to create a new visitor whenever someone visits the /visit route
// src/index.ts
import { PrismaClient } from "@prisma/client";
import { PrismaD1 } from "@prisma/adapter-d1";

export interface Env {
  DB: D1Database,
}

export default {
  async fetch(request: Request, env: Env, ctx: ExecutionContext): Promise<Response> {
    const adapter = new PrismaD1(env.DB);
    const prisma = new PrismaClient({ adapter });
    const { pathname } = new URL(request.url);

    if (pathname === '/') {
      const numVisitors = await prisma.visit.count();
      return new Response(
        `You have had ${numVisitors} visitors!`
      );
    } else if (pathname === '/visit') {
      const newVisitor = await prisma.visit.create({ data: {} });
      return new Response(
        `You visited at ${newVisitor.visitTime}. Thanks!`
      );
    }

    return new Response('');
  },
};
Your app is now set up to record visits and report how many visitors you have had!
Summary and further reading
We were able to build a simple app easily with Cloudflare Workers, D1 and Prisma ORM, but the benefits don’t stop there! Check the official documentation for information on using Prisma ORM with D1 along with workflows for migrating your data, and even extending the Prisma Client for your specific needs.
Data is fundamental to any real-world application: the database storing your user data and inventory, the analytics tracking sales events and/or error rates, the object storage with your web assets and/or the Parquet files driving your data science team, and the vector database enabling semantic search or AI-powered recommendations for your users.
When we first announced Workers back in 2017, and then Workers KV, Cloudflare R2, and D1, it was obvious that the next big challenge to solve for developers would be in making it easier to ingest, store, and query the data needed to build scalable, full-stack applications.
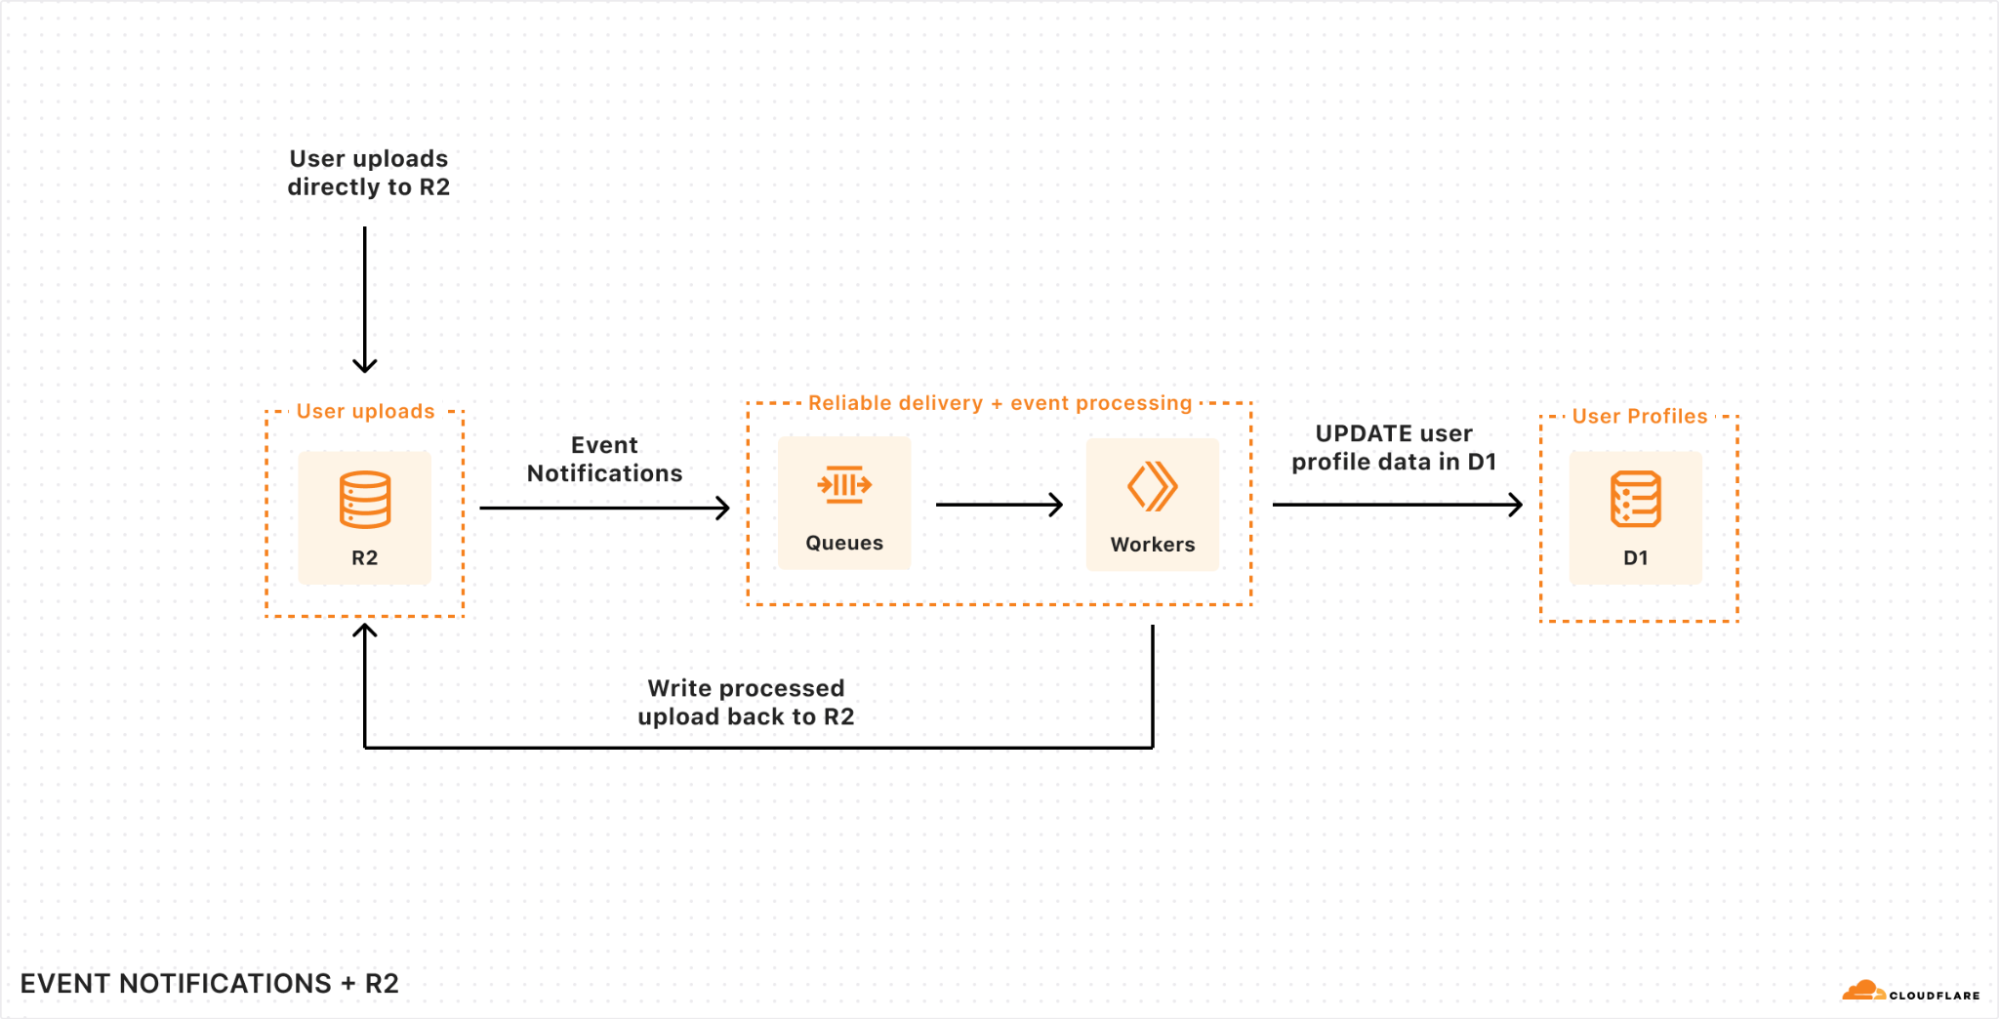
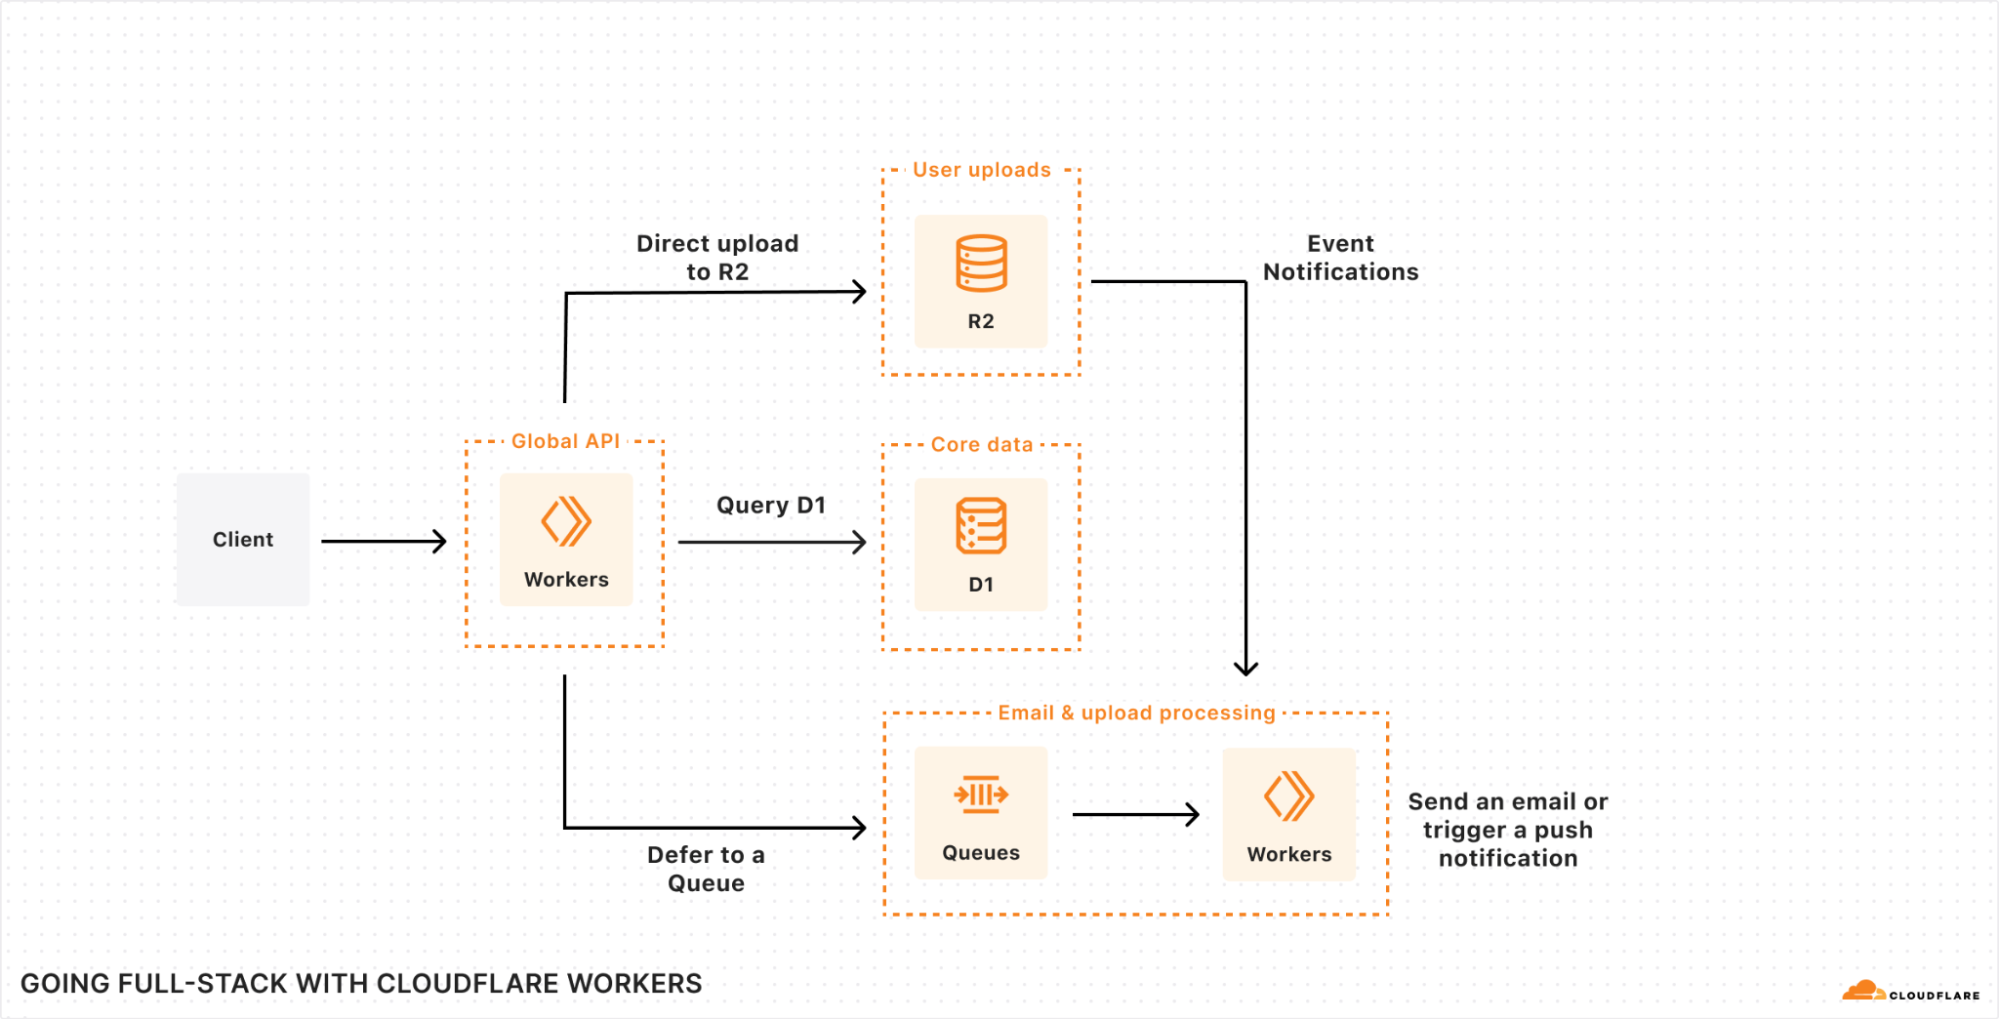
To that end, as part of our quest to make building stateful, distributed-by-default applications even easier, we’re launching our new Event Notifications service; a preview of our upcoming streaming ingestion product, Pipelines; and a sneak peek into our take on durable execution, Workflows.
Event-based architectures
When you’re writing data — whether that’s new data, changing existing data, or deleting old data — you often want to trigger other, asynchronous work to run in response. That could be processing user-driven uploads, updating search indexes as the underlying data changes, or removing associated rows in your SQL database when content is removed.
In order to make these event-driven workflows far easier to build across Cloudflare, we’re launching the first step towards a wider Event Notifications platform across Cloudflare, starting with notifications support in R2.
You can read more in the deep-dive on Event Notifications for R2, but in a nutshell: you can configure changes to content in any R2 bucket to write directly to a Queue, allowing you to reliably consume those events in a Worker or to pull from compute in a legacy cloud.
Event Notifications for R2 are just the beginning, though. There are many kinds of events you might want to trigger as a developer — these are just some of the event types we’re planning to support:
Changes (writes) to key-value pairs in your Workers KV namespaces.
Updates to your D1 databases, including changed rows or triggers.
Consuming event notifications from a single Worker is just one approach, though. As you start to consume events, you may want to trigger multi-step workflows that execute reliably, resume from errors or exceptions, and ensure that previous steps aren’t duplicated or repeated unnecessarily. An event notification framework turns out to be just the thing needed to drive a workflow engine that executes durably…
Making it even easier to ingest data
When we launched Cloudflare R2, our object storage service, we knew that supporting the de facto-standard S3 API was critical in order to allow developers to bring the tooling and services they already had over to R2. But the S3 API is designed to be simple: at its core, it provides APIs for upload, download, multipart and metadata operations, and many tools don’t support the S3 API.
What if you want to batch clickstream data from your web services so that it’s efficient (and cost-effective) to query by your analytics team? Or partition data by customer ID, merchant ID, or locale within a structured data format like JSON?
Well, we want to help solve this problem too, and so we’re announcing Pipelines, an upcoming streaming ingestion service designed to ingest data at scale, aggregate it, and write it directly to R2, without you having to manage infrastructure, partitions, runners, or worry about durability.
With Pipelines, creating a globally scalable ingestion endpoint that can ingest tens-of-thousands of events per second doesn’t require any code:
$ wrangler pipelines create clickstream-ingest-prod --batch-size="1MB" --batch-timeout-secs=120 --batch-on-json-key=".merchantId" --destination-bucket="prod-cs-data"

✅ Successfully created new pipeline "clickstream-ingest-prod"
📥 Created endpoints:
➡ HTTPS: https://d458dbe698b8eef41837f941d73bc5b3.pipelines.cloudflarestorage.com/clickstream-ingest-prod
➡ WebSocket: wss://d458dbe698b8eef41837f941d73bc5b3.pipelines.cloudflarestorage.com:8443/clickstream-ingest-prod
➡ Kafka: d458dbe698b8eef41837f941d73bc5b3.pipelines.cloudflarestorage.com:9092 (topic: clickstream-ingest-prod)
As you can see here, we’re already thinking about how to make Pipelines protocol-agnostic: write from a HTTP client, stream events over a WebSocket, and/or redirect your existing Kafka producer (and stop having to manage and scale Kafka) directly to Pipelines.
But that’s just the beginning of our vision here. Scalable ingestion and simple batching is one thing, but what about if you have more complex needs? Well, we have a massively scalable compute platform (Cloudflare Workers) that can help address this too.
The code below is just an initial exploration for how we’re thinking about an API for running transforms over streaming data. If you’re aware of projects like Apache Beam or Flink, this programming model might even look familiar:
export default {
   // Pipeline handler is invoked when batch criteria are met
   async pipeline(stream: StreamPipeline, env: Env, ctx: ExecutionContext): Promise<StreamingPipeline> {
      // ...
      return stream
         // Type: transform(label: string, transformFunc: TransformFunction): Promise<StreamPipeline>
         // Each transform has a label that is used in metrics to provide
    // per-transform observability and debugging
         .transform("human readable label", (events: Array<StreamEvent>) => {
            return events.map((e) => ...)
         })
         .transform("another transform", (events: Array<StreamEvent>) => {
            return events.map((e) => ...)
         })
         .writeToR2({
            format: "json",
            bucket: "MY_BUCKET_NAME",
            prefix: somePrefix,
            batchSize: "10MB"
         })
   }
}
Specifically:
The Worker describes a pipeline of transformations (mapping, reducing, filtering) that operates over each subset of events (records)
You can call out to other services — including D1 or KV — in order to synchronously or asynchronously hydrate data or lookup values during your stream processing
We take care of scaling horizontally based on records-per-second and/or any concurrency settings you configure based on processing latency requirements.
We’ll be bringing Pipelines into open beta later in 2024, and it will initially launch with support for HTTP ingestion and R2 as a destination (sink), but we’re already thinking bigger.
We’ll be sharing more as Pipelines gets closer to release. In the meantime, you can register your interest and share your use-case, and we’ll reach out when Pipelines reaches open beta.
Durable Execution
If the term “Durable Execution” is new to you, don’t worry: the term comes from the desire to run applications that can resume execution from where they left off, even if the underlying host or compute fails (where the “durable” part comes from).
As we’ve continued to build out our data and AI platforms, we’ve been acutely aware that developers need ways to create reliable, repeatable workflows that operate over that data, turn unstructured data into structured data, trigger on fresh data (or periodically), and automatically retry, restart, and export metrics for each step along the way. The industry calls this Durable Execution: we’re just calling it Workflows.
What makes Workflows different from other takes on Durable Execution is that we provide the underlying compute as part of the platform. You don’t have to bring-your-own compute, or worry about scaling it or provisioning it in the right locations. Workflows runs on top of Cloudflare Workers – you write the workflow, and we take care of the rest.
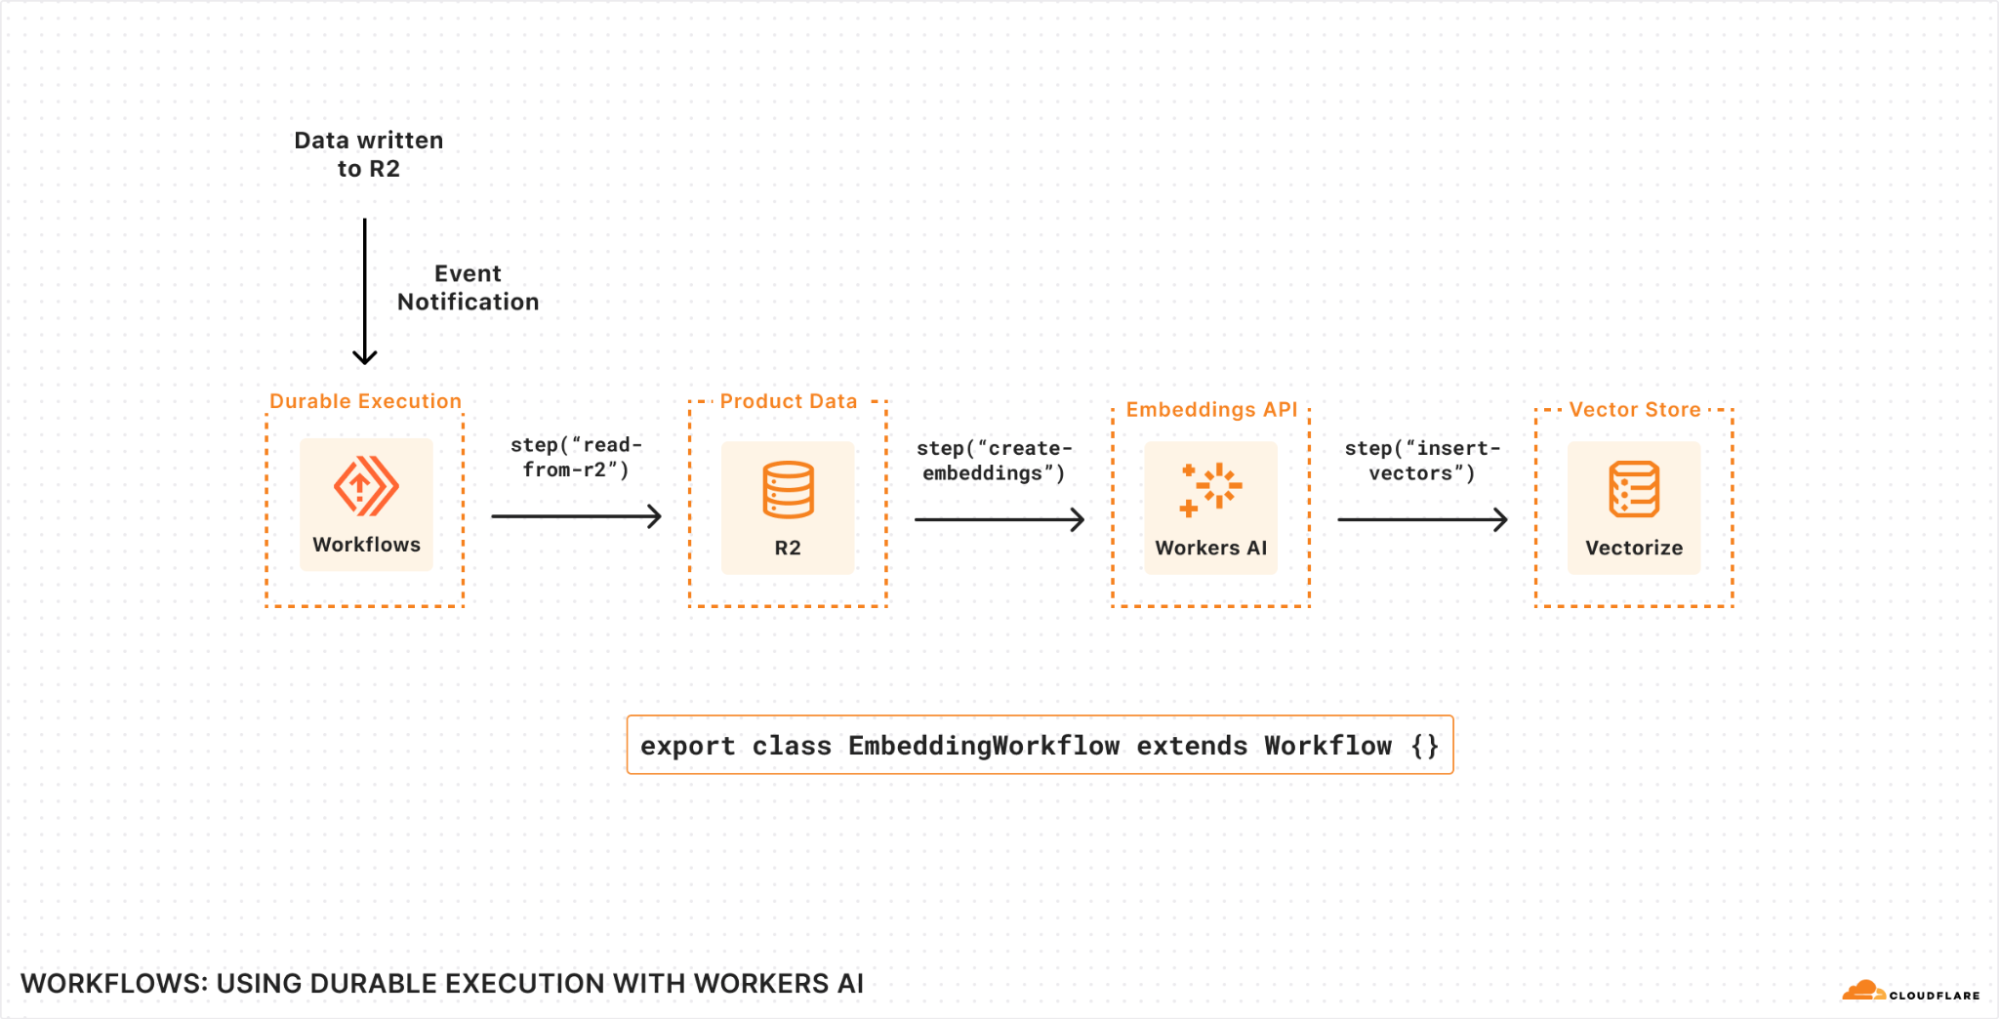
Here’s an early example of writing a Workflow that generates text embeddings using Workers AI and stores them (ready to query) in Vectorize as new content is written to (or updated within) R2.
Each Workflow run is triggered by an Event Notification consumed from a Queue, but could also be triggered by a HTTP request, another Worker, or even scheduled on a timer.
Individual steps within the Workflow allow us to define individually retriable units of work: in this case, we’re reading the new objects from R2, creating text embeddings using Workers AI, and then inserting.
State is durably persisted between steps: each step can emit state, and Workflows will automatically persist that so that any underlying failures, uncaught exceptions or network retries can resume execution from the last successful step.
Every call to step() automatically emits metrics associated with the unique Workflow run, making it easier to debug within each step and/or break down your application into its smallest units of execution, without having to worry about observability.
Step-by-step, it looks like this:
Transforming this series of steps into real code, here’s what this would look like with Workflows:
import { Ai } from "@cloudflare/ai";
import { Workflow } from "cloudflare:workers";

export interface Env {
  R2: R2Bucket;
  AI: any;
  VECTOR_INDEX: VectorizeIndex;
}

export default class extends Workflow {
  async run(event: Event) {
    const ai = new Ai(this.env.AI);

    // List of keys to fetch from our incoming event notification
    const keysToFetch = event.messages.map((val) => {
      return val.object.key;
    });

    // The return value of each step is stored (the "durable" part
    // of "durable execution")
    // This ensures that state can be persisted between steps, reducing
    // the need to recompute results ($$, time) should subsequent
    // steps fail.
    const inputs = await this.ctx.run(
      // Each step has a user-defined label
      // Metrics are emitted as each step runs (to success or failure)
// with this label attached and available within per-Workflow
// analytics in near-real-time.
"read objects from R2", async () => {
      const objects = [];

      for (const key of keysToFetch) {
        const object = await this.env.R2.get(key);
        objects.push(await object.text());
      }

      return objects;
    });


    // Persist the output of this step.
    const embeddings = await this.ctx.run(
      "generate embeddings",
      async () => {
        const { data } = await ai.run("@cf/baai/bge-small-en-v1.5", {
          text: inputs,
        });

        if (data.length) {
          return data;
        } else {
          // Uncaught exceptions trigger an automatic retry of the step
          // Retries and timeouts have sane defaults and can be overridden
    // per step
          throw new Error("Failed to generate embeddings");
        }
      },
      {
        retries: {
          limit: 5,
          delayMs: 1000,
          backoff: "exponential",
        },
      }
    );

    await this.ctx.run("insert vectors", async () => {
      const vectors = [];

      keysToFetch.forEach((key, index) => {
        vectors.push({
          id: crypto.randomUUID(),
          // Our embeddings from the previous step
          values: embeddings[index].values,
          // The path to each R2 object to map back to during
 	    // vector search
          metadata: { r2Path: key },
        });
      });

      return this.env.VECTOR_INDEX.upsert();
    });
  }
}
This is just one example of what a Workflow can do. The ability to durably execute an application, modeled as a series of steps, applies to a wide number of domains. You can apply this model of execution to a number of use-cases, including:
Deploying software: each step can define a build step and subsequent health check, gating further progress until your deployment meets your criteria for “healthy”.
Post-processing user data: triggering a workflow based on user uploads (e.g. to Cloudflare R2) that then subsequently parses that data asynchronously, redacts PII or sensitive data, writes the sanitized output, and triggers a notification via email, webhook, or mobile push.
Payment and batch workflows: aggregating raw customer usage data on a periodic schedule by querying your data warehouse (or Workers Analytics Engine), triggering usage or spend alerts, and/or generating PDF invoices.
Each of these use cases model tasks that you want to run to completion, minimize redundant retries by persisting intermediate state, and (importantly) easily observe success and failure.
We’ll be sharing more about Workflows during the second quarter of 2024 as we work towards an open (public!) beta. This includes how we’re thinking about idempotency and interactions with our storage, per-instance observability and metrics, local development, and templates to bootstrap common workflows.
Putting it together
We’ve often thought of Cloudflare’s own network as one massively scalable parallel data processing cluster: data centers in 310+ cities, with the ability to run compute close to users and/or close to data, keep it within the bounds of regulatory or compliance requirements, and most importantly, use our massive scale to enable our customers to scale as well.
Recapping, a fully-fledged data platform needs to enable three things:
Ingesting data: getting data into the platform (in the right format, from the right sources)
Storing data: securely, reliably, and durably.
Querying data: understanding and extracting insights from the data, and/or transforming it for use by other tools.
When we launched R2 we tackled the second part, but knew that we’d need to follow up with the first and third parts in order to make it easier for developers to get data in and make use of it.
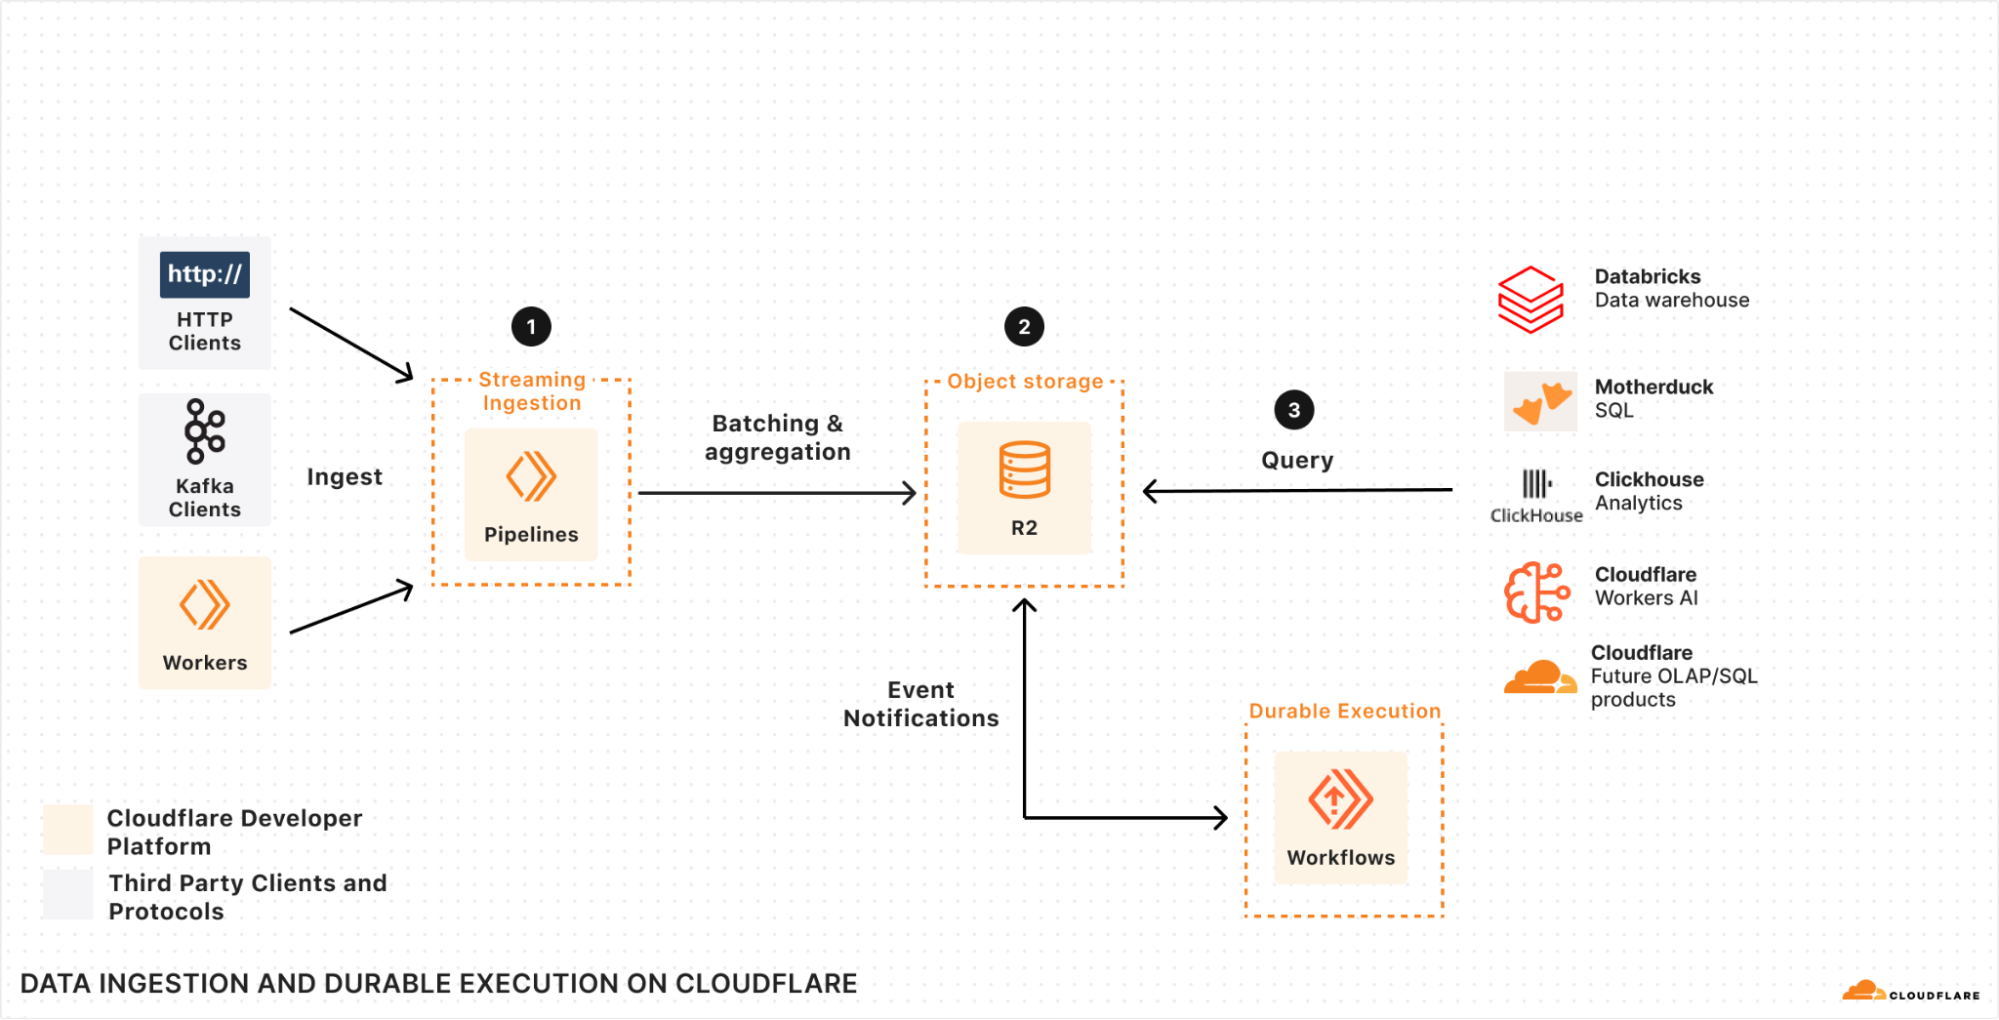
If we look at how we can build a system that helps us solve each of these three parts together with Pipelines, Event Notifications, R2, and Workflows, we end up with an architecture that resembles this:
Specifically, we have Pipelines (1) scaling out to ingest data, batch it, filter it, and then durably store it in R2 (2) in a format that’s ready and optimized for querying. Workflows, ClickHouse, Databricks, or the query engine of your choice can then query (3) that data as soon as it’s ready — with “ready” being automatically triggered by an Event Notification as soon as the data is ingested and written to R2.
There’s no need to poll, no need to batch after the fact, no need to have your query engine slow down on data that wasn’t pre-aggregated or filtered, and no need to manage and scale infrastructure in order to keep up with load or data jurisdiction requirements. Create a Pipeline, write your data directly to R2, and query directly from it.
If you’re also looking at this and wondering about the costs of moving this data around, then we’re holding to one important principle: zero egress fees across all of our data products. Just as we set the stage for this with our R2 object storage, we intend to apply this to every data product we’re building, Pipelines included.
Start Building
We’ve shared a lot of what we’re building so that developers have an opportunity to provide feedback (including via our Developer Discord), share use-cases, and think about how to build their next application on Cloudflare.
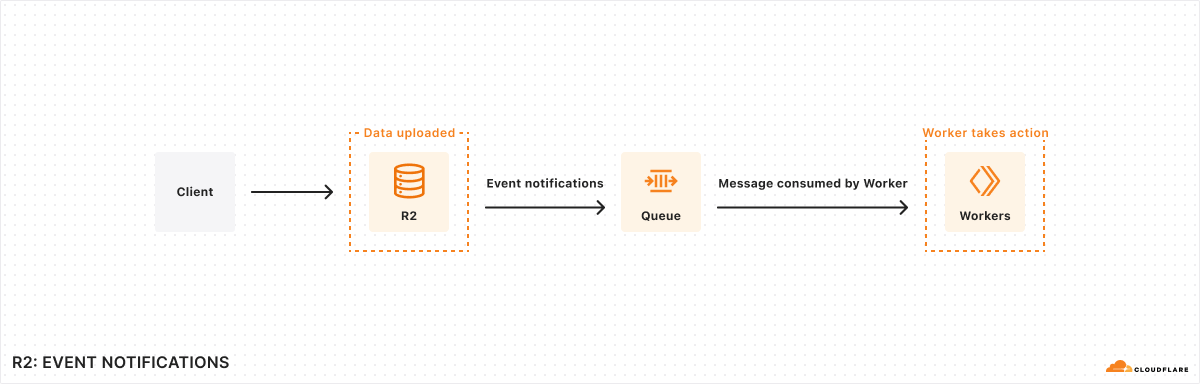
The lifecycle of data often doesn’t stop immediately after upload to an R2 bucket – event data may need to be transformed and loaded into a data warehouse, media files may need to go through a post-processing step, etc. We’re releasing event notifications for R2 in open beta to enable building applications and workflows driven by your changing data.
Event notifications work by sending messages to your queue each time there is a change to your data. These messages are then received by a consumer Worker where you can then define any subsequent action that needs to be taken.
To get started enabling event notifications on your R2 bucket, you can run the following Wrangler command (replacing bucket_name and queue_name with your bucket and queue names respectively):
For more information on how to set up event notifications on your R2 buckets today and limitations during beta, please refer to the documentation.
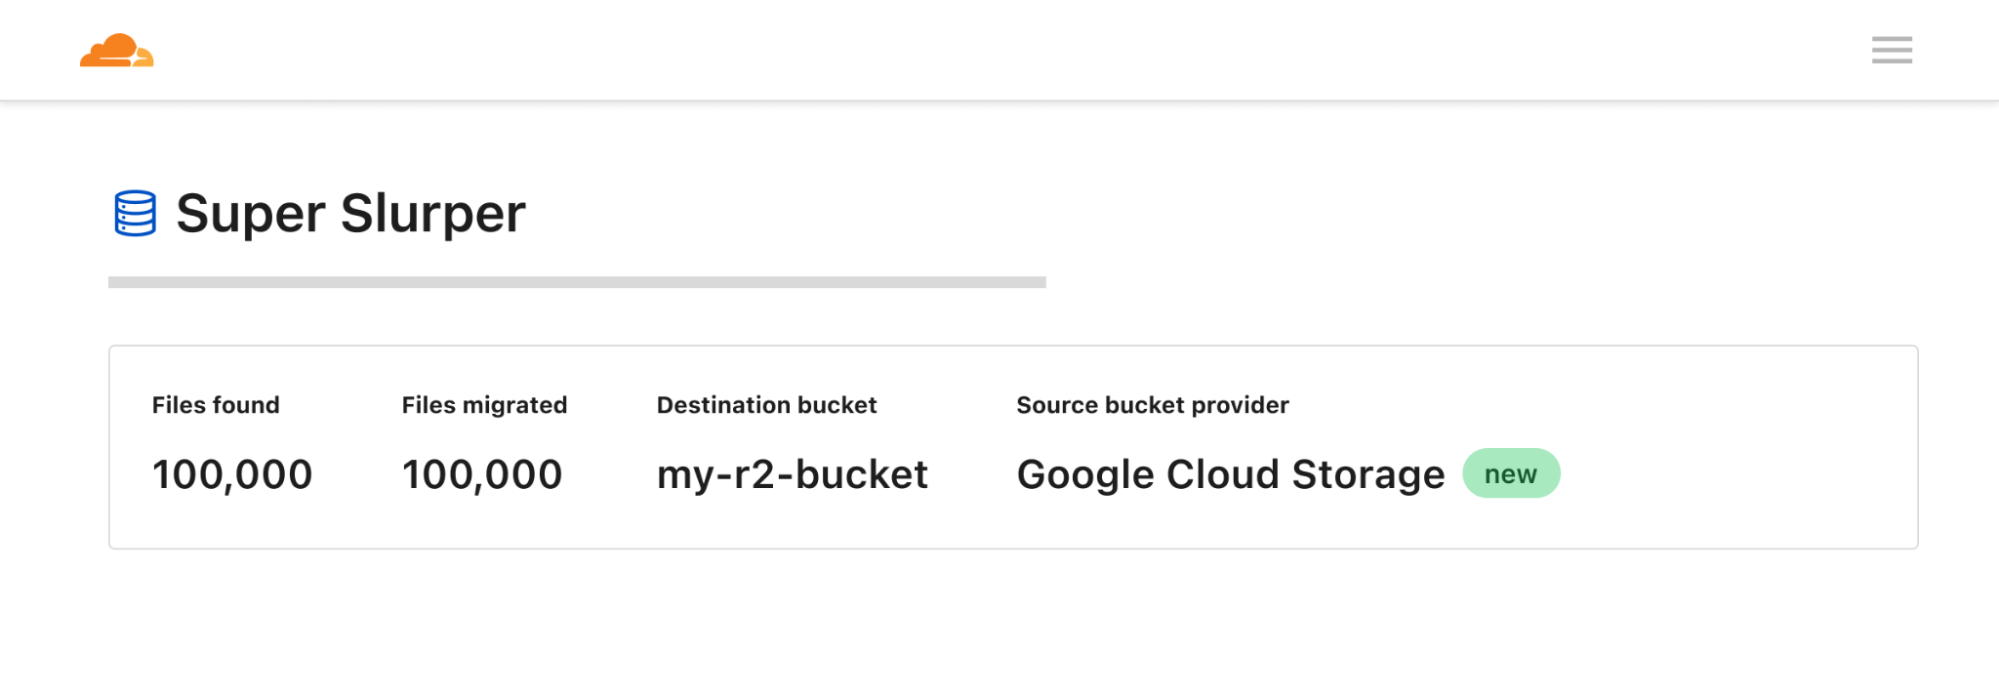
Super Slurper for Google Cloud Storage
Super Slurper can now migrate data from Google Cloud Storage (GCS) to Cloudflare R2. We released Super Slurper last year with the goal of making one-time comprehensive data migrations fast, reliable, and easy: there’s no need to spin up migration VMs and implement complicated retry logic. Since then, thousands of developers have used Super Slurper to migrate petabytes of data from AWS S3 to R2. Now Google Cloud Storage customers can migrate data to Cloudflare R2 to benefit from Cloudflare’s zero egress fees, whether you are permanently moving data to another provider or not.
To get started migrating data from GCS:
From the Cloudflare dashboard, select R2 > Data Migration.
Select Migrate files.
Select Google Cloud Storage for the source bucket provider.
Enter your bucket name and associated credentials and select Next.
Enter your R2 bucket name and associated credentials and select Next.
After you finish reviewing the details of your migration, select Migrate files.
You can view the status of your migration job at any time on the dashboard. For more information on how to use Super Slurper, please refer to the documentation here.
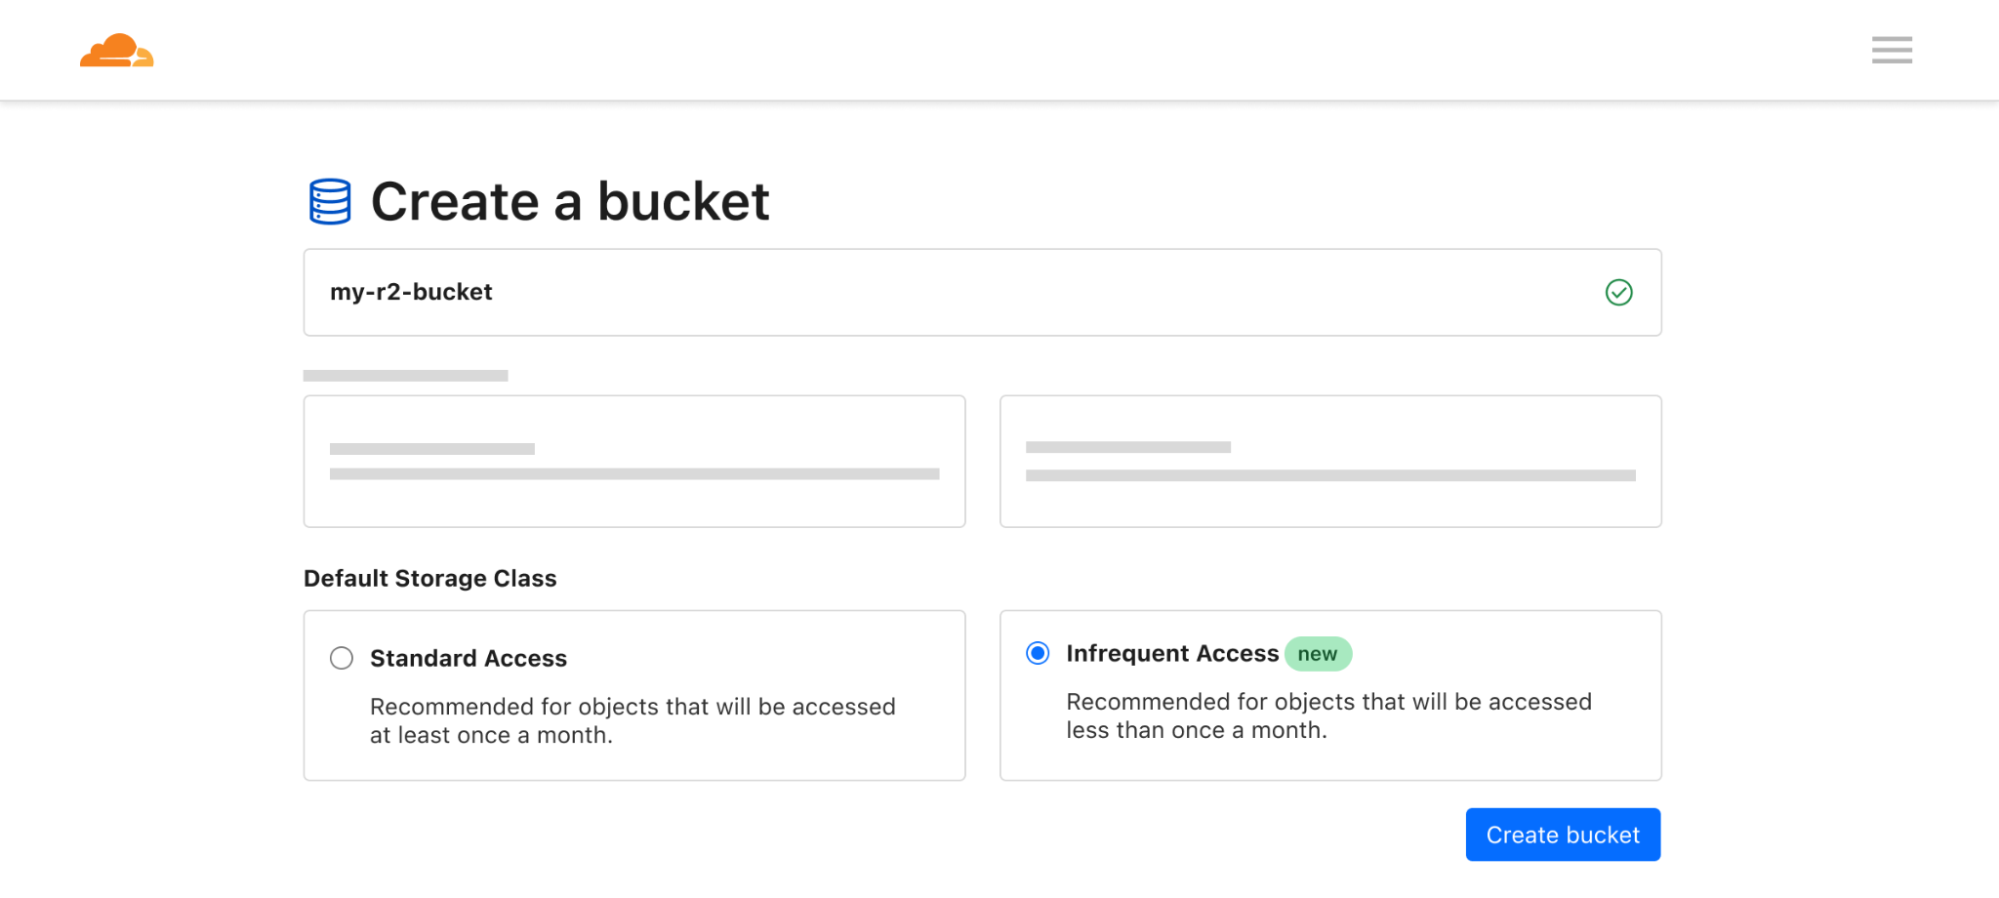
Infrequent Access Private Beta
We’re excited to introduce the private beta of our new Infrequent Access storage class. For use cases that involve data that isn’t frequently accessed (long tail user-generated content, logs, etc), Infrequent Access gives you the ability to pay less for storage while maintaining performance and durability.
Here’s an example of how you can upload an object to your R2 bucket with the new Infrequent Access storage class using Workers:
In addition to uploading objects directly to Infrequent Access, you can define an object lifecycle policy to move data to Infrequent Access after a period of time goes by and you no longer need to access your data as often. In the future, we plan to automatically optimize storage classes for data so you can avoid manually creating rules and better adapt to changing data access patterns.
For data stored in the Infrequent Access storage class, the pricing components will be similar to what you’re used to with R2: storage, Class A operations (writes, lists), Class B operations (reads), and data retrieval (processing). Data retrieval is charged per GB when data in the Infrequent Access storage class is retrieved and is what allows us to provide storage at a lower price. It reflects the additional computational resources required to fetch data from underlying storage optimized for less frequent access. And when the time comes, and you do need to use your data, there are still no egress fees.
Component
Price
Storage
$0.01 / GB-month
Class A Operations
$9.00 / million requests
Class B Operations
$0.90 / million requests
Data Retrieval (Processing)
$0.01 / GB
Egress (or Data Transfer)
$0 – No Charge
Are you interested in participating in the private beta for Infrequent Access?
We would love to hear from you! To share your feedback about R2 and our data migration services, please join the Cloudflare Developer Discord. If you’re interested in learning more about R2, get started by visiting R2’s developer documentation or see how much you could save with our pricing calculator.
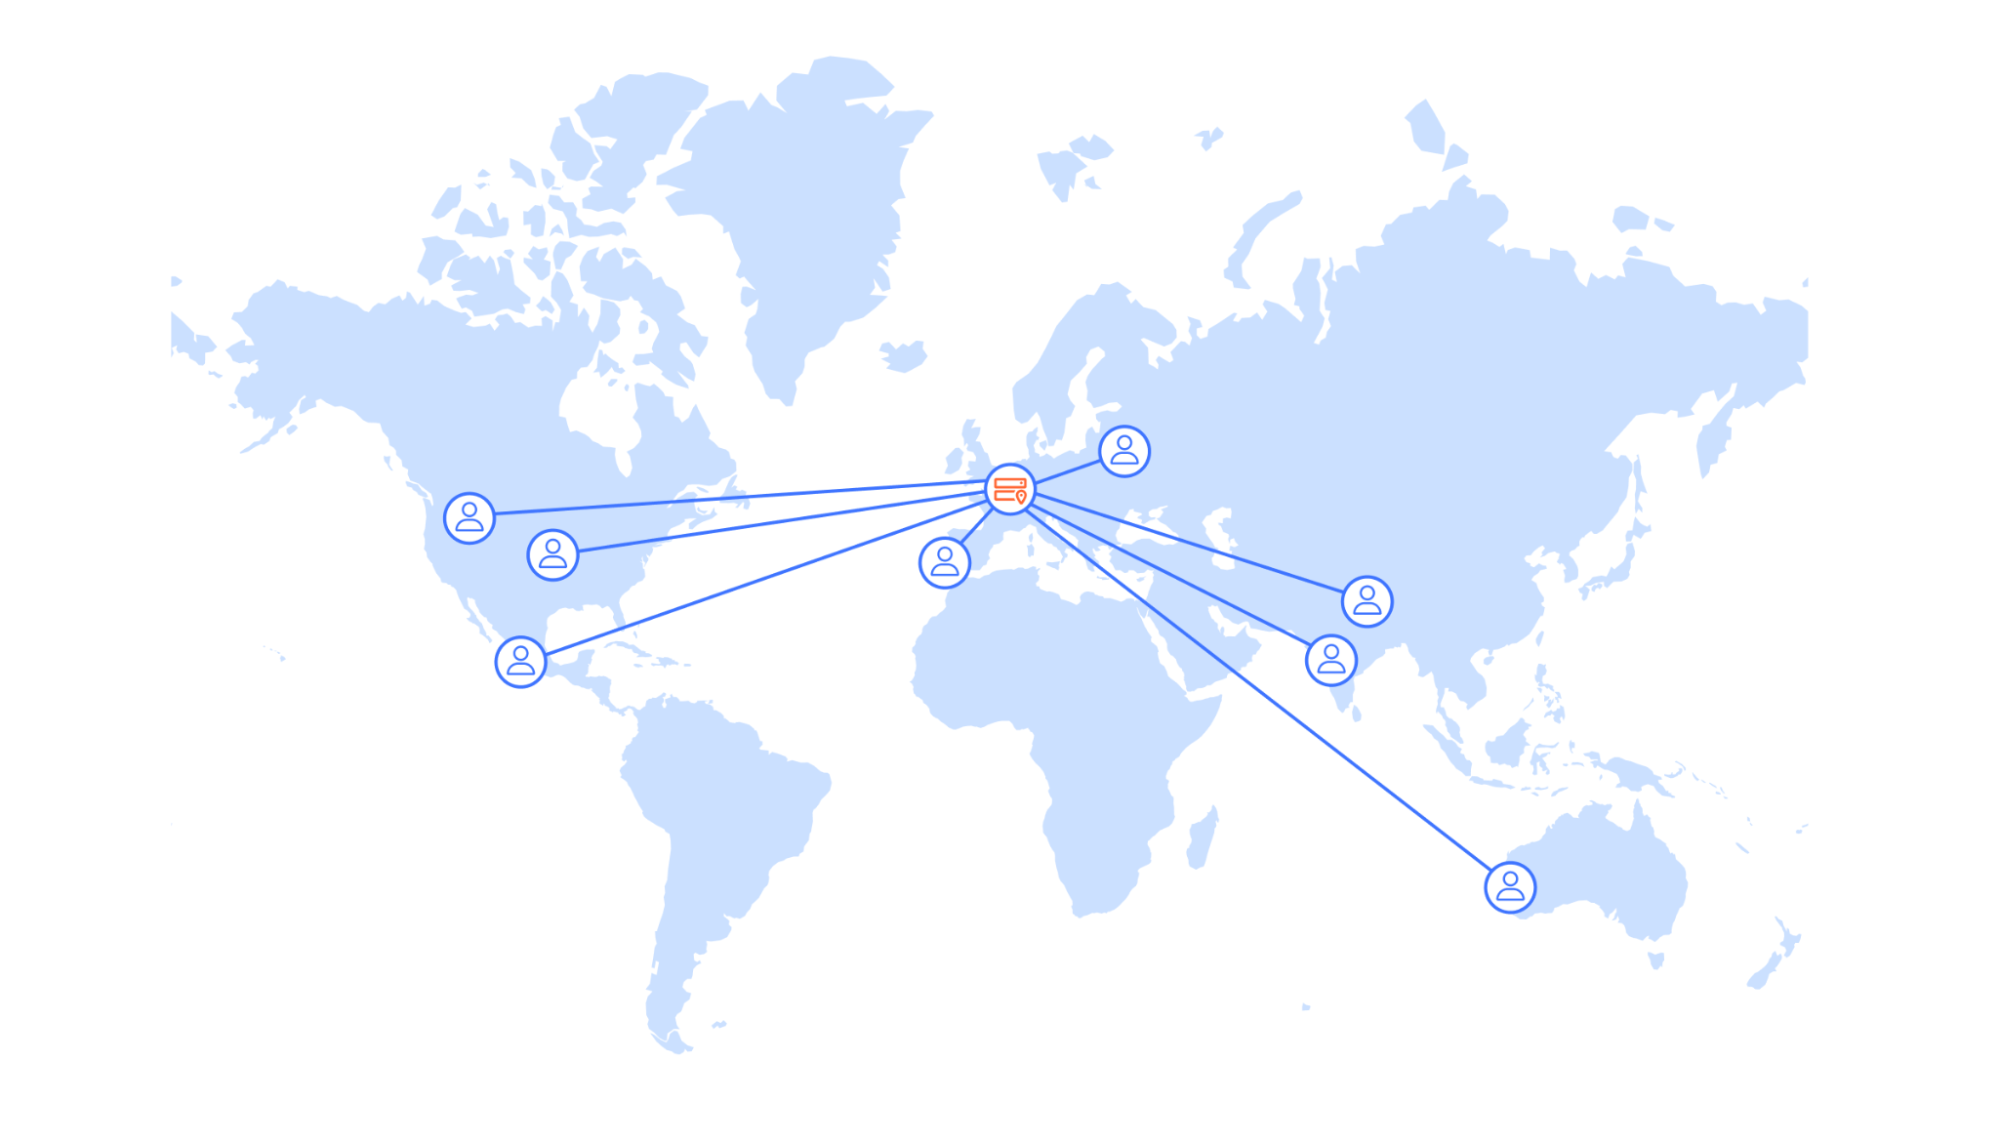
Delivering great user experiences with a global user base can be challenging. While serving requests quickly when you start out in a local market is straightforward, doing so for a global audience is much more difficult. Why? Even under optimal conditions, you cannot be faster than the speed of light, which brings single data center solutions to their performance limits.
In this post, we will cover how Picsart improved the performance of one of its most critical services by moving from a centralized architecture to a globally distributed service built on Cloudflare. Our serverless compute platform, Workers, distributed throughout 310+ cities around the world, and our globally distributed Workers KV storage allowed them to improve their performance significantly and drive real business impact.
Success driven by data-driven insights
Picsart is one of the world’s largest digital creation platforms and a long-standing Cloudflare partner. At its core, an advanced tech stack powers its comprehensive features, including AI-driven photo and video editing tools and community-driven content sharing. With its infrastructure spanning across multiple cloud environments and on-prem deployments, Picsart is engineered to handle billions of daily requests from its huge mobile and web user base and API integrations. For over a decade, Cloudflare has been integral to Picsart, providing support for performant content delivery and securing its digital ecosystem.
Similar to many other tech giants, Picsart approaches product development in a data-driven way. At the core of the innovation is Picsart’s remote configuration and experimentation platform, which enables product managers, UX researchers, and others to segment their user base into different test groups. These test groups might get to see slightly different implementations of features or designs of the Picsart app. Users might also get early access to experimental features or see different in-app promotions. In combination with constant monitoring of relevant KPIs, this allows for informed product decisions based on user preference and business impact.
On each app start, the client device sends a request to the remote configuration service for the latest setup tailored to the user’s session. The assignment of experiments relies on factors like the operating system and previous sessions, making each request unique and uncachable. Picsart’s app showcases extensive remote configuration capabilities, enabling adjustments to nearly every element. This results in a response containing a 1.5 MB configuration file for mobile clients. While the long-term solution is to reduce the file size, which has grown over time as more teams adopted the powerful service, this is not possible in the near or mid-term as it requires a major rewrite of all clients.
This setup request is blocking in the “hot path” during app start, as the results of this request will decide how the app itself looks and behaves. Hence, performance is critical. To ensure users are not waiting for too long, Picsart apps will wait for 1500ms on mobile for the request to complete – if it does not, the user will not be assigned a test group and the app will fallback to default settings.
The clock is ticking
While a 1500ms round trip time seems like a sufficiently large time budget, the data suggested otherwise. Before the improvements were implemented, a staggering 50% of devices could not complete the requests in time. How come? In these 1.5 seconds the following steps need to complete:
The request must travel from the users’ devices to the centralized backend servers
The server processes the request based on dozens of user attributes provided in the request and thousands of defined remote configuration variations, running experiments, and segments metadata. Using all the info, the server selects the right variation of each remote setting entry and builds the response payload.
The response must travel from the centralized backend servers to the user devices.
Looking at the data, it was clear to the Picsart team that their backend service was already well-optimized, taking only 30 milliseconds, a tiny fraction of the available time budget, to process each of the billions of monthly requests. The bulk of the request time came from network latency. Especially with mobile devices, last mile performance can be very volatile, eating away a significant amount of the available time budget. Not only that, but the data was clear: users closer to the origin server had a much higher chance of making the round trip in time versus users out of region. It quickly became obvious that Picsart, fueled by its global success, had outgrown a single-region setup.
To the drawing board
A solution that comes to mind would be to replicate the existing cloud infrastructure in multiple regions and use global load balancing to minimize the distance a request needs to travel. However, this introduces significant overhead and cost. On the infrastructure side, it is not only the additional compute instances and database clusters that incur cost, but also cross-region data transfer to keep data in sync. Moreover, technical teams would need to operate and monitor infrastructure in multiple regions, which can add a lot to the complexity and cognitive load, leading to decreased development velocity and productivity loss.
Workers and Workers KV seemed like the ideal solution. Both compute and data are globally distributed in 310+ locations around the world, resulting in a shorter distance between end users and the experimentation service. Not only that, but Cloudflare’s global-by-default approach allows for deployment with minimal overhead, and in contrast to other considered solutions, no additional fees to distribute the data around the globe.
No race without a clock
The objective for the refactor of the experimentation service was to increase the share of devices that successfully receive experimentation configuration within the set time budget.
But how to measure success? While synthetic testing can be useful in many situations, Picsart opted to come up with another clever solution:
During development, the Picsart engineers had already added a testing endpoint to the web and mobile versions of their app that sends a duplicate request to the new endpoint, discarding the response and swallowing all potential errors. This allows them to collect timing data based on real-user metrics without impacting the app’s performance and reliability.
A simplified version of this pattern for a web client could look like this:
// API endpoint URLs
const prodUrl = 'https://prod.example.com/';
const devUrl = 'https://new.example.com/';

// Function to collect metrics
const collectMetrics = (duration) => {
    console.log('Request duration:', duration);
    // …
};

// Function to fetch data from an endpoint and call collectMetrics
const fetchData = async (url, options) => {
    const startTime = performance.now();

    try {
        const response = await fetch(url, options);
        const endTime = performance.now();
        const duration = endTime - startTime;
        collectMetrics(duration);
        return await response.json();
    } catch (error) {
        console.error('Error fetching data:', error);
    }
};

// Fetching data from both endpoints
async function fetchDataFromBothEndpoints() {
    try {
        const result1 = await fetchData(prodUrl, { method: 'POST', ... });
        console.log('Result from endpoint 1:', result1);

        // Fetching data from the second endpoint without awaiting its completion
        fetchData(devUrl, { method: 'POST', ... });
    } catch (error) {
        console.error('Error fetching data from both endpoints:', error);
    }
}

fetchDataFromBothEndpoints();
Using existing data analytics tools, Picsart was able to analyze the performance of the new services from day one, starting with a dummy endpoint and a ‘hello world’ response. And with that a v0 was created that did not have the correct logic just yet, but simulated reading multiple values from KV and returning a response of a realistic size back to the end user.
The need for a do-over
In the initial phase, outcomes fell short of expectations. Surprisingly, requests were slower despite the service’s proximity to end users. What caused this setback? Subsequent investigation unveiled multiple culprits and design patterns in need for optimization.
Data segmentation
The previous, stateful solution operated on a single massive “blob” of data exceeding 100MB in value. Loading this into memory incurred a few seconds of initial startup time, but once the VM completed the task, request handling was fast, benefiting from the readily available data in memory.
However, this approach doesn’t seamlessly transition to the serverless realm. Unlike long-running VMs, Worker isolates have short lifespans. Repeatedly parsing large JSON objects led to prolonged compute durations. Simply parsing four KV entries of 25MB each (KV maximum value size is 25MB) on each request was not a feasible option.
The Picsart team went back to solution design and embarked on a journey to optimize their system’s execution time, resulting in a series of impactful improvements.
The fundamental insight that guided the solution was the unnecessary overhead that was involved in loading and parsing data irrelevant to the user’s specific context. The 100MB configuration file contained configurations for all platforms and locations worldwide – a setup that was far from efficient in a globally distributed, serverless compute environment. For instance, when processing requests from users in the United States, there was no need to fetch configurations targeted for users in other countries, or for different platforms.
To address this inefficiency, the Picsart team stored the configuration of each platform and country in separate KV records. This targeted strategy meant that for a request originating from a US user on an Android device, our system would only fetch and parse the KV record specific to Android users in the US, thereby excluding all irrelevant data. This resulted in approximately 600 KV records, each with a maximum size of 10MB. While this leads to data duplication on the KV storage side, it decreases the amount of data that needs to be parsed upon request. As Cloudflare operates in over 120 countries around the world, only a subset of records were needed in each location. Hence, the increase in cardinality had minimal impact on KV cache performance, as demonstrated by more than 99.5% of KV reads being served from local cache.
Key
Size
settings_part1.json
25MB
settings_part2.json
25MB
…
….
Before (simplified)
Key
Size
com.picsart.studio_apple_us.json
6.1MB
com.picsart.studio_apple_de.json
6.1MB
com.picsart.studio_android_us.json
5.9MB
…
…
After (simplified)
This approach was a significant move for Picsart as they transitioned from a regional cloud setup to Cloudflare’s globally distributed connectivity cloud. By serving data from close proximity to end user locations, they were able to combat the high network latency from their previous setup. This strategy radically transformed the data-handling process. which unlocked two major benefits:
Performance Gains: By ensuring that only the relevant subset of data is fetched and parsed based on the user’s platform and geographical location, wall time and compute resources required for these operations could be significantly reduced.
Scalability and Flexibility: the granular segmentation of data enables effortless scaling of the service for new features or regional content. Adding support for new applications now only requires inserting new, standalone KV records in contrast to the previous solution where this would require increasing the size of the single record.
Immutable updates
Now that changes to the configuration were segmented by app, country, and platform, this also allowed for individual updates of the configuration in KV. KV storage showcases its best performance when records are updated infrequently but read very often. This pattern leverages KV’s fundamental design to cache values at edge locations upon reads, ensuring that subsequent queries for the same record are swiftly served by local caches rather than requiring a trip back to KV’s centralized data centers. This architecture is fundamental for minimizing latency and maximizing the speed of data retrieval across a globally distributed platform.
A crucial requirement for Picsart’s experimentation system was the ability to propagate updates of remote configuration values immediately. Updating existing records would require very short cache TTLs and even the minimum KV cache TTL of 60 seconds was considered unacceptable for the dynamic nature of the feature flagging. Moreover, setting short TTLs also impacts the cache hit ratio and the overall KV performance, specifically in regions with low traffic.
To reconcile the need for both rapid updates and efficient caching, Picsart adopted an innovative approach: making KV records immutable. Instead of modifying existing records, they opted to create new records with each configuration change. By appending the content hash to the KV key and writing new records after each update, Picsart ensured that each record was unique and immutable. This allowed them to leverage higher cache TTLs, as these records would never be updated.
Key
Size
com.picsart.studio_apple_us.json
60s
…
….
Before (simplified)
Key
Size
com.picsart.studio_apple_us_b58b59.json
86400s
com.picsart.studio_apple_us_273678.json
86400s
–
…
After (simplified)
There was a catch, though. The service must now keep track of the correct KV keys to use. The Picsart team addressed this challenge by storing references to the latest KV keys in the environment variables of the Worker.
Each configuration change triggers a new KV pair to be written and the services’ environment variables to be updated. As global Workers deployments take mere seconds, changes to the experimentation and configuration data are near-instantaneously globally available.
JSON serialization & alternatives
Following the previous improvements, the Picsart team made another significant discovery: only a small fraction of configuration data is needed to assign the experiments, while the remaining majority of the data comprises JSON values for the remote configuration payloads. While the service must deliver the latter in the response, the data is not required during the initial processing phase.
The initial implementation used KV’s get() method to retrieve the configuration data with the parameter type=json, which converts the KV value to an object. This process is very compute-intensive compared to using the get() method with parameter type= text, which simply returns the value as a string. In the context of Picsart’s data, the bulk of the CPU cycles were wasted on serializing JSON data that is not needed to perform the required business logic.
What if the data structure and code could be changed in such a way that only the data needed to assign experiments was parsed as JSON, while the configuration values were treated as text? Picsart went ahead with a new approach: splitting the KV records into two, creating a small 300KB record for the metadata, which can be quickly parsed to an object, and a 9.7MB record of configuration values. The extracted configuration values are delimited by newline characters. The respective line number is used as reference in the metadata entry, so that the respective configuration value for an experiment can be merged back into the payload response later.
After calculating the experiments and selecting the correct variants based solely on the small metadata entry, the service constructs a JSON string for the response containing placeholders for the actual values that reference the corresponding line numbers in the separate text file. To finalize the response, the server replaces the placeholders with the corresponding serialized JSON strings from the text file. This approach circumvents the need for parsing and re-serializing large JSON objects and helps to avoid a significant computational overhead.
Note that the process of parsing the metadata JSON and determining the correct experiments as well as the loading of the large file with configuration values are executed in parallel, saving additional milliseconds.
By minimizing the size of the JSON data that needed to be parsed and leveraging a more efficient method for constructing the final response, the Picsart team managed to not only reduce the response times but also optimize the compute resource usage. This approach reflects a broader principle applicable across the tech industry: that efficiency, particularly in serverless architectures, can often be dramatically improved by rethinking data structure and utilization.
Getting a head start
The changes on the server-side, moving from a single region setup to Cloudflare’s global architecture, paid off massively. Median response times globally dropped by more than 1 second, which was already a huge improvement for the team. However, in looking at the new data, two more paths for client-side optimizations were found.
As the web and mobile app would call the service at startup, most of the time no active connections to the servers were alive and establishing that connection at request time costs valuable milliseconds.
For the web version, setting a pre-connect header on initial page load showed a positive impact. For the mobile app version, the Picsart team took it a step further. Investigation showed that before the connection could be established, three modules had to complete initialization: the error tracker, the HTTP client, and the SDK. Reordering of the modules to initialize the HTTP client first allowed for connection establishment in parallel to the initialization of the SDK and error tracker, again saving time. This resulted in another 200ms improvement for end users.
Setting a new personal best
The day had come and it was time for the phased rollout, web first and the mobile apps second. With suspense, the team looked at the dashboards, and were pleasantly surprised. The rollout was successful and billions of requests were handled with ease.
Share of successfully delivered experiments
The result? The Picsart apps are loading faster than ever for millions of users worldwide, while the share of successfully delivered experiments increased from 50% to 85%. Median response time dropped from 1500 ms to 280 ms. The response time dropped to 70 ms on the web since the response size is smaller compared to mobile. This translates to a real business impact for Picsart as they can now deliver more personalized and data-driven experiences to even more of their users.
A bright future ahead
Picsart is already thinking of the next generation of experimentation. To integrate with Cloudflare even further, the plan is to use Durable Objects to store hundreds of millions of user data records in a decentralized fashion, enabling even more powerful experiments without impacting performance. This is possible thanks to Durable Objects’ underlying architecture that stores the user data in-region, close to the respective end user device.
Beyond that, Picsart’s experimentation team is also planning to onboard external B2B customers to their experimentation platform as Cloudflare’s developer platform provides them with the scale and global network to handle more traffic and data with ease.
Get started yourself
If you’re also working on or with an application that would benefit from Cloudflare’s speed and scale, check out our developer documentation and tutorials, and join our developer Discord to get community support and inspiration.
Inference from fine-tuned LLMs with LoRAs is now in open beta
Today, we’re excited to announce that you can now run fine-tuned inference with LoRAs on Workers AI. This feature is in open beta and available for pre-trained LoRA adapters to be used with Mistral, Gemma, or Llama 2, with some limitations. Take a look at our product announcements blog post to get a high-level overview of our Bring Your Own (BYO) LoRAs feature.
In this post, we’ll do a deep dive into what fine-tuning and LoRAs are, show you how to use it on our Workers AI platform, and then delve into the technical details of how we implemented it on our platform.
What is fine-tuning?
Fine-tuning is a general term for modifying an AI model by continuing to train it with additional data. The goal of fine-tuning is to increase the probability that a generation is similar to your dataset. Training a model from scratch is not practical for many use cases given how expensive and time consuming they can be to train. By fine-tuning an existing pre-trained model, you benefit from its capabilities while also accomplishing your desired task. Low-Rank Adaptation (LoRA) is a specific fine-tuning method that can be applied to various model architectures, not just LLMs. It is common that the pre-trained model weights are directly modified or fused with additional fine-tune weights in traditional fine-tuning methods. LoRA, on the other hand, allows for the fine-tune weights and pre-trained model to remain separate, and for the pre-trained model to remain unchanged. The end result is that you can train models to be more accurate at specific tasks, such as generating code, having a specific personality, or generating images in a specific style. You can even fine-tune an existing LLM to understand additional information about a specific topic.
The approach of maintaining the original base model weights means that you can create new fine-tune weights with relatively little compute. You can take advantage of existing foundational models (such as Llama, Mistral, and Gemma), and adapt them for your needs.
How does fine-tuning work?
To better understand fine-tuning and why LoRA is so effective, we have to take a step back to understand how AI models work. AI models (like LLMs) are neural networks that are trained through deep learning techniques. In neural networks, there are a set of parameters that act as a mathematical representation of the model’s domain knowledge, made up of weights and biases – in simple terms, numbers. These parameters are usually represented as large matrices of numbers. The more parameters a model has, the larger the model is, so when you see models like llama-2-7b, you can read “7b” and know that the model has 7 billion parameters.
A model’s parameters define its behavior. When you train a model from scratch, these parameters usually start off as random numbers. As you train the model on a dataset, these parameters get adjusted bit-by-bit until the model reflects the dataset and exhibits the right behavior. Some parameters will be more important than others, so we apply a weight and use it to show more or less importance. Weights play a crucial role in the model’s ability to capture patterns and relationships in the data it is trained on.
Traditional fine-tuning will adjust all the parameters in the trained model with a new set of weights. As such, a fine-tuned model requires us to serve the same amount of parameters as the original model, which means it can take a lot of time and compute to train and run inference for a fully fine-tuned model. On top of that, new state-of-the-art models, or versions of existing models, are regularly released, meaning that fully fine-tuned models can become costly to train, maintain, and store.
LoRA is an efficient method of fine-tuning
In the simplest terms, LoRA avoids adjusting parameters in a pre-trained model and instead allows us to apply a small number of additional parameters. These additional parameters are applied temporarily to the base model to effectively control model behavior. Relative to traditional fine-tuning methods it takes a lot less time and compute to train these additional parameters, which are referred to as a LoRA adapter. After training, we package up the LoRA adapter as a separate model file that can then plug in to the base model it was trained from. A fully fine-tuned model can be tens of gigabytes in size, while these adapters are usually just a few megabytes. This makes it a lot easier to distribute, and serving fine-tuned inference with LoRA only adds ms of latency to total inference time.
If you’re curious to understand why LoRA is so effective, buckle up — we first have to go through a brief lesson on linear algebra. If that’s not a term you’ve thought about since university, don’t worry, we’ll walk you through it.
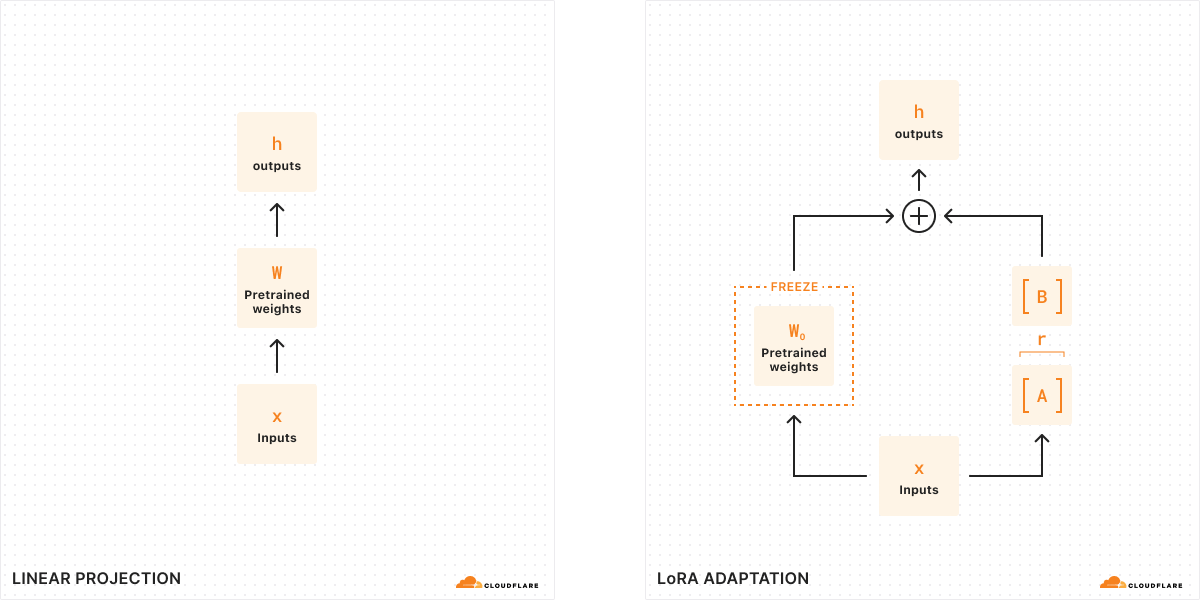
Show me the math
With traditional fine-tuning, we can take the weights of a model (W0) and tweak them to output a new set of weights — so the difference between the original model weights and the new weights is ΔW, representing the change in weights. Therefore, a tuned model will have a new set of weights which can be represented as the original model weights plus the change in weights, W0 + ΔW.
Remember, all of these model weights are actually represented as large matrices of numbers. In math, every matrix has a property called rank (r), which describes the number of linearly independent columns or rows in a matrix. When matrices are low-rank, they have only a few columns or rows that are “important”, so we can actually decompose or split them into two smaller matrices with the most important parameters (think of it like factoring in algebra). This technique is called rank decomposition, which allows us to greatly reduce and simplify matrices while keeping the most important bits. In the context of fine-tuning, rank determines how many parameters get changed from the original model – the higher the rank, the stronger the fine-tune, giving you more granularity over the output.
According to the original LoRA paper, researchers have found that when a model is low-rank, the matrix representing the change in weights is also low-rank. Therefore, we can apply rank decomposition to our matrix representing the change in weights ΔW to create two smaller matrices A, B, where ΔW = BA. Now, the change in the model can be represented by two smaller low-rank matrices. This is why this method of fine-tuning is called Low-Rank Adaptation.
When we run inference, we only need the smaller matrices A, B to change the behavior of the model. The model weights in A, B constitute our LoRA adapter (along with a config file). At runtime, we add the model weights together, combining the original model (W0) and the LoRA adapter (A, B). Adding and subtracting are simple mathematical operations, meaning that we can quickly swap out different LoRA adapters by adding and subtracting A, B from W0.. By temporarily adjusting the weights of the original model, we modify the model’s behavior and output and as a result, we get fine-tuned inference with minimal added latency.
According to the original LoRA paper, “LoRA can reduce the number of trainable parameters by 10,000 times and the GPU memory requirement by 3 times”. Because of this, LoRA is one of the most popular methods of fine-tuning since it’s a lot less computationally expensive than a fully fine-tuned model, doesn’t add any material inference time, and is much smaller and portable.
How can you use LoRAs with Workers AI?
Workers AI is very well-suited to run LoRAs because of the way we run serverless inference. The models in our catalog are always pre-loaded on our GPUs, meaning that we keep them warm so that your requests never encounter a cold start. This means that the base model is always available, and we can dynamically load and swap out LoRA adapters as needed. We can actually plug in multiple LoRA adapters to one base model, so we can serve multiple different fine-tuned inference requests at once.
When you fine-tune with LoRA, your output will be two files: your custom model weights (in safetensors format) and an adapter config file (in json format). To create these weights yourself, you can train a LoRA on your own data using the Hugging Face PEFT (Parameter-Efficient Fine-Tuning) library combined with the Hugging Face AutoTrain LLM library. You can also run your training tasks on services such as Auto Train and Google Colab. Alternatively, there are many open-source LoRA adapters available on Hugging Face today that cover a variety of use cases.
Eventually, we want to support the LoRA training workloads on our platform, but we’ll need you to bring your trained LoRA adapters to Workers AI today, which is why we’re calling this feature Bring Your Own (BYO) LoRAs.
For the initial open beta release, we are allowing people to use LoRAs with our Mistral, Llama, and Gemma models. We have set aside versions of these models which accept LoRAs, which you can access by appending -lora to the end of the model name. Your adapter must have been fine-tuned from one of our supported base models listed below:
@cf/meta-llama/llama-2-7b-chat-hf-lora
@cf/mistral/mistral-7b-instruct-v0.2-lora
@cf/google/gemma-2b-it-lora
@cf/google/gemma-7b-it-lora
As we are launching this feature in open beta, we have some limitations today to take note of: quantized LoRA models are not yet supported, LoRA adapters must be smaller than 100MB and have up to a max rank of 8, and you can try up to 30 LoRAs per account during our initial open beta. To get started with LoRAs on Workers AI, read the Developer Docs.
As always, we expect people to use Workers AI and our new BYO LoRA feature with our Terms of Service in mind, including any model-specific restrictions on use contained in the models’ license terms.
How did we build multi-tenant LoRA serving?
Serving multiple LoRA models simultaneously poses a challenge in terms of GPU resource utilization. While it is possible to batch inference requests to a base model, it is much more challenging to batch requests with the added complexity of serving unique LoRA adapters. To tackle this problem, we leverage the Punica CUDA kernel design in combination with global cache optimizations in order to handle the memory intensive workload of multi-tenant LoRA serving while offering low inference latency.
The Punica CUDA kernel was introduced in the paper Punica: Multi-Tenant LoRA Serving as a method to serve multiple, significantly different LoRA models applied to the same base model. In comparison to previous inference techniques, the method offers substantial throughput and latency improvements. This optimization is achieved in part through enabling request batching even across requests serving different LoRA adapters.
The core of the Punica kernel system is a new CUDA kernel called Segmented Gather Matrix-Vector Multiplication (SGMV). SGMV allows a GPU to store only a single copy of the pre-trained model while serving different LoRA models. The Punica kernel design system consolidates the batching of requests for unique LoRA models to improve performance by parallelizing the feature-weight multiplication of different requests in a batch. Requests for the same LoRA model are then grouped to increase operational intensity. Initially, the GPU loads the base model while reserving most of its GPU memory for KV Cache. The LoRA components (A and B matrices) are then loaded on demand from remote storage (Cloudflare’s cache or R2) when required by an incoming request. This on demand loading introduces only milliseconds of latency, which means that multiple LoRA adapters can be seamlessly fetched and served with minimal impact on inference performance. Frequently requested LoRA adapters are cached for the fastest possible inference.
Once a requested LoRA has been cached locally, the speed it can be made available for inference is constrained only by PCIe bandwidth. Regardless, given that each request may require its own LoRA, it becomes critical that LoRA downloads and memory copy operations are performed asynchronously. The Punica scheduler tackles this exact challenge, batching only requests which currently have required LoRA weights available in GPU memory, and queueing requests that do not until the required weights are available and the request can efficiently join a batch.
By effectively managing KV cache and batching these requests, it is possible to handle significant multi-tenant LoRA-serving workloads. A further and important optimization is the use of continuous batching. Common batching methods require all requests to the same adapter to reach their stopping condition before being released. Continuous batching allows a request in a batch to be released early so that it does not need to wait for the longest running request.
Given that LLMs deployed to Cloudflare’s network are available globally, it is important that LoRA adapter models are as well. Very soon, we will implement remote model files that are cached at Cloudflare’s edge to further reduce inference latency.
A roadmap for fine-tuning on Workers AI
Launching support for LoRA adapters is an important step towards unlocking fine-tunes on our platform. In addition to the LLM fine-tunes available today, we look forward to supporting more models and a variety of task types, including image generation.
Our vision for Workers AI is to be the best place for developers to run their AI workloads — and this includes the process of fine-tuning itself. Eventually, we want to be able to run the fine-tuning training job as well as fully fine-tuned models directly on Workers AI. This unlocks many use cases for AI to be more relevant in organizations by empowering models to have more granularity and detail for specific tasks.
With AI Gateway, we will be able to help developers log their prompts and responses, which they can then use to fine-tune models with production data. Our vision is to have a one-click fine-tuning service, where log data from AI Gateway can be used to retrain a model (on Cloudflare) and then the fine-tuned model can be redeployed on Workers AI for inference. This will allow developers to personalize their AI models to fit their applications, allowing for granularity as low as a per-user level. The fine-tuned model can then be smaller and more optimized, helping users save time and money on AI inference – and the magic is that all of this can all happen within our very own Developer Platform.
We’re excited for you to try the open beta for BYO LoRAs! Read our Developer Docs for more details, and tell us what you think on Discord.
Welcome to Tuesday – our AI day of Developer Week 2024! In this blog post, we’re excited to share an overview of our new AI announcements and vision, including news about Workers AI officially going GA with improved pricing, a GPU hardware momentum update, an expansion of our Hugging Face partnership, Bring Your Own LoRA fine-tuned inference, Python support in Workers, more providers in AI Gateway, and Vectorize metadata filtering.
Workers AI GA
Today, we’re excited to announce that our Workers AI inference platform is now Generally Available. After months of being in open beta, we’ve improved our service with greater reliability and performance, unveiled pricing, and added many more models to our catalog.
Improved performance & reliability
With Workers AI, our goal is to make AI inference as reliable and easy to use as the rest of Cloudflare’s network. Under the hood, we’ve upgraded the load balancing that is built into Workers AI. Requests can now be routed to more GPUs in more cities, and each city is aware of the total available capacity for AI inference. If the request would have to wait in a queue in the current city, it can instead be routed to another location, getting results back to you faster when traffic is high. With this, we’ve increased rate limits across all our models – most LLMs now have a of 300 requests per minute, up from 50 requests per minute during our beta phase. Smaller models have a limit of 1500-3000 requests per minute. Check out our Developer Docs for the rate limits of individual models.
Lowering costs on popular models
Alongside our GA of Workers AI, we published a pricing calculator for our 10 non-beta models earlier this month. We want Workers AI to be one of the most affordable and accessible solutions to run inference, so we added a few optimizations to our models to make them more affordable. Now, Llama 2 is over 7x cheaper and Mistral 7B is over 14x cheaper to run than we had initially published on March 1. We want to continue to be the best platform for AI inference and will continue to roll out optimizations to our customers when we can.
As a reminder, our billing for Workers AI started on April 1st for our non-beta models, while beta models remain free and unlimited. We offer 10,000 neurons per day for free to all customers. Workers Free customers will encounter a hard rate limit after 10,000 neurons in 24 hours while Workers Paid customers will incur usage at $0.011 per 1000 additional neurons. Read our Workers AI Pricing Developer Docs for the most up-to-date information on pricing.
New dashboard and playground
Lastly, we’ve revamped our Workers AI dashboard and AI playground. The Workers AI page in the Cloudflare dashboard now shows analytics for usage across models, including neuron calculations to help you better predict pricing. The AI playground lets you quickly test and compare different models and configure prompts and parameters. We hope these new tools help developers start building on Workers AI seamlessly – go try them out!
Run inference on GPUs in over 150 cities around the world
When we announced Workers AI back in September 2023, we set out to deploy GPUs to our data centers around the world. We plan to deliver on that promise and deploy inference-tuned GPUs almost everywhere by the end of 2024, making us the most widely distributed cloud-AI inference platform. We have over 150 cities with GPUs today and will continue to roll out more throughout the year.
We also have our next generation of compute servers with GPUs launching in Q2 2024, which means better performance, power efficiency, and improved reliability over previous generations. We provided a preview of our Gen 12 Compute servers design in a December 2023 blog post, with more details to come. With Gen 12 and future planned hardware launches, the next step is to support larger machine learning models and offer fine-tuning on our platform. This will allow us to achieve higher inference throughput, lower latency and greater availability for production workloads, as well as expanding support to new categories of workloads such as fine-tuning.
Hugging Face Partnership
We’re also excited to continue our partnership with Hugging Face in the spirit of bringing the best of open-source to our customers. Now, you can visit some of the most popular models on Hugging Face and easily click to run the model on Workers AI if it is available on our platform.
We’re happy to announce that we’ve added 4 more models to our platform in conjunction with Hugging Face. You can now access the new Mistral 7B v0.2 model with improved context windows, Nous Research’s Hermes 2 Pro fine-tuned version of Mistral 7B, Google’s Gemma 7B, and Starling-LM-7B-beta fine-tuned from OpenChat. There are currently 14 models that we’ve curated with Hugging Face to be available for serverless GPU inference powered by Cloudflare’s Workers AI platform, with more coming soon. These models are all served using Hugging Face’s technology with a TGI backend, and we work closely with the Hugging Face team to curate, optimize, and deploy these models.
“We are excited to work with Cloudflare to make AI more accessible to developers. Offering the most popular open models with a serverless API, powered by a global fleet of GPUs is an amazing proposition for the Hugging Face community, and I can’t wait to see what they build with it.” – Julien Chaumond, Co-founder and CTO, Hugging Face
You can find all of the open models supported in Workers AI in this Hugging Face Collection, and the “Deploy to Cloudflare Workers AI” button is at the top of each model card. To learn more, read Hugging Face’s blog post and take a look at our Developer Docs to get started. Have a model you want to see on Workers AI? Send us a message on Discord with your request.
Supporting fine-tuned inference – BYO LoRAs
Fine-tuned inference is one of our most requested features for Workers AI, and we’re one step closer now with Bring Your Own (BYO) LoRAs. Using the popular Low-Rank Adaptation method, researchers have figured out how to take a model and adapt some model parameters to the task at hand, rather than rewriting all model parameters like you would for a fully fine-tuned model. This means that you can get fine-tuned model outputs without the computational expense of fully fine-tuning a model.
We now support bringing trained LoRAs to Workers AI, where we apply the LoRA adapter to a base model at runtime to give you fine-tuned inference, at a fraction of the cost, size, and speed of a fully fine-tuned model. In the future, we want to be able to support fine-tuning jobs and fully fine-tuned models directly on our platform, but we’re excited to be one step closer today with LoRAs.
const response = await ai.run(
  "@cf/mistralai/mistral-7b-instruct-v0.2-lora", //the model supporting LoRAs
  {
      messages: [{"role": "user", "content": "Hello world"],
      raw: true, //skip applying the default chat template
      lora: "00000000-0000-0000-0000-000000000", //the finetune id OR name
  }
);
BYO LoRAs is in open beta as of today for Gemma 2B and 7B, Llama 2 7B and Mistral 7B models with LoRA adapters up to 100MB in size and max rank of 8, and up to 30 total LoRAs per account. As always, we expect you to use Workers AI and our new BYO LoRA feature with our Terms of Service in mind, including any model-specific restrictions on use contained in the models’ license terms.
Python is the second most popular programming language in the world (after JavaScript) and the language of choice for building AI applications. And starting today, in open beta, you can now write Cloudflare Workers in Python. Python Workers support all bindings to resources on Cloudflare, including Vectorize, D1, KV, R2 and more.
…and are configured by simply pointing at a .py file in your wrangler.toml:
name = "hello-world-python-worker"
main = "src/entry.py"
compatibility_date = "2024-03-18"
compatibility_flags = ["python_workers"]
There are no extra toolchain or precompilation steps needed. The Pyodide Python execution environment is provided for you, directly by the Workers runtime, mirroring how Workers written in JavaScript already work.
There’s lots more to dive into — take a look at the docs, and check out our companion blog post for details about how Python Workers work behind the scenes.
AI Gateway now supports Anthropic, Azure, AWS Bedrock, Google Vertex, and Perplexity
Our AI Gateway product helps developers better control and observe their AI applications, with analytics, caching, rate limiting, and more. We are continuing to add more providers to the product, including Anthropic, Google Vertex, and Perplexity, which we’re excited to announce today. We quietly rolled out Azure and Amazon Bedrock support in December 2023, which means that the most popular providers are now supported via AI Gateway, including Workers AI itself.
Take a look at our Developer Docs to get started with AI Gateway.
Coming soon: Persistent Logs
In Q2 of 2024, we will be adding persistent logs so that you can push your logs (including prompts and responses) to object storage, custom metadata so that you can tag requests with user IDs or other identifiers, and secrets management so that you can securely manage your application’s API keys.
We want AI Gateway to be the control plane for your AI applications, allowing developers to dynamically evaluate and route requests to different models and providers. With our persistent logs feature, we want to enable developers to use their logged data to fine-tune models in one click, eventually running the fine-tune job and the fine-tuned model directly on our Workers AI platform. AI Gateway is just one product in our AI toolkit, but we’re excited about the workflows and use cases it can unlock for developers building on our platform, and we hope you’re excited about it too.
Vectorize metadata filtering and future GA of million vector indexes
Vectorize is another component of our toolkit for AI applications. In open beta since September 2023, Vectorize allows developers to persist embeddings (vectors), like those generated from Workers AI text embedding models, and query for the closest match to support use cases like similarity search or recommendations. Without a vector database, model output is forgotten and can’t be recalled without extra costs to re-run a model.
Since Vectorize’s open beta, we’ve added metadata filtering. Metadata filtering lets developers combine vector search with filtering for arbitrary metadata, supporting the query complexity in AI applications. We’re laser-focused on getting Vectorize ready for general availability, with an target launch date of June 2024, which will include support for multi-million vector indexes.
The most comprehensive Developer Platform to build AI applications
On Cloudflare’s Developer Platform, we believe that all developers should be able to quickly build and ship full-stack applications – and that includes AI experiences as well. With our GA of Workers AI, announcements for Python support in Workers, AI Gateway, and Vectorize, and our partnership with Hugging Face, we’ve expanded the world of possibilities for what you can build with AI on our platform. We hope you are as excited as we are – take a look at all our Developer Docs to get started, and let us know what you build.
This new support for Python is different from how Workers have historically supported languages beyond JavaScript — in this case, we have directly integrated a Python implementation into workerd, the open-source Workers runtime. All bindings, including bindings to Vectorize, Workers AI, R2, Durable Objects, and more are supported on day one. Python Workers can import a subset of popular Python packages including FastAPI, Langchain, Numpy and more. There are no extra build steps or external toolchains.
To do this, we’ve had to push the bounds of all of our systems, from the runtime itself, to our deployment system, to the contents of the Worker bundle that is published across our network. You can read the docs, and start using it today.
We want to use this post to pull back the curtain on the internal lifecycle of a Python Worker, share what we’ve learned in the process, and highlight where we’re going next.
Beyond “Just compile to WebAssembly”
Cloudflare Workers have supported WebAssembly since 2018 — each Worker is a V8 isolate, powered by the same JavaScript engine as the Chrome web browser. In principle, it’s been possible for years to write Workers in any language — including Python — so long as it first compiles to WebAssembly or to JavaScript.
In practice, just because something is possible doesn’t mean it’s simple. And just because “hello world” works doesn’t mean you can reliably build an application. Building full applications requires supporting an ecosystem of packages that developers are used to building with. For a platform to truly support a programming language, it’s necessary to go much further than showing how to compile code using external toolchains.
Python Workers are different from what we’ve done in the past. It’s early, and still in beta, but we think it shows what providing first-class support for programming languages beyond JavaScript can look like on Workers.
Create an isolate for your Worker, and automatically inject Pyodide
Serve your Python code using Pyodide
This all happens under the hood — no extra toolchain or precompilation steps needed. The Python execution environment is provided for you, mirroring how Workers written in JavaScript already work.
A Python interpreter built into the Workers runtime
Just as JavaScript has many engines, Python has many implementations that can execute Python code. CPython is the reference implementation of Python. If you’ve used Python before, this is almost certainly what you’ve used, and is commonly referred to as just “Python”.
Pyodide is a port of CPython to WebAssembly. It interprets Python code, without any need to precompile the Python code itself to any other format. It runs in a web browser — check out this REPL. It is true to the CPython that Python developers know and expect, providing most of the Python Standard Library. It provides a foreign function interface (FFI) to JavaScript, allowing you to call JavaScript APIs directly from Python — more on this below. It provides popular open-source packages, and can import pure Python packages directly from PyPI.
Pyodide struck us as the perfect fit for Workers. It is designed to allow the core interpreter and each native Python module to be built as separate WebAssembly modules, dynamically linked at runtime. This allows the code footprint for these modules to be shared among all Workers running on the same machine, rather than requiring each Worker to bring its own copy. This is essential to making WebAssembly work well in the Workers environment, where we often run thousands of Workers per machine — we need Workers using the same programming language to share their runtime code footprint. Running thousands of Workers on every machine is what makes it possible for us to deploy every application in every location at a reasonable price.
Just like with JavaScript Workers, with Python Workers we provide the runtime for you:
Pyodide is currently the exception — most languages that target WebAssembly do not yet support dynamic linking, so each application ends up bringing its own copy of its language runtime. We hope to see more languages support dynamic linking in the future, so that we can more effectively bring them to Workers.
How Pyodide works
Pyodide executes Python code in WebAssembly, which is a sandboxed environment, separated from the host runtime. Unlike running native code, all operations outside of pure computation (such as file reads) must be provided by a runtime environment, then imported by the WebAssembly module.
LLVM provides three target triples for WebAssembly:
wasm32-unknown-unknown – this backend provides no C standard library or system call interface; to support this backend, we would need to manually rewrite every system or library call to make use of imports we would define ourselves in the runtime.
wasm32-wasi – WASI is a standardized system interface, and defines a standard set of imports that are implemented in WASI runtimes such as wasmtime.
wasm32-unknown-emscripten – Like WASI, Emscripten defines the imports that a WebAssembly program needs to execute, but also outputs an accompanying JavaScript library that implements these imported functions.
Pyodide uses Emscripten, and provides three things:
A distribution of the CPython interpreter, compiled using Emscripten
A foreign function interface (FFI) between Python and JavaScript
A set of third-party Python packages, compiled using Emscripten’s compiler to WebAssembly.
Of these targets, only Emscripten currently supports dynamic linking, which, as we noted above, is essential to providing a shared language runtime for Python that is shared across isolates. Emscripten does this by providing implementations of dlopen and dlsym, which use the accompanying JavaScript library to modify the WebAssembly program’s table to link additional WebAssembly-compiled modules at runtime. WASI does not yet support the dlopen/dlsym dynamic linking abstractions used by CPython.
Pyodide and the magic of foreign function interfaces (FFI)
You might have noticed that in our Hello World Python Worker, we import Response from the js module:
Most Workers are written in JavaScript, and most of our engineering effort on the Workers runtime goes into improving JavaScript Workers. There is a risk in adding a second language that it might never reach feature parity with the first language and always be a second class citizen. Pyodide’s foreign function interface (FFI) is critical to avoiding this by providing access to all JavaScript functionality from Python. This can be used by the Worker author directly, and it is also used to make packages like FastAPI and Langchain work out-of-the-box, as we’ll show later in this post.
An FFI is a system for calling functions in one language that are implemented in another language. In most cases, an FFI is defined by a “higher-level” language in order to call functions implemented in a systems language, often C. Python’s ctypes module is such a system. These sorts of foreign function interfaces are often difficult to use because of the nature of C APIs.
Pyodide’s foreign function interface is an interface between Python and JavaScript, which are two high level object-oriented languages with a lot of design similarities. When passed from one language to another, immutable types such as strings and numbers are transparently translated. All mutable objects are wrapped in an appropriate proxy.
When a JavaScript object is passed into Python, Pyodide determines which JavaScript protocols the object supports and dynamically constructs an appropriate Python class that implements the corresponding Python protocols. For example, if the JavaScript object supports the JavaScript iteration protocol then the proxy will support the Python iteration protocol. If the JavaScript object is a Promise or other thenable, the Python object will be an awaitable.
from js import JSON

js_array = JSON.parse("[1,2,3]")

for entry in js_array:
   print(entry)
The lifecycle of a request to a Python Worker makes use of Pyodide’s FFI, wrapping the incoming JavaScript Request object in a JsProxy object that is accessible in your Python code. It then converts the value returned by the Python Worker’s handler into a JavaScript Response object that can be delivered back to the client:
Why dynamic linking is essential, and static linking isn’t enough
Python comes with a C FFI, and many Python packages use this FFI to import native libraries. These libraries are typically written in C, so they must first be compiled down to WebAssembly in order to work on the Workers runtime. As we noted above, Pyodide is built with Emscripten, which overrides Python’s C FFI — any time a package tries to load a native library, it is instead loaded from a WebAssembly module that is provided by the Workers runtime. Dynamic linking is what makes this possible — it is what lets us override Python’s C FFI, allowing Pyodide to support many Python packages that have native library dependencies.
Dynamic linking is “pay as you go”, while static linking is “pay upfront” — if code is statically linked into your binary, it must be loaded upfront in order for the binary to run, even if this code is never used.
Dynamic linking enables the Workers runtime to share the underlying WebAssembly modules of packages across different Workers that are running on the same machine.
We won’t go too much into detail on how dynamic linking works in Emscripten, but the main takeaway is that the Emscripten runtime fetches WebAssembly modules from a filesystem abstraction provided in JavaScript. For each Worker, we generate a filesystem at runtime, whose structure mimics a Python distribution that has the Worker’s dependencies installed, but whose underlying files are shared between Workers. This makes it possible to share Python and WebAssembly files between multiple Workers that import the same dependency. Today, we’re able to share these files across Workers, but copy them into each new isolate. We think we can go even further, by employing copy-on-write techniques to share the underlying resource across many Workers.
Supporting Server and Client libraries
Python has a wide variety of popular HTTP client libraries, including httpx, urllib3, requests and more. Unfortunately, none of them work out of the box in Pyodide. Adding support for these has been one of the longest running user requests for the Pyodide project. The Python HTTP client libraries all work with raw sockets, and the browser security model and CORS do not allow this, so we needed another way to make them work in the Workers runtime.
Async Client libraries
For libraries that can make requests asynchronously, including aiohttp and httpx, we can use the Fetch API to make requests. We do this by patching the library, instructing it to use the Fetch API from JavaScript — taking advantage of Pyodide’s FFI. The httpx patch ends up quite simple —fewer than 100 lines of code. Simplified even further, it looks like this:
Another challenge in supporting Python HTTP client libraries is that many Python APIs are synchronous. For these libraries, we cannot use the fetch API directly because it is asynchronous.
Thankfully, Joe Marshall recently landed a contribution to urllib3 that adds Pyodide support in web browsers by:
Checking if blocking with Atomics.wait() is possible a. If so, start a fetch worker thread b. Delegate the fetch operation to the worker thread and serialize the response into a SharedArrayBuffer c. In the Python thread, use Atomics.wait to block for the response in the SharedArrayBuffer
If Atomics.wait() doesn’t work, fall back to a synchronous XMLHttpRequest
Despite this, today Cloudflare Workers do not support worker threads or synchronous XMLHttpRequest, so neither of these two approaches will work in Python Workers. We do not support synchronous requests today, but there is a way forward…
FastAPI and Python’s Asynchronous Server Gateway Interface
FastAPI is one of the most popular libraries for defining Python servers. FastAPI applications use a protocol called the Asynchronous Server Gateway Interface (ASGI). This means that FastAPI never reads from or writes to a socket itself. An ASGI application expects to be hooked up to an ASGI server, typically uvicorn. The ASGI server handles all of the raw sockets on the application’s behalf.
Conveniently for us, this means that FastAPI works in Cloudflare Workers without any patches or changes to FastAPI itself. We simply need to replace uvicorn with an appropriate ASGI server that can run within a Worker. Our initial implementation lives here, in the fork of Pyodide that we maintain. We hope to add a more comprehensive feature set, add test coverage, and then upstream this implementation into Pyodide.
You can try this yourself by cloning cloudflare/python-workers-examples, and running npx wrangler@latest dev in the directory of the FastAPI example.
Importing Python Packages
Python Workers support a subset of Python packages, which are provided directly by Pyodide, including numpy, httpx, FastAPI, Langchain, and more. This ensures compatibility with the Pyodide runtime by pinning package versions to Pyodide versions, and allows Pyodide to patch internal implementations, as we showed above in the case of httpx.
To import a package, simply add it to your requirements.txt file, without adding a version number. A specific version of the package is provided directly by Pyodide. Today, you can use packages in local development, and in the coming weeks, you will be able to deploy Workers that define dependencies in a requirements.txt file. Later in this post, we’ll show how we’re thinking about managing new versions of Pyodide and packages.
We maintain our own fork of Pyodide, which allows us to provide patches specific to the Workers runtime, and to quickly expand our support for packages in Python Workers, while also committing to upstreaming our changes back to Pyodide, so that the whole ecosystem of developers can benefit.
Python packages are often big and memory hungry though, and they can do a lot of work at import time. How can we ensure that you can bring in the packages you need, while mitigating long cold start times?
Making cold starts faster with memory snapshots
In the example at the start of this post, in local development, we mentioned injecting Pyodide into your Worker. Pyodide itself is 6.4MB — and Python packages can also be quite large.
If we simply shoved Pyodide into your Worker and uploaded it to Cloudflare, that’d be quite a large Worker to load into a new isolate — cold starts would be slow. On a fast computer with a good network connection, Pyodide takes about two seconds to initialize in a web browser, one second of network time and one second of cpu time. It wouldn’t be acceptable to initialize it every time you update your code for every isolate your Worker runs in across Cloudflare’s network.
Wrangler uploads your Python code and your requirements.txt file to the Workers API
We send your Python code, and your requirements.txt file to the Workers runtime to be validated
We create a new isolate for your Worker, and automatically inject Pyodide plus any packages you’ve specified in your requirements.txt file.
We scan the Worker’s code for import statements, execute them, and then take a snapshot of the Worker’s WebAssembly linear memory. Effectively, we perform the expensive work of importing packages at deploy time, rather than at runtime.
We deploy this snapshot alongside your Worker’s Python code to Cloudflare’s network.
Just like a JavaScript Worker, we execute the Worker’s top-level scope.
When a request comes in to your Worker, we load this snapshot and use it to bootstrap your Worker in an isolate, avoiding expensive initialization time:
This takes cold starts for a basic Python Worker down to below 1 second. We’re not yet satisfied with this though. We’re confident that we can drive this down much, much further. How? By reusing memory snapshots.
Reusing Memory Snapshots
When you upload a Python Worker, we generate a single memory snapshot of the Worker’s top-level imports, including both Pyodide and any dependencies. This snapshot is specific to your Worker. It can’t be shared, even though most of its contents are the same as other Python Workers.
Instead, we can create a single, shared snapshot ahead of time, and preload it into a pool of “pre-warmed” isolates. These isolates would already have the Pyodide runtime loaded and ready — making a Python Worker work just like a JavaScript Worker. In both cases, the underlying interpreter and execution environment is provided by the Workers runtime, and available on-demand without delay. The only difference is that with Python, the interpreter runs in WebAssembly, within the Worker.
Snapshots are a common pattern across runtimes and execution environments. Node.js uses V8 snapshots to speed up startup time. You can take snapshots of Firecracker microVMs and resume execution in a different process. There’s lots more we can do here — not just for Python Workers, but for Workers written in JavaScript as well, caching snapshots of compiled code from top-level scope and the state of the isolate itself. Workers are so fast and efficient that to-date we haven’t had to take snapshots in this way, but we think there are still big performance gains to be had.
This is our biggest lever towards driving cold start times down over the rest of 2024.
Future proofing compatibility with Pyodide versions and Compatibility Dates
When you deploy a Worker to Cloudflare, you expect it to keep running indefinitely, even if you never update it again. There are Workers deployed in 2018 that are still running just fine in production.
We achieve this using Compatibility Dates and Compatibility Flags, which provide explicit opt-in mechanisms for new behavior and potentially backwards-incompatible changes, without impacting existing Workers.
This works in part because it mirrors how the Internet and web browsers work. You publish a web page with some JavaScript, and rightly expect it to work forever. Web browsers and Cloudflare Workers have the same type of commitment of stability to developers.
There is a challenge with Python though — both Pyodide and CPython are versioned. Updated versions are published regularly and can contain breaking changes. And Pyodide provides a set of built-in packages, each with a pinned version number. This presents a question — how should we allow you to update your Worker to a newer version of Pyodide?
A new version of Python is released every year in August, and a new version of Pyodide is released six (6) months later. When this new version of Pyodide is published, we will add it to Workers by gating it behind a Compatibility Flag, which is only enabled after a specified Compatibility Date. This lets us continually provide updates, without risk of breaking changes, extending the commitment we’ve made for JavaScript to Python.
Each Python release has a five (5) year support window. Once this support window has passed for a given version of Python, security patches are no longer applied, making this version unsafe to rely on. To mitigate this risk, while still trying to hold as true as possible to our commitment of stability and long-term support, after five years any Python Worker still on a Python release that is outside of the support window will be automatically moved forward to the next oldest Python release. Python is a mature and stable language, so we expect that in most cases, your Python Worker will continue running without issue. But we recommend updating the compatibility date of your Worker regularly, to stay within the support window.
In between Python releases, we also expect to update and add additional Python packages, using the same opt-in mechanism. A Compatibility Flag will be a combination of the Python version and the release date of a set of packages. For example, python_3.17_packages_2025_03_01.
How bindings work in Python Workers
We mentioned earlier that Pyodide provides a foreign function interface (FFI) to JavaScript — meaning that you can directly use JavaScript objects, methods, functions and more, directly from Python.
This means that from day one, all binding APIs to other Cloudflare resources are supported in Cloudflare Workers. The env object that is provided by handlers in Python Workers is a JavaScript object that Pyodide provides a proxy API to, handling type translations across languages automatically.
For example, to write to and read from a KV namespace from a Python Worker, you would write:
from js import Response

async def on_fetch(request, env):
    await env.FOO.put("bar", "baz")
    bar = await env.FOO.get("bar")
    return Response.new(bar) # returns "baz"
This works for Web APIs too — see how Response is imported from the js module? You can import any global from JavaScript this way.
Get this JavaScript out of my Python!
You’re probably reading this post because you want to write Python instead of JavaScript. from js import Response just isn’t Pythonic. We know — and we have actually tackled this challenge before for another language (Rust). And we think we can do this even better for Python.
We launched workers-rs in 2021 to make it possible to write Workers in Rust. For each JavaScript API in Workers, we, alongside open-source contributors, have written bindings that expose a more idiomatic Rust API.
We plan to do the same for Python Workers — starting with the bindings to Workers AI and Vectorize. But while workers-rs requires that you use and update an external dependency, the APIs we provide with Python Workers will be built into the Workers runtime directly. Just update your compatibility date, and get the latest, most Pythonic APIs.
This is about more than just making bindings to resources on Cloudflare more Pythonic though — it’s about compatibility with the ecosystem.
Similar to how we recently converted workers-rs to use types from the http crate, which makes it easy to use the axum crate for routing, we aim to do the same for Python Workers. For example, the Python standard library provides a raw socket API, which many Python packages depend on. Workers already provides connect(), a JavaScript API for working with raw sockets. We see ways to provide at least a subset of the Python standard library’s socket API in Workers, enabling a broader set of Python packages to work on Workers, with less of a need for patches.
But ultimately, we hope to kick start an effort to create a standardized serverless API for Python. One that is easy to use for any Python developer and offers the same capabilities as JavaScript.
We’re just getting started with Python Workers
Providing true support for a new programming language is a big investment that goes far beyond making “hello world” work. We chose Python very intentionally — it’s the second most popular programming language after JavaScript — and we are committed to continuing to improve performance and widen our support for Python packages.
We’re grateful to the Pyodide maintainers and the broader Python community — and we’d love to hear from you. Drop into the Python Workers channel in the Cloudflare Developers Discord, or start a discussion on Github about what you’d like to see next and which Python packages you’d like us to support.
Developers who build Worker applications focus on what they’re creating, not the infrastructure required, and benefit from the global reach of Cloudflare’s network. Many applications require persistent data, from personal projects to business-critical workloads. Workers offer various database and storage options tailored to developer needs, such as key-value and object storage.
Relational databases are the backbone of many applications today. D1, Cloudflare’s relational database complement, is now generally available. Our journey from alpha in late 2022 to GA in April 2024 focused on enabling developers to build production workloads with the familiarity of relational data and SQL.
What’s D1?
D1 is Cloudflare’s built-in, serverless relational database. For Worker applications, D1 offers SQL’s expressiveness, leveraging SQLite’s SQL dialect, and developer tooling integrations, including object-relational mappers (ORMs) like Drizzle ORM. D1 is accessible via Workers or an HTTP API.
Serverless means no provisioning, default disaster recovery with Time Travel, and usage-based pricing. D1 includes a generous free tier that allows developers to experiment with D1 and then graduate those trials to production.
How to make data global?
D1 GA has focused on reliability and developer experience. Now, we plan on extending D1 to better support globally-distributed applications.
In the Workers model, an incoming request invokes serverless execution in the closest data center. A Worker application can scale globally with user requests. Application data, however, remains stored in centralized databases, and global user traffic must account for access round trips to data locations. For example, a D1 database today resides in a single location.
Workers support Smart Placement to account for frequently accessed data locality. Smart Placement invokes a Worker closer to centralized backend services like databases to lower latency and improve application performance. We’ve addressed Workers placement in global applications, but need to solve data placement.
The question, then, is how can D1, as Cloudflare’s built-in database solution, better support data placement for global applications? The answer is asynchronous read replication.
What is asynchronous read replication?
In a server-based database management system, like Postgres, MySQL, SQL Server, or Oracle, a read replica is a separate database server that serves as a read-only, almost up-to-date copy of the primary database server. An administrator creates a read replica by starting a new server from a snapshot of the primary server and configuring the primary server to send updates asynchronously to the replica server. Since the updates are asynchronous, the read replica may be behind the current state of the primary server. The difference between the primary server and a replica is called replica lag. It’s possible to have more than one read replica.
Asynchronous read replication is a time-proven solution for improving the performance of databases:
It’s possible to increase throughput by distributing load across multiple replicas.
It’s possible to lower query latency when the replicas are close to the users making queries.
Note that some database systems also offer synchronous replication. In a synchronous replicated system, writes must wait until all replicas have confirmed the write. Synchronous replicated systems can run only as fast as the slowest replica and come to a halt when a replica fails. If we’re trying to improve performance on a global scale, we want to avoid synchronous replication as much as possible!
Consistency models & read replicas
Most database systems provide read committed, snapshot isolation, or serializable consistency models, depending on their configuration. For example, Postgres defaults to read committed but can be configured to use stronger modes. SQLite provides snapshot isolation in WAL mode. Stronger modes like snapshot isolation or serializable are easier to program against because they limit the permitted system concurrency scenarios and the kind of concurrency race conditions the programmer has to worry about.
Read replicas are updated independently, so each replica’s contents may differ at any moment. If all of your queries go to the same server, whether the primary or a read replica, your results should be consistent according to whatever consistency model your underlying database provides. If you’re using a read replica, the results may just be a little old.
In a server-based database with read replicas, it’s important to stick with the same server for all of the queries in a session. If you switch among different read replicas in the same session, you compromise the consistency model provided by your application, which may violate your assumptions about how the database acts and cause your application to return incorrect results!
Example For example, there are two replicas, A and B. Replica A lags the primary database by 100ms, and replica B lags the primary database by 2s. Suppose a user wishes to:
Execute query 1
1a. Do some computation based on query 1 results
Execute query 2 based on the results of the computation in (1a)
At time t=10s, query 1 goes to replica A and returns. Query 1 sees what the primary database looked like at t=9.9s. Suppose it takes 500ms to do the computation, so at t=10.5s, query 2 goes to replica B. Remember, replica B lags the primary database by 2s, so at t=10.5s, query 2 sees what the database looks like at t=8.5s. As far as the application is concerned, the results of query 2 look like the database has gone backwards in time!
Formally, this is read committed consistency since your queries will only see committed data, but there’s no other guarantee – not even that you can read your own writes. While read committed is a valid consistency model, it’s hard to reason about all of the possible race conditions the read committed model allows, making it difficult to write applications correctly.
Snapshot isolation is a familiar consistency model that most developers find easy to use. We implement this consistency model in D1 by ensuring at most one active copy of the D1 database and routing all HTTP requests to that single database. While ensuring that there’s at most one active copy of the D1 database is a gnarly distributed systems problem, it’s one that we’ve solved by building D1 using Durable Objects. Durable Objects guarantee global uniqueness, so once we depend on Durable Objects, routing HTTP requests is easy: just send them to the D1 Durable Object.
This trick doesn’t work if you have multiple active copies of the database since there’s no 100% reliable way to look at a generic incoming HTTP request and route it to the same replica 100% of the time. Unfortunately, as we saw in the previous section’s example, if we don’t route related requests to the same replica 100% of the time, the best consistency model we can provide is read committed.
Given that it’s impossible to route to a particular replica consistently, another approach is to route requests to any replica and ensure that the chosen replica responds to requests according to a consistency model that “makes sense” to the programmer. If we’re willing to include a Lamport timestamp in our requests, we can implement sequential consistency using any replica. The sequential consistency model has important properties like “read my own writes” and “writes follow reads,” as well as a total ordering of writes. The total ordering of writes means that every replica will see transactions commit in the same order, which is exactly the behavior we want in a transactional system. Sequential consistency comes with the caveat that any individual entity in the system may be arbitrarily out of date, but that caveat is a feature for us because it allows us to consider replica lag when designing our APIs.
The idea is that if D1 gives applications a Lamport timestamp for every database query and those applications tell D1 the last Lamport timestamp they’ve seen, we can have each replica determine how to make queries work according to the sequential consistency model.
A robust, yet simple, way to implement sequential consistency with replicas is to:
Associate a Lamport timestamp with every single request to the database. A monotonically increasing commit token works well for this.
Send all write queries to the primary database to ensure the total ordering of writes.
Send read queries to any replica, but have the replica delay servicing the query until the replica receives updates from the primary database that are later than the Lamport timestamp in the query.
What’s nice about this implementation is that it’s fast in the common case where a read-heavy workload always goes to the same replica and will work even if requests get routed to different replicas.
Sneak Preview: bringing read replication to D1 with Sessions
To bring read replication to D1, we will expand the D1 API with a new concept: Sessions. A Session encapsulates all the queries representing one logical session for your application. For example, a Session might represent all requests coming from a particular web browser or all requests coming from a mobile app. If you use Sessions, your queries will use whatever copy of the D1 database makes the most sense for your request, be that the primary database or a nearby replica. D1’s Sessions implementation will ensure sequential consistency for all queries in the Session.
Since the Sessions API changes D1’s consistency model, developers must opt-in to the new API. Existing D1 API methods are unchanged and will still have the same snapshot isolation consistency model as before. However, only queries made using the new Sessions API will use replicas.
Here’s an example of the D1 Sessions API:
export default {
  async fetch(request: Request, env: Env) {
    // When we create a D1 Session, we can continue where we left off
    // from a previous Session if we have that Session's last commit
    // token.  This Worker will return the commit token back to the
    // browser, so that it can send it back on the next request to
    // continue the Session.
    //
    // If we don't have a commit token, make the first query in this
    // session an "unconditional" query that will use the state of the
    // database at whatever replica we land on.
    const token = request.headers.get('x-d1-token') ?? 'first-unconditional'
    const session = env.DB.withSession(token)


    // Use this Session for all our Workers' routes.
    const response = await handleRequest(request, session)


    if (response.status === 200) {
      // Set the token so we can continue the Session in another request.
      response.headers.set('x-d1-token', session.latestCommitToken)
    }
    return response
  }
}


async function handleRequest(request: Request, session: D1DatabaseSession) {
  const { pathname } = new URL(request.url)


  if (pathname === '/api/orders/list') {
    // This statement is a read query, so it will execute on any
    // replica that has a commit equal or later than `token` we used
    // to create the Session.
    const { results } = await session.prepare('SELECT * FROM Orders').all()


    return Response.json(results)
  } else if (pathname === '/api/orders/add') {
    const order = await request.json<Order>()


    // This statement is a write query, so D1 will send the query to
    // the primary, which always has the latest commit token.
    await session
      .prepare('INSERT INTO Orders VALUES (?, ?, ?)')
      .bind(order.orderName, order.customer, order.value)
      .run()


    // In order for the application to be correct, this SELECT
    // statement must see the results of the INSERT statement above.
    // The Session API keeps track of commit tokens for queries
    // within the session and will ensure that we won't execute this
    // query until whatever replica we're using has seen the results
    // of the INSERT.
    const { results } = await session
      .prepare('SELECT COUNT(*) FROM Orders')
      .all()


    return Response.json(results)
  }


  return new Response('Not found', { status: 404 })
}
D1’s implementation of Sessions makes use of commit tokens. Commit tokens identify a particular committed query to the database. Within a session, D1 will use commit tokens to ensure that queries are sequentially ordered. In the example above, the D1 session ensures that the “SELECT COUNT(*)” query happens after the “INSERT” of the new order, even if we switch replicas between the awaits.
There are several options on how you want to start a session in a Workers fetch handler. db.withSession(<condition>) accepts these arguments:
condition argument
Behavior
<commit_token>
(1) starts Session as of given commit token
(2) subsequent queries have sequential consistency
first-unconditional
(1) if the first query is read, read whatever current replica has and use the commit token of that read as the basis for subsequent queries. If the first query is a write, forward the query to the primary and use the commit token of the write as the basis for subsequent queries.
(2) subsequent queries have sequential consistency
first-primary
(1) runs first query, read or write, against the primary
(2) subsequent queries have sequential consistency
null or missing argument
treated like first-unconditional
It’s possible to have a session span multiple requests by “round-tripping” the commit token from the last query of the session and using it to start a new session. This enables individual user agents, like a web app or a mobile app, to make sure that all of the queries the user sees are sequentially consistent.
D1’s read replication will be built-in, will not incur extra usage or storage costs, and will require no replica configuration. Cloudflare will monitor an application’s D1 traffic and automatically create database replicas to spread user traffic across multiple servers in locations closer to users. Aligned with our serverless model, D1 developers shouldn’t worry about replica provisioning and management. Instead, developers should focus on designing applications for replication and data consistency tradeoffs.
We’re actively working on global read replication and realizing the above proposal (share feedback In the #d1 channel on our Developer Discord). Until then, D1 GA includes several exciting new additions.
Check out D1 GA
Since D1’s open beta in October 2023, we’ve focused on D1’s reliability, scalability, and developer experience demanded of critical services. We’ve invested in several new features that allow developers to build and debug applications faster with D1.
Build bigger with larger databases We’ve listened to developers who requested larger databases. D1 now supports up to 10GB databases, with 50K databases on the Workers Paid plan. With D1’s horizontal scaleout, applications can model database-per-business-entity use cases. Since beta, new D1 databases process 40x more requests than D1 alpha databases in a given period.
Import & export bulk data Developers import and export data for multiple reasons:
Database migration testing to/from different database systems
Data copies for local development or testing
Manual backups for custom requirements like compliance
While you could execute SQL files against D1 before, we’re improving wrangler d1 execute –file=<filename> to ensure large imports are atomic operations, never leaving your database in a halfway state. wrangler d1 execute also now defaults to local-first to protect your remote production database.
To import our Northwind Traders demo database, you can download the schema & data and execute the SQL files.
npx wrangler d1 create northwind-traders

# omit --remote to run on a local database for development
npx wrangler d1 execute northwind-traders --remote --file=./schema.sql

npx wrangler d1 execute northwind-traders --remote --file=./data.sql
D1 database data & schema, schema-only, or data-only can be exported to a SQL file using:
# database schema & data
npx wrangler d1 export northwind-traders --remote --output=./database.sql

# single table schema & data
npx wrangler d1 export northwind-traders --remote --table='Employee' --output=./table.sql

# database schema only
npx wrangler d1 export <database_name> --remote --output=./database-schema.sql --no-data=true
Debug query performance Understanding SQL query performance and debugging slow queries is a crucial step for production workloads. We’ve added the experimental wrangler d1 insights to help developers analyze query performance metrics also available via GraphQL API.
# To find top 10 queries by average execution time:
npx wrangler d1 insights <database_name> --sort-type=avg --sort-by=time --count=10
Developer tooling Various community developer projects support D1. New additions include Prisma ORM, in version 5.12.0, which now supports Workers and D1.
Next steps
The features available now with GA and our global read replication design are just the start of delivering the SQL database needs for developer applications. If you haven’t yet used D1, you can get started right now, visit D1’s developer documentation to spark some ideas, or join the #d1 channel on our Developer Discord to talk to other D1 developers and our product engineering team.
If you’ve ever written a Cloudflare Worker using Workers KV for storage, you may have noticed something unsettling.
// A simple Worker that always returns the value named "content",
// read from Workers KV storage.
export default {
  async fetch(request, env, ctx) {
    return new Response(await env.MY_KV.get("content"));
  }
}
Do you feel something is… missing? Like… Where is the setup? The authorization keys? The client library instantiation? Aren’t environment variables normally strings? How is it that env.MY_KV seems to be an object with a get() method that is already hooked up?
Coming from any other platform, you might expect to see something like this instead:
// How would a "typical cloud platform" do it?

// Import KV client library?
import { KV } from "cloudflare:kv";

export default {
  async fetch(request, env, ctx) {
    // Connect to the database?? Using my secret auth key???
    // Which comes from an environment variable????
    let myKv = KV.connect("my-kv-namespace", env.MY_KV_AUTHKEY);

    return new Response(await myKv.get("content"));
  }
}
As another example, consider service bindings, which allow a Worker to send requests to another Worker.
// A simple Worker that greets an authenticated user, delegating to a
// separate service to perform authentication.
export default {
  async fetch(request, env, ctx) {
    // Forward headers to auth service to get user info.
    let authResponse = await env.AUTH_SERVICE.fetch(
        "https://auth/getUser",
        {headers: request.headers});
    let userInfo = await authResponse.json();
    return new Response("Hello, " + userInfo.name);
  }
}
Notice in particular the use of env.AUTH_SERVICE.fetch() to send the request. This sends the request directly to the auth service, regardless of the hostname we give in the URL.
On “typical” platforms, you’d expect to use a real (perhaps internal) hostname to route the request instead, and also include some credentials proving that you’re allowed to use the auth service API:
// How would a "typical cloud platform" do it?
export default {
  async fetch(request, env, ctx) {
    // Forward headers to auth service, via some internal hostname?
    // Hostname needs to be configurable, so get it from an env var.
    let authRequest = new Request(
        "https://" + env.AUTH_SERVICE_HOST + "/getUser",
        {headers: request.headers});

    // We also need to prove that our service is allowed to talk to
    // the auth service API. Add a header for that, containing a
    // secret token from our environment.
    authRequest.headers.set("X-Auth-Service-Api-Key",
        env.AUTH_SERVICE_API_KEY);

    // Now we can make the request.
    let authResponse = await fetch(authRequest);
    let userInfo = await authResponse.json();
    return new Response("Hello, " + userInfo.name);
  }
}
As you can see, in Workers, the “environment” is not just a bunch of strings. It contains full-fledged objects. We call each of these objects a “binding“, because it binds the environment variable name to a resource. You configure exactly what resource a name is bound to when you deploy your Worker – again, just like a traditional environment variable, but not limited to strings.
We can clearly see above that bindings eliminate a little bit of boilerplate, which is nice. But, there’s so much more.
Bindings don’t just reduce boilerplate. They are a core design feature of the Workers platform which simultaneously improve developer experience and application security in several ways. Usually these two goals are in opposition to each other, but bindings elegantly solve for both at the same time.
Security
It may not be obvious at first glance, but bindings neatly solve a number of common security problems in distributed systems.
SSRF is Not A Thing
Bindings, when used properly, make Workers immune to Server-Side Request Forgery (SSRF) attacks, one of the most common yet deadly security vulnerabilities in application servers today. In an SSRF attack, an attacker tricks a server into making requests to other internal services that only it can see, thus giving the attacker access to those internal services.
As an example, imagine we have built a social media application where users are able to set their avatar image. Imagine that, as a convenience, instead of uploading an image from their local disk, a user can instead specify the URL of an image on a third-party server, and the application server will fetch that image to use as the avatar. Sounds reasonable, right? We can imagine the app contains some code like:
let resp = await fetch(userAvatarUrl);
let data = await resp.arrayBuffer();
await setUserAvatar(data);
One problem: What if the user claims their avatar URL is something like “https://auth-service.internal/status”? Whoops, now the above code will actually fetch a status page from the internal auth service, and set it as the user’s avatar. Presumably, the user can then download their own avatar, and it’ll contain the content of this status page, which they were not supposed to be able to access!
But using bindings, this is impossible: There is no URL that the attacker can specify to reach the auth service. The application must explicitly use the binding env.AUTH_SERVICE to reach it. The global fetch() function cannot reach the auth service no matter what URL it is given; it can only make requests to the public Internet.
A legacy caveat: When we originally designed Workers in 2017, the primary use case was implementing a middleware layer in front of an origin server, integrated with Cloudflare’s CDN. At the time, bindings weren’t a thing yet, and we were primarily trying to implement the Service Workers interface. To that end, we made a design decision: when a Worker runs on Cloudflare in front of some origin server, if you invoke the global fetch() function with a URL that is within your zone’s domain, the request will be sent directly to the origin server, bypassing most logic Cloudflare would normally apply to a request received from the Internet. Sadly, this means that Workers which run in front of an origin server are not immune to SSRF – they must worry about it just like traditional servers on private networks must. Although this puts Workers in the same place as most servers, we now see a path to make SSRF a thing you never have to worry about when writing Workers. We will be introducing “origin bindings”, where the origin server is represented by an explicit binding. That is, to send a request to your origin, you’d need to do env.ORIGIN.fetch(). Then, the global fetch() function can be restricted to only talk to the public Internet, fully avoiding SSRF. This is a big change and we need to handle backwards-compatibility carefully – expect to see more in the coming months. Meanwhile, for Workers that do not have an origin server behind them, or where the origin server does not rely on Cloudflare for security, global fetch() is SSRF-safe today.
And a reminder: Requests originating from Workers have a header, CF-Worker, identifying the domain name that owns the Worker. This header is intended for abuse mitigation: if your server is receiving abusive requests from a Worker, it tells you who to blame and gives you a way to filter those requests. This header is not intended for authorization. You should not implement a private API that grants access to your Workers based solely on the CF-Worker header matching your domain. If you do, you may re-open the opportunity for SSRF vulnerabilities within any Worker running on that domain.
You can’t leak your API key if there is no API key
Usually, if your web app needs access to a protected resource, you will have to obtain some sort of an API key that grants access to the resource. But typically anyone who has this key can access the resource as if they were the Worker. This makes handling auth keys tricky. You can’t put it directly in a config file, unless the entire config file is considered a secret. You can’t check it into source control – you don’t want to publish your keys to GitHub! You probably shouldn’t even store the key on your hard drive – what if your laptop is compromised? And so on.
Even if you have systems in place to deliver auth keys to services securely (like Workers Secrets), if the key is just a string, the service itself can easily leak it. For instance, a developer might carelessly insert a log statement for debugging which logs the service’s configuration – including keys. Now anyone who can access your logs can discover the secret, and there’s probably no practical way to tell if such a leak has occurred.
With Workers bindings, we endeavor for bindings to be live objects, not secret keys. For instance, as seen in the first example in this post, when using a Workers KV binding, you never see a key at all. It’s therefore impossible for a Worker to accidentally leak access to a KV namespace.
No certificate management
This is similar to the API key problem, but arguably worse. When internal services talk to each other over a network, you presumably want them to use secure transports, but typically that requires that every service have a certificate and a private key signed by some CA, and clients must be configured to trust that CA. This is all a big pain to manage, and often the result is that developers don’t bother; they set up a VPC and assume the network is trusted.
In Workers, since all intra-service communications happen over a binding, the system itself can take on all the work of ensuring the transport is secure and goes to the right place.
No frustrating ACL management – but also no lazy “allow all”
At this point you might be thinking: Why are we talking about API keys at all? Cloudflare knows which Worker is sending any request. Can’t it handle the authentication that way?
Consider the earlier example where we imagined that KV namespaces could be opened by name:
// Imagine KV namespaces could be open by name?
let myKv = KV.connect("my-kv-namespace", env.MY_KV_AUTHKEY);
What if we made it simply:
// No authkey, because the system knows whether the Worker has
// permission?
let myKv = KV.connect("my-kv-namespace");
We could then imagine that we could separately configure each KV namespace with an Access Control List (ACL) that specifies which Workers can access it.
Of course, the first problem with this is that it’s vulnerable to SSRF. But, we discussed that already, so let’s discuss another problem.
Many platforms use ACLs for security, but have you ever noticed how everyone hates them? You end up with two choices:
Tediously maintain ACLs on every resource. Inevitably, this is always a huge pain. First you deploy your code, which you think is properly configured. Then you discover that it’s failing with permissions errors causing a production outage! So you go fiddle with the IAM system. There are 533,291 roles to choose from and none of them are actually what you want. It turns out you’re supposed to create a custom role, but that’s not obvious, and once you get there, the UI is confusing. Also it’s easy to confuse your team’s service account with your team’s email group, so you give the permissions to the wrong principal, but it takes you an hour of staring at it to realize what you did wrong. Then somehow you manage to remove your own access to the resource and you can’t add it back even though you’re a project admin? (Why yes, all this did in fact happen to me, while using a cloud provider that shall remain nameless.)
Give up and grant everything access to everything. Just put all your services in a single VPC where they can all freely talk to each other. This is what most developers are inclined to do, if their security team doesn’t step in to stop them.
Much of this pain comes about because connecting a server to a resource today involves two steps that should really be one step:
Configure the server to point at the resource.
Configure the resource to accept requests from the server.
Developers are primarily concerned with step 1, and forget that step 2 exists until it blows up in their faces. Then it’s a mad scramble to learn how step 2 even works.
What if step 1 just implied step 2? Obviously, if you’re trying to configure a service to access a resource, then you also want the resource to allow access to the service. As long as the person trying to set this up has permissions to both, then there is no reason for this to be a two-step process.
But in typical platforms, the platform itself has no way of knowing that a service has been configured to talk to a resource, because the configuration is just a string.
Bindings fix that. When you define a binding from a Worker to a particular KV namespace, the platform inherently understands that you are telling the Worker to use the KV namespace. Therefore, it can implicitly ensure that the correct permissions are granted. There is no step 2.
And conversely, if no binding is configured, then the Worker does not have access. That means that every Worker starts out with no access by default, and only receives access to exactly the things it needs. Secure by default.
As a related benefit, you can always accurately answer the question “What services are using this resource?” based on bindings. Since the system itself understands bindings and what they point to, the system can answer the query without knowing anything about the service’s internals.
Developer Experience
We’ve seen that bindings improve security in a number of ways. Usually, people expect security and developer friendliness to be a trade-off, with each security measure making life harder for developers. Bindings, however, are entirely the opposite! They actually make life easier!
Easier setup
As we saw in the intro, using a binding reduces setup boilerplate. Instead of receiving an environment variable containing an API key which must be passed into some sort of library, the environment variable itself is an already-initialized client library.
Observability
Because the system understands what bindings a Worker has, and even exactly when those bindings are exercised, the system can answer a lot of questions that would normally require more manual instrumentation or analysis to answer, such as:
For a given Worker, what resources does it use? Since the system understands the types of all bindings and what they point to (it doesn’t just see them as opaque strings), it can answer this question.
For a given resource, which Workers use it? This is the reverse query. The system can maintain an index of bindings in order to find ones pointing at a given resource.
How often does a particular Worker use a particular resource? Since bindings are invoked by calling methods on the binding itself, the system can observe these calls, log them, collect metrics, etc.
Testability via dependency injection
When you deploy a test version of your service, you probably want it to operate on test resources rather than real production resources. For instance, you might have a separate testing KV namespace for storage. But, you probably want to deploy exactly the same code to test that you will eventually deploy to production. That means the names of these resources cannot be hard-coded.
On traditional platforms, the obvious way to avoid hard-coding resource names is to put the name in an environment variable. Going back to our example from the intro, if KV worked in a traditional way not using bindings, you might end up with code like this:
// Hypothetical non-binding-based KV.
let myKv = KV.connect(env.MY_KV_NAMESPACE, env.MY_KV_AUTHKEY);
At best, you now have two environment variables (which had better stay in sync) just to specify what namespace to use.
But at worst, developers might forget to parameterize their resources this way.
A developer may write new code that is hard-coded to use a test database, and then forget to update it before pushing it to production, accidentally using the test database in prod.
A developer might prototype a new service using production resources from the start (or using new resources which become production resources), only later on deciding that they need to create a new deployment for testing. But by then, it may be a pain to find and parameterize all the different resources used.
With bindings, it’s impossible to have this problem. Since you can only connect to a KV namespace through a binding, it’s always possible to make a separate deployment of the same code which talks to a test namespace instead of production, e.g. using Wrangler Environments.
In the testing world, this is sometimes called “dependency injection”. With bindings, dependencies are always injectable.
Adaptability
Dependency injection isn’t just for tests. A service whose dependencies can be changed out easily will be easier to deploy into new environments, including new production environments.
Say, for instance, you have a service that authenticates users. Now you are launching a new product, which, for whatever reason, has a separate userbase from the original product. You need to deploy a new version of the auth service that uses a different database to implement a separate user set. As long as all dependencies are injectable, this should be easy.
Again, bindings are not the only way to achieve dependency injection, but a bindings-based system will tend to lead developers to write dependency-injectable code by default.
Q&A
Has anyone done this before?
You have. Every time you write code.
As it turns out, this approach is used all the time at the programming language level. Bindings are analogous to parameters of a function, or especially parameters to a class constructor. In a memory-safe programming language, you can’t access an object unless someone has passed you a pointer or reference to that object. Objects in memory don’t have URLs that you use to access them.
Programming languages work this way because they are designed to manage complexity, and this proves to be an elegant way to do so. Yet, this style which we’re used to using at the programming language level is much less common at the distributed system level. The Cloudflare Workers platform aims to treat the network as one big computer, and so it makes sense to extend programming language concepts across the network.
Of course, we’re not the first to apply this to distributed systems, either. The paradigm is commonly called “capability-based security”, which brings us to the next question…
Is this capability-based security?
Bindings are very much inspired by capability-based security.
At present, bindings are not a complete capability system. In particular, there is currently no particular mechanism for a Worker to pass a binding to another Worker. However, this is something we can definitely imagine adding in the future.
Imagine, for instance, you want to call another Worker through a service binding, and as you do, you want to give that other Worker temporary access to a KV namespace for it to operate on. Wouldn’t it be nice if you could just pass the object, and have it auto-revoked at the end of the request? In the future, we might introduce a notion of dynamic bindings which can bind to different resources on a per-request basis, where a calling Worker can pass in a particular value to use for a given request.
For the time being, bindings cannot really be called object capabilities. However, many of the benefits of bindings are the same benefits commonly attributed to capability systems. This is because of some basic similarities:
Like a capability, a binding simultaneously designates a resource and also confers permission to access that resource, without referencing any separate ACL.
Like capabilities, bindings do not exist in any global namespace: they are scoped to the env object passed to a specific Worker.
Like a capability, to use a binding, the application must explicitly specify which binding it is trying to use, and only specifies the binding. In particular, the application does not separately specify the name of the resource in any other namespace (no URL, no global ID, etc.). The existence of the binding only affects the application’s behavior when the application explicitly invokes that binding.
Why is env a parameter to fetch(), not global?
This is a bit wonky, but the goal is to enable composition of Workers.
Imagine you have two Workers, one which implements your API, mapped to api.example.com, and one which serves static assets, mapped to assets.example.com. One day, for whatever reason, you decide you want to combine these two Workers into a single Worker. So you write this code:
import apiWorker from "api-worker.js";
import assetWorker from "asset-worker.js";

export default {
  async fetch(req, env, ctx) {
    let url = new URL(req.url);
    if (url.hostname == "api.example.com") {
      return apiWorker.fetch(req, env, ctx);
    } else if (url.hostname == "assets.example.com") {
      return assetWorker.fetch(req, env, ctx);
    } else {
      return new Response("Not found", {status: 404});
    }
  }
}
This is great! No code from either Worker needed to be modified at all. We just create a new file containing a router Worker that delegates to one or the other.
But, you discover a problem: both the API Worker and the assets Worker use a KV namespace binding, and it turns out that they both decided to name the binding env.KV, but these bindings are meant to point to different namespaces used for different purposes. Does this mean I have to go edit the Workers to change the name of the binding before I can merge them?
No, it doesn’t, because I can just remap the environments before delegating:
import apiWorker from "api-worker.js";
import assetWorker from "asset-worker.js";

export default {
  async fetch(req, env, ctx) {
    let url = new URL(req.url);
    if (url.hostname == "api.example.com") {
      let subenv = {KV: env.API_KV};
      return apiWorker.fetch(req, subenv, ctx);
    } else if (url.hostname == "assets.example.com") {
      let subenv = {KV: env.ASSETS_KV};
      return assetWorker.fetch(req, subenv, ctx);
    } else {
      return new Response("Not found", {status: 404});
    }
  }
}
If environments were globals, this remapping would not be possible.
In fact, this benefit goes much deeper than this somewhat-contrived example. The fact that the environment is not a global essentially forces code to be internally designed for dependency injection (DI). Designing code to be DI-friendly sometimes seems tedious, but every time I’ve done it, I’ve been incredibly happy that I did. Such code tends to be much easier to test and to adapt to new circumstances, for the same reasons mentioned when we discussed dependency injection earlier, but applying at the level of individual modules rather than whole Workers.
With that said, if you really insist that you don’t care about making your code explicitly DI-friendly, there is an alternative: Put your env into AsyncLocalStorage. That way it is “ambiently” available anywhere in your code, but you can still get some composability.
import { AsyncLocalStorage } from 'node:async_hooks';

// Allocate a new AsyncLocalStorage to store the value of `env`.
const ambientEnv = new AsyncLocalStorage();

// We can now define a global function that reads a key from env.MY_KV,
// without having to pass `env` down to it.
function getFromKv(key) {
  // Get the env from AsyncLocalStorage.
  return ambientEnv.getStore().MY_KV.get(key);
}

export default {
  async fetch(req, env, ctx) {
    // Put the env into AsyncLocalStorage while we handle the request,
    // so that calls to getFromKv() work.
    return ambientEnv.run(env, async () => {
      // Handle request, including calling functions that may call
      // getFromKv().

      // ... (code) ...
    });
  }
};
How does a KV binding actually work?
Under the hood, a Workers KV binding encapsulates a secret key used to access the corresponding KV namespace. This key is actually the encryption key for the namespace. The key is distributed to the edge along with the Worker’s code and configuration, using encrypted storage to keep it safe.
Although the key is distributed with the Worker, the Worker itself has no way to access the key. In fact, even the owner of the Cloudflare account cannot see the key – it is simply never revealed outside of Cloudflare’s systems. (Cloudflare employees are also prevented from viewing these keys.)
Even if an attacker somehow got ahold of the key, it would not be useful to them as-is. Cloudflare’s API does not provide any way for a user to upload a raw key to use in a KV binding. The API instead has the client specify the public ID of the namespace they want to use. The deployment system verifies that the KV namespace in question is on the same account as the Worker being uploaded (and that the client is authorized to deploy Workers on said account).
Get Started
To learn about all the types of bindings offered by Workers and how to use them, check out the documentation.
Today might be April Fools, and while we like to have fun as much as anyone else, we like to use this day for serious announcements. In fact, as of today, there are over 2 million developers building on top of Cloudflare’s platform — that’s no joke!
To kick off this Developer Week, we’re flipping the big “production ready” switch on three products: D1, our serverless SQL database; Hyperdrive, which makes your existing databases feel like they’re distributed (and faster!); and Workers Analytics Engine, our time-series database.
We’ve been on a mission to allow developers to bring their entire stack to Cloudflare for some time, but what might an application built on Cloudflare look like?
The diagram itself shouldn’t look too different from the tools you’re already familiar with: you want a database for your core user data. Object storage for assets and user content. Maybe a queue for background tasks, like email or upload processing. A fast key-value store for runtime configuration. Maybe even a time-series database for aggregating user events and/or performance data. And that’s before we get to AI, which is increasingly becoming a core part of many applications in search, recommendation and/or image analysis tasks (at the very least!).
Yet, without having to think about it, this architecture runs on Region: Earth, which means it’s scalable, reliable and fast — all out of the box.
D1: Production Ready
Your core database is one of the most critical pieces of your infrastructure. It needs to be ultra-reliable. It can’t lose data. It needs to scale. And so we’ve been heads down over the last year getting the pieces into place to make sure D1 is production-ready, and we’re extremely excited to say that D1 — our global, serverless SQL database — is now Generally Available.
The GA for D1 lands some of the most asked-for features, including:
Support for 10GB databases — and 50,000 databases per account;
New data export capabilities; and
Enhanced query debugging (we call it “D1 Insights”) — that allows you to understand what queries are consuming the most time, cost, or that are just plain inefficient…
… to empower developers to build production-ready applications with D1 to meet all their relational SQL needs. And importantly, in an era where the concept of a “free plan” or “hobby plan” is seemingly at risk, we have no intention of removing the free tier for D1 or reducing the 25 billion row reads included in the $5/mo Workers Paid plan:
Plan
Rows Read
Rows Written
Storage
WorkersPaid
First 25 billion / month included + $0.001 / million rows
First 50 million / month included + $1.00 / million rows
First 5 GB included
+ $0.75 / GB-mo
Workers Free
5 million / day
100,000 / day
5 GB (total)
For those who’ve been following D1 since the start: this is the same pricing we announced at open beta
But things don’t just stop at GA: we have some major new features lined up for D1, including global read replication, even larger databases, more Time Travel capabilities that will allow you to branch your database, and new APIs for dynamically querying and/or creating new databases-on-the-fly from within a Worker.
D1’s read replication will automatically deploy read replicas as needed to get data closer to your users: and without you having to spin up, manage scaling, or run into consistency (replication lag) issues. Here’s a sneak preview of what D1’s upcoming Replication API looks like:
export default {
  async fetch(request: Request, env: Env) {
    const {pathname} = new URL(request.url);
    let resp = null;
    let session = env.DB.withSession(token); // An optional commit token or mode

    // Handle requests within the session.
    if (pathname === "/api/orders/list") {
      // This statement is a read query, so it will work against any
      // replica that has a commit equal or later than `token`.
      const { results } = await session.prepare("SELECT * FROM Orders");
      resp = Response.json(results);
    } else if (pathname === "/api/orders/add") {
      order = await request.json();

      // This statement is a write query, so D1 will send the query to
      // the primary, which always has the latest commit token.
      await session.prepare("INSERT INTO Orders VALUES (?, ?, ?)")
        .bind(order.orderName, order.customer, order.value);
        .run();

      // In order for the application to be correct, this SELECT
      // statement must see the results of the INSERT statement above.
      //
      // D1's new Session API keeps track of commit tokens for queries
      // within the session and will ensure that we won't execute this
      // query until whatever replica we're using has seen the results
      // of the INSERT.
      const { results } = await session.prepare("SELECT COUNT(*) FROM Orders")
        .run();
      resp = Response.json(results);
    }

    // Set the token so we can continue the session in another request.
    resp.headers.set("x-d1-token", session.latestCommitToken);
    return resp;
  }
}
Importantly, we will give developers the ability to maintain session-based consistency, so that users still see their own changes reflected, whilst still benefiting from the performance and latency gains that replication can bring.
You can learn more about how D1’s read replication works under the hood in our deep-dive post, and if you want to start building on D1 today, head to our developer docs to create your first database.
Hyperdrive: GA
We launched Hyperdrive into open beta last September during Birthday Week, and it’s now Generally Available — or in other words, battle-tested and production-ready.
If you’re not caught up on what Hyperdrive is, it’s designed to make the centralized databases you already have feel like they’re global. We use our global network to get faster routes to your database, keep connection pools primed, and cache your most frequently run queries as close to users as possible.
Importantly, Hyperdrive supports the most popular drivers and ORM (Object Relational Mapper) libraries out of the box, so you don’t have to re-learn or re-write your queries:
// Use the popular 'pg' driver? Easy. Hyperdrive just exposes a connection string
// to your Worker.
const client = new Client({ connectionString: env.HYPERDRIVE.connectionString });
await client.connect();

// Prefer using an ORM like Drizzle? Use it with Hyperdrive too.
// https://orm.drizzle.team/docs/get-started-postgresql#node-postgres
const client = new Client({ connectionString: env.HYPERDRIVE.connectionString });
await client.connect();
const db = drizzle(client);
But the work on Hyperdrive doesn’t stop just because it’s now “GA”. Over the next few months, we’ll be bringing support for the other most widely deployed database engine there is: MySQL. We’ll also be bringing support for connecting to databases inside private networks (including cloud VPC networks) via Cloudflare Tunnel and Magic WAN On top of that, we plan to bring more configurability around invalidation and caching strategies, so that you can make more fine-grained decisions around performance vs. data freshness.
As we thought about how we wanted to price Hyperdrive, we realized that it just didn’t seem right to charge for it. After all, the performance benefits from Hyperdrive are not only significant, but essential to connecting to traditional database engines. Without Hyperdrive, paying the latency overhead of 6+ round-trips to connect & query your database per request just isn’t right.
And so we’re happy to announce that for any developer on a Workers Paid plan, Hyperdrive is free. That includes both query caching and connection pooling, as well as the ability to create multiple Hyperdrives — to separate different applications, prod vs. staging, or to provide different configurations (cached vs. uncached, for example).
Plan
Price per query
Connection Pooling
WorkersPaid
$0
$0
To get started with Hyperdrive, head over to the docs to learn how to connect your existing database and start querying it from your Workers.
Queues: Pull From Anywhere
The task queue is an increasingly critical part of building a modern, full-stack application, and this is what we had in mind when we originally announced the open beta of Queues. We’ve since been working on several major Queues features, and we’re launching two of them this week: pull-based consumers and new message delivery controls.
Any HTTP-speaking client can now pull messages from a queue: call the new /pull endpoint on a queue to request a batch of messages, and call the /ack endpoint to acknowledge each message (or batch of messages) as you successfully process them:
// Pull and acknowledge messages from a Queue using any HTTP client
$  curl "https://api.cloudflare.com/client/v4/accounts/${CF_ACCOUNT_ID}/queues/${QUEUE_ID}/messages/pull" -X POST --data '{"visibilityTimeout":10000,"batchSize":100}}' \
     -H "Authorization: Bearer ${QUEUES_TOKEN}" \
     -H "Content-Type:application/json"

// Ack the messages you processed successfully; mark others to be retried.
$ curl "https://api.cloudflare.com/client/v4/accounts/${CF_ACCOUNT_ID}/queues/${QUEUE_ID}/messages/ack" -X POST --data '{"acks":["lease-id-1", "lease-id-2"],"retries":["lease-id-100"]}' \
     -H "Authorization: Bearer ${QUEUES_TOKEN}" \
     -H "Content-Type:application/json"
A pull-based consumer can run anywhere, allowing you to run queue consumers alongside your existing legacy cloud infrastructure. Teams inside Cloudflare adopted this early on, with one use-case focused on writing device telemetry to a queue from our 310+ data centers and consuming within some of our back-of-house infrastructure running on Kubernetes. Importantly, our globally distributed queue infrastructure means that messages are retained within the queue until the consumer is ready to process them.
Queues also now supports delaying messages, both when sending to a queue, as well as when marking a message for retry. This can be useful to queue (pun intended) tasks for the future, as well apply a backoff mechanism if an upstream API or infrastructure has rate limits that require you to pace how quickly you are processing messages.
// Apply a delay to a message when sending it
await env.YOUR_QUEUE.send(msg, { delaySeconds: 3600 })

// Delay a message (or a batch of messages) when marking it for retry
for (const msg of batch.messages) {
	msg.retry({delaySeconds: 300})
}
We’ll also be bringing substantially increased per-queue throughput over the coming months on the path to getting Queues to GA. It’s important to us that Queues is extremely reliable: lost or dropped messages means that a user doesn’t get their order confirmation email, that password reset notification, and/or their uploads processed — each of those are user-impacting and hard to recover from.
Workers Analytics Engine
Workers Analytics Engine provides unlimited-cardinality analytics at scale, via a built-in API to write data points from Workers, and a SQL API to query that data.
Workers Analytics Engine is backed by the same ClickHouse-based system we have depended on for years at Cloudflare. We use it ourselves to observe the health of our own services, to capture product usage data for billing, and to answer questions about specific customers’ usage patterns. At least one data point is written to this system on nearly every request to Cloudflare’s network. Workers Analytics Engine lets you build your own custom analytics using this same infrastructure, while we manage the hard parts for you.
Since launching in beta, developers have started depending on Workers Analytics Engine for these same use cases and more, from large enterprises to open-source projects like Counterscale. Workers Analytics Engine has been operating at production scale with mission-critical workloads for years — but we hadn’t shared anything about pricing, until today.
We are keeping Workers Analytics Engine pricing simple, and based on two metrics:
Data points written — every time you call writeDataPoint() in a Worker, this counts as one data point written. Every data point costs the same amount — unlike other platforms, there is no penalty for adding dimensions or cardinality, and no need to predict what the size and cost of a compressed data point might be.
Read queries — every time you post to the Workers Analytics Engine SQL API, this counts as one read query. Every query costs the same amount — unlike other platforms, there is no penalty for query complexity, and no need to reason about the number of rows of data that will be read by each query.
Both the Workers Free and Workers Paid plans will include an allocation of data points written and read queries, with pricing for additional usage as follows:
Plan
Data points written
Read queries
WorkersPaid
10 million included per month
+$0.25 per additional million
1 million included per month
+$1.00 per additional million
Workers Free
100,000 included per day
10,000 included per day
With this pricing, you can answer, “how much will Workers Analytics Engine cost me?” by counting the number of times you call a function in your Worker, and how many times you make a request to a HTTP API endpoint. Napkin math, rather than spreadsheet math.
This pricing will be made available to everyone in coming months. Between now and then, Workers Analytics Engine continues to be available at no cost. You can start writing data points from your Worker today — it takes just a few minutes and less than 10 lines of code to start capturing data. We’d love to hear what you think.
The week is just getting started
Tune in to what we have in store for you tomorrow on our second day of Developer Week. If you have questions or want to show off something cool you already built, please join our developer Discord.
It’s time to ship. For us (that’s what Innovation Weeks are all about!), and also for our developers.
Shipping itself is always fun, but getting there is not always easy. Bringing something from idea to life requires many stars to align. That’s what this week is all about — helping developers, including the two million developers already building on our platform, bring their ideas to life.
The full-stack cloud
Building applications requires assembling many different components.
The frontend, the face of the application, must be intuitive, responsive, and visually appealing to engage users effectively. Behind the scenes, you need a backend to handle data processing, storage, and retrieval, ensuring smooth functionality and performance. On top of all that, in the past year AI has entered the chat, so to speak, and increasingly every application requires an element of AI, making it a crucial part of the stack.
The job of a good platform is to provide all these components, and any others you will need, to you, the developer.
Just as there’s nothing more frustrating than coming home from the grocery store and realizing you left out an ingredient, realizing a platform is missing a major component or piece of functionality is no different.
We view providing the tooling that developers need as a critical part of our job as a platform, which is why with every Developer Week, we make it our mission to provide you with more and more pieces you may need. This week is no different — you can expect us to announce more tools and primitives from the frontend to backend to AI.
However, our job doesn’t stop there. If a good platform provides the components, a great platform goes a step further than that.
The job of a great platform is not only to provide the components, but make sure they play well with each other in a way that makes your job as a developer easier. Our vision for the developer platform is exactly that: to anticipate not just the tools you need but also think about how they work with each other, and how they integrate into your development flow.
This week, you will see announcements and deep dives that expound on our vision for an integrated platform: pulling back the curtain on the way we expose services in Workers through bindings for an integrated developer experience, talking about our vision for a unified data platform, updating you on framework support, and more.
The connectivity cloud
While we’re excited for you to build on us as much as possible, we also realize that development projects are rarely greenfield. If you’ve been at this for a long time, chances are a large portion of your application already lives somewhere, whether on another cloud, or on-prem.
That’s why we’re constantly making it easier for you to connect to existing infrastructure or other providers, and working hard to make sure you can still reap the benefits of building on Cloudflare by making your application feel fast and global, regardless of where your backend is.
And vice versa, if your data is on us, but you need to access it from other providers, it’s not our job to keep it hostage in a captivity cloud by charging a tariff for egress.
The experimentation cloud
Before you start assembling components, or even coming up with a plan or a spec for it, there’s an important but overlooked step to the development process — experimentation.
Experimentation can take many forms. Experimentation can be in the form of prototyping an MVP before you spend months developing a product or a feature. If you’ve found yourself rewriting your entire personal website just to try out a new tool or framework, that’s also experimentation.
It’s easy to overlook experimentation as a part of the process, but innovation doesn’t happen without it, which is why it’s something we always want to encourage and support as a part of our platform.
That’s why offering a generous free tier is something that’s been a part of our DNA since the very beginning, and something you can expect to forever be a staple of our platform.
The demo to production cloud
Alright, you’ve got all the tools you need, you’ve had a chance to experiment, and at some point… it’s time to ship.
Shipping is exciting, but shipping is also vulnerable and scary. You’re exposing the thing you’ve been working hard on to the world to criticize. You’re exposing your code to a world of untested edge cases and abuse. You’re exposing your colleagues who are on call to the possibility of getting paged at 1 AM due to the code you released.
Of course, the wrong answer is not shipping.
The right answer is having a platform that supports you and holds your hand through the scary parts. This means a platform that can seamlessly scale from zero to sixty. A platform gives you the tools to test your code, and release it gradually to the world to help you gain confidence. Or a platform provides the observability you need when you are trying to figure out what’s gone wrong at 1 AM.
That’s why this week, you can look forward to some announcements from us that we hope will help you sleep better.
The demo to production cloud — for inference
We talked about some of the scary parts of deploying to production, and while all these apply to AI as well, building AI applications today, especially in production, presents its own unique set of challenges.
Almost every day you see a new AI demo go viral — from Sora to Devin, it’s easy and inspiring to imagine our world completely changed by AI. But if you’ve started actually playing with and implementing AI use cases, you know the harsh reality of making AI truly work. It requires a lot of trial and error to get the results you want — choosing a model, RAG, fine-tuning…
And that’s before you even go to production.
That’s when you encounter the real challenge — provisioning enough capacity to stay up, without over-provisioning and overpaying. This is the exact challenge we set out to solve from the early days of Workers — helping developers not worry about infrastructure, just the application they want to build.
With the recent rise of AI, we’ve noticed many of these challenges return. Thankfully, managing loads and infrastructure is what we’re good at here at Cloudflare. It’s what we’ve had practice at for over a decade of running our platform. It’s all just one giant scheduler.
Our vision for our AI platform is to help solve the exact challenges in deploying AI workloads that we’ve been helping developers solve for, well, any other type of workload. Whether you’re deploying directly on us with Workers AI, or another provider, we’ll help provide the tools you need to access the models you need, without overpaying for idle compute.
Don’t worry, it’s all going to be fine.
So what can you expect this week?
No one in my family can keep a secret — my sister cannot get me a birthday present without spoiling it the week before. For me, the anticipation and the look of surprise is part of the fun! My coworkers seem to have clued into this.
While I won’t give away too much, we’ve already teased out a few things last week (you can find some hints here, here and here), as well as in this blog post if you read closely (because as it turns out, I too, can’t help myself).
See you tomorrow!
Our series of announcements starts on Monday, April 1st. We look forward to sharing them with you here on our blog, and discussing them with you on Discord and X.
Many people have probably come across the ‘this is fine’ meme or the original comic. This is what a typical day for a lot of on-call personnel looks like. On-calls get a lot of alerts, and dealing with too many alerts can result in alert fatigue – a feeling of exhaustion caused by responding to alerts that lack priority or clear actions. Ensuring the alerts are actionable and accurate, not false positives, is crucial because repeated false alarms can desensitize on-call personnel. To this end, within Cloudflare, numerous teams conduct periodic alert analysis, with each team developing its own dashboards for reporting. As members of the Observability team, we’ve encountered situations where teams reported inaccuracies in alerts or instances where alerts failed to trigger, as well as provided assistance in dealing with noisy/flapping alerts.
Observability aims to enhance insight into the technology stack by gathering and analyzing a broader spectrum of data. In this blog post, we delve into alert observability, discussing its importance and Cloudflare’s approach to achieving it. We’ll also explore how we overcome shortcomings in alert reporting within our architecture to simplify troubleshooting using open-source tools and best practices. Join us to understand how we use alerts effectively and use simple tools and practices to enhance our alerts observability, resilience, and on-call personnel health.
Being on-call can disrupt sleep patterns, impact social life, and hinder leisure activities, potentially leading to burnout. While burnout can be caused by several factors, one contributing factor can be excessively noisy alerts or receiving alerts that are neither important nor actionable. Analyzing alerts can help mitigate the risk of such burnout by reducing unnecessary interruptions and improving the overall efficiency of the on-call process. It involves periodic review and feedback to the system for improving alert quality. Unfortunately, only some companies or teams do alert analysis, even though it is essential information that every on-call or manager should have access to.
Alert analysis is useful for on-call personnel, enabling them to easily see which alerts have fired during their shift to help draft handover notes and not miss anything important. In addition, managers can generate reports from these stats to see the improvements over time, as well as helping assess on-call vulnerability to burnout. Alert analysis also helps with writing incident reports, to see if alerts were fired, or to determine when an incident started.
Let’s first understand the alerting stack and how we used open-source tools to gain greater visibility into it, which allowed us to analyze and optimize its effectiveness.
Prometheus architecture at Cloudflare
At Cloudflare, we rely heavily on Prometheus for monitoring. We have data centers in more than 310 cities, and each has several Prometheis. In total, we have over 1100 Prometheus servers. All alerts are sent to a central Alertmanager, where we have various integrations to route them. Additionally, using an alertmanager webhook, we store all alerts in a datastore for analysis.
Lifecycle of an alert
Prometheus collects metrics from configured targets at given intervals, evaluates rule expressions, displays the results, and can trigger alerts when the alerting conditions are met. Once an alert goes into firing state, it will be sent to the alertmanager.
Depending on the configuration, once Alertmanager receives an alert, it can inhibit, group, silence, or route the alerts to the correct receiver integration, such as chat, PagerDuty, or ticketing system. When configured properly, Alertmanager can mitigate a lot of alert noise. Unfortunately, that is not the case all the time, as not all alerts are optimally configured.
In Alertmanager, alerts initially enter the firing state, where they may be inhibited or silenced. They return to the firing state when the silence expires or the inhibiting alert resolves, and eventually transition to the resolved state.
Alertmanager sends notifications for firing and resolved alert events via webhook integration. We were using alertmanager2es, which receives webhook alert notifications from Alertmanager and inserts them into an Elasticsearch index for searching and analysis. Alertmanager2es has been a reliable tool for us over the years, offering ways to monitor alerting volume, noisy alerts and do some kind of alert reporting. However, it had its limitations. The absence of silenced and inhibited alert states made troubleshooting issues challenging. We often found ourselves guessing why an alert didn’t trigger – was it silenced by another alert or perhaps inhibited by one? Without concrete data, we lacked the means to confirm what was truly happening.
Since the Alertmanager doesn’t provide notifications for silenced or inhibited alert events via webhook integration, the alert reporting we were doing was somewhat lacking or incomplete. However, the Alertmanager API provides querying capabilities and by querying the /api/alerts alertmanager endpoint, we can get the silenced and inhibited alert states. Having all four states in a datastore will enhance our ability to improve alert reporting and troubleshoot Alertmanager issues.
Interfaces for providing information about alert states
Solution
We opted to aggregate all states of the alerts (firing, silenced, inhibited, and resolved) into a datastore. Given that we’re gathering data from two distinct sources (the webhook and API) each in varying formats and potentially representing different events, we correlate alerts from both sources using the fingerprint field. The fingerprint is a unique hash of the alert’s label set which enables us to match alerts across responses from the Alertmanager webhook and API.
Alertmanager webhook and API response of same alert event
The Alertmanager API offers additional fields compared to the webhook (highlighted in pastel red on the right), such as silencedBy and inhibitedBy IDs, which aid in identifying silenced and inhibited alerts. We store both webhook and API responses in the datastore as separate rows. While querying, we match the alerts using the fingerprint field.
We decided to use a vector.dev instance to transform the data as necessary, and store it in a data store. Vector.dev (acquired by Datadog) is an open-source, high-performance, observability data pipeline that supports a vast range of sources to read data from and supports a lot of sinks for writing data to, as well as a variety of data transformation operations.
Here, we use one http_server vector instance to receive Alertmanager webhook notifications, two http_client sources to query alerts and silence API endpoints, and two sinks for writing all of the state logs in ClickHouse into alerts and silences tables
Although we use ClickHouse to store this data, any other database can be used here. ClickHouse was chosen as a data store because it provides various data manipulation options. It allows aggregating data during insertion using Materialized Views, reduces duplicates with the replacingMergeTree table engine, and supports JOIN statements.
If we were to create individual columns for all the alert labels, the number of columns would grow exponentially with the addition of new alerts and unique labels. Instead, we decided to create individual columns for a few common labels like alert priority, instance, dashboard, alert-ref, alertname, etc., which helps us analyze the data in general and keep all other labels in a column of type Map(String, String). This was done because we wanted to keep all the labels in the datastore with minimal resource usage and allow users to query specific labels or filter alerts based on particular labels. For example, we can select all Prometheus alerts using labelsmap[‘service’’] = ‘Prometheus’.
Dashboards
We built multiple dashboards on top of this data:
Alerts overview: To get insights into all the alerts the Alertmanager receives.
Alertname overview: To drill down on a specific alert.
Alerts overview by receiver: This is similar to alerts overview but specific to a team or receiver.
Alerts state timeline: This dashboard shows a snapshot of alert volume at a glance.
Jiralerts overview: To get insights into the alerts the ticket system receives.
Silences overview: To get insights into the Alertmanager silences.
Alerts overview
The image is a screenshot of the collapsed alerts overview dashboard by receiver. This dashboard comprises general stats, components, services, and alertname breakdown. The dashboard also highlights the number of P1 / P2 alerts in the last one day / seven days / thirty days, top alerts for the current quarter, and quarter-to-quarter comparison.
Component breakdown
We route alerts to teams and a team can have multiple services or components. This panel shows firing alerts component counts over time for a receiver. For example, the alerts are sent to the observability team, which owns multiple components like logging, metrics, traces, and errors. This panel gives an alerting component count over time, and provides a good idea about which component is noisy and at what time at a glance.
Timeline of alerts
We created this swimlane view using Grafana’s state timeline panel for the receivers. The panel shows how busy the on-call was and at what point. Red here means the alert started firing, orange represents the alert is active and green means it has resolved. It displays the start time, active duration, and resolution of an alert. This highlighted alert is changing state too frequently from firing to resolved – this looks like a flapping alert. Flapping occurs when an alert changes state too frequently. This can happen when alerts are not configured properly and need tweaking, such as adjusting the alert threshold or increasing the for duration period in the alerting rule. The for duration field in the alerting rules adds time tolerance before an alert starts firing. In other words, the alert won’t fire unless the condition is met for ‘X’ minutes.
Findings
There were a few interesting findings within our analysis. We found a few alerts that were firing and did not have a notify label set, which means the alerts were firing but were not being sent or routed to any team, creating unnecessary load on the Alertmanager. We also found a few components generating a lot of alerts, and when we dug in, we found that they were for a cluster that was decommissioned where the alerts were not removed. These dashboards gave us excellent visibility and cleanup opportunities.
Alertmanager inhibitions
Alertmanager inhibition allows suppressing a set of alerts or notifications based on the presence of another set of alerts. We found that Alertmanager inhibitions were not working sometimes. Since there was no way to know about this, we only learned about it when a user reported getting alerted for inhibited alerts. Imagine a Venn diagram of firing and inhibited alerts to understand failed inhibitions. Ideally, there should be no overlap because the inhibited alerts shouldn’t be firing. But if there is an overlap, that means inhibited alerts are firing, and this overlap is considered a failed inhibition alert.
Failed inhibition venn diagram
After storing alert notifications in ClickHouse, we were able to come up with a query to find the fingerprint of the `alertnames` where the inhibitions were failing using the following query:
SELECT $rollup(timestamp) as t, count() as count
FROM
(
    SELECT
        fingerprint, timestamp
    FROM alerts
    WHERE
        $timeFilter
        AND status.state = 'firing'
    GROUP BY
        fingerprint, timestamp
) AS firing
ANY INNER JOIN
(
    SELECT
        fingerprint, timestamp
    FROM alerts
    WHERE
        $timeFilter
        AND status.state = 'suppressed' AND notEmpty(status.inhibitedBy)
    GROUP BY
        fingerprint, timestamp
) AS suppressed USING (fingerprint)
GROUP BY t
The first panel in the image below is the total number of firing alerts, the second panel is the number of failed inhibitions.
We can also create breakdown for each failed inhibited alert
By looking up the fingerprint from the database, we could map the alert inhibitions and found that the failed inhibited alerts have an inhibition loop. For example, alert Service_XYZ_down is inhibited by alert server_OOR, alert server_OOR is inhibited by alert server_down, and server_down is inhibited by alert server_OOR.
Failed inhibitions can be avoided if alert inhibitions are configured carefully.
Silences
Alertmanager provides a mechanism to silence an alert while it is being worked on or during maintenance. Silence can mute the alerts for a given time and it can be configured based on matchers, which can be an exact match, a regex, an alert name, or any other label. The silence matcher doesn’t necessarily translate to the alertname. By doing alert analysis, we could map the alerts and the silence ID by doing a JOIN query on the alerts and silences tables. We also discovered a lot of stale silences, where silence was created for a long duration and is not relevant anymore.
DIY Alert analysis
The directory contains a basic demo for implementing alerts observability. Running `docker-compose up` spawns several containers, including Prometheus, Alertmanager, Vector, ClickHouse, and Grafana. The vector.dev container queries the Alertmanager alerts API and writes the data into ClickHouse after transforming it. The Grafana dashboard showcases a demo of Alerts and Silences overview.
Make sure you have docker installed and run docker compose up to get started.
As part of the observability team, we manage the Alertmanager, which is a multi-tenant system. It’s crucial for us to have visibility to detect and address system misuse, ensuring proper alerting. The use of alert analysis tools has significantly enhanced the experience for on-call personnel and our team, offering swift access to the alert system. Alerts observability has facilitated the troubleshooting of events such as why an alert did not fire, why an inhibited alert fired, or which alert silenced / inhibited another alert, providing valuable insights for improving alert management.
Moreover, alerts overview dashboards facilitate rapid review and adjustment, streamlining operations. Teams use these dashboards in the weekly alert reviews to provide tangible evidence of how an on-call shift went, identify which alerts fire most frequently, becoming candidates for cleanup or aggregation thus curbing system misuse and bolstering overall alert management. Additionally, we can pinpoint services that may require particular attention. Alerts observability has also empowered some teams to make informed decisions about on-call configurations, such as transitioning to longer but less frequent shifts or integrating on-call and unplanned work shifts.
In conclusion, alert observability plays a crucial role in averting burnout by minimizing interruptions and enhancing on-call duties’ efficiency. Offering alerts observability as a service benefits all teams by obviating the need for individual dashboard development and fostering a proactive monitoring culture. If you found this blog post interesting and want to work on observability, please check out our job openings – we’re hiring for Alerting and Logging!
Today, we’re excited to announce a new Workers Vitest integration – allowing you to write unit and integration tests via the popular testing framework, Vitest, that execute directly in our runtime, workerd!
This integration provides you with the ability to test anything related to your Worker!
For the first time, you can write unit tests that run within the same runtime that Cloudflare Workers run on in production, providing greater confidence that the behavior of your Worker in tests will be the same as when deployed to production. For integration tests, you can now write tests for Workers that are triggered by Cron Triggers in addition to traditional fetch() events. You can also more easily test complex applications that interact with KV, R2, D1, Queues, Service Bindings, and more Cloudflare products.
For all of your tests, you have access to Vitest features like snapshots, mocks, timers, and spies.
In addition to increased testing and functionality, you’ll also notice other developer experience improvements like hot-module-reloading, watch mode on by default, and per-test isolated storage. Meaning that, as you develop and edit your tests, they’ll automatically re-run, without you having to restart your test runner.
Get started testing Workers with Vitest
The easiest way to get started with testing your Workers via Vitest is to start a new Workers project via our create-cloudflare tool:
Running this command will scaffold a new project for you with the Workers Vitest integration already set up. An example unit test and integration test are also included.
Manual install and setup instructions
If you prefer to manually install and set up the Workers Vitest integration, begin by installing @cloudflare/vitest-pool-workers from npm:
@cloudflare/vitest-pool-workers has a peer dependency on a specific version of vitest. Modern versions of npm will install this automatically, but we recommend you install it explicitly too. Refer to the getting started guide for the current supported version. If you’re using TypeScript, add @cloudflare/vitest-pool-workers to your tsconfig.json’s types to get types for the cloudflare:test module:
@cloudflare/vitest-pool-workers has a peer dependency on a specific version of vitest. Modern versions of npm will install this automatically, but we recommend you install it explicitly too. Refer to the getting started guide for the current supported version. If you’re using TypeScript, add @cloudflare/vitest-pool-workers to your tsconfig.json’s types to get types for the cloudflare:test module:
With the new Workers Vitest Integration, you can test anything exported from your Worker in both unit and integration-style tests. Within these tests, you can also test connected resources like R2, KV, and Durable Objects, as well as applications involving multiple Workers.
Writing unit tests
In a Workers context, a unit test imports and directly calls functions from your Worker then asserts on their return values. Let’s say you have a Worker that looks like this:
export function add(a, b) {
  return a + b;
}

export default {
  async fetch(request) {
    const url = new URL(request.url);
    const a = parseInt(url.searchParams.get("a"));
    const b = parseInt(url.searchParams.get("b"));
    return new Response(add(a, b));
  }
}
After you’ve setup and installed the Workers Vitest integration, you can unit test this Worker by creating a new test file called index.spec.js with the following code:
Using the Workers Vitest integration, you can write unit tests like these for any of your Workers.
Writing integration tests
While unit tests are great for testing individual parts of your application, integration tests assess multiple units of functionality, ensuring that workflows and features work as expected. These are usually more complex than unit tests, but provide greater confidence that your app works as expected. In the Workers context, an integration test sends HTTP requests to your Worker and asserts on the HTTP responses.
With the Workers Vitest Integration, you can run integration tests by importing SELF from the new cloudflare:test utility like this:
// test/index.spec.ts
import { SELF } from "cloudflare:test";
import { it, expect } from "vitest";
import "../src";

// an integration test using SELF
it("sends request (integration style)", async () => {
   const response = await SELF.fetch("http://example.com/?a=3&b=4");
   expect(await response.text()).toMatchInlineSnapshot(`"7"`);
});
When using SELF for integration tests, your Worker code runs in the same context as the test runner. This means you can use mocks to control your Worker.
Testing different scenarios
Whether you’re writing unit or integration tests, if your application uses Cloudflare Developer Platform products (e.g. KV, R2, D1, Queues, or Durable Objects), you can test them. To demonstrate this, we have created a set of examples to help get you started testing.
Better testing experience === better testing
Having better testing tools makes it easier to test your projects right from the start, which leads to better overall quality and experience for your end users. The Workers Vitest integration provides that better experience, not just in terms of developer experience, but in making it easier to test your entire application.
The rest of this post will focus on how we built this new testing integration, diving into the internals of how Vitest works, the problems we encountered trying to get a framework to work within our runtime, and ultimately how we solved it and the improved DX that it unlocked.
How Vitest traditionally works
When you start Vitest’s CLI, it first collects and sequences all your test files. By default, Vitest uses a “threads” pool, which spawns Node.js worker threads for isolating and running tests in parallel. Each thread gets a test file to run, dynamically requesting and evaluating code as needed. When the test runner imports a module, it sends a request to the host’s “Vite Node Server” which will either return raw JavaScript code transformed by Vite, or an external module path. If raw code is returned, it will be executed using the node:vmrunInThisContext() function. If a module path is returned, it will be imported using dynamic import(). Transforming user code with Vite allows hot-module-reloading (HMR) — when a module changes, it’s invalidated in the module cache and a new version will be returned when it’s next imported.
Miniflare is a fully-local simulator for Cloudflare’s Developer Platform. Miniflare v2 provided a custom environment for Vitest that allowed you to run your tests inside the Workers sandbox. This meant you could import and call any function using Workers runtime APIs in your tests. You weren’t restricted to integration tests that just sent and received HTTP requests. In addition, this environment provided per-test isolated storage, automatically undoing any changes made at the end of each test. In Miniflare v2, this environment was relatively simple to implement. We’d already reimplemented Workers Runtime APIs in a Node.js environment, and could inject them using Vitest’s APIs into the global scope of the test runner.
By contrast, Miniflare v3 runs your Worker code inside the same workerd runtime that Cloudflare uses in production. Running tests directly in workerd presented a challenge — workerd runs in its own process, separate from the Node.js worker thread, and it’s not possible to reference JavaScript classes across a process boundary.
Solving the problem with custom pools
Instead, we use Vitest’s custom pools feature to run the test runner in Cloudflare Workers running locally with workerd. A pool receives test files to run and decides how to execute them. By executing the runner inside workerd, tests have direct access to Workers runtime APIs as they’re running in a Worker. WebSockets are used to send and receive serialisable RPC messages between the Node.js host and workerd process. Note we’re running the exact same test runner code originally designed for a Node-context inside a Worker here. This means our Worker needs to provide Node’s built-in modules, support for dynamic code evaluation, and loading of arbitrary modules from disk with Node-resolution behavior. The nodejs_compat compatibility flag provides support for some of Node’s built-in modules, but does not solve our other problems. For that, we had to get creative…
Dynamic code evaluation
For security reasons, the Cloudflare Workers runtime does not allow dynamic code evaluation via eval() or new Function(). It also requires all modules to be defined ahead-of-time before execution starts. The test runner doesn’t know what code to run until we start executing tests, so without lifting these restrictions, we have no way of executing the raw JavaScript code transformed by Vite nor importing arbitrary modules from disk. Fortunately, code that is only meant to run locally – like tests – has a much more relaxed security model than deployed code. To support local testing and other development-specific use-cases such as Vite’s new Runtime API, we added “unsafe-eval bindings” and “module-fallback services” to workerd.
Unsafe-eval bindings provide local-only access to the eval() function, and new Function()/new AsyncFunction()/new WebAssembly.Module() constructors. By exposing these through a binding, we retain control over which code has access to these features.
Using the unsafe-eval binding eval() method, we were able to implement a polyfill for the required vm.runInThisContext() function. While we could also implement loading of arbitrary modules from disk using unsafe-eval bindings, this would require us to rebuild workerd’s module resolution system in JavaScript. Instead, we allow workers to be configured with module fallback services. If enabled, imports that cannot be resolved by workerd become HTTP requests to the fallback service. These include the specifier, referrer, and whether it was an import or require. The service may respond with a module definition, or a redirect to another location if the resolved location doesn’t match the specifier. Requests originating from synchronous requires will block the main thread until the module is resolved. The Workers Vitest pool’s fallback service implements Node-like resolution with Node-style interoperability between CommonJS and ES modules.
Durable Objects as test runners
Now that we can run and import arbitrary code, the next step is to get Vitest’s thread worker running inside workerd. Every incoming request has its own request context. To improve overall performance, I/O objects such as streams, request/response bodies and WebSockets created in one request context cannot be used from another. This means if we want to use a WebSocket for RPC between the pool and our workerd processes, we need to make sure the WebSocket is only used from one request context. To coordinate this, we define a singleton Durable Object for accepting the RPC connection and running tests from. Functions using RPC such as resolving modules, reporting results and console logging will always use this singleton. We use Miniflare’s “magic proxy” system to get a reference to the singleton’s stub in Node.js, and send a WebSocket upgrade request directly to it. After adding a few more Node.js polyfills, and a basic cloudflare:test module to provide access to bindings and a function for creating ExecutionContexts, we’re able to write basic Workers unit tests! 🎉
Integration tests with hot-module-reloading
In addition to unit tests, we support integration testing with a special SELF service binding in the cloudflare:test module. This points to a special export default { fetch(...) {...} } handler which uses Vite to import your Worker’s main module.
Using Vite’s transformation pipeline here means your handler gets hot-module-reloading (HMR) for free! When code is updated, the module cache is invalidated, tests are rerun, and subsequent requests will execute with new code. The same approach of wrapping user code handlers applies to Durable Objects too, providing the same HMR benefits.
Integration tests can be written by calling SELF.fetch(), which will dispatch a fetch() event to your user code in the same global scope as your test, but under a different request context. This means global mocks apply to your Worker’s execution, as do request context lifetime restrictions. In particular, if you forget to call ctx.waitUntil(), you’ll see an appropriate error message. This wouldn’t be the case if you called your Worker’s handler directly in a unit test, as you’d be running under the runner singleton’s Durable Object request context, whose lifetime is automatically extended.
Most Workers applications will have at least one binding to a Cloudflare storage service, such as KV, R2 or D1. Ideally, tests should be self-contained and runnable in any order or on their own. To make this possible, writes to storage need to be undone at the end of each test, so reads by other tests aren’t affected. Whilst it’s possible to do this manually, it can be tricky to keep track of all writes and undo them in the correct order. For example, take the following two functions:
// helpers.ts
interface Env {
  NAMESPACE: KVNamespace;
}
// Get the current list stored in a KV namespace
export async function get(env: Env, key: string): Promise<string[]> {
  return await env.NAMESPACE.get(key, "json") ?? [];
}
// Add an item to the end of the list
export async function append(env: Env, key: string, item: string) {
  const value = await get(env, key);
  value.push(item);
  await env.NAMESPACE.put(key, JSON.stringify(value));
}
If we wanted to test these functions, we might write something like below. Note we have to keep track of all the keys we might write to, and restore their values at the end of tests, even if those tests fail.
// helpers.spec.ts
import { env } from "cloudflare:test";
import { beforeAll, beforeEach, afterEach, it, expect } from "vitest";
import { get, append } from "./helpers";

let startingList1: string | null;
let startingList2: string | null;
beforeEach(async () => {
  // Store values before each test
  startingList1 = await env.NAMESPACE.get("list 1");
  startingList2 = await env.NAMESPACE.get("list 2");
});
afterEach(async () => {
  // Restore starting values after each test
  if (startingList1 === null) {
    await env.NAMESPACE.delete("list 1");
  } else {
    await env.NAMESPACE.put("list 1", startingList1);
  }
  if (startingList2 === null) {
    await env.NAMESPACE.delete("list 2");
  } else {
    await env.NAMESPACE.put("list 2", startingList2);
  }
});

beforeAll(async () => {
  await append(env, "list 1", "one");
});

it("appends to one list", async () => {
  await append(env, "list 1", "two");
  expect(await get(env, "list 1")).toStrictEqual(["one", "two"]);
});

it("appends to two lists", async () => {
  await append(env, "list 1", "three");
  await append(env, "list 2", "four");
  expect(await get(env, "list 1")).toStrictEqual(["one", "three"]);
  expect(await get(env, "list 2")).toStrictEqual(["four"]);
});
This is slightly easier with the recently introduced onTestFinished() hook, but you still need to remember which keys were written to, or enumerate them at the start/end of tests. You’d also need to manage this for KV, R2, Durable Objects, caches and any other storage service you used. Ideally, the testing framework should just manage this all for you.
That’s exactly what the Workers Vitest pool does with the isolatedStorage option which is enabled by default. Any writes to storage performed in a test are automagically undone at the end of the test. To support seeding data in beforeAll() hooks, including those in nested describe()-blocks, a stack is used. Before each suite or test, a new frame is pushed to the storage stack. All writes performed by the test or associated beforeEach()/afterEach() hooks are written to the frame. After each suite or test, the top frame is popped from the storage stack, undoing any writes.
Miniflare implements simulators for storage services on top of Durable Objects with a separate blob store. When running locally, workerd uses SQLite for Durable Object storage. To implement isolated storage, we implement an on-disk stack of .sqlite database files by backing up the databases when “pushing”, and restoring backups when “popping”. Blobs stored in the separate store are retained through stack operations, and cleaned up at the end of each test run. Whilst this works, it involves copying lots of .sqlite files. Looking ahead, we’d like to explore using SQLite SAVEPOINTS for a more efficient solution.
Declarative request mocking
In addition to storage, most Workers will make outbound fetch() requests. For tests, it’s often useful to mock responses to these requests. Miniflare already allows you to specify an undiciMockAgent to route all requests through. The MockAgent class provides a declarative interface for specifying requests to mock and the corresponding responses to return. This API is relatively simple, whilst being flexible enough for advanced use cases. We provide an instance of MockAgent as fetchMock in the cloudflare:test module.
import { fetchMock } from "cloudflare:test";
import { beforeAll, afterEach, it, expect } from "vitest";

beforeAll(() => {
  // Enable outbound request mocking...
  fetchMock.activate();
  // ...and throw errors if an outbound request isn't mocked
  fetchMock.disableNetConnect();
});
// Ensure we matched every mock we defined
afterEach(() => fetchMock.assertNoPendingInterceptors());

it("mocks requests", async () => {
  // Mock the first request to `https://example.com`
  fetchMock
    .get("https://example.com")
    .intercept({ path: "/" })
    .reply(200, "body");

  const response = await fetch("https://example.com/");
  expect(await response.text()).toBe("body");
});
To implement this, we bundled a stripped down version of undici containing just the MockAgent code. We then built a custom undiciDispatcher that used the Worker’s global fetch() function instead of undici’s built-in HTTP implementation based on llhttp and node:net.
Testing Durable Objects directly
Finally, Miniflare v2’s custom Vitest environment provided support for accessing the instance methods and state of Durable Objects in tests directly. This allowed you to unit test Durable Objects like any other JavaScript class—you could mock particular methods and properties, or immediately call specific handlers like alarm(). To implement this in workerd, we rely on our existing wrapping of user Durable Objects for Vite transforms and hot-module reloading. When you call the runInDurableObject(stub, callback) function from cloudflare:test, we store callback in a global cache and send a special fetch() request to stub which is intercepted by the wrapper. The wrapper executes the callback in the request context of the Durable Object, and stores the result in the same cache. runInDurableObject() then reads from this cache, and returns the result.
Note that this assumes the Durable Object is running in the same isolate as the runInDurableObject() call. While this is true for same-Worker Durable Objects running locally, it means Durable Objects defined in auxiliary workers can’t be accessed directly.
Try it out!
We are excited to release the @cloudflare/vitest-pool-workers package on npm, and to provide an improved testing experience for you.
Make sure to read the Write your first test guide and begin writing unit and integration tests today! If you’ve been writing tests using one of our previous options, our unstable_devmigration guide or our Miniflare 2 migration guide should explain key differences and help you move your tests over quickly.
If you run into issues or have suggestions for improvements, please file an issue in our GitHub repo or reach out via our Developer Discord.
Let’s Encrypt, a publicly trusted certificate authority (CA) that Cloudflare uses to issue TLS certificates, has been relying on two distinct certificate chains. One is cross-signed with IdenTrust, a globally trusted CA that has been around since 2000, and the other is Let’s Encrypt’s own root CA, ISRG Root X1. Since Let’s Encrypt launched, ISRG Root X1 has been steadily gaining its own device compatibility.
On September 30, 2024, Let’s Encrypt’s certificate chain cross-signed with IdenTrust will expire. To proactively prepare for this change, on May 15, 2024, Cloudflare will stop issuing certificates from the cross-signed chain and will instead use Let’s Encrypt’s ISRG Root X1 chain for all future Let’s Encrypt certificates.
The change in the certificate chain will impact legacy devices and systems, such as Android devices version 7.1.1 or older, as those exclusively rely on the cross-signed chain and lack the ISRG X1 root in their trust store. These clients may encounter TLS errors or warnings when accessing domains secured by a Let’s Encrypt certificate.
According to Let’s Encrypt, more than 93.9% of Android devices already trust the ISRG Root X1 and this number is expected to increase in 2024, especially as Android releases version 14, which makes the Android trust store easily and automatically upgradable.
We took a look at the data ourselves and found that, from all Android requests, 2.96% of them come from devices that will be affected by the change. In addition, only 1.13% of all requests from Firefox come from affected versions, which means that most (98.87%) of the requests coming from Android versions that are using Firefox will not be impacted.
Preparing for the change
If you’re worried about the change impacting your clients, there are a few things that you can do to reduce the impact of the change. If you control the clients that are connecting to your application, we recommend updating the trust store to include the ISRG Root X1. If you use certificate pinning, remove or update your pin. In general, we discourage all customers from pinning their certificates, as this usually leads to issues during certificate renewals or CA changes.
If you experience issues with the Let’s Encrypt chain change, and you’re using Advanced Certificate Manager or SSL for SaaS on the Enterprise plan, you can choose to switch your certificate to use Google Trust Services as the certificate authority instead.
While this change will impact a very small portion of clients, we support the shift that Let’s Encrypt is making as it supports a more secure and agile Internet.
Embracing change to move towards a better Internet
Looking back, there were a number of challenges that slowed down the adoption of new technologies and standards that helped make the Internet faster, more secure, and more reliable.
For starters, before Cloudflare launched Universal SSL, free certificates were not attainable. Instead, domain owners had to pay around $100 to get a TLS certificate. For a small business, this is a big cost and without browsers enforcing TLS, this significantly hindered TLS adoption for years. Insecure algorithms have taken decades to deprecate due to lack of support of new algorithms in browsers or devices. We learned this lesson while deprecating SHA-1.
Supporting new security standards and protocols is vital for us to continue improving the Internet. Over the years, big and sometimes risky changes were made in order for us to move forward. The launch of Let’s Encrypt in 2015 was monumental. Let’s Encrypt allowed every domain to get a TLS certificate for free, which paved the way to a more secure Internet, with now around 98% of traffic using HTTPS.
In 2014, Cloudflare launched elliptic curve digital signature algorithm (ECDSA) support for Cloudflare-issued certificates and made the decision to issue ECDSA-only certificates to free customers. This boosted ECDSA adoption by pressing clients and web operators to make changes to support the new algorithm, which provided the same (if not better) security as RSA while also improving performance. In addition to that, modern browsers and operating systems are now being built in a way that allows them to constantly support new standards, so that they can deprecate old ones.
For us to move forward in supporting new standards and protocols, we need to make the Public Key Infrastructure (PKI) ecosystem more agile. By retiring the cross-signed chain, Let’s Encrypt is pushing devices, browsers, and clients to support adaptable trust stores. This allows clients to support new standards without causing a breaking change. It also lays the groundwork for new certificate authorities to emerge.
Today, one of the main reasons why there’s a limited number of CAs available is that it takes years for them to become widely trusted, that is, without cross-signing with another CA. In 2017, Google launched a new publicly trusted CA, Google Trust Services, that issued free TLS certificates. Even though they launched a few years after Let’s Encrypt, they faced the same challenges with device compatibility and adoption, which caused them to cross-sign with GlobalSign’s CA. We hope that, by the time GlobalSign’s CA comes up for expiration, almost all traffic is coming from a modern client and browser, meaning the change impact should be minimal.
Today, we are proud to open source Pingora, the Rust framework we have been using to build services that power a significant portion of the traffic on Cloudflare. Pingora is released under the Apache License version 2.0.
As mentioned in our previous blog post, Pingora is a Rust async multithreaded framework that assists us in constructing HTTP proxy services. Since our last blog post, Pingora has handled nearly a quadrillion Internet requests across our global network.
We are open sourcing Pingora to help build a better and more secure Internet beyond our own infrastructure. We want to provide tools, ideas, and inspiration to our customers, users, and others to build their own Internet infrastructure using a memory safe framework. Having such a framework is especially crucial given the increasing awareness of the importance of memory safety across the industry and the US government. Under this common goal, we are collaborating with the Internet Security Research Group (ISRG) Prossimo project to help advance the adoption of Pingora in the Internet’s most critical infrastructure.
In our previous blog post, we discussed why and how we built Pingora. In this one, we will talk about why and how you might use Pingora.
Pingora provides building blocks for not only proxies but also clients and servers. Along with these components, we also provide a few utility libraries that implement common logic such as event counting, error handling, and caching.
What’s in the box
Pingora provides libraries and APIs to build services on top of HTTP/1 and HTTP/2, TLS, or just TCP/UDP. As a proxy, it supports HTTP/1 and HTTP/2 end-to-end, gRPC, and websocket proxying. (HTTP/3 support is on the roadmap.) It also comes with customizable load balancing and failover strategies. For compliance and security, it supports both the commonly used OpenSSL and BoringSSL libraries, which come with FIPS compliance and post-quantum crypto.
Besides providing these features, Pingora provides filters and callbacks to allow its users to fully customize how the service should process, transform and forward the requests. These APIs will be especially familiar to OpenResty and NGINX users, as many map intuitively onto OpenResty’s “*_by_lua” callbacks.
Operationally, Pingora provides zero downtime graceful restarts to upgrade itself without dropping a single incoming request. Syslog, Prometheus, Sentry, OpenTelemetry and other must-have observability tools are also easily integrated with Pingora as well.
Who can benefit from Pingora
You should consider Pingora if:
Security is your top priority: Pingora is a more memory safe alternative for services that are written in C/C++. While some might argue about memory safety among programming languages, from our practical experience, we find ourselves way less likely to make coding mistakes that lead to memory safety issues. Besides, as we spend less time struggling with these issues, we are more productive implementing new features.
Your service is performance-sensitive: Pingora is fast and efficient. As explained in our previous blog post, we saved a lot of CPU and memory resources thanks to Pingora’s multi-threaded architecture. The saving in time and resources could be compelling for workloads that are sensitive to the cost and/or the speed of the system.
Your service requires extensive customization: The APIs that the Pingora proxy framework provides are highly programmable. For users who wish to build a customized and advanced gateway or load balancer, Pingora provides powerful yet simple ways to implement it. We provide examples in the next section.
Let’s build a load balancer
Let’s explore Pingora’s programmable API by building a simple load balancer. The load balancer will select between https://1.1.1.1/ and https://1.0.0.1/ to be the upstream in a round-robin fashion.
Any object that implements the ProxyHttp trait (similar to the concept of an interface in C++ or Java) is an HTTP proxy. The only required method there is upstream_peer(), which is called for every request. This function should return an HttpPeer which contains the origin IP to connect to and how to connect to it.
Next let’s implement the round-robin selection. The Pingora framework already provides the LoadBalancer with common selection algorithms such as round robin and hashing, so let’s just use it. If the use case requires more sophisticated or customized server selection logic, users can simply implement it themselves in this function.
pub struct LB(Arc<LoadBalancer<RoundRobin>>);

#[async_trait]
impl ProxyHttp for LB {
    async fn upstream_peer(...) -> Result<Box<HttpPeer>> {
        let upstream = self.0
            .select(b"", 256) // hash doesn't matter for round robin
            .unwrap();

        // Set SNI to one.one.one.one
        let peer = Box::new(HttpPeer::new(upstream, true, "one.one.one.one".to_string()));
        Ok(peer)
    }
}
Since we are connecting to an HTTPS server, the SNI also needs to be set. Certificates, timeouts, and other connection options can also be set here in the HttpPeer object if needed.
Finally, let’s put the service in action. In this example we hardcode the origin server IPs. In real life workloads, the origin server IPs can also be discovered dynamically when the upstream_peer() is called or in the background. After the service is created, we just tell the LB service to listen to 127.0.0.1:6188. In the end we created a Pingora server, and the server will be the process which runs the load balancing service.
fn main() {
    let mut upstreams = LoadBalancer::try_from_iter(["1.1.1.1:443", "1.0.0.1:443"]).unwrap();

    let mut lb = pingora_proxy::http_proxy_service(&my_server.configuration, LB(upstreams));
    lb.add_tcp("127.0.0.1:6188");

    let mut my_server = Server::new(None).unwrap();
    my_server.add_service(lb);
    my_server.run_forever();
}
We can see that the proxy is working, but the origin server rejects us with a 403. This is because our service simply proxies the Host header, 127.0.0.1:6188, set by curl, which upsets the origin server. How do we make the proxy correct that? This can simply be done by adding another filter called upstream_request_filter. This filter runs on every request after the origin server is connected and before any HTTP request is sent. We can add, remove or change http request headers in this filter.
curl 127.0.0.1:6188 -svo /dev/null
< HTTP/1.1 200 OK
This time it works! The complete example can be found here.
Below is a very simple diagram of how this request flows through the callback and filter we used in this example. The Pingora proxy framework currently provides more filters and callbacks at different stages of a request to allow users to modify, reject, route and/or log the request (and response).
Behind the scenes, the Pingora proxy framework takes care of connection pooling, TLS handshakes, reading, writing, parsing requests and any other common proxy tasks so that users can focus on logic that matters to them.
Open source, present and future
Pingora is a library and toolset, not an executable binary. In other words, Pingora is the engine that powers a car, not the car itself. Although Pingora is production-ready for industry use, we understand a lot of folks want a batteries-included, ready-to-go web service with low or no-code config options. Building that application on top of Pingora will be the focus of our collaboration with the ISRG to expand Pingora’s reach. Stay tuned for future announcements on that project.
Other caveats to keep in mind:
Today, API stability is not guaranteed. Although we will try to minimize how often we make breaking changes, we still reserve the right to add, remove, or change components such as request and response filters as the library evolves, especially during this pre-1.0 period.
Support for non-Unix based operating systems is not currently on the roadmap. We have no immediate plans to support these systems, though this could change in the future.
How to contribute
Feel free to raise bug reports, documentation issues, or feature requests in our GitHub issue tracker. Before opening a pull request, we strongly suggest you take a look at our contribution guide.
Conclusion
In this blog we announced the open source of our Pingora framework. We showed that Internet entities and infrastructure can benefit from Pingora’s security, performance and customizability. We also demonstrated how easy it is to use Pingora and how customizable it is.
Whether you’re building production web services or experimenting with network technologies we hope you find value in Pingora. It’s been a long journey, but sharing this project with the open source community has been a goal from the start. We’d like to thank the Rust community as Pingora is built with many great open-sourced Rust crates. Moving to a memory safe Internet may feel like an impossible journey, but it’s one we hope you join us on.
Setting up Cloudflare Zaraz on your website is a great way to load third-party tools and scripts, like analytics or conversion pixels, while keeping things secure and performant. The process can be a breeze if all you need is just to add a few tools to your website, but If your setup is complex and requires using click listeners, advanced triggers and variables, or, if you’re migrating a substantial container from Google Tag Manager, it can be quite an undertaking. We want to make sure customers going through this process receive all the support they need.
Historically, we’ve provided hands-on support and maintenance for Zaraz customers, helping them navigate the intricacies of this powerful tool. However, as Zaraz’s popularity continues to surge, providing one-on-one support has become increasingly impractical.
Companies usually rely on agencies to manage their tags and marketing campaigns. These agencies often have specialized knowledge, can handle diverse client needs efficiently, scale resources as required, and may offer cost advantages compared to maintaining an in-house team. That’s why we’re thrilled to announce the launch of the first round of certified Zaraz developers, aligning with the way other Tag Management software works. Our certified developers have undergone an intensive training program and passed an examination to prove their in-depth knowledge of Cloudflare Zaraz, including all the ins-and-outs of the tool.
These certified developers are now available to assist you with everything related to Zaraz, whether it’s migration, configuration, or ongoing support. They are well-equipped to ensure that you get the most out of your Zaraz experience, and they have a direct line of communication with the Cloudflare Zaraz team when a need arises.
We’re also pleased to mention that the majority of the course materials used for training are available online for free. You can explore these resources in our YouTube playlist for the Zaraz Developer Certification Program and empower yourself with the knowledge you need to make the most of Zaraz. The videos total more than 4 hours of deep dive into many areas of how to use Zaraz in the best way.
In conclusion, our new certified developers play a significant role in extending the ecosystem for Zaraz. We started this process by empowering developers to write their own integrations by open-sourcing the Managed Components technology, and we’re now pushing to make Zaraz an even better choice for enterprises and big websites. We encourage you to leverage the Certified Developers expertise to streamline your Zaraz experience, and to explore the wealth of free educational materials at your disposal.
Two months ago, we made Cloudflare Turnstile generally available — giving website owners everywhere an easy way to fend off bots, without ever issuing a CAPTCHA. Turnstile allows any website owner to embed a frustration-free Cloudflare challenge on their website with a simple code snippet, making it easy to help ensure that only human traffic makes it through. In addition to protecting a website’s frontend, Turnstile also empowers web administrators to harden browser-initiated (AJAX) API calls running under the hood. These APIs are commonly used by dynamic single-page web apps, like those created with React, Angular, Vue.js.
Today, we’re excited to announce that we have integrated Turnstile with the Cloudflare Web Application Firewall (WAF). This means that web admins can add the Turnstile code snippet to their websites, and then configure the Cloudflare WAF to manage these requests. This is completely customizable using WAF Rules; for instance, you can allow a user authenticated by Turnstile to interact with all of an application’s API endpoints without facing any further challenges, or you can configure certain sensitive endpoints, like Login, to always issue a challenge.
Challenging fetch requests in the Cloudflare WAF
Millions of websites protected by Cloudflare’s WAF leverage our JS Challenge, Managed Challenge, and Interactive Challenge to stop bots while letting humans through. For each of these challenges, Cloudflare intercepts the matching request and responds with an HTML page rendered by the browser, where the user completes a basic task to demonstrate that they’re human. When a user successfully completes a challenge, they receive a cf_clearance cookie, which tells Cloudflare that a user has successfully passed a challenge, the type of challenge, and when it was completed. A clearance cookie can’t be shared between users, and is only valid for the time set by the Cloudflare customer in their Security Settings dashboard.
This process works well, except when a browser receives a challenge on a fetch request and the browser has not previously passed a challenge. On a fetch request, or an XML HTTP Request (XHR), the browser expects to get back simple text (in JSON or XML formats) and cannot render the HTML necessary to run a challenge.
As an example, let’s imagine a pizzeria owner who built an online ordering form in React with a payment page that submits data to an API endpoint that processes payments. When a user views the web form to add their credit card details they can pass a Managed Challenge, but when the user submits their credit card details by making a fetch request, the browser won’t execute the code necessary for a challenge to run. The pizzeria owner’s only option for handling suspicious (but potentially legitimate) requests is to block them, which runs the risk of false positives that could cause the restaurant to lose a sale.
This is where Turnstile can help. Turnstile allows anyone on the Internet to embed a Cloudflare challenge anywhere on their website. Before today, the output of Turnstile was only a one-time use token. To enable customers to issue challenges for these fetch requests, Turnstile can now issue a clearance cookie for the domain that it’s embedded on. Customers can issue their challenge within the HTML page before a fetch request, pre-clearing thevisitor to interact with the Payment API.
Turnstile Pre-Clearance mode
Returning to our pizzeria example, the three big advantages of using Pre-Clearance to integrate Turnstile with the Cloudflare WAF are:
Improved user experience: Turnstile’s embedded challenge can run in the background while the visitor is entering their payment details.
Blocking more requests at the edge: Because Turnstile now issues a clearance cookie for the domain that it’s embedded on, our pizzeria owner can use a Custom Rule to issue a Managed Challenge for every request to the payment API. This ensures that automated attacks attempting to target the payment API directly are stopped by Cloudflare before they can reach the API.
(Optional) Securing the action and the user: No backend code changes are necessary to get the benefit of Pre-Clearance. However, further Turnstile integration will increase security for the integrated API. The pizzeria owner can adjust their payment form to validate the received Turnstile token, ensuring that every payment attempt is individually validated by Turnstile to protect their payment endpoint from session hijacking.
A Turnstile widget with Pre-Clearance enabled will still issue turnstile tokens, which gives customers the flexibility to decide if an endpoint is critical enough to require a security check on every request to it, or just once a session. Clearance cookies issued by a Turnstile widget are automatically applied to the Cloudflare zone the Turnstile widget is embedded on, with no configuration necessary. The clearance time the token is valid for is still controlled by the zone specific “Challenge Passage” time.
Implementing Turnstile with Pre-Clearance
Let’s make this concrete by walking through a basic implementation. Before we start, we’ve set up a simple demo application where we emulate a frontend talking to a backend on a /your-api endpoint.
We’ve created a button. Upon clicking, Cloudflare makes a fetch() request to the /your-api endpoint, showing the result in the response container.
Now let’s consider that we have a Cloudflare WAF rule set up that protects the /your-api endpoint with a Managed Challenge.
Due to this rule, the app that we just wrote is going to fail for the reason described earlier (the browser is expecting a JSON response, but instead receives the challenge page as HTML).
If we inspect the Network Tab, we can see that the request to /your-api has been given a 403 response.
Upon inspection, the Cf-Mitigated header shows that the response was challenged by Cloudflare’s firewall, as the visitor has not solved a challenge before.
To address this problem in our app, we set up a Turnstile Widget in Pre-Clearance mode for the Turnstile sitekey that we want to use.
In our application, we override the fetch() function to invoke Turnstile once a Cf-Mitigated response has been received.
<script>
turnstileLoad = function () {
  // Save a reference to the original fetch function
  const originalFetch = window.fetch;

  // A simple modal to contain Cloudflare Turnstile
  const overlay = document.createElement('div');
  overlay.style.position = 'fixed';
  overlay.style.top = '0';
  overlay.style.left = '0';
  overlay.style.right = '0';
  overlay.style.bottom = '0';
  overlay.style.backgroundColor = 'rgba(0, 0, 0, 0.7)';
  overlay.style.border = '1px solid grey';
  overlay.style.zIndex = '10000';
  overlay.style.display = 'none';
  overlay.innerHTML =       '<p style="color: white; text-align: center; margin-top: 50vh;">One more step before you proceed...</p><div style=”display: flex; flex-wrap: nowrap; align-items: center; justify-content: center;” id="turnstile_widget"></div>';
  document.body.appendChild(overlay);

  // Override the native fetch function
  window.fetch = async function (...args) {
      let response = await originalFetch(...args);

      //If the original request was challenged...
      if (response.headers.has('cf-mitigated') && response.headers.get('cf-mitigated') === 'challenge') {
          //The request has been challenged...
          overlay.style.display = 'block';

          await new Promise((resolve, reject) => {
              turnstile.render('#turnstile_widget', {
                  'sitekey': ‘YOUR_TURNSTILE_SITEKEY',
                  'error-callback': function (e) {
                      overlay.style.display = 'none';
                      reject(e);
                  },
                  'callback': function (token, preClearanceObtained) {
                      if (preClearanceObtained) {
                          //The visitor successfully solved the challenge on the page.
                          overlay.style.display = 'none';
                          resolve();
                      } else {
                          reject(e);
                      }
                  },
              });
          });

          // Replay the original fetch request, this time it will have the cf_clearance Cookie
          response = await originalFetch(...args);
      }
      return response;
  };
};
</script>
<script src="https://challenges.cloudflare.com/turnstile/v0/api.js?onload=turnstileLoad" async defer></script>
There is a lot going on in the snippet above: First, we create a hidden overlay element and override the browser’s fetch() function. The fetch() function is changed to introspect the Cf-Mitigated header for ‘challenge’. If a challenge is issued, the initial result will be unsuccessful; instead, a Turnstile overlay (with Pre-Clearance enabled) will appear in our web application. Once the Turnstile challenge has been completed we will retry the previous request after Turnstile has obtained the cf_clearance cookie to get through the Cloudflare WAF.
Upon solving the Turnstile widget, the overlay disappears, and the requested API result is shown successfully:
Pre-Clearance is available to all Cloudflare customers
Every Cloudflare user with a free plan or above can use Turnstile in managed mode free for an unlimited number of requests. If you’re a Cloudflare user looking to improve your security and user experience for your critical API endpoints, head over to our dashboard and create a Turnstile widget with Pre-Clearance today.
The following is a guest post written by Pierre-Antoine Mills, Miguel Fernández, and Petra Donka of Prisma. Prisma provides a server-side library that helps developers read and write data to the database in an intuitive, efficient and safe way.
Prisma’s mission is to redefine how developers build data-driven applications. At its core, Prisma provides an open-source, next-generation TypeScript Object-Relational Mapping (ORM) library that unlocks a new level of developer experience thanks to its intuitive data model, migrations, type-safety, and auto-completion.
Prisma ORM has experienced remarkable growth, engaging a vibrant community of developers. And while it was a great problem to have, this growth was causing an explosion in our AWS infrastructure costs. After investigating a wide range of alternatives, we went with Cloudflare’s R2 storage — and as a result are thrilled that our engine distribution costs have decreased by 98%, while delivering top-notch performance.
It was a natural fit: Prisma is already a proud technology partner of Cloudflare’s, offering deep database integration with Cloudflare Workers. And Cloudflare products provide much of the underlying infrastructure for Prisma Accelerate and Prisma Pulse, empowering user-focused product development. In this post, we’ll dig into how we decided to extend our ongoing collaboration with Cloudflare to the Prisma ORM, and how we migrated from AWS S3 + CloudFront to Cloudflare R2, with zero downtime.
Distributing the Prisma ORM and its engines
Prisma ORM simplifies data access thanks to its type-safe Prisma Client, and enables efficient database management via the Prisma CLI, so that developers can focus on product development.
Both the Prisma Client and the Prisma CLI rely on the Prisma Engines, which are implemented in Rust and distributed as platform-specific compiled binaries. The Prisma Engines perform a variety of tasks ranging from providing information about the schema for type generation, or migrating the database, to transforming Prisma queries into SQL, and executing those queries against the database. Think of the engines as the layer in the Prisma ORM that talks to the database.
As a developer, one of the first steps to get started with Prisma is to install Prisma Client and the Prisma CLI from npm. Once installed, these packages need the Prisma Engines to be able to function. These engines have complex target-platform rules and were originally envisioned to be distributed separately from the npm package, so they can be used outside of the Node.js ecosystem. As a result, they are downloaded on demand by the Prisma CLI, only downloading what is strictly required for a given project.
As of mid-2023, the engines account for 100 million downloads a month and 250 terabytes of egress data transfer, with a continuous month-over-month increase as our user base grows. This highlights the importance of a highly available, global, and scalable infrastructure that provides low latency engine downloads to Prisma users all around the world.
Our original solution: AWS S3 & CloudFront
During the early development of the Prisma ORM, our engineering team looked for tools to build the CDN for engine distribution. With extensive AWS experience, we went with the obvious: S3 blob storage for the engine files and CloudFront to cache contents closer to the user.
A simplified representation of how the Prisma Engines flow from our CI where they are built and uploaded, to the Prisma CLI downloading the correct engine for a given environment when installing Prisma, all the way to the user being able to use it.
We were happy with AWS for the most part, and it was able to scale with our demands. However, as our user base continued to grow, so did the costs. At our scale of traffic, data transfer became a considerable cost item that we knew would only continue to grow.
The continuously increasing cost of these services prompted us to explore alternative options that could better accommodate our needs while at least maintaining the same level of performance and reliability. Prisma is committed to providing the best products and solutions to our users, and an essential part of that commitment is being intentional about the allocation of our resources, including sensible spending to enable us to serve our growing user base in the best way possible.
Exploring distribution options
We extensively explored different technologies and services that provided both reliable and fast engine distribution, while being cost-effective.
Free solutions: GitHub & npm
Because Prisma ORM is an open-source solution, we have explored various ways to distribute the engines through our existing distribution channels, at no cost. In this area, we had both GitHub Releases and npm as candidates to host and distribute our engine files. We dismissed GitHub Releases early on as the quality of service was not guaranteed, which was a requirement for us towards our users, so we can be sure to provide a good developer experience under all circumstances.
We also looked at npm, and confirmed that hosting the engine files would be in agreement with their Terms of Service. This made npm a viable option, but also meant we would have to change our engine download and upload logic to accommodate a different system. Additionally, this implied that we would have to update many past Prisma CLI versions, requiring our users to upgrade to take advantage of the new solution.
Paid solutions: CDNs & Cloudflare
We then considered only replacing CloudFront, which accounted for 97% of our distribution costs, while retaining S3 as the origin. When we evaluated different CDNs, we found that alternatives could lead to an estimated 70% cost reduction.
We also explored Cloudflare’s offerings and were impressed byCloudflare R2, an alternative to AWS S3 + CloudFront. It offers robust blob storage compatible with S3 and leverages Cloudflare’s network for global low-latency distribution. Additionally, it has no egress costs, and is solely priced based on the total volume of data stored and operations on that data. Given our reliance on Cloudflare’sproduct portfolio for ourData Platform, and extensive experience with their Workers platform, we already had high trust in the quality of Cloudflare’s products.
To finalize our decision, we implemented a test to confirm our intuitions about Cloudflare’s quality of service. We deployed a script to 50 cities across the globe, representative of our incoming traffic, to measure download latencies for our engine files (~15MB). The test was run multiple times, with latencies for the different cache statuses recorded and compared against our previous AWS-based solution. The results confirmed that Cloudflare R2's reliability and performance were at least on par with AWS S3 + CloudFront. And because R2 is compatible with S3, we wouldn’t need to make substantial changes to our software in order to move over to Cloudflare. These were great results, and we couldn’t wait to switch!
Our solution: moving to Cloudflare’s R2
In order to move our engine file distribution to Cloudflare, we needed to ensure we could make the switch without any disruption or impact to our users.
While R2 URLs match S3's format, Prisma CLI uses a fixed domain to point to the engine file distribution. This fixed domain enabled us to transition without making any changes to the code of older Prisma versions, and simply point the existing URLs to R2. However, to make the transition, we needed to change our DNS configuration to point to Cloudflare. While this seems trivial, potential issues like unexpected DNS propagation challenges, or certificate validation problems when connecting via TLS, required us to plan ahead in order to proceed confidently and safely.
We modified the Prisma ORM release pipeline to upload assets to both S3 and R2, and used the R2 Super Slurper for migrating past engine versions to R2. This ensured all Prisma releases, past and future, existed in both places. We also established Grafana monitoring checks to pull engine files from R2, using a DNS and TLS configuration similar to our desired production setup, but via an experimental domain. Those monitoring checks were later reused during the final traffic cutover to ensure that there was no service disruption.
As ensuring no impact or disruption to our users was of utmost importance, we proceeded with a gradual rollout of the DNS changes using DNS load balancing, a method where a group of alias records assigned to a domain are weighted differently. This meant that the DNS resolver directed more traffic to heavier-weighted records. We began with a load balancing configuration simulating our old setup, with one record (the control) pointing to AWS CloudFront, and the other (the candidate) pointing to R2. Initially, all weight was on the control, effectively preserving the old routing to CloudFront. We also set the lowest TTL possible, so changes in the record weights took effect as soon as possible, creating more control over DNS propagation. Additionally, we implemented a health check that would redirect all traffic to the control if download latencies were significantly higher, or if errors were detected, ensuring a stable fallback.
At this point, everything was in place and we could start the rollout.
Our DNS load balancing setup during the rollout. We assigned increasing weights to route traffic to Cloudflare R2. The health check that would fail over to AWS CloudFront never fired.
The rollout began with a gradual increase in R2's DNS weight, and our monitoring dashboards showed that Cloudflare downloads were proportional to the weight assigned to R2. With as little as 5% traffic routed to Cloudflare, cache hit ratios neared 100%, as expected. Latencies matched the control, so the health checks were all good, and our fallback never activated. Over the duration of an hour, we gradually increased R2's DNS weight to manage 25%, 50%, and finally 100% of traffic, without any issues. The cutover could not have gone any smoother.
After monitoring for an additional two days, we simplified the DNS topology and routed to Cloudflare exclusively. We were extremely satisfied with the change, and started seeing our infrastructure costs drop considerably, as expected, not to mention the zero downtime and zero reported issues from users.
A success
Transitioning to Cloudflare R2 was easy thanks to their great product and tooling, intuitive platform and supportive team. We've had an excellent experience with their service, with consistently great uptime, performance and latency. Cloudflare proved once again to be a valuable partner to help us scale.
We are thrilled that our engine distribution costs have decreased by 98%. Cloudflare's cost-effective solution has not only delivered top-notch performance but has also brought significant savings to our operations. An all around success!
And if you want to see Prisma in action, get started with the Quickstart guide.
The collective thoughts of the interwebz
Manage Consent
To provide the best experiences, we use technologies like cookies to store and/or access device information. Consenting to these technologies will allow us to process data such as browsing behavior or unique IDs on this site. Not consenting or withdrawing consent, may adversely affect certain features and functions.
Functional
Always active
The technical storage or access is strictly necessary for the legitimate purpose of enabling the use of a specific service explicitly requested by the subscriber or user, or for the sole purpose of carrying out the transmission of a communication over an electronic communications network.
Preferences
The technical storage or access is necessary for the legitimate purpose of storing preferences that are not requested by the subscriber or user.
Statistics
The technical storage or access that is used exclusively for statistical purposes.The technical storage or access that is used exclusively for anonymous statistical purposes. Without a subpoena, voluntary compliance on the part of your Internet Service Provider, or additional records from a third party, information stored or retrieved for this purpose alone cannot usually be used to identify you.
Marketing
The technical storage or access is required to create user profiles to send advertising, or to track the user on a website or across several websites for similar marketing purposes.