Amazon Managed Streaming for Apache Kafka (Amazon MSK) is a fully managed service that enables you to build and run applications that use Apache Kafka to process streaming data.
Today, we’re excited to bring the benefits of Graviton3 to Kafka workloads, with Amazon MSK now offering M7g instances for new MSK provisioned clusters. AWS Graviton processors are custom Arm-based processors built by AWS to deliver the best price-performance for your cloud workloads. For example, when running an MSK provisioned cluster using M7g.4xlarge instances, you can achieve up to 27% reduction in CPU usage and up to 29% higher write and read throughput compared to M5.4xlarge instances. These performance improvements, along with M7g’s lower prices provide up to 24% in compute cost savings over M5 instances.
In February 2023, AWS launched new Graviton3-based M7g instances. M7g instances are equipped with DDR5 memory, which provides up to 50% higher memory bandwidth than the DDR4 memory used in previous generations. M7g instances also deliver up to 25% higher storage throughput and up to 88% increase in network throughput compared to similar sized M5 instances to deliver price-performance benefits for Kafka workloads. You can read more about M7g features in New Graviton3-Based General Purpose (m7g) and Memory-Optimized (r7g) Amazon EC2 Instances.
Here are the specs for the M7g instances on MSK:
Name
vCPUs
Memory
Network Bandwidth
Storage Bandwidth
M7g.large
2
8 GiB
up to 12.5 Gbps
up to 10 Gbps
M7g.xlarge
4
16 GiB
up to 12.5 Gbps
up to 10 Gbps
M7g.2xlarge
8
32 GiB
up to 15 Gbps
up to 10 Gbps
M7g.4xlarge
16
64 GiB
up to 15 Gbps
up to 10 Gbps
M7g.8xlarge
32
128 GiB
15 Gbps
10 Gbps
M7g.12xlarge
48
192 GiB
22.5 Gbps
15 Gbps
M7g.16xlarge
64
256 GiB
30 Gbps
20 Gbps
M7g instances on Amazon MSK
Organizations are adopting Amazon MSK to capture and analyze data in real time, run machine learning (ML) workflows, and build event-driven architectures. Amazon MSK enables you to reduce operational overhead and run your applications with higher availability and durability. It also offers a consistent reduction in price-performance with capabilities such as Tiered Storage. With compute making up a large portion of Kafka costs, customers wanted a way to optimize them further and see Graviton instances providing them the quickest path. Amazon MSK has fully tested and validated M7g on all Kafka versions starting with version 2.8.2, making it to run critical workloads and benefit from Gravition3 cost savings.
You can get started by provisioning new clusters with the Graviton3-based M7g instances as the broker type using the AWS Management Console, APIs via the AWS SDK, and the AWS Command Line Interface (AWS CLI). M7g instances support all Amazon MSK and Kafka features, making it straightforward for you to run all your existing Kafka workloads with minimal changes. Amazon MSK supports Graviton3-based M7g instances from large through 16xlarge sizes to run all Kafka workloads.
Let’s take the M7g instances on MSK provisioned clusters for a test drive and see how it compares with Amazon MSK M5 instances.
M7g instances in action
Customers run a wide variety of workloads on Amazon MSK; some are latency sensitive, and some are throughput bound. In this post, we focus on M7g performance impact on throughput-bound workloads. M7g comes with an increase in network and storage throughput, providing a higher throughput per broker compared to an M5-based cluster.
To understand the implications, let’s look at how Kafka uses available throughput for writing or reading data. Every broker in the MSK cluster comes with a bounded storage and network throughput entitlement. Predominantly, writes in Kafka consume both storage and network throughput, whereas reads consume mostly network throughput. This is because a Kafka consumer is typically reading real-time data from a page cache and occasionally goes to disk to process old data. Therefore, the overall throughput gains also change based on the workload’s write to read throughput ratios.
Let’s look at the throughput gains based on an example. Our setup includes an MSK cluster with M7g.4xlarge instances and another with M5.4xlarge instances, with three nodes in three different Availability Zones. We also enabled TLS encryption, AWS Identity and Access Management (IAM) authentication, and a replication factor of 3 across both M7g and M5 MSK clusters. We also applied Amazon MSK best practices for broker configurations, including num.network.threads = 8 and num.io.threads = 16. On the client side for writes, we optimized the batch size with appropriate linger.ms and batch.size configurations. For the workload, we assumed 6 topics each with 64 partitions (384 per broker). For ingestion, we generated load with an average message size of 512 bytes and with one consumer group per topic. The amount of load sent to the clusters was identical.
As we ingest more data into the MSK cluster, the M7g.4xlarge instance supports higher throughput per broker, as shown in the following graph. After an hour of consistent writes, M7g.4xlarge brokers support up to 54 MB/s of write throughput vs. 40 MB/s with M5-based brokers, which represents a 29% increase.
We also see another important observation: M7g-based brokers consume much fewer CPU resources than M5s, even though they support 29% higher throughput. As seen in the following chart, CPU utilization of an M7g-based broker is on average 40%, whereas on an M5-based broker, it’s 47%.
As covered previously, customers may see different performance improvements based on the number of consumer group, batch sizes, and instance size. We recommend referring to MSK Sizing and Pricing to calculate M7g performance gains for your use case or creating a cluster based on M7g instances and benchmark the gains on your own.
Lower costs, with lesser operational burden, and higher resiliency
Since its launch, Amazon MSK has made it cost-effective to run your Kafka workloads, while still improving overall resiliency. Since day 1, you have been able to run brokers in multiple Availability Zones without worrying about additional networking costs. In October 2022, we launched Tiered Storage, which provides virtually unlimited storage at up to 50% lower costs. When you use Tiered Storage, you not only save on overall storage cost but also improve the overall availability and elasticity of your cluster.
Continuing down this path, we are now reducing compute costs for customers while still providing performance improvements. With M7g instances, Amazon MSK provides 24% savings on compute costs compared to similar sized M5 instances. When you move to Amazon MSK, you can not only lower your operational overhead using features such as Amazon MSK Connect, Amazon MSK Replicator, and automatic Kafka version upgrades, but also improve over resiliency and reduce their infrastructure costs.
Pricing and Regions
M7g instances on Amazon MSK are available today in the US (Ohio, N. Virginia, N. California, Oregon), Asia Pacific (Hyderabad, Mumbai, Seoul, Singapore, Sydney, Tokyo), Canada (Central), and EU (Ireland, London, Spain, Stockholm) Regions.
Refer to Amazon MSK pricing to learn about Graivton3-based instances with Amazon MSK pricing.
Summary
In this post, we discussed the performance gains achieved while using Graviton-based M7g instances. These instances can provide significant improvement in read and write throughput compared to similar sized M5 instances for Amazon MSK workloads. To get started, create a new cluster with M7g brokers using the AWS Management Console, and read our documentation for more information.
About the Authors
Sai Maddali is a Senior Manager Product Management at AWS who leads the product team for Amazon MSK. He is passionate about understanding customer needs, and using technology to deliver services that empowers customers to build innovative applications. Besides work, he enjoys traveling, cooking, and running.
Umesh is a Streaming Solutions Architect at AWS. He works with AWS customers to design and build real time data processing systems. He has 13 years of working experience in software engineering including architecting, designing, and developing data analytics systems.
Lanre Afod is a Solutions Architect focused with Global Financial Services at AWS, passionate about helping customers with deploying secure, scalable, high available and resilient architectures within the AWS Cloud.
As cloud environments—and security risks associated with them—become more complex, it becomes increasingly critical to understand your cloud security posture so that you can quickly and efficiently mitigate security gaps. AWS Security Hub offers close to 300 automated controls that continuously check whether the configuration of your cloud resources aligns with the best practices identified by Amazon Web Services (AWS) security experts and with industry standards. Furthermore, you can manage your cloud security posture at scale by using a single action to enable Security Hub across your organization with the default settings, and by aggregating findings across your organization accounts and Regions to a single account and Region of your choice.
With the release of the new central configuration feature of Security Hub, the setup and management of control and policy configurations is simplified and centralized to the same account you have already been using to aggregate findings. In this blog post, we will explain the benefits of the new feature and describe how you can quickly onboard to it.
Central configuration overview
With the release of the new central configuration capabilities in Security Hub, you are now able to use your delegated administrator (DA) account (an AWS Organizations account designated to manage Security Hub throughout your organization) to centrally manage Security Hub controls and standards and to view your Security Hub configuration throughout your organization from a single place. To facilitate this functionality, central configuration allows you to set up policies that specify whether or not Security Hub should be enabled and which standards and controls should be turned on. You can then choose to associate your policies with your entire organization or with specific accounts or organizational units (OUs), with your policies applying automatically across linked Regions. Policies applied to specific OUs (or to the entire organization) are inherited by child accounts. This not only applies to existing accounts, but also to new accounts added to those OUs (or to the entire organization) after you created the policy. Furthermore, when you add a new linked Region to Security Hub, your existing policies will be applied to that Region immediately. This allows you to stop maintaining manual lists of accounts and Regions to which you’d like to apply your custom configurations; instead, you can maintain several policies for your organization, with each one being associated to a different set of accounts in your organization. As a result, by using the central configuration capabilities, you can significantly reduce the time spent on configuring Security Hub and switch your focus to remediating its findings.
After applying your policies, Security Hub also provides you with a view of your organization that shows the policy status per OU and account while also preventing drift. This means that after you set up your organization by using central configuration, account owners will not be able to deviate from your chosen settings—your policies will serve as the source of truth for your organizational configuration, and you can use them to understand how Security Hub is configured for your organization.
The use of the new central configuration feature is now the recommended approach to configuring Security Hub, and its standards and controls, across some or all AWS accounts in your AWS Organizations structure.
Prerequisites
To get started with central configuration, you need to complete three prerequisites:
Enable AWS Config in the accounts and Regions where you plan to enable Security Hub. (For more information on how to optimize AWS Config configuration for Security Hub usage, see this blog post.)
Turn on Security Hub in your AWS Organizations management account at least in one Region where you plan to use Security Hub.
Use your Organizations management account to delegate an administrator account for Security Hub.
If you are new to Security Hub, simply navigate to it in the AWS Management Console from your organization management account, and the console will walk you through setting the last two prerequisites listed here. If you already use Security Hub, these can be configured from the Settings page in Security Hub. In both cases, upon completing these three prerequisites, you can proceed with the central configuration setup from the account you set as the DA.
Recommended setup
To begin the setup, open the Security Hub console from your AWS Organizations management account or from your Security Hub delegated administrator account. In the left navigation menu, choose Configuration to open the new Configuration page, shown in Figure 1. Choose Start central configuration.
Figure 1: The new Configuration page, where you can see your current organizational configuration and start using the new capabilities
If you signed in to Security Hub using the AWS Organizations management account, you will be brought to step 1, Designate delegated administrator, where you will be able to designate a new delegated administrator or confirm your existing selection before continuing the setup. If you signed in to Security Hub using your existing delegated administrator account, you will be brought directly to step 2, Centralize organization, which is shown in Figure 2. In step 2, you are first asked to choose your home Region, which is the AWS Region you will use to create your configuration policies. By default, the current Region is selected as your home Region, unless you already use cross-Region finding aggregation — in which case, your existing aggregation Region is pre-selected as your home Region.
You are then prompted to select your linked Regions, which are the Regions you will configure by using central configuration. Regions that were already linked as part of your cross-Region aggregation settings will be pre-selected. You will also be able to add additional Regions or choose to include all AWS Regions, including future Regions. If your selection includes opt-in Regions, note that Security Hub will not be enabled in them until you enable those Regions directly.
Figure 2: The Centralize organization page
Step 3, Configure organization, is shown in Figure 3. You will see a recommendation that you use the AWS recommended Security Hub configuration policy (SHCP) across your entire organization. This includes enabling the AWS Foundational Security Best Practices (FSBP) v1.0.0 standard and enabling new and existing FSBP controls in accounts in your AWS Organizations structure. This is the recommended configuration for most customers, because the AWS FSBP have been carefully curated by AWS security experts and represent trusted security practices for customers to build on.
Alternatively, if you already have a custom configuration in Security Hub and would like to import it into the new capabilities, choose Customize my Security Hub configuration and then choose Pre-populate configuration.
Figure 3: Step 3 – creating your first policy
Step 4, Review and apply, is where you can review the policy you just created. Until you complete this step, your organization’s configuration will not be changed. This step will override previous account configurations and create and apply your new policy. After you choose Create policy and apply, you will be taken to the new Configuration page, which was previously shown in Figure 1. The user interface will now be updated to include three tabs — Organization, Policies, and Invitation account — where you can do the following:
On the Organization tab, which serves as a single pane of glass for your organization configuration in Security Hub, you can see the policy status for each account and OU and verify that your desired configuration is in effect.
On the Policies tab, you can view your policies, update them, and create new ones.
On the Invitation accounts tab, you can view and update findings for invitation accounts, which do not belong to your AWS Organizations structure. These accounts cannot be configured using the new central configuration capabilities.
Together, those tabs serve as a single pane of glass for your organization configuration in Security Hub. To that end, the organization chart you now see shows which of your accounts have already been affected by the policy you just created and which are still pending. Normally, an account will show as pending only for a few minutes after you create new policies or update existing ones. However, an account can stay in pending status for up to 24 hours. During this time, Security Hub will try to configure the account with your chosen policy settings.
If Security Hub determines that a policy cannot be successfully propagated to an account, it will show its status as failed (see Figure 4). This is most likely to happen when you missed completing the prerequisites in the account where the failure is showing. For example, if AWS Config is not yet enabled in an account, the policy will have a failed status. When you hover your pointer over the word “Failed”, Security Hub will show an error message with details about the issue. After you fix the error, you can try again to apply the policy by selecting the failed account and choosing the Re-apply policy button.
Figure 4: The Organization tab on the Configuration page shows all your organization accounts, if they are being managed by a policy, and the policy status for each account and OU
Flexibility in onboarding to central configuration
As mentioned earlier, central configuration makes it significantly more accessible for you to centrally manage Security Hub and its controls and standards. This feature also gives you the granularity to choose the specific accounts to which your chosen settings will be applied. Even though we recommend to use central configuration to configure all your accounts, one advantage of the feature is that you can initially create a test configuration and then apply it across your organization. This is especially useful when you have already configured Security Hub using previously available methods and you would like to check that you have successfully imported your existing configuration.
When you onboard to central configuration, accounts in the organization are self-managed by default, which means that they still maintain their previous configuration until you apply a policy to them, to one of their parent OUs, or to the entire organization. This gives you the option to create a test policy when you onboard, apply it only to a test account or OU, and check that you achieved your desired outcome before applying it to other accounts in the organization.
Configure and deploy different policies per OU
Although we recommend that you use the policy recommended by Security Hub whenever possible, every customer has a different environment and some customization might be required. Central configuration does not require you to use the recommended policy, and you can instead create your own custom policies that specify how Security Hub is used across organization accounts and Regions. You can create one configuration policy for your entire organization, or multiple policies to customize Security Hub settings in different accounts.
In addition, you might need to implement different policies per OU. For example, you might need to do that when you have a finance account or OU in which you want to use Payment Card Industry Data Security Standard (PCI DSS) v3.2.1. In this case, you can go to the Policies tab, choose Create policy, specify the configuration you’d like to have, and apply it to those specific OUs or accounts, as shown in Figure 5. Note that each policy must be complete — which means that it must contain the full configuration settings you would like to apply to the chosen set of accounts or OUs. In particular, an account cannot inherit part of its settings from a policy associated with a parent OU, and the other part from its own policy. The benefit of this requirement is that each policy serves as the source of truth for the configuration of the accounts it is applied to. For more information on this behavior or on how to create new policies, see the Security Hub documentation.
Figure 5: Creation of a new policy with the FSBP and the PCI DSS standards
You might find it necessary to exempt accounts from being centrally configured. You have the option to set an account or OU to self-managed status. Then only the account owner can configure the settings for that account. This is useful if your organization has teams that need to be able to set their own security coverage. Unless you disassociate self-managed accounts from your Security Hub organization, you will still see findings from self-managed accounts, giving you organization-wide visibility into your security posture. However, you won’t be able to view the configuration of those accounts, because they are not centrally managed.
Understand and manage where controls are applied
In addition to being able to centrally create and view your policies, you can use the control details page to define, review, and apply how policies are configured at a control level. To access the control details page, go to the left navigation menu in Security Hub, choose Controls, and then choose any individual control.
The control details page allows you to review the findings of a control in accounts where it is already enabled. Then, if you decide that these findings are not relevant to specific accounts and OUs, or if you decide that you want to use the control in additional accounts where it is not currently enabled, you can choose Configure, view the policies to which the control currently applies, and update the configuration accordingly as shown in Figure 6.
Figure 6: Configuring a control from the control details page
Organizational visibility
As you might already have noticed in the earlier screenshot of the Organization view (Figure 4), the new central configuration capability gives you a new view of the policies applied (and by extension, the controls and standards deployed) to each account and OU. If you need to customize this configuration, you can modify an existing policy or create a new policy to quickly apply to all or a subset of your accounts. At a glance, you can also see which accounts are self-managed or don’t have Security Hub turned on.
Conclusion
Security Hub central configuration helps you to seamlessly configure Security Hub and its controls and standards across your accounts and Regions so that your organization’s accounts have the level of security controls coverage that you want. AWS recommends that you use this feature when configuring, deploying, and managing controls in Security Hub across your organization’s accounts and Regions. Central configuration is now available in all commercial AWS Regions. Try it out today by visiting the new Configuration page in Security Hub from your DA. You can benefit from the Security Hub 30-day free trial even if you use central configuration, and the trial offer will be automatically applied to organization accounts in which you didn’t use Security Hub before.
If you have feedback about this post, submit comments in the Comments section below. If you have questions about this post, contact AWS Support.
Want more AWS Security news? Follow us on Twitter.
You can now use AWS IAM Identity Center application assignment APIs to programmatically manage and audit user and group access to AWS managed applications. Previously, you had to use the IAM Identity Center console to manually assign users and groups to an application. Now, you can automate this task so that you scale more effectively as your organization grows.
In this post, we will show you how to use IAM Identity Center APIs to programmatically manage and audit user and group access to applications. The procedures that we share apply to both organization instances and account instances of IAM Identity Center.
Automate management of user and group assignment to applications
IAM Identity Center is where you create, or connect, your workforce users one time and centrally manage their access to multiple AWS accounts and applications. You configure AWS managed applications to work with IAM Identity Center directly from within the relevant application console, and then manage which users or groups need permissions to the application.
AWS managed applications access user and group information directly from IAM Identity Center. One example of an AWS managed application is Amazon Redshift. When you configure Amazon Redshift as an AWS managed application with IAM Identity Center, and a user from your organization accesses the database, their group memberships defined in IAM Identity Center can map to Amazon Redshift database roles that grant them specific permissions. This makes it simpler for you to manage users because you don’t have to set database-object permissions for each individual. For more information, see The benefits of Redshift integration with AWS IAM Identity Center.
After you configure the integration between IAM Identity Center and Amazon Redshift, you can automate the assignment or removal of users and groups by using the DeleteApplicationAssignment and CreateApplicationAssignment APIs, as shown in Figure 1.
Figure 1: Use the CreateApplicationAssignment API to assign users and groups to Amazon Redshift
In this section, you will learn how to use Identity Center APIs to assign a group to your Amazon Redshift application. You will also learn how to delete the group assignment.
Prerequisites
To follow along with this walkthrough, make sure that you’ve completed the following prerequisites:
Configure Amazon Redshift to use IAM Identity Center as its identity source. When you configure Amazon Redshift to use IAM Identity Center as its identity source, the application requires explicit assignment by default. This means that you must explicitly assign users to the application in the Identity Center console or APIs.
Take note of the IdentityStoreId and the InstanceArn — you will use both in the following steps.
Step 2: Create user and group in your Identity Store
The next step is to create a user and group in your Identity Store.
Note: If you already have a group in your Identity Center instance, get its GroupId and then proceed to Step 3. To get your GroupId, run the following command:
If you have more than one application in your environment, use the filter flag to specify the application account or the application provider. To learn more about the filter option, see the ListApplications API documentation.
In this case, we have only one application: Amazon Redshift. The response should look similar to the following. Take note of the ApplicationArn — you will need it in the next step.
Step 4: Add your group to the Amazon Redshift application
Now you can add your new group to the Amazon Redshift application managed by IAM Identity Center. The principal-id is the GroupId that you created in Step 2.
The group now has access to Amazon Redshift, but with the default permissions in Amazon Redshift. To grant access to databases, you can create roles that control the permissions available on a set of tables or views.
To create these roles in Amazon Redshift, you need to connect to your cluster and run SQL commands. To connect to your cluster, use one of the following options:
Figure 2 shows a connection to Amazon Redshift through the query editor v2.
Figure 2: Query editor v2
By default, all users have CREATE and USAGE permissions on the PUBLIC schema of a database. To disallow users from creating objects in the PUBLIC schema of a database, use the REVOKE command to remove that permission. For more information, see Default database user permissions.
As the Amazon Redshift database administrator, you can create roles where the role name contains the identity provider namespace prefix and the group or user name. To do this, use the following syntax:
CREATE ROLE <identitycenternamespace:rolename>;
The rolename needs to match the group name in IAM Identity Center. Amazon Redshift automatically maps the IAM Identity Center group or user to the role created previously. To expand the permissions of a user, use the GRANT command.
The identityprovidernamespace is assigned when you create the integration between Amazon Redshift and IAM Identity Center. It represents your organization’s name and is added as a prefix to your IAM Identity Center managed users and roles in the Redshift database.
Your syntax should look like the following:
CREATE ROLE <AWSIdentityCenter:MyGroup>;
Step 5: Remove application assignment
If you decide that the new group no longer needs access to the Amazon Redshift application but should remain within the IAM Identity Center instance, run the following command:
Note: Removing an application assignment for a group doesn’t remove the group from your Identity Center instance.
When you remove or add user assignments, we recommend that you review the application’s documentation because you might need to take additional steps to completely onboard or offboard a given user or group. For example, when you remove a user or group assignment, you must also remove the corresponding roles in Amazon Redshift. You can do this by using the DROP ROLE command. For more information, see Managing database security.
Audit user and group access to applications
Let’s consider how you can use the new APIs to help you audit application assignments. In the preceding example, you used the AWS CLI to create and delete assignments to Amazon Redshift. Now, we will show you how to use the new ListApplicationAssignments API to list the groups that are currently assigned to your Amazon Redshift application.
To see the group membership, use the PrincipalId information to query Identity Store and get information on the users assigned to the group with a combination of the ListGroupMemberships and DescribeGroupMembership APIs.
If you have several applications that IAM Identity Center manages, you can also create a script to automatically audit those applications. You can run this script periodically in an AWS Lambda function in your environment to maintain oversight of the members that are added to each application.
To get the script for this use case, see the multiple-instance-management-iam-identity-center GitHub repository. The repository includes instructions to deploy the script using Lambda within the AWS Organizations delegated administrator account. After deployment, you can invoke the Lambda function to get .csv files of every IAM Identity Center instance in your organization, the applications assigned to each instance, and the users that have access to those applications.
Conclusion
In this post, you learned how to use the IAM Identity Center application assignment APIs to assign users to Amazon Redshift and remove them from the application when they are no longer part of the organization. You also learned to list which applications are deployed in each account, and which users are assigned to each of those applications.
If you have feedback about this post, submit comments in the Comments section below. If you have questions about this post, start a new thread on AWS IAM Identity Center re:Post or contact AWS Support.
Want more AWS Security news? Follow us on Twitter.
AWS Secrets Manager is a service that helps you manage, retrieve, and rotate database credentials, application credentials, OAuth tokens, API keys, and other secrets throughout their lifecycles. You can use Secrets Manager to help remove hard-coded credentials in application source code. Storing the credentials in Secrets Manager helps avoid unintended or inadvertent access by anyone who can inspect your application’s source code, configuration, or components. You can replace hard-coded credentials with a runtime call to the Secrets Manager service to retrieve credentials dynamically when you need them.
In this blog post, we introduce a new Secrets Manager API call, BatchGetSecretValue, and walk you through how you can use it to retrieve multiple Secretes Manager secrets.
New API — BatchGetSecretValue
Previously, if you had an application that used Secrets Manager and needed to retrieve multiple secrets, you had to write custom code to first identify the list of needed secrets by making a ListSecrets call, and then call GetSecretValue on each individual secret. Now, you don’t need to run ListSecrets and loop. The new BatchGetSecretValue API reduces code complexity when retrieving secrets, reduces latency by running bulk retrievals, and reduces the risk of reaching Secrets Manager service quotas.
Security considerations
Though you can use this feature to retrieve multiple secrets in one API call, the access controls for Secrets Manager secrets remain unchanged. This means AWS Identity and Access Management (IAM) principals need the same permissions as if they were to retrieve each of the secrets individually. If secrets are retrieved using filters, principals must have both permissions for list-secrets and get-secret-value on secrets that are applicable. This helps protect secret metadata from inadvertently being exposed. Resource policies on secrets serve as another access control mechanism, and AWS principals must be explicitly granted permissions to access individual secrets if they’re accessing secrets from a different AWS account (see Cross-account access for more information). Later in this post, we provide some examples of how you can restrict permissions of this API call through an IAM policy or a resource policy.
Solution overview
In the following sections, you will configure an AWS Lambda function to use the BatchGetSecretValue API to retrieve multiple secrets at once. You also will implement attribute based access control (ABAC) for Secrets Manager secrets, and demonstrate the access control mechanisms of Secrets Manager. In following along with this example, you will incur costs for the Secrets Manager secrets that you create, and the Lambda function invocations that are made. See the Secrets Manager Pricing and Lambda Pricing pages for more details.
Prerequisites
To follow along with this walk-through, you need:
Five resources that require an application secret to interact with, such as databases or a third-party API key.
Create an IAM role to be used as a Lambda execution role.
Create a Lambda function.
Step 1: Create secrets
First, create multiple secrets with the same resource tag key-value pair using the AWS CLI. The resource tag will be used for ABAC. These secrets might look different depending on the resources that you decide to use in your environment. You can also manually create these secrets in the Secrets Manager console if you prefer.
Run the following commands in the AWS CLI, replacing the secret-string values with the credentials of the resources that you will be accessing:
aws secretsmanager create-secret --name MyTestSecret1 --description "My first test secret created with the CLI for resource 1." --secret-string "{\"user\":\"username\",\"password\":\"EXAMPLE-PASSWORD-1\"}" --tags "[{\"Key\":\"app\",\"Value\":\"app1\"},{\"Key\":\"environment\",\"Value\":\"production\"}]"
aws secretsmanager create-secret --name MyTestSecret2 --description "My second test secret created with the CLI for resource 2." --secret-string "{\"user\":\"username\",\"password\":\"EXAMPLE-PASSWORD-2\"}" --tags "[{\"Key\":\"app\",\"Value\":\"app1\"},{\"Key\":\"environment\",\"Value\":\"production\"}]"
aws secretsmanager create-secret --name MyTestSecret3 --description "My third test secret created with the CLI for resource 3." --secret-string "{\"user\":\"username\",\"password\":\"EXAMPLE-PASSWORD-3\"}" --tags "[{\"Key\":\"app\",\"Value\":\"app1\"},{\"Key\":\"environment\",\"Value\":\"production\"}]"
aws secretsmanager create-secret --name MyTestSecret4 --description "My fourth test secret created with the CLI for resource 4." --secret-string "{\"user\":\"username\",\"password\":\"EXAMPLE-PASSWORD-4 \"}" --tags "[{\"Key\":\"app\",\"Value\":\"app1\"},{\"Key\":\"environment\",\"Value\":\"production\"}]"
aws secretsmanager create-secret --name MyTestSecret5 --description "My fifth test secret created with the CLI for resource 5." --secret-string "{\"user\":\"username\",\"password\":\"EXAMPLE-PASSWORD-5\"}" --tags "[{\"Key\":\"app\",\"Value\":\"app1\"},{\"Key\":\"environment\",\"Value\":\"production\"}]"
Next, create a secret with a different resource tag value for the app key, but the same environment key-value pair. This will allow you to demonstrate that the BatchGetSecretValue call will fail when an IAM principal doesn’t have permissions to retrieve and list the secrets in a given filter.
Create a secret with a different tag, replacing the secret-string values with credentials of the resources that you will be accessing.
aws secretsmanager create-secret --name MyTestSecret6 --description "My test secret created with the CLI." --secret-string "{\"user\":\"username\",\"password\":\"EXAMPLE-PASSWORD-6\"}" --tags "[{\"Key\":\"app\",\"Value\":\"app2\"},{\"Key\":\"environment\",\"Value\":\"production\"}]"
Step 2: Create an execution role for your Lambda function
In this example, create a Lambda execution role that only has permissions to retrieve secrets that are tagged with the app:app1 resource tag.
Select change default execution role and attach the execution role you just created.
Choose Create Function.
Figure 1: create a Lambda function to access secrets
In the Code tab, copy and paste the following code:
import json
import boto3
from botocore.exceptions import ClientError
import urllib.request
import json

session = boto3.session.Session()
# Create a Secrets Manager client
client = session.client(
        service_name='secretsmanager'
    )


def lambda_handler(event, context):

     application_secrets = client.batch_get_secret_value(Filters =[
        {
        'Key':'tag-key',
        'Values':[event["TagKey"]]
        },
        {
        'Key':'tag-value',
        'Values':[event["TagValue"]]
        }
        ])


    ### RESOURCE 1 CONNECTION ###
    try:
        print("TESTING CONNECTION TO RESOURCE 1")
        resource_1_secret = application_secrets["SecretValues"][0]
        ## IMPLEMENT RESOURCE CONNECTION HERE

        print("SUCCESFULLY CONNECTED TO RESOURCE 1")

    except Exception as e:
        print("Failed to connect to resource 1")
        return e

    ### RESOURCE 2 CONNECTION ###
    try:
        print("TESTING CONNECTION TO RESOURCE 2")
        resource_2_secret = application_secrets["SecretValues"][1]
        ## IMPLEMENT RESOURCE CONNECTION HERE

        print("SUCCESFULLY CONNECTED TO RESOURCE 2")

    except Exception as e:
        print("Failed to connect to resource 2",)
        return e


    ### RESOURCE 3 CONNECTION ###
    try:
        print("TESTING CONNECTION TO RESOURCE 3")
        resource_3_secret = application_secrets["SecretValues"][2]
        ## IMPLEMENT RESOURCE CONNECTION HERE

        print("SUCCESFULLY CONNECTED TO DB 3")

    except Exception as e:
        print("Failed to connect to resource 3")
        return e

    ### RESOURCE 4 CONNECTION ###
    try:
        print("TESTING CONNECTION TO RESOURCE 4")
        resource_4_secret = application_secrets["SecretValues"][3]
        ## IMPLEMENT RESOURCE CONNECTION HERE

        print("SUCCESFULLY CONNECTED TO RESOURCE 4")

    except Exception as e:
        print("Failed to connect to resource 4")
        return e

    ### RESOURCE 5 CONNECTION ###
    try:
        print("TESTING ACCESS TO RESOURCE 5")
        resource_5_secret = application_secrets["SecretValues"][4]
        ## IMPLEMENT RESOURCE CONNECTION HERE

        print("SUCCESFULLY CONNECTED TO RESOURCE 5")

    except Exception as e:
        print("Failed to connect to resource 5")
        return e

    return {
        'statusCode': 200,
        'body': json.dumps('Successfully Completed all Connections!')
    }
You need to configure connections to the resources that you’re using for this example. The code in this example doesn’t create database or resource connections to prioritize flexibility for readers. Add code to connect to your resources after the “## IMPLEMENT RESOURCE CONNECTION HERE” comments.
Choose Deploy.
Step 4: Configure the test event to initiate your Lambda function
Above the code source, choose Test and then Configure test event.
In the Event JSON, replace the JSON with the following:
{
"TagKey": "app",
“TagValue”:”app1”
}
Enter a Name for your event.
Choose Save.
Step 5: Invoke the Lambda function
Invoke the Lambda by choosing Test.
Step 6: Review the function output
Review the response and function logs to see the new feature in action. Your function logs should show successful connections to the five resources that you specified earlier, as shown in Figure 2.
Figure 2: Review the function output
Step 7: Test a different input to validate IAM controls
In the Event JSON window, replace the JSON with the following:
You should now see an error message from Secrets Manager in the logs similar to the following:
User: arn:aws:iam::123456789012:user/JohnDoe is not authorized to perform:
secretsmanager:GetSecretValue because no resource-based policy allows the secretsmanager:GetSecretValue action
As you can see, you were able to retrieve the appropriate secrets based on the resource tag. You will also note that when the Lambda function tried to retrieve secrets for a resource tag that it didn’t have access to, Secrets Manager denied the request.
How to restrict use of BatchGetSecretValue for certain IAM principals
When dealing with sensitive resources such as secrets, it’s recommended that you adhere to the principle of least privilege. Service control policies, IAM policies, and resource policies can help you do this. Below, we discuss three policies that illustrate this:
Policy 1: IAM ABAC policy for Secrets Manager
This policy denies requests to get a secret if the principal doesn’t share the same project tag as the secret that the principal is trying to retrieve. Note that the effectiveness of this policy is dependent on correctly applied resource tags and principal tags. If you want to take a deeper dive into ABAC with Secrets Manager, see Scale your authorization needs for Secrets Manager using ABAC with IAM Identity Center.
Policy 3: Restrict actions to specified principals
Finally, let’s take a look at an example resource policy from our data perimeters policy examples. This resource policy restricts Secrets Manager actions to the principals that are in the organization that this secret is a part of, except for AWS service accounts.
In this blog post, we introduced the BatchGetSecretValue API, which you can use to improve operational excellence, performance efficiency, and reduce costs when using Secrets Manager. We looked at how you can use the API call in a Lambda function to retrieve multiple secrets that have the same resource tag and showed an example of an IAM policy to restrict access to this API.
Starting in mid-2024, Amazon Web Services (AWS) will introduce a series of UI improvements to the AWS sign-in pages. Our primary focus is to revamp the UI, especially the root and AWS Identity and Access Management (IAM) user sign-in page and switch role page. With these design updates, we aim to facilitate smoother transitions and provide clearer access to essential sign-in features. In this blog post, we provide an overview of the upcoming changes.
Redesigned root and IAM user sign-in page
When you visit the updated sign-in page for the root and IAM users, you’ll experience a refreshed interface. We’ve provided clearer form labels, more detailed descriptions, and improved tooltip guidance to distinguish between user types. To address customer feedback, we’ve enhanced compatibility with password managers, offering a smoother auto-fill, and refined the layout for more intuitive navigation.
Note: Although you don’t need to take specific actions to benefit from these updates, if your setup depends on the current UI for automated tasks, you might notice some changes. For the most reliable and stable experience, use the AWS supported options to grant programmatic access to your users. For more information, review the programmatic access options in the documentation.
Figure 1: Root and IAM user sign-in page
Additionally, to enhance the resilience of IAM user sign-ins, we will introduce improvements that allow the use of Regional endpoints for direct AWS Management Console sign-in within specific AWS Regions. This enhancement will be available ahead of the scheduled UI refresh. For example, the Regional endpoint for the console in the US West (Oregon) Region looks like this: https://us-west-2.console.aws.amazon.com. For a full list of the console Regional endpoints, see AWS Management Console endpoints and quotas.
To provide console access to people, we recommend that you use AWS IAM Identity Center. For more information, see the IAM Identity Center User Guide. However, when you enable programmatic access, you should create IAM users only if necessary for access keys or service-specific credentials. We recommend that you grant programmatic access through IAM roles or IAM Roles Anywhere.
Figure 2: IAM sign-in page
Refreshed switch role page
To further improve the user experience, we are updating the switch role page to match the look and feel of other AWS pages, providing a consistent navigation experience.
Figure 3: Switch role page
Conclusion
We’re excited to introduce these improvements to the AWS sign-in experience, set to launch in mid-2024. We encourage users who rely on the current UI for automated tasks to familiarize themselves with the changes. By making sure that your systems and process are aligned with the new interface, you can help maintain a smooth transition.
If you have questions or feedback, start a new thread in IAM re:Post or reach out to AWS Support.
Want more AWS Security news? Follow us on Twitter.
Today, we’re making available a new capability of AWS GlueData Catalog that allows generating column-level statistics for AWS Glue tables. These statistics are now integrated with the cost-based optimizers (CBO) of Amazon Athena and Amazon Redshift Spectrum, resulting in improved query performance and potential cost savings.
Data lakes are designed for storing vast amounts of raw, unstructured, or semi-structured data at a low cost, and organizations share those datasets across multiple departments and teams. The queries on these large datasets read vast amounts of data and can perform complex join operations on multiple datasets. When talking with our customers, we learned that one the challenging aspect of data lake performance is how to optimize these analytics queries to execute faster.
The data lake performance optimization is especially important for queries with multiple joins and that is where cost-based optimizers helps the most. In order for CBO to work, column statistics need to be collected and updated based on changes in the data. We’re launching capability of generating column-level statistics such as number of distinct, number of nulls, max, and min on files such as Parquet, ORC, JSON, Amazon ION, CSV, XML on AWS Glue tables. With this launch, customers now have integrated end-to-end experience where statistics on Glue tables are collected and stored in the AWS Glue Catalog, and made available to analytics services for improved query planning and execution.
Using these statistics, cost-based optimizers improves query run plans and boosts the performance of queries run in Amazon Athena and Amazon Redshift Spectrum. For example, CBO can use column statistics such as number of distinct values and number of nulls to improve row prediction. Row prediction is the number of rows from a table that will be returned by a certain step during the query planning stage. The more accurate the row predictions are, the more efficient query execution steps are. This leads to faster query execution and potentially reduced cost. Some of the specific optimizations that CBO can employ include join reordering and push-down of aggregations based on the statistics available for each table and column.
For customers using data mesh with AWS Lake Formation permissions, tables from different data producers are cataloged in the centralized governance accounts. As they generate statistics on tables on centralized catalog and share those tables with consumers, queries on those tables in consumer accounts will see query performance improvements automatically. In this post, we’ll demonstrate the capability of AWS Glue Data Catalog to generate column statistics for our sample tables.
Solution overview
To demonstrate the effectiveness of this capability, we employ the industry-standard TPC-DS 3 TB dataset stored in an Amazon Simple Storage Service (Amazon S3) public bucket. We’ll compare the query performance before and after generating column statistics for the tables, by running queries in Amazon Athena and Amazon Redshift Spectrum. We are providing queries that we used in this post and we encourage to try out your own queries following workflow as illustrated in the following details.
The workflow consists of the following high level steps:
Cataloging the Amazon S3 Bucket: Utilize AWS Glue Crawler to crawl the designated Amazon S3 bucket, extracting metadata, and seamlessly storing it in the AWS Glue data catalog. We’ll query these tables using Amazon Athena and Amazon Redshift Spectrum.
Generating column statistics: Employ the enhanced capabilities of AWS Glue Data Catalog to generate comprehensive column statistics for the crawled data, thereby providing valuable insights into the dataset.
Querying with Amazon Athena and Amazon Redshift Spectrum: Evaluate the impact of column statistics on query performance by utilizing Amazon Athena and Amazon Redshift Spectrum to execute queries on the dataset.
The following diagram illustrates the solution architecture.
Walkthrough
To implement the solution, we complete the following steps:
Run AWS Glue Crawler on Public Amazon S3 bucket to list the 3TB TPC-DS dataset.
Run queries on Amazon Athena and Amazon Redshift and note down query duration
Generate statistics for AWS Glue Data Catalog tables
Run queries on Amazon Athena and Amazon Redshift and compare query duration with previous run
Optional: Schedule AWS Glue column statistics jobs using AWS Lambda and the Amazon EventBridge Scheduler
Set up resources with AWS CloudFormation
This post includes an AWS CloudFormation template for a quick setup. You can review and customize it to suit your needs. The template generates the following resources:
An Amazon Virtual Private Cloud (Amazon VPC), public subnet, private subnets and route tables.
An Amazon Redshift Serverless workgroup and namespace.
An AWS Glue crawler to crawl the public Amazon S3 bucket and create a table for the Glue Data Catalog for TPC-DS dataset
AWS Lambda and Amazon Event Bridge scheduler to schedule the AWS Glue Column statistics
To launch the AWS CloudFormation stack, complete the following steps:
Note: The AWS Glue data catalog tables are generated using the public bucket s3://blogpost-sparkoneks-us-east-1/blog/BLOG_TPCDS-TEST-3T-partitioned/, hosted in the us-east-1 region. If you intend to deploy this AWS CloudFormation template in a different region, it is necessary to either copy the data to the corresponding region or share the data within your deployed region for it to be accessible from Amazon Redshift.
Choose Launch Stack to deploy a AWS CloudFormation template.
Choose Next.
On the next page, keep all the option as default or make appropriate changes based on your requirement choose Next.
Review the details on the final page and select I acknowledge that AWS CloudFormation might create IAM resources.
Choose Create.
This stack can take around 10 minutes to complete, after which you can view the deployed stack on the AWS CloudFormation console.
Run the AWS Glue Crawlers created by the AWS CloudFormation stack
To run your crawlers, complete the following steps:
On the AWS Glue console to AWS Glue Console, choose Crawlers under Data Catalog in the navigation pane.
Locate and run two crawlers tpcdsdb-without-stats and tpcdsdb-with-stats. It may take few mins to complete.
Once the crawler completes successfully, it would create two identical databases tpcdsdbnostats and tpcdsdbwithstats. The tables in tpcdsdbnostats will have No Stats and we’ll use them as reference. We generate statistics on tables in tpcdsdbwithstats. Please verify that you have those two databases and underlying tables from the AWS Glue Console. The tpcdsdbnostats database will look like below. At this time there are no statistics generated on these tables.
Run provided query using Amazon Athena on no-stats tables
To run your query in Amazon Athena on tables without statistics, complete the following steps:
On the Redshift query editor v2, execute the Redshift Query for tables without stats section from downloaded query.
Run the query and note down the query execution of each query.
Generate statistics on AWS Glue Catalog tables
To generate statistics on AWS Glue Catalog tables, complete the following steps:
Navigate to the AWS Glue Console and choose the databases under Data Catalog.
Click on tpcdsdbwithstats database and it will list all the available tables.
Select any of these tables (e.g., call_center).
Go to Column statistics – new tab and choose Generate statistics.
Keep the default option. Under Choose columns keep Table (All columns) and Under Row sampling options Keep All rows, Under IAM role choose AWSGluestats-blog and select Generate statistics.
You’ll be able to see status of the statistics generation run as shown in the following illustration:
After generate statistics on AWS Glue Catalog tables, you should be able to see detailed column statistics for that table:
Reiterate steps 2–5 to generate statistics for all necessary tables, such as catalog_sales, catalog_returns, warehouse, item, date_dim, store_sales, customer, customer_address, web_sales, time_dim, ship_mode, web_site, web_returns. Alternatively, you can follow the “Schedule AWS Glue Statistics Runs” section near the end of this blog to generate statistics for all tables. Once done, assess query performance for each query.
Run provided query using Athena Console on stats tables
On the Amazon Athena console, execute the Athena Query for tables with stats section from downloaded query.
Run and note down the query execution of each query.
In our sample run of the queries on the tables, we observed the query execution time as per the below table. We saw clear improvement in the query performance, ranging from 13 to 55%.
Athena query time improvement
TPC-DS 3T Queries
without glue stats (sec)
with glue stats (sec)
performance improvement (%)
Query 2
33.62
15.17
55%
Query 4
132.11
72.94
45%
Query 14
134.77
91.48
32%
Query 28
55.99
39.36
30%
Query 38
29.32
25.58
13%
Run the provided query using Amazon Redshift Spectrum on statistics tables
On the Amazon Redshift query editor v2, execute the Redshift Query for tables with stats section from downloaded query.
Run the query and note down the query execution of each query.
In our sample run of the queries on the tables, we observed the query execution time as per the below table. We saw clear improvement in the query performance, ranging from 13 to 89%.
Amazon Redshift Spectrum query time improvement
TPC-DS 3T Queries
without glue stats (sec)
with glue stats (sec)
performance improvement (%)
Query 40
124.156
13.12
89%
Query 60
29.52
16.97
42%
Query 66
18.914
16.39
13%
Query 95
308.806
200
35%
Query 99
20.064
16
20%
Schedule AWS Glue statistics Runs
In this segment of the post, we’ll guide you through the steps of scheduling AWS Glue column statistics runs using AWS Lambda and the Amazon EventBridge Scheduler. To streamline this process, a AWS Lambda function and an Amazon EventBridge scheduler were created as part of the CloudFormation stack deployment.
AWS Lambda function setup:
To begin, we utilize an AWS Lambda function to trigger the execution of the AWS Glue column statistics job. The AWS Lambda function invokes the start_column_statistics_task_run API through the boto3 (AWS SDK for Python) library. This sets the groundwork for automating the column statistics update.
Select Functions and locate the GlueTableStatisticsFunctionv1.
For a clearer understanding of the AWS Lambda function, we recommend reviewing the code in the Code section and examining the environment variables under Configuration.
Amazon EventBridge scheduler configuration
The next step involves scheduling the AWS Lambda function invocation using the Amazon EventBridge Scheduler. The scheduler is configured to trigger the AWS Lambda function daily at a specific time – in this case, 08:00 PM. This ensures that the AWS Glue column statistics job runs on a regular and predictable basis.
Now, let’s explore how you can update the schedule:
Once in the Amazon EventBridge Console, select Schedules under the Scheduler section. This is where you manage and configure the schedules for your events.
Cleaning up
To avoid unwanted charges to your AWS account, delete the AWS resources:
Sign into the AWS CloudFormation console as the AWS IAM administrator used for creating the AWS CloudFormation stack.
Delete the AWS CloudFormation stack you created.
Conclusion
In this post, we showed you how you can use AWS Glue Data Catalog to generate column-level statistics for AWS Glue tables. These statistics are now integrated with cost-based optimizer from Amazon Athena and Amazon Redshift Spectrum, resulting in improved query performance and potential costs savings. Refer to Docs for support for Glue Catalog Statistics across various AWS analytical services.
If you have questions or suggestions, submit them in the comments section.
About the Authors
Sandeep Adwankar is a Senior Technical Product Manager at AWS. Based in the California Bay Area, he works with customers around the globe to translate business and technical requirements into products that enable customers to improve how they manage, secure, and access data.
Navnit Shukla serves as an AWS Specialist Solution Architect with a focus on Analytics. He possesses a strong enthusiasm for assisting clients in discovering valuable insights from their data. Through his expertise, he constructs innovative solutions that empower businesses to arrive at informed, data-driven choices. Notably, Navnit Shukla is the accomplished author of the book titled Data Wrangling on AWS. He can be reached via LinkedIn.
For any modern data-driven company, having smooth data integration pipelines is crucial. These pipelines pull data from various sources, transform it, and load it into destination systems for analytics and reporting. When running properly, it provides timely and trustworthy information. However, without vigilance, the varying data volumes, characteristics, and application behavior can cause data pipelines to become inefficient and problematic. Performance can slow down or pipelines can become unreliable. Undetected errors result in bad data and impact downstream analysis. That’s why robust monitoring and troubleshooting for data pipelines is essential across the following four areas:
Reliability
Performance
Throughput
Resource utilization
Together, these four aspects of monitoring provide end-to-end visibility and control over a data pipeline and its operations.
Today we are pleased to announce a new class of Amazon CloudWatch metrics reported with your pipelines built on top of AWS Glue for Apache Spark jobs. The new metrics provide aggregate and fine-grained insights into the health and operations of your job runs and the data being processed. In addition to providing insightful dashboards, the metrics provide classification of errors, which helps with root cause analysis of performance bottlenecks and error diagnosis. With this analysis, you can evaluate and apply the recommended fixes and best practices for architecting your jobs and pipelines. As a result, you gain the benefit of higher availability, better performance, and lower cost for your AWS Glue for Apache Spark workload.
This post demonstrates how the new enhanced metrics help you monitor and debug AWS Glue jobs.
Enable the new metrics
The new metrics can be configured through the job parameter enable-observability-metrics.
The new metrics are enabled by default on the AWS Glue Studio console. To configure the metrics on the AWS Glue Studio console, complete the following steps:
On the AWS Glue console, choose ETL jobs in the navigation pane.
Under Your jobs, choose your job.
On the Job details tab, expand Advanced properties.
Under Job observability metrics, select Enable the creation of additional observability CloudWatch metrics when this job runs.
To enable the new metrics in the AWS Glue CreateJob and StartJobRun APIs, set the following parameters in the DefaultArguments property:
Key – --enable-observability-metrics
Value – true
To enable the new metrics in the AWS Command Line Interface (AWS CLI), set the same job parameters in the --default-arguments argument.
Use case
A typical workload for AWS Glue for Apache Spark jobs is to load data from a relational database to a data lake with SQL-based transformations. The following is a visual representation of an example job where the number of workers is 10.
When the example job ran, the workerUtilization metrics showed the following trend.
Note that workerUtilization showed values between 0.20 (20%) and 0.40 (40%) for the entire duration. This typically happens when the job capacity is over-provisioned and many Spark executors were idle, resulting in unnecessary cost. To improve resource utilization efficiency, it’s a good idea to enable AWS Glue Auto Scaling. The following screenshot shows the same workerUtilization metrics graph when AWS Glue Auto Scaling is enabled for the same job.
workerUtilization showed 1.0 in the beginning because of AWS Glue Auto Scaling and it trended between 0.75 (75%) and 1.0 (100%) based on the workload requirements.
Query and visualize metrics in CloudWatch
Complete the following steps to query and visualize metrics on the CloudWatch console:
On the CloudWatch console, choose All metrics in the navigation pane.
Under Custom namespaces, choose Glue.
Choose Observability Metrics (or Observability Metrics Per Source, or Observability Metrics Per Sink).
Search for and select the specific metric name, job name, job run ID, and observability group.
On the Graphed metrics tab, configure your preferred statistic, period, and so on.
Query metrics using the AWS CLI
Complete the following steps for querying using the AWS CLI (for this example, we query the worker utilization metric):
Create a metric definition JSON file (provide your AWS Glue job name and job run ID):
For example, for skewness, you can set an alarm for skewness.stage with a threshold of 1.0, and skewness.job with a threshold of 0.5. This threshold is just a recommendation; you can adjust the threshold based on your specific use case (for example, some jobs are expected to be skewed and it’s not an issue to be alarmed for). Our recommendation is to evaluate the metric values of your job runs for some time before qualifying the anomalous values and configuring the thresholds to alarm.
Other enhanced metrics
For a full list of other enhanced metrics available with AWS Glue jobs, refer to Monitoring with AWS Glue Observability metrics. These metrics allow you to capture the operational insights of your jobs, such as resource utilization (memory and disk), normalized error classes such as compilation and syntax, user or service errors, and throughput for each source or sink (records, files, partitions, and bytes read or written).
Job observability dashboards
You can further simplify observability for your AWS Glue jobs using dashboards for the insight metrics that enable real-time monitoring using Amazon Managed Grafana, and enable visualization and analysis of trends with Amazon QuickSight.
Conclusion
This post demonstrated how the new enhanced CloudWatch metrics help you monitor and debug AWS Glue jobs. With these enhanced metrics, you can more easily identify and troubleshoot issues in real time. This results in AWS Glue jobs that experience higher uptime, faster processing, and reduced expenditures. The end benefit for you is more effective and optimized AWS Glue for Apache Spark workloads. The metrics are available in all AWS Glue supported Regions. Check it out!
About the Authors
Noritaka Sekiyama is a Principal Big Data Architect on the AWS Glue team. He is responsible for building software artifacts to help customers. In his spare time, he enjoys cycling with his new road bike.
Shenoda Guirguis is a Senior Software Development Engineer on the AWS Glue team. His passion is in building scalable and distributed Data Infrastructure/Processing Systems. When he gets a chance, Shenoda enjoys reading and playing soccer.
Sean Ma is a Principal Product Manager on the AWS Glue team. He has an 18+ year track record of innovating and delivering enterprise products that unlock the power of data for users. Outside of work, Sean enjoys scuba diving and college football.
Mohit Saxena is a Senior Software Development Manager on the AWS Glue team. His team focuses on building distributed systems to enable customers with interactive and simple to use interfaces to efficiently manage and transform petabytes of data seamlessly across data lakes on Amazon S3, databases and data-warehouses on cloud.
In AWS, hundreds of thousands of customers use AWS Glue, a serverless data integration service, to discover, combine, and prepare data for analytics and machine learning. When you have complex datasets and demanding Apache Spark workloads, you may experience performance bottlenecks or errors during Spark job runs. Troubleshooting these issues can be difficult and delay getting jobs working in production. Customers often use Apache Spark Web UI, a popular debugging tool that is part of open source Apache Spark, to help fix problems and optimize job performance. AWS Glue supports Spark UI in two different ways, but you need to set it up yourself. This requires time and effort spent managing networking and EC2 instances, or through trial-and error with Docker containers.
Today, we are pleased to announce serverless Spark UI built into the AWS Glue console. You can now use Spark UI easily as it’s a built-in component of the AWS Glue console, enabling you to access it with a single click when examining the details of any given job run. There’s no infrastructure setup or teardown required. AWS Glue serverless Spark UI is a fully-managed serverless offering and generally starts up in a matter of seconds. Serverless Spark UI makes it significantly faster and easier to get jobs working in production because you have ready access to low level details for your job runs.
This post describes how the AWS Glue serverless Spark UI helps you to monitor and troubleshoot your AWS Glue job runs.
Getting started with serverless Spark UI
You can access the serverless Spark UI for a given AWS Glue job run by navigating from your Job’s page in AWS Glue console.
On the AWS Glue console, choose ETL jobs.
Choose your job.
Choose the Runs tab.
Select the job run you want to investigate, then choose Spark UI.
The Spark UI will display in the lower pane, as shown in the following screen capture:
Alternatively, you can get to the serverless Spark UI for a specific job run by navigating from Job run monitoring in AWS Glue.
On the AWS Glue console, choose job run monitoring under ETL jobs.
Select your job run, and choose View run details.
Scroll down to the bottom to view the Spark UI for the job run.
Prerequisites
Complete the following prerequisite steps:
Enable Spark UI event logs for your job runs. It is enabled by default on Glue console and once enabled, Spark event log files will be created during the job run, and stored in your S3 bucket. The serverless Spark UI parses a Spark event log file generated in your S3 bucket to visualize detailed information for both running and completed job runs. A progress bar shows the percentage to completion, with a typical parsing time of less than a minute. Once logs are parsed, you can
When logs are parsed, you can use the built-in Spark UI to debug, troubleshoot, and optimize your jobs.
A typical workload for AWS Glue for Apache Spark jobs is loading data from relational databases to S3-based data lakes. This section demonstrates how to monitor and troubleshoot an example job run for the above workload with serverless Spark UI. The sample job reads data from MySQL database and writes to S3 in Parquet format. The source table has approximately 70 million records.
The following screen capture shows a sample visual job authored in AWS Glue Studio visual editor. In this example, the source MySQL table has already been registered in the AWS Glue Data Catalog in advance. It can be registered through AWS Glue crawler or AWS Glue catalog API. For more information, refer to Data Catalog and crawlers in AWS Glue.
Now it’s time to run the job! The first job run finished in 30 minutes and 10 seconds as shown:
Let’s use Spark UI to optimize the performance of this job run. Open Spark UI tab in the Job runs page. When you drill down to Stages and view the Duration column, you will notice that Stage Id=0 spent 27.41 minutes to run the job, and the stage had only one Spark task in the Tasks:Succeeded/Total column. That means there was no parallelism to load data from the source MySQL database.
To optimize the data load, introduce parameters called hashfield and hashpartitions to the source table definition. For more information, refer to Reading from JDBC tables in parallel. Continuing to the Glue Catalog table, add two properties: hashfield=emp_no, and hashpartitions=18 in Table properties.
This means the new job runs reading parallelize data load from the source MySQL table.
Let’s try running the same job again! This time, the job run finished in 9 minutes and 9 seconds. It saved 21 minutes from the previous job run.
As a best practice, view the Spark UI and compare them before and after the optimization. Drilling down to Completed stages, you will notice that there was one stage and 18 tasks instead of one task.
In the first job run, AWS Glue automatically shuffled data across multiple executors before writing to destination because there were too few tasks. On the other hand, in the second job run, there was only one stage because there was no need to do extra shuffling, and there were 18 tasks for loading data in parallel from source MySQL database.
Considerations
Keep in mind the following considerations:
Serverless Spark UI is supported in AWS Glue 3.0 and later
Serverless Spark UI will be available for jobs that ran after November 20, 2023, due to a change in how AWS Glue emits and stores Spark logs
Serverless Spark UI can visualize Spark event logs which is up to 1 GB in size
There is no limit in retention because serverless Spark UI scans the Spark event log files on your S3 bucket
Serverless Spark UI is not available for Spark event logs stored in S3 bucket that can only be accessed by your VPC
Conclusion
This post described how the AWS Glue serverless Spark UI helps you monitor and troubleshoot your AWS Glue jobs. By providing instant access to the Spark UI directly within the AWS Management Console, you can now inspect the low-level details of job runs to identify and resolve issues. With the serverless Spark UI, there is no infrastructure to manage—the UI spins up automatically for each job run and tears down when no longer needed. This streamlined experience saves you time and effort compared to manually launching Spark UIs yourself.
Give the serverless Spark UI a try today. We think you’ll find it invaluable for optimizing performance and quickly troubleshooting errors. We look forward to hearing your feedback as we continue improving the AWS Glue console experience.
About the authors
Noritaka Sekiyama is a Principal Big Data Architect on the AWS Glue team. He works based in Tokyo, Japan. He is responsible for building software artifacts to help customers. In his spare time, he enjoys cycling on his road bike.
Alexandra Tello is a Senior Front End Engineer with the AWS Glue team in New York City. She is a passionate advocate for usability and accessibility. In her free time, she’s an espresso enthusiast and enjoys building mechanical keyboards.
Matt Sampson is a Software Development Manager on the AWS Glue team. He loves working with his other Glue team members to make services that our customers benefit from. Outside of work, he can be found fishing and maybe singing karaoke.
Matt Su is a Senior Product Manager on the AWS Glue team. He enjoys helping customers uncover insights and make better decisions using their data with AWS Analytic services. In his spare time, he enjoys skiing and gardening.
Recently, AWS launched a new feature that allows deployment of account instances of AWS IAM Identity Center . With this launch, you can now have two types of IAM Identity Center instances: organization instances and account instances. An organization instance is the IAM Identity Center instance that’s enabled in the management account of your organization created with AWS Organizations. This instance is used to manage access to AWS accounts and applications across your entire organization. Organization instances are the best practice when deploying IAM Identity Center. Many customers have requested a way to enable AWS applications using test or sandbox identities. The new account instances are intended to support sand-boxed deployments of AWS managed applications such as Amazon CodeCatalyst and are only usable from within the account and AWS Region in which they were created. They can exist in a standalone account or in a member account within AWS Organizations.
In this blog post, we show you when to use each instance type, how to control the deployment of account instances, and how you can monitor, manage, and audit these instances at scale using the enhanced IAM Identity Center APIs.
IAM Identity Center instance types
IAM Identity Center now offers two deployment types, the traditional organization instance and an account instance, shown in Figure 1. In this section, we show you the differences between the two.
Figure 1: IAM Identity Center instance types
Organization instance of IAM Identity Center
An organization instance of IAM Identity Center is the fully featured version that’s available with AWS Organizations. This type of instance helps you securely create or connect your workforce identities and manage their access centrally across AWS accounts and applications in your organization. The recommended use of an organization instance of Identity Center is for workforce authentication and authorization on AWS for organizations of any size and type.
Using the organization instance of IAM Identity Center, your identity center administrator can create and manage user identities in the Identity Center directory, or connect your existing identity source, including Microsoft Active Directory, Okta, Ping Identity, JumpCloud, Google Workspace, and Azure Active Directory (Entra ID). There is only one organization instance of IAM Identity Center at the organization level. If you have enabled IAM Identity Center before November 15, 2023, you have an organization instance.
Account instances of IAM Identity Center
Account instances of IAM Identity Center provide a subset of the features of the organization instance. Specifically, account instances support user and group assignments initially only to Amazon CodeCatalyst. They are bound to a single AWS account, and you can deploy them in either member accounts of an organization or in standalone AWS accounts. You can only deploy one account instance per AWS account regardless of Region.
You can use account instances of IAM Identity Center to provide access to supported Identity Center enabled application if the application is in the same account and Region.
When should I use account instances of IAM Identity Center?
Account instances are intended for use in specific situations where organization instances are unavailable or impractical, including:
You want to run a temporary trial of a supported AWS managed application to determine if it suits your business needs. See Additional Considerations.
You are unable to deploy IAM Identity Center across your organization, but still want to experiment with one or more AWS managed applications. See Additional Considerations.
You have an organization instance of IAM Identity Center, but you want to deploy a supported AWS managed application to an isolated set of users that are distinct from those in your organization instance.
Additional considerations
When working with multiple instances of IAM Identity Center, you want to keep a number of things in mind:
Each instance of IAM Identity Center is separate and distinct from other Identity Center instances. That is, users and assignments are managed separately in each instance without a means to keep them in sync.
Migration between instances isn’t possible. This means that migrating an application between instances requires setting up that application from scratch in the new instance.
Account instances have the same considerations when changing your identity source as an organization instance. In general, you want to set up with the right identity source before adding assignments.
Automating assigning users to applications through the IAM Identity Center public APIs also requires using the applications APIs to ensure that those users and groups have the right permissions within the application. For example, if you assign groups to CodeCatalyst using Identity Center, you still have to assign the groups to the CodeCatalyst space from the Amazon CodeCatalyst page in the AWS Management Console. See the Setting up a space that supports identity federation documentation.
By default, account instances require newly added users to register a multi-factor authentication (MFA) device when they first sign in. This can be altered in the AWS Management Console for Identity Center for a specific instance.
Controlling IAM Identity Center instance deployments
If you’ve enabled IAM Identity Center prior to November 15, 2023 then account instance creation is off by default. If you want to allow account instance creation, you must enable this feature from the Identity Center console in your organization’s management account. This includes scenarios where you’re using IAM Identity Center centrally and want to allow deployment and management of account instances. See Enable account instances in the AWS Management Console documentation.
If you enable IAM Identity Center after November 15, 2023 or if you haven’t enabled Identity Center at all, you can control the creation of account instances of Identity Center through a service control policy (SCP). We recommend applying the following sample policy to restrict the use of account instances to all but a select set of AWS accounts. The sample SCP that follows will help you deny creation of account instances of Identity Center to accounts in the organization unless the account ID matches the one you specified in the policy. Replace <ALLOWED-ACCOUNT_ID> with the ID of the account that is allowed to create account instances of Identity Center:
If your organization has an existing log ingestion pipeline solution to collect logs and generate reports through AWS CloudTrail, then IAM Identity Center supported CloudTrail operations will automatically be present in your pipeline, including additional account instances of IAM Identity Center actions such as sso:CreateInstance.
To create a monitoring solution for IAM Identity Center events in your organization, you should set up monitoring through AWS CloudTrail. CloudTrail is a service that records events from AWS services to facilitate monitoring activity from those services in your accounts. You can create a CloudTrail trail that captures events across all accounts and all Regions in your organization and persists them to Amazon Simple Storage Service (Amazon S3).
After creating a trail for your organization, you can use it in several ways. You can send events to Amazon CloudWatch Logs and set up monitoring and alarms for Identity Center events, which enables immediate notification of supported IAM Identity Center CloudTrail operations. With multiple instances of Identity Center deployed within your organization, you can also enable notification of instance activity, including new instance creation, deletion, application registration, user authentication, or other supported actions.
The following is an example of a simple query that shows you a list of the Identity Center instances created and deleted, the account where they were created, and the user that created them. Replace <Event_data_store_ID> with your store ID.
SELECT
    userIdentity.arn AS userARN, eventName, userIdentity.accountId
FROM
    <Event_data_store_ID>
WHERE
    userIdentity.arn IS NOT NULL
    AND eventName = 'DeleteInstance'
    OR eventName = 'CreateInstance'
You can save your query result to an S3 bucket and download a copy of the results in CSV format. To learn more, follow the steps in Download your CloudTrail Lake saved query results. Figure 2 shows the CloudTrail Lake query results.
Figure 2: AWS CloudTrail Lake query results
If you want to automate the sourcing, aggregation, normalization, and data management of security data across your organization using the Open Cyber Security Framework (OCSF) standard, you will benefit from using Amazon Security Lake. This service helps make your organization’s security data broadly accessible to your preferred security analytics solutions to power use cases such like threat detection, investigation, and incident response. Learn more in What is Amazon Security Lake?
Instance management and discovery within an organization
You can create account instances of IAM Identity Center in a standalone account or in an account that belongs to your organization. Creation can happen from an API call (CreateInstance) from the Identity Center console in a member account or from the setup experience of a supported AWS managed application. Learn more about Supported AWS managed applications.
If you decide to apply the DenyCreateAccountInstances SCP shown earlier to accounts in your organization, you will no longer be able to create account instances of IAM Identity Center in those accounts. However, you should also consider that when you invite a standalone AWS account to join your organization, the account might have an existing account instance of Identity Center.
To identify existing instances, who’s using them, and what they’re using them for, you can audit your organization to search for new instances. The following script shows how to discover all IAM Identity Center instances in your organization and export a .csv summary to an S3 bucket. This script is designed to run on the account where Identity Center was enabled. Click here to see instructions on how to use this script.
. . .
. . .
accounts_and_instances_dict={}
duplicated_users ={}

main_session = boto3.session.Session()
sso_admin_client = main_session.client('sso-admin')
identity_store_client = main_session.client('identitystore')
organizations_client = main_session.client('organizations')
s3_client = boto3.client('s3')
logger = logging.getLogger()
logger.setLevel(logging.INFO)

#create function to list all Identity Center instances in your organization
def lambda_handler(event, context):
    application_assignment = []
    user_dict={}

    current_account = os.environ['CurrentAccountId']

    logger.info("Current account %s", current_account)

    paginator = organizations_client.get_paginator('list_accounts')
    page_iterator = paginator.paginate()
    for page in page_iterator:
        for account in page['Accounts']:
            get_credentials(account['Id'],current_account)
            #get all instances per account - returns dictionary of instance id and instances ARN per account
            accounts_and_instances_dict = get_accounts_and_instances(account['Id'], current_account)

def get_accounts_and_instances(account_id, current_account):
    global accounts_and_instances_dict

    instance_paginator = sso_admin_client.get_paginator('list_instances')
    instance_page_iterator = instance_paginator.paginate()
    for page in instance_page_iterator:
        for instance in page['Instances']:
            #send back all instances and identity centers
            if account_id == current_account:
                accounts_and_instances_dict = {current_account:[instance['IdentityStoreId'],instance['InstanceArn']]}
            elif instance['OwnerAccountId'] != current_account:
                accounts_and_instances_dict[account_id]= ([instance['IdentityStoreId'],instance['InstanceArn']])
    return accounts_and_instances_dict
  . . .
  . . .
  . . .
The following table shows the resulting IAM Identity Center instance summary report with all of the accounts in your organization and their corresponding Identity Center instances.
AccountId
IdentityCenterInstance
111122223333
d-111122223333
111122224444
d-111122223333
111122221111
d-111111111111
Duplicate user detection across multiple instances
A consideration of having multiple IAM Identity Center instances is the possibility of having the same person existing in two or more instances. In this situation, each instance creates a unique identifier for the same person and the identifier associates application-related data to the user. Create a user management process for incoming and outgoing users that is similar to the process you use at the organization level. For example, if a user leaves your organization, you need to revoke access in all Identity Center instances where that user exists.
The code that follows can be added to the previous script to help detect where duplicates might exist so you can take appropriate action. If you find a lot of duplication across account instances, you should consider adopting an organization instance to reduce your management overhead.
...
#determine if the member in IdentityStore have duplicate
def get_users(identityStoreId, user_dict):
    global duplicated_users
    paginator = identity_store_client.get_paginator('list_users')
    page_iterator = paginator.paginate(IdentityStoreId=identityStoreId)
    for page in page_iterator:
        for user in page['Users']:
            if ( 'Emails' not in user ):
                print("user has no email")
            else:
                for email in user['Emails']:
                    if email['Value'] not in user_dict:
                        user_dict[email['Value']] = identityStoreId
                    else:
                        print("Duplicate user found " + user['UserName'])
                        user_dict[email['Value']] = user_dict[email['Value']] + "," + identityStoreId
                        duplicated_users[email['Value']] = user_dict[email['Value']]
    return user_dict
...
The following table shows the resulting report with duplicated users in your organization and their corresponding IAM identity Center instances.
The full script for all of the above use cases is available in the multiple-instance-management-iam-identity-center GitHub repository. The repository includes instructions to deploy the script using AWS Lambda within the management account. After deployment, you can invoke the Lambda function to get .csv files of every IAM Identity center instance in your organization, the applications assigned to each instance, and the users that have access to those applications. With this function, you also get a report of users that exist in more than one local instance.
Conclusion
In this post, you learned the differences between an IAM Identity Center organization instance and an account instance, considerations for when to use an account instance, and how to use Identity Center APIs to automate discovery of Identity Center account instances in your organization.
If you have feedback about this post, submit comments in the Comments section below. If you have questions about this post, start a new thread on AWS IAM Identity Center re:Post or contact AWS Support.
Want more AWS Security news? Follow us on Twitter.
AWS Security Hub provides a comprehensive view of your security posture in Amazon Web Services (AWS) and helps you check your environment against security standards and best practices. In this post, I show you a solution to export Security Hub findings to a .csv file weekly and send an email notification to download the file from Amazon Simple Storage Service (Amazon S3). By using this solution, you can share the report with others without providing access to your AWS account. You can also use it to generate assessment reports and prioritize and build a remediation roadmap.
Cloud security processes can differ from traditional on-premises security in that security is often decentralized in the cloud. With traditional on-premises security operations, security alerts are typically routed to centralized security teams operating out of security operations centers (SOCs). With cloud security operations, it’s often the application builders or DevOps engineers who are best situated to triage, investigate, and remediate security alerts.
This solution uses the Security Hub API, AWS Lambda, Amazon S3, and Amazon Simple Notification Service (Amazon SNS). Findings are aggregated into a .csv file to help identify common security issues that might require remediation action.
Solution overview
This solution assumes that Security Hub is enabled in your AWS account. If it isn’t enabled, set up the service so that you can start seeing a comprehensive view of security findings across your AWS accounts.
How the solution works
An Amazon EventBridge time-based event invokes a Lambda function for processing.
The Lambda function gets finding results from the Security Hub API and writes them into a .csv file.
The API uploads the file into Amazon S3 and generates a presigned URL with a 24-hour duration, or the duration of the temporary credential used in Lambda, whichever ends first.
Amazon SNS sends an email notification to the address provided during deployment. This email address can be updated afterwards through the Amazon SNS console.
The email includes a link to download the file.
Figure 1: Solution overview, deployed through AWS CloudFormation
An Amazon SNS topic named SecurityHubRecurringFullReport and an email subscription to the topic.
Figure 2: SNS topic created by the solution
The email address that subscribes to the topic is captured through a CloudFormation template input parameter. The subscriber is notified by email to confirm the subscription. After confirmation, the subscription to the SNS topic is created. Additional subscriptions can be added as needed to include additional emails or distribution lists.
Figure 3: SNS email subscription
The SendSecurityHubFullReportEmail Lambda function queries the Security Hub API to get findings into a .csv file that’s written to Amazon S3. A pre-authenticated link to the file is generated and sends the email message to the SNS topic described above.
Figure 4: Lambda function created by the solution
An IAM role for the Lambda function to be able to create logs in CloudWatch, get findings from Security Hub, publish messages to SNS, and put objects into an S3 bucket.
Figure 5: Permissions policy for the Lambda function
An EventBridge rule that runs on a schedule named SecurityHubFullReportEmailSchedule used to invoke the Lambda function that generates the findings report. The default schedule is every Monday at 8:00 AM UTC. This schedule can be overwritten by using a CloudFormation input parameter. Learn more about creating cron expressions.
Figure 6: Example of the EventBridge schedule created by the solution
Copy the template to an S3 bucket within your target AWS account and Region. Copy the object URL for the CloudFormation template .json file.
On the AWS Management Console, go to the CloudFormation console. Choose Create Stack and select With new resources.
Figure 7: Create stack with new resources
Under Specify template, in the Amazon S3 URL textbox, enter the S3 object URL for the .json file that you uploaded in step 1.
Figure 8: Specify S3 URL for CloudFormation template
Choose Next. On the next page, do the following:
Stack name: Enter a name for the stack.
Email address: Enter the email address of the subscriber to the Security Hub findings email.
RecurringScheduleCron: Enter the cron expression for scheduling the Security Hub findings email. The default is every Monday at 8:00 AM UTC. Learn more about creating cron expressions.
SecurityHubRegion: Enter the Region where Security Hub is aggregating the findings.
Figure 9: Enter stack name and parameters
Choose Next.
Keep all defaults in the screens that follow and choose Next.
Check the box I acknowledge that AWS CloudFormation might create IAM resources, and then choose Create stack.
Test the solution
You can send a test email after the deployment is complete. To do this, open the Lambda console and locate the SendSecurityHubFullReportEmail Lambda function. Perform a manual invocation with an event payload to receive an email within a few minutes. You can repeat this procedure as many times as you want.
Conclusion
In this post I’ve shown you an approach for rapidly building a solution for sending weekly findings report of the security posture of your AWS account as evaluated by Security Hub. This solution helps you to be diligent in reviewing outstanding findings and to remediate findings in a timely way based on their severity. You can extend the solution in many ways, including:
Send a file to an email-enabled ticketing service, such as ServiceNow or another security information and event management (SIEM) that you use.
Add links to internal wikis for workflows such as organizational exceptions to vulnerabilities or other internal processes.
Extend the solution by modifying the filters, email content, and delivery frequency.
If you have feedback about this post, submit comments in the Comments section below. If you have any questions about this post, start a thread on the AWS Security Hub re:Post forum.
Want more AWS Security news? Follow us on Twitter.
Amazon Athena is a serverless, interactive analytics service built on open source frameworks, supporting open table file formats. Athena provides a simplified, flexible way to analyze petabytes of data where it lives. You can analyze data or build applications from an Amazon Simple Storage Service (Amazon S3) data lake and 30 data sources, including on-premises data sources or other cloud systems using SQL or Python. Athena is built on open source Trino and Presto engines and Apache Spark frameworks, with no provisioning or configuration effort required.
Starting today, the Athena SQL engine uses a cost-based optimizer (CBO), a new feature that uses table and column statistics stored in the AWS Glue Data Catalog as part of the table’s metadata. By using these statistics, CBO improves query run plans and boosts the performance of queries run in Athena. Some of the specific optimizations CBO can employ include join reordering and pushing aggregations down based on the statistics available for each table and column.
TPC-DS benchmarks These benchmarks demonstrate the power of the cost-based optimizer—queries run up to 2x times faster with CBO enabled compared to running the same TPC-DS queries without CBO.
Performance and cost comparison on TPC-DS benchmarks
We used the industry-standard TPC-DS 3 TB to represent different customer use cases. These are representative of workloads with 10 times the stated benchmark size. This means a 3 TB benchmark dataset accurately represents customer workloads on 30–50 TB datasets.
In our testing, the dataset was stored in Amazon S3 in non-compressed Parquet format and the AWS Glue Data Catalog was used to store metadata for databases and tables. Fact tables were partitioned on the date column used for join operations, and each fact table consisted of 2,000 partitions. To help illustrate the performance of CBO, we compare the behavior of various queries and highlight the performance differences between running with CBO enabled vs. disabled.
The following graph illustrates the runtime of queries on the engine with and without CBO.
The following graph presents the top 10 queries from the TPC-DS benchmark with the greatest performance improvement.
Let’s discuss some of the cost-based optimization techniques that contributed to improved query performance.
Cost-based join reordering
Join reordering, an optimization technique used by cost-based SQL optimizers, analyzes different join sequences to select the order that minimizes query runtime by reducing intermediate data processed at each step, lowering memory and CPU requirements.
Let’s talk about query 82 of the TPC-DS 3TB dataset. The query performs inner joins on four tables: item, inventory, date_dim, and store_sales. The store_sales table has 8.6 billion rows and is partitioned by date. The inventory table has 1 billion rows and is also partitioned by date. The item table contains 360,000 rows, and the date_dim table holds 73,000 rows.
Query 82
select  i_item_id ,i_item_desc ,i_current_price
from item, inventory, date_dim, store_sales
where i_current_price between 30 and 30+30
and inv_item_sk = i_item_sk
and d_date_sk=inv_date_sk
and cast(d_date as date) between cast('2002-05-30' as date) and (cast('2002-05-30' as date) +  interval '60' day)
and i_manufact_id in (437,129,727,663)
and inv_quantity_on_hand between 100 and 500
and ss_item_sk = i_item_sk
group by i_item_id,i_item_desc,i_current_price
order by i_item_id
limit 100
Without CBO
Without using CBO, the engine will determine the join order based on the sequence of tables defined in the input query with internal heuristics. The FROM clause of the input query is "from item, inventory, date_dim, store_sales" (all inner joins). After passing through internal heuristics, Athena chose the join order as ((item ⋈ (inventory ⋈ date_dim)) ⋈ store_sales). Despite store_sales being the largest fact table, it’s defined last in the FROM clause and therefore gets joined last. This plan fails to reduce the intermediate join sizes as early as possible, resulting in an increased query runtime. The following diagram shows the join order without CBO and the number of rows flowing through different stages.
With CBO
When using CBO, the optimizer determines the best join order using a variety of data, including statistics as well as join size estimation, join build side, and join type. In this instance, Athena’s selected join order is ((store_sales ⋈ item) ⋈ (inventory ⋈ date_dim)). The largest fact table, store_sales, without being shuffled, is first joined with the item dimension table. The other partitioned table, inventory, is also first joined in-place with the date_dim dimension table. The join with the dimension table acts as a filter on the fact table, which dramatically reduces the input data size of the join that follows. Note that which side a table resides for a join is significant in Athena, because it’s the table on the right that will be built into memory for the join operation. Therefore, we always want to keep the larger table on the left and the smaller table on the right. CBO chose a plan that the left side was 8.6 billion before, and now it’s 13.6 million.
With CBO, the query runtime improved by 25% (from 15 seconds down to 11 seconds) by choosing the optimal join order.
Next, let’s discuss another CBO technique.
Cost-based aggregation pushdown
Aggregation pushdown is an optimization technique used by query optimizers to improve performance. It involves pushing aggregation operations like SUM, COUNT, and AVG into an earlier stage in the query plan, while maintaining the same query semantics. This reduces the amount of data transferred between the stages. By minimizing data processing, aggregation pushdown decreases memory usage, I/O costs, and network traffic.
However, pushing down aggregation is not always beneficial. It depends on the data distribution. For example, grouping on a column with many rows but few distinct values (like gender) before joins works better. Grouping first means aggregating a large number of records into fewer records (just male, female, for example). Grouping after joining means a large number of records have to participate the join before being aggregated. On the other hand, grouping on a high cardinality column is better done after joins. Doing it before risks unnecessary aggregation overhead because each value is likely unique anyway and that step will not result in an earlier reduction in the amount of data transferred between intermediate stages.
Therefore, whether to push down aggregation should be a cost-based decision. Let’s take example of the query 2 run on a 3TB TPC-DS dataset, showing how the aggregation pushdown’s value depends on data distribution. The web_sales table has 2.1 billion rows and the catalog_sales table has 4.23 billion rows. Both tables are partitioned on the date column.
Query 2
with wscs as
 (select sold_date_sk
        ,sales_price
  from (select ws_sold_date_sk sold_date_sk
              ,ws_ext_sales_price sales_price
        from web_sales
        union all
        select cs_sold_date_sk sold_date_sk
              ,cs_ext_sales_price sales_price
        from catalog_sales)),
 wswscs as
 (select d_week_seq,
        sum(case when (d_day_name='Sunday') then sales_price else null end) sun_sales,
        sum(case when (d_day_name='Monday') then sales_price else null end) mon_sales,
        sum(case when (d_day_name='Tuesday') then sales_price else  null end) tue_sales,
        sum(case when (d_day_name='Wednesday') then sales_price else null end) wed_sales,
        sum(case when (d_day_name='Thursday') then sales_price else null end) thu_sales,
        sum(case when (d_day_name='Friday') then sales_price else null end) fri_sales,
        sum(case when (d_day_name='Saturday') then sales_price else null end) sat_sales
 from wscs
     ,date_dim
 where d_date_sk = sold_date_sk
 group by d_week_seq)
 select d_week_seq1
       ,round(sun_sales1/sun_sales2,2)
       ,round(mon_sales1/mon_sales2,2)
       ,round(tue_sales1/tue_sales2,2)
       ,round(wed_sales1/wed_sales2,2)
       ,round(thu_sales1/thu_sales2,2)
       ,round(fri_sales1/fri_sales2,2)
       ,round(sat_sales1/sat_sales2,2)
 from
 (select wswscs.d_week_seq d_week_seq1
        ,sun_sales sun_sales1
        ,mon_sales mon_sales1
        ,tue_sales tue_sales1
        ,wed_sales wed_sales1
        ,thu_sales thu_sales1
        ,fri_sales fri_sales1
        ,sat_sales sat_sales1
  from wswscs,date_dim
  where date_dim.d_week_seq = wswscs.d_week_seq and
        d_year = 2001) y,
 (select wswscs.d_week_seq d_week_seq2
        ,sun_sales sun_sales2
        ,mon_sales mon_sales2
        ,tue_sales tue_sales2
        ,wed_sales wed_sales2
        ,thu_sales thu_sales2
        ,fri_sales fri_sales2
        ,sat_sales sat_sales2
  from wswscs
      ,date_dim
  where date_dim.d_week_seq = wswscs.d_week_seq and
        d_year = 2001+1) z
 where d_week_seq1=d_week_seq2-53
 order by d_week_seq1
Without CBO
Athena first joins the result of the union all operation on the web_sales table and the catalog_sales table with another table. Only then does it perform aggregation on the joined results. In this example, the amount of data that needed to be joined was huge, resulting in a longer query runtime.
With CBO
Athena utilizes one of the statistics values, the distinct value count, to evaluate the cost implications of pushing down the aggregation vs. not doing so. When a column has many rows but few distinct values, CBO is more likely to push aggregation down. This shrank the qualified rows from web_sales and catalog_sales tables to 2,590 and 3,590 rows, respectively. These aggregated records were then unioned and used to join with the tables. Comparing to the plan without CBO, the records participating in the join from the two large tables dropped from 6.33 billion rows (2.1 billion + 4.23 billion) to just 6,180 rows (2,590 + 3,590). This significantly decreased query runtime.
With CBO, the query runtime improved by 50% (from 37 seconds down to 18 seconds). In summary, CBO helped Athena choose an optimal aggregation pushdown plan, cutting the query time in half compared to not using cost-based optimization.
Conclusion
In this post, we discussed how Athena uses a cost-based optimizer (CBO) in its engine v3 to use table statistics for generating more efficient query run plans. Testing on the TPC-DS benchmark showed an 11% improvement in overall query performance when using CBO compared to without it.
Two key optimization employed by CBO are join reordering and aggregate pushdown. Join reordering reduces intermediate data by intelligently picking the order to join tables based on statistics. Aggregate pushdown decreases intermediate data by pushing aggregations earlier in the plan when beneficial.
In summary, Athena’s new cost-based optimizer significantly speeds up queries by choosing superior run plans. CBO optimizes based on table statistics stored in the AWS Glue Data Catalog. This automatic optimization improves productivity for Athena users through more responsive query performance. To take advantage of optimization techniques of CBO, refer to working with column statistics to generate statistics on the tables and columns in the AWS Glue Data Catalog.
About the Authors
Darshit Thakkar is a Technical Product Manager with AWS and works with the Amazon Athena team based out of Boston, Massachusetts.
Wei Zheng is a Sr. Software Development Engineer with Amazon Athena. He joined AWS in 2021 and has been working on multiple performance improvements on Athena.
Chuho Chang is a Software Development Engineer with Amazon Athena. He has been working on query optimizers for over a decade.
Pathik Shah is a Sr. Analytics Architect on Amazon Athena. He joined AWS in 2015 and has been focusing in the big data analytics space since then, helping customers build scalable and robust solutions using AWS analytics services.
Early-feedback loops exist to provide developers with ongoing feedback through automated checks. This enables developers to take early remedial action while increasing the efficiency of the code review process and, in turn, their productivity.
Early-feedback loops help provide confidence to reviewers that fundamental security and compliance requirements were validated before review. As part of this process, common expectations of code standards and quality can be established, while shifting governance mechanisms to the left.
In this post, we will show you how to use AWS developer tools to implement a shift-left approach to security that empowers your developers with early feedback loops within their development practices. You will use AWS CodeCommit to securely host Git repositories, AWS CodePipeline to automate continuous delivery pipelines, AWS CodeBuild to build and test code, and Amazon CodeGuru Reviewer to detect potential code defects.
Why the shift-left approach is important
Developers today are an integral part of organizations, building and maintaining the most critical customer-facing applications. Developers must have the knowledge, tools, and processes in place to help them identify potential security issues before they release a product to production.
This is why the shift-left approach is important. Shift left is the process of checking for vulnerabilities and issues in the earlier stages of software development. By following the shift-left process (which should be part of a wider application security review and threat modelling process), software teams can help prevent undetected security issues when they build an application. The modern DevSecOps workflow continues to shift left towards the developer and their practices with the aim to achieve the following:
Drive accountability among developers for the security of their code
Empower development teams to remediate issues up front and at their own pace
Improve risk management by enabling early visibility of potential security issues through early feedback loops
You can use AWS developer tools to help provide this continual early feedback for developers upon each commit of code.
Solution prerequisites
To follow along with this solution, make sure that you have the following prerequisites in place:
Make sure that you have a general working knowledge of the listed services and DevOps practices.
Solution overview
The following diagram illustrates the architecture of the solution.
Figure 1: Solution overview
We will show you how to set up a continuous integration and continuous delivery (CI/CD) pipeline by using AWS developer tools—CodeCommit, CodePipeline, CodeBuild, and CodeGuru—that you will integrate with the code repository to detect code security vulnerabilities. As shown in Figure 1, the solution has the following steps:
The developer commits the new branch into the code repository.
The developer creates a pull request to the main branch.
CodeGuru Reviewer uses program analysis and machine learning to help detect potential defects in your Java and Python code, and provides recommendations to improve the code. CodeGuru Reviewer helps detect security vulnerabilities, secrets, resource leaks, concurrency issues, incorrect input validation, and deviation from best practices for using AWS APIs and SDKs.
You can configure the CodeBuild deployment with third-party tools, such as Bandit for Python to help detect security issues in your Python code.
CodeGuru Reviewer or CodeBuild writes back the findings of the code scans to the pull request to provide a single common place for developers to review the findings that are relevant to their specific code updates.
The following table presents some other tools that you can integrate into the early-feedback toolchain, depending on the type of code or artefacts that you are evaluating:
When you deploy the solution in your AWS account, you can review how Bandit for Python has been built into the deployment pipeline by using AWS CodeBuild with a configured buildspec file, as shown in Figure 2. You can implement the other tools in the table by using a similar approach.
Figure 2: Bandit configured in CodeBuild
Walkthrough
To deploy the solution, you will complete the following steps:
The first step is to deploy the required resources into your AWS environment by using CloudFormation.
To deploy the solution
Choose the following Launch Stack button to deploy the solution’s CloudFormation template:
The solution deploys in the AWS US East (N. Virginia) Region (us-east-1) by default because each service listed in the Prerequisites section is available in this Region. To deploy the solution in a different Region, use the Region selector in the console navigation bar and make sure that the services required for this walkthrough are supported in your newly selected Region. For service availability by Region, see AWS Services by Region.
On the Quick Create Stack screen, do the following:
Leave the provided parameter defaults in place.
Scroll to the bottom, and in the Capabilities section, select I acknowledge that AWS CloudFormation might create IAM resources with custom names.
Choose Create Stack.
When the CloudFormation template has completed, open the AWS Cloud9 console.
In the Environments table, for the provisioned shift-left-blog-cloud9-ide environment, choose Open, as shown in Figure 3.
Figure 3: Cloud9 environments
The provisioned Cloud9 environment opens in a new tab. Wait for Cloud9 to initialize the two sample code repositories: shift-left-sample-app-java and shift-left-sample-app-python, as shown in Figure 4. For this post, you will work only with the Python sample repository shift-left-sample-app-python, but the procedures we outline will also work for the Java repository.
Figure 4: Cloud9 IDE
Associate CodeGuru Reviewer with a code repository
The next step is to associate the Python code repository with CodeGuru Reviewer. After you associate the repository, CodeGuru Reviewer analyzes and comments on issues that it finds when you create a pull request.
To associate CodeGuru Reviewer with a repository
Open the CodeGuru console, and in the left navigation pane, under Reviewer, choose Repositories.
In the Repositories section, choose Associate repository and run analysis.
In the Associate repository section, do the following:
For Select source provider, select AWS CodeCommit.
For Repository location,select shift-left-sample-app-python.
In the Run a repository analysis section, do the following, as shown in Figure 5:
For Source branch, select main.
For Code review name – optional, enter a name.
For Tags – optional, leave the default settings.
Choose Associate repository and run analysis.
Figure 5: CodeGuru repository configuration
CodeGuru initiates the Full repository analysis and the status is Pending, as shown in Figure 6. The full analysis takes about 5 minutes to complete. Wait for the status to change from Pending to Completed.
Figure 6: CodeGuru full analysis pending
Create a pull request
The next step is to create a new branch and to push sample code to the repository by creating a pull request so that the code scan can be initiated by CodeGuru Reviewer and the CodeBuild job.
To create a new branch
In the Cloud9 IDE, locate the terminal and create a new branch by running the following commands.
cd ~/environment/shift-left-sample-app-python
git checkout -b python-test
Confirm that you are working from the new branch, which will be highlighted in the Cloud9 IDE terminal, as shown in Figure 7.
git branch -v
Figure 7: Cloud9 IDE terminal
To create a new file and push it to the code repository
Create a new file called sample.py.
touch sample.py
Copy the following sample code, paste it into the sample.py file, and save the changes, as shown in Figure 8.
import requests

data = requests.get("https://www.example.org/", verify = False)
print(data.status_code)
Figure 8: Cloud9 IDE noncompliant code
Commit the changes to the repository.
git status
git add -A
git commit -m "shift left blog python sample app update"
Note: if you receive a message to set your name and email address, you can ignore it because Git will automatically set these for you, and the Git commit will complete successfully.
Push the changes to the code repository, as shown in Figure 9.
git push origin python-test
Figure 9: Git push
To create a new pull request
Open the CodeCommit console and select the code repository called shift-left-sample-app-python.
From the Branches dropdown, select the new branch that you created and pushed, as shown in Figure 10.
Figure 10: CodeCommit branch selection
In your new branch, select the file sample.py, confirm that the file has the changes that you made, and then choose Create pull request, as shown in Figure 11.
Figure 11: CodeCommit pull request
A notification appears stating that the new code updates can be merged.
In the Source dropdown, choose the new branch python-test. In the Destination dropdown, choose the main branch where you intend to merge your code changes when the pull request is closed.
To have CodeCommit run a comparison between the main branch and your new branch python-test, choose Compare. To see the differences between the two branches, choose the Changes tab at the bottom of the page. CodeCommit also assesses whether the two branches can be merged automatically when the pull request is closed.
When you’re satisfied with the comparison results for the pull request, enter a Title and an optional Description, and then choose Create pull request. Your pull request appears in the list of pull requests for the CodeCommit repository, as shown in Figure 12.
Figure 12: Pull request
The creation of this pull request has automatically started two separate code scans. The first is a CodeGuru incremental code review and the second uses CodeBuild, which utilizes Bandit to perform a security code scan of the Python code.
Review code scan results and resolve detected security vulnerabilities
The next step is to review the code scan results to identify security vulnerabilities and the recommendations on how to fix them.
To review the code scan results
Open the CodeGuru console, and in the left navigation pane, under Reviewer, select Code reviews.
On the Incremental code reviews tab, make sure that you see a new code review item created for the preceding pull request.
Figure 13: CodeGuru Code review
After a few minutes, when CodeGuru completes the incremental analysis, choose the code review to review the CodeGuru recommendations on the pull request. Figure 14 shows the CodeGuru recommendations for our example.
Figure 14: CodeGuru recommendations
Open the CodeBuild console and select the CodeBuild job called shift-left-blog-pr-Python. In our example, this job should be in a Failed state.
Open the CodeBuild run, and under the Build history tab, select the CodeBuild job, which is in Failed state. Under the Build Logs tab, scroll down until you see the following errors in the logs. Note that the severity of the finding is High, which is why the CodeBuild job failed. You can review the Bandit scanning options in the Bandit documentation.
Test results:
>> Issue: [B501:request_with_no_cert_validation] Call to requests with verify=False disabling SSL certificate checks, security issue.
   Severity: High   Confidence: High
   CWE: CWE-295 (https://cwe.mitre.org/data/definitions/295.html)
   More Info: https://bandit.readthedocs.io/en/1.7.5/plugins/b501_request_with_no_cert_validation.html
   Location: sample.py:3:7

2
3   data = requests.get("https://www.example.org/", verify = False)
4   print(data.status_code)
Navigate to the CodeCommit console, and on the Activity tab of the pull request, review the CodeGuru recommendations. You can also review the results of the CodeBuild jobs that Bandit performed, as shown in Figure 15.
Figure 15: CodeGuru recommendations and CodeBuild logs
This demonstrates how developers can directly link the relevant information relating to security code scans with their code development and associated pull requests, hence shifting to the left the required security awareness for developers.
To resolve the detected security vulnerabilities
In the Cloud9 IDE, navigate to the file sample.py in the Python sample repository, as shown in Figure 16.
Figure 16: Cloud9 IDE sample.py
Copy the following code and paste it in the sample.py file, overwriting the existing code. Save the update.
import requests

data = requests.get("https://www.example.org", timeout=5)
print(data.status_code)
Commit the changes by running the following commands.
git status
git add -A
git commit -m "shift left python sample.py resolve security errors"
git push origin python-test
Open the CodeCommit console and choose the Activity tab on the pull request that you created earlier. You will see a banner indicating that the pull request was updated. You will also see new comments indicating that new code scans using CodeGuru and CodeBuild were initiated for the new pull request update.
In the CodeGuru console, on the Incremental code reviews page, check that a new code scan has begun. When the scans are finished, review the results in the CodeGuru console and the CodeBuild build logs, as described previously. The previously detected security vulnerability should now be resolved.
In the CodeCommit console, on the Activity tab, under Activity history, review the comments to verify that each of the code scans has a status of Passing, as shown in Figure 17.
Figure 17: CodeCommit activity history
Now that the security issue has been resolved, merge the pull request into the main branch of the code repository. Choose Merge, and under Merge strategy, select Fast Forward merge.
AWS account clean-up
Clean up the resources created by this solution to avoid incurring future charges.
To clean up your account
Start by deleting the CloudFormation stacks for the Java and Python sample applications that you deployed. In the CloudFormation console, in the Stacks section, select one of these stacks and choose Delete; then select the other stack and choose Delete.
Figure 18: Delete repository stack
To initiate deletion of the Cloud9 CloudFormation stack, select it and choose Delete.
Open the Amazon S3 console, and in the search box, enter shift-left to search for the S3 bucket that CodePipeline used.
Figure 19: Select CodePipeline S3 bucket
Select the S3 bucket, select all of the object folders in the bucket, and choose Delete
Figure 20: Select CodePipeline S3 objects
To confirm deletion of the objects, in the section Permanently delete objects?, enter permanently delete, and then choose Delete objects. A banner message that states Successfully deleted objects appears at the top confirming the object deletion.
Navigate back to the CloudFormation console, select the stack named shift-left-blog, and choose Delete.
Conclusion
In this blog post, we showed you how to implement a solution that enables early feedback on code development through status comments in the CodeCommit pull request activity tab by using Amazon CodeGuru Reviewer and CodeBuild to perform automated code security scans on the creation of a code repository pull request.
We configured CodeBuild with Bandit for Python to demonstrate how you can integrate third-party or open-source tools into the development cycle. You can use this approach to integrate other tools into the workflow.
Shifting security left early in the development cycle can help you identify potential security issues earlier and empower teams to remediate issues earlier, helping to prevent the need to refactor code towards the end of a build.
This solution provides a simple method that you can use to view and understand potential security issues with your newly developed code and thus enhances your awareness of the security requirements within your organization.
It’s simple to get started. Sign up for an AWS account, deploy the provided CloudFormation template through the Launch Stack button, commit your code, and start scanning for vulnerabilities.
If you have feedback about this post, submit comments in the Comments section below. If you have questions about this post, start a new thread on AWS re:Post or contact AWS Support.
Want more AWS Security news? Follow us on Twitter.
Sometimes you want to configure an AWS service to access your resource in another service. For example, you can configure AWS CloudTrail, a service that monitors account activity across your AWS infrastructure, to write log data to your bucket in Amazon Simple Storage Service (Amazon S3). When you do this, you want assurance that the service will only access your resource on your behalf—you don’t want an untrusted entity to be able to use the service to access your resource. Before today, you could achieve this by using the two AWS Identity and Access Management (IAM) condition keys, aws:SourceAccount and aws:SourceArn. You can use these condition keys to help make sure that a service accesses your resource only on behalf of specific accounts or resources that you trust. However, because these condition keys require you to specify individual accounts and resources, they can be difficult to manage at scale, especially in larger organizations.
Recently, IAM launched two new condition keys that can help you achieve this in a more scalable way that is simpler to manage within your organization:
aws:SourceOrgID — use this condition key to make sure that an AWS service can access your resources only when the request originates from a particular organization ID in AWS Organizations.
aws:SourceOrgPaths — use this condition key to make sure that an AWS service can access your resources only when the request originates from one or more organizational units (OUs) in your organization.
In this blog post, we describe how you can use the four available condition keys, including the two new ones, to help you control how AWS services access your resources.
Background
Imagine a scenario where you configure an AWS service to access your resource in another service. Let’s say you’re using Amazon CloudWatch to observe resources in your AWS environment, and you create an alarm that activates when certain conditions occur. When the alarm activates, you want it to publish messages to a topic that you create in Amazon Simple Notification Service (Amazon SNS) to generate notifications.
Figure 1 depicts this process.
Figure 1: Amazon CloudWatch publishing messages to an SNS topic
In this scenario, there’s a resource-based policy controlling access to your SNS topic. For CloudWatch to publish messages to it, you must configure the policy to allow access by CloudWatch. When you do this, you identify CloudWatch using an AWS service principal, in this case cloudwatch.amazonaws.com.
Cross-service access
This is an example of a common pattern known as cross-service access. With cross-service access, a calling service accesses your resource in a called service, and a resource-based policy attached to your resource grants access to the calling service. The calling service is identified using an AWS service principal in the form <SERVICE-NAME>.amazonaws.com, and it accesses your resource on behalf of an originating resource, such as a CloudWatch alarm.
Figure 2 shows cross-service access.
Figure 2: Cross-service access
When you configure cross-service access, you want to make sure that the calling service will access your resource only on your behalf. That means you want the originating resource to be controlled by someone whom you trust. If an untrusted entity creates their own CloudWatch alarm in their AWS environment, for example, then their alarm should not be able to publish messages to your SNS topic.
If an untrusted entity could use a calling service to access your resource on their behalf, it would be an example of what’s known as the confused deputy problem. The confused deputy problem is a security issue in which an entity that doesn’t have permission to perform an action coerces a more privileged entity (in this case, a calling service) to perform the action instead.
Use condition keys to help prevent cross-service confused deputy issues
AWS provides global condition keys to help you prevent cross-service confused deputy issues. You can use these condition keys to control how AWS services access your resources.
Before today, you could use the aws:SourceAccount or aws:SourceArn condition keys to make sure that a calling service accesses your resource only when the request originates from a specific account (with aws:SourceAccount) or a specific originating resource (with aws:SourceArn). However, there are situations where you might want to allow multiple resources or accounts to use a calling service to access your resource. For example, you might want to create many VPC flow logs in an organization that publish to a central S3 bucket. To achieve this using the aws:SourceAccount or aws:SourceArn condition keys, you must enumerate all the originating accounts or resources individually in your resource-based policies. This can be difficult to manage, especially in large organizations, and can potentially cause your resource-based policy documents to reach size limits.
Now, you can use the new aws:SourceOrgID or aws:SourceOrgPaths condition keys to make sure that a calling service accesses your resource only when the request originates from a specific organization (with aws:SourceOrgID) or a specific organizational unit (with aws:SourceOrgPaths). This helps avoid the need to update policies when accounts are added or removed, reduces the size of policy documents, and makes it simpler to create and review policy statements.
The following table summarizes the four condition keys that you can use to help prevent cross-service confused deputy issues. These keys work in a similar way, but with different levels of granularity.
Use case
Condition key
Value
Allowed operators
Single/multi valued
Example value
Allow a calling service to access your resource only on behalf of an organization that you trust.
Note: Only use these condition keys in resource-based policies that allow access by an AWS service. Don’t use them in other use cases, including identity-based policies and service control policies (SCPs), where these condition keys won’t be populated.
Use condition keys for defense in depth
AWS services use a variety of mechanisms to help prevent cross-service confused deputy issues, and the details vary by service. For example, where a calling service accesses an S3 bucket, some services use S3 prefixes to help prevent confused deputy issues. For more information, see the relevant service documentation.
Where supported by the service, AWS recommends that you use the condition keys we describe in this post regardless of whether the service has another mechanism in place to help prevent cross-service confused deputy issues. This helps to make your intentions explicit, provide defense in depth, and guard against misconfigurations.
Example use cases
Let’s walk through some example use cases to learn how to use these condition keys in practice.
First, imagine you’re using Amazon Virtual Private Cloud (Amazon VPC) to manage logically isolated virtual networks. In Amazon VPC, you can configure flow logs, which capture information about your network traffic. Let’s say you want a flow log to write data into an S3 bucket for later analysis. This process is depicted in Figure 3.
Figure 3: Amazon VPC writing flow logs to an S3 bucket
This constitutes another cross-service access scenario. In this case, Amazon VPC is the calling service, Amazon S3 is the called service, the VPC flow log is the originating resource, and the S3 bucket is your resource in the called service.
To allow access, the resource-based policy for your S3 bucket (known as a bucket policy) must allow Amazon VPC to put objects there. The Principal element in this policy specifies the AWS service principal of the service that will access the resource, which for VPC flow logs is delivery.logs.amazonaws.com.
Initial policy without confused deputy prevention
The following is an initial version of the bucket policy that allows Amazon VPC to put objects in the bucket but doesn’t yet provide confused deputy prevention. We’re showing this policy for illustration purposes; don’t use it in its current form.
Note: For simplicity, we only show one of the policy statements that you need to allow VPC flow logs to write to a bucket. In a real-life bucket policy for flow logs, you need two policy statements: one allowing actions on the bucket, and one allowing actions on the bucket contents. These are described in Publish flow logs to Amazon S3. Both policy statements work in the same way with respect to confused deputy prevention.
This policy statement allows Amazon VPC to put objects in the bucket. However, it allows Amazon VPC to do that on behalf of any flow log in any account. There’s nothing in the policy to tell Amazon VPC that it should access this bucket only if the flow log belongs to a specific organization, OU, account, or resource that you trust.
Let’s now update the policy to help prevent cross-service confused deputy issues. For the rest of this post, the remaining policy samples provide confused deputy protection, but at different levels of granularity.
Specify a trusted organization
Continuing with the previous example, imagine that you now have an organization in AWS Organizations, and you want to create VPC flow logs in various accounts within your organization that publish to a central S3 bucket. You want Amazon VPC to put objects in the bucket only if the request originates from a flow log that resides in your organization.
You can achieve this by using the new aws:SourceOrgID condition key. In a cross-service access scenario, this condition key evaluates to the ID of the organization that the request came from. You can use this condition key in the Condition element of a resource-based policy to allow actions only if aws:SourceOrgID matches the ID of a specific organization, as shown in the following example. In your own policy, make sure to replace <DOC-EXAMPLE-BUCKET> and <MY-ORGANIZATION-ID> with your own information.
The revised policy states that Amazon VPC can put objects in the bucket only if the request originates from a flow log in your organization. Now, if someone creates a flow log outside your organization and configures it to access your bucket, they will get an access denied error.
You can use aws:SourceOrgID in this way to allow a calling service to access your resource only if the request originates from a specific organization, as shown in Figure 4.
Figure 4: Specify a trusted organization using aws:SourceOrgID
Specify a trusted OU
What if you don’t want to trust your entire organization, but only part of it? Let’s consider a different scenario. Imagine that you want to send messages from Amazon SNS into a queue in Amazon Simple Queue Service (Amazon SQS) so they can be processed by consumers. This is depicted in Figure 5.
Figure 5: Amazon SNS sending messages to an SQS queue
Now imagine that you want your SQS queue to receive messages only if they originate from an SNS topic that resides in a specific organizational unit (OU) in your organization. For example, you might want to allow messages only if they originate from a production OU that is subject to change control.
You can achieve this by using the new aws:SourceOrgPaths condition key. As before, you use this condition key in a resource-based policy attached to your resource. In a cross-service access scenario, this condition key evaluates to the AWS Organizations entity path that the request came from. An entity path is a text representation of an entity within an organization.
You build an entity path for an OU by using the IDs of the organization, root, and all OUs in the path down to and including the OU. For example, consider the organizational structure shown in Figure 6.
Figure 6: Example organization structure
In this example, you can specify the Prod OU by using the following entity path:
Let’s now match the aws:SourceOrgPaths condition key against a specific entity path in the Condition element of a resource-based policy for an SQS queue. In your own policy, make sure to replace <MY-QUEUE-ARN> and <MY-ENTITY-PATH> with your own information.
Note:aws:SourceOrgPaths is a multivalued condition key, which means it’s capable of having multiple values in the request context. At the time of writing, it contains a single entity path if the request originates from an account in an organization, and a null value if the request originates from an account that’s not in an organization. Because this key is multivalued, you need to use both a set operator and a string operator to compare values.
In this policy, there are two conditions in the Condition block. The first uses the Null condition operator and compares with a false value to confirm that the condition key’s value is not null. The second uses set operator ForAllValues, which returns true if every condition key value in the request matches at least one value in your policy condition, and string operator StringEquals, which requires an exact match with a value specified in your policy condition.
Note: The reason for the null check is that set operator ForAllValuesreturns true when a condition key resolves to null. With an Allow effect and the null check in place, access is denied if the request originates from an account that’s not in an organization.
With this policy applied to your SQS queue, Amazon SNS can send messages to your queue only if the message came from an SNS topic in a specific OU.
You can use aws:SourceOrgPaths in this way to allow a calling service to access your resource only if the request originates from a specific organizational unit, as shown in Figure 7.
Figure 7: Specify a trusted OU using aws:SourceOrgPaths
Specify a trusted OU and its children
In the previous example, we specified a trusted OU, but that didn’t include its child OUs. What if you want to include its children as well?
You can achieve this by replacing the string operator StringEquals with StringLike. This allows you to use wildcards in the entity path. Using the organization structure from the previous example, the following Condition evaluates to true only if the condition key value is not null and the request originates from the Prod OU or any of its child OUs.
If you want to be more granular, you can allow a service to access your resource only if the request originates from a specific account. You can achieve this by using the aws:SourceAccount condition key. In a cross-service access scenario, this condition key evaluates to the ID of the account that the request came from.
The following Condition evaluates to true only if the request originates from the account that you specify in the policy. In your own policy, make sure to replace <MY-ACCOUNT-ID> with your own information.
You can use this condition element within a resource-based policy to allow a calling service to access your resource only if the request originates from a specific account, as shown in Figure 8.
Figure 8: Specify a trusted account using aws:SourceAccount
Specify a trusted resource
If you want to be even more granular, you can allow a service to access your resource only if the request originates from a specific resource. For example, you can allow Amazon SNS to send messages to your SQS queue only if the request originates from a specific topic within Amazon SNS.
You can achieve this by using the aws:SourceArn condition key. In a cross-service access scenario, this condition key evaluates to the Amazon Resource Name (ARN) of the originating resource. This provides the most granular form of cross-service confused deputy prevention.
The following Condition evaluates to true only if the request originates from the resource that you specify in the policy. In your own policy, make sure to replace <MY-RESOURCE-ARN> with your own information.
Note: AWS recommends that you use an ARN operator rather than a string operator when comparing ARNs. This example uses ArnEquals to match the condition key value against the ARN specified in the policy.
You can use this condition element within a resource-based policy to allow a calling service to access your resource only if the request comes from a specific originating resource, as shown in Figure 9.
Figure 9: Specify a trusted resource using aws:SourceArn
Specify multiple trusted resources, accounts, OUs, or organizations
The four condition keys allow you to specify multiple trusted entities by matching against an array of values. This allows you to specify multiple trusted resources, accounts, OUs, or organizations in your policies.
Conclusion
In this post, you learned about cross-service access, in which an AWS service communicates with another AWS service to access your resource. You saw that it’s important to make sure that such services access your resources only on your behalf in order to help avoid cross-service confused deputy issues.
We showed you how to help prevent cross-service confused deputy issues by using two new condition keys aws:SourceOrgID and aws:SourceOrgPaths, as well as the other available condition keys aws:SourceAccount and aws:SourceArn. You learned that you should use these condition keys in any resource-based policy statements that allow access by an AWS service, if the condition key is supported by the service. This helps make sure that a calling service can access your resource only when the request originates from a specific organization, OU, account, or resource that you trust.
If you have feedback about this post, submit comments in the Comments section below. If you have questions about this post, start a new thread on AWS IAM re:Post or contact AWS Support.
Want more AWS Security news? Follow us on Twitter.
In today’s data-driven world, organizations face unprecedented challenges in managing and extracting valuable insights from their ever-expanding data ecosystems. As the number of data assets and users grow, the traditional approaches to data management and governance are no longer sufficient. Customers are now building more advanced architectures to decentralize permissions management to allow for individual groups of users to build and manage their own data products, without being slowed down by a central governance team. One of the core features of AWS Lake Formation is the delegation of permissions on a subset of resources such as databases, tables, and columns in AWS Glue Data Catalog to data stewards, empowering them make decisions regarding who should get access to their resources and helping you decentralize the permissions management of your data lakes. Lake Formation has added a new capability that further allows data stewards to create and manage their own Lake Formation tags (LF-tags). Lake Formation tag-based access control (LF-TBAC) is an authorization strategy that defines permissions based on attributes. In Lake Formation, these attributes are called LF-Tags. LF-TBAC is the recommended method to use to grant Lake Formation permissions when there is a large number of Data Catalog resources. LF-TBAC is more scalable than the named resource method and requires less permission management overhead.
In this post, we go through the process of delegating the LF-tag creation, management, and granting of permissions to a data steward.
Lake Formation serves as the foundation for these advanced architectures by simplifying security management and governance for users at scale across AWS analytics. Lake Formation is designed to address these challenges by providing secure sharing between AWS accounts and tag-based access control to be able scale permissions. By assigning tags to data assets based on their characteristics and properties, organizations can implement access control policies tailored to specific data attributes. This ensures that only authorized individuals or teams can access and work with the data relevant to their domain. For example, it allows customers to tag data assets as “Confidential” and grant access to that LF-Tag to only those users who should have access to confidential data. Tag-based access control not only enhances data security and privacy, but also promotes efficient collaboration and knowledge sharing.
The need for producer autonomy and decentralized tag creation and delegation in data governance is paramount, regardless of the architecture chosen, whether it be a single account, hub and spoke, or data mesh with central governance. Relying solely on centralized tag creation and governance can create bottlenecks, hinder agility, and stifle innovation. By granting producers and data stewards the autonomy to create and manage tags relevant to their specific domains, organizations can foster a sense of ownership and accountability among producer teams. This decentralized approach allows you to adapt and respond quickly to changing requirements. This methodology helps organizations strike a balance between central governance and producer ownership, leading to improved governance, enhanced data quality, and data democratization.
Lake Formation announced the tag delegation feature to address this. With this feature, a Lake Formation admin can now provide permission to AWS Identity and Access Management (IAM) users and roles to create tags, associate them, and manage the tag expressions.
Solution overview
In this post, we examine an example organization that has a central data lake that is being used by multiple groups. We have two personas: the Lake Formation administrator LFAdmin, who manages the data lake and onboards different groups, and the data steward LFDataSteward-Sales, who owns and manages resources for the Sales group within the organization. The goal is to grant permission to the data steward to be able to use LF-Tags to perform permission grants for the resources that they own. In addition, the organization has a set of common LF-Tags called Confidentiality and Department, which the data steward will be able to use.
The following diagram illustrates the workflow to implement the solution.
The following are the high-level steps:
Grant permissions to create LF-Tags to a user who is not a Lake Formation administrator (the LFDataSteward-Sales IAM role).
Grant permissions to associate an organization’s common LF-Tags to the LFDataSteward-Sales role.
Create new LF-Tags using the LFDataSteward-Sales role.
Associate the new and common LF-Tags to resources using the LFDataSteward-Sales role.
Grant permissions to other users using the LFDataSteward-Sales role.
Prerequisites
For this walkthrough, you should have the following:
An AWS account.
Knowledge of using Lake Formation and enabling Lake Formation to manage permissions to a set of tables.
An IAM role that is a Lake Formation administrator. For this post, we name ours LFAdmin.
Two LF-Tags created by the LFAdmin:
Key Confidentiality with values PII and Public.
Key Department with values Sales and Marketing.
An IAM role that is a data steward within an organization. For this post, we name ours LFDataSteward-Sales.
The data steward should have ‘Super’ access to at least one database. In this post, the data steward has access to three databases: sales-ml-data, sales-processed-data, and sales-raw-data.
An IAM role to serve as a user that the data steward will grant permissions to using LF-Tags. For this post, we name ours LFAnalysts-MLScientist.
Grant permission to the data steward to be able to create LF-Tags
Complete the following steps to grant LFDataSteward-Sales the ability to create LF-Tags:
As the LFAdmin role, open the Lake Formation console.
In the navigation pane, choose LF-Tags and permissions under Permissions.
Under LF-Tags, because you are logged in as LFAdmin, you can see all the tags that have been created within the account. You can see the Confidentiality LF-Tag as well as the Department LF-Tag and the possible values for each tag.
On the LF-Tag creators tab, choose Add LF-Tag creators.
For IAM users and roles, enter the LFDataSteward-Sales IAM role.
For Permission, select Create LF-Tag.
If you want this data steward to be able to grant Create LF-Tag permissions to other users, select Create LF-Tag under Grantable permission.
Choose Add.
The LFDataSteward-Sales IAM role now has permissions to create their own LF-Tags.
Grant permission to the data steward to use common LF-Tags
We now want to give permission to the data steward to tag using the Confidentiality and Department tags. Complete the following steps:
As the LFAdmin role, open the Lake Formation console.
In the navigation pane, choose LF-Tags and permissions under Permissions.
On the LF-Tag permissions tab, choose Grant permissions.
Select LF-Tag key-value permission for Permission type.
The LF-Tag permission option grants the ability to modify or drop an LF-Tag, which doesn’t apply in this use case.
Select IAM users and roles and enter the LFDataSteward-Sales IAM role.
Provide the Confidentiality LF-Tag and all its values, and the Department LF-Tag with only the Sales value.
Select Describe, Associate, and Grant with LF-Tag expression under Permissions.
Choose Grant permissions.
This gave the LFDataSteward-Sales role the ability to tag resources using the Confidentiality tag and all its values as well as the Department tag with only the Sales value.
Create new LF-Tags using the data steward role
This step demonstrates how the LFDataSteward-Sales role can now create their own LF-Tags.
As the LFDataSteward-Sales role, open the Lake Formation console.
In the navigation pane, choose LF-Tags and permissions under Permissions.
The LF-Tags section only shows the Confidentiality tag and Department tag with only the Sales value. As the data steward, we want to create our own LF-Tags to make permissioning easier.
Choose Add LF-Tag.
For Key, enter Sales-Subgroups.
For Values¸ enter DataScientists, DataEngineers, and MachineLearningEngineers.
Choose Add LF-Tag.
As the LF-Tag creator, the data steward has full permissions on the tags that they created. You will be able to see all the tags that the data steward has access to.
Associate LF-Tags to resources as the data steward
We now associate resources to the LF-Tags that we just created so that Machine Learning Engineers can have access to the sales-ml-data resource.
As the LFDataSteward-Sales role, open the Lake Formation console.
In the navigation pane, choose Databases.
Select sales-ml-data and on the Actions menu, choose Edit LF-Tags.
Add the following LF-Tags and values:
Key Sales-Subgroups with value MachineLearningEngineers.
Key Department with value analytics.
Key Confidentiality with value Public.
Choose Save.
Grant permissions using LF-Tags as the data steward
To grant permissions using LF-Tags, complete the following steps:
As the LFDataSteward-Sales role, open the Lake Formation console.
In the navigation pane, choose Data lake permissions under Permissions.
Choose Grant.
Select IAM users and roles and enter the IAM principal to grant permission to (for this example, the Sales-MLScientist role).
In the LF-Tags or catalog resources section, select Resources matched by LF-Tags.
Enter the following tag expressions:
For the Department LF-Tag, set the Sales value.
For the Sales-Subgroups LF-Tag, set the MachineLearningEngineers value.
For the Confidentiality LF-Tag, set the Public value.
Because this is a machine learning (ML) and data science user, we want to give full permissions so that they can manage databases and create tables.
For Database permissions, select Super, and for Table permissions, select Super.
Choose Grant.
We now see the permissions granted to the LF-Tag expression.
Verify permissions granted to the user
To verify permissions using Amazon Athena, navigate to the Athena console as the Sales-MLScientist role. We can observe that the Sales-MLScientist role now has access to the sales-ml-data database and all the tables. In this case, there is only one table, sales-report.
Clean up
To clean up your resources, delete the following:
IAM roles that you may have created for the purposes of this post
Any LF-Tags that you created
Conclusion
In this post, we discussed the benefits of decentralized tag management and how the new Lake Formation feature helps implement this. By granting permission to producer teams’ data stewards to manage tags, organizations empower them to use their domain knowledge and capture the nuances of their data effectively. Furthermore, granting permission to data stewards enables them to take ownership of the tagging process, ensuring accuracy and relevance.
The post illustrated the various steps involved in decentralized Lake Formation tag management, such as granting permission to data stewards to create LF-Tags and use common LF-Tags. We also demonstrated how the data steward can create their own LF-Tags, associate the tags to resources, and grant permissions using tags.
Ramkumar Nottath is a Principal Solutions Architect at AWS focusing on Analytics services. He enjoys working with various customers to help them build scalable, reliable big data and analytics solutions. His interests extend to various technologies such as analytics, data warehousing, streaming, data governance, and machine learning. He loves spending time with his family and friends.
Mert Hocanin is a Principal Big Data Architect at AWS within the AWS Lake Formation Product team. He has been with Amazon for over 10 years, and enjoys helping customers build their data lakes with a focus on governance on a wide variety of services. When he isn’t helping customers build data lakes, he spends his time with his family and traveling.
In this era of big data, organizations worldwide are constantly searching for innovative ways to extract value and insights from their vast datasets. Apache Spark offers the scalability and speed needed to process large amounts of data efficiently.
Amazon EMR is the industry-leading cloud big data solution for petabyte-scale data processing, interactive analytics, and machine learning (ML) using open source frameworks such as Apache Spark, Apache Hive, and Presto. Amazon EMR is the best place to run Apache Spark. You can quickly and effortlessly create managed Spark clusters from the AWS Management Console, AWS Command Line Interface (AWS CLI), or Amazon EMR API. You can also use additional Amazon EMR features, including fast Amazon Simple Storage Service (Amazon S3) connectivity using the Amazon EMR File System (EMRFS), integration with the Amazon EC2 Spot market and the AWS Glue Data Catalog, and EMR Managed Scaling to add or remove instances from your cluster. Amazon EMR Studio is an integrated development environment (IDE) that makes it straightforward for data scientists and data engineers to develop, visualize, and debug data engineering and data science applications written in R, Python, Scala, and PySpark. EMR Studio provides fully managed Jupyter notebooks, and tools like Spark UI and YARN Timeline Service to simplify debugging.
To unlock the potential hidden within the data troves, it’s essential to go beyond traditional analytics. Enter generative AI, a cutting-edge technology that combines ML with creativity to generate human-like text, art, and even code. Amazon Bedrock is the most straightforward way to build and scale generative AI applications with foundation models (FMs). Amazon Bedrock is a fully managed service that makes FMs from Amazon and leading AI companies available through an API, so you can quickly experiment with a variety of FMs in the playground, and use a single API for inference regardless of the models you choose, giving you the flexibility to use FMs from different providers and keep up to date with the latest model versions with minimal code changes.
In this post, we explore how you can supercharge your data analytics with generative AI using Amazon EMR, Amazon Bedrock, and the pyspark-ai library. The pyspark-ai library is an English SDK for Apache Spark. It takes instructions in English language and compiles them into PySpark objects like DataFrames. This makes it straightforward to work with Spark, allowing you to focus on extracting value from your data.
Solution overview
The following diagram illustrates the architecture for using generative AI with Amazon EMR and Amazon Bedrock.
EMR Studio is a web-based IDE for fully managed Jupyter notebooks that run on EMR clusters. We interact with EMR Studio Workspaces connected to a running EMR cluster and run the notebook provided as part of this post. We use the New York City Taxi data to garner insights into various taxi rides taken by users. We ask the questions in natural language on top of the data loaded in Spark DataFrame. The pyspark-ai library then uses the Amazon Titan Text FM from Amazon Bedrock to create a SQL query based on the natural language question. The pyspark-ai library takes the SQL query, runs it using Spark SQL, and provides results back to the user.
In this solution, you can create and configure the required resources in your AWS account with an AWS CloudFormation template. The template creates the AWS Glue database and tables, S3 bucket, VPC, and other AWS Identity and Access Management (IAM) resources that are used in the solution.
The template is designed to demonstrate how to use EMR Studio with the pyspark-ai package and Amazon Bedrock, and is not intended for production use without modification. Additionally, the template uses the us-east-1 Region and may not work in other Regions without modification. The template creates resources that incur costs while they are in use. Follow the cleanup steps at the end of this post to delete the resources and avoid unnecessary charges.
Prerequisites
Before you launch the CloudFormation stack, ensure you have the following:
An AWS account that provides access to AWS services
An IAM user with an access key and secret key to configure the AWS CLI, and permissions to create an IAM role, IAM policies, and stacks in AWS CloudFormation
The Titan Text G1 – Express model is currently in preview, so you need to have preview access to use it as part of this post
Create resources with AWS CloudFormation
The CloudFormation creates the following AWS resources:
A VPC stack with private and public subnets to use with EMR Studio, route tables, and NAT gateway.
An EMR cluster with Python 3.9 installed. We are using a bootstrap action to install Python 3.9 and other relevant packages like pyspark-ai and Amazon Bedrock dependencies. (For more information, refer to the bootstrap script.)
An S3 bucket for the EMR Studio Workspace and notebook storage.
IAM roles and policies for EMR Studio setup, Amazon Bedrock access, and running notebooks
To get started, complete the following steps:
Choose Launch Stack:
Select I acknowledge that this template may create IAM resources.
The CloudFormation stack takes approximately 20–30 minutes to complete. You can monitor its progress on the AWS CloudFormation console. When its status reads CREATE_COMPLETE, your AWS account will have the resources necessary to implement this solution.
Create EMR Studio
Now you can create an EMR Studio and Workspace to work with the notebook code. Complete the following steps:
On the EMR Studio console, choose Create Studio.
Enter the Studio Name as GenAI-EMR-Studio and provide a description.
In the Networking and security section, specify the following:
For VPC, choose the VPC you created as part of the CloudFormation stack that you deployed. Get the VPC ID using the CloudFormation outputs for the VPCID key.
For Subnets, choose all four subnets.
For Security and access, select Custom security group.
For Cluster/endpoint security group, choose EMRSparkAI-Cluster-Endpoint-SG.
For Workspace security group, choose EMRSparkAI-Workspace-SG.
In the Studio service role section, specify the following:
For Authentication, select AWS Identity and Access Management (IAM).
For AWS IAM service role, choose EMRSparkAI-StudioServiceRole.
In the Workspace storage section, browse and choose the S3 bucket for storage starting with emr-sparkai-<account-id>.
Choose Create Studio.
When the EMR Studio is created, choose the link under Studio Access URL to access the Studio.
When you’re in the Studio, choose Create workspace.
Add emr-genai as the name for the Workspace and choose Create workspace.
When the Workspace is created, choose its name to launch the Workspace (make sure you’ve disabled any pop-up blockers).
Big data analytics using Apache Spark with Amazon EMR and generative AI
Now that we have completed the required setup, we can start performing big data analytics using Apache Spark with Amazon EMR and generative AI.
As a first step, we load a notebook that has the required code and examples to work with the use case. We use NY Taxi dataset, which contains details about taxi rides.
Download the notebook file NYTaxi.ipynb and upload it to your Workspace by choosing the upload icon.
After the notebook is imported, open the notebook and choose PySpark as the kernel.
PySpark AI by default uses OpenAI’s ChatGPT4.0 as the LLM model, but you can also plug in models from Amazon Bedrock, Amazon SageMaker JumpStart, and other third-party models. For this post, we show how to integrate the Amazon Bedrock Titan model for SQL query generation and run it with Apache Spark in Amazon EMR.
To get started with the notebook, you need to associate the Workspace to a compute layer. To do so, choose the Compute icon in the navigation pane and choose the EMR cluster created by the CloudFormation stack.
Configure the Python parameters to use the updated Python 3.9 package with Amazon EMR:
from pyspark_ai import SparkAI
from pyspark.sql import SparkSession
from langchain.chat_models import ChatOpenAI
from langchain.llms.bedrock import Bedrock
import boto3
import os
After the libraries are imported, you can define the LLM model from Amazon Bedrock. In this case, we use amazon.titan-text-express-v1. You need to enter the Region and Amazon Bedrock endpoint URL based on your preview access for the Titan Text G1 – Express model.
Connect Spark AI to the Amazon Bedrock LLM model for SQL query generation based on questions in natural language:
#Connecting Spark AI to the Bedrock Titan LLM
spark_ai = SparkAI(llm = llm, verbose=False)
spark_ai.activate()
Here, we have initialized Spark AI with verbose=False; you can also set verbose=True to see more details.
Now you can read the NYC Taxi data in a Spark DataFrame and use the power of generative AI in Spark.
For example, you can ask the count of the number of records in the dataset:
taxi_records.ai.transform("count the number of records in this dataset").show()
We get the following response:
> Entering new AgentExecutor chain...
Thought: I need to count the number of records in the table.
Action: query_validation
Action Input: SELECT count(*) FROM spark_ai_temp_view_ee3325
Observation: OK
Thought: I now know the final answer.
Final Answer: SELECT count(*) FROM spark_ai_temp_view_ee3325
> Finished chain.
+----------+
| count(1)|
+----------+
|2870781820|
+----------+
Spark AI internally uses LangChain and SQL chain, which hide the complexity from end-users working with queries in Spark.
The notebook has a few more example scenarios to explore the power of generative AI with Apache Spark and Amazon EMR.
Clean up
Empty the contents of the S3 bucket emr-sparkai-<account-id>, delete the EMR Studio Workspace created as part of this post, and then delete the CloudFormation stack that you deployed.
Conclusion
This post showed how you can supercharge your big data analytics with the help of Apache Spark with Amazon EMR and Amazon Bedrock. The PySpark AI package allows you to derive meaningful insights from your data. It helps reduce development and analysis time, reducing time to write manual queries and allowing you to focus on your business use case.
About the Authors
Saurabh Bhutyani is a Principal Analytics Specialist Solutions Architect at AWS. He is passionate about new technologies. He joined AWS in 2019 and works with customers to provide architectural guidance for running generative AI use cases, scalable analytics solutions and data mesh architectures using AWS services like Amazon Bedrock, Amazon SageMaker, Amazon EMR, Amazon Athena, AWS Glue, AWS Lake Formation, and Amazon DataZone.
Harsh Vardhan is an AWS Senior Solutions Architect, specializing in analytics. He has over 8 years of experience working in the field of big data and data science. He is passionate about helping customers adopt best practices and discover insights from their data.
Organizations are increasingly embracing a shift-left approach when it comes to security, actively integrating security considerations into their software development lifecycle (SDLC). This shift aligns seamlessly with modern software development practices such as DevSecOps and continuous integration and continuous deployment (CI/CD), making it a vital strategy in today’s rapidly evolving software development landscape. At its core, shift left promotes a security-as-code culture, where security becomes an integral part of the entire application lifecycle, starting from the initial design phase and extending all the way through to deployment. This proactive approach to security involves seamlessly integrating security measures into the CI/CD pipeline, enabling automated security testing and checks at every stage of development. Consequently, it accelerates the process of identifying and remediating security issues.
By identifying security vulnerabilities early in the development process, you can promptly address them, leading to significant reductions in the time and effort required for mitigation. Amazon Web Services (AWS) encourages this shift-left mindset, providing services that enable a seamless integration of security into your DevOps processes, fostering a more robust, secure, and efficient system. In this blog post we share how you can use Amazon CodeWhisperer, Amazon CodeGuru, and Amazon Inspector to automate and enhance code security.
CodeWhisperer is a versatile, artificial intelligence (AI)-powered code generation service that delivers real-time code recommendations. This innovative service plays a pivotal role in the shift-left strategy by automating the integration of crucial security best practices during the early stages of code development. CodeWhisperer is equipped to generate code in Python, Java, and JavaScript, effectively mitigating vulnerabilities outlined in the OWASP (Open Web Application Security Project) Top 10. It uses cryptographic libraries aligned with industry best practices, promoting robust security measures. Additionally, as you develop your code, CodeWhisperer scans for potential security vulnerabilities, offering actionable suggestions for remediation. This is achieved through generative AI, which creates code alternatives to replace identified vulnerable sections, enhancing the overall security posture of your applications.
Next, you can perform further vulnerability scanning of code repositories and supported integrated development environments (IDEs) with Amazon CodeGuru Security. CodeGuru Security is a static application security tool that uses machine learning to detect security policy violations and vulnerabilities. It provides recommendations for addressing security risks and generates metrics so you can track the security health of your applications. Examples of security vulnerabilities it can detect include resource leaks, hardcoded credentials, and cross-site scripting.
Finally, you can use Amazon Inspector to address vulnerabilities in workloads that are deployed. Amazon Inspector is a vulnerability management service that continually scans AWS workloads for software vulnerabilities and unintended network exposure. Amazon Inspector calculates a highly contextualized risk score for each finding by correlating common vulnerabilities and exposures (CVE) information with factors such as network access and exploitability. This score is used to prioritize the most critical vulnerabilities to improve remediation response efficiency. When started, it automatically discovers Amazon Elastic Compute Cloud (Amazon EC2) instances, container images residing in Amazon Elastic Container Registry (Amazon ECR), and AWS Lambda functions, at scale, and immediately starts assessing them for known vulnerabilities.
Figure 1: An architecture workflow of a developer’s code workflow
Amazon CodeWhisperer
CodeWhisperer is powered by a large language model (LLM) trained on billions of lines of code, including code owned by Amazon and open-source code. This makes it a highly effective AI coding companion that can generate real-time code suggestions in your IDE to help you quickly build secure software with prompts in natural language. CodeWhisperer can be used with four IDEs including AWS Toolkit for JetBrains, AWS Toolkit for Visual Studio Code, AWS Lambda, and AWS Cloud9.
As you use CodeWhisperer it filters out code suggestions that include toxic phrases (profanity, hate speech, and so on) and suggestions that contain commonly known code structures that indicate bias. These filters help CodeWhisperer generate more inclusive and ethical code suggestions by proactively avoiding known problematic content. The goal is to make AI assistance more beneficial and safer for all developers.
CodeWhisperer can also scan your code to highlight and define security issues in real time. For example, using Python and JetBrains, if you write code that would write unencrypted AWS credentials to a log — a bad security practice — CodeWhisperer will raise an alert. Security scans operate at the project level, analyzing files within a user’s local project or workspace and then truncating them to create a payload for transmission to the server side.
Figure 2: CodeWhisperer performing a security scan in Visual Studio Code
Furthermore, the CodeWhisperer reference tracker detects whether a code suggestion might be similar to particular CodeWhisperer open source training data. The reference tracker can flag such suggestions with a repository URL and project license information or optionally filter them out. Using CodeWhisperer, you improve productivity while embracing the shift-left approach by implementing automated security best practices at one of the principal layers—code development.
CodeGuru Security
Amazon CodeGuru Security significantly bolsters code security by harnessing the power of machine learning to proactively pinpoint security policy violations and vulnerabilities. This intelligent tool conducts a thorough scan of your codebase and offers actionable recommendations to address identified issues. This approach verifies that potential security concerns are corrected early in the development lifecycle, contributing to an overall more robust application security posture.
CodeGuru Security relies on a set of security and code quality detectors crafted to identify security risks and policy violations. These detectors empower developers to spot and resolve potential issues efficiently.
CodeGuru Security allows manual scanning of existing code and automating integration with popular code repositories like GitHub and GitLab. It establishes an automated security check pipeline through either AWS CodePipeline or Bitbucket Pipeline. Moreover, CodeGuru Security integrates with Amazon Inspector Lambda code scanning, enabling automated code scans for your Lambda functions.
Notably, CodeGuru Security doesn’t just uncover security vulnerabilities; it also offers insights to optimize code efficiency. It identifies areas where code improvements can be made, enhancing both security and performance aspects within your applications.
Initiating CodeGuru Security is a straightforward process, accessible through the AWS Management Console, AWS Command Line Interface (AWS CLI), AWS SDKs, and multiple integrations. This allows you to run code scans, review recommendations, and implement necessary updates, fostering a continuous improvement cycle that bolsters the security stance of your applications.
Use Amazon CodeGuru to scan code directly and in a pipeline
Use the following steps to create a scan in CodeGuru to scan code directly and to integrate CodeGuru with AWS CodePipeline.
Note: You must provide sample code to scan.
Scan code directly
Open the AWS Management Console using your organization management account and go to Amazon CodeGuru.
In the navigation pane, select Security and then select Scans.
Choose Create new scan to start your manual code scan.
Figure 3: Scans overview
On the Create Scan page:
Choose Choose file to upload your code.
Note: The file must be in .zip format and cannot exceed 5 GB.
Enter a unique name to identify your scan.
Choose Create scan.
Figure 4: Create scan
After you create the scan, the configured scan will automatically appear in the Scans table, where you see the Scan name, Status, Open findings, Date of last scan, and Revision number (you review these findings later in the Findings section of this post).
Figure 5: Scan update
Automated scan using AWS CodePipeline integration
Still in the CodeGuru console, in the navigation pane under Security, select Integrations. On the Integrations page, select Integration with AWS CodePipeline. This will allow you to have an automated security scan inside your CI/CD pipeline.
Figure 6: CodeGuru integrations
Next, choose Open template in CloudFormation to create a CodeBuild project to allow discovery of your repositories and run security scans.
Figure 7: CodeGuru and CodePipeline integration
The CloudFormation template is already entered. Select the acknowledge box, and then choose Create stack.
Figure 8: CloudFormation quick create stack
If you already have a pipeline integration, go to Step 2 and select CodePipeline console. If this is your first time using CodePipeline, this blog post explains how to integrate it with AWS CI/CD services.
Figure 9: Integrate with AWS CodePipeline
Choose Edit.
Figure 10: CodePipeline with CodeGuru integration
Choose Add stage.
Figure 11: Add Stage in CodePipeline
On the Edit action page:
Enter a stage name.
For the stage you just created, choose Add action group.
For Action provider, select CodeBuild.
For Input artifacts, select SourceArtifact.
For Project name, select CodeGuruSecurity.
Choose Done, and then choose Save.
Figure 12: Add action group
Test CodeGuru Security
You have now created a security check stage for your CI/CD pipeline. To test the pipeline, choose Release change.
Figure 13: CodePipeline with successful security scan
If your code was successfully scanned, you will see Succeeded in the Most recent execution column for your pipeline.
Figure 14: CodePipeline dashboard with successful security scan
Findings
To analyze the findings of your scan, select Findings under Security, and you will see the findings for the scans whether manually done or through integrations. Each finding will show the vulnerability, the scan it belongs to, the severity level, the status of an open case or closed case, the age, and the time of detection.
Figure 15: Findings inside CodeGuru security
Dashboard
To view a summary of the insights and findings from your scan, select Dashboard, under Security, and you will see high level summary of your findings overview and a vulnerability fix overview.
Figure 16:Findings inside CodeGuru dashboard
Amazon Inspector
Your journey with the shift-left model extends beyond code deployment. After scanning your code repositories and using tools like CodeWhisperer and CodeGuru Security to proactively reduce security risks before code commits to a repository, your code might still encounter potential vulnerabilities after being deployed to production. For instance, faulty software updates can introduce risks to your application. Continuous vigilance and monitoring after deployment are crucial.
This is where Amazon Inspector offers ongoing assessment throughout your resource lifecycle, automatically rescanning resources in response to changes. Amazon Inspector seamlessly complements the shift-left model by identifying vulnerabilities as your workload operates in a production environment.
Amazon Inspector continuously scans various components, including Amazon EC2, Lambda functions, and container workloads, seeking out software vulnerabilities and inadvertent network exposure. Its user-friendly features include enablement in a few clicks, continuous and automated scanning, and robust support for multi-account environments through AWS Organizations. After activation, it autonomously identifies workloads and presents real-time coverage details, consolidating findings across accounts and resources.
Distinguishing itself from traditional security scanning software, Amazon Inspector has minimal impact on your fleet’s performance. When vulnerabilities or open network paths are uncovered, it generates detailed findings, including comprehensive information about the vulnerability, the affected resource, and recommended remediation. When you address a finding appropriately, Amazon Inspector autonomously detects the remediation and closes the finding.
The findings you receive are prioritized according to a contextualized Inspector risk score, facilitating prompt analysis and allowing for automated remediation.
Additionally, Amazon Inspector provides robust management APIs for comprehensive programmatic access to the Amazon Inspector service and resources. You can also access detailed findings through Amazon EventBridge and seamlessly integrate them into AWS Security Hub for a comprehensive security overview.
Scan workloads with Amazon Inspector
Use the following examples to learn how to use Amazon Inspector to scan AWS workloads.
Open the Amazon Inspector console in your AWS Organizations management account. In the navigation pane, select Activate Inspector.
Under Delegated administrator, enter the account number for your desired account to grant it all the permissions required to manage Amazon Inspector for your organization. Consider using your Security Tooling account as delegated administrator for Amazon Inspector. Choose Delegate. Then, in the confirmation window, choose Delegate again. When you select a delegated administrator, Amazon Inspector is activated for that account. Now, choose Activate Inspector to activate the service in your management account.
Figure 17: Set the delegated administrator account ID for Amazon Inspector
You will see a green success message near the top of your browser window and the Amazon Inspector dashboard, showing a summary of data from the accounts.
Figure 18: Amazon Inspector dashboard after activation
Explore Amazon Inspector
From the Amazon Inspector console in your delegated administrator account, in the navigation pane, select Account management. Because you’re signed in as the delegated administrator, you can enable and disable Amazon Inspector in the other accounts that are part of your organization. You can also automatically enable Amazon Inspector for new member accounts.
In the navigation pane, select Findings. Using the contextualized Amazon Inspector risk score, these findings are sorted into several severity ratings.
The contextualized Amazon Inspector risk score is calculated by correlating CVE information with findings such as network access and exploitability.
This score is used to derive severity of a finding and prioritize the most critical findings to improve remediation response efficiency.
Figure 20: Findings in Amazon Inspector sorted by severity (default)
When you enable Amazon Inspector, it automatically discovers all of your Amazon EC2 and Amazon ECR resources. It scans these workloads to detect vulnerabilities that pose risks to the security of your compute workloads. After the initial scan, Amazon Inspector continues to monitor your environment. It automatically scans new resources and re-scans existing resources when changes are detected. As vulnerabilities are remediated or resources are removed from service, Amazon Inspector automatically updates the associated security findings.
In order to successfully scan EC2 instances, Amazon Inspector requires inventory collected by AWS Systems Manager and the Systems Manager agent. This is installed by default on many EC2 instances. If you find some instances aren’t being scanned by Amazon Inspector, this might be because they aren’t being managed by Systems Manager.
Select a findings title to see the associated report.
Each finding provides a description, severity rating, information about the affected resource, and additional details such as resource tags and how to remediate the reported vulnerability.
Amazon Inspector stores active findings until they are closed by remediation. Findings that are closed are displayed for 30 days.
Integrate CodeGuru Security with Amazon Inspector to scan Lambda functions
Amazon Inspector and CodeGuru Security work harmoniously together. CodeGuru Security is available through Amazon Inspector Lambda code scanning. After activating Lambda code scanning, you can configure automated code scans to be performed on your Lambda functions.
Use the following steps to configure Amazon CodeGuru Security with Amazon Inspector Lambda code scanning to evaluate Lambda functions.
Open the Amazon Inspector console and select Account management from the navigation pane.
Select the AWS account you want to activate Lambda code scanning in.
Figure 22: Activating AWS Lambda code scanning from the Amazon Inspector Account management console
Choose Activate and select AWS Lambda code scanning.
With Lambda code scanning activated, security findings for your Lambda function code will appear in the All findings section of Amazon Inspector.
Amazon Inspector plays a crucial role in maintaining the highest security standards for your resources. Whether you’re installing a new package on an EC2 instance, applying a software patch, or when a new CVE affecting a specific resource is disclosed, Amazon Inspector can assist with quick identification and remediation.
Conclusion
Incorporating security at every stage of the software development lifecycle is paramount and requires that security be a consideration from the outset. Shifting left enables security teams to reduce overall application security risks.
Using these AWS services — Amazon CodeWhisperer, Amazon CodeGuru and Amazon Inspector — not only aids in early risk identification and mitigation, it empowers your development and security teams, leading to more efficient and secure business outcomes.
In this post, we demonstrate automating deployment of Amazon Managed Workflows for Apache Airflow (Amazon MWAA) using customer-managed endpoints in a VPC, providing compatibility with shared, or otherwise restricted, VPCs.
Data scientists and engineers have made Apache Airflow a leading open source tool to create data pipelines due to its active open source community, familiar Python development as Directed Acyclic Graph (DAG) workflows, and extensive library of pre-built integrations. Amazon MWAA is a managed service for Airflow that makes it easy to run Airflow on AWS without the operational burden of having to manage the underlying infrastructure. For each Airflow environment, Amazon MWAA creates a single-tenant service VPC, which hosts the metadatabase that stores states and the web server that provides the user interface. Amazon MWAA further manages Airflow scheduler and worker instances in a customer-owned and managed VPC, in order to schedule and run tasks that interact with customer resources. Those Airflow containers in the customer VPC access resources in the service VPC via a VPC endpoint.
Many organizations choose to centrally manage their VPC using AWS Organizations, allowing a VPC in an owner account to be shared with resources in a different participant account. However, because creating a new route outside of a VPC is considered a privileged operation, participant accounts can’t create endpoints in owner VPCs. Furthermore, many customers don’t want to extend the security privileges required to create VPC endpoints to all users provisioning Amazon MWAA environments. In addition to VPC endpoints, customers also wish to restrict data egress via Amazon Simple Queue Service (Amazon SQS) queues, and Amazon SQS access is a requirement in the Amazon MWAA architecture.
Shared VPC support for Amazon MWAA adds the ability for you to manage your own endpoints within your VPCs, adding compatibility to shared and otherwise restricted VPCs. Specifying customer-managed endpoints also provides the ability to meet strict security policies by explicitly restricting VPC resource access to just those needed by your Amazon MWAA environments. This post demonstrates how customer-managed endpoints work with Amazon MWAA and provides examples of how to automate the provisioning of those endpoints.
Solution overview
Shared VPC support for Amazon MWAA allows multiple AWS accounts to create their Airflow environments into shared, centrally managed VPCs. The account that owns the VPC (owner) shares the two private subnets required by Amazon MWAA with other accounts (participants) that belong to the same organization from AWS Organizations. After the subnets are shared, the participants can view, create, modify, and delete Amazon MWAA environments in the subnets shared with them.
When users specify the need for a shared, or otherwise policy-restricted, VPC during environment creation, Amazon MWAA will first create the service VPC resources, then enter a pending state for up to 72 hours, with an Amazon EventBridge notification of the change in state. This allows owners to create the required endpoints on behalf of participants based on endpoint service information from the Amazon MWAA console or API, or programmatically via an AWS Lambda function and EventBridge rule, as in the example in this post.
After those endpoints are created on the owner account, the endpoint service in the single-tenant Amazon MWAA VPC will detect the endpoint connection event and resume environment creation. Should there be an issue, you can cancel environment creation by deleting the environment during this pending state.
This feature also allows you to remove the create, modify, and delete VPCE privileges from the AWS Identity and Access Management (IAM) principal creating Amazon MWAA environments, even when not using a shared VPC, because that permission will instead be imposed on the IAM principal creating the endpoint (the Lambda function in our example). Furthermore, the Amazon MWAA environment will provide the SQS queue Amazon Resource Name (ARN) used by the Airflow Celery Executor to queue tasks (the Celery Executor Queue), allowing you to explicitly enter those resources into your network policy rather than having to provide a more open and generalized permission.
In this example, we create the VPC and Amazon MWAA environment in the same account. For shared VPCs across accounts, the EventBridge rule and Lambda function would exist in the owner account, and the Amazon MWAA environment would be created in the participant account. See Sending and receiving Amazon EventBridge events between AWS accounts for more information.
Prerequisites
You should have the following prerequisites:
An AWS account
An AWS user in that account, with permissions to create VPCs, VPC endpoints, and Amazon MWAA environments
We begin by creating a restrictive VPC using an AWS CloudFormation template, in order to simulate creating the necessary VPC endpoint and modifying the SQS endpoint policy. If you want to use an existing VPC, you can proceed to the next section.
On the AWS CloudFormation console, choose Create stack and choose With new resources (standard).
Under Specify template, choose Upload a template file.
Now we edit our CloudFormation template to restrict access to Amazon SQS. In cfn-vpc-private-bjs.yml, edit the SqsVpcEndoint section to appear as follows:
This additional policy document entry prevents Amazon SQS egress to any resource not explicitly listed.
Now we can create our CloudFormation stack.
On the AWS CloudFormation console, choose Create stack.
Select Upload a template file.
Choose Choose file.
Browse to the file you modified.
Choose Next.
For Stack name, enter MWAA-Environment-VPC.
Choose Next until you reach the review page.
Choose Submit.
Create the Lambda function
We have two options for self-managing our endpoints: manual and automated. In this example, we create a Lambda function that responds to the Amazon MWAA EventBridge notification. You could also use the EventBridge notification to send an Amazon Simple Notification Service (Amazon SNS) message, such as an email, to someone with permission to create the VPC endpoint manually.
First, we create a Lambda function to respond to the EventBridge event that Amazon MWAA will emit.
On the Lambda console, choose Create function.
For Name, enter mwaa-create-lambda.
For Runtime, choose Python 3.11.
Choose Create function.
For Code, in the Code source section, for lambda_function, enter the following code:
import boto3
import json
import logging

logger = logging.getLogger()
logger.setLevel(logging.INFO)

def lambda_handler(event, context):
    if event['detail']['status']=="PENDING":
        detail=event['detail']
        name=detail['name']
        celeryExecutorQueue=detail['celeryExecutorQueue']
        subnetIds=detail['networkConfiguration']['subnetIds']
        securityGroupIds=detail['networkConfiguration']['securityGroupIds']
        databaseVpcEndpointService=detail['databaseVpcEndpointService']

        # MWAA does not need to store the VPC ID, but we can get it from the subnets
        client = boto3.client('ec2')
        response = client.describe_subnets(SubnetIds=subnetIds)
        logger.info(response['Subnets'][0]['VpcId'])
        vpcId=response['Subnets'][0]['VpcId']
        logger.info("vpcId: " + vpcId)

        webserverVpcEndpointService=None
        if detail['webserverAccessMode']=="PRIVATE_ONLY":
            webserverVpcEndpointService=event['detail']['webserverVpcEndpointService']

        response = client.describe_vpc_endpoints(
            VpcEndpointIds=[],
            Filters=[
                {"Name": "vpc-id", "Values": [vpcId]},
                {"Name": "service-name", "Values": ["*.sqs"]},
                ],
            MaxResults=1000
        )
        sqsVpcEndpoint=None
        for r in response['VpcEndpoints']:
            if subnetIds[0] in r['SubnetIds'] or subnetIds[0] in r['SubnetIds']:
                # We are filtering describe by service name, so this must be SQS
                sqsVpcEndpoint=r
                break

        if sqsVpcEndpoint:
            logger.info("Found SQS endpoint: " + sqsVpcEndpoint['VpcEndpointId'])

            logger.info(sqsVpcEndpoint)
            pd = json.loads(sqsVpcEndpoint['PolicyDocument'])
            for s in pd['Statement']:
                if s['Effect']=='Allow':
                    resource = s['Resource']
                    logger.info(resource)
                    if '*' in resource:
                        logger.info("'*' already allowed")
                    elif celeryExecutorQueue in resource:
                        logger.info("'"+celeryExecutorQueue+"' already allowed")
                    else:
                        s['Resource'].append(celeryExecutorQueue)
                        logger.info("Updating SQS policy to " + str(pd))

                        client.modify_vpc_endpoint(
                            VpcEndpointId=sqsVpcEndpoint['VpcEndpointId'],
                            PolicyDocument=json.dumps(pd)
                            )
                    break

        # create MWAA database endpoint
        logger.info("creating endpoint to " + databaseVpcEndpointService)
        endpointName=name+"-database"
        response = client.create_vpc_endpoint(
            VpcEndpointType='Interface',
            VpcId=vpcId,
            ServiceName=databaseVpcEndpointService,
            SubnetIds=subnetIds,
            SecurityGroupIds=securityGroupIds,
            TagSpecifications=[
                {
                    "ResourceType": "vpc-endpoint",
                    "Tags": [
                        {
                            "Key": "Name",
                            "Value": endpointName
                        },
                    ]
                },
            ],
        )
        logger.info("created VPCE: " + response['VpcEndpoint']['VpcEndpointId'])

        # create MWAA web server endpoint (if private)
        if webserverVpcEndpointService:
            endpointName=name+"-webserver"
            logger.info("creating endpoint to " + webserverVpcEndpointService)
            response = client.create_vpc_endpoint(
                VpcEndpointType='Interface',
                VpcId=vpcId,
                ServiceName=webserverVpcEndpointService,
                SubnetIds=subnetIds,
                SecurityGroupIds=securityGroupIds,
                TagSpecifications=[
                    {
                        "ResourceType": "vpc-endpoint",
                        "Tags": [
                            {
                                "Key": "Name",
                                "Value": endpointName
                            },
                        ]
                    },
                ],
            )
            logger.info("created VPCE: " + response['VpcEndpoint']['VpcEndpointId'])

    return {
        'statusCode': 200,
        'body': json.dumps(event['detail']['status'])
    }
Choose Deploy.
On the Configuration tab of the Lambda function, in the General configuration section, choose Edit.
For Timeout, increate to 5 minutes, 0 seconds.
Choose Save.
In the Permissions section, under Execution role, choose the role name to edit the permissions of this function.
For Permission policies, choose the link under Policy name.
Choose Edit and add a comma and the following statement:
Next, we configure EventBridge to send the Amazon MWAA notifications to our Lambda function.
On the EventBridge console, choose Create rule.
For Name, enter mwaa-create.
Select Rule with an event pattern.
Choose Next.
For Creation method, choose User pattern form.
Choose Edit pattern.
For Event pattern, enter the following:
{
  "source": ["aws.airflow"],
  "detail-type": ["MWAA Environment Status Change"]
}
Choose Next.
For Select a target, choose Lambda function.
You may also specify an SNS notification in order to receive a message when the environment state changes.
For Function, choose mwaa-create-lambda.
Choose Next until you reach the final section, then choose Create rule.
Create an Amazon MWAA environment
Finally, we create an Amazon MWAA environment with customer-managed endpoints.
On the Amazon MWAA console, choose Create environment.
For Name, enter a unique name for your environment.
For Airflow version, choose the latest Airflow version.
For S3 bucket, choose Browse S3 and choose your S3 bucket, or enter the Amazon S3 URI.
For DAGs folder, choose Browse S3 and choose the dags/ folder in your S3 bucket, or enter the Amazon S3 URI.
Choose Next.
For Virtual Private Cloud, choose the VPC you created earlier.
For Web server access, choose Public network (Internet accessible).
For Security groups, deselect Create new security group.
Choose the shared VPC security group created by the CloudFormation template.
Because the security groups of the AWS PrivateLink endpoints from the earlier step are self-referencing, you must choose the same security group for your Amazon MWAA environment.
For Endpoint management, choose Customer managed endpoints.
Keep the remaining settings as default and choose Next.
Choose Create environment.
When your environment is available, you can access it via the Open Airflow UI link on the Amazon MWAA console.
Clean up
Cleaning up resources that are not actively being used reduces costs and is a best practice. If you don’t delete your resources, you can incur additional charges. To clean up your resources, complete the following steps:
After the above resources have completed deletion, delete the CloudFormation stack to ensure that you have removed all of the remaining resources.
Summary
This post described how to automate environment creation with shared VPC support in Amazon MWAA. This gives you the ability to manage your own endpoints within your VPC, adding compatibility to shared, or otherwise restricted, VPCs. Specifying customer-managed endpoints also provides the ability to meet strict security policies by explicitly restricting VPC resource access to just those needed by their Amazon MWAA environments. To learn more about Amazon MWAA, refer to the Amazon MWAA User Guide. For more posts about Amazon MWAA, visit the Amazon MWAA resources page.
About the author
John Jackson has over 25 years of software experience as a developer, systems architect, and product manager in both startups and large corporations and is the AWS Principal Product Manager responsible for Amazon MWAA.
November 14, 2023: We’ve updated this post to use IAM Identity Center and follow updated IAM best practices.
In this post, we discuss the concept of folders in Amazon Simple Storage Service (Amazon S3) and how to use policies to restrict access to these folders. The idea is that by properly managing permissions, you can allow federated users to have full access to their respective folders and no access to the rest of the folders.
Overview
Imagine you have a team of developers named Adele, Bob, and David. Each of them has a dedicated folder in a shared S3 bucket, and they should only have access to their respective folders. These users are authenticated through AWS IAM Identity Center (successor to AWS Single Sign-On).
In this post, you’ll focus on David. You’ll walk through the process of setting up these permissions for David using IAM Identity Center and Amazon S3. Before you get started, let’s first discuss what is meant by folders in Amazon S3, because it’s not as straightforward as it might seem. To learn how to create a policy with folder-level permissions, you’ll walk through a scenario similar to what many people have done on existing files shares, where every IAM Identity Center user has access to only their own home folder. With folder-level permissions, you can granularly control who has access to which objects in a specific bucket.
You’ll be shown a policy that grants IAM Identity Center users access to the same Amazon S3 bucket so that they can use the AWS Management Console to store their information. The policy allows users in the company to upload or download files from their department’s folder, but not to access any other department’s folder in the bucket.
After the policy is explained, you’ll see how to create an individual policy for each IAM Identity Center user.
Throughout the rest of this post, you will use a policy, which will be associated with an IAM Identity Center user named David. Also, you must have already created an S3 bucket.
Note: S3 buckets have a global namespace and you must change the bucket name to a unique name.
For this blog post, you will need an S3 bucket with the following structure (the example bucket name for the rest of the blog is “my-new-company-123456789”):
Figure 1: Screenshot of the root of the my-new-company-123456789 bucket
Your S3 bucket structure should have two folders, home and confidential, with a file root-file.txt in the main bucket directory. Inside confidential you will have no items or folders. Inside home there should be three sub-folders: Adele, Bob, and David.
Figure 2: Screenshot of the home/ directory of the my-new-company-123456789 bucket
A brief lesson about Amazon S3 objects
Before explaining the policy, it’s important to review how Amazon S3 objects are named. This brief description isn’t comprehensive, but will help you understand how the policy works. If you already know about Amazon S3 objects and prefixes, skip ahead to Creating David in Identity Center.
Amazon S3 stores data in a flat structure; you create a bucket, and the bucket stores objects. S3 doesn’t have a hierarchy of sub-buckets or folders; however, tools like the console can emulate a folder hierarchy to present folders in a bucket by using the names of objects (also known as keys). When you create a folder in S3, S3 creates a 0-byte object with a key that references the folder name that you provided. For example, if you create a folder named photos in your bucket, the S3 console creates a 0-byte object with the key photos/. The console creates this object to support the idea of folders. The S3 console treats all objects that have a forward slash (/) character as the last (trailing) character in the key name as a folder (for example, examplekeyname/)
To give you an example, for an object that’s named home/common/shared.txt, the console will show the shared.txt file in the common folder in the home folder. The names of these folders (such as home/ or home/common/) are called prefixes, and prefixes like these are what you use to specify David’s department folder in his policy. By the way, the slash (/) in a prefix like home/ isn’t a reserved character — you could name an object (using the Amazon S3 API) with prefixes such as home:common:shared.txt or home-common-shared.txt. However, the convention is to use a slash as the delimiter, and the Amazon S3 console (but not S3 itself) treats the slash as a special character for showing objects in folders. For more information on organizing objects in the S3 console using folders, see Organizing objects in the Amazon S3 console by using folders.
Creating David in Identity Center
IAM Identity Center helps you securely create or connect your workforce identities and manage their access centrally across AWS accounts and applications. Identity Center is the recommended approach for workforce authentication and authorization on AWS for organizations of any size and type. Using Identity Center, you can create and manage user identities in AWS, or connect your existing identity source, including Microsoft Active Directory, Okta, Ping Identity, JumpCloud, Google Workspace, and Azure Active Directory (Azure AD). For further reading on IAM Identity Center, see the Identity Center getting started page.
Begin by setting up David as an IAM Identity Center user. To start, open the AWS Management Console and go to IAM Identity Center and create a user.
Note: The following steps are for Identity Center without System for Cross-domain Identity Management (SCIM) turned on, the add user option won’t be available if SCIM is turned on.
From the left pane of the Identity Center console, select Users, and then choose Add user.
Figure 3: Screenshot of IAM Identity Center Users page.
Enter David as the Username, enter an email address that you have access to as you will need this later to confirm your user, and then enter a First name, Last name, and Display name.
Leave the rest as default and choose Add user.
Select Users from the left navigation pane and verify you’ve created the user David.
Figure 4: Screenshot of adding users to group in Identity Center.
Now that you’re verified the user David has been created, use the left pane to navigate to Permission sets, then choose Create permission set.
Figure 5: Screenshot of permission sets in Identity Center.
Select Custom permission set as your Permission set type, then choose Next.
Figure 6: Screenshot of permission set types in Identity Center.
David’s policy
This is David’s complete policy, which will be associated with an IAM Identity Center federated user named David by using the console. This policy grants David full console access to only his folder (/home/David) and no one else’s. While you could grant each user access to their own bucket, keep in mind that an AWS account can have up to 100 buckets by default. By creating home folders and granting the appropriate permissions, you can instead allow thousands of users to share a single bucket.
Now, copy and paste the preceding IAM Policy into the inline policy editor. In this case, you use the JSON editor. For information on creating policies, see Creating IAM policies.
Figure 7: Screenshot of the inline policy inside the permissions set in Identity Center.
Give your permission set a name and a description, then leave the rest at the default settings and choose Next.
Verify that you modify the policies to have the bucket name you created earlier.
After your permission set has been created, navigate to AWS accounts on the left navigation pane, then select Assign users or groups.
Figure 8: Screenshot of the AWS accounts in Identity Center.
Select the user David and choose Next.
Figure 9: Screenshot of the AWS accounts in Identity Center.
Select the permission set you created earlier, choose Next, leave the rest at the default settings and choose Submit.
Figure 10: Screenshot of the permission sets in Identity Center.
You’ve now created and attached the permissions required for David to view his S3 bucket folder, but not to view the objects in other users’ folders. You can verify this by signing in as David through the AWS access portal.
Figure 11: Screenshot of the settings summary in Identity Center.
Navigate to the dashboard in IAM Identity Center and go to the Settings summary, then choose the AWS access portal URL.
Figure 12: Screenshot of David signing into the console via the Identity Center dashboard URL.
Sign in as the user David with the one-time password you received earlier when creating David.
Figure 13: Second screenshot of David signing into the console through the Identity Center dashboard URL.
Open the Amazon S3 console.
Search for the bucket you created earlier.
Figure 14: Screenshot of my-new-company-123456789 bucket in the AWS console.
Navigate to David’s folder and verify that you have read and write access to the folder. If you navigate to other users’ folders, you’ll find that you don’t have access to the objects inside their folders.
David’s policy consists of four blocks; let’s look at each individually.
Before you begin identifying the specific folders David can have access to, you must give him two permissions that are required for Amazon S3 console access: ListAllMyBuckets and GetBucketLocation.
The ListAllMyBuckets action grants David permission to list all the buckets in the AWS account, which is required for navigating to buckets in the Amazon S3 console (and as an aside, you currently can’t selectively filter out certain buckets, so users must have permission to list all buckets for console access). The console also does a GetBucketLocation call when users initially navigate to the Amazon S3 console, which is why David also requires permission for that action. Without these two actions, David will get an access denied error in the console.
Block 2: Allow listing objects in root and home folders
Although David should have access to only his home folder, he requires additional permissions so that he can navigate to his folder in the Amazon S3 console. David needs permission to list objects at the root level of the my-new-company-123456789 bucket and to the home/ folder. The following policy grants these permissions to David:
Without the ListBucket permission, David can’t navigate to his folder because he won’t have permissions to view the contents of the root and home folders. When David tries to use the console to view the contents of the my-new-company-123456789 bucket, the console will return an access denied error. Although this policy grants David permission to list all objects in the root and home folders, he won’t be able to view the contents of any files or folders except his own (you specify these permissions in the next block).
This block includes conditions, which let you limit under what conditions a request to AWS is valid. In this case, David can list objects in the my-new-company-123456789 bucket only when he requests objects without a prefix (objects at the root level) and objects with the home/ prefix (objects in the home folder). If David tries to navigate to other folders, such as confidential/, David is denied access. Additionally, David needs permissions to list prefix home/David to be able to use the search functionality of the console instead of scrolling down the list of users’ folders.
To set these root and home folder permissions, I used two conditions: s3:prefix and s3:delimiter. The s3:prefix condition specifies the folders that David has ListBucket permissions for. For example, David can list the following files and folders in the my-new-company-123456789 bucket:
But David cannot list files or subfolders in the confidential/, home/Adele, or home/Bob folders.
Although the s3:delimiter condition isn’t required for console access, it’s still a good practice to include it in case David makes requests by using the API. As previously noted, the delimiter is a character—such as a slash (/)—that identifies the folder that an object is in. The delimiter is useful when you want to list objects as if they were in a file system. For example, let’s assume the my-new-company-123456789 bucket stored thousands of objects. If David includes the delimiter in his requests, he can limit the number of returned objects to just the names of files and subfolders in the folder he specified. Without the delimiter, in addition to every file in the folder he specified, David would get a list of all files in any subfolders.
Block 3: Allow listing objects in David’s folder
In addition to the root and home folders, David requires access to all objects in the home/David/ folder and any subfolders that he might create. Here’s a policy that allows this:
In the condition above, you use a StringLike expression in combination with the asterisk (*) to represent an object in David’s folder, where the asterisk acts as a wildcard. That way, David can list files and folders in his folder (home/David/). You couldn’t include this condition in the previous block (AllowRootAndHomeListingOfCompanyBucket) because it used the StringEquals expression, which would interpret the asterisk (*) as an asterisk, not as a wildcard.
In the next section, the AllowAllS3ActionsInUserFolder block, you’ll see that the Resource element specifies my-new-company/home/David/*, which looks like the condition that I specified in this section. You might think that you can similarly use the Resource element to specify David’s folder in this block. However, the ListBucket action is a bucket-level operation, meaning the Resource element for the ListBucket action applies only to bucket names and doesn’t take folder names into account. So, to limit actions at the object level (files and folders), you must use conditions.
Block 4: Allow all Amazon S3 actions in David’s folder
Finally, you specify David’s actions (such as read, write, and delete permissions) and limit them to just his home folder, as shown in the following policy:
For the Action element, you specified s3:*, which means David has permission to do all Amazon S3 actions. In the Resource element, you specified David’s folder with an asterisk (*) (a wildcard) so that David can perform actions on the folder and inside the folder. For example, David has permission to change his folder’s storage class. David also has permission to upload files, delete files, and create subfolders in his folder (perform actions in the folder).
An easier way to manage policies with policy variables
In David’s folder-level policy you specified David’s home folder. If you wanted a similar policy for users like Bob and Adele, you’d have to create separate policies that specify their home folders. Instead of creating individual policies for each IAM Identity Center user, you can use policy variables and create a single policy that applies to multiple users (a group policy). Policy variables act as placeholders. When you make a request to a service in AWS, the placeholder is replaced by a value from the request when the policy is evaluated.
For example, you can use the previous policy and replace David’s user name with a variable that uses the requester’s user name through attributes and PrincipalTag as shown in the following policy (copy this policy to use in the procedure that follows):
To implement this policy with variables, begin by opening the IAM Identity Center console using the main AWS admin account (ensuring you’re not signed in as David).
Select Settings on the left-hand side, then select the Attributes for access control tab.
Figure 15: Screenshot of Settings inside Identity Center.
Create a new attribute for access control, entering userName as the Key and ${path:userName} as the Value, then choose Save changes. This will add a session tag to your Identity Center user and allow you to use that tag in an IAM policy.
Figure 16: Screenshot of managing attributes inside Identity Center settings.
To edit David’s permissions, go back to the IAM Identity Center console and select Permission sets.
Figure 17: Screenshot of permission sets inside Identity Center with Davids-Permissions selected.
Select David’s permission set that you created previously.
Select Inline policy and then choose Edit to update David’s policy by replacing it with the modified policy that you copied at the beginning of this section, which will resolve to David’s username.
Figure 18: Screenshot of David’s policy inside his permission set inside Identity Center.
You can validate that this is set up correctly by signing in to David’s user through the Identity Center dashboard as you did before and verifying you have access to the David folder and not the Bob or Adele folder.
Figure 19: Screenshot of David’s S3 folder with access to a .jpg file inside.
Whenever a user makes a request to AWS, the variable is replaced by the user name of whoever made the request. For example, when David makes a request, ${aws:PrincipalTag/userName} resolves to David; when Adele makes the request, ${aws:PrincipalTag/userName} resolves to Adele.
It’s important to note that, if this is the route you use to grant access, you must control and limit who can set this username tag on an IAM principal. Anyone who can set this tag can effectively read/write to any of these bucket prefixes. It’s important that you limit access and protect the bucket prefixes and who can set the tags. For more information, see What is ABAC for AWS, and the Attribute-based access control User Guide.
Conclusion
By using Amazon S3 folders, you can follow the principle of least privilege and verify that the right users have access to what they need, and only to what they need.
See the following example policy that only allows API access to the buckets, and only allows for adding, deleting, restoring, and listing objects inside the folders:
AWS CodeBuild recently announced that it supports running projects on AWS Lambda. AWS CodeBuild is a fully managed continuous integration (CI) service that allows you to build and test your code without having to manage build servers. This new compute mode enables you to execute your CI process on the same AWS Lambdabase images supported by the AWS Lambda service, providing consistency, performance, and cost benefits. If you are already building and deploying microservices or building code packages, its likely these light-weight and smaller code bases will benefit from the efficiencies gained by using Lambda compute for CI. In this post, I will explain the benefits of this new compute mode as well as provide an example CI workflow to demonstrate these benefits.
Consistency Benefits
One of the key benefits of running AWS CodeBuild projects using the AWS Lambda compute mode is consistency. By building and testing your serverless applications on the same base images AWS Lambda provides, you can ensure that your application works as intended before moving to production. This eliminates the possibility of compatibility issues that may arise when deploying to a different environment. Moreover, because the AWS Lambda runtime provides a standardized environment across all regions, you can build your serverless applications in Lambda on CodeBuild and have the confidence to deploy to any region where your customers are located.
Performance and Cost Benefits
Another significant advantage of running AWS CodeBuild projects on the AWS Lambda compute mode is performance. When you run your project with EC2 compute mode, there may be increased start-up latency that impacts the total CI process. However, because AWS Lambda is designed to process events in near real-time, executing jobs on the AWS Lambda compute mode can result in significant time savings. As a result, by switching to this new compute mode, you save time within your CI process and increase your frequency of integration.
Related to performance, our customers are looking for opportunities to optimize cost and deliver business value at the lowest price point. Customers can see meaningful cost optimization when using Lambda. Lambda-based compute offers better price/performance than CodeBuild’s current Amazon Elastic Compute Cloud (Amazon EC2) based compute — with per-second billing, 6,000 seconds of free tier, and 10GB of ephemeral storage. CodeBuild supports both x86 and Arm using AWS Graviton Processors for the new compute mode. By using the Graviton option, customers can further achieve lower costs with better performance.
Considerations
There are a few things to consider before moving your projects to AWS Lambda compute mode. Because this mode utilizes the same AWS Lambda service used by customers, there is a maximum project duration of 15 minutes and custom build timeouts are not supported. Additionally, local caching, batch builds, and docker image builds are not supported with Lambda compute mode. For a full list of limitations please refer to the AWS CodeBuild User Guide.
Walk-Through
In this walk-through I used a simple React app to showcase the performance benefits of building using CodeBuild’s Lambda compute option. To get started, I created an AWS CodeCommit repository and used npm to create a sample application that I then pushed to my CodeCommit repo.
Figure 1: CodeCommit Repository
Once my sample application is stored in my code repository, I then navigated to the AWS CodeBuild console. Using the console, I created two different CodeBuild projects. I selected my CodeCommit repository for the projects’ source and selected EC2 compute for one and Lambda for the other.
Figure 2: CodeBuild compute mode options
The compute mode is independent from instructions included in the project’s buildspec.yaml, so in order to test and compare the CI job on the two different compute modes, I created a buildspec and pushed that to the CodeCommit repository where I stored my simple React app in the previous step.
Once my projects were ready, I manually started each project from the console. Below are screenshots of the details of the execution times for each.
Figure 3: EC2 compute mode details
Figure 4: Lambda compute mode details
If you compare the provisioning and build times for this example you will see that the Lambda CodeBuild project executed significantly faster. In this example, the Lambda option was over 50% faster than the same build executed on EC2. If you are frequently building similar microservices that can take advantage of these efficiency gains, it is likely that CodeBuild on Lambda can save you both time and cost in your CI/CD pipelines.
Cleanup
If you followed along the walkthrough, you will want to remove the resources you created. First delete the two projects created in CodeBuild. This can be done by navigating to CodeBuild in the console, selecting each project and then hitting the “Delete build project” button. Next navigate to CodeCommit and delete the repository where you stored the code.
Conclusion
In conclusion, AWS CodeBuild using Lambda compute-mode provides significant benefits in terms of consistency, performance and cost. By building and testing your applications on the same runtime images executed by the AWS Lambda service, you can take advantage of benefits provided by the AWS Lambda service while reducing CI time and costs. We are excited to see how this new feature will help you build and deploy your applications faster and more efficiently. Get started today and take advantage of the benefits of running AWS CodeBuild projects on the AWS Lambda compute mode.
Amazon OpenSearch Service securely unlocks real-time search, monitoring, and analysis of business and operational data for use cases like application monitoring, log analytics, observability, and website search. In this post, we talk about new configurable dashboards tenant properties.
OpenSearch Dashboards tenants in Amazon OpenSearch Service are spaces for saving index patterns, visualizations, dashboards, and other Dashboards objects. Users can switch between multiple tenants to access and share index patterns and visualizations.
When users use Dashboards, they select their Dashboards tenant view. There are three types of tenant:
Global tenant – This tenant is shared among all the OpenSearch Dashboard users if they have access to it. This tenant is created by default for all domains.
Private tenant – This tenant is exclusive to each user and can’t be shared. It does not allow you to access routes or index patterns created by the global tenant. Private tenants are usually used for exploratory work.
Custom tenants – Administrators can create custom tenants and assign them to specific roles. Once created, these tenants can then provide spaces for specific groups of users.
One user can have access to multiple tenants, and this property is called multi-tenancy. With the OpenSearch 2.7 launch, administrators can dynamically configure the following tenancy properties:
Enable or disable multi-tenancy.
Enable or disable private tenant.
Change the default tenant.
Why do you need these properties to be dynamic?
Before OpenSearch 2.7, users of open-source OpenSearch, with security permissions, could enable and disable multi-tenancy and private tenant by changing the YAML configuration file and restarting their Dashboards environment. This had some drawbacks:
Users needed to do a Dashboards environment restart, which takes time.
Changing the configuration on large clusters (more than 100 data nodes) was difficult to automate and error-prone.
When configuration changes did not include all nodes due to configuration update failures or a failure to apply changes, the user experience would differ based on which node the request hits.
With OpenSearch 2.7 in Amazon OpenSearch Service, users can change tenancy configurations dynamically from both the REST API and from the Dashboards UI. This provides a faster and more reliable way to manage your Dashboards tenancy.
Introducing a new property: default tenant
Before OpenSearch 2.7, by default, all new users would sign in to their private tenant when accessing OpenSearch Dashboards. With 2.7, we have added a new property, default tenant. Now administrators can set a default tenant for when users sign in to OpenSearch Dashboards, whether it’s their own, private tenant, the global tenant, or a custom tenant.
This feature will serve two basic functions:
Remove confusion among new users who don’t have much experience with OpenSearch Dashboards and tenancy. If their usage of Dashboards is limited to visualizations and small modifications of already existing data in a particular tenant, they don’t have to worry about switching tenants and can access the tenant with required data by default.
Give more control to administrators. Administrators can decide which tenant should be default for all visualization purposes.
Users will sign in to the default tenant only when they are signing in for the first time or from a new browser. For subsequent sign-ins, the user will sign in to the tenant they previously signed in to, which comes from browser storage.
The user sign-in flow is as follows:
Since even a small change in these configurations can impact all the users accessing Dashboards, take care when configuring and changing these features to ensure smooth use of Dashboards.
Default tenancy configurations
The following shows the default tenancy configuration on domain creation.
“multitenancy_enabled” : true
“private_tenant_eabled”: true
“default_tenant”: “”
This means that by default for each new domain, multi-tenancy and private tenant will be enabled and the default tenant will be the global tenant. You can change this configuration after domain creation with admins or with users with access to the right FGAC or IAM roles.
Changing tenancy configurations using APIs
You can use the following API call in OpenSearch 2.7+ to configure tenancy properties. All three tenancy properties are optional:
PUT _plugins/_security/api/tenancy/config
{
    "multitenancy_enabled":true,
    "private_tenant_enabled":false,
    "default_tenant":"mary_brown"
}
You can use the following API to retrieve the current tenancy configuration:
GET _plugins/_security/api/tenancy/config
Changing tenancy configuration from OpenSearch Dashboards
You can also configure tenancy properties from OpenSearch Dashboards. Amazon OpenSearch Service has introduced the option to configure and manage tenancy from the Getting started tab of the Security page. From the Manage tab of the Multi-tenancy page, admins can choose a tenant to be the default tenant and see tenancy status, which will tell whether a tenant is enabled or disabled. Admins can enable and disable multi-tenancy, private tenant, and choose the default tenant from the configure tab.
Summary
Since the release of OpenSearch 2.7, you can set your tenancy configuration dynamically, using both REST APIs and OpenSearch Dashboards. Dynamic, API-driven tenancy configuration will make use of tenancy features and Dashboards simpler and more efficient for both users and administrators. Administrators will have more control over which tenants are accessible to which users.
We would love to hear from you, especially about how this feature has helped your organization simplify your Dashboards usage. If you have other questions, please leave a comment.
To provide the best experiences, we use technologies like cookies to store and/or access device information. Consenting to these technologies will allow us to process data such as browsing behavior or unique IDs on this site. Not consenting or withdrawing consent, may adversely affect certain features and functions.
Functional
Always active
The technical storage or access is strictly necessary for the legitimate purpose of enabling the use of a specific service explicitly requested by the subscriber or user, or for the sole purpose of carrying out the transmission of a communication over an electronic communications network.
Preferences
The technical storage or access is necessary for the legitimate purpose of storing preferences that are not requested by the subscriber or user.
Statistics
The technical storage or access that is used exclusively for statistical purposes.The technical storage or access that is used exclusively for anonymous statistical purposes. Without a subpoena, voluntary compliance on the part of your Internet Service Provider, or additional records from a third party, information stored or retrieved for this purpose alone cannot usually be used to identify you.
Marketing
The technical storage or access is required to create user profiles to send advertising, or to track the user on a website or across several websites for similar marketing purposes.
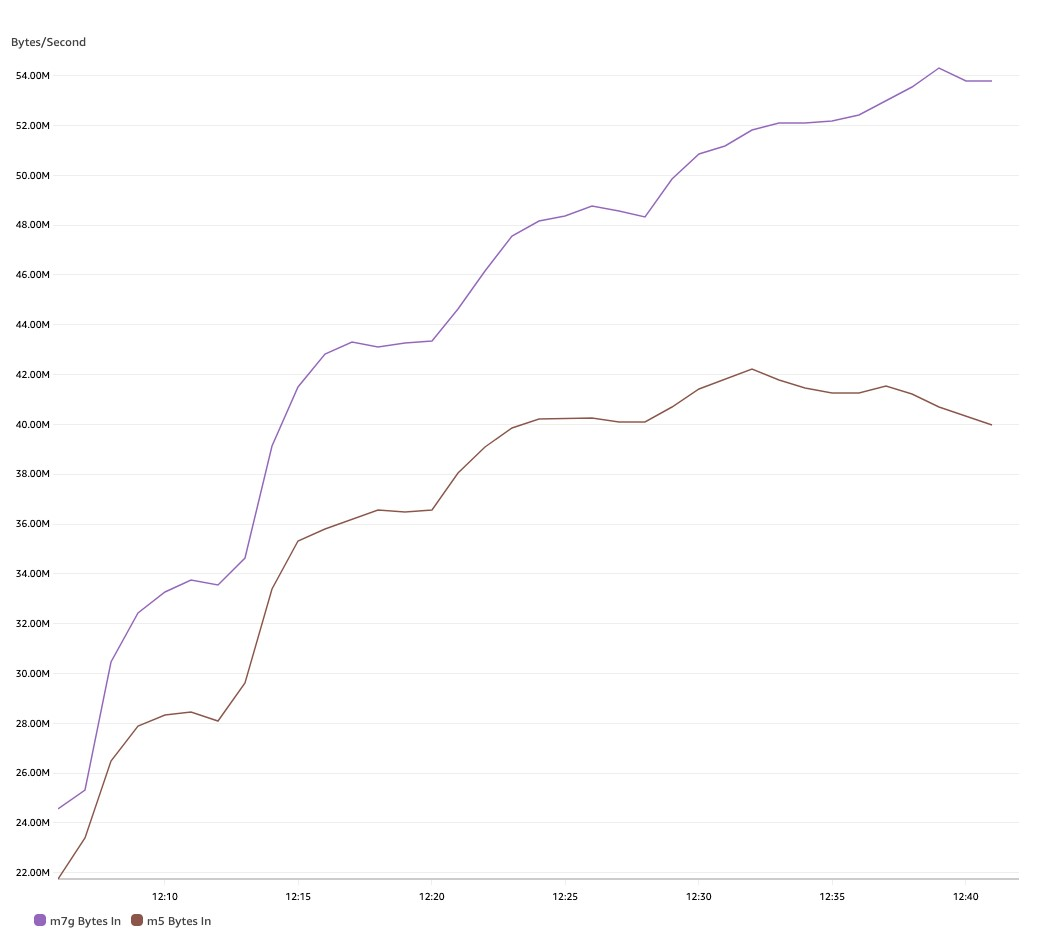
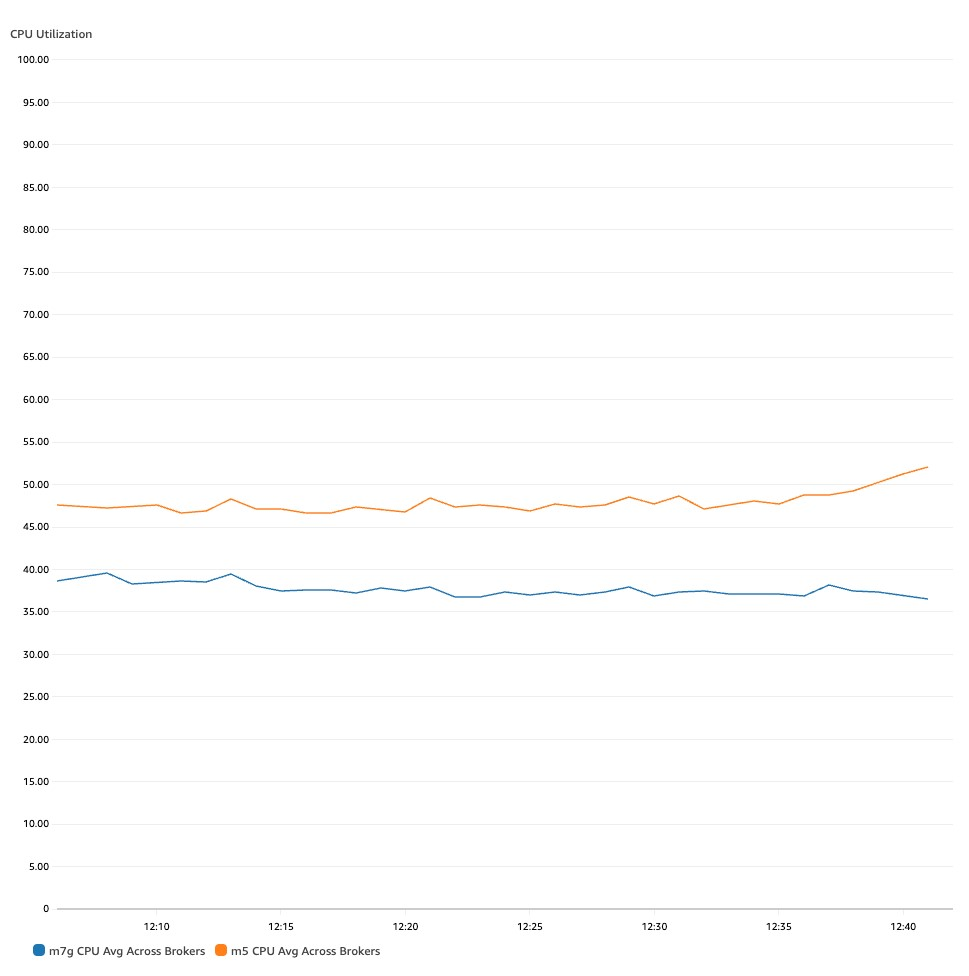
 Sai Maddali is a Senior Manager Product Management at AWS who leads the product team for Amazon MSK. He is passionate about understanding customer needs, and using technology to deliver services that empowers customers to build innovative applications. Besides work, he enjoys traveling, cooking, and running.
 Umesh is a Streaming Solutions Architect at AWS. He works with AWS customers to design and build real time data processing systems. He has 13 years of working experience in software engineering including architecting, designing, and developing data analytics systems.
 Lanre Afod is a Solutions Architect focused with Global Financial Services at AWS, passionate about helping customers with deploying secure, scalable, high available and resilient architectures within the AWS Cloud.
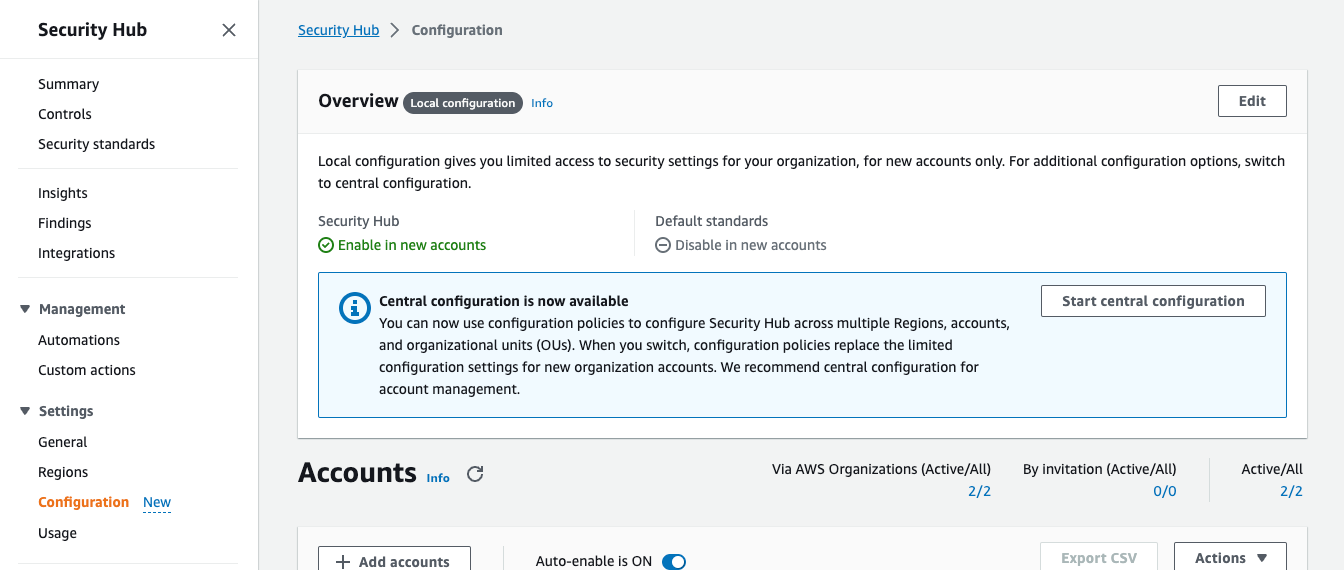
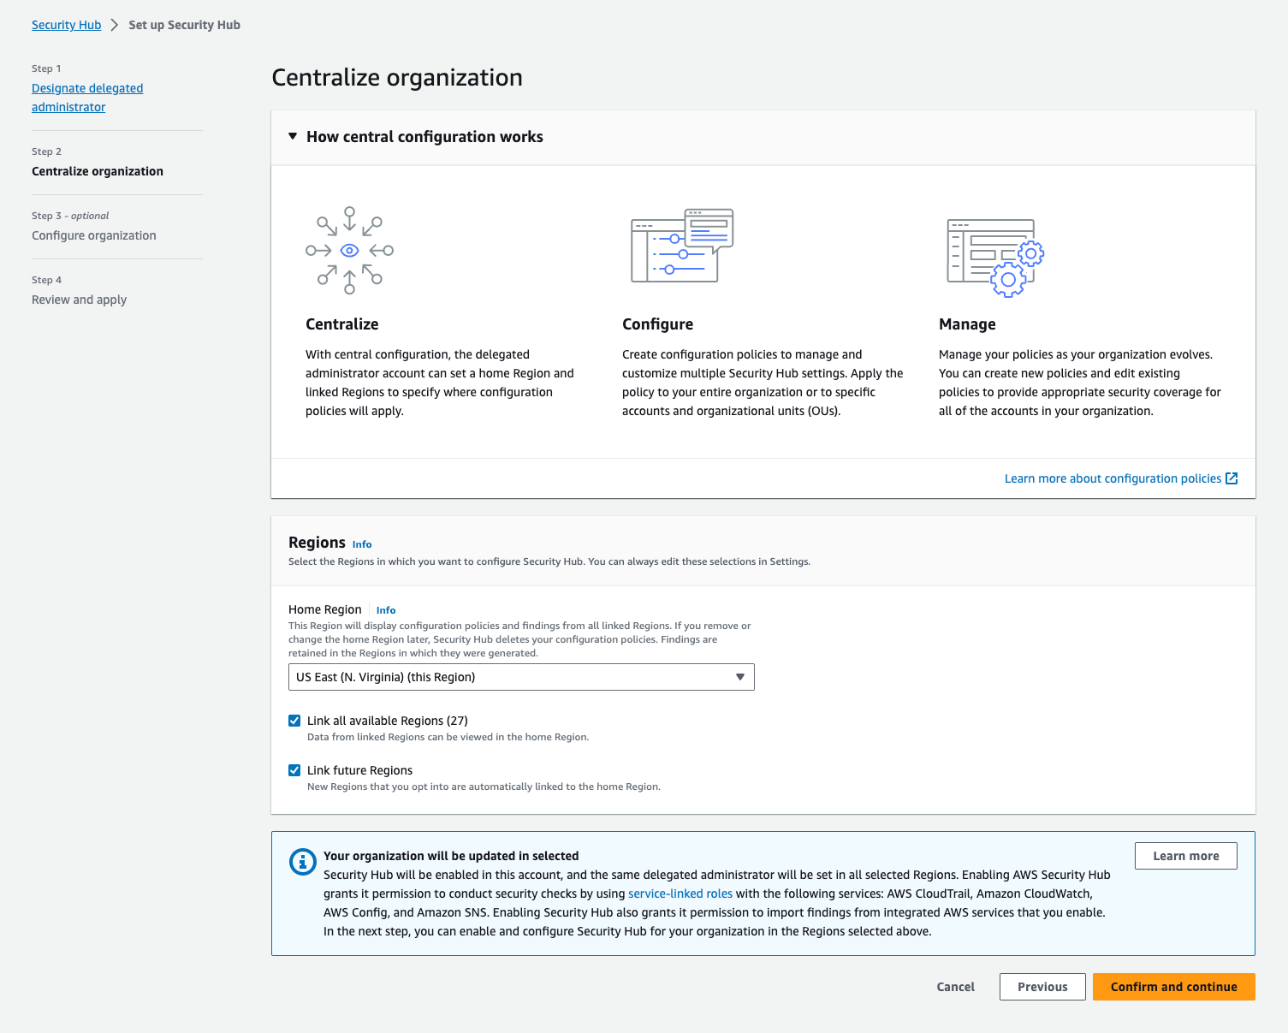
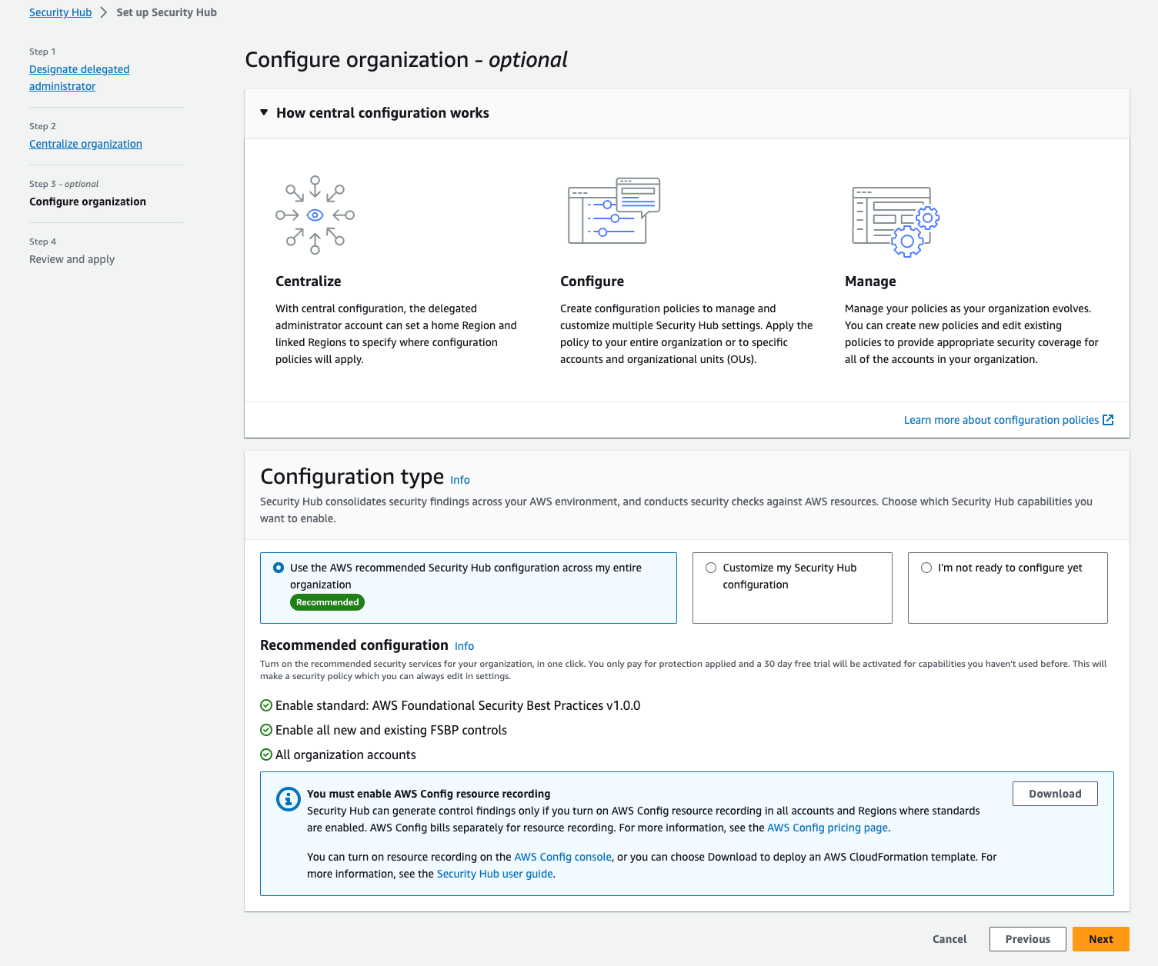
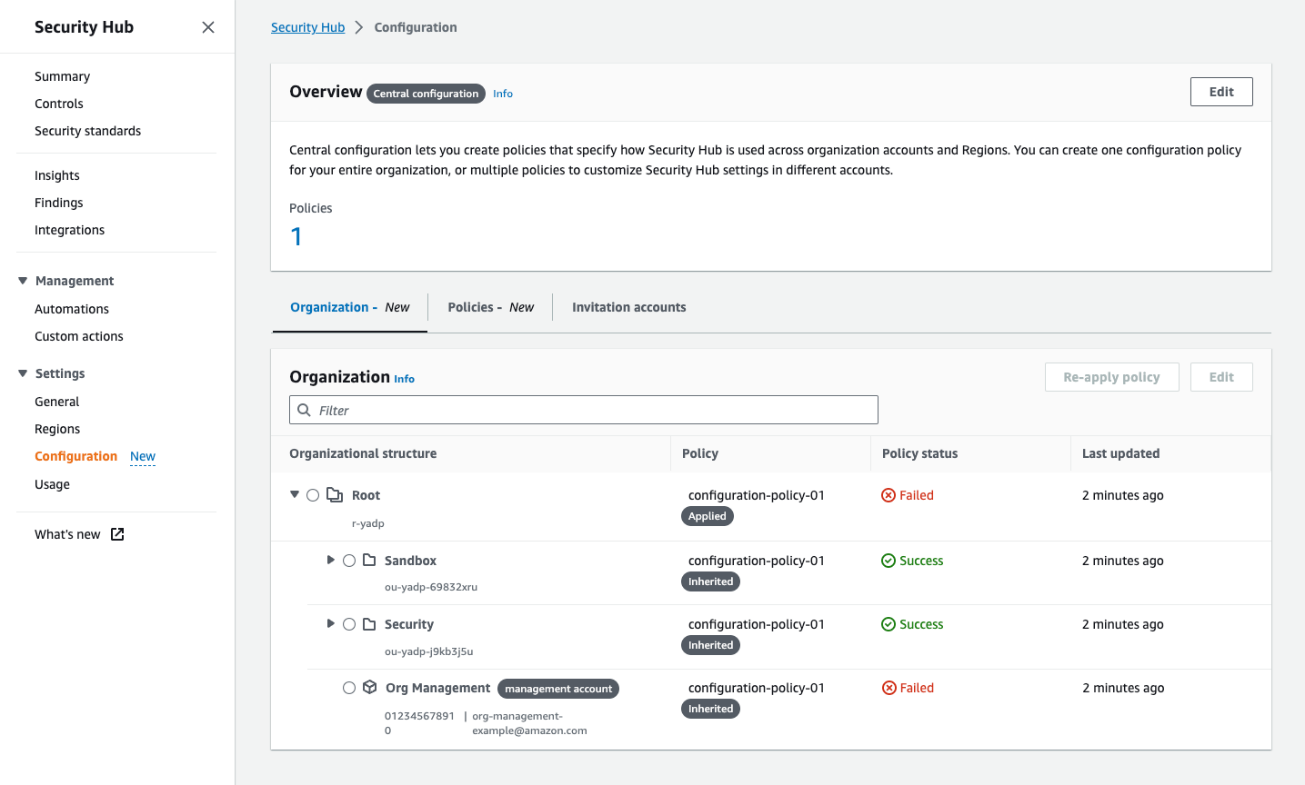 Figure 4: The Organization tab on the Configuration page shows all your organization accounts, if they are being managed by a policy, and the policy status for each account and OU
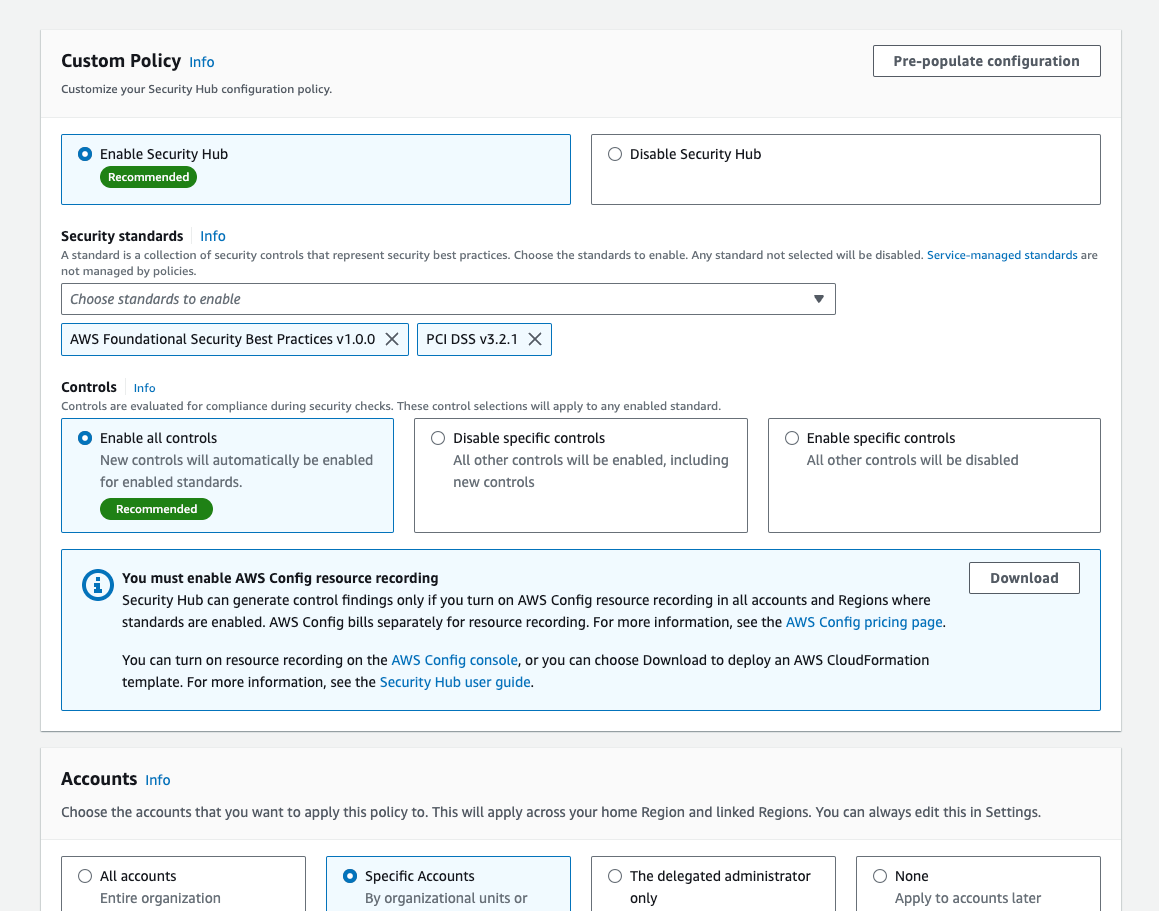
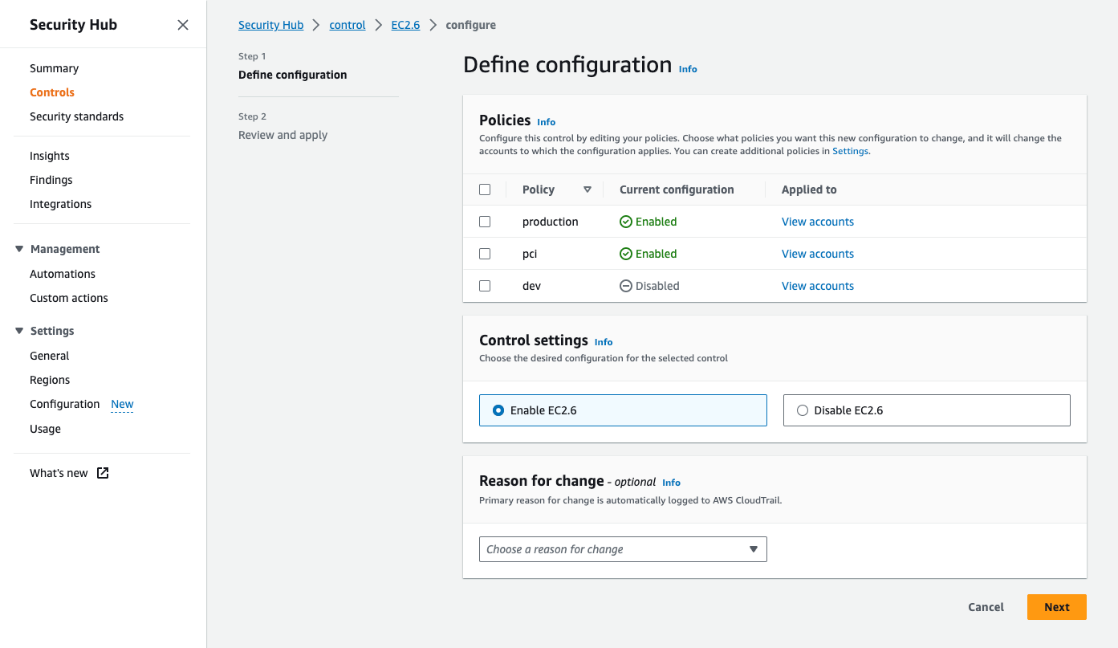
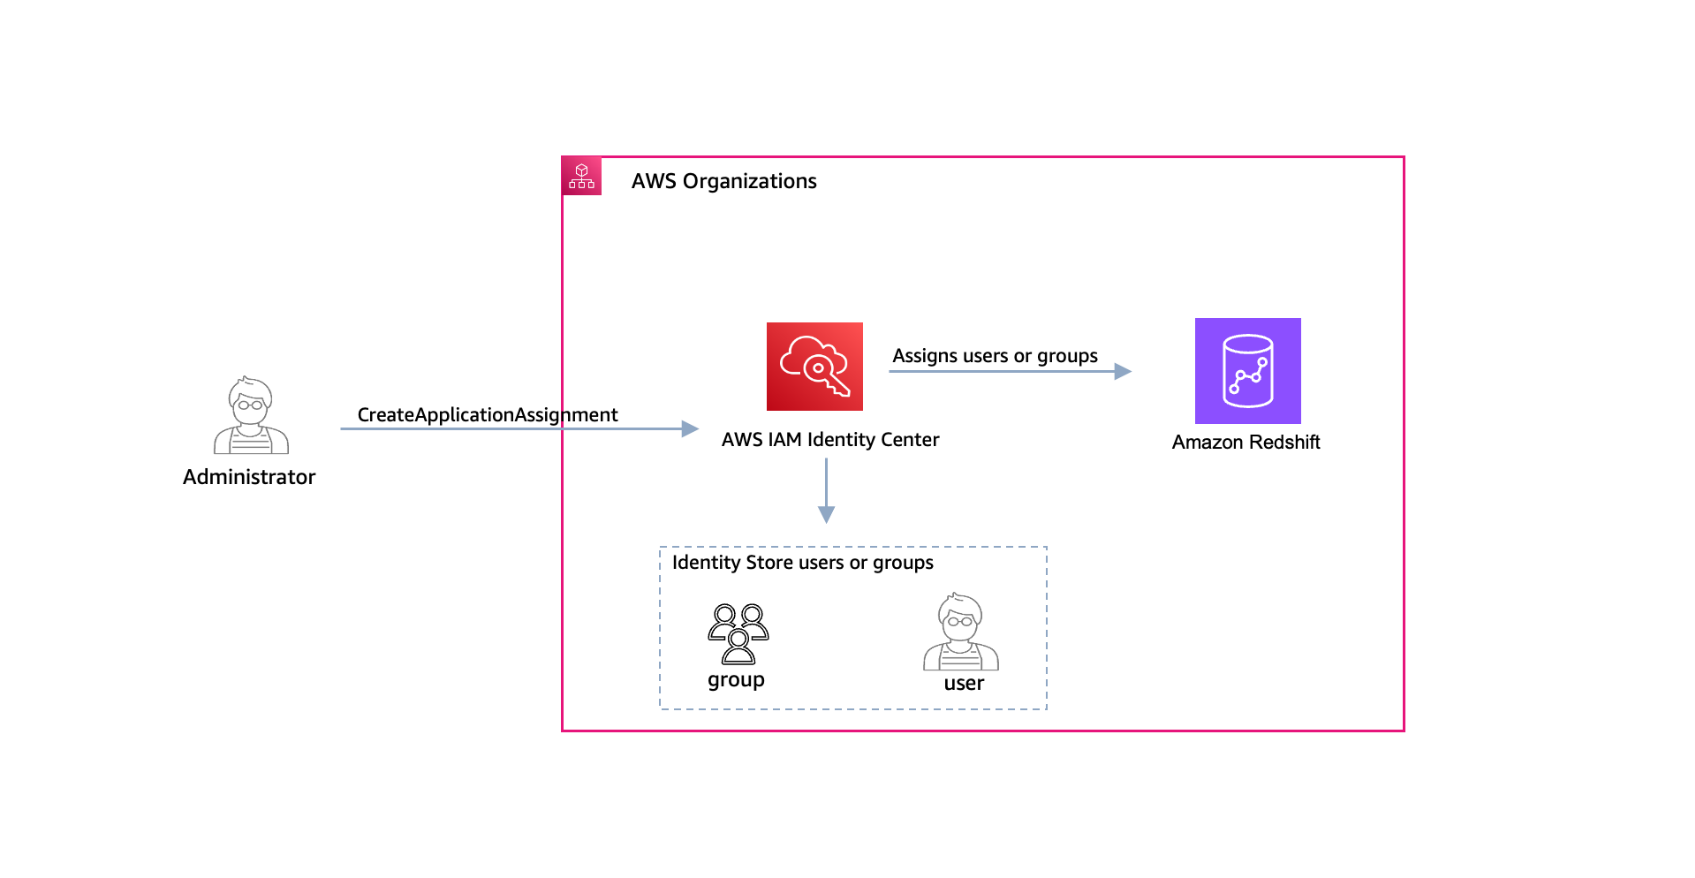
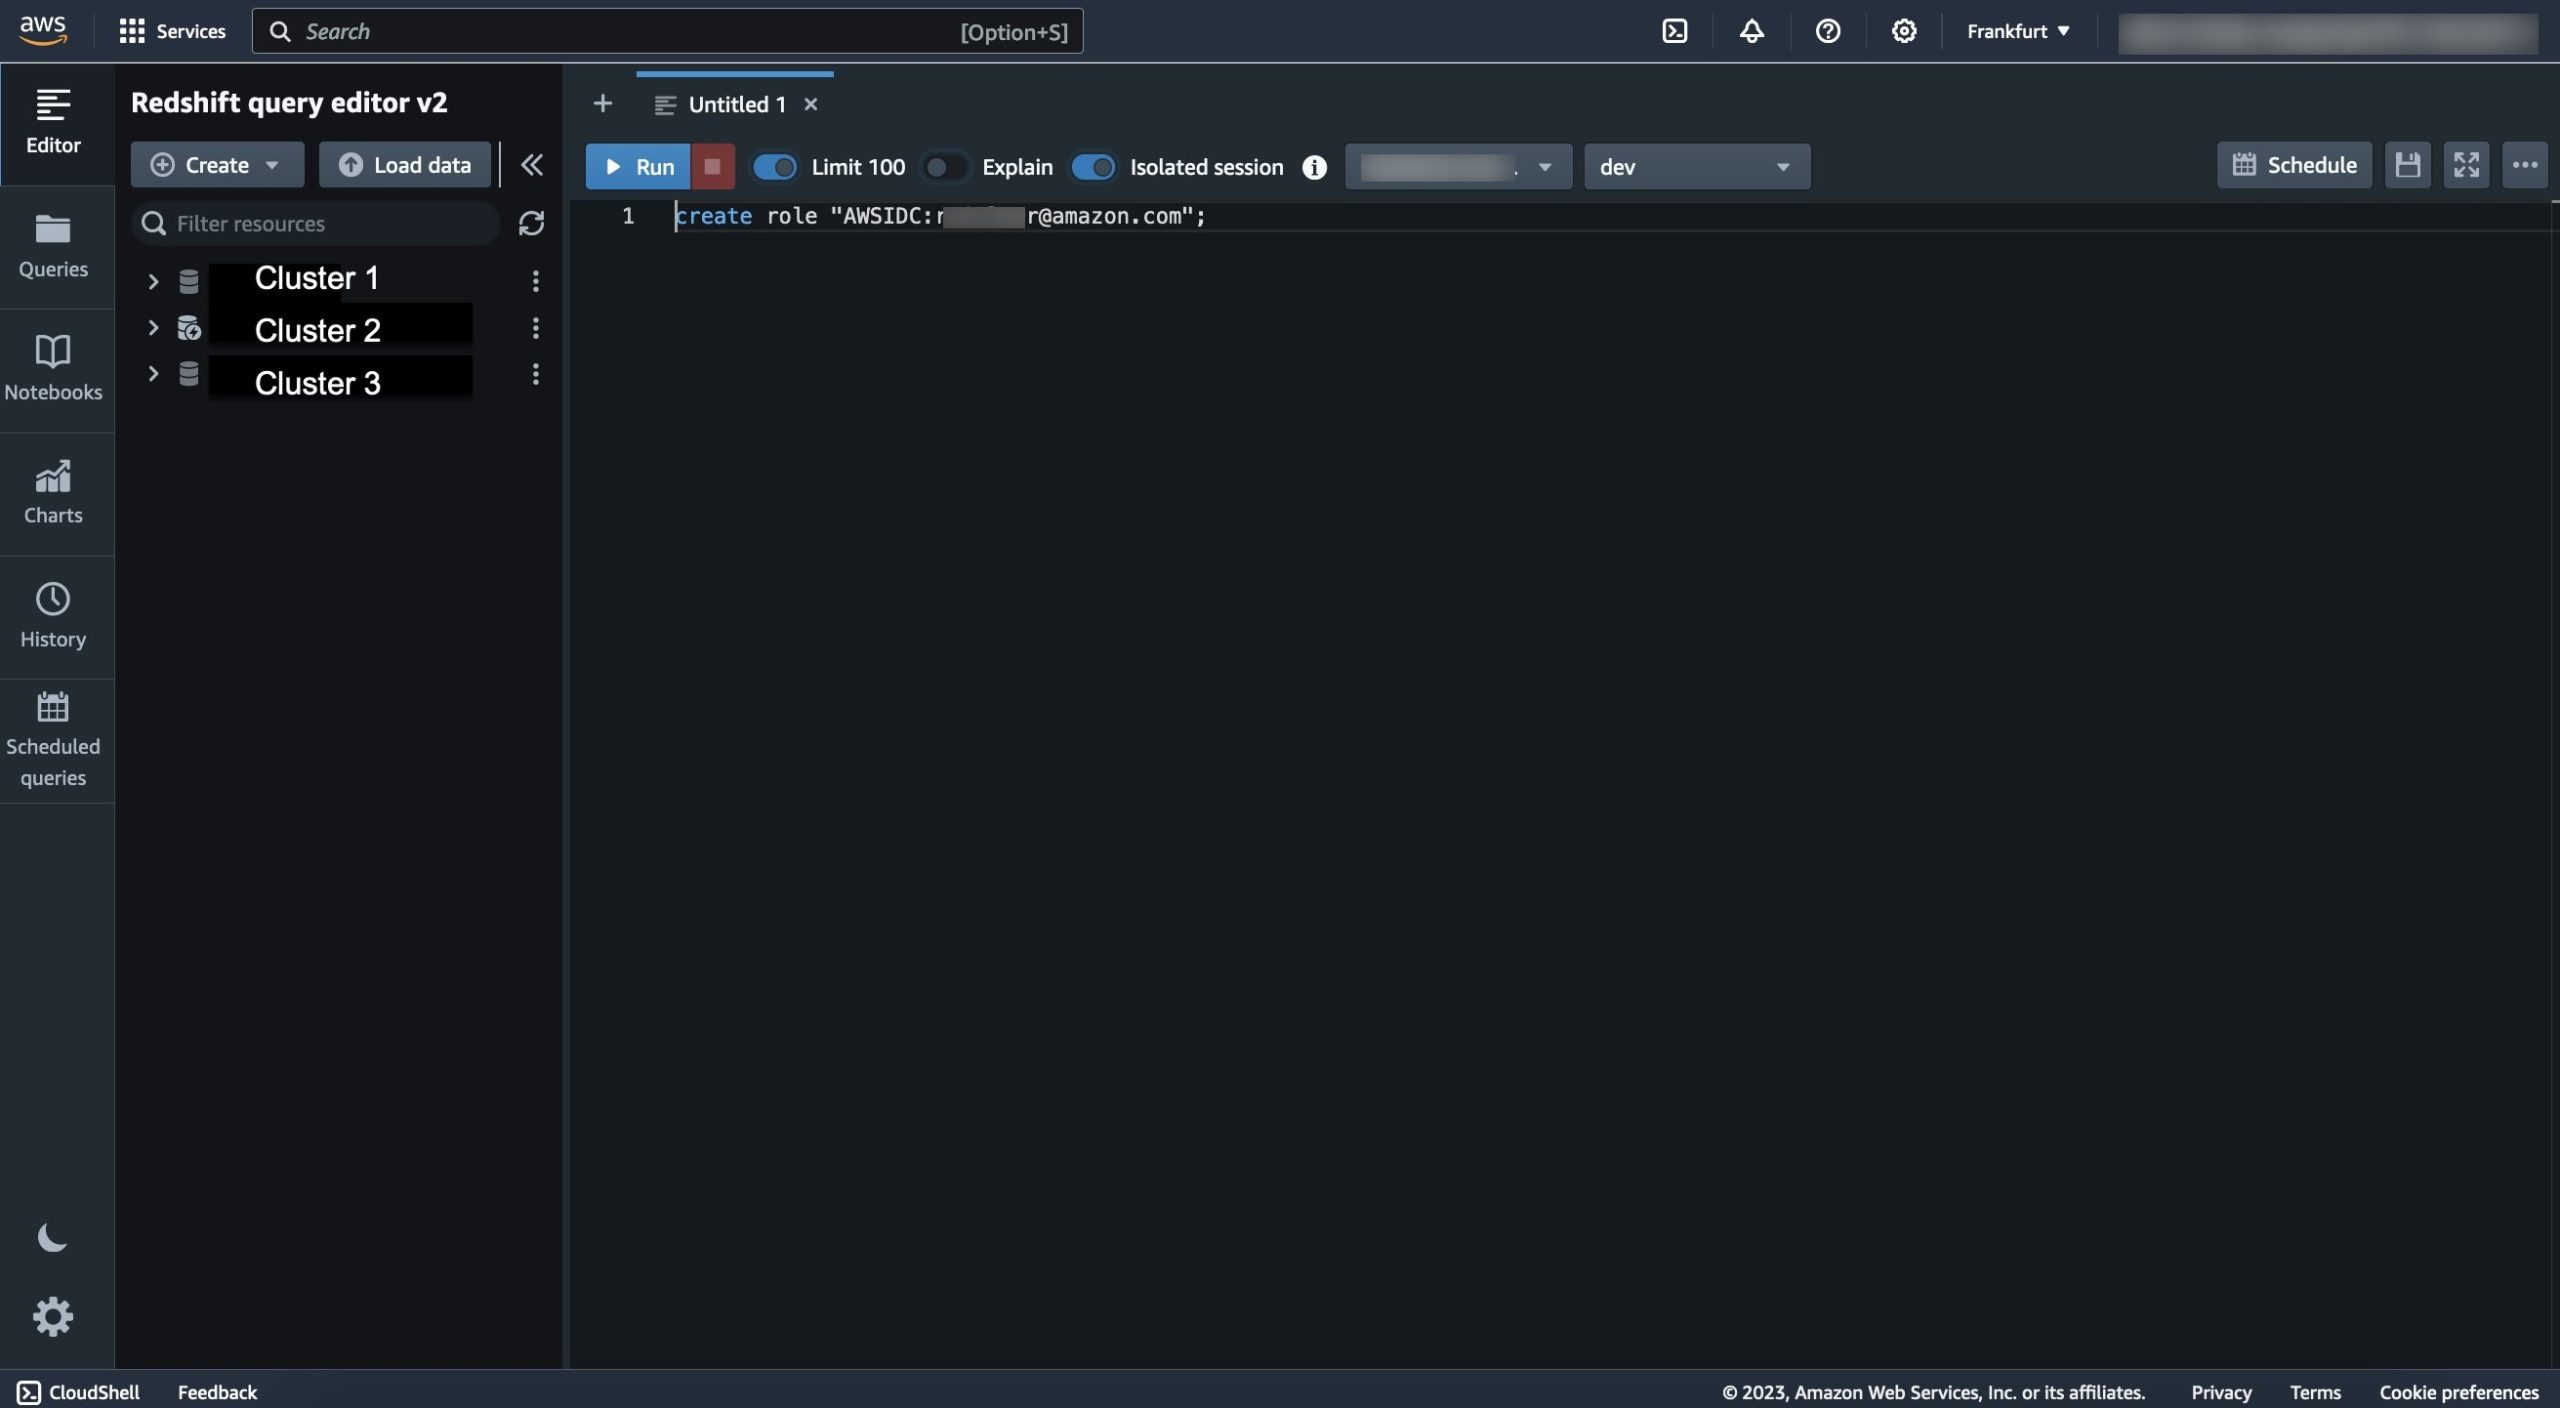


 Sandeep Adwankar is a Senior Technical Product Manager at AWS. Based in the California Bay Area, he works with customers around the globe to translate business and technical requirements into products that enable customers to improve how they manage, secure, and access data.
 Navnit Shukla serves as an AWS Specialist Solution Architect with a focus on Analytics. He possesses a strong enthusiasm for assisting clients in discovering valuable insights from their data. Through his expertise, he constructs innovative solutions that empower businesses to arrive at informed, data-driven choices. Notably, Navnit Shukla is the accomplished author of the book titled Data Wrangling on AWS. He can be reached via
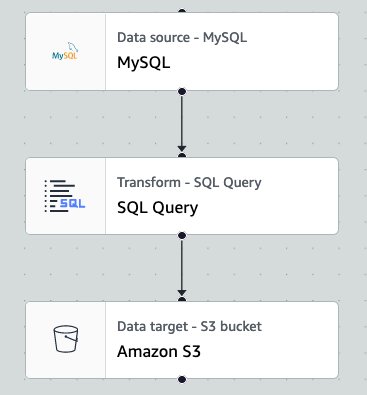
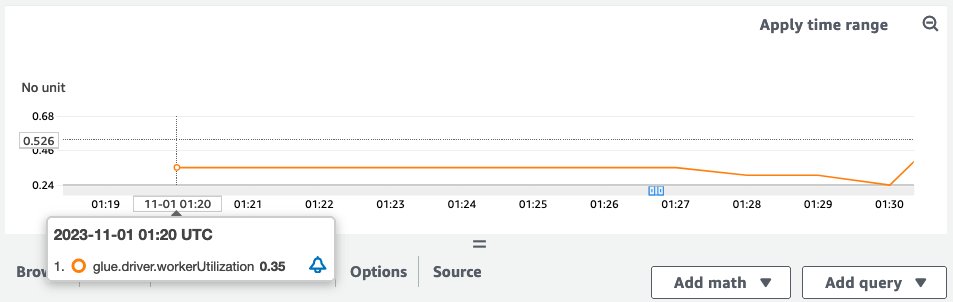
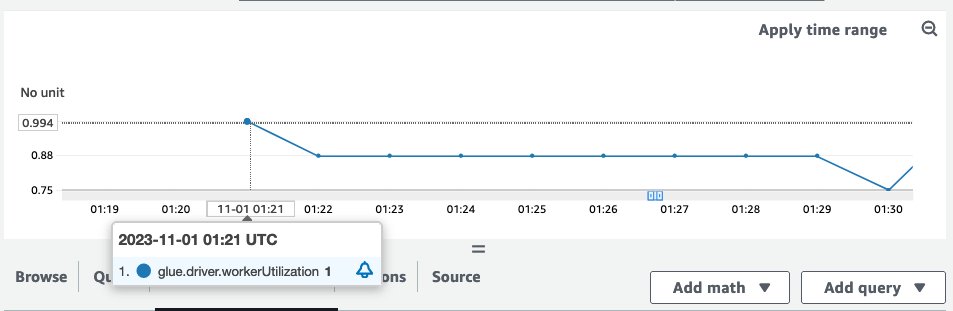
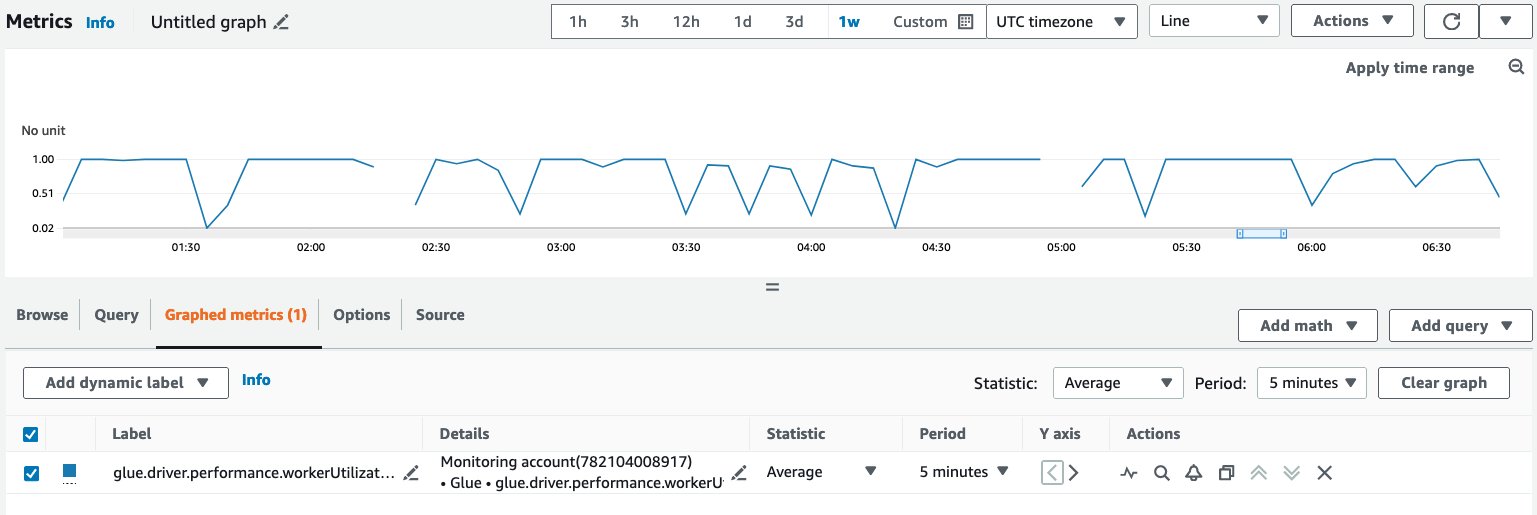
 Noritaka Sekiyama is a Principal Big Data Architect on the AWS Glue team. He is responsible for building software artifacts to help customers. In his spare time, he enjoys cycling with his new road bike.
 Shenoda Guirguis is a Senior Software Development Engineer on the AWS Glue team. His passion is in building scalable and distributed Data Infrastructure/Processing Systems. When he gets a chance, Shenoda enjoys reading and playing soccer.
 Sean Ma is a Principal Product Manager on the AWS Glue team. He has an 18+ year track record of innovating and delivering enterprise products that unlock the power of data for users. Outside of work, Sean enjoys scuba diving and college football.
 Mohit Saxena is a Senior Software Development Manager on the AWS Glue team. His team focuses on building distributed systems to enable customers with interactive and simple to use interfaces to efficiently manage and transform petabytes of data seamlessly across data lakes on Amazon S3, databases and data-warehouses on cloud.
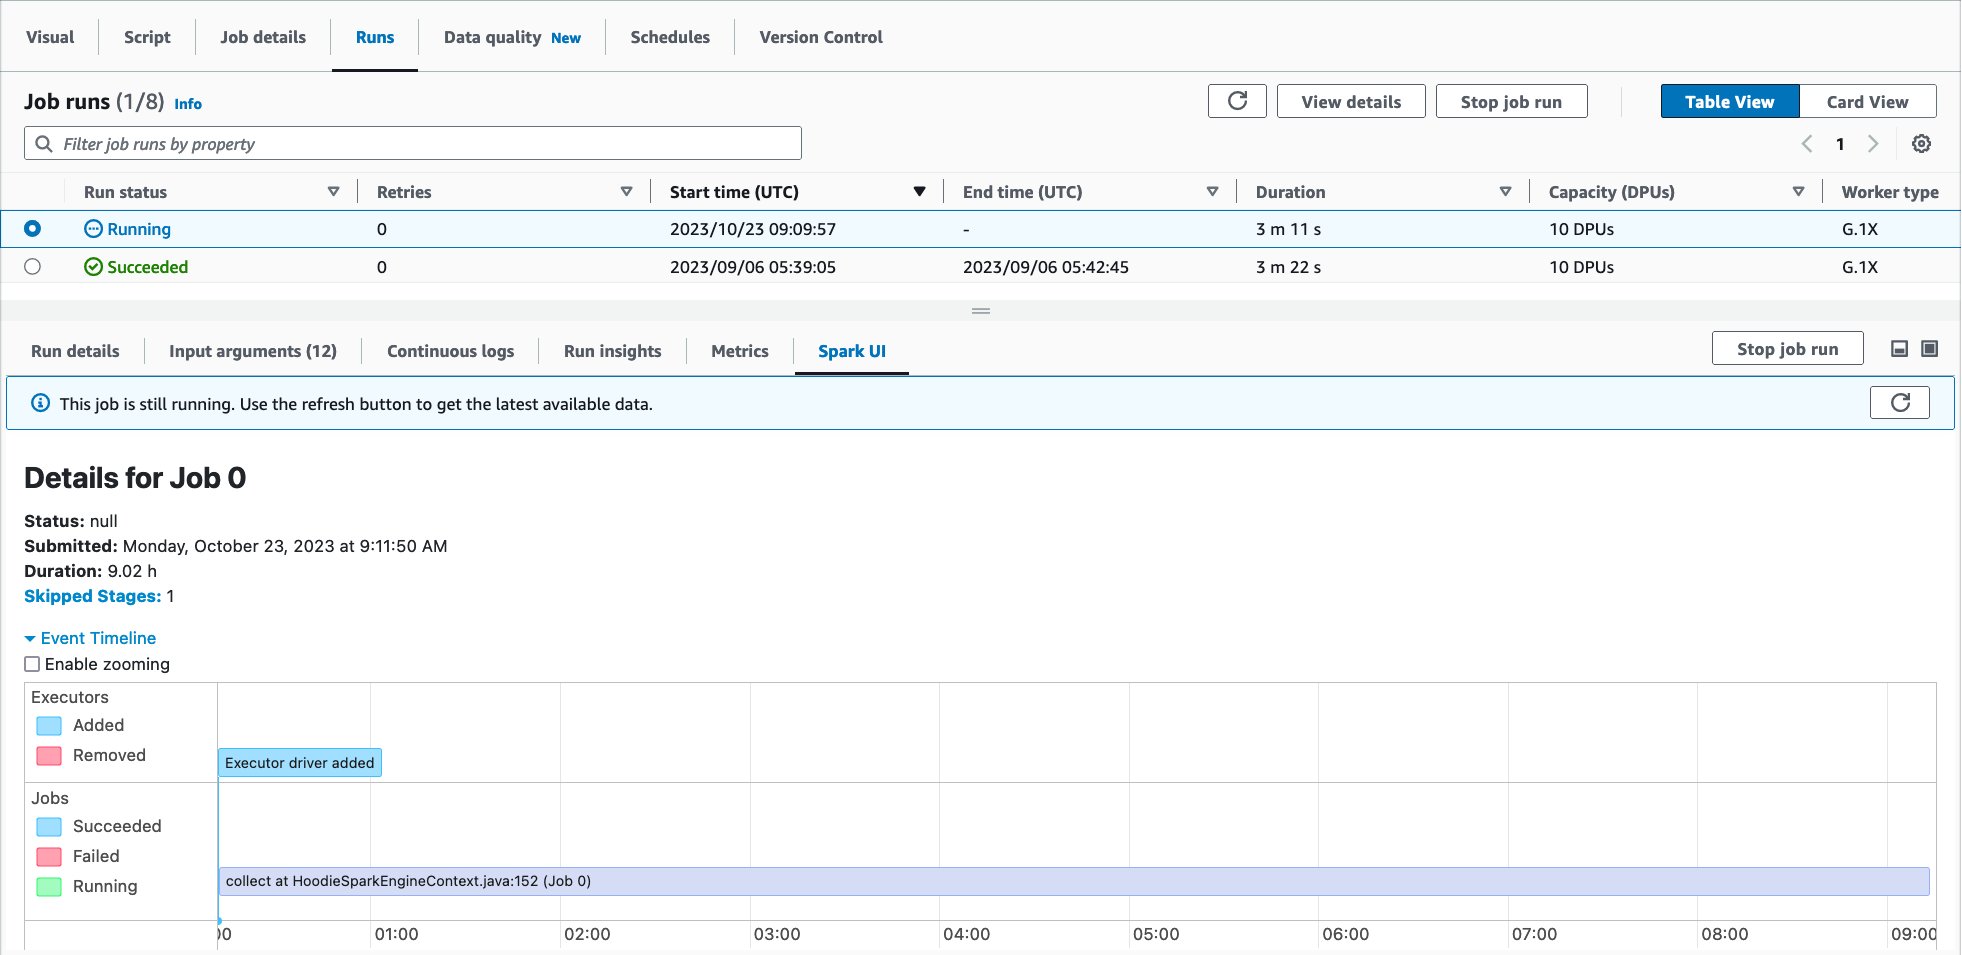
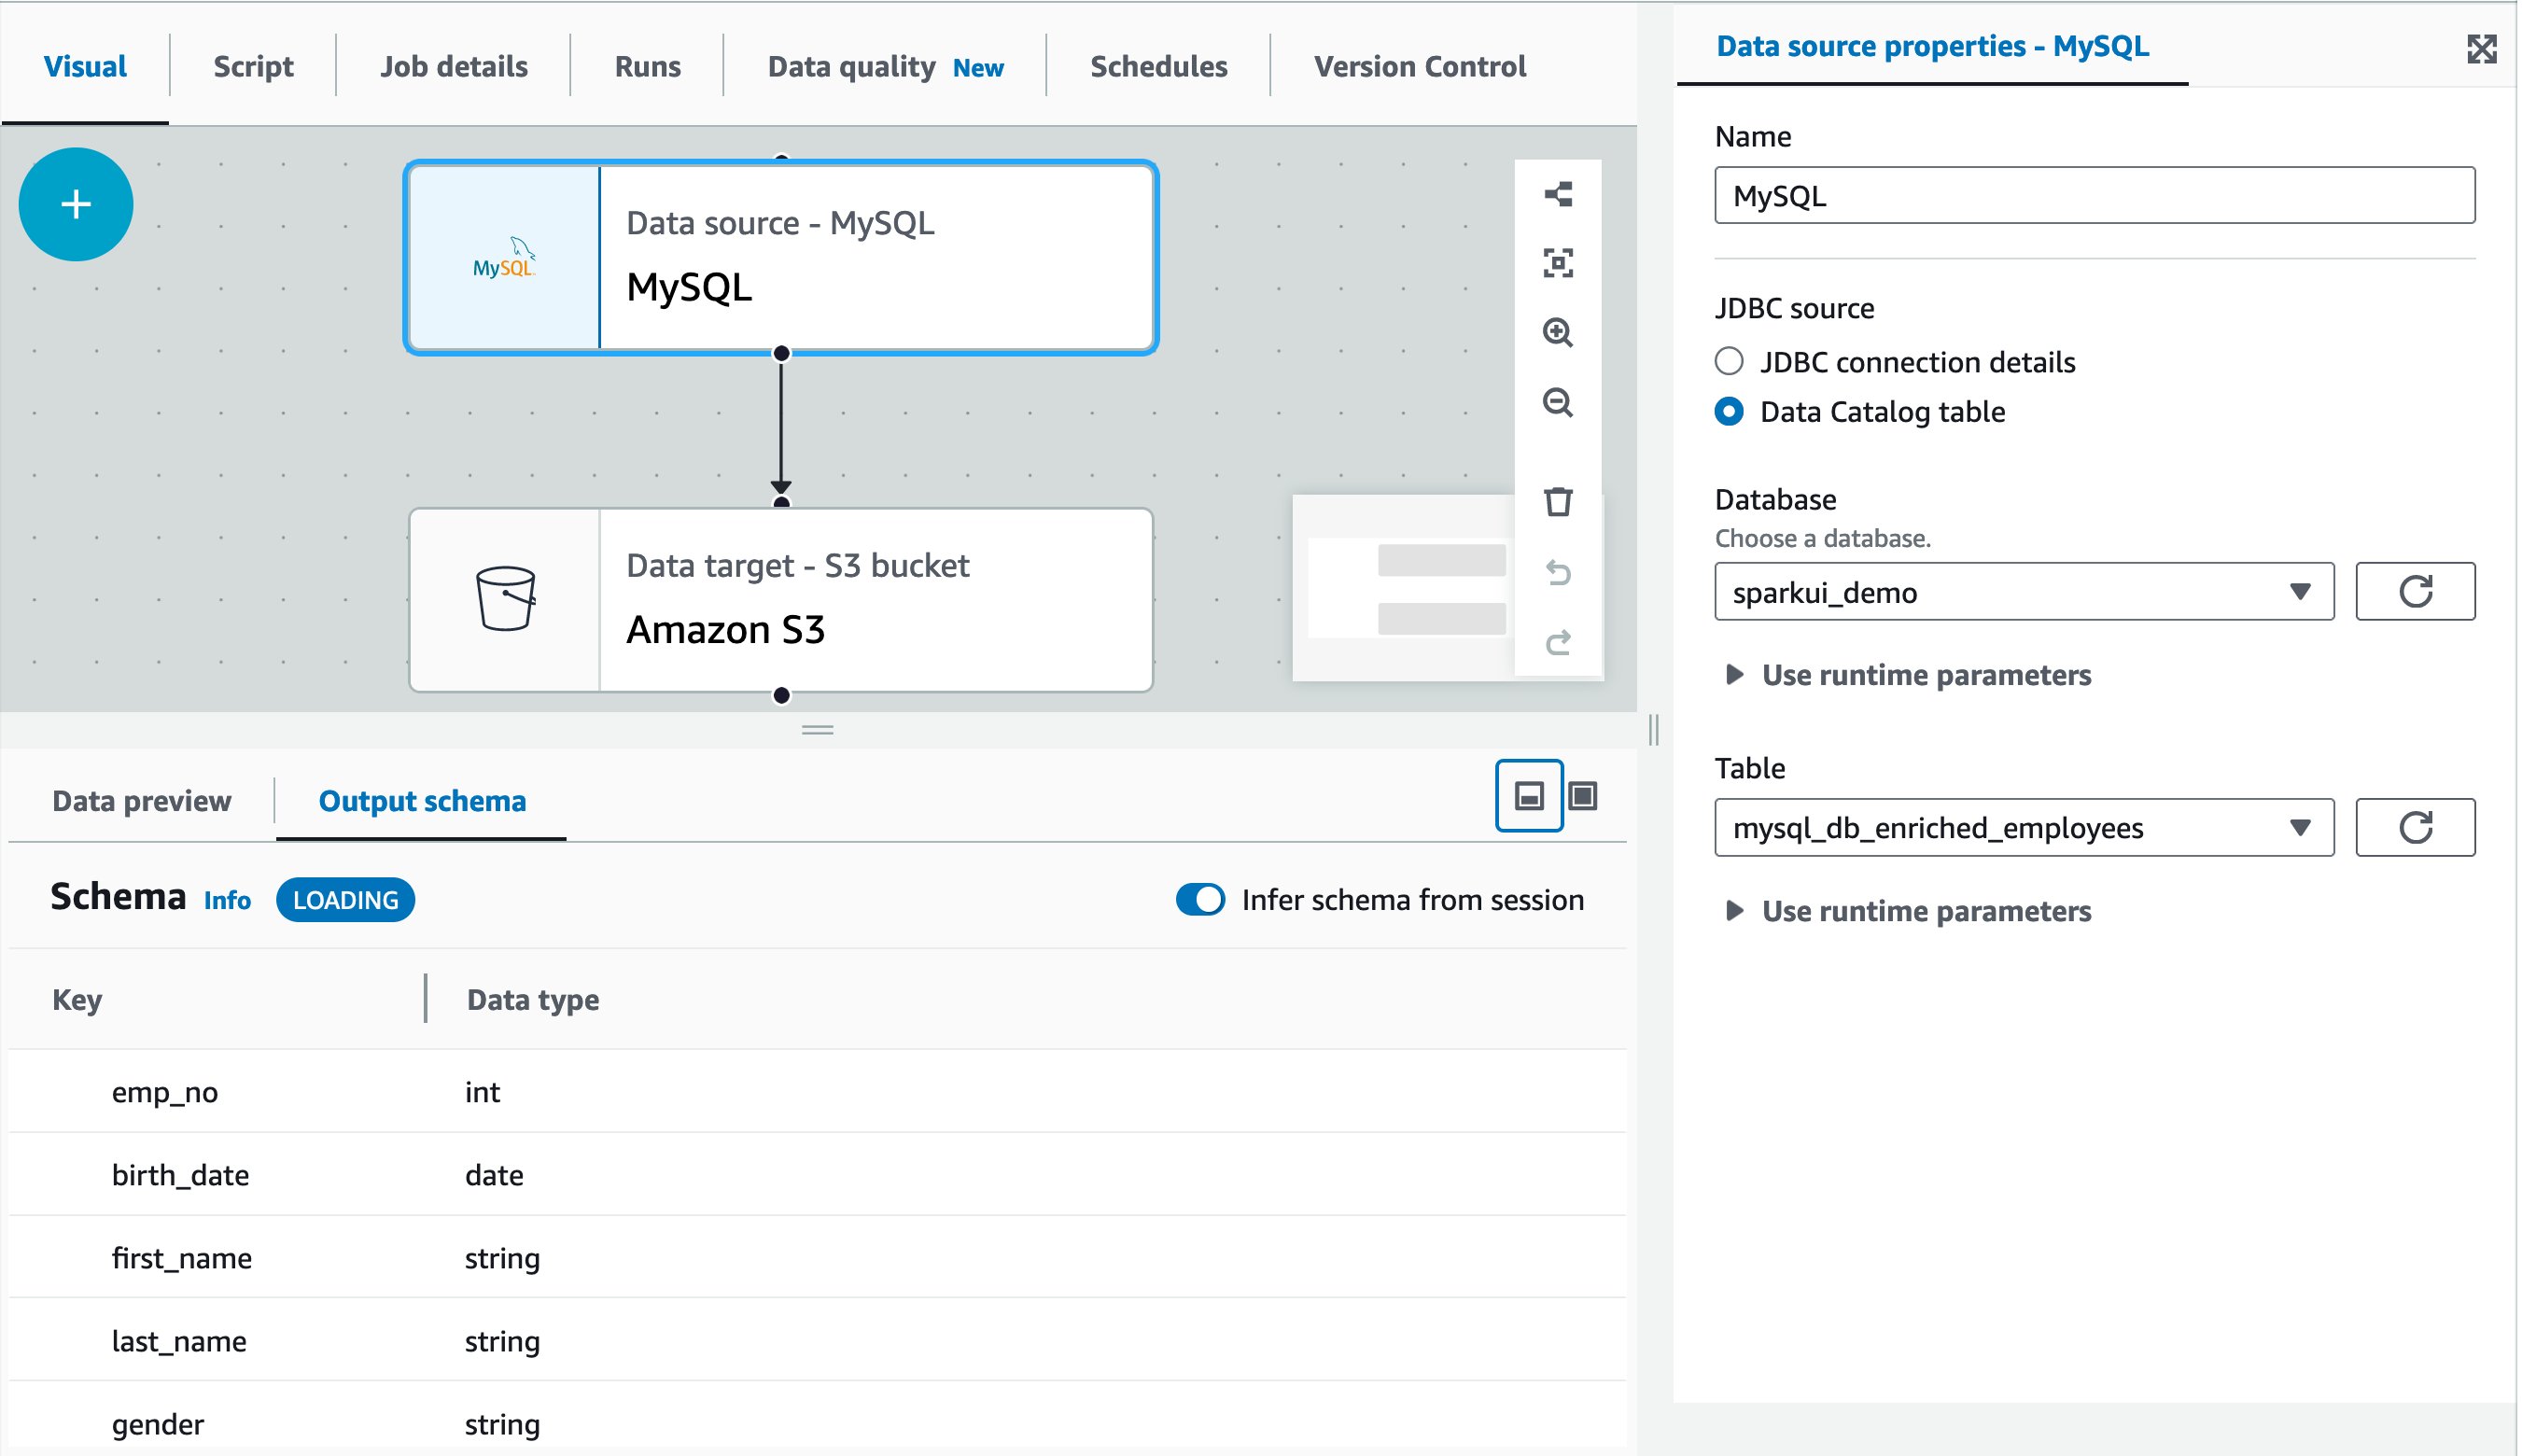
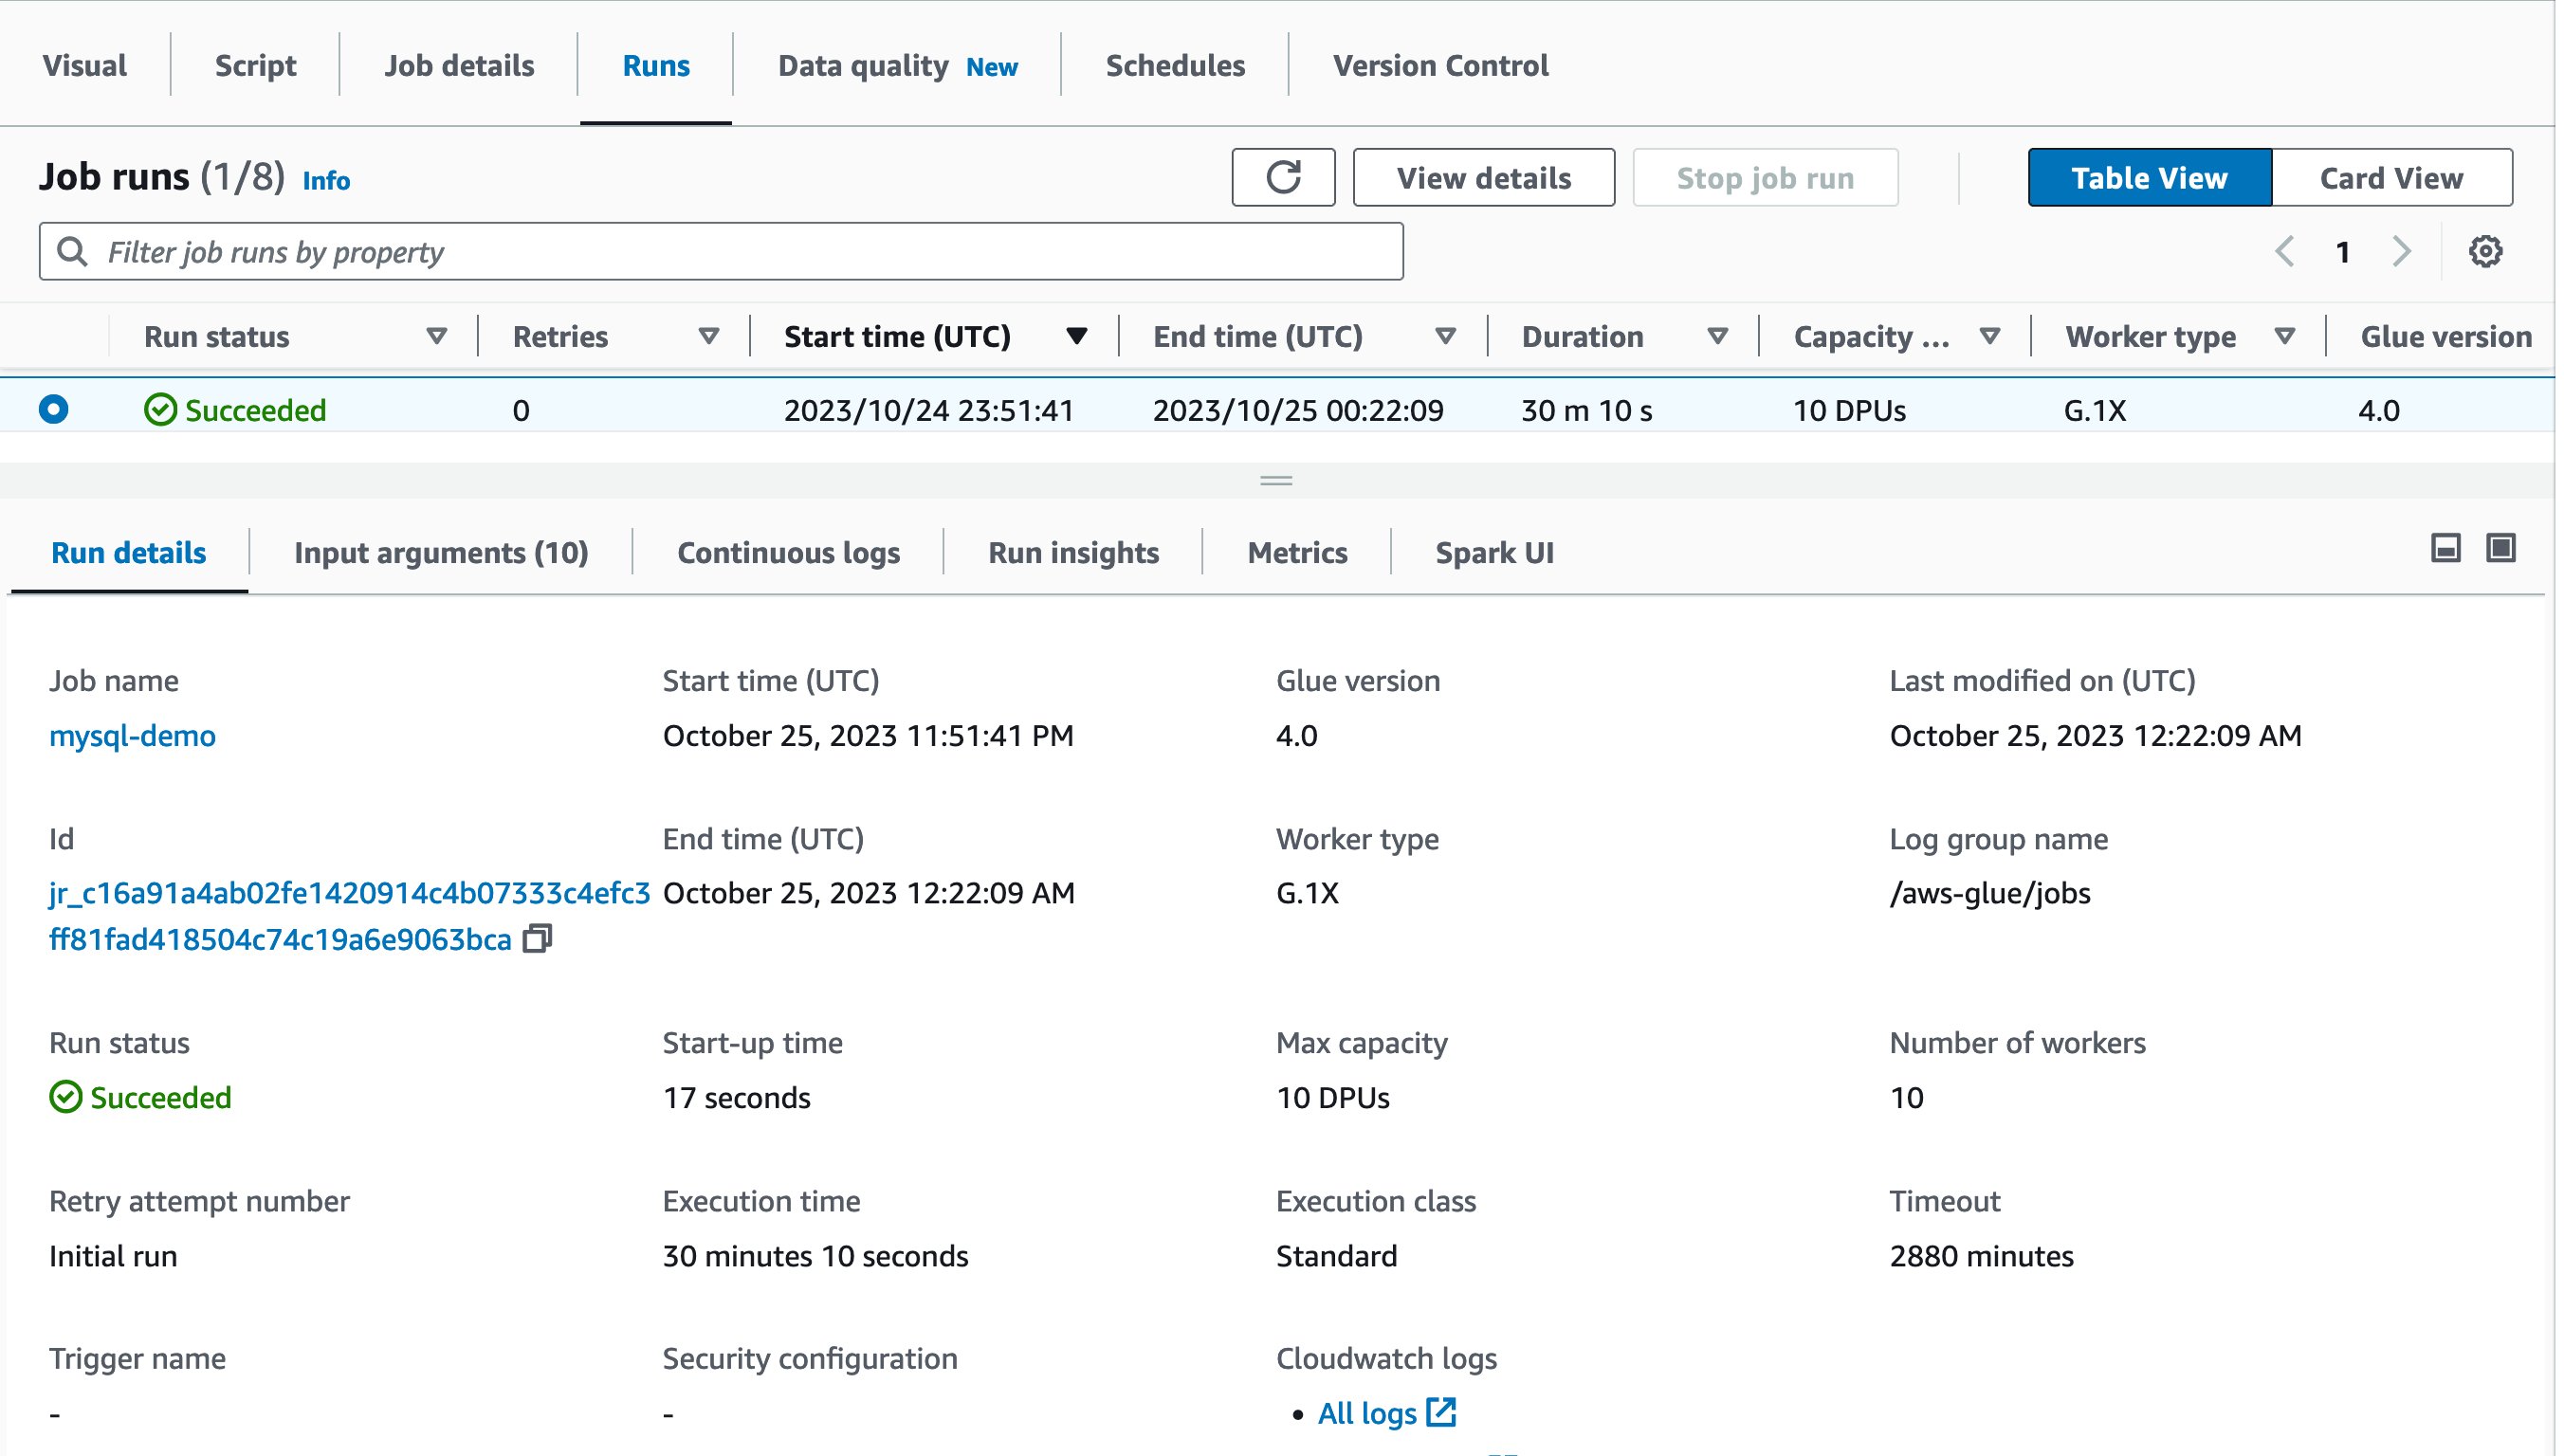

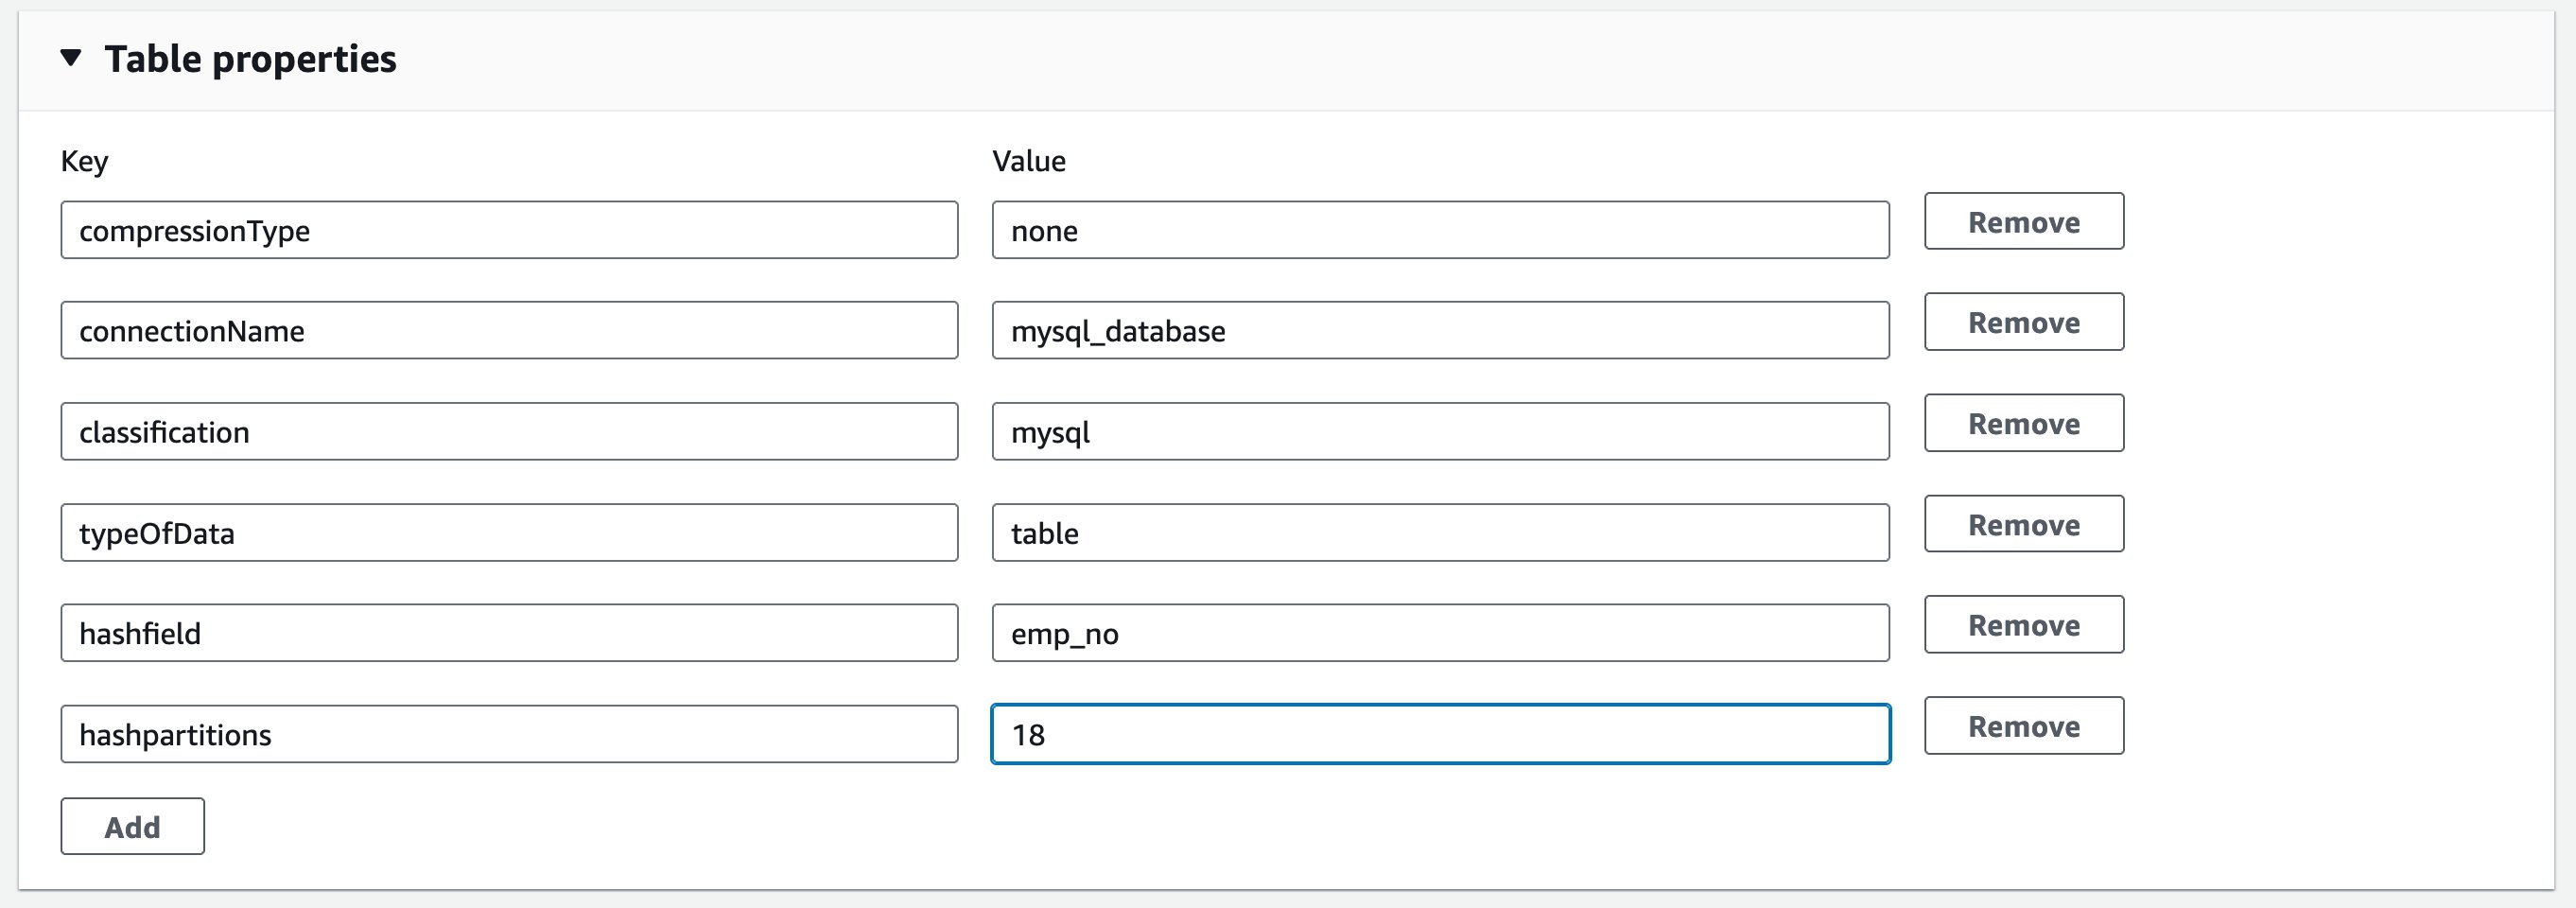
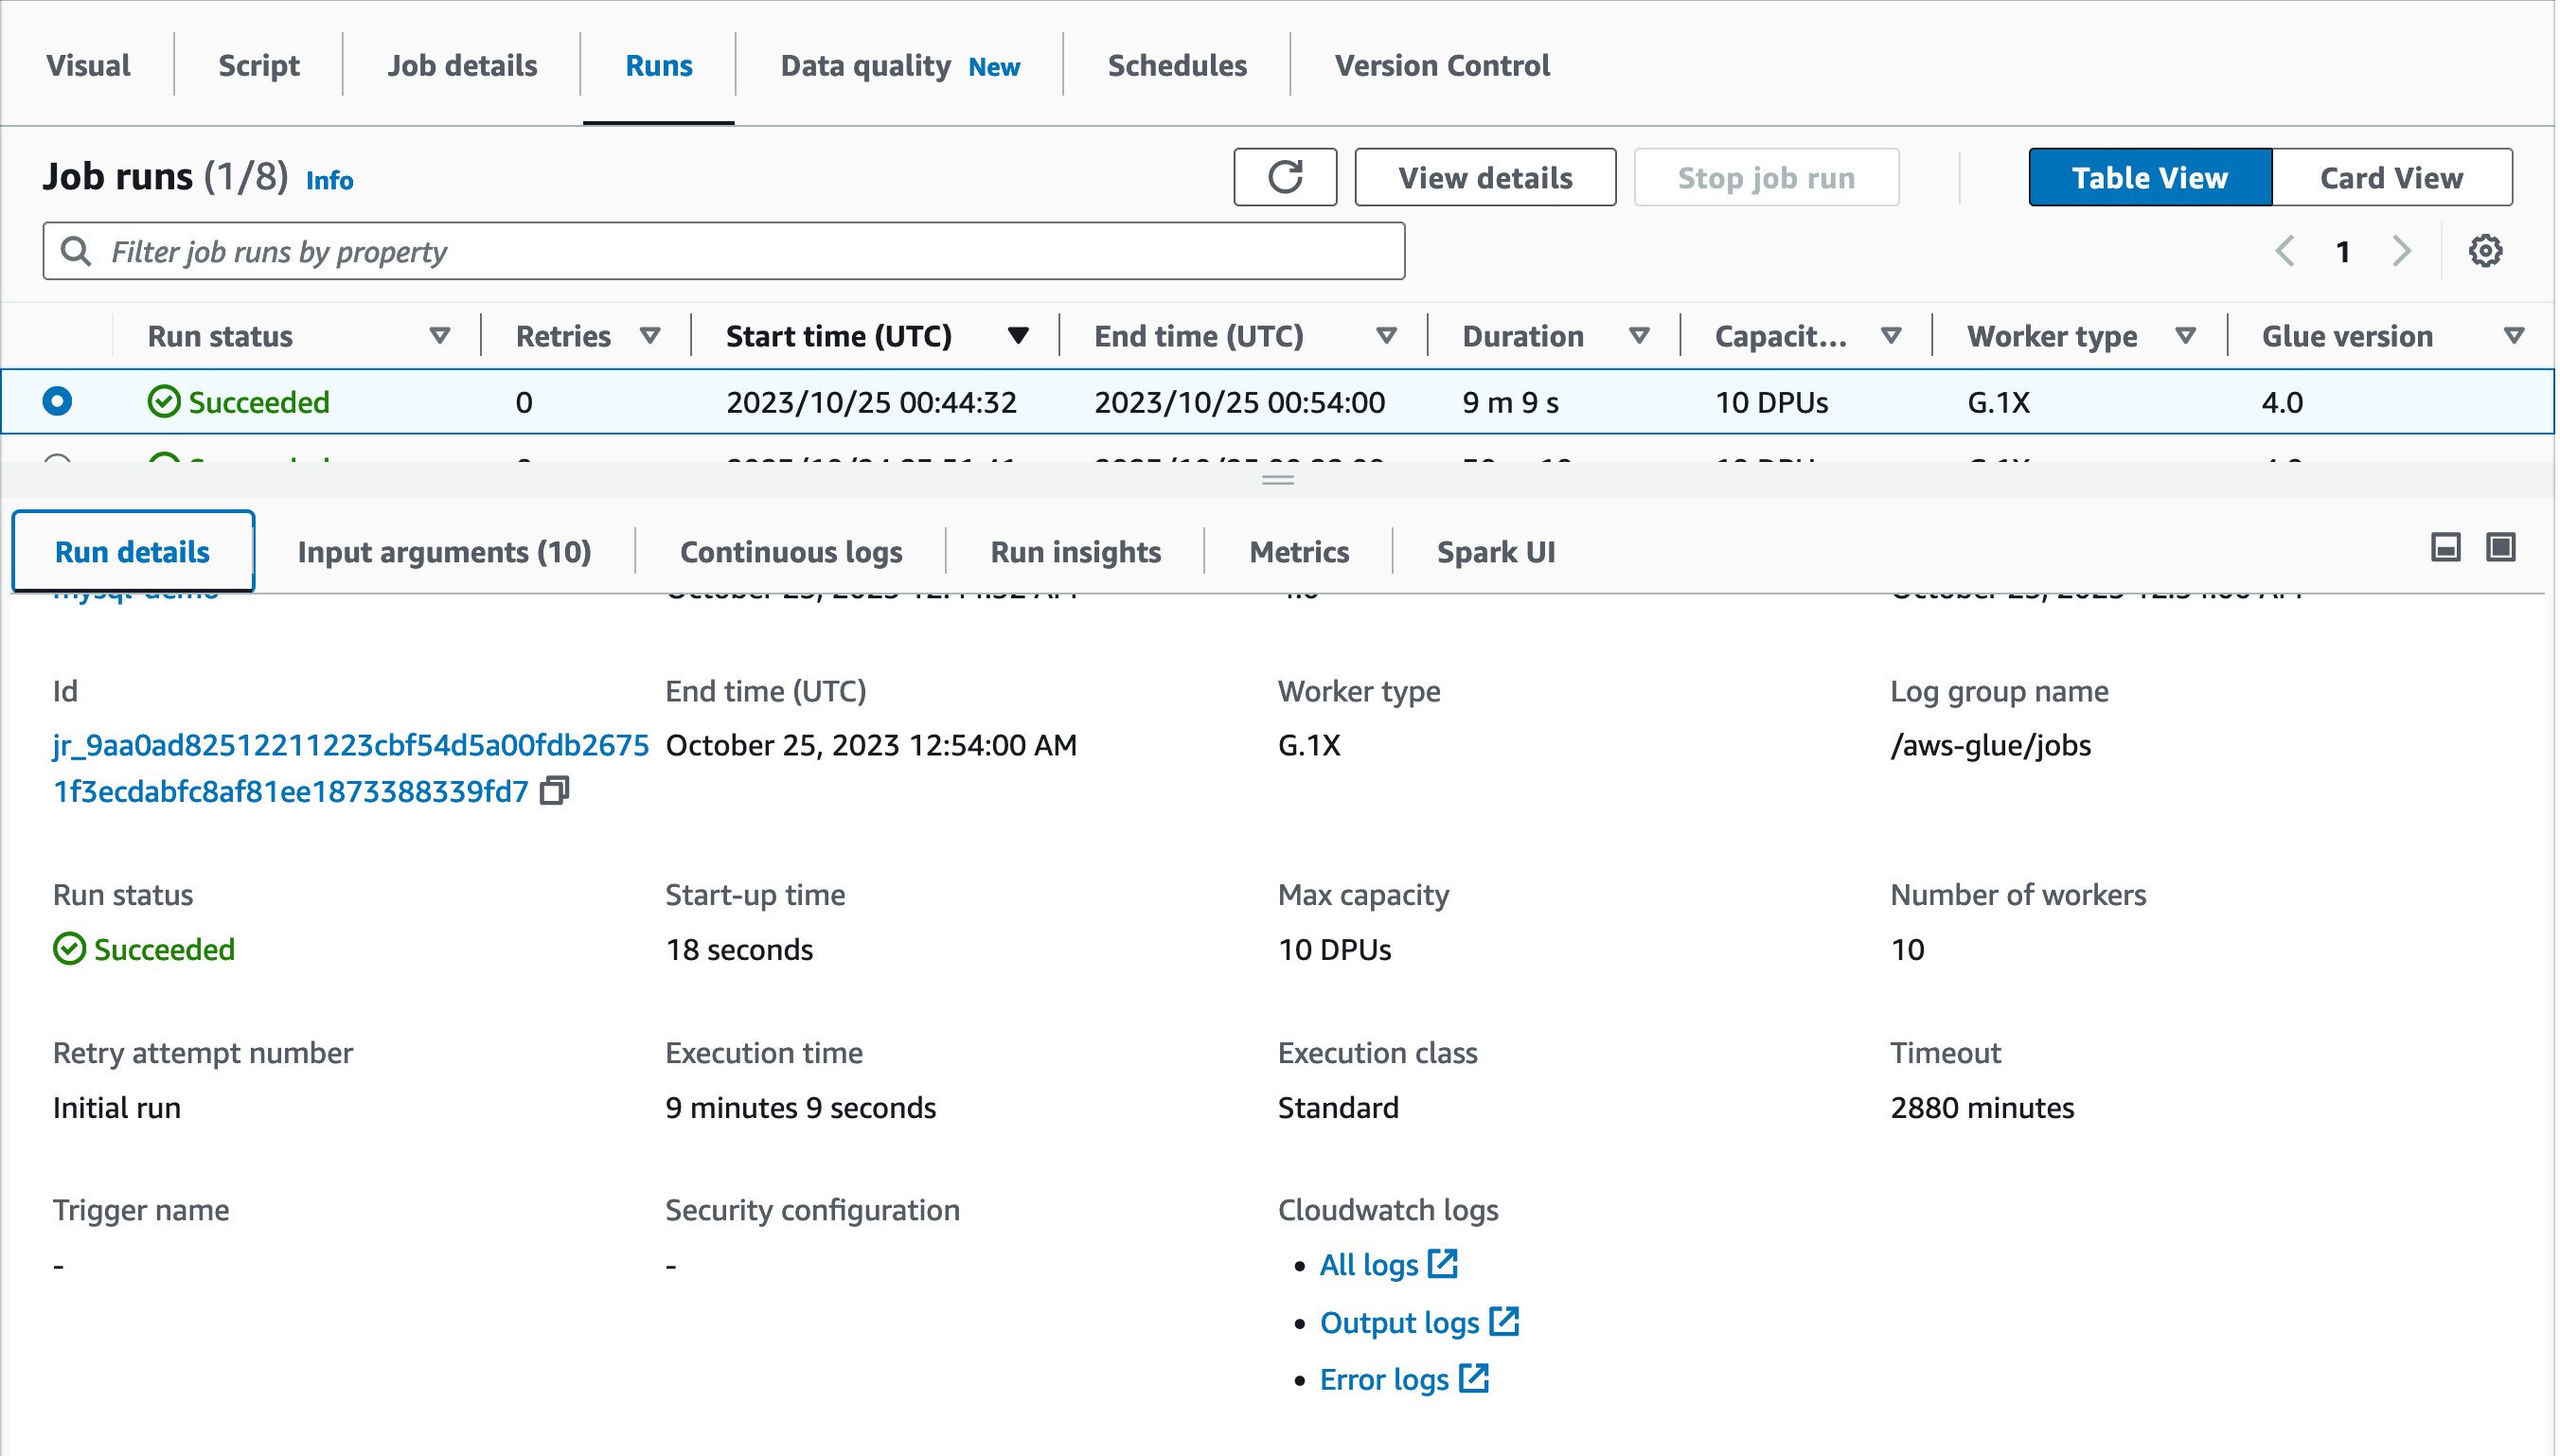
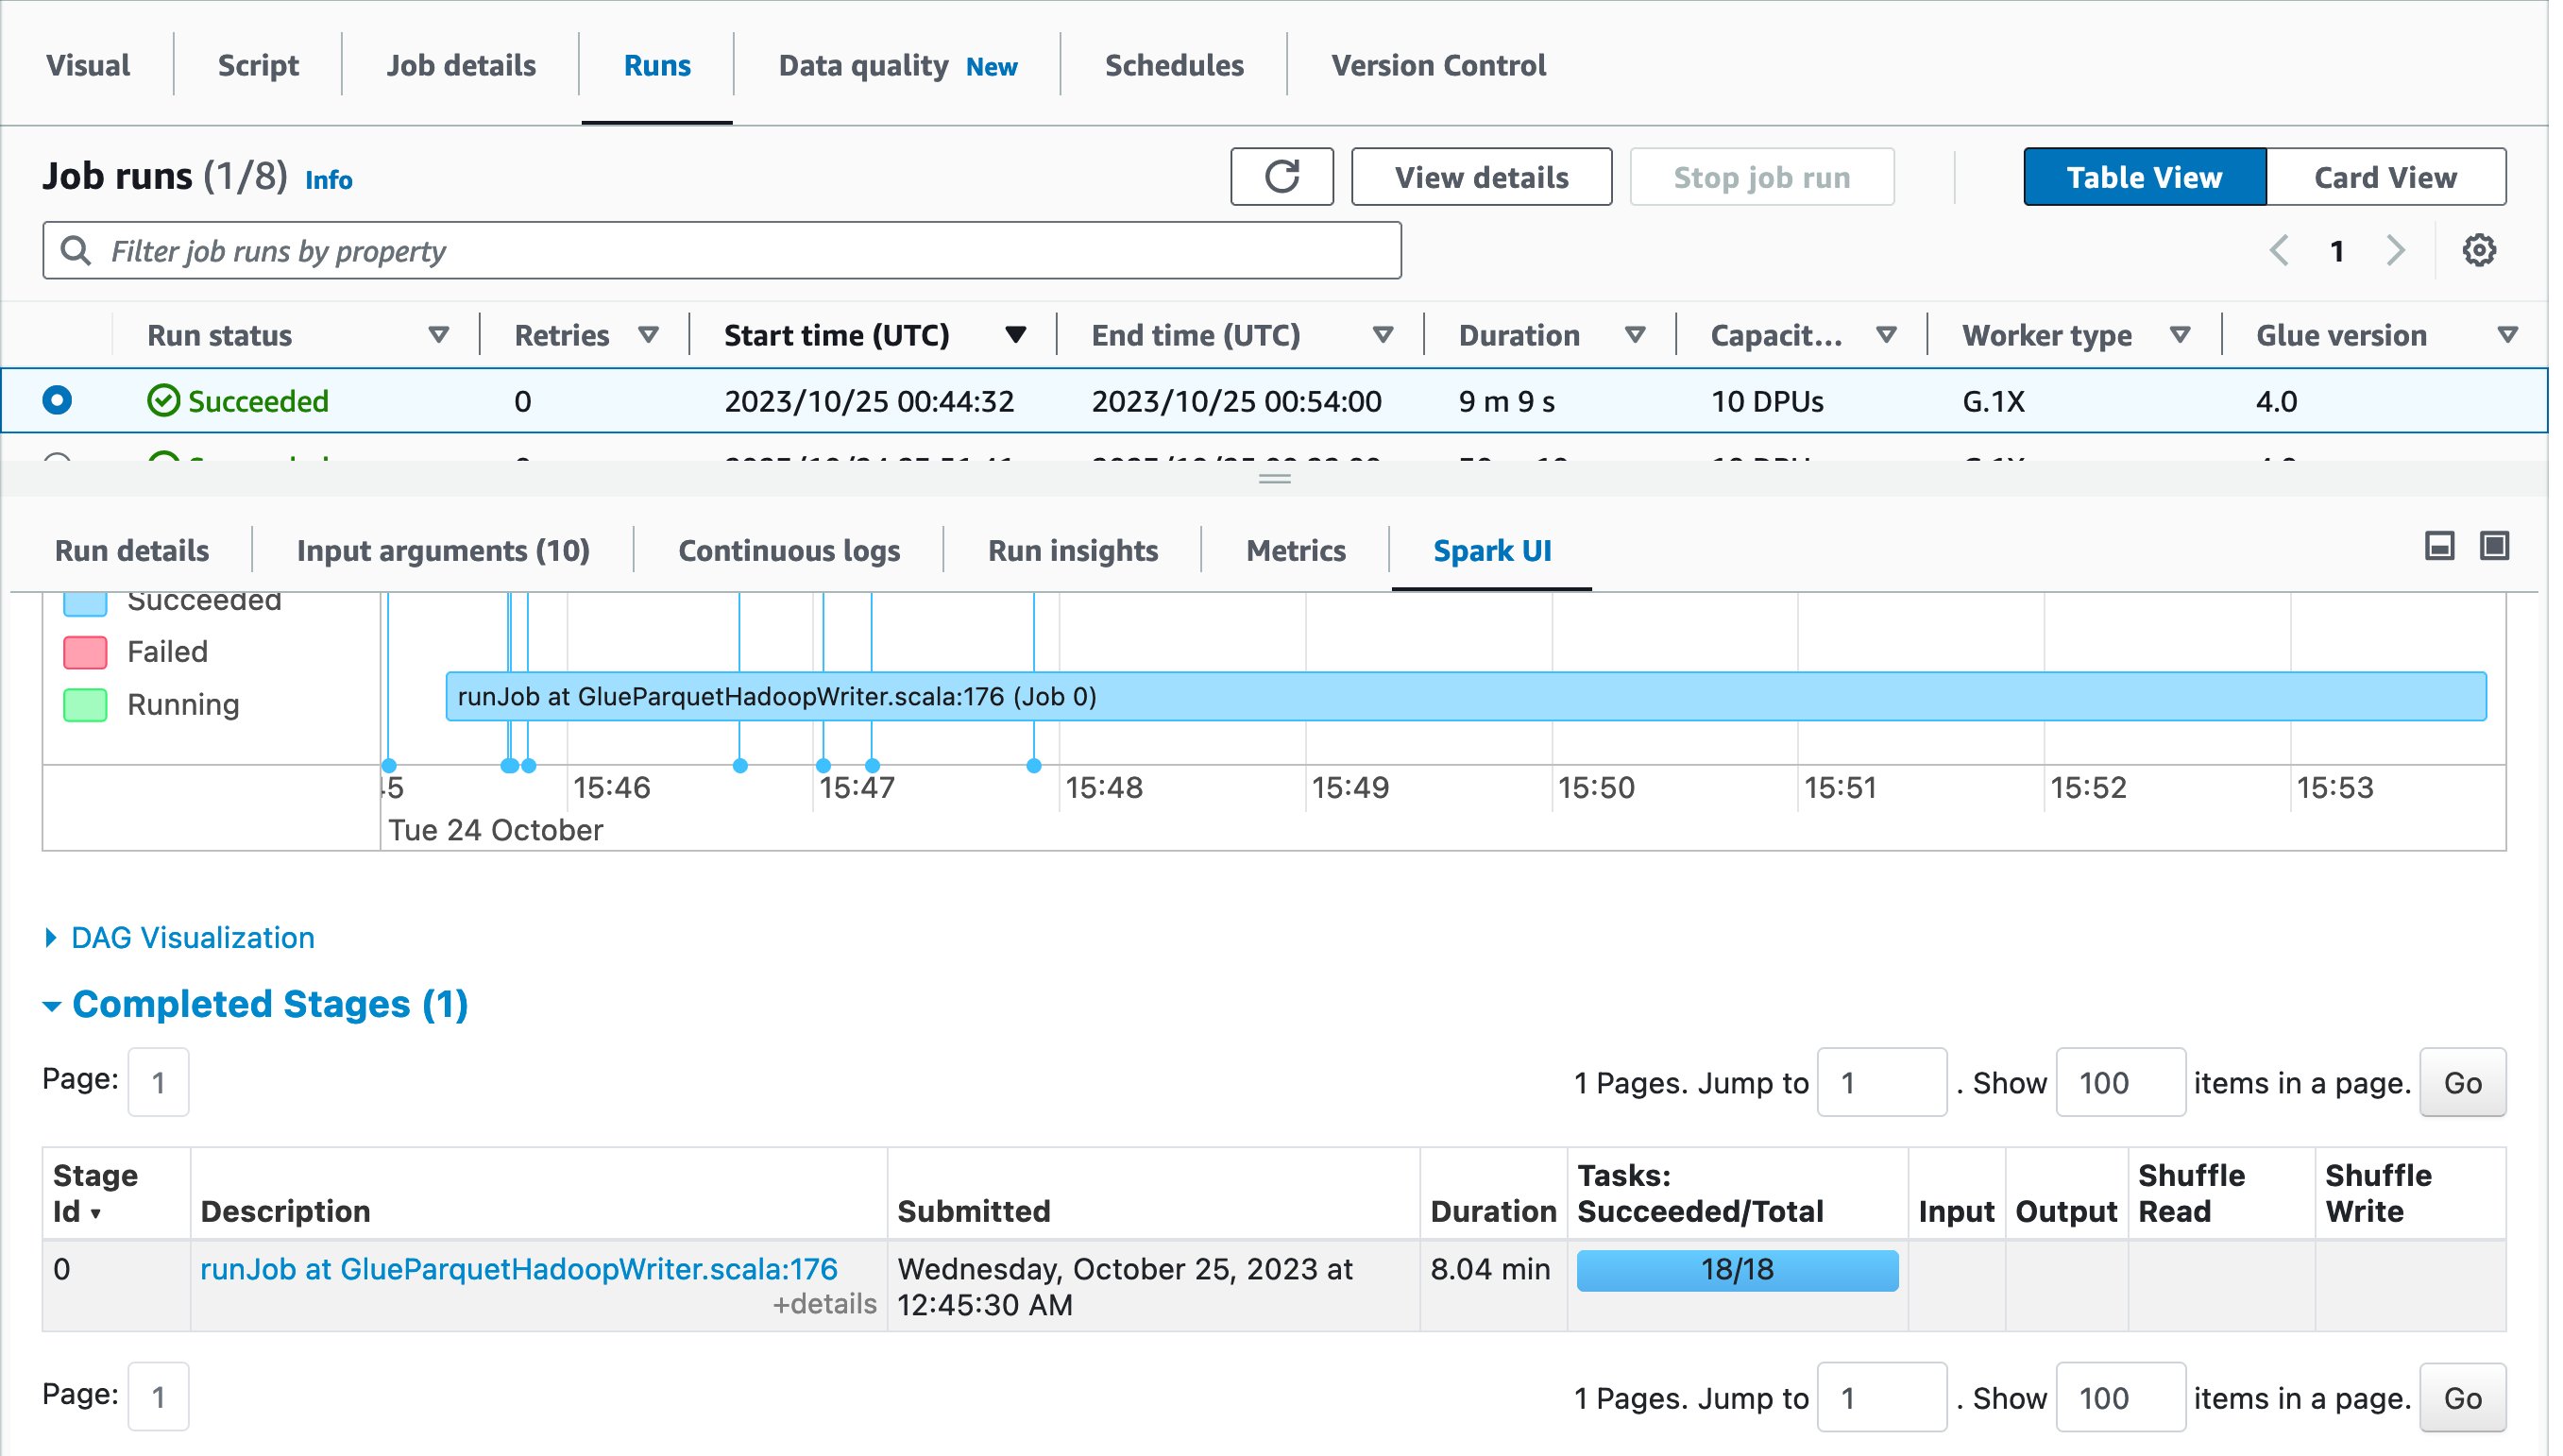
 Alexandra Tello is a Senior Front End Engineer with the AWS Glue team in New York City. She is a passionate advocate for usability and accessibility. In her free time, she’s an espresso enthusiast and enjoys building mechanical keyboards.
 Matt Sampson is a Software Development Manager on the AWS Glue team. He loves working with his other Glue team members to make services that our customers benefit from. Outside of work, he can be found fishing and maybe singing karaoke.
 Matt Su is a Senior Product Manager on the AWS Glue team. He enjoys helping customers uncover insights and make better decisions using their data with AWS Analytic services. In his spare time, he enjoys skiing and gardening.

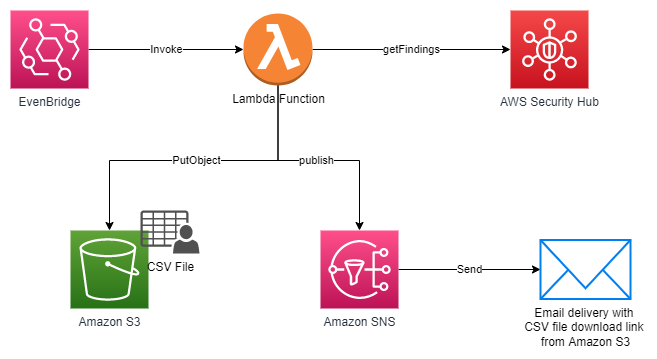


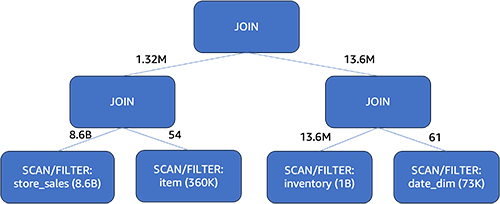

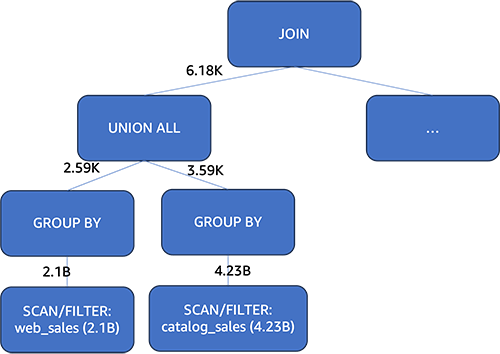
 Darshit Thakkar is a Technical Product Manager with AWS and works with the Amazon Athena team based out of Boston, Massachusetts.
 Wei Zheng is a Sr. Software Development Engineer with Amazon Athena. He joined AWS in 2021 and has been working on multiple performance improvements on Athena.
 Chuho Chang is a Software Development Engineer with Amazon Athena. He has been working on query optimizers for over a decade.
 Pathik Shah is a Sr. Analytics Architect on Amazon Athena. He joined AWS in 2015 and has been focusing in the big data analytics space since then, helping customers build scalable and robust solutions using AWS analytics services.
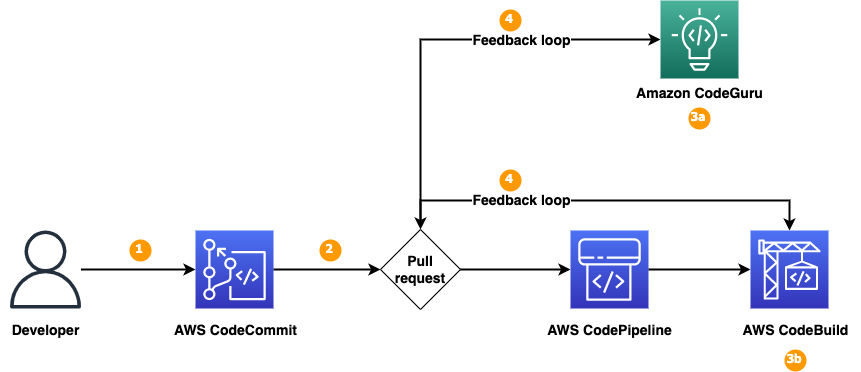
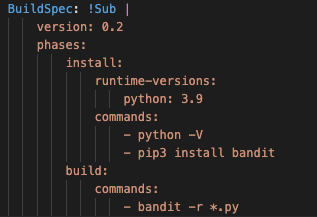


 Ramkumar Nottath is a Principal Solutions Architect at AWS focusing on Analytics services. He enjoys working with various customers to help them build scalable, reliable big data and analytics solutions. His interests extend to various technologies such as analytics, data warehousing, streaming, data governance, and machine learning. He loves spending time with his family and friends.
 Mert Hocanin is a Principal Big Data Architect at AWS within the AWS Lake Formation Product team. He has been with Amazon for over 10 years, and enjoys helping customers build their data lakes with a focus on governance on a wide variety of services. When he isn’t helping customers build data lakes, he spends his time with his family and traveling.
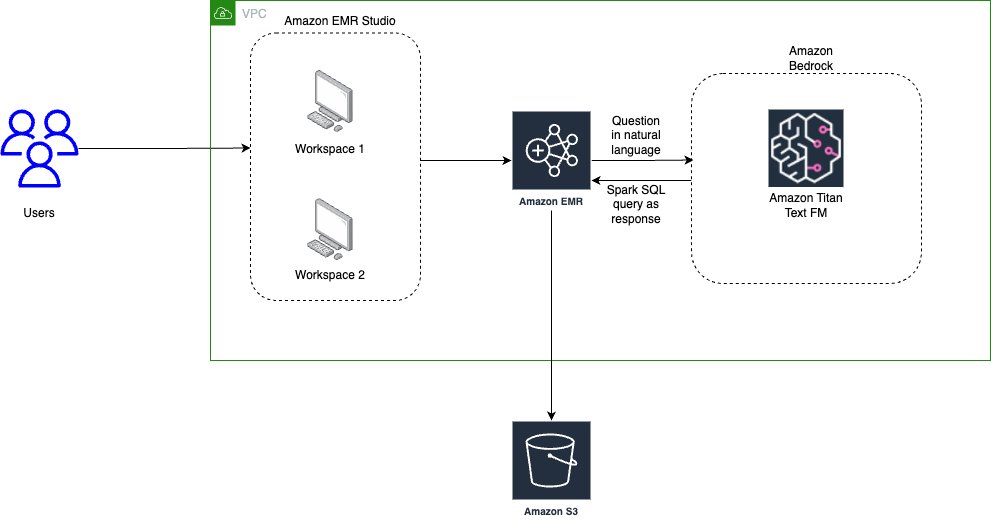


 Saurabh Bhutyani is a Principal Analytics Specialist Solutions Architect at AWS. He is passionate about new technologies. He joined AWS in 2019 and works with customers to provide architectural guidance for running generative AI use cases, scalable analytics solutions and data mesh architectures using AWS services like Amazon Bedrock, Amazon SageMaker, Amazon EMR, Amazon Athena, AWS Glue, AWS Lake Formation, and Amazon DataZone.
 Harsh Vardhan is an AWS Senior Solutions Architect, specializing in analytics. He has over 8 years of experience working in the field of big data and data science. He is passionate about helping customers adopt best practices and discover insights from their data.
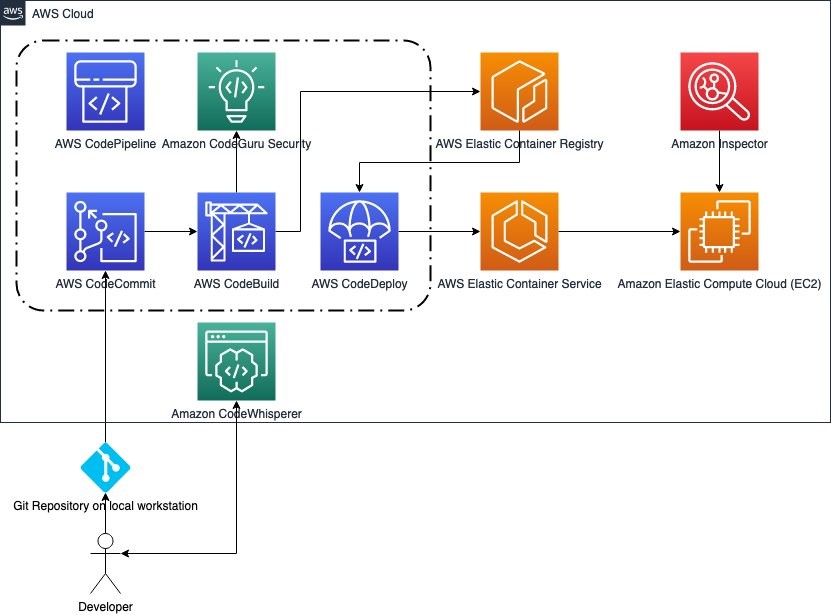


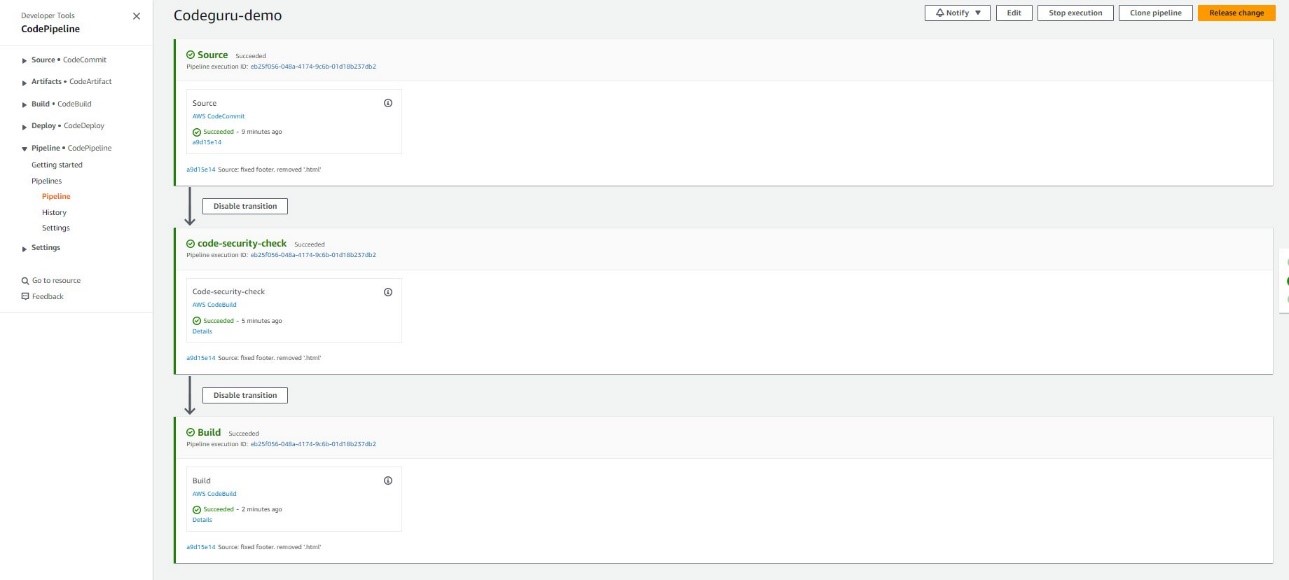
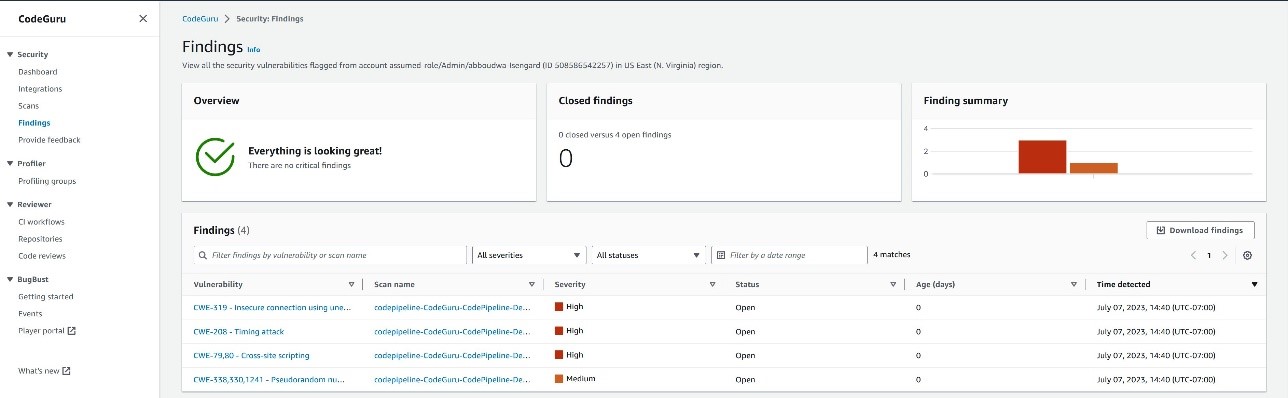
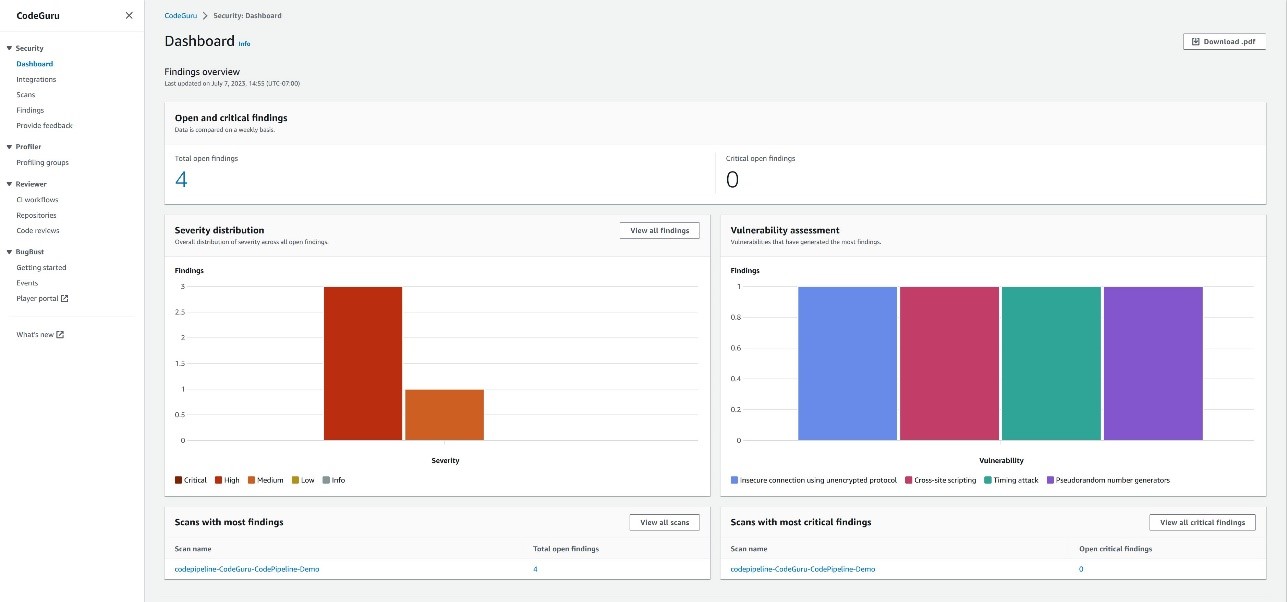


 John Jackson has over 25 years of software experience as a developer, systems architect, and product manager in both startups and large corporations and is the AWS Principal Product Manager responsible for Amazon MWAA.
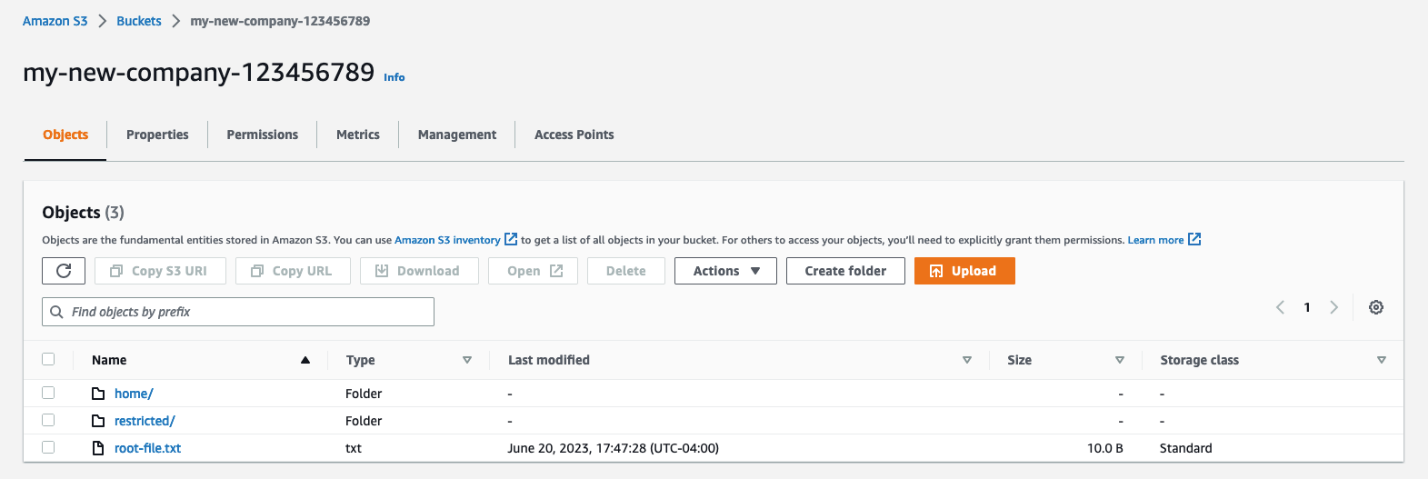
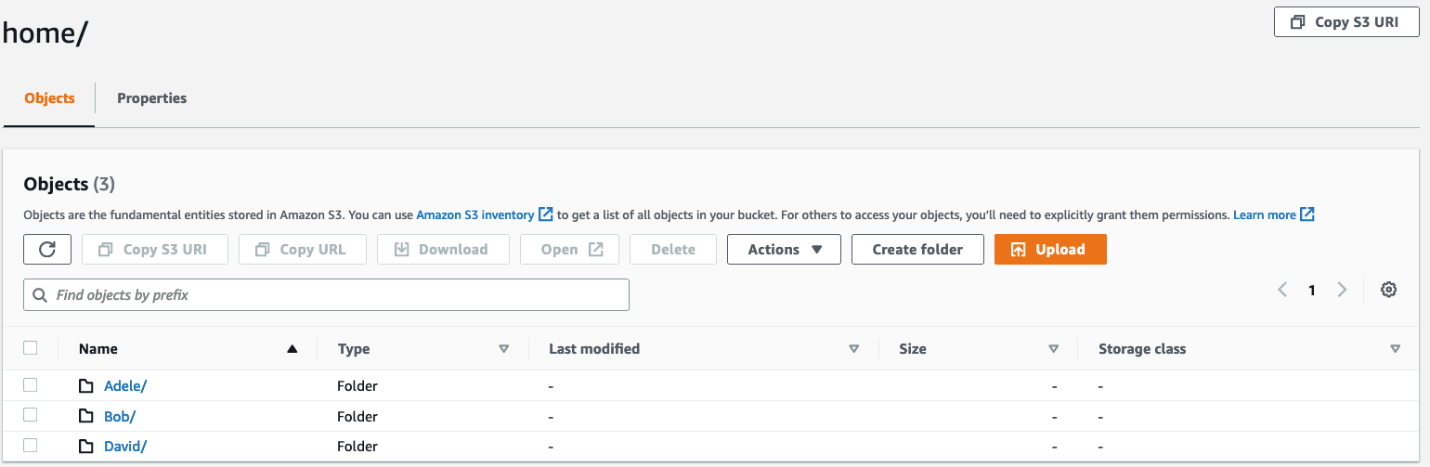


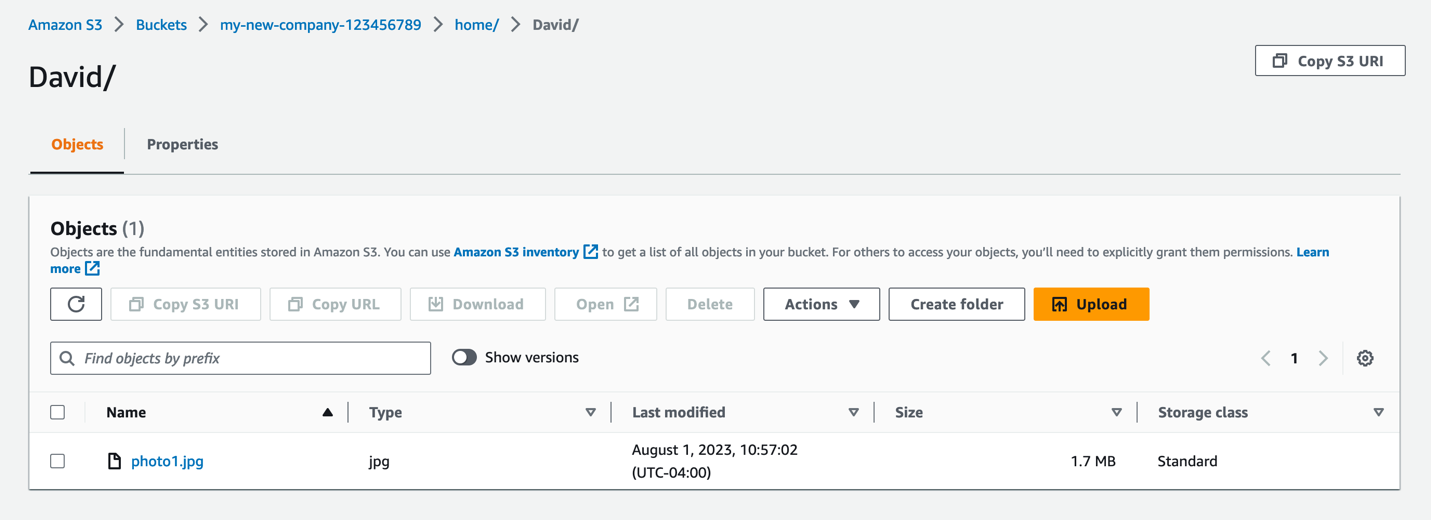


 Prabhat Chaturvedi