In our previous blog post (Part 1 of our key replication series), Automatically replicate your card payment keys across AWS Regions, we explored an event-driven, serverless architecture using AWS PrivateLink to securely replicate card payment keys across AWS Regions. That solution demonstrated how to build a custom replication framework for payment cryptography keys.
Based on customer feedback requesting a more automated, no-code approach, we’re excited to announce an additional option to this capability with Multi-Region keys for AWS Payment Cryptography in Part 2 of our series.
By using this new feature, you can automatically synchronize payment cryptography keys from a primary Region to other Regions that you select, improving resilience and availability of payment applications. You can also choose between account-level replication or key-level replication, giving more flexibility in how to manage payment keys across Regions.
Multi-Region keys: Overview and benefits
The new Multi-Region key replication feature for AWS Payment Cryptography offers you flexible control over your key replication strategy through the following primary capabilities:
Control whether keys are replicated
Select specific Regions for key replication
Manage replication configuration changes
Configure either account-level or key-level replication to meet business needs
Multi-Region keys help deliver several benefits for global payment operations, including:
Improved availability: Access your payment keys even if a Region becomes unavailable
Disaster recovery: Maintain business continuity with replicated keys across Regions
Global operations: Support payment processing across multiple geographic regions
Simplified management: Centralized control with distributed availability
Consistent key IDs: The same key ID across Regions simplifies application development
Configuration options
Payment Cryptography provides two distinct methods for configuring Multi-Region key replication, giving flexibility to implement a strategy that best fits your organization’s needs. You can choose between a broad, account-level approach or a more granular, key-level method.
Account-level
With account-level configuration, AWS automatically replicates exportable symmetric keys created in your Payment Cryptography account from your designated primary Region to other Regions you specify. This simplifies key management in multi-Region deployments, provides consistent key availability in the Regions that you specify, and reduces the operational overhead of key management.
To configure account-level replication using the AWS Command Line Interface (AWS CLI), use the new enable-default-key-replication-regions API to set the Regions where AWS will replicate your keys. To remove Regions from your default replication list, use the disable-default-key-replication-regions API.
Note: Only symmetric keys created after the account-level replication is enabled will be replicated.
Key-level replication
By using key-level replication, you can achieve more granular control by:
Designating specific keys as multi-Region keys
Defining custom replication targets for each multi-Region key
Maintaining Region-specific keys when needed
Note: Within each Region, Payment Cryptography maintains redundancy of your keys across multiple Availability Zones for high availability. Multi-Region key replication extends across geographic boundaries, giving you additional resilience against Regional outages while maintaining control over where your keys are stored.
You can specify replication Regions during key creation using the --replication-regions parameter, using the AWS CLI, with the create-key or import-key APIs. For existing keys, you can use the new add-key-replication-regions and remove-key-replication-regions APIs to manage which regions receive your replicated keys.
Important: When you specify replication Regions during key creation, these settings take precedence over default replication Regions configured at the account level.
How it works
Figure 1 shows the process when you replicate a key in Payment Cryptography.
The key is created in your designated primary Region
Payment Cryptography automatically replicates the key material asynchronously to the specified replica Regions
The replicated keys maintain the same key ID across Regions; only the Region portion of the Amazon Resource Name (ARN) changes
The key in the primary Region is marked with MultiRegionKeyType: PRIMARY
Keys in replica Regions are marked with MultiRegionKeyType: REPLICA and include a reference to the primary Region
When deleting a key, its deletion cascades from the primary to replica Regions
Figure 1: Representation of key replication from us-east-1 to us-west-2
Example: Creating a multi-Region key at key level
The following is an example of creating a card verification key (CVK) in the primary Region (us-east-1) with replication to us-west-2:
When using multi-Region keys, several important aspects should be considered. Multi-Region key replication supports only symmetric keys with the exportable attribute enabled, and asymmetric keys are not supported. For billing purposes, AWS bills per key per Region, which means replicating to three Regions incurs costs for the primary key plus costs for each key in the replica Regions.
Key aliases and tags require separate management in each Region because they are not part of the replication process. While primary keys support modifications and updates, replica keys are read-only copies that support only cryptographic operations. Modifications must be made to the key in the primary Region, and Payment Cryptography automatically propagates these changes to the replica Regions. Monitor the replication status to confirm successful synchronization of these changes.
The deletion process for multi-Region keys follows specific behavior patterns that are important to understand. When a primary key is scheduled for deletion, associated replica keys are deleted immediately. The primary key enters a pending deletion state with a minimum 3-day waiting period, during which the deletion can be canceled. However, if you restore the primary key by canceling its deletion, you will need to re-enable replication to recreate the replica keys in your desired Regions. After the 3-day waiting period expires, the primary key is permanently deleted and becomes unrecoverable. Note that deleting a replica key affects only that specific Region and does not impact the primary key or other replica keys.
Multi-Region key replication operates with eventual consistency. When creating new keys or making changes to existing keys, these updates might not appear immediately across all Regions. Applications should be designed to handle this eventual consistency model and not assume immediate availability of keys or key changes in replica Regions. If your application requires strong consistency, implement polling mechanisms using the GetKey API to verify that changes have been synchronized before proceeding with key operations.
Logging and monitoring
Payment Cryptography logs API activity through AWS CloudTrail, which now includes new events and attributes specific to Multi-Region key replication.
New CloudTrail event
The service logs a new event type called SynchronizeMultiRegionKey, which appears in primary and replica Regions.
Primary Region events:
Two SynchronizeMultiRegionKey events are logged in the primary Region for each replication Region defined:
To start using Multi-Region key replication in Payment Cryptography:
Determine your primary Region.
Determine your replica Regions and if you will use account-level or key-level configuration.
Create new exportable symmetric keys or update existing keys to use the Multi-Region key replication feature.
Update your applications to use the consistent key IDs across Regions.
Conclusion
The new Multi-Region key replication feature in Payment Cryptography enhances our automatic key replication capabilities, providing improved resilience and simplified management for global payment applications. This feature helps make sure your payment cryptography keys are available when and where you need them, with the flexibility to choose between account-level or key-level replication strategies.
Today, we’re announcing some changes that will improve the security of accessing Git data over SSH.
What’s changing?
We’re adding a new post-quantum secure SSH key exchange algorithm, known alternately as sntrup761x25519-sha512 and [email protected], to our SSH endpoints for accessing Git data.
This only affects SSH access and doesn’t impact HTTPS access at all.
It also does not affect GitHub Enterprise Cloud with data residency in the United States region.
Why are we making these changes?
These changes will keep your data secure both now and far into the future by ensuring they are protected against future decryption attacks carried out on quantum computers.
When you make an SSH connection, a key exchange algorithm is used for both sides to agree on a secret. The secret is then used to generate encryption and integrity keys. While today’s key exchange algorithms are secure, new ones are being introduced that are secure against cryptanalytic attacks carried out by quantum computers.
We don’t know if it will ever be possible to produce a quantum computer powerful enough to break traditional key exchange algorithms. Nevertheless, an attacker could save encrypted sessions now and, if a suitable quantum computer is built in the future, decrypt them later. This is known as a “store now, decrypt later” attack.
To protect your traffic to GitHub when using SSH, we’re rolling out a hybrid post-quantum key exchange algorithm: sntrup761x25519-sha512 (also known by the older name [email protected]). This provides security against quantum computers by combining a new post-quantum-secure algorithm, Streamlined NTRU Prime, with the classical Elliptic Curve Diffie-Hellman algorithm using the X25519 curve. Even though these post-quantum algorithms are newer and thus have received less testing, combining them with the classical algorithm ensures that security won’t be weaker than what the classical algorithm provides.
These changes are rolling out to github.com and non-US resident GitHub Enterprise Cloud regions. Only FIPS-approved cryptography may be used within the US region, and this post-quantum algorithm isn’t approved by FIPS.
When are these changes effective?
We’ll enable the new algorithm on September 17, 2025 for GitHub.com and GitHub Enterprise Cloud with data residency (with the exception of the US region).
This will also be included in GitHub Enterprise Server 3.19.
How do I prepare?
This change only affects connections with a Git client over SSH. If your Git remotes start with https://, you won’t be impacted by this change.
For most uses, the new key exchange algorithm won’t result in any noticeable change. If your SSH client supports [email protected] or sntrup761x25519-sha512 (for example, OpenSSH 9.0 or newer), it will automatically choose the new algorithm by default if your client prefers it. No configuration change should be necessary unless you modified your client’s defaults.
If you use an older SSH client, your client should fall back to an older key exchange algorithm. That means you won’t experience the security benefits of using a post-quantum algorithm until you upgrade, but your SSH experience should continue to work as normal, since the SSH protocol automatically picks an algorithm that both sides support.
If you want to test whether your version of OpenSSH supports this algorithm, you can run the following command: ssh -Q kex. That lists all of the key exchange algorithms supported, so if you see sntrup761x25519-sha512 or [email protected], then it’s supported.
To check which key exchange algorithm OpenSSH uses when you connect to GitHub.com, run the following command on Linux, macOS, Git Bash, or other Unix-like environments:
For other implementations of SSH, please see the documentation for that implementation.
What’s next?
We’ll keep an eye on the latest developments in security. As the SSH libraries we use begin to support additional post-quantum algorithms, including ones that comply with FIPS, we’ll update you on our offerings.
Over the past few days Cloudflare has been notified through our vulnerability disclosure program and the certificate transparency mailing list that unauthorized certificates were issued by Fina CA for 1.1.1.1, one of the IP addresses used by our public DNS resolver service. From February 2024 to August 2025, Fina CA issued twelve certificates for 1.1.1.1 without our permission. We did not observe unauthorized issuance for any properties managed by Cloudflare other than 1.1.1.1.
We have no evidence that bad actors took advantage of this error. To impersonate Cloudflare’s public DNS resolver 1.1.1.1, an attacker would not only require an unauthorized certificate and its corresponding private key, but attacked users would also need to trust the Fina CA. Furthermore, traffic between the client and 1.1.1.1 would have to be intercepted.
While this unauthorized issuance is an unacceptable lapse in security by Fina CA, we should have caught and responded to it earlier. After speaking with Fina CA, it appears that they issued these certificates for the purposes of internal testing. However, no CA should be issuing certificates for domains and IP addresses without checking control. At present all certificates have been revoked. We are awaiting a full post-mortem from Fina.
While we regret this situation, we believe it is a useful opportunity to walk through how trust works on the Internet between networks like ourselves, destinations like 1.1.1.1, CAs like Fina, and devices like the one you are using to read this. To learn more about the mechanics, please keep reading.
Background
Cloudflare operates a public DNS resolver 1.1.1.1 service that millions of devices use to resolve domain names from a human-readable format such as example.com to an IP address like 192.0.2.42 or 2001:db8::2a.
The 1.1.1.1 service is accessible using various methods, across multiple domain names, such as cloudflare-dns.com and one.one.one.one, and also using various IP addresses, such as 1.1.1.1, 1.0.0.1, 2606:4700:4700::1111, and 2606:4700:4700::1001. 1.1.1.1 for Families also provides public DNS resolver services and is hosted on different IP addresses — 1.1.1.2, 1.1.1.3, 1.0.0.2, 1.0.0.3, 2606:4700:4700::1112, 2606:4700:4700::1113, 2606:4700:4700::1002, 2606:4700:4700::1003.
As originally specified in RFC 1034 and RFC 1035, the DNS protocol includes no privacy or authenticity protections. DNS queries and responses are exchanged between client and server in plain text over UDP or TCP. These represent around 60% of queries received by the Cloudflare 1.1.1.1 service. The lack of privacy or authenticity protection means that any intermediary can potentially read the DNS query and response and modify them without the client or the server being aware.
To address these shortcomings, we have helped develop and deploy multiple solutions at the IETF. The two of interest to this post are DNS over TLS (DoT, RFC 7878) and DNS over HTTPS (DoH, RFC 8484). In both cases the DNS protocol itself is mainly unchanged, and the desirable security properties are implemented in a lower layer, replacing the simple use of plain-text in UDP and TCP in the original specification. Both DoH and DoT use TLS to establish an authenticated, private, and encrypted channel over which DNS messages can be exchanged. To learn more you can read DNS Encryption Explained.
During the TLS handshake, the server proves its identity to the client by presenting a certificate. The client validates this certificate by verifying that it is signed by a Certification Authority that it already trusts. Only then does it establish a connection with the server. Once connected, TLS provides encryption and integrity for the DNS messages exchanged between client and server. This protects DoH and DoT against eavesdropping and tampering between the client and server.
The TLS certificates used in DoT and DoH are the same kinds of certificates HTTPS websites serve. Most website certificates are issued for domain names like example.com. When a client connects to that website, they resolve the name example.com to an IP like 192.0.2.42, then connect to the domain on that IP address. The server responds with a TLS certificate containing example.com, which the device validates.
However, DNS server certificates tend to be used slightly differently. Certificates used for DoT and DoH have to contain the service IP addresses, not just domain names. This is due to clients being unable to resolve a domain name in order to contact their resolver, like cloudflare-dns.com. Instead, devices are first set up by connecting to their resolver via a known IP address, such as 1.1.1.1 in the case of Cloudflare public DNS resolver. When this connection uses DoT or DoH, the resolver responds with a TLS certificate issued for that IP address, which the client validates. If the certificate is valid, the client believes that it is talking to the owner of 1.1.1.1 and starts sending DNS queries.
You can see that the IP addresses are included in the certificate Cloudflare’s public resolver uses for DoT/DoH:
Certificate:
  Data:
      Version: 3 (0x2)
      Serial Number:
          02:7d:c8:c5:e1:72:94:ae:c9:ed:3f:67:72:8e:8a:08
      Signature Algorithm: sha256WithRSAEncryption
      Issuer: C=US, O=DigiCert Inc, CN=DigiCert Global G2 TLS RSA SHA256 2020 CA1
      Validity
          Not Before: Jan  2 00:00:00 2025 GMT
          Not After : Jan 21 23:59:59 2026 GMT
      Subject: C=US, ST=California, L=San Francisco, O=Cloudflare, Inc., CN=cloudflare-dns.com
      X509v3 extensions:
          X509v3 Subject Alternative Name:
              DNS:cloudflare-dns.com, DNS:*.cloudflare-dns.com, DNS:one.one.one.one, IP Address:1.0.0.1, IP Address:1.1.1.1, IP Address:162.159.36.1, IP Address:162.159.46.1, IP Address:2606:4700:4700:0:0:0:0:1001, IP Address:2606:4700:4700:0:0:0:0:1111, IP Address:2606:4700:4700:0:0:0:0:64, IP Address:2606:4700:4700:0:0:0:0:6400
Rogue certificate issuance
The section above describes normal, expected use of Cloudflare public DNS resolver 1.1.1.1 service, using certificates managed by Cloudflare. However, Cloudflare has been made aware of other, unauthorized certificates being issued for 1.1.1.1. Since certificate validation is the mechanism by which DoH and DoT clients establish the authenticity of a DNS resolver, this is a concern. Let’s now dive a little further in the security model provided by DoH and DoT.
Consider a client that is preconfigured to use the 1.1.1.1 resolver service using DoT. The client must establish a TLS session with the configured server before it can send any DNS queries. To be trusted, the server needs to present a certificate issued by a CA that the client trusts. The collection of certificates trusted by the client is also called the root store.
A Certification Authority (CA) is an organisation, such as DigiCert in the section above, whose role is to receive requests to sign certificates and verify that the requester has control of the domain. In this incident, Fina CA issued certificates for 1.1.1.1 without Cloudflare’s involvement. This means that Fina CA did not properly check whether the requestor had legitimate control over 1.1.1.1. According to Fina CA:
“They were issued for the purpose of internal testing of certificate issuance in the production environment. An error occurred during the issuance of the test certificates when entering the IP addresses and as such they were published on Certificate Transparency log servers.”
Although it’s not clear whether Fina CA sees it as an error, we emphasize that it is not an error to publish test certificates on Certificate Transparency (more about what that is later on). Instead, the error at hand is Fina CA using their production keys to sign a certificate for an IP address without permission of the controller. We have talked about misuse of 1.1.1.1 in documentation, lab, and testing environments at length. Instead of the Cloudflare public DNS resolver 1.1.1.1 IP address, Fina should have used an IP address it controls itself.
Unauthorized certificates are unfortunately not uncommon, whether due to negligence — such as IdenTrust in November 2024 — or compromise. Famously in 2011, the Dutch CA DigiNotar was hacked, and its keys were used to issue hundreds of certificates. This hack was a wake-up call and motivated the introduction of Certificate Transparency (CT), later formalised in RFC 6962. The goal of Certificate Transparency is not to directly prevent misissuance, but to be able to detect any misissuance once it has happened, by making sure every certificate issued by a CA is publicly available for inspection.
In certificate transparency several independent parties, including Cloudflare, operate public logs of issued certificates. Many modern browsers do not accept certificates unless they provide proof in the form of signed certificate timestamps (SCTs) that the certificate has been logged in at least two logs. Domain owners can therefore monitor all public CT logs for any certificate containing domains they care about. If they see a certificate for their domains that they did not authorize, they can raise the alarm. CT is also the data source for public services such as crt.sh and Cloudflare Radar’s certificate transparency page.
Not all clients require proof of inclusion in certificate transparency. Browsers do, but most DNS clients don’t. We were fortunate that Fina CA did submit the unauthorized certificates to the CT logs, which allowed them to be discovered.
Investigation into potential malicious use
Our immediate concern was that someone had maliciously used the certificates to impersonate the 1.1.1.1 service. Such an attack would require all the following:
An attacker would require a rogue certificate and its corresponding private key.
Attacked clients would need to trust the Fina CA.
Traffic between the client and 1.1.1.1 would have to be intercepted.
In light of this incident, we have reviewed these requirements one by one:
1. We know that a certificate was issued without Cloudflare’s involvement. We must assume that a corresponding private key exists, which is not under Cloudflare’s control. This could be used by an attacker. Fina CA wrote to us that the private keys were exclusively in Fina’s controlled environment and were immediately destroyed even before the certificates were revoked. As we have no way to verify this, we have and continue to take steps to detect malicious use as described in point 3.
2. Furthermore, some clients trust Fina CA. It is included by default in Microsoft’s root store and in an EU Trust Service provider. We can exclude some clients, as the CA certificate is not included by default in the root stores of Android, Apple, Mozilla, or Chrome. These users cannot have been affected with these default settings. For these certificates to be used nefariously, the client’s root store must include the Certification Authority (CA) that issued them. Upon discovering the problem, we immediately reached out to Fina CA, Microsoft, and the EU Trust Service provider. Microsoft responded quickly, and started rolling out an update to their disallowed list, which should cause clients that use it to stop trusting the certificate.
3. Finally, we have launched an investigation into possible interception between users and 1.1.1.1. The first way this could happen is when the attacker is on-path of the client request. Such man-in-the-middle attacks are likely to be invisible to us. Clients will get responses from their on-path middlebox and we have no reliable way of telling that is happening. On-path interference has been a persistent problem for 1.1.1.1, which we’ve been working on ever since we announced 1.1.1.1.
A second scenario can occur when a malicious actor is off-path, but is able to hijack 1.1.1.1 routing via BGP. These are scenarios we have discussed in aprevious blog post, and increasing adoption of RPKI route origin validation (ROV) makes BGP hijacks with high penetration harder. We looked at the historical BGP announcements involving 1.1.1.1, and have found no evidence that such routing hijacks took place.
Although we cannot be certain, so far we have seen no evidence that these certificates have been used to impersonate Cloudflare public DNS resolver 1.1.1.1 traffic. In later sections we discuss the steps we have taken to prevent such impersonation in the future, as well as concrete actions you can take to protect your own systems and users.
A closer look at the unauthorized certificates attributes
All unauthorized certificates for 1.1.1.1 were valid for exactly one year and included other domain names. Most of these domain names are not registered, which indicates that the certificates were issued without proper domain control validation. This violates sections 3.2.2.4 and 3.2.2.5 of the CA/Browser Forum’s Baseline Requirements, and sections 3.2.2.3 and 3.2.2.4 of the Fina CA Certificate Policy.
The full list of domain names we identified on the unauthorized certificates are as follows:
It’s also worth noting that the Subject attribute points to a fictional organisation TEST D.D., as can be seen on this unauthorized certificate:
        Serial Number:
            a5:30:a2:9c:c1:a5:da:40:00:00:00:00:56:71:f2:4c
        Signature Algorithm: sha256WithRSAEncryption
        Issuer: C=HR, O=Financijska agencija, CN=Fina RDC 2015
        Validity
            Not Before: Nov  2 23:45:15 2024 GMT
            Not After : Nov  2 23:45:15 2025 GMT
        Subject: C=HR, O=TEST D.D., L=ZAGREB, CN=testssl.finatest.hr, serialNumber=VATHR-32343828408.306
        X509v3 extensions:
            X509v3 Subject Alternative Name:
                DNS:testssl.finatest.hr, DNS:testssl2.finatest.hr, IP Address:1.1.1.1
Incident timeline and impact
All timestamps are UTC. All certificates are identified by their date of validity.
The first certificate was issued to be valid starting February 2024, and revoked 33 min later. 11 certificate issuances with common name 1.1.1.1 followed from February 2024 to August 2025. Public reports have been made on Hacker News and on the certificate-transparency mailing list early in September 2025, which Cloudflare responded to.
While responding to the incident, we identified the full list of misissued certificates, their revocation status, and which clients trust them.
First response by Cloudflare on the mailing list about starting the investigation
2025-09-03 12:08:00
Incident declared
2025-09-03 12:16:00
Notification of an unauthorised issuance sent to Fina CA, Microsoft Root Store, and EU Trust service provider
2025-09-03 12:23:00
Cloudflare identifies an initial list of nine rogue certificates
2025-09-03 12:24:00
Outreach to Fina CA to inform them about the unauthorized issuance, requesting revocation
2025-09-03 12:26:00
Identify the number of requests served on 1.1.1.1 IP address, and associated names/services
2025-09-03 12:42:00
As a precautionary measure, began investigation to rule out the possibility of a BGP hijack for 1.1.1.1
2025-09-03 18:48:00
Second notification of the incident to Fina CA
2025-09-03 21:27:00
Microsoft Root Store notifies us that they are preventing further use of the identified unauthorized certificates by using their quick-revocation mechanism.
2025-09-04 06:13:27
Fina revoked all certificates.
2025-09-04 12:44:00
Cloudflare receives a response from Fina indicating “an error occurred during the issuance of the test certificates when entering the IP addresses and as such they were published on Certificate Transparency log servers. […] Fina will eliminate the possibility of such an error recurring.”
It is therefore disappointing that we failed to properly monitor certificates for our own domain. We failed three times. The first time because 1.1.1.1 is an IP certificate and our system failed to alert on these. The second time because even if we were to receive certificate issuance alerts, as any of our customers can, we did not implement sufficient filtering. With the sheer number of names and issuances we manage it has not been possible for us to keep up with manual reviews. Finally, because of this noisy monitoring, we did not enable alerting for all of our domains. We are addressing all three shortcomings.
We double-checked all certificates issued for our names, including but not limited to 1.1.1.1, using certificate transparency, and confirmed that as of 3 September, the Fina CA issued certificates are the only unauthorized issuances. We contacted Fina, and the root programs we know that trust them, to ask for revocation and investigation. The certificates have been revoked.
Despite no indication of usage of these certificates so far, we take this incident extremely seriously. We have identified several steps we can take to address the risk of these sorts of problems occurring in the future, and we plan to start working on them immediately:
Alerting: Cloudflare will improve alerts and escalation for issuance of certificates for missing Cloudflare owned domains including 1.1.1.1 certificates.
Transparency: The issuance of these unauthorised 1.1.1.1 certificates were detected because Fina CA used Certificate Transparency. Transparency inclusion is not enforced by most DNS clients, which implies that this detection was a lucky one. We are working on bringing transparency to non-browser clients, in particular DNS clients that rely on TLS.
Bug Bounty: Our procedure for triaging reports made through our vulnerability disclosure program was the cause for a delayed response. We are working to revise our triaging process to ensure such reports get the right visibility.
Monitoring: During this incident, our team relied on crt.sh to provide us a convenient UI to explore CA issued certificates. We’d like to give a shout to the Sectigo team for maintaining this tool. Given Cloudflare is an active CT Monitor, we have started to build a dedicated UI to explore our data in Radar. We are looking to enable exploration of certs with IP addresses as common names to Radar as well.
What steps should you take?
This incident demonstrates the disproportionate impact that the current root store model can have. It is enough for a single certification authority going rogue for everyone to be at risk.
If you are an IT manager with a fleet of managed devices, you should consider whether you need to take direct action to revoke these unauthorized certificates. We provide the list in the timeline section above. As the certificates have since been revoked, it is possible that no direct intervention should be required; however, system-wide revocation is not instantaneous and automatic and hence we recommend checking.
If you are tasked to review the policy of a root store that includes Fina CA, you should take immediate actions to review their inclusion in your program. The issue that has been identified through the course of this investigation raises concerns, and requires a clear report and follow-up from the CA. In addition, to make it possible to detect future such incidents, you should consider having a requirement for all CAs in your root store to participate in Certificate Transparency. Without CT logs, problems such as the one we describe here are impossible to address before they result in impact to end users.
We are not suggesting that you should stop using DoH or DoT. DNS over UDP and TCP are unencrypted, which puts every single query and response at risk of tampering and unauthorised surveillance. However, we believe that DoH and DoT client security could be improved if clients required that server certificates be included in a certificate transparency log.
Conclusion
This event is the first time we have observed a rogue issuance of a certificate used by our public DNS resolver 1.1.1.1 service. While we have no evidence this was malicious, we know that there might be future attempts that are.
We plan to accelerate how quickly we discover and alert on these types of issues ourselves. We know that we can catch these earlier, and we plan to do so.
The identification of these kinds of issues rely on an ecosystem of partners working together to support Certificate Transparency. We are grateful for the monitors who noticed and reported this issue.
Security professionals everywhere face a paradox: while more data provides the visibility needed to catch threats, it also makes it harder for humans to process it all and find what’s important. When there’s a sudden spike in suspicious traffic, every second counts. But for many security teams — especially lean ones — it’s hard to quickly figure out what’s going on. Finding a root cause means diving into dashboards, filtering logs, and cross-referencing threat feeds. All the data tracking that has happened can be the very thing that slows you down — or worse yet, what buries the threat that you’re looking for.
Today, we’re excited to announce that we’ve solved that problem. We’ve integrated Cloudy — Cloudflare’s first AI agent — with our security analytics functionality, and we’ve also built a new, conversational interface that Cloudflare users can use to ask questions, refine investigations, and get answers. With these changes, Cloudy can now help Cloudflare users find the needle in the digital haystack, making security analysis faster and more accessible than ever before.
Since Cloudly’s launch in March of this year, its adoption has been exciting to watch. Over 54,000 users have tried Cloudy for custom rule creation, and 31% of them have deployed a rule suggested by the agent. For our log explainers in Cloudflare Gateway, Cloudy has been loaded over 30,000 times in just the last month, with 80% of the feedback we received confirming the summaries were insightful. We are excited to empower our users to do even more.
Talk to your traffic: a new conversational interface for faster RCA and mitigation
Security analytics dashboards are powerful, but they often require you to know exactly what you’re looking for — and the right queries to get there. The new Cloudy chat interface changes this. It is designed for faster root cause analysis (RCA) of traffic anomalies, helping you get from “something’s wrong” to “here’s the fix” in minutes. You can now start with a broad question and narrow it down, just like you would with a human analyst.
For example, you can start an investigation by asking Cloudy to look into a recommendation from Security Analytics.
From there, you can ask follow-up questions to dig deeper:
“Focus on login endpoints only.”
“What are the top 5 IP addresses involved?”
“Are any of these IPs known to be malicious?”
This is just the beginning of how Cloudy is transforming security. You can read more about how we’re using Cloudy to bring clarity to another critical security challenge: automating summaries of email detections. This is the same core mission — translating complex security data into clear, actionable insights — but applied to the constant stream of email threats that security teams face every day.
Use Cloudy to understand, prioritize, and act on threats
Analyzing your own logs is powerful — but it only shows part of the picture. What if Cloudy could look beyond your own data and into Cloudflare’s global network to identify emerging threats? This is where Cloudforce One’s Threat Events platform comes in.
Cloudforce One translates the high-volume attack data observed on the Cloudflare network into real-time, attacker-attributed events relevant to your organization. This platform helps you track adversary activity at scale — including APT infrastructure, cybercrime groups, compromised devices, and volumetric DDoS activity. Threat events provide detailed, context-rich events, including interactive timelines and mappings to attacker TTPs, regions, and targeted verticals.
We have spent the last few months making Cloudy more powerful by integrating it with the Cloudforce One Threat Events platform. Cloudy now can offer contextual data about the threats we observe and mitigate across Cloudflare’s global network, spanning everything from APT activity and residential proxies to ACH fraud, DDoS attacks, WAF exploits, cybercrime, and compromised devices. This integration empowers our users to quickly understand, prioritize, and act on indicators of compromise (IOCs) based on a vast ocean of real-time threat data.
Cloudy lets you query this global dataset in a natural language and receive clear, concise answers. For example, imagine asking these questions and getting immediate actionable answers:
Who is targeting my industry vertical or country?
What are the most relevant indicators (IPs, JA3/4 hashes, ASNs, domains, URLs, SHA fingerprints) to block right now?
How has a specific adversary progressed across the cyber kill chain over time?
What novel new threats are threat actors using that might be used against your network next, and what insights do Cloudflare analysts know about them?
Simply interact with Cloudy in the Cloudflare Dashboard > Security Center > Threat Intelligence, providing your queries in natural language. It can walk you from a single indicator (like an IP address or domain) to the specific threat event Cloudflare observed, and then pivot to other related data — other attacks, related threats, or even other activity from the same actor.
This cuts through the noise, so you can quickly understand an adversary’s actions across the cyber kill chain and MITRE ATT&CK framework, and then block attacks with precise, actionable intelligence. The threat events platform is like an evidence board on the wall that helps you understand threats; Cloudy is like your sidekick that will run down every lead.
How it works: Agents SDK and Workers AI
Developing this advanced capability for Cloudy was a testament to the agility of Cloudflare’s AI ecosystem. We leveraged our Agents SDK running on Workers AI. This allowed for rapid iteration and deployment, ensuring Cloudy could quickly grasp the nuances of threat intelligence and provide highly accurate, contextualized insights. The combination of our massive network telemetry, purpose-built LLM prompts, and the flexibility of Workers AI means Cloudy is not just fast, but also remarkably precise.
And a quick word on what we didn’t do when developing Cloudy: We did not train Cloudy on any Cloudflare customer data. Instead, Cloudy relies on models made publicly available through Workers AI. For more information on Cloudflare’s approach to responsible AI, please see these FAQs.
What’s next for Cloudy
This is just the next step in Cloudy’s journey. We’re working on expanding Cloudy’s abilities across the board. This includes intelligent debugging for WAF rules and deeper integrations with Alerts to give you more actionable, contextual notifications. At the same time, we are continuously enriching our threat events datasets and exploring ways for Cloudy to help you visualize complex attacker timelines, campaign overviews, and intricate attack graphs. Our goal remains the same: make Cloudy an indispensable partner in understanding and reacting to the security landscape.
The new chat interface is now available on all plans, and the threat intelligence capabilities are live for Cloudforce One customers. Learn more about Cloudforce One here and reach out for a consultation if you want to go deeper with our experts.
Amazon’s threat intelligence team has identified and disrupted a watering hole campaign conducted by APT29 (also known as Midnight Blizzard), a threat actor associated with Russia’s Foreign Intelligence Service (SVR). Our investigation uncovered an opportunistic watering hole campaign using compromised websites to redirect visitors to malicious infrastructure designed to trick users into authorizing attacker-controlled devices through Microsoft’s device code authentication flow. This opportunistic approach illustrates APT29’s continued evolution in scaling their operations to cast a wider net in their intelligence collection efforts.
The evolving tactics of APT29
This campaign follows a pattern of activity we’ve previously observed from APT29. In October 2024, Amazon disrupted APT29’s attempt to use domains impersonating AWS to phish users with Remote Desktop Protocol files pointed to actor-controlled resources. Also, in June 2025, Google’s Threat Intelligence Group reported on APT29’s phishing campaigns targeting academics and critics of Russia using application-specific passwords (ASPs). The current campaign shows their continued focus on credential harvesting and intelligence collection, with refinements to their technical approach, and demonstrates an evolution in APT29’s tradecraft through their ability to:
Compromise legitimate websites and initially inject obfuscated JavaScript
Rapidly adapt infrastructure when faced with disruption
On new infrastructure, adjust from use of JavaScript redirects to server-side redirects
Technical details
Amazon identified the activity through an analytic it created for APT29 infrastructure, which led to the discovery of the actor-controlled domain names. Through further investigation, Amazon identified the actor compromised various legitimate websites and injected JavaScript that redirected approximately 10% of visitors to these actor-controlled domains. These domains, including findcloudflare[.]com, mimicked Cloudflare verification pages to appear legitimate. The campaign’s ultimate target was Microsoft’s device code authentication flow. There was no compromise of AWS systems, nor was there a direct impact observed on AWS services or infrastructure.
Analysis of the code revealed evasion techniques, including:
Using randomization to only redirect a small percentage of visitors
Employing base64 encoding to hide malicious code
Setting cookies to prevent repeated redirects of the same visitor
Pivoting to new infrastructure when blocked
Image of compromised page, with domain name removed.
Amazon’s disruption efforts
Amazon remains committed to protecting the security of the internet by actively hunting for and disrupting sophisticated threat actors. We will continue working with industry partners and the security community to share intelligence and mitigate threats. Upon discovering this campaign, Amazon worked quickly to isolate affected EC2 instances, partner with Cloudflare and other providers to disrupt the actor’s domains, and share relevant information with Microsoft.
Despite the actor’s attempts to migrate to new infrastructure, including a move off AWS to another cloud provider, our team continued tracking and disrupting their operations. After our intervention, we observed the actor register additional domains such as cloudflare[.]redirectpartners[.]com, which again attempted to lure victims into Microsoft device code authentication workflows.
Protecting users and organizations
We recommend organizations implement the following protective measures:
For end users:
Be vigilant for suspicious redirect chains, particularly those masquerading as security verification pages.
Always verify the authenticity of device authorization requests before approving them.
Enable multi-factor authentication (MFA) on all accounts, similar to how AWS now requires MFA for root accounts.
Be wary of web pages asking you to copy and paste commands or perform actions in Windows Run dialog (Win+R).
This matches the recently documented “ClickFix” technique where attackers trick users into running malicious commands.
For IT administrators:
Follow Microsoft’s security guidance on device authentication flows and consider disabling this feature if not required.
Enforce conditional access policies that restrict authentication based on device compliance, location, and risk factors.
Implement robust logging and monitoring for authentication events, particularly those involving new device authorizations.
Indicators of compromise (IOCs)
findcloudflare[.]com
cloudflare[.]redirectpartners[.]com
Sample JavaScript code
Decoded JavaScript code, with compromised site removed: “[removed_domain]”
If you have feedback about this post, submit comments in the Comments section below. If you have questions about this post, contact AWS Support.
As your organization grows, the amount of data you own and the number of data sources to store and process your data across multiple Amazon Web Services (AWS) accounts increases. Enforcing consistent access controls that restrict access to known networks might become a key part in protecting your organization’s sensitive data.
Previously, AWS customers could rely on AWS Identity and Access Management (IAM) global condition keys such as aws:SourceVpc and aws:SourceVpce to restrict access to specific virtual private clouds (VPCs) or VPC endpoints. These condition keys work well for organizations with few accounts and for use cases limited to specific workloads. However, as the number of your VPCs grow, using these keys could introduce challenges in scaling the control across a large set of resources.
To address this challenge, AWS has introduced three new global condition keys for scalable access controls based on request origin: aws:VpceAccount, aws:VpceOrgPaths, and aws:VpceOrgID.
In this blog post, we demonstrate how these keys can help make sure that your AWS resources are accessible only from expected VPCs, so that you can scale your data perimeter implementation across your organization within AWS Organizations.
Background
Organizations often store data in AWS resources such as Amazon Simple Storage Service (Amazon S3) buckets. For example, you might use Amazon S3 as your data lake foundation with data scientists and analysts running their data processing and analytics workflows against data stored in a centralized S3 bucket.
To limit access to data stored in your S3 buckets to expected networks, you can use IAM policies associated with your identities and resources. You can define expected networks in a policy using specific IAM global condition keys based on your organization’s intended data access patterns and unique requirements. For example, use aws:SourceIp to specify your corporate IP CIDR ranges, and aws:SourceVpc or aws:SourceVpce to list VPC and VPC endpoint IDs you expect requests to come from. These condition keys help make sure that only workloads operating within your expected network boundaries can access sensitive data.
However, there are scenarios where you might want to allow access from multiple networks within your organization, as illustrated in Figure 1.
Figure 1: Applications and users accessing an S3 bucket from VPCs and public networks
In such cases, using the aws:SourceVpc and aws:SourceVpce condition keys requires enumerating all expected VPC and VPC endpoint IDs and updating policies whenever new VPCs or VPC endpoints are added or deleted. This approach creates operational overhead and increases the risk of misconfigurations. The operational complexity grows as organizations scale their data processing capacity across multiple AWS Regions and accounts. While many organizations have developed automated mechanisms to detect changes in VPC configurations and update policies accordingly, auditing lengthy policies that enumerate VPCs within their organization remains challenging.
The new global condition keys provide a more scalable way to restrict access to expected networks:
aws:VpceAccount – Restricts the use of your identities and resources to networks that belong to a specific AWS account.
aws:VpceOrgID – Restricts the use of your identities and resources to networks that belong to your organization.
The value of these keys in the request context is the ID of the account (for example, 111122223333), organization unit (OU) (for example, o-abcdef0123/r-acroot/ou-development/*), or organization (for example, o-abcdef0123) that owns the VPC endpoint the request is made through.
Note that at the time of writing, not all services support these keys. See AWS global condition context keys for a list of supported services.
Implementation examples
Let’s look at how to restrict access to expected networks using the three new condition keys for common use cases. Each of the use cases demonstrates how the new condition keys help simplify controlling access to your resources in the sample scenario from Figure 1.
Use case 1: Allow access to your S3 buckets only from networks of data processing accounts
Data owners might want to strictly manage what data workflows can access their data sources and restrict cross-account access to specific data processing accounts and networks. They can use the aws:VpceAccount condition key to allow access based on the account that owns the VPC endpoint the request is made through. The following is an example S3 bucket policy.
This policy allows specific principals listed in the Principal element to list and download objects from the data lake bucket but only if they make requests from networks in one of the specified AWS accounts (StringEquals and aws:VpceAccount). Using the aws:VpceAccount condition key in this policy alleviates the need to maintain a list of VPC IDs or VPC endpoint IDs for the data processing accounts, reduces the size of the policy document, and simplifies auditing.
Use case 2: Restricting access to company networks for resources across multiple accounts
Central security teams often look for ways to enforce a set of standard access controls on resources across their entire organization. This is to meet compliance and security requirements, fulfill legal and contractual obligations, and to protect corporate data from unintended access. One such control could be used to limit access to only expected networks within the organization. In our sample scenario, this control helps prevent your data analysts and scientists from using their credentials to access data outside of your corporate environment. The following RCP demonstrates how to enforce the network perimeter controls on S3 buckets:
This policy denies access to S3 buckets and objects unless it is from expected networks defined as: your corporate IP CIDR range (NotIpAddressIfExists and aws:SourceIp), VPC endpoints in your organization (StringNotEqualsIfExists and aws:VpceOrgID), networks of AWS services that use their service principals or forward access sessions (FAS) to act on your behalf (BoolIfExists with aws:PrincipalIsAWSService and aws:ViaAWSService). It also allows access to networks of AWS services using specific service roles to access your resources (StringNotEqualsIfExists and aws:PrincipalTag/network-perimeter-exception set to true). Some organizations might need to edit this policy to allow third-party partner access. See Establishing a data perimeter on AWS: Allow access to company data only from expected networks for additional information on access patterns that need to be accounted for to meet the needs of your organization.
We used an RCP because it can be used to apply access controls centrally on resources across multiple accounts. Central security teams use RCPs to enforce security invariants on resources across their entire organization. For best practices in designing and deploying RCPs, see Effectively implementing resource control policies in a multi-account environment.
Remember to reference the list of services that support aws:VpceOrgID before using it in a policy such as an RCP. Enforcing it on an unsupported service might prevent your developers from using the service. If you need to restrict access to expected networks on a wider range of services, consider using the aws:SourceVpc and aws:SourceVpce condition keys. See the data perimeter policy examples repository that illustrate how to implement network perimeter controls for a wider range of services.
Use case 3: Restricting access based on intra-organization boundaries
Organizations often need to segment environments within their organization with varying data access requirements. For example, they might need to separate production from non-production environments or create boundaries between different business units, such as Finance, Marketing, and Sales; each operating in separate accounts. This might include making sure that resources within a specific OU can only be accessed from networks in the same OU. Central security teams can use aws:VpceOrgPaths to achieve this objective at scale.
The following is an example RCP that restricts access to your Amazon S3 and AWS Key Management Service (AWS KMS) resources so that they can only be accessed through VPC endpoints in a specific OU.
This policy is similar to the one we built for the previous use case but uses aws:VpceOrgPaths instead of aws:VpceOrgID to enforce a more granular boundary based on the requests’ network origin.
Best practices and considerations
When implementing the new condition keys, consider the following best practices.
Identify opportunities to adopt the new global condition keys by reviewing your security objectives and controls
If you currently restrict access to a wide range of resources using the aws:SourceVpc and aws:SourceVpce condition keys and want to avoid the need to enumerate VPC or VPC endpoint IDs in your policies, evaluate if you can migrate to aws:VpceAccount, aws:VpceOrgPaths, or aws:VpceOrgID. This migration decision depends on whether services you restrict access to are supported by the new condition keys. Similarly, if you plan to add network perimeter restrictions to your security baseline, first evaluate whether the new condition keys offer a more scalable solution for your target services. Only enforce the new keys on services that are currently supported. If you need to enforce the restriction on a service not yet supported, you should use aws:SourceVpc and aws:SourceVpce. Also, continue using aws:SourceVpc and aws:SourceVpce to achieve your least privilege objectives, for example if the network boundary you need to maintain for a subset of resources is scoped to specific VPCs or VPC endpoints.
Plan the implementation of the new condition keys
We recommend that you test access controls updates in a non-production environment and only promote them to production after validating their expected behavior. If you currently maintain an automation to enumerate VPC or VPC endpoint IDs in your policies and plan to migrate to the new keys, deactivate your automation only after you have completed policy updates across all environments. This approach helps make sure that your existing security posture remains intact while you progressively deploy the changes.
Monitor and validate the implementation
Use AWS CloudTrail to audit access patterns and regularly review and update your access controls as your organization structure evolves and security objectives change. For example, you might need to adjust access controls when accounts requiring access to your data lakes change, or when organizational boundaries need modification to accommodate new integrations between business units. You must establish processes to continuously evaluate the effectiveness of your controls in meeting both security and business objectives.
Conclusion
In this post, you learned how to use the new global condition keys—aws:VpceAccount, aws:VpceOrgPaths, and aws:VpceOrgID—to restrict access to expected networks at scale. By using these keys, you can:
Implement network perimeter controls that scale with your AWS organization.
Reduce the operational overhead of managing access to your data.
Simplify your IAM policies and reduce the risk of misconfigurations.
Scale your data lake implementation while maintaining security.
If you have feedback about this post, submit comments in the Comments section below. If you have questions about this post, start a new thread on AWS IAM re:Post or contact AWS Support.
Security teams are racing to secure a new attack surface: AI-powered applications. From chatbots to search assistants, LLMs are already shaping customer experience, but they also open the door to new risks. A single malicious prompt can exfiltrate sensitive data, poison a model, or inject toxic content into customer-facing interactions, undermining user trust. Without guardrails, even the best-trained model can be turned against the business.
Today, as part of AI Week, we’re expanding our AI security offerings by introducing unsafe content moderation, now integrated directly into Cloudflare Firewall for AI. Built with Llama, this new feature allows customers to leverage their existing Firewall for AI engine for unified detection, analytics, and topic enforcement, providing real-time protection for Large Language Models (LLMs) at the network level. Now with just a few clicks, security and application teams can detect and block harmful prompts or topics at the edge — eliminating the need to modify application code or infrastructure.
This feature is immediately available to current Firewall for AI users. Those not yet onboarded can contact their account team to participate in the beta program.
AI protection in application security
Cloudflare’s Firewall for AI protects user-facing LLM applications from abuse and data leaks, addressing several of the OWASP Top 10 LLM risks such as prompt injection, PII disclosure, and unbound consumption. It also extends protection to other risks such as unsafe or harmful content.
Unlike built-in controls that vary between model providers, Firewall for AI is model-agnostic. It sits in front of any model you choose, whether it’s from a third party like OpenAI or Gemini, one you run in-house, or a custom model you have built, and applies the same consistent protections.
Just like our origin-agnostic Application Security suite, Firewall for AI enforces policies at scale across all your models, creating a unified security layer. That means you can define guardrails once and apply them everywhere. For example, a financial services company might require its LLM to only respond to finance-related questions, while blocking prompts about unrelated or sensitive topics, enforced consistently across every model in use.
Unsafe content moderation protects businesses and users
Effective AI moderation is more than blocking “bad words”, it’s about setting boundaries that protect users, meeting legal obligations, and preserving brand integrity, without over-moderating in ways that silence important voices.
Because LLMs cannot be fully scripted, their interactions are inherently unpredictable. This flexibility enables rich user experiences but also opens the door to abuse.
Key risks from unsafe prompts include misinformation, biased or offensive content, and model poisoning, where repeated harmful prompts degrade the quality and safety of future outputs. Blocking these prompts aligns with the OWASP Top 10 for LLMs, preventing both immediate misuse and long-term degradation.
One example of this isMicrosoft’s Tay chatbot. Trolls deliberately submitted toxic, racist, and offensive prompts, which Tay quickly began repeating. The failure was not only in Tay’s responses; it was in the lack of moderation on the inputs it accepted.
Detecting unsafe prompts before reaching the model
Cloudflare has integrated Llama Guard directly into Firewall for AI. This brings AI input moderation into the same rules engine our customers already use to protect their applications. It uses the same approach that we created for developers building with AI in our AI Gateway product.
Llama Guard analyzes prompts in real time and flags them across multiple safety categories, including hate, violence, sexual content, criminal planning, self-harm, and more.
With this integration, Firewall for AI not only discovers LLM traffic endpoints automatically, but also enables security and AI teams to take immediate action. Unsafe prompts can be blocked before they reach the model, while flagged content can be logged or reviewed for oversight and tuning. Content safety checks can also be combined with other Application Security protections, such as Bot Managementand Rate Limiting, to create layered defenses when protecting your model.
The result is a single, edge-native policy layer that enforces guardrails before unsafe prompts ever reach your infrastructure — without needing complex integrations.
How it works under the hood
Before diving into the architecture of Firewall for AI engine and how it fits within our previously mentioned module to detect PII in the prompts, let’s start with how we detect unsafe topics.
Detection of unsafe topics
A key challenge in building safety guardrails is balancing a good detection with model helpfulness. If detection is too broad, it can prevent a model from answering legitimate user questions, hurting its utility. This is especially difficult for topic detection because of the ambiguity and dynamic nature of human language, where context is fundamental to meaning.
Simple approaches like keyword blocklists are interesting for precise subjects — but insufficient. They are easily bypassed and fail to understand the context in which words are used, leading to poor recall. Older probabilistic models such as Latent Dirichlet Allocation (LDA) were an improvement, but did not properly account for word ordering and other contextual nuances.
Recent advancements in LLMs introduced a new paradigm. Their ability to perform zero-shot or few-shot classification is uniquely suited for the task of topic detection. For this reason, we chose Llama Guard 3, an open-source model based on the Llama architecture that is specifically fine-tuned for content safety classification. When it analyzes a prompt, it answers whether the text is safe or unsafe, and provides a specific category. We are showing the default categories, as listed here. Because Llama 3 has a fixed knowledge cutoff, certain categories — like defamation or elections — are time-sensitive. As a result, the model may not fully capture events or context that emerged after it was trained, and that’s important to keep in mind when relying on it.
For now, we cover the 13 default categories. We plan to expand coverage in the future, leveraging the model’s zero-shot capabilities.
A scalable architecture for future detections
We designed Firewall for AI to scale without adding noticeable latency, including Llama Guard, and this remains true even as we add new detection models.
To achieve this, we built a new asynchronous architecture. When a request is sent to an application protected by Firewall for AI, a Cloudflare Worker makes parallel, non-blocking requests to our different detection modules — one for PII, one for unsafe topics, and others as we add them.
Thanks to the Cloudflare network, this design scales to handle high request volumes out of the box, and latency does not increase as we add new detections. It will only be bounded by the slowest model used.
We optimize to keep the model utility at its maximum while keeping the guardrail detection broad enough.
Llama Guard is a rather large model, so running it at scale with minimal latency is a challenge. We deploy it on Workers AI, leveraging our large fleet of high performance GPUs. This infrastructure ensures we can offer fast, reliable inference throughout our network.
To ensure the system remains fast and reliable as adoption grows, we ran extensive load tests simulating the requests per second (RPS) we anticipate, using a wide range of prompt sizes to prepare for real-world traffic. To handle this, the number of model instances deployed on our network scales automatically with the load. We employ concurrency to minimize latency and optimize for hardware utilization. We also enforce a hard 2-second threshold for each analysis; if this time limit is reached, we fall back to any detections already completed, ensuring your application’s requests latency is never further impacted.
From detection to security rules enforcement
Firewall for AI follows the same familiar pattern as other Application Security features like Bot Management and WAF Attack Score, making it easy to adopt.
Once enabled, the new fields appear in Security Analytics and expanded logs. From there, you can filter by unsafe topics, track trends over time, and drill into the results of individual requests to see all detection outcomes, for example: did we detect unsafe topics, and what are the categories. The request body itself (the prompt text) is not stored or exposed; only the results of the analysis are logged.
After reviewing the analytics, you can enforce unsafe topic moderation by creating rules to log or block based on prompt categories in Custom rules.
For example, you might log prompts flagged as sexual content or hate speech for review.
You can use this expression: If (any(cf.llm.prompt.unsafe_topic_categories[*] in {"S10" "S12"})) then Log
Or deploy the rule with the categories field in the dashboard as in the below screenshot.
You can also take a broader approach by blocking all unsafe prompts outright: If (cf.llm.prompt.unsafe_topic_detected)then Block
These rules are applied automatically to all discovered HTTP requests containing prompts, ensuring guardrails are enforced consistently across your AI traffic.
What’s Next
In the coming weeks, Firewall for AI will expand to detect prompt injection and jailbreak attempts. We are also exploring how to add more visibility in the analytics and logs, so teams can better validate detection results. A major part of our roadmap is adding model response handling, giving you control over not only what goes into the LLM but also what comes out. Additional abuse controls, such as rate limiting on tokens and support for more safety categories, are also on the way.
Firewall for AI is available in beta today. If you’re new to Cloudflare and want to explore how to implement these AI protections, reach out for a consultation. If you’re already with Cloudflare, contact your account team to get access and start testing with real traffic.
Cloudflare is also opening up a user research program focused on AI security. If you are curious about previews of new functionality or want to help shape our roadmap, express your interest here.
The digital landscape of corporate environments has always been a battleground between efficiency and security. For years, this played out in the form of “Shadow IT” — employees using unsanctioned laptops or cloud services to get their jobs done faster. Security teams became masters at hunting these rogue systems, setting up firewalls and policies to bring order to the chaos.
But the new frontier is different, and arguably far more subtle and dangerous.
Imagine a team of engineers, deep into the development of a groundbreaking new product. They’re on a tight deadline, and a junior engineer, trying to optimize his workflow, pastes a snippet of a proprietary algorithm into a popular public AI chatbot, asking it to refactor the code for better performance. The tool quickly returns the revised code, and the engineer, pleased with the result, checks it in. What they don’t realize is that their query, and the snippet of code, is now part of the AI service’s training data, or perhaps logged and stored by the provider. Without anyone noticing, a critical piece of the company’s intellectual property has just been sent outside the organization’s control, a silent and unmonitored data leak.
This isn’t a hypothetical scenario. It’s the new reality. Employees, empowered by these incredibly powerful AI tools, are now using them for everything from summarizing confidential documents to generating marketing copy and, yes, even writing code. The data leaving the company in these interactions is often invisible to traditional security tools, which were never built to understand the nuances of a browser tab interacting with a large language model. This quiet, unmanaged usage is “Shadow AI,” and it represents a new, high-stakes security blind spot.
To combat this, we need a new approach—one that provides visibility into this new class of applications and gives security teams the control they need, without impeding the innovation that makes these tools so valuable.
Shadow AI reporting
This is where the Cloudflare Shadow IT Report comes in. It’s not a list of threats to be blocked, but rather a visibility and analytics tool designed to help you understand the problem before it becomes a crisis. Instead of relying on guesswork or trying to manually hunt down every unsanctioned application, Cloudflare One customers can use the insights from their traffic to gain a clear, data-driven picture of their organization’s application usage.
The report provides a detailed, categorized view of your application activity, and is easily narrowed down to AI activity. We’ve leveraged our network and threat intelligence capabilities to identify and classify AI services, identifying general-purpose models like ChatGPT, code-generation assistants like GitHub Copilot, and specialized tools used for marketing, data analysis, or other content creation, like Leonardo.ai. This granular view allows security teams to see not just that an employee is using an AI app, but which AI app, and what users are accessing it.
How we built it
Sharp eyed users may have noticed that we’ve had a shadow IT feature for a while — so what changed? While Cloudflare Gateway, our secure web gateway (SWG), has recorded some of this data for some time, users have wanted deeper insights and reporting into their organization’s application usage. Cloudflare Gateway processes hundreds of millions of rows of app usage data for our biggest users daily, and that scale was causing issues with queries into larger time windows. Additionally, the original implementation lacked the filtering and customization capabilities to properly investigate the usage of AI applications. We knew this was information that our customers loved, but we weren’t doing a good enough job of showing it to them.
Solving this was a cross-team effort requiring a complete overhaul by our analytics and reporting engineers. You may have seen our work recently in this July 2025 blog post detailing how we adopted TimescaleDB to support our analytics platform, unlocking our analytics, allowing us to aggregate and compress long term data to drastically improve query performance. This solves the issue we originally faced around our scale, letting our biggest customers query their data for long time periods. Our crawler collects the original HTTP traffic data from Gateway, which we store into a Timescale database.
Once the data are in our database, we built specific, materialized views in our database around the Shadow IT and AI use case to support analytics for this feature. Whereas the existing HTTP analytics we built are centered around the HTTP requests on an account, these specific views are centered around the information relevant to applications, for example: Which of my users are going to unapproved applications? How much bandwidth are they consuming? Is there an end-user in an unexpected geographical location interacting with an unreviewed application? What devices are using the most bandwidth?
Over the past year, the team has defined a set framework for the analytics we surface. Our timeseries graphs and top-n graphs are all filterable by duration and the relevant data points shown, allowing users to drill down to specific data points and see the details of their corporate traffic. We overhauled Shadow IT by examining the data we had and researching how AI applications were presenting visibility challenges for customers. From there we leveraged our existing framework and built the Shadow IT dashboard. This delivered the application-level visibility that we know our customers needed.
How to use it
1. Proxy your traffic with Gateway
The core of the system is Cloudflare Gateway, an in-line filter and proxy for all your organization’s Internet traffic, regardless of where your users are. When an employee tries to access an AI application, their traffic flows through Cloudflare’s global network. Cloudflare can inspect the traffic, including the hostname, and map the traffic to our application definitions. TLS inspection is optional for Gateway customers, but it is required for ShadowIT analytics.
Interactions are logged and tied to user identity, device posture, bandwidth consumed and even the geographic location. This rich context is crucial for understanding who is using which AI tools, when, and from where.
2. Review application use
All this granular data is then presented in an our Shadow IT Report within your Cloudflare One dashboard. Simply filter for AI applications so you can:
High-Level Overview: Get an immediate sense of your organization’s AI adoption. See the top AI applications in use, overall usage trends, and the volume of data being processed. This will help you identify and target your security and governance efforts.
Granular Drill-Downs: Need more detail? Click on any AI application to see specific users or groups accessing it, their usage frequency, location, and the amount of data transferred. This detail helps you pinpoint teams using AI around the company, as well as how much data is flowing to those applications.
ShadowIT analytics dashboard
3. Mark application approval statuses
We understand that not all AI tools are created equal, and your organization’s comfort level will vary. The Shadow AI Report introduces a flexible framework for Application Approval Status, allowing you to formally categorize each detected AI application:
Approved: These are the AI applications that have passed your internal security vetting, comply with your policies, and are officially sanctioned for use.
Unapproved: These are the red-light applications. Perhaps they have concerning data privacy policies, a history of vulnerabilities, or simply don’t align with your business objectives.
In Review: For those gray-area applications, or newly discovered tools, this status lets your teams acknowledge their usage while conducting thorough due diligence. It buys you time to make an informed decision without immediate disruption.
Review and mark application statuses in the dashboard
4. Enforce policies
These approval statuses come alive when integrated with Cloudflare Gateway policies. This allows you to automatically enforce your AI decisions at the edge of Cloudflare’s network, ensuring consistent security for every employee, anywhere they work.
Here’s how you can translate your decisions into inline protection:
Block unapproved AI: The simplest and most direct action. Create a Gateway HTTP policy that blocks all traffic to any AI application marked as “Unapproved.” This immediately shuts down risky data exfiltration.
Limit “In Review” exposure: For applications still being assessed, you might not want a hard block, but rather a soft limit on potential risks:
Data Loss Prevention (DLP): Cloudflare DLP inspects and analyzes traffic for indicators of sensitive data (e.g., credit card numbers, PII, internal project names, source code) and can then block the transfer. By applying DLP to “In Review” AI applications, you can prevent AI prompts containing this proprietary data, as well as notify the user why the prompt was blocked. This could have saved our poor junior engineer from their well-intended mistake..
Restrict Specific Actions: Block only file uploads allowing basic interaction but preventing mass data egress.
Isolate Risky Sessions: Route traffic for “In Review” applications through Cloudflare’s Browser Isolation. Browser Isolation executes the browser session in a secure, remote container, isolating all data interactions from your corporate network. With it, you can control file uploads, clipboard actions, reduce keyboard inputs and more, reducing interaction with the application while you review it.
Audit “Approved” usage: Even for AI tools you trust, you might want to log all interactions for compliance auditing or apply specific data handling rules to ensure ongoing adherence to internal policies.
This workflow enables your team to consistently audit your organization’s AI usage and easily update policies to quickly and easily reduce security risk.
Forensics with Cloudflare Log Explorer
While the Shadow AI Report provides excellent insights, security teams often need to perform deeper forensic investigations. For these advanced scenarios, we offer Cloudflare Log Explorer.
Log Explorer allows you to store and query your Cloudflare logs directly within the Cloudflare dashboard or via API, eliminating the need to send massive log volumes to third-party SIEMs for every investigation. It provides raw, unsampled log data with full context, enabling rapid and detailed analysis.
Log Explorer customers can dive into Shadow AI logs with pre-populated SQL queries from Cloudflare Analytics, enabling deeper investigations into AI usage:
Log Search’s SQL query interface
How to investigate Shadow AI with Log Explorer:
Trace Specific User Activity: If the Shadow AI Report flags a user with high activity on an “In Review” or “Unapproved” AI app, you can jump into Log Explorer and query by user, application category, or specific AI services.
Analyze Data Exfiltration Attempts: If you have DLP policies configured, you can search for DLP matches in conjunction with AI application categories. This helps identify attempts to upload sensitive data to AI applications and pinpoint exactly what data was being transmitted.
Identify Anomalous AI Usage: The Shadow AI Report might show a spike in usage for a particular AI application. In Log Explorer, you can filter by application status (In Review or Unapproved) for a specific time range. Then, look for unusual patterns, such as a high number of requests from a single source IP address, or unexpected geographic origins, which could indicate compromised accounts or policy evasion attempts.
If AI visibility is a challenge for your organization, the Shadow AI Report is available now for Cloudflare One customers, as part of our broader shadow IT discovery capabilities. Log in to your dashboard to start regaining visibility and shaping your AI governance strategy today.
Ready to modernize how you secure access to AI apps? Reach out for a consultation with our Cloudflare One security experts about how to regain visibility and control.
Or if you’re not ready to talk to someone yet, nearly every feature in Cloudflare One is available at no cost for up to 50 users. Many of our largest enterprise customers start by exploring the products themselves on our free plan, and you can get started here.
Today, we are announcing Cloudflare’s Browser Developer Program, a collaborative initiative to strengthen partnership between Cloudflare and browser development teams.
At Cloudflare, we aim to help build a better Internet. One way we achieve this is by providing website owners with the tools to detect and block unwanted traffic from bots through Cloudflare Challenges or Turnstile. As both bots and our detection systems become more sophisticated, the security checks required to validate human traffic become more complicated. While we aim to strike the right balance, we recognize these security measures can sometimes cause issues for legitimate browsers and their users.
Building a better web together
A core objective of the program is to provide a space for intentional collaboration where we can work directly with browser developers to ensure that both accessibility and security can co-exist. We aim to support the evolving browser landscape, while upholding our responsibility to our customers to deliver the best security products. This program provides a dedicated channel for browser teams to share feedback, report issues, and help ensure that Cloudflare’s Challenges and Turnstile work seamlessly with all browsers.
What the program includes
Browser developers in the program will benefit from:
A two-way communication channel to Cloudflare’s team dedicated to addressing browser-specific concerns, feedback, and issues.
Best practices for building and testing against Cloudflare Challenges and Turnstile.
A private community forum for updates, questions, and discussion between browser developers and Cloudflare engineers.
Early visibility into updates or changes to that may impact how your browser handles Cloudflare Challenges.
(If applicable) Testing integration where we will incorporate your browser into our testing pipeline and monitor its performance with our releases.
This program is designed as a partnership where Cloudflare will, with our best effort, ensure our security products work properly with all browsers, while giving browser developers a voice in how these systems evolve. As an output of this program, we expect to publish clear browser requirements to run Cloudflare Challenges while striking the balance between openness and security.
For end users browsing the web, we continue to support a wide range of browsers. We will continue to update this list based on the insights and collaborations from the Browser Developer Program. We are also committed to ensuring our Challenge interstitial pages and Turnstile provide clear, actionable UI/UX for any error or failed states, making it easier for you to understand and resolve issues you may encounter.
How to apply
If you are working on a browser and want to ensure your users have a seamless experience with Cloudflare-protected websites, we encourage you to apply here.
We’ll ask for basic information about your project and ask you to sign our Browser Developer Program Agreement. In addition, we expect participants to adhere to our Community Code of Conduct and commit to constructive engagement.
Once you’re accepted, you’ll be invited to a private space in the Cloudflare Community where you can engage directly with our team.
Why is this important?
Cloudflare Challenges, a security mechanism to verify whether a visitor is a human or a bot, serve a wide variety of browsers in the world today. Chrome leads with 68.0%, Safari at 8.7%, Firefox at 6.3%, Edge at 4.8%, and Opera at 6.2%. However, the very long tail of browsers that collectively make up the remaining traffic, each representing less than 1% individually but together painting a picture of an incredibly diverse web ecosystem.
Browser traffic distribution, with 100+ browsers comprising the ‘Other’ category
This diversity spans a wide range of environments, each with unique constraints and capabilities:
Emerging and experimental browsers pushing the boundaries of web technology
Privacy-focused browsers such as DuckDuckGo that prioritize user data protection
Embedded browsers inside social media apps like Facebook, Instagram, and TikTok
WebViews used by mobile applications
Gaming and VR browsers such as Oculus for headsets and gaming consoles
Smart device browsers built into classroom displays and home appliances
Supporting this level of diversity poses real engineering challenges. Many of these browsers deviate from standard assumptions. Some lack full support for modern Web APIs, others operate under more stringent data privacy policies, and some are optimized for environments where our script to verify visitors may be hindered or blocked from running properly. These browsers are not bad or malicious. But their behavior may fall outside the typical patterns observed in mainstream browsers, which can lead to problematic or failed Challenge flows which we would like to avoid.
From an engineering perspective, our job is to strike a difficult balance. If our logic is too rigid that it expects only the behaviors of the majority, we risk excluding legitimate users on less conventional platforms. But if we relax our standards too much, we increase the attack surface for abuse. We cannot overfit to the top 5 browsers, nor can we afford to treat all clients as equal in capability or trustworthiness.
The Browser Developer Program is one way to close this gap. By working directly with browser teams, especially those building for niche or emerging environments, we can better understand the constraints they operate under and collaborate to make each of our systems more compatible and resilient.
Join us!
This program is free to join, and is open to any browser developer, no matter the size or the lifecycle stage. Our goal is to listen, learn, and collaborate with browser developers to create a better experience for everyone.
We believe this program will ultimately benefit end users the most. By joining this program, you will help us build solutions that prioritize both the security needs of businesses as well as the diverse ways people access the Internet.
On August 13, security researchers at Tel Aviv University disclosed a new HTTP/2 denial-of-service (DoS) vulnerability that they are calling MadeYouReset (CVE-2025-8671). This vulnerability exists in a limited number of unpatched HTTP/2 server implementations that do not sufficiently enforce restrictions on the number of times a client may send malformed frames. If you’re using Cloudflare for HTTP DDoS mitigation, you’re already protected from MadeYouReset.
Cloudflare was informed of this vulnerability in May through a coordinated disclosure process, and we were able to confirm that our systems were not susceptible, due in large part to the mitigations we put in place during Rapid Reset (CVE-2023-44487). MadeYouReset and Rapid Reset are two conceptually similar HTTP/2 protocol attacks that exploit a fundamental feature within the HTTP/2 specification: stream resets. In the HTTP/2 protocol, a “stream” represents an independent series of HTTP request/response pairs exchanged between the client and server within an HTTP/2 connection. The stream reset feature is intended to allow a client to initiate an HTTP request and subsequently cancel it before the server has delivered its response.
The vulnerability exploited by both MadeYouReset and Rapid Reset lies in the potential for malicious actors to abuse this stream reset mechanism. By repeatedly causing stream resets, attackers can overwhelm a server’s resources. While the server is attempting to process and respond to a multitude of requests, the rapid succession of resets forces it to expend computational effort on starting and then immediately discarding these operations. This can lead to resource exhaustion and impact the availability of the targeted server for legitimate users. The difference between MadeYouReset and Rapid Reset is that, instead of clients issuing stream resets directly, they instead trick servers into resetting streams by sending specially crafted malformed frames.
Fortunately, the MadeYouReset vulnerability only impacts a relatively small number of HTTP/2 implementations. In most major HTTP/2 implementations already in widespread use today, the proactive measures taken to counter Rapid Reset in 2023 have also provided substantial protection against MadeYouReset, limiting its potential impact and preventing a similarly disruptive event.
A note about Cloudflare’s Pingora and its users: Our open-sourced Pingora framework uses the popular Rust-language h2 library for its HTTP/2 support. Versions of h2 prior to 0.4.11 were potentially susceptible to MadeYouReset. Users of Pingora can patch their applications by updating their h2 crate version using the cargo update command. Pingora does not itself terminate inbound HTTP connections to Cloudflare’s network, meaning this vulnerability could not be exploited against Cloudflare’s infrastructure.
We would like to credit researchers Gal Bar Nahum, Anat Bremler-Barr, and Yaniv Harel of Tel Aviv University for discovering this vulnerability and thank them for their leadership in the coordinated disclosure process. Cloudflare always encourages security researchers to submit vulnerabilities like this to our HackerOne Bug Bounty program.
At Cloudflare, we have a simple but audacious goal: to help build a better Internet. That mission has driven us to build one of the world’s largest networks, to stand up for content providers, and to innovate relentlessly to make the Internet safer, faster, and more reliable for everyone, everywhere.
Building world-class products is only part of the battle, however. Fulfilling our mission means making these products accessible, including a pricing model that is fair, predictable, and aligned with the value we provide. If our packaging is confusing, or if our pricing penalizes you for using the service, then we’re not living up to our mission. And the best way to ensure that alignment?
Listen to our customers.
Over the years, your feedback has shaped our product roadmap, helping us evolve to offer nearly 100 products across four solution areas — Application Services, Network Services, Zero Trust Services, and our Developer Platform — on a single, unified platform and network infrastructure. Recently, we’ve heard a new theme emerge: the need for simplicity. You’ve asked us, “A hundred products is a lot. Can you please be more prescriptive?” and “Can you make your pricing more straightforward?”
We heard that feedback loud and clear. That’s why we are incredibly excited to introduce Externa and Interna,two new families of use-case bundles designed to simplify your journey with Cloudflare.
Two challenges, two solutions
When we speak with CIOs, CTOs, and CISOs, their challenges almost always boil down to connecting and protecting two fundamental domains: (1) their external, public-facing infrastructure and (2) their internal, private systems.
Historically, the industry has sold dozens of point products to solve these problems with a series of band-aids. A WAF from one vendor, a DDoS scrubber from another, a VPN from a third. The result is a mess of complexity, vendor lock-in, and a security posture riddled with gaps. It’s expensive, inefficient, and insecure.
We think that’s backwards. There’s a simpler, more integrated approach with our new solution packages:
Externa to connect and protect the part of your business facing the public Internet — the websites, APIs, applications, and networks that are the front doors and face of your business
Interna to connect and protect your internal private systems and resources — the employees, devices, data, and networks that are at the heart of your organization
These packages represent our prescriptive view on what a modern connectivity and security architecture should look like. And, they’re best when used together.
Externa: Connect and protect external, public-facing systems
With Externa, we’re solving for the complexity of connecting and protecting your public-facing infrastructure. A key principle here is fairness. We’ve seen competitors send customers astronomical bills after a DDoS attack because they charge for all traffic — clean or malicious. It’s like a fire department charging you for the water they use to save your house. We don’t do that and never have, which is why with Externa, you only pay for legitimate traffic.
We believe a simple, integrated model will reduce total cost of ownership and lead to a stronger security posture. A patchwork of band-aids is a lot of overhead to manage. Externa bundles our WAF, DDoS, API security, networking, application performance services, and more, into a simple package with units of measure that scale with value.
What does this mean for you?
No attack traffic tax: your costs remain predictable, even during a massive DDoS attack.
Simple, value-driven price units: no origin fetch fees, duplicate charges per request, or paying per rule.
And because security shouldn’t stop at your perimeter, every Externa package includes 50 seats of Interna, our SASE solution package.
Interna: Connect and protect internal, private systems
With Interna, we’re fixing the broken economics of networking and security. The old models were built for a world where everyone came into an office. The world has changed: in today’s hybrid work environment, your internal network isn’t just confined to your offices and data centers anymore. It’s wherever your employees and data are. But many vendors still effectively charge you twice for the same user — once for the seat and again when they’re using the office network.
We believe you should never pay for user bandwidth. Our model recognizes that a user is a user, wherever they are; we don’t double-charge for bandwidth; we actually subtract the traffic that’s generated from user device clients from your WAN meter. We’ve gone a step further: every Interna user license contributes to a shared bandwidth pool that you can use to build a modern, secure, and fast corporate WAN. With Interna, the budget you already have for security now builds your corporate network, too.
What does this mean for you?
Never pay for user bandwidth: a single per-seat price covers your users wherever they work, reducing your WAN bill and eliminating the hybrid work penalty.
Each license expands your WAN: pooled bandwidth from user licenses helps you replace expensive, dedicated WAN contracts.
All-inclusive security: premium features like Digital Experience Monitoring (DEM) and both in-line and API-based Cloud Access Security Broker (CASB) are included, not expensive add-ons.
The unifying Cloudflare advantage
Our unique advantage has always been our network. Serving millions of customers — from individual developers on our Free plan to the world’s largest enterprises — on one platform and one global network gives us incredible leverage. It’s what allows us to offer robust free services and protect journalists and nonprofits. It’s also what makes our platform structurally better: our AI models are trained on data from 20% of the web, providing more effective threat detection than siloed platforms ever could.
We believe that the same structural advantage should help businesses of all sizes scale without compromise. As companies grow, they often face a difficult choice: does the patchwork of point products they started with become too complex to manage, or does the integrated platform they chose become too limited? You asked for a more prescriptive path, one that solves this false choice.
With our new Externa and Interna bundles, that trade-off is over. The Essentials, Advantage, and Premier tiers in each family are designed to provide a clear path for businesses of all sizes, allowing you to adopt stage-appropriate networking and security solutions that scale seamlessly. As your business grows, you move up the tiers from Essentials to Advantage to Premier, gaining access to more advanced features along the way. It’s growth, simplified.
Ready for the next steps towards simplified security and connectivity?
We’ve aimed to deliver pricing and packaging that is fair, accessible, predictable, and scales with value. This is what it means to align our pricing and packaging with our principles. It’s another step toward a better Internet.
We are observing stealth crawling behavior from Perplexity, an AI-powered answer engine. Although Perplexity initially crawls from their declared user agent, when they are presented with a network block, they appear to obscure their crawling identity in an attempt to circumvent the website’s preferences. We see continued evidence that Perplexity is repeatedly modifying their user agent and changing their source ASNs to hide their crawling activity, as well as ignoring — or sometimes failing to even fetch — robots.txtfiles.
The Internet as we have known it for the past three decades is rapidly changing, but one thing remains constant: it is built on trust. There are clear preferences that crawlers should be transparent, serve a clear purpose, perform a specific activity, and, most importantly, follow website directives and preferences. Based on Perplexity’s observed behavior, which is incompatible with those preferences, we have de-listed them as a verified bot and added heuristics to our managed rules that block this stealth crawling.
How we tested
We received complaints from customers who had both disallowed Perplexity crawling activity in their robots.txt files and also created WAF rules to specifically block both of Perplexity’s declared crawlers: PerplexityBot and Perplexity-User. These customers told us that Perplexity was still able to access their content even when they saw its bots successfully blocked. We confirmed that Perplexity’s crawlers were in fact being blocked on the specific pages in question, and then performed several targeted tests to confirm what exact behavior we could observe.
We created multiple brand-new domains, similar to testexample.com and secretexample.com. These domains were newly purchased and had not yet been indexed by any search engine nor made publicly accessible in any discoverable way. We implemented a robots.txt file with directives to stop any respectful bots from accessing any part of a website:
We conducted an experiment by querying Perplexity AI with questions about these domains, and discovered Perplexity was still providing detailed information regarding the exact content hosted on each of these restricted domains. This response was unexpected, as we had taken all necessary precautions to prevent this data from being retrievable by their crawlers.
Obfuscating behavior observed
Bypassing Robots.txt and undisclosed IPs/User Agents
Our multiple test domains explicitly prohibited all automated access by specifying in robots.txt and had specific WAF rules that blocked crawling from Perplexity’s public crawlers. We observed that Perplexity uses not only their declared user-agent, but also a generic browser intended to impersonate Google Chrome on macOS when their declared crawler was blocked.
Declared
Mozilla/5.0 AppleWebKit/537.36 (KHTML, like Gecko; compatible; Perplexity-User/1.0; +https://perplexity.ai/perplexity-user)
20-25m daily requests
Stealth
Mozilla/5.0 (Macintosh; Intel Mac OS X 10_15_7) AppleWebKit/537.36 (KHTML, like Gecko) Chrome/124.0.0.0 Safari/537.36
3-6m daily requests
Both their declared and undeclared crawlers were attempting to access the content for scraping contrary to the web crawling norms as outlined in RFC 9309.
This undeclared crawler utilized multiple IPs not listed in Perplexity’s official IP range, and would rotate through these IPs in response to the restrictive robots.txt policy and block from Cloudflare. In addition to rotating IPs, we observed requests coming from different ASNs in attempts to further evade website blocks. This activity was observed across tens of thousands of domains and millions of requests per day. We were able to fingerprint this crawler using a combination of machine learning and network signals.
An example:
Of note: when the stealth crawler was successfully blocked, we observed that Perplexity uses other data sources — including other websites — to try to create an answer. However, these answers were less specific and lacked details from the original content, reflecting the fact that the block had been successful.
How well-meaning bot operators respect website preferences
In contrast to the behavior described above, the Internet has expressed clear preferences on how good crawlers should behave. All well-intentioned crawlers acting in good faith should:
Be transparent. Identify themselves honestly, using a unique user-agent, a declared list of IP ranges or Web Bot Auth integration, and provide contact information if something goes wrong.
Be well-behaved netizens. Don’t flood sites with excessive traffic, scrape sensitive data, or use stealth tactics to try and dodge detection.
Serve a clear purpose. Whether it’s powering a voice assistant, checking product prices, or making a website more accessible, every bot has a reason to be there. The purpose should be clearly and precisely defined and easy for site owners to look up publicly.
Separate bots for separate activities. Perform each activity from a unique bot. This makes it easy for site owners to decide which activities they want to allow. Don’t force site owners to make an all-or-nothing decision.
Follow the rules. That means checking for and respecting website signals like robots.txt, staying within rate limits, and never bypassing security protections.
OpenAI is an example of a leading AI company that follows these best practices. They clearly outline their crawlers and give detailed explanations for each crawler’s purpose. They respect robots.txt and do not try to evade either a robots.txt directive or a network level block. And ChatGPT Agent is signing http requests using the newly proposed open standard Web Bot Auth.
When we ran the same test as outlined above with ChatGPT, we found that ChatGPT-User fetched the robots file and stopped crawling when it was disallowed. We did not observe follow-up crawls from any other user agents or third party bots. When we removed the disallow directive from the robots entry, but presented ChatGPT with a block page, they again stopped crawling, and we saw no additional crawl attempts from other user agents. Both of these demonstrate the appropriate response to website owner preferences.
How can you protect yourself?
All the undeclared crawling activity that we observed from Perplexity’s hidden User Agent was scored by our bot management system as a bot and was unable to pass managed challenges. Any bot management customer who has an existing block rule in place is already protected. Customers who don’t want to block traffic can set up rules to challenge requests, giving real humans an opportunity to proceed. Customers with existing challenge rules are already protected. Lastly, we added signature matches for the stealth crawler into our managed rule that blocks AI crawling activity. This rule is available to all customers, including our free customers.
What’s next?
We announced Content Independence Day almost one month ago, giving content creators and publishers more control over how their content is accessed. Today, over two and a half million websites have chosen to completely disallow AI training through our managed robots.txt feature or our managed rule blocking AI Crawlers. Every Cloudflare customer is now able to selectively decide which declared AI crawlers are able to access their content in accordance with their business objectives.
We expected a change in bot and crawler behavior based on these new features, and we expect that the techniques bot operators use to evade detection will continue to evolve. Once this post is live the behavior we saw will almost certainly change, and the methods we use to stop them will keep evolving as well.
Cloudflare is actively working with technical and policy experts around the world, like the IETF efforts to standardize extensions to robots.txt, to establish clear and measurable principles that well-meaning bot operators should abide by. We think this is an important next step in this quickly evolving space.
Earlier this year, a group of external researchers identified and reported a vulnerability in Cloudflare’s SSL for SaaS v1 (Managed CNAME) product offering through Cloudflare’s bug bounty program. We officially deprecated SSL for SaaS v1 in 2021; however, some customers received extensions for extenuating circumstances that prevented them from migrating to SSL for SaaS v2 (Cloudflare for SaaS). We have continually worked with the remaining customers to migrate them onto Cloudflare for SaaS over the past four years and have successfully migrated the vast majority of these customers. For most of our customers, there is no action required; for the very small number of SaaS v1 customers, we will be actively working to help migrate you to SSL for SaaS v2 (Cloudflare for SaaS).
Background on SSL for SaaS v1 at Cloudflare
Back in 2017, Cloudflare announced SSL for SaaS, a product that allows SaaS providers to extend the benefits of Cloudflare security and performance to their end customers. Using a “Managed CNAME” configuration, providers could bring their customer’s domain onto Cloudflare. In the first version of SSL for SaaS (v1), the traffic for Custom Hostnames is proxied to the origin based on the IP addresses assigned to the zone. In this Managed CNAME configuration, the end customers simply pointed their domains to the SaaS provider origin using a CNAME record. The customer’s origin would then be configured to accept traffic from these hostnames.
What are the security concerns with v1 (Managed CNAME)?
While SSL for SaaS v1 enabled broad adoption of Cloudflare for end customer domains, its architecture introduced a subtle but important security risk – one that motivated us to build Cloudflare for SaaS.
As adoption scaled, so did our understanding of the security and operational limitations of SSL for SaaS v1. The architecture depended on IP-based routing and didn’t verify domain ownership before proxying traffic. That meant that any custom hostname pointed to the correct IP could be served through Cloudflare — even if ownership hadn’t been proven. While this produced the desired functionality, this design introduced risks and created friction when customers needed to make changes without downtime.
A malicious CF user aware of another customer’s Managed CNAME (via social engineering or publicly available info), could abuse the way SSL for SaaS v1 handles host header redirects through DNS manipulation and Man-in-The-Middle attack because of the way Cloudflare serves the valid TLS certificate for the Managed CNAME.
For regular connections to Cloudflare, the certificate served by Cloudflare is determined by the SNI provided by the client in the TLS handshake, while the zone configuration applied to a request is determined based on the host-header of the HTTP request.
In contrast, SSL for SaaS v1/Managed CNAME setups work differently. The certificate served by Cloudflare is still based on the TLS SNI, but the zone configuration is determined solely based on the specific Cloudflare anycast IP address the client connected to.
For example, let’s assume that 192.0.2.1 is the anycast IP address assigned to a SaaS provider. All connections to this IP address will be routed to the SaaS provider’s origin server, irrespective of the host-header in the HTTP request. This means that for the following request:
The certificate served by Cloudflare will be valid for www.cloudflare.com, but the request will not be sent to the origin server of www.cloudflare.com. It will instead be sent to the origin server of the SaaS provider assigned to the 192.0.2.1 IP address.
While the likelihood of exploiting this vulnerability is low and requires multiple complex conditions to be met, the vulnerability can be paired with other issues and potentially exploit other Cloudflare customers if:
The adversary is able to perform DNS poisoning on the target domain to change the IP address that the end-user connects to when visiting the target domain
The adversary is able to place a malicious payload on the Managed CNAME customer’s website, or discovers an existing cross-site scripting vulnerability on the website
Mitigation: A Phased Transition
To address these challenges, we launched SSL for SaaS v2 (Cloudflare for SaaS) and deprecated SSL for SaaS v1 in 2021. Cloudflare for SaaS transitioned away from IP-based routing towards a verified custom hostname model. Now, custom hostnames must pass a hostname verification step alongside SSL certificate validation to proxy to the customer origin. This improves security by limiting origin access to authorized hostnames and reduces downtime through hostname pre-validation, which allows customers to verify ownership before traffic is proxied through Cloudflare.
When Cloudflare for SaaS became generally available, we began a careful and deliberate deprecation of the original architecture. Starting in March 2021, we notified all v1 users of the then upcoming sunset in favor of v2 in September 2021 with instructions to migrate. Although we officially deprecated Managed CNAME, some customers were granted exceptions and various zones remained on SSL for SaaS v1. Cloudflare was notified this year through our Bug Bounty program that an external researcher had identified the SSL for SaaS v1 vulnerabilities in the midst of our continued efforts to migrate all customers.
The majority of customers have successfully migrated to the modern v2 setup. For those few that require more time to migrate, we’ve implemented compensating controls to limit the potential scope and reach of this issue for the remaining v1 users. Specifically:
This feature is unavailable for new customer accounts, and new zones within existing customer accounts, to configure via the UI or API
Cloudflare actively maintains an allowlist of zones & customers that currently use the v1 service
We have also implemented WAF custom rules configurations for the remaining customers such that any requests targeting an unauthorized destination will be caught and blocked in their L7 firewall.
The architectural improvement of Cloudflare for SaaS not only closes the gap between certificate and routing validation but also ensures that only verified and authorized domains are routed to their respective origins—effectively eliminating this class of vulnerability.
Next steps
There is no action necessary for Cloudflare customers, with the exception of remaining SSL for SaaS v1 customers, with whom we are actively working to help migrate. While we move to the final phases of sunsetting v1, Cloudflare for SaaS is now the standard across our platform, and all current and future deployments will use this secure, validated model by default.
Conclusion
As always, thank you to the external researchers for responsibly disclosing this vulnerability. We encourage all of our Cloudflare community to submit any identified vulnerabilities to help us continually improve upon the security posture of our products and platform.
We also recognize that the trust you place in us is paramount to the success of your infrastructure on Cloudflare. We consider these vulnerabilities with the utmost concern and will continue to do everything in our power to mitigate impact. Although we are confident in our steps to mitigate impact, we recognize the concern that such incidents may induce. We deeply appreciate your continued trust in our platform and remain committed not only to prioritizing security in all we do, but also acting swiftly and transparently whenever an issue does arise.
Recent security research has highlighted the importance of CI/CD pipeline configurations, as documented in AWS Security Bulletin AWS-2025-016. This post pulls together existing guidance and recommendations into one guide.
Continuous integration and continuous deployment (CI/CD) practices help development teams deliver software efficiently and reliably. AWS CodeBuild provides managed build services that integrate with source code repositories like GitHub, GitLab, and other Source Control Management (SCM) systems. While this guide uses GitHub examples, the security principles and webhook configuration approaches apply to other supported source control systems.
However, certain configurations require careful attention. We strongly recommend that you do not use automatic pull request builds from untrusted repository contributors without proper security controls and a clear understanding of your threat model. This configuration allows untrusted code to execute in your build environment with access to repository credentials and environment variables. Webhook configurations determine which repository events trigger builds and what code gets executed during the build process. Understanding these configurations is essential for maintaining appropriate security boundaries while preserving the automation benefits that make CI/CD valuable.
Security teams and DevOps engineers can use these practical approaches to configure AWS CodeBuild to meet their security goals while maintaining development velocity. We’ll explore webhook configurations, trust boundaries, and implementation strategies that emphasize threat model assessment, least-privilege access, and proactive monitoring of your pipeline configurations.
Security of the pipeline implications
Under the shared responsibility model, while AWS manages the security of the underlying AWS CodeBuild infrastructure, customers are responsible for securing their pipeline configurations, access controls, and the code that runs within their build environments. This shared responsibility is critical when considering the security of the pipeline itself.
When AWS CodeBuild processes pull requests automatically, it builds the code in an environment with access to repository credentials, environment variables, and potentially sensitive information. This creates specific security of the pipeline considerations:
Repository access: AWS CodeBuild projects require repository credentials to read source code and create webhooks. These credentials provide specific permissions that vary based on your configuration.
Build execution: The build process runs the retrieved source code, which may include build scripts, dependency definitions, or test files from pull requests.
Build environment: AWS CodeBuild environments may have access to environment variables, AWS credentials, or other configuration data needed for the build process.
Establishing trust boundaries
Effective security of the pipeline starts with clearly defining trust boundaries for different types of code contributions:
Internal contributors: Team members with repository write access who have been verified through your organization’s access management processes.
External contributors: Contributors from outside your organization who submit pull requests from forked repositories.
Automated processing: Code that runs without manual review as part of the build process.
These trust boundaries form the foundation for threat modeling your specific environment. Internal and trusted environments can often rely more heavily on automation with contributor filtering and least-privilege controls. Public and open source projects require more stringent controls due to the inherent risks of processing untrusted contributions – these environments benefit from stricter webhook filtering, comprehensive approval gates, or the self-hosted GitHub Actions runner approach discussed later.
The key principle is finding the appropriate balance between security controls and development velocity based on your specific risk profile and contributor trust levels. With these considerations in mind, let’s examine how to assess and configure your current AWS CodeBuild webhook settings.
Configuring secure webhooks
Webhooks represent the preferred mechanism by which external events trigger AWS CodeBuild processes. When properly configured, webhooks provide a powerful and efficient way to automate your build processes in response to repository changes. However, improper webhook configuration can create security vulnerabilities by allowing untrusted code to execute in privileged environments.The security of your webhook configuration depends on understanding exactly which events trigger builds, what level of access those builds have, and what code gets executed during the build process. This section provides a comprehensive approach to authoring, assessing, configuring, and maintaining secure webhook configurations.
Assessing current webhook configurations
Begin by reviewing your existing AWS CodeBuild projects to understand their current webhook configurations. The following AWS CLI commands provide a systematic approach to gathering this information:
# List all CodeBuild projects in your region
aws codebuild list-projects --region us-west-2

# Retrieve detailed configuration for analysis
aws codebuild batch-get-projects --region us-west-2 \
  --names $(aws codebuild list-projects --region us-west-2 \
  --query 'projects[*]' --output text | tr '\n' ' ')
When you run these commands, pay particular attention to the webhook section in the output. This section contains the filterGroups configuration, which determines exactly which repository events trigger builds.
Now that you understand how to review your current setup, let’s examine common configuration patterns and their security implications.
Webhook configuration patterns
Understanding common webhook configuration patterns helps you quickly identify potential security concerns and implement appropriate improvements. The following patterns represent different approaches to webhook configuration, each with specific security implications.
Note: These patterns are not recommended for use and are shown here to help you identify configurations that may need attention.
This configuration allows contributors who can create a pull request to trigger code execution in your build environment. We strongly recommend that you do not use automatic pull request builds from untrusted repository contributors.
Configuration requiring immediate review – No event filtering
Without filtering, this configuration can trigger builds for a wide variety of repository events.
Recommended secure webhook configurations
The following configurations represent security best practices that balance automation benefits with appropriate security controls. These patterns help to reduce security risks while maintaining the development velocity that makes CI/CD valuable.
Push-based builds (Recommended for most use cases)
Push-based builds make sure that only users with repository write access can trigger builds, which means contributors have already been vetted through your repository’s access control mechanisms.
Organizations that rely heavily on external open-source contributions may find this approach too restrictive. For example, a popular open-source project that receives dozens of pull requests daily from external contributors would need to manually merge each contribution before builds can run, significantly slowing down the contribution review process. In such cases, contributor-filtered builds or the self-hosted GitHub Actions runner approach may be more appropriate.
Contributor-filtered builds (Recommended for trusted contributors only)
This configuration allows pull request builds from specific, trusted contributors.
Important: Filtering applies to the GitHub account ID, not repository ownership. Contributors working from forked repositories can still introduce untrusted code that executes in your build environment.
Before implementing these configurations in your environment, consider these key factors that will help facilitate a smooth transition.
Webhook configuration implementation steps
While implementing the webhook security measures below, consider these broader practices:
Threat modeling: Assess your specific risk profile before selecting approaches.
Infrastructure as code: Use Infrastructure as Code (IaC) tools for production implementations.
Gradual implementation: Implement changes incrementally with observation periods.
Testing and rollback: Validate changes in non-production environments first.
The following implementation approach moves from most restrictive to more automated configurations. Choose the approach that best fits your organization’s risk tolerance and operational requirements. This three-step process moves from the most restrictive approach to more automated configurations while maintaining security controls. Each step builds upon the previous one, creating layers of security that work together to protect your pipeline.
Note: The following examples use the AWS CLI for demonstration purposes. Similar configuration steps can be performed using the AWS Management Console through the AWS CodeBuild project settings.
Step 1: Configure push-only builds
Push-based builds help make sure that only verified contributors can trigger builds. This approach is more secure, because contributors must already be vetted through your repository’s access control mechanisms before they can push code. Configure your webhook to trigger only on push events:
Branch-based filtering adds an additional layer of security by making sure that builds are triggered only for changes to specific branches. This approach recognizes that not all branches in a repository have the same security requirements or risk profiles.
For example, changes to main or production branches typically require more stringent security controls than changes to feature or development branches. By implementing branch-based filtering, you can apply appropriate security measures based on the criticality and exposure of different branches.
Contributor filtering can be used to manage pull request builds by allowing automation for trusted contributors while requiring manual review for others. This approach recognizes that different contributors represent different risk profiles and should be treated accordingly.
The first step in implementing contributor filtering is identifying the GitHub user IDs of your trusted contributors.
Retrieve GitHub user IDs for trusted contributors:
Important: Contributor allowlists require ongoing maintenance as team membership changes. Consider using Infrastructure as Code templates like the Cloudformation examples to manage webhook configurations and contributor lists in version control.
Webhook filtering provides the first layer of security by controlling which events trigger builds. However, comprehensive pipeline security requires additional controls around the permissions and credentials available to those builds once they execute. The following section covers how to implement defense-in-depth security through proper access controls and credential management.
Access control and credential management
This section covers specific approaches to limit the permissions available to build processes, scope repository access tokens appropriately, and create isolated environments that help contain potential security issues. These practices work together to implement defense-in-depth security while maintaining the operational benefits of automated CI/CD workflows.
Implementing least-privilege access
AWS CodeBuild projects require IAM service roles to access AWS resources during the build process. The principle of least privilege dictates that each role should have only the minimum permissions necessary to perform its intended function. By creating separate, purpose-built IAM roles for different types of builds, you can help reduce the potential impact of unauthorized access to build environments.
The following examples demonstrate how to structure minimal IAM roles for different build scenarios. These examples serve as starting points that you should customize based on your specific requirements, adding only the permissions your builds actually need.
Service role configuration
Create minimal IAM roles that provide only the permissions required for specific build types:
Leveraging IAM Access Analyzer for CodeBuild security
AWS IAM Access Analyzer can generate least-privilege policies for your AWS CodeBuild service roles based on actual CloudTrail activity from your build executions. This eliminates guesswork by analyzing the specific AWS API calls your builds make, rather than requiring you to predict what permissions might be needed.
After running your CodeBuild projects for a representative period, use Access Analyzer’s policy generation feature to create refined policies. This approach proves particularly valuable for complex build processes where the required permissions might not be immediately obvious.
When processing external contributions, the principle of least privilege becomes important for repository access tokens. If an unauthorized user gains access to a token through an untrusted build, properly scoped tokens limit the potential impact to only the permissions necessary for the build process.
Configure fine-grained GitHub Personal Access Tokens with minimal permissions to help reduce this risk. Even if accessed inappropriately, a properly scoped token can only read source code (already accessible through the PR) and write status messages – it cannot push code, modify repository settings, or access other repositories.
The following permissions represent the minimum required access for processing external pull requests, demonstrating how to limit token scope to only essential operations:
contents:read – Read-only access to repository source code (already accessible through the PR)
statuses:write – Write commit status messages only (cannot modify code or settings)
metadata:read – Access basic repository information (name, description, public status)
Important: Use fine-grained personal access tokens restricted to the target repository only. Otherwise, this could allow access to other repositories beyond what is necessary for the build process.
This scoped approach ensures that even if a token is accessed inappropriately, the potential impact is limited to reading already-accessible information and writing status messages. The token cannot push code, modify repository settings, create webhooks, or access other repositories.
Credential storage and rotation
The following examples demonstrate how to securely store and reference these tokens using AWS Secrets Manager. AWS Secrets Manager provides automatic rotation capabilities, encryption at rest and in transit, and fine-grained access controls that help prevent tokens from being exposed in build logs or configuration files. This approach also enables centralized token management across multiple CodeBuild projects while maintaining audit trails of token access.
The centralized storage enables credential rotation capabilities, helping to minimize the window of exposure compared to hardcoded tokens that would require infrastructure updates to rotate.
Build environment isolation
Establishing proper build environment security controls helps maintain pipeline integrity. The foundation of this approach involves implementing separation between test and release builds, which helps prevent credential escalation and limits the scope of potential unauthorized access.
Network isolation represents another layer of protection. Configure VPC settings specifically for builds that process external code by creating dedicated security groups with carefully restricted outbound access. These security groups should permit only necessary connections, such as HTTPS traffic for downloading legitimate dependencies, while blocking unnecessary network access that could be exploited by untrusted code.
Update your AWS CodeBuild projects to leverage this network isolation through proper VPC configuration, including specified subnets and the restricted security groups you’ve established.
Multi-stage pipeline security with human review gates
Implementing security controls across multiple pipeline stages helps provide proper validation and approval processes, especially when processing external contributions. This approach combines automated scanning with human oversight to identify issues before they reach production.
Code inspection integration
Configure your build specification to automatically run security tools like Automated Security Helper during the build process. These tools scan for code security issues and dependency problems, generating detailed reports for review.
Structure the build to continue execution even when issues are found, allowing all scans to complete while automatically failing builds that contain security problems requiring attention. Store all scan artifacts to provide security teams with detailed information for approval decisions.
Manual approval gates
After code passes automated security scans, configure manual approval gates to involve human reviewers for final validation. This helps provide appropriate human review before proceeding to sensitive environments.
The access control and credential management practices outlined in this section provide specific, actionable approaches to implementing defense-in-depth security for AWS CodeBuild pipelines. These controls work together to create multiple layers of protection while maintaining the operational benefits that make CI/CD automation valuable.
Alternative approach – Self-hosted GitHub Actions runners
AWS CodeBuild’s self-hosted GitHub Actions runner capability addresses the configuration issues described in this guide by isolating repository credentials from the build environment and using GitHub Actions’ execution framework instead of AWS CodeBuild webhook processing.
For organizations that need to process external contributions automatically, configure runners with proper access controls, use ephemeral runners to minimize persistent access, and apply standard security practices for runner management.
The security controls outlined in previous sections provide protection at build time, but comprehensive defense-in-depth security requires ongoing visibility into your pipeline activities and configuration changes. Monitoring and compliance tracking serve as the final layer of your security framework, helping you detect configuration drift, audit access patterns, and maintain security posture over time.
AWS CloudTrail provides detailed logging of API calls made to AWS services, including AWS CodeBuild. Enable CloudTrail logging to create a comprehensive audit trail of all build-related activities in your environment.
AWS Config tracks AWS CodeBuild project configurations over time, providing an inventory of projects and a complete history of configuration changes. This includes webhook modifications, resource relationships, and compliance tracking across your environment. Configure AWS Config to monitor AWS CodeBuild projects and receive notifications when security-critical configurations like webhook filters are modified. For more information, see the AWS Config sample with CodeBuild documentation.
Conclusion
Implementing defense-in-depth security for AWS CodeBuild pipelines requires layered controls that address different security considerations. The most effective approach combines webhook filtering, access controls, credential management, and monitoring to provide comprehensive protection. By implementing these layered practices outlined in this guide, you can maintain development velocity while establishing robust pipeline security. Key principles to remember:
Assess your threat model first – different projects require different security approaches
Establish clear trust boundaries between different types of contributors
Use webhook filtering to control when builds are triggered
Implement least-privilege access for build environments
Monitor and audit configurations regularly using AWS Config and CloudTrail
Store secrets in AWS Secrets Manager or SSM Parameter Store and enable rotation
AWS CodeBuild provides the flexibility to implement these security measures while maintaining the operational benefits that make pipelines valuable. Apply the configurations and mitigations in this guide based on your specific risk profile and operational requirements. Regular review and updates of your configurations will help your pipelines remain secure as your organization’s needs evolve.
Stay tuned for additional practical guides for implementing CI/CD security best practices. If you have questions or feedback about this post, including suggestions for topics that would help you most, start a new thread on re:Post : Begimher or contact AWS Support.
As introduced in Part 1 of this series, implementing secure file sharing solutions in AWS requires a comprehensive understanding of your organization’s needs and constraints. Before selecting a specific solution, organizations must evaluate five fundamental areas: access patterns and scale, technical requirements, security and compliance, operational requirements, and business constraints. These areas cover everything from how files will be shared and what protocols are needed, to security measures, day-to-day operations, and business limitations.
See Part 1 of this series for detailed information about each of these fundamental areas and their specific considerations. Part 1 also covers solutions including AWS Transfer Family, Transfer Family web apps, and Amazon Simple Storage Service (Amazon S3) pre-signed URLs. This part continues our analysis with additional AWS file sharing solutions to help you make an informed decision based on your specific requirements.
Solutions
Let’s start by looking at the various file sharing mechanisms that AWS supports. The following table identifies the key AWS services needed for each solution, describes the security and cost implications of the solutions, and describes their complexity and protocol support capabilities.
Solution
AWS services
Security features
Cost*
Region control
CloudFront signed URLs
CloudFront, Amazon S3, and Lambda
Optional edge security using AWS Lambda@Edge, WAF integration, SSL/TLS, geo restrictions, and AWS Shield Standard (included automatically)
Content delivery network (CDN) costs, request pricing, and data transfer fees
Global service by design; origin can be AWS Region-specific
Amazon VPC endpoint service
AWS PrivateLink, Amazon VPC, and Network Load Balancer (NLB)
Complete network isolation, private connectivity, and multi-layer security
Endpoint hourly charges, NLB costs, and data processing fees
Service endpoints are strictly Region-specific; must create endpoints in each Region where access is needed
Data transfer fees apply based on standard S3 rates
Amazon VPC endpoint charges apply when using VPC endpoints with access points
Access points are Region-specific
Each access point is created in the same Region as its S3 bucket
Cross-Region access requires separate access points in each Region
VPC-specific access points are limited to the VPC’s Region
The following table shows the solutions described in Part 1.
Solution
AWS services
Security features
Cost*
Region control
AWS Transfer Family
Transfer Family, Amazon S3, API Gateway, and Lambda
Managed security, encryption in transit and at rest, IAM integration, and custom authentication
$0.30 per hour per protocol, data transfer fees, and storage costs
Can deploy to specific AWS Regions, can only transfer files to and from S3 buckets in the same Region
Transfer Family web apps
Transfer Family, S3, and CloudFront
Browser-based access, IAM Identity Center integration, and S3 Access Grants
Pay-per-file operation, CloudFront costs, and storage costs
Uses CloudFront (global) for web access, but backend components can be Region-specific
Amazon S3 pre-signed URLs
S3
Time-limited URLs, IAM controls for URL generation, and HTTPS
S3 request and data transfer fees
Can be restricted to specific Regions
Serverless application with Amazon S3 presigned URLs
S3, Lambda, and API Gateway
Time-limited URLs, HTTPS, IAM controls, customizable authentication
Pay per request and minimal infrastructure cost
Components can be Region-specific
* Pricing information provided is based on AWS service rates at the time of publication and is intended as an estimation only. Additional costs may be incurred depending on your specific implementation and usage patterns. For the most current and accurate pricing details, please consult the official AWS pricing pages for each service mentioned.
Let’s examine each of the solutions in detail. Part 1 talked about AWS Transfer Family, Transfer Family web apps, and Amazon S3 pre-signed URLs. Here in Part 2, we explain the remaining solutions to help you make the right choice for your use case.
CloudFront signed URLs with Amazon S3
Amazon CloudFront signed URLs combine Amazon S3 storage with the global edge network of CloudFront to deliver files securely with lower latency.
CloudFront edge locations cache content geographically closer to users, which usually reduces latency and gives better performance for users. CloudFront also reduces the number of origin requests to Amazon S3. CloudFront integration with AWS Shield and AWS WAF provides options for additional security layers, helping to protect against DDoS events and unintended requests. You can use custom domains with AWS-provided or your own SSL/TLS certificates managed through AWS Certificate Manager (ACM), helping to facilitate secure connections from users to edge locations.
When a user requests a file, the system generates a signed URL using either a CloudFront key pair or a custom trusted signer (such as Lambda Edge) that includes security parameters such as IP restrictions, time windows, and custom policies. The major difference is the content distribution network (CDN) making performance faster by caching data geographically close to the user downloading it.
The built-in logging and monitoring capabilities of CloudFront provide detailed insights into content access patterns, cache hit ratios, and security events. CloudFront integrates seamlessly with Amazon S3 to support origin access identity (OAI), helping to make sure that the S3 objects can be accessed only through CloudFront and not directly through S3 APIs.
Figure 1: CloudFront signed URLs with Amazon S3 architecture
Pros
If Amazon S3 pre-signed URLs sound good, but you need higher performance at a global scale, CloudFront signed URLs are the right choice. The AWS global edge network has points of presence (POPs) all over the world, which significantly reduces latency for users and minimizes data transfer costs through caching. This architecture provides substantial cost savings for frequently accessed content, because edge locations serve cached copies without retrieving objects from the S3 origin. The integration with AWS security services offers protection against various threats, including sophisticated distributed denial of service (DDoS) events and web application issues, making it particularly suitable for public-facing file sharing applications. Choose CloudFront instead of S3 if you tend to make the same file available to many people who download it many times, such as in software distribution or documentation distribution.
The solution’s security model provides extensive flexibility in access control implementation. You can define granular permissions through custom policies, implement geo-restriction rules, and enforce IP-based access controls. The ability to use custom TLS certificates and domains maintains brand consistency while helping to facilitate secure communications. The integration with AWS WAF enables advanced request filtering and rate limiting, while detailed access logging and real-time metrics provide visibility into content delivery and security events. The solution’s support for both signed URLs and signed cookies offers flexibility in implementing various access control scenarios. Signed cookies are used when you want to provide access to multiple restricted files. For example, if you need to provide access to many files in a private directory, you can use signed cookies to avoid having to create individual signed URLs for each file. When choosing between CloudFront signed URLs (ideal for individual file access) or signed cookies (better for providing access to multiple files, like a subscriber’s content library), consider your content distribution needs and whether your clients support cookies.
Cons
If you implement CloudFront, you must develop expertise in its configuration options, including robust key management processes and secure key rotation procedures. Self-managed certificates don’t automatically renew. You must track expiration dates and make sure you renew on time, or your users will get warnings and errors when they try to download. ACM can simplify TLS certificate management and automatically renew certificates before they expire. while trusted signer workflows enhance your security posture.
Note: To create signed URLs, you need a signer. A signer is either a trusted key group that you create in CloudFront, or an AWS account that contains a CloudFront key pair.
Misconfigured web caches have many surprising and frustrating effects for users. Understanding and configuring CloudFront cache behavior is key to helping to prevent unintended content exposure or availability issues. You need to add cache invalidation to your publication workflows so that old versions are no longer available from the cache. This might introduce additional costs and operational overhead, especially in scenarios with frequent content changes. If you frequently change the content that you share, if the content is unique to an individual (such as a personalized report), or if the same content isn’t downloaded many times by many people in many locations, you won’t realize much cost savings or reduced latency from CloudFront caching. The additional complexity added by cache configuration might not be justified unless the cache is used a lot.
If you use the CloudFront global content delivery network, your content will be stored in caches in hundreds of locations around the world. ACM will store your TLS certificates for CloudFront (whether ACM is issuing them or you manage them yourself) in the us-east-1 AWS Region. Because CloudFront is a global service, it automatically distributes the certificate from the us-east-1 Region to the Regions associated with your CloudFront distribution. Caching data and keys around the world might not be acceptable if you have data sovereignty requirements to keep your data in one country.
From a cost perspective, while CloudFront can provide savings through caching, the pricing model has other variables to consider. Data transfer costs vary by Region and can be significant for large-scale distributions. If you need custom domain names and custom TLS certificates, that might introduce additional costs. Implementation expertise is needed when dealing with dynamic content or when specific origin request handling is required. CloudFront only delivers via HTTPS and HTTP protocols, so you won’t be able to use it if you require support for other file transfer protocols. CloudFront distributions provide statistics on cache hit-and-miss rates—pay attention to these because low cache hit rates mean that you’re pulling data from the origin frequently, which limits the possible cost savings.
Amazon VPC endpoint service with custom application
Amazon VPC endpoint services, powered by AWS PrivateLink, enable private connectivity between VPCs without requiring internet access, VPN connections, or direct physical connections. This solution creates a highly secure, private network path for file sharing by exposing services through Network Load Balancers (NLB) and allowing other VPCs to access them through interface endpoints. The architecture isolates the file sharing service from the public internet, operating entirely within the AWS private network infrastructure.
The best use cases for this architecture involve sharing data or distributing software around your AWS infrastructure without exposing it to the public internet.
Figure 2: Amazon VPC endpoint service architecture
The solution, shown in Figure 2, typically involves deploying a custom file sharing application behind an NLB in the service VPC, which is then exposed as an endpoint service. Consumer VPCs create interface endpoints to connect to this service, establishing private connectivity through the AWS backbone network. Traffic remains within the AWS network, is encrypted in transit, and is subject to security controls at both the endpoint and VPC levels. The architecture supports many TCP-based protocols, making it versatile for various file transfer requirements.
This architecture provides secure pathways for data to travel by using multiple layers, including VPC security groups, network access control lists (ACLs), endpoint policies, and the custom application’s authentication mechanisms. The built-in security features of PrivateLink are designed so that only approved AWS principals can create interface endpoints to connect to the service, while detailed VPC flow logs provide network traffic visibility.
Pros
Amazon VPC endpoint services provide complete network isolation and private connectivity that’s inaccessible from the public internet. This reduces the exposure footprint and helps meet security requirements for sensitive data transfer operations. The solution maintains private connectivity across different AWS accounts and Regions while keeping traffic within the AWS network infrastructure.
This solution also provides the most flexible protocol support. Other solutions require you to use HTTPS, AWS API calls (which are HTTPS), or one of the protocols supported by Transfer Family (such as SFTP). If you have software that uses custom protocols, and you need security controls and network isolation, this architecture provides predictable performance through dedicated network paths and supports high throughput requirements without internet bandwidth constraints. The granular control over network security through VPC security groups, network ACLs, and endpoint policies enables organizations to implement defense-in-depth strategies effectively. Additionally, the solution’s integration with AWS Organizations facilitates centralized management and governance across multiple accounts.
Cons
Setting up and maintaining VPC endpoints requires significant expertise in AWS networking, including VPC design, PrivateLink configuration, and network security controls. The initial architecture design must carefully consider IP address management, service quotas, and Regional availability to provide scalability and reliability. Organizations must also develop and maintain the custom file sharing application in addition to the VPC endpoints.
This solution has many components that incur hourly and bandwidth-related charges. Each interface endpoint incurs hourly charges and data processing fees, which can accumulate significantly in multi-VPC or multi-Region deployments. NLBs add another cost component, and you must maintain sufficient capacity for peak loads. The solution also has operational costs because of the need for specialized expertise and ongoing maintenance. Additionally, while the private connectivity model provides superior security, it can make troubleshooting more challenging and might require additional tooling for effective monitoring and diagnostics. The Regional nature of VPC endpoints might necessitate additional architecture for multi-Region deployments, potentially increasing both costs and operational overhead. This solution is most suitable when private network security considerations are the highest priority, and cost considerations are secondary.
Amazon S3 Access Points
Amazon S3 Access Points simplify managing data access at scale for applications using shared data sets on S3. Access points are named network endpoints attached to S3 buckets that streamline managing access to shared datasets. Each access point has its own AWS Identity and Access Management (IAM) policy that controls access to the data, allowing you to create custom access permissions for different applications or user groups accessing the same bucket.
The architecture uses S3 buckets with access points providing dedicated access paths to the data. Each access point has its own hostname (URL) and access policy that works in conjunction with the bucket policy. You can create access points that only allow connections from your Amazon Virtual Private Cloud (Amazon VPC) for private network access to Amazon S3 or create access points with Internet connectivity. You can use this flexibility to implement sophisticated access control patterns while maintaining a single source of truth in S3.
Figure 3: S3 Access Points with VPC endpoints
Pros
Amazon S3 Access Points simplify permissions management and security to accommodate multiple access patterns and use cases. For example, if an S3 bucket contains data that needs to be accessed by multiple applications, each requiring different levels of access, you can create a dedicated access point for each application with precisely the permissions it needs, rather than managing a long monolithic bucket policy.
You can implement access control workflows, such as restricting access to specific VPCs, encryption, or limit access to specific objects or prefixes. The service requires no new infrastructure management, reducing operational overhead and allowing you to focus on business logic implementation.
Access points provide a way to enforce network controls through VPC-only access points, helping to make sure that data can only be accessed from within your private network. IAM permissions management becomes more granular and straightforward to audit when each application or user group has its own access point with a dedicated policy. You can associate different access points with different network origins.
Another possible use case is when you need to provide temporary access to specific data within a bucket without modifying the bucket policy. You can create a temporary access point with the necessary permissions and delete it when the access is no longer needed.
Cons
Access points add another layer to your Amazon S3 architecture that needs to be managed and monitored. Each access point has its own Amazon Resource Name (ARN) and hostname that applications need to use instead of the bucket name, which might require changes to your application code.
There are limits to the number of access points you can create for each bucket, which might be a constraint for large-scale applications. Access points can only control access to the bucket they’re associated with, not across multiple buckets, so if your application needs to access data across buckets, you’ll need multiple access points.
When implementing this solution, you need to design your access point policies to make sure that they work correctly with your bucket policy. Think of your S3 bucket policy as the primary security framework, while access point policies act as specialized gatekeepers. These two layers of security must work in harmony. The bucket policy takes precedence. For example, if your bucket policy explicitly denies access from specific IP ranges, an access point policy can’t override this restriction. This hierarchical relationship requires strategic planning. Start by defining your broad security boundaries in the bucket policy—perhaps allowing access only from specific VPCs or requiring encryption. Then create your access point policies within these boundaries.
While Amazon S3 Access Points offer powerful flexibility, understanding their boundaries is crucial. Cross-account scenarios, common in large enterprises or partner collaborations, require careful configuration. Imagine you’re working with an external auditing firm that needs temporary access to your financial data stored in S3. Setting up a cross-account access point requires creating the access point in your account, configuring a trust policy to allow the external account, verifying that the bucket policy permits access from the access point, and providing the auditors with the access point ARN and necessary IAM permissions in their account. This process maintains tight control over your data while enabling secure cross-account access.
Some Amazon S3 operations are only controlled at the bucket level and can’t be controlled by access points. Core bucket operations such as configuring versioning, logging, managing lifecycle policies, and setting up cross-Region replication require direct bucket access. For these operations, you need to interact directly with the bucket through the appropriate permissions. This limitation helps make sure that fundamental bucket configurations remain centralized and controlled by bucket owners.
Creating a dedicated IAM role for bucket administration tasks—separate from the roles that interact with data through access points—enhances security and aligns with the principle of least privilege.
Conclusion
In this second part of a two-part post, you’ve learned about multiple solutions for secure file sharing using AWS services and the pros and cons of each. You can find additional options and a full decision matrix in Part 1. The optimal solution depends on your specific organizational requirements, technical capabilities, and budget constraints. You don’t have to choose just one option, you can implement multiple solutions to address different use cases, creating a file sharing strategy that balances security, cost, and operational efficiency.
Organizations face mounting challenges in building and maintaining effective security incident response programs. Studies from IBM and Morning Consult show security teams face two major challenges: over 50 percent of security alerts go unaddressed because of resource constraints and alert fatigue, while false positives consume 30 percent of investigation time, delaying responses to true positive threats
According to the 2024 IBM Cost of a Data Breach Report, organizations now take an average of 258 days to identify and contain security events. The report also reveals that nearly half of SOC teams report increased detection and response times over the past two years, with 80 percent indicating that manual threat investigation significantly impacts their response times.
Despite these challenges, according to the 2024 IBM Security Services Benchmark Report, organizations with mature incident response capabilities demonstrate a 50 percent reduction in mean time to resolution (MTTR) and achieve cost savings of up to 58 percent per incident. These improvements are driven by the adoption of automated workflows, integrated tools, and streamlined communication processes that accelerate threat detection and containment.
In this post, we walk you through a real-world scenario to show how AWS Security Incident Response can immediately generate benefits by accelerating every step of your incident response lifecycle, how it integrates with other native AWS services such as Amazon GuardDuty, AWS Security Hub, and AWS Systems Manager, and how to integrate third-party threat detection findings for inclusion in your automated monitoring, triage, and containment capabilities.
How AWS Security Incident Response can help
AWS Security Incident Response is a Tier 1 service that launched in December 2024. The service is an AWS-native, purpose-built security incident response solution for customers that can be used as a better-together experience with other AWS services in the areas of detection and response (GuardDuty and Security Hub), networking and content delivery (AWS WAF and AWS Shield), and management and governance (Systems Manager). AWS Security Incident Response is also integrated across AWS Partners through a service specific Partner Specialization program. More detailed information is available in the AWS Security Incident Response documentation.
AWS Security Incident Response complements existing services by enhancing your security posture through streamlined incident management capabilities before, during, and after security events.
Key challenges
AWS Security Incident Response addresses three common challenges:
Alert fatigue: It can reduce alert fatigue and accelerate security investigations through automated monitoring and intelligent triage, reducing false positives and helping to prevent security team burnout.
Fragmented access and communications: By simplifying AWS Management Console permissions management and unifying incident response team communications, it can resolve fragmented access issues.
Security skills gaps: It can bridge cloud security skills gaps by providing 24/7 access to AWS security experts who support the incidents including credential compromise, data exfiltration, and ransomware. The AWS Security Incident Response service allows security teams to handle immediate security challenges while maintaining focus on strategic long-term preparedness and operational improvements.
Service integration
AWS Security Incident Response complements and integrates with AWS security services to provide comprehensive incident response capabilities. The service works seamlessly with:
This integration helps you build efficient incident response capabilities that can minimize the time, cost, and impact of security events throughout your organization’s cloud journey, while helping to reduce investments in additional staffing, training, and tool maintenance.
Distinct capabilities
The AWS Security Incident Response service offers:
Expert knowledge from the AWS Customer Incident Response Team (CIRT)
Tools through APIs and the console
Streamlined processes for handling security incidents
Prerequisites
Before implementing the capabilities described in this post, make sure that you have:
These prerequisites help make sure that you can fully utilize the service’s automated detection, triage, and response capabilities.
The service provides automated monitoring and analysis capabilities within its own service infrastructure, enabling automatic triage of findings from GuardDuty and Security Hub.
For automated containment actions in your AWS accounts, you must first deploy the required CloudFormation StackSets and configure the appropriate IAM permissions. This helps make sure that you maintain full control over automated actions taken in your environment while benefiting from the service’s detection capabilities. This automation can be customized based on variables you establish, such as known CIDR ranges (specific ranges of IP addresses that define your network) and IP addresses, and you can implement GuardDuty suppression rules to help reduce false positives and alert volumes. As a result, the service can serve as a powerful augmentation to your existing security incident response programs and tools.
Setting up AWS Security Incident Response
Your cloud administrator, with AWSSecurityIncidentResponseFullAccess permissions, has established the incident response team in the service. The service notifies individuals, your partners or managed security service provider (MSSP), and other contacts added to the team, supporting a rapid escalation to alert the required parties and respond to the event.
As a best practice, your team establishes minimal privileges for accessing and managing information within AWS Security Incident Response cases. This helps make sure that team members have appropriate access levels to case details, findings, and investigation data while maintaining security and compliance requirements. AWS Security Incident Response provides multiple API actions, such as CreateCaseComment (to add notes to investigations) and GetCase (to retrieve case metadata), to limit whom and which actions can be performed against differing cases. For development and testing environments, AWS provides role-based policies that you can use such as AWSSecurityIncidentResponseCaseFullAccess and AWSSecurityIncidentResponseReadOnlyAccess for role-based access control (as shown in Figure 1). For production environments, we recommend creating custom IAM policies following the principle of least privilege based on your security requirements.
Figure 1: Permissions policies for security incident response
Following your configuration of the AWS Security Incident Response service, your security team reviews the email distribution list or alias for notifications for notifications from the service, as shown in Figure 2. You have developed items in your backlog to take advantage of Amazon EventBridge integrations to add in pager duty, Jira, and other services in the future for additional notification mechanisms.
Figure 2: Use the console to manage your incident response team membership
Detecting and responding to suspicious activity
At 2:00 AM, days after AWS Security Incident Response has been set up, the service detects a combination of suspicious activities through GuardDuty findings, including anomalous IAM user behavior (such as shown in Figure 3), unusual API calls from unknown IP addresses, and a surge of Amazon Elastic Compute Cloud (Amazon EC2) instance creations that deviate from your account’s normal baseline. This pattern of activities matches known threat behaviors monitored by GuardDuty Extended Threat Detection. Without the service, security teams would need to manually analyze and correlate these separate findings across accounts and Regions. Instead, the service automatically identifies the pattern of suspicious activities.
Figure 3: Pattern of potentially suspicious activity
One of the anomalous behaviors is a surge of unrecognized EC2 instance creations, complete with SSH keys (secure credentials used for remote access) and security group configurations (firewall rules that control network traffic) allowing internet connectivity. Using this example scenario, let’s walk through how the service’s automated monitoring, triage and containment capabilities, access management, API actions for custom integrations, collaboration tools, and 24/7 AWS security experts work together to help you navigate security incident response challenges across your AWS environment.
With the initial detection complete, the next phase focuses on centralizing and analyzing the security findings to understand the full scope of the incident.
Centralizing security findings: A systematic approach
GuardDuty begins to generate findings in your enabled Regions.
Note: GuardDuty must be enabled in your accounts and Regions. For setup instructions, see the GuardDuty documentation.
Because AWS Security Incident Response is integrated with GuardDuty, these findings are automatically sent to the service for internal processing, analysis, and auto-triage without manual effort. The service’s proactive response and alert triaging feature analyzes multiple factors, including your account’s historical baseline activity, specific GuardDuty finding types, and correlation patterns across accounts. In this case, it identified anomalous EC2 instance creation activity that deviated significantly from your environment’s normal patterns.
When the service identifies a true positive, an AWS Security Incident Response case is opened automatically (see Figure 4), resulting in a notification to the incident response team you configured earlier. A central benefit is how the service correlates disparate events—connecting the instance creations with the security group modifications—to paint a complete picture of the potential security event.
Figure 4: Automated incident remediation flow
This proactive monitoring and analysis, as documented in your monthly service reports, demonstrates tangible benefits by reducing alert fatigue, and providing intelligent triage capabilities to SOC teams every day. The service’s automated analysis and correlation capabilities set the stage for rapid response when security events occur, which means that your team can focus on strategic security initiatives instead of spending time manually investigating alerts. The service feature helps you maintain strong security in two ways:
Comprehensive monitoring across configured Regions.
Integration with third-party security tools. This automated approach reduces the time, cost, and impact of security events.
As the investigation progresses from initial detection to detailed analysis, the GuardDuty integration provides crucial insights into the threat patterns.
From detection to action: The GuardDuty integration story
As your security team responds to the internal detection mechanisms, AWS Security Incident Response processes security findings in three key steps:
It analyzes GuardDuty alerts to identify genuine security threats
Using GuardDuty Extended Threat Detection, it correlates related events to identify threat patterns
It tracks the threat sequence, from initial actions (deleting logs or creating unauthorized access) through to potential data theft attempts
For this event, the sequence started with the deletion of CloudTrail logs, followed by the creation of unauthorized access keys. As the threat progressed, the service identified suspicious Amazon Simple Storage Service (Amazon S3) object access patterns and potential data exfiltration attempts, along with sophisticated evasion techniques and persistence mechanisms. Each of these signals maps directly to specific MITRE ATT&CK® tactics, techniques and procedures (TTPs), revealing the systematic nature of a potential ransomware threat. For detailed mapping of AWS Security Incident Response findings to MITRE ATT&CK® frameworks, see Mapping AWS security services to MITRE frameworks for threat detection and mitigation.
The service assists in correlation and analysis, evaluating patterns such as deletion of CloudTrail trails, creation of new access keys, and suspicious actions targeting S3 objects. When the AI and machine learning (AI/ML) capabilities of GuardDuty detect these concerning patterns over periods of time, the service automatically elevates the situation by creating an AWS Security Incident Response case on your behalf, bringing additional resources and focused attention to the situation. The incident response team defined in the earlier steps are then notified by email or other methods (shown in Figure 5) that a new triaged event has been created and to begin their investigations.
The benefits include the service coordinating communication across your affected accounts. Instead of juggling multiple alerts and trying to piece together the scope of the potential ransomware incident, GuardDuty Extended Threat Detection provides a comprehensive view of the threat sequence, while the AWS Security Incident Response case offers a single, coherent channel for triaging these signals and providing coordination as your global team comes online to join the response effort.
Note: For brevity, Security Hub’s workflow details have been omitted because they mirror the monitoring and escalation processes described above for GuardDuty. Both services integrate closely and share similar operational patterns, with GuardDuty findings being sent to Security Hub within five minutes of detection. Security Hub enhances security coverage by aggregating findings from multiple AWS services and third-party partners.
With the threat patterns identified, your team moves to the next phase—engaging AWS CIRT for specialized expertise and advanced investigation capabilities.
Partnering with AWS CIRT through the incident response case
Your team continues investigating the event and discovers that they need additional assistance. An authorized user in your account opens a service supported case to request assistance from AWS.
The AWS Security Incident Response case establishes a direct communication channel with AWS CIRT (shown in Figure 6) with a one-click escalation of the case within the console, providing immediate access to specialized expertise. Upon case escalation, AWS CIRT engages through the incident response case with a 15-minute acknowledgement timeframe, bringing their advanced tooling and specialized knowledge to analyze patterns across your accounts—even in environments with limited logging capabilities. This partnership delivers:
Real-time collaboration through conference bridge video calls
Advanced artifact analysis and pattern recognition
Technical guidance for investigation and containment
Recommendations for improving security posture
Figure 6: Connect with the AWS CIRT
Figure 6 is an example of how this would appear in your account, with the resolver set to Self for a self-managed case.
Returning to the scenario, you discover that multiple accounts have insufficient logging enabled—which limits the available investigation data. While AWS CIRT can provide additional insights through specialized tooling, maintaining comprehensive logging across your accounts remains crucial for security visibility, compliance requirements, and thorough incident investigations. The capabilities of AWS CIRT complement—but do not replace—proper logging practices. This capability provides an understanding of the scope of the incident, as they see patterns and activities otherwise invisible to you.
The collaboration begins with AWS CIRT analyzing your environment using their tooling, looking for anomalous patterns beyond what you see in your immediate logs. Through the incident response case, they help you understand the scope of your situation by:
Communicating their findings
Recommending additional investigation paths
Sharing analysis showing similar EC2 instance creation patterns from other environments
AWS CIRT uses the incident response case to establish a bridge call, bringing together their team and yours for real-time collaboration. During these calls, AWS CIRT shares their ongoing analysis of artifacts and service data, helping you understand what happened, why it happened, and how to prevent similar issues in the future. They also provide guidance on implementing proper logging across your accounts to improve your future security posture.
Managing the incident through intelligent tagging
As AWS CIRT begins their analysis, your team implements real-time resource tagging using the incident case ID. This systematic tagging approach proves crucial for tracking and managing the suspicious EC2 instances across your accounts. By using tags, you can quickly implement isolation policies and track costs while maintaining clear documentation of affected resources throughout the investigation.
Your tag-based approach helps track affected resources to implement isolation policies. You used the incident case ID tags to quickly identify resources connected to the incident, which you use to apply targeted access controls and containment measures. The tags also help you track costs associated with the incident, giving your finance team precise visibility into the event’s financial impact.
Working alongside the AWS Security Incident Response service, you find that using the incident case ID as your primary tag key (shown in Figure 7) created a consistent way to correlate resources across affected accounts. This proves especially helpful when coordinating with AWS CIRT, because you can quickly direct them to specific resources requiring investigation. Even after containment, these tags continue to provide value in supporting your post-incident analysis and helping you implement targeted security controls based on what you learn from the incident.
Figure 7: Incident tags
Automated containment options through Systems Manager integration
While working with AWS CIRT to understand the incident scope, you can also use Systems Manager to help automatically contain threats. Your team previously deployed the required CloudFormation StackSets across your organization, enabling Amazon EC2 containment actions through Systems Manager.
The setup process required deploying CloudFormation StackSets with specific IAM roles and Systems Manager configurations across your accounts. This infrastructure allows the AWS Security Incident Response service to make containment actions on your behalf. These actions can be reversed if needed—similar to using an undo function—so that you can restore systems to their previous state.
When authorized through your pre-deployed CloudFormation StackSets, AWS Security Incident Response service can request Systems Manager to implement containment measures. Containment actions require explicit customer authorization and proper IAM permissions to be configured in advance. The service isolates the tagged suspicious instances by modifying their security groups and network access, while preserving their state to maintain forensic integrity for analysis.
The containment process happens in three steps:
Isolate: Remove compromised instances from security groups
Preserve: Create backup copies (snapshots) of affected systems
Investigate: Collect system information using Systems Manager
These actions can be reversed if needed, supporting containment decisions for legitimate workloads.
The automation capabilities help streamline containment procedures across multiple instances, reducing the time taken to contain impacted resources. The service maintains detailed logs of each action in the incident response case, providing your team with clear visibility into the containment efforts.
Through this response capability, combined with the guidance from AWS CIRT, you can contain the incident’s spread within minutes rather than hours. The Systems Manager integration provides a reliable way to implement containment actions while preserving evidence for investigation (shown in Figure 8).
Figure 8: Systems Manager documents for containment actions
Resolution and lessons learned
As the incident moves toward resolution, your team works through a systematic process to verify containment, alleviate threats, and restore services. Working alongside AWS CIRT through the AWS Security Incident Response case, you implement a structured approach to make sure that affected resources are secured and normal operations can safely resume. The immediate resolution actions fall into three main categories:
Containment confirmation through Systems Manager verification
Verify security group modifications are in place
Confirm network isolation of affected instances
Validate that automated containment actions were successful
Review Systems Manager logs for containment action completion
Verification of threat alleviation across affected resources
Analyze GuardDuty findings to confirm that there’s no new suspicious activity
Review tagged resources for complete containment
Verify termination of unauthorized access attempts
Confirm removal of persistence mechanisms
Check for remaining unauthorized IAM access
Service restoration and access control normalization
Restore legitimate workload access based on verified baselines
Implement updated security group configurations
Reset affected IAM credentials and access keys
Re-establish normal network connectivity for verified clean resources
Update resource tags to reflect post-incident status
Documentation and reporting:
As the incident reaches resolution, AWS Security Incident Response service compiles a comprehensive incident timeline. This documentation accelerates your reporting process, helping you quickly generate required reports for executives, regulators, and cyber insurance providers—all from within the incident response case.
The incident response case captures the complete timeline of events, starting with GuardDuty Extended Threat Detection identifying the initial threat sequences. Each step of the incident response is documented, from the moment suspicious EC2 instance creations were detected, through the MITRE ATT&CK® tactics observed, to the containment actions implemented through Systems Manager integration, and finally to the resolution steps that proved effective.
Long-term Improvements: Through this collaborative post-incident review process, your team:
Implements enhanced logging based on AWS CIRT recommendations
Updates security controls to help prevent similar incidents
Improves incident response processes based on lessons learned
Strengthens your security posture through targeted improvements
Conclusion
This example illustrates how AWS Security Incident Response service can enhance security operations through automated detection, triage, containment, access, and coordinated response capabilities. The service’s integration with AWS Security Hub and Amazon GuardDuty provides efficient handling of security events, while the optional escalation to the AWS CIRT can provide valuable expertise and specialized tooling to help accelerate every stage of your incident response lifecycle and strengthen your security posture.
AWS Security Incident Response service serves as a critical component of a comprehensive security operations strategy, delivering measurable benefits through:
Continuous threat monitoring for automated correlation and machine learning to identify high-priority security risks while minimizing false positives.
Reduced incident response times through automated detection and coordinated response
Enhanced investigation capabilities through direct AWS CIRT collaboration
Streamlined, rapid containment
Comprehensive incident documentation and audit trails to support and accelerate reporting requirements
To prepare for, respond to and recover from security incidents faster and more efficiently today, visit AWS Security Incident Response or contact your AWS account team to schedule a discussion.
Additional resources
Here are some additional AWS resources that your teams can use to further improve your security incident response capabilities:
Before an event:
AWS Customer Playbook Framework: Publicly available response frameworks that use AWS CIRT lessons learned from security events
Assisted Log Enabler: A tool that assists customers to enable logs, including the following: Amazon VPC Flow Logs, AWS CloudTrail, Amazon Elastic Kubernetes Service audit and authenticator logs, Amazon Route 53 Resolver Query Logs, Amazon S3 server access logs, and Elastic Load Balancing logs
During an event:
Athena Security Analytics Bootstrap: A tool for customers who need a quick method to set up Amazon Athena and perform investigations on AWS service logs archived in S3 buckets
The AWS Security Reference Architecture (AWS SRA) provides prescriptive guidance for deploying AWS security services in a multi-account environment. However, validating that your implementation aligns with these best practices can be challenging and time-consuming.
Today, we’re announcing the open source release of SRA Verify, a security assessment tool that helps you assess your organization’s alignment to the AWS SRA.
The AWS SRA is a holistic set of guidelines for deploying the full complement of AWS security services in a multi-account environment. You can use it to design, implement, and manage AWS security services so that they align with AWS recommended practices. The recommendations are built around a single-page architecture that includes AWS security services—how they help achieve security objectives, where they can be best deployed and managed in your AWS accounts, and how they interact with other security services. This overall architectural guidance complements detailed, service-specific recommendations such as those found in AWS Security Documentation.
SRA Verify directly maps to these recommendations by providing automated checks that validate your implementation against the AWS SRA guidance. The tool helps you verify that security services are properly configured according to the reference architecture. To assist with remediation and implementing the guidance in the AWS SRA, review the infrastructure as code (IaC) examples in the AWS Security Reference Architecture Github repo.
On June 27, the United Nations celebrates Micro-, Small, and Medium-sized Enterprises Day (MSME) to recognize the critical role these businesses play in the global economy and economic development. According to the World Bank and the UN, small and medium-sized businesses make up about 90 percent of all businesses, between 50-70 percent of global employment, and 50 percent of global GDP. They not only drive local and national economies, but also sustain the livelihoods of women, youth, and other groups in vulnerable situations.
As part of MSME Day, we wanted to highlight some of the amazing startups and small businesses that are using Cloudflare to not only secure and improve their websites, but also build, scale, and deploy new serverless applications (and businesses) directly on Cloudflare’s global network.
A startup for startups
Cloudflare started as an idea to provide better security and performance tools for everyone. Back in 2010, if you were a large enterprise and wanted better performance and security for your website, you could buy an expensive piece of on-premise hardware or contract with a large, global Content Delivery Network (CDN) provider. Those same types of services were not only unaffordable for most website owners or smaller businesses, but also generally unavailable, as they typically demanded expensive on-premise hardware or direct server access that most smaller operations lacked. Cloudflare launched, fittingly at a startup competition, with the goal of making those same types of tools available to everyone.
As Cloudflare has grown, we have continued to highlight how our millions of free customers, many of them individual developers, startups, and small businesses, drive our network, company, and mission. They help keep our costs low, allow us to interconnect with more networks, and help us build better products.
Over the last 12 months, we have put even more of an emphasis on supporting startup and small business communities by expanding free developer tools, which make it easier for anyone to build full stack, AI-enabled applications directly on Cloudflare’s network, and investing in programs like Cloudflare for Startups, Workers Launchpad, and the Dev Alliance. For example:
More than 3,000 startups are receiving free credits to build and scale their applications directly on Cloudflare’s global network using our developer services.
In 2024 alone, 122 startups in 22 countries were accepted into Cloudflare’s Launchpad Program, which provides additional infrastructure, tools, and community support to help entrepreneurs scale their applications and businesses, including access to Cloudflare demo days.
Since 2022, Cloudflare has worked with over 40 venture capital partners to secure more than $2 billion in potential financing for companies participating in our startup programs.
With the right tools in hand, entrepreneurs are turning ideas into real world impact, and we’re honored to support them.
Spotlighting innovation across the globe
Cloudflare proudly supports over hundreds of thousands of small businesses that are using our services, including SaaS startups, health and wellness providers, real estate firms, local retailers, and global service providers. Here are just a few examples of these amazing new companies.
Mobile-friendly mini websites from Instagram bios, powered by Workers for routing and Pages for hosting.
Cloudflare is also working with our civil society partners in the Asia-Pacific region to help provide security training for new businesses. For example, in 2025, we partnered with Cyberpeace, a leading nonprofit organization in India, to host a webinar focused on building cyber resilience. The session included a live onboarding session, training on security services, and information on the most common cyber threats. Our first session attracted over 95 participants, and due to the high demand, Cloudflare is planning to host an additional in-person training session later this year. Stay tuned for more details!
Helping protect small businesses (and a new security guide!)
It is incredible to see all the innovative ways companies are building new ideas with Cloudflare. However, as a startup originally designed to protect other startups, we know security remains one of the most pressing concerns for any small business. According to the U.S. Federal Communications Commission, theft of digital information has surpassed physical theft as the most commonly reported fraud for small businesses. In 2025 so far, Cloudflare has mitigated over three million Layer 3 (network layer) DDoS attacks targeting small businesses protected by our network.
This year, to help celebrate MSME day, Cloudflare is continuing our efforts to provide training and capacity building for our small business partners by releasing a brand new Cloudflare Small Business Security Guide. The guide includes step-by-step instructions that will allow anyone to better understand cyber security services and protect their business and customers from common cyberattacks. For more information, visit the Cloudflare for Small Businesses page to download the guide today.
Cloudflare will always make robust security services available to any small business that needs them, free of charge. It is a fundamental part of our mission to help build a better Internet and our identity as a company.
If you are building a small business and need access to better developer or security services, getting started with Cloudflare is simple, fast, and straightforward. Signing up for a Free plan takes only minutes and can instantly provide access to the tools you need to secure and accelerate your web presence and keep your small business thriving.
Running applications across hybrid or multicloud environments creates a common challenge: fragmented logs scattered across different platforms. This fragmentation complicates monitoring, slows troubleshooting, and reduces operational visibility. To address this, many organizations seek to implement secure log ingestion from all environments into a centralized platform.
Amazon OpenSearch Service provides a unified solution for real-time search, analytics, and log management across your entire infrastructure. Amazon OpenSearch Ingestion, a fully managed data collector, simplifies data processing with built-in capabilities to filter, transform, and enrich your logs before analysis.
However, securely sending logs from non-AWS environments presents a challenge. Every request to OpenSearch Ingestion requires AWS Signature Version 4 (AWS SigV4) authentication, traditionally requiring long-term credentials that introduce security risks. AWS Identity and Access Management Roles Anywhere solves this problem by providing temporary credentials for workloads running outside AWS.
In this post, we demonstrate how to configure Fluent Bit, a fast and flexible log processor and router supported by various operating systems, to securely send logs from any environment to OpenSearch Ingestion using IAM Roles Anywhere. This approach alleviates the need for long-term credentials while providing a comprehensive view of your application logs across all environments—improving security, simplifying operations, and enhancing your ability to quickly resolve issues.
Solutions overview
The solution in this post uses Fluent Bit to collect logs, retrieve temporary credentials from IAM Roles Anywhere, and sign HTTP log ingestion requests with AWS SigV4 before sending them to the OpenSearch Ingestion pipeline. The following diagram shows the architecture.
This solution provisions the following key components:
IAM Roles Anywhere configuration – This includes the following:
Trust anchor – Establishes trust between IAM Roles Anywhere and the specified CA.
IAM role – Grants permissions for log ingestion and trusts the IAM Roles Anywhere service principal. At minimum, this role must be granted permission for the osis:Ingest action.
Profile – Defines which roles IAM Roles Anywhere can assume and the maximum permissions granted with the temporary credentials.
OpenSearch Service domain – For this post, we use an OpenSearch Service domain, which is an AWS provisioned equivalent of an open source OpenSearch cluster. We create the domain within a virtual private cloud (VPC); see VPC versus public domains for more information. Alternatively, you can use an Amazon OpenSearch Serverless collection, which is an OpenSearch cluster that scales compute capacity based on your application’s needs.
OpenSearch Ingestion – This is configured to receive logs over HTTP as the pipeline source and forward them to the OpenSearch Service domain as the pipeline sink.
Connectivity between AWS and your hybrid or multicloud environments
You can access your OpenSearch Ingestion pipelines using an interface VPC endpoint with push-based HTTP source, which provides private IP address connectivity. For production environments, we recommend using these private connections through interface endpoints for enhanced security.
Setting up this connectivity requires additional configuration, such as creating an AWS Site-to-Site VPN connection with your hybrid and multicloud network. Although this post focuses on the log ingestion solution, you can find detailed guidance on network connectivity in the following resources:
Hybrid connectivity – Learn about different methods to connect your on-premises networks to AWS
How Fluent Bit retrieves temporary credentials using IAM Roles Anywhere
Using the HTTP output plugin, Fluent Bit can send logs to the OpenSearch Ingestion pipeline. The following diagram is a simplified view of how Fluent Bit retrieves AWS credentials.
On Linux systems, Fluent Bit can use an AWS Command Line Interface (AWS CLI) profile that uses the credential_process parameter to trigger an external process. This external process is invoked to generate or retrieve credentials not directly supported by the AWS CLI.
The following are two common mechanisms for the external process:
As of this writing, the Fluent Bit aws_profile configuration is supported only on Linux. It is untested on other Unix-based systems (such as macOS) and is not implemented for Windows.
Prerequisites
Before you begin this walkthrough, make sure you have the following:
Access to AWS CloudShell for exporting a sample private certificate we will create using AWS CloudFormation in a later step.
Remote (hybrid or multicloud) environment – You must have a remote machine with Linux-based operating system. This solution was tested on Ubuntu 24.04 with the following additional tooling installed:
Follow these steps to deploy AWS resources required for this solution:
Choose Launch Stack:
Enter a unique name for Stack name. The default value is osis-with-iamra.
Configure the stack parameters. Default values are provided in the following table.
Parameter
Default value
Description
CACommonName
example.com
Common Name for the CA
CACountry
US
Organization for the CA
CAOrganization
Example Org
Country for the CA
CAValidityInDays
1826
Validity period in days for the CA certificate
VPCCIDR
10.0.0.0/16
IPv4 CIDR range for the VPC used for OpenSearch Service domain
PublicSubnetCIDR
10.0.0.0/24
IPv4 CIDR range for public subnet
PrivateSubnet1CIDR
10.0.1.0/24
IPv4 CIDR range for private subnet
PrivateSubnet2CIDR
10.0.2.0/24
IPv4 CIDR range for private subnet
DomainName
test-domain
Name of the OpenSearch Service domain
PipelineName
test-pipeline
Name of the OpenSearch Ingestion pipeline
PipelineIngestionPath
/test-ingestion-path
Ingestion path for the OpenSearch Ingestion pipeline
Select the acknowledgement check box and choose Create Stack. Stack deployment takes about 30 minutes to complete.
When stack creation is complete, navigate to the Outputs tab on the AWS CloudFormation console and note down the values for the resources created. The following table summarizes the output values.
Output
Description
Example value
ACMCertificateArn
Amazon Resource Name (ARN) of the ACM certificate. You will use this for exporting certificate and private key files using the AWS CLI in a later step.
Export the certificate ARN from the CloudFormation outputs. If you changed the stack name in the previous step, use that value for <stack-name>, otherwise use the default value osis-with-iamra.
Create a new profile named osis-pipeline-credentials that invokes the credential process. Replace the placeholders with your specific values. Find the values for trusted-anchor-arn, profile-arn, and ingestion-role-arn in your CloudFormation stack outputs.
Run the following command to create a Fluent Bit configuration. Replace the placeholders with your specific values. Find the osis-pipeline-endpoint and pipeline-ingestion-path values in your CloudFormation stack outputs.
cat << 'EOF' > ~/fluent-bit.conf
[INPUT]
  name                  tail
  path                  /var/log/syslog
  read_from_head        true
  refresh_interval      5
[OUTPUT]
  name 			http
  match	   		*
  aws_service 		osis
  host 			<osis-pipeline-endpoint>
  port 			443
  uri 			<pipeline-ingestion-path>
  format 		json
  aws_auth	 	true
  aws_region 		<aa-example-1>
  aws_profile 		osis-pipeline-credentials
  tls 			On
EOF
This example configuration includes the following:
Uses the tail input plugin to monitor the /var/log/syslog file
Uses the http output plugin to flush log records to the OpenSearch Ingestion pipeline endpoint
Uses the osis-pipeline-credentials profile to obtain temporary AWS credentials for SigV4 authentication (aws_auth set to true)
Test the solution
Follow these steps to test the setup:
Start the Fluent Bit client with the configuration file fluent-bit.conf that you created in the previous step. Replace the placeholder with the value applicable to your environment. For Ubuntu 24.04, the default path of the Fluent Bit client is /opt/fluent-bit/bin/fluent-bit. Adjust the path if using other distributions.
Because the solution in this post launched the OpenSearch Service domain within a VPC, you will need an environment that has connectivity to the VPC. For this post, we create a CloudShell VPC environment to run the commands in the next step. Find the VPC, subnet, and security group to use from your CloudFormation stack outputs.
The solution that you deployed through AWS CloudFormation dynamically creates indexes based on ingestion timestamps, format logs-%{yyyy.MM.dd}. You can specify your preferred naming using OpenSearch Ingestion index management. You can query your OpenSearch index using your preferred tool to see the ingested logs from Fluent Bit. We use awscurl in a CloudShell environment as shown in the following example. Replace the placeholders with your specific values. Find the opensearch-domain-endpoint value in your CloudFormation stack outputs.
pip install awscurl

export OPENSEARCH_DOMAIN_ENDPOINT=https://<opensearch-domain-endpoint>

# List indices matching logs-%{yyyy.MM.dd} format and get most recent one to query
export INDEX=$(awscurl --service es "$OPENSEARCH_DOMAIN_ENDPOINT/_cat/indices?v" | grep -E "logs-[0-9]{4}\.[0-9]{2}\.[0-9]{2}" | sort -r | head -1 | awk '{print $3}')

awscurl --service es $OPENSEARCH_DOMAIN_ENDPOINT/$INDEX/_search \
        -X GET -H "Content-Type: application/json" \
        -d '{
            "size": 10,
            "sort": [
              {"@timestamp": {"order": "desc"}}
            ],
            "query": { "match_all": {} }
          }' | jq '.hits.hits[]._source'
The following is an example of the expected output:
In this post, we demonstrated how to obtain temporary credentials from IAM Roles Anywhere and securely ingest logs from hybrid or multicloud environments into OpenSearch Service using OpenSearch Ingestion. This approach minimizes the risk of credential exposure while enabling centralized log collection from distributed workloads. This solution is particularly valuable for organizations managing complex infrastructures across multiple environments and looking to consolidate observability data in OpenSearch Service. For additional details, refer to the following resources:
If you have questions or feedback about this post, please leave them in the comments section.
About the Authors
Xiaoxue Xu is a Solutions Architect for AWS based in Toronto. She primarily works with financial services customers to help secure their workload and design scalable solutions on the AWS Cloud.
Simran Singh is a Senior Solutions Architect at AWS. In this role, he assists our large enterprise customers in meeting their key business objectives using AWS. His areas of expertise include artificial intelligence and machine learning, security, and improving the experience of developers building on AWS.
As organizations increasingly adopt Amazon Bedrock to build and deploy large-scale AI applications, it’s important that they understand and adopt critical network access controls to protect their data and workloads. These generative AI-enabled applications might have access to sensitive or confidential information within their knowledge bases, Retrieval Augmented Generation (RAG) data sources, or models themselves, which could pose a risk if exposed to unauthorized parties. Additionally, organizations might want to limit access to certain AI models to specific teams or services, making sure only authorized users can use the most powerful capabilities. Another important consideration is cost optimization, because organizations need to be able to monitor and control access to manage various aspects of their cloud spending.
In this post, we explore the Amazon Bedrock baseline architecture and how you can secure and control network access to your various Amazon Bedrock capabilities within AWS network services and tools. We discuss key design considerations, such as using Amazon VPC Latticeauth policies, Amazon Virtual Private Cloud (Amazon VPC) endpoints, and AWS Identity and Access Management (IAM) to restrict and monitor access to your Amazon Bedrock capabilities.
By the end of this post, you will have a better understanding of how to configure your AWS landing zone to establish secure and controlled network connectivity to Amazon Bedrock across your organization using VPC Lattice.
Solution overview
Addressing the aforementioned challenges requires a well-designed network architecture and security controls. For this, we use the standard AWS Landing Zone Accelerator networking configuration. It provides a good starting point for managing network communication across multiple accounts. On top of the AWS Landing Zone Accelerator network design, we add two shared accounts.
In this solution design, we create a centralized architecture for managing organization AI capabilities across different accounts. The architecture consists of three main parts that work together to provide secure and controlled access to AI services:
Service network account – This account serves as the central networking hub for the organization, managing network connectivity and access policies. Through this account, network administrators can centrally manage and control access to AI services across the organization. The account follows AWS Landing Zone Accelerator networking practices that scale with enterprise organizational needs.
Generative AI account – This account hosts the organization’s Amazon Bedrock capabilities and serves as the central point for AI/ML management. The organization’s AI/ML scientists and prompt engineers will centrally build and manage Amazon Bedrock capabilities. The account provides access to various large language models (LLMs) through Amazon Bedrock by using VPC interface endpoints, while also enabling centralized monitoring of cost consumption and access patterns.
Workload accounts (dev, test, prod) – These accounts represent different environments where teams develop and deploy applications that consume AI services. Through secure network connections established through the service network account, these workload accounts can access the AI capabilities hosted in the generative AI account. This separation enforces proper isolation between development, testing, and production workloads while maintaining secure access to AI services.
Amazon Bedrock baseline architecture in an AWS landing zone
The following diagram illustrates the solution architecture.
The service network account has its own VPC Lattice service network—a centralized networking construct that enables service-to-service communication across your organization, which is shared with workload accounts using AWS Resource Access Manager (AWS RAM) to enable VPC Lattice Service network sharing.
Workload accounts (dev, test, prod) establish VPC associations with the shared VPC Lattice service network by creating a service network association in their VPC. When an application in these accounts makes a request, it first queries the VPC resolver for DNS resolution. The resolver routes the traffic to the VPC Lattice service network.
Access control is implemented through an VPC Lattice auth policy. The service network policies determine which accounts can access the VPC Lattice service network, and service-level policies control access to specific AI services and define what actions each account can perform.
In the central AI services account, we find the proxy layer, we create a VPC Lattice service that points to a proxy layer, which acts as a single entry point, providing workload accounts access to Amazon Bedrock. This proxy layer then connects to Amazon Bedrock through VPC endpoints. Through this setup, the AI team can configure which foundation models (FMs) are available and manage access permissions for different workload accounts. After the necessary policies and connections are in place, workload accounts can access Amazon Bedrock capabilities through the established secure pathway. This setup enables secure, cross-account access to AI services while maintaining centralized control and monitoring.
Network components
We use VPC Lattice, which is a fully managed application networking service that helps you simplify network connectivity, security, and monitoring for service-to-service communication needs. With VPC Lattice, organizations can achieve a centralized connectivity pattern to control and monitor access to the services required for building generative AI applications.
For details about VPC Lattice, refer to the Amazon VPC Lattice User Guide. The following is an overview of the constructs you can use in setting up the centralized pattern in this solution:
VPC Lattice service network – You can use the VPC Lattice service network to provide central connectivity and security to the central AI services account. The service network is a logical grouping mechanism that simplifies how you can enable connectivity across VPCs or accounts, and apply common security policies for application communication patterns. You can create a service network in an account and share it with other accounts within or outside AWS Organizations using AWS RAM.
VPC Lattice service – In a service network, you can associate a VPC Lattice service, which consists of a listener (protocol and port number), routing rules that allow for control of the application flow (for example, path, method, header-based, or weighted routing), and target group, which defines the application infrastructure. A service can have multiple listeners to meet various client capabilities. Supported protocols include HTTP, HTTPS, gRPC, and TLS. The path-based routing allows control to various high-performing FMs and other capabilities you would need to build a generative AI application.
Proxy layer – You use a proxy layer for the VPC Lattice service target group. The proxy layer can be built based on your organization’s preference of AWS services, such as AWS Lambda, AWS Fargate, or Amazon Elastic Kubernetes Service (Amazon EKS). The purpose of the proxy layer is to provide a single entry point to access LLMs, knowledge bases, and other capabilities that are tested and approved according to your organization’s compliance requirements.
VPC Lattice auth policies – For security, you use VPC Lattice auth policies. VPC Lattice auth policies are specified using the same syntax as IAM policies. You can apply an auth policy to VPC Lattice service network as well as to the VPC Lattice service.
Fully Qualified Domain Names –To facilitate service discovery, VPC Lattice supports custom domain names for your services and resources, and maintains a Fully Qualified Domain Name (FQDN) for each VPC Lattice service and resource you define. You can use these FQDNs in your Amazon Route 53 private hosted zone configurations, and empower business units or teams to discover and access services and resources.
Service network VPC – Business units or teams can access generative AI services in a service network using service network VPC associations or a service network VPC endpoint.
Monitoring – You can choose to enable monitoring at the VPC Lattice service network level and VPC Lattice service level. VPC Lattice generates metrics and logs for requests and responses, making it more efficient to monitor and troubleshoot applications
The preceding guidance takes a “secure by default” approach—you must be explicit about which features, models, and so on should be accessed by which business unit. The setup also enables you to implement a defense-in-depth strategy at multiple layers of the network:
The first level of defense is that business team needs to connect to the service network in order to get access to the generative AI service through the central AI service account.
The second level includes network-level security protections in the business team’s VPC for the service network, such as security groups and network access control lists (ACLs). By using these, you can allow access to specific workloads or teams in a VPC.
The third level is through the VPC Lattice auth policy, which you can apply at two layers: at the service network level to allow authenticated requests within the organization, and at the service level to allow access to specific models and features.
VPC Lattice auth policy
This solution makes it possible to centrally manage access to Amazon Bedrock resources across your organization. This approach uses an VPC Lattice auth policy to centrally control Amazon Bedrock resources and manage it from one location across all the organization accounts.
Typically, the auth policy on the service network is operated by the network or cloud administrator. For example, allowing only authenticated requests from specific workloads or teams in your AWS organization. In the following example, access is granted to invoke the generated AI service for authenticated requests and to principals that are part of the o-123456example organization:
The auth policy at the service level is managed by the central AI service team to set fine-grained controls, which can be more restrictive than the coarse-grained authorization applied at the service network level. For example, the following policy restricts access to claude-3-haiku for only business-team1:
This design employs three monitoring approaches, using Amazon CloudWatch, AWS CloudTrail, and VPC Lattice access logs. This strategy provides a view of service usage, security, and performance.
CloudWatch metrics offer real-time monitoring of VPC Lattice service performance and usage. CloudWatch tracks metrics such as request counts and response times for Amazon Bedrock related endpoints, allowing for the setup of alarms for proactive management of service health and capacity. This enables monitoring of overall usage patterns of Amazon Bedrock models across different business units, facilitating capacity planning and resource allocation. CloudTrail provides detailed API-level auditing of Amazon Bedrock related actions. It logs cross-account access attempts and interactions with Amazon Bedrock services, providing a compliance and security audit trail. This tracking of who is accessing which Amazon Bedrock models, when, and from which accounts helps organizations adhere to their organizational policies.VPC Lattice access logs provide detailed insights into HTTP/HTTPS requests to Amazon Bedrock services, capturing specific usage patterns of AI models by different business teams. These logs contain client-specific information, which for example can be used to enable organizations to implement capabilities such as charge-back models. This allows for accurate attribution of AI service usage to specific teams or departments, facilitating fair cost allocation and responsible resource utilization across the organization. These services work together to enhance security, optimize performance, and provide valuable insights for managing cross-account Amazon Bedrock access.
Conclusion
In this post, we explored the importance of securing and controlling network access to Amazon Bedrock capabilities within an organization’s AWS landing zone. We discussed the key business challenges, such as the need to protect sensitive information in Amazon Bedrock knowledge bases, limit access to AI models, and optimize cloud costs by monitoring and controlling Amazon Bedrock capabilities. To address these challenges, we outlined a multi-layered network solution that uses AWS networking services, including a VPC Lattice auth policy to restrict and monitor access to Amazon Bedrock capabilities. Try out this solution for your own use case, and share your feedback in the comments.
About the authors
The collective thoughts of the interwebz
Manage Consent
To provide the best experiences, we use technologies like cookies to store and/or access device information. Consenting to these technologies will allow us to process data such as browsing behavior or unique IDs on this site. Not consenting or withdrawing consent, may adversely affect certain features and functions.
Functional
Always active
The technical storage or access is strictly necessary for the legitimate purpose of enabling the use of a specific service explicitly requested by the subscriber or user, or for the sole purpose of carrying out the transmission of a communication over an electronic communications network.
Preferences
The technical storage or access is necessary for the legitimate purpose of storing preferences that are not requested by the subscriber or user.
Statistics
The technical storage or access that is used exclusively for statistical purposes.The technical storage or access that is used exclusively for anonymous statistical purposes. Without a subpoena, voluntary compliance on the part of your Internet Service Provider, or additional records from a third party, information stored or retrieved for this purpose alone cannot usually be used to identify you.
Marketing
The technical storage or access is required to create user profiles to send advertising, or to track the user on a website or across several websites for similar marketing purposes.
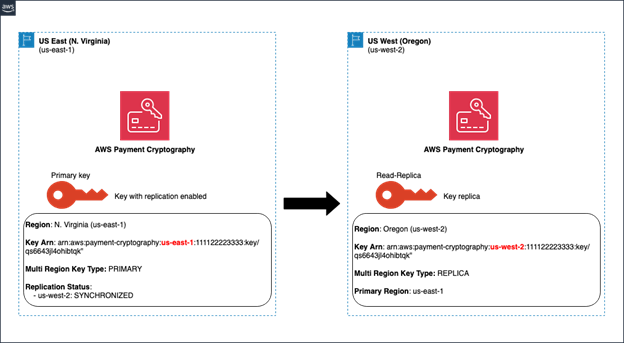


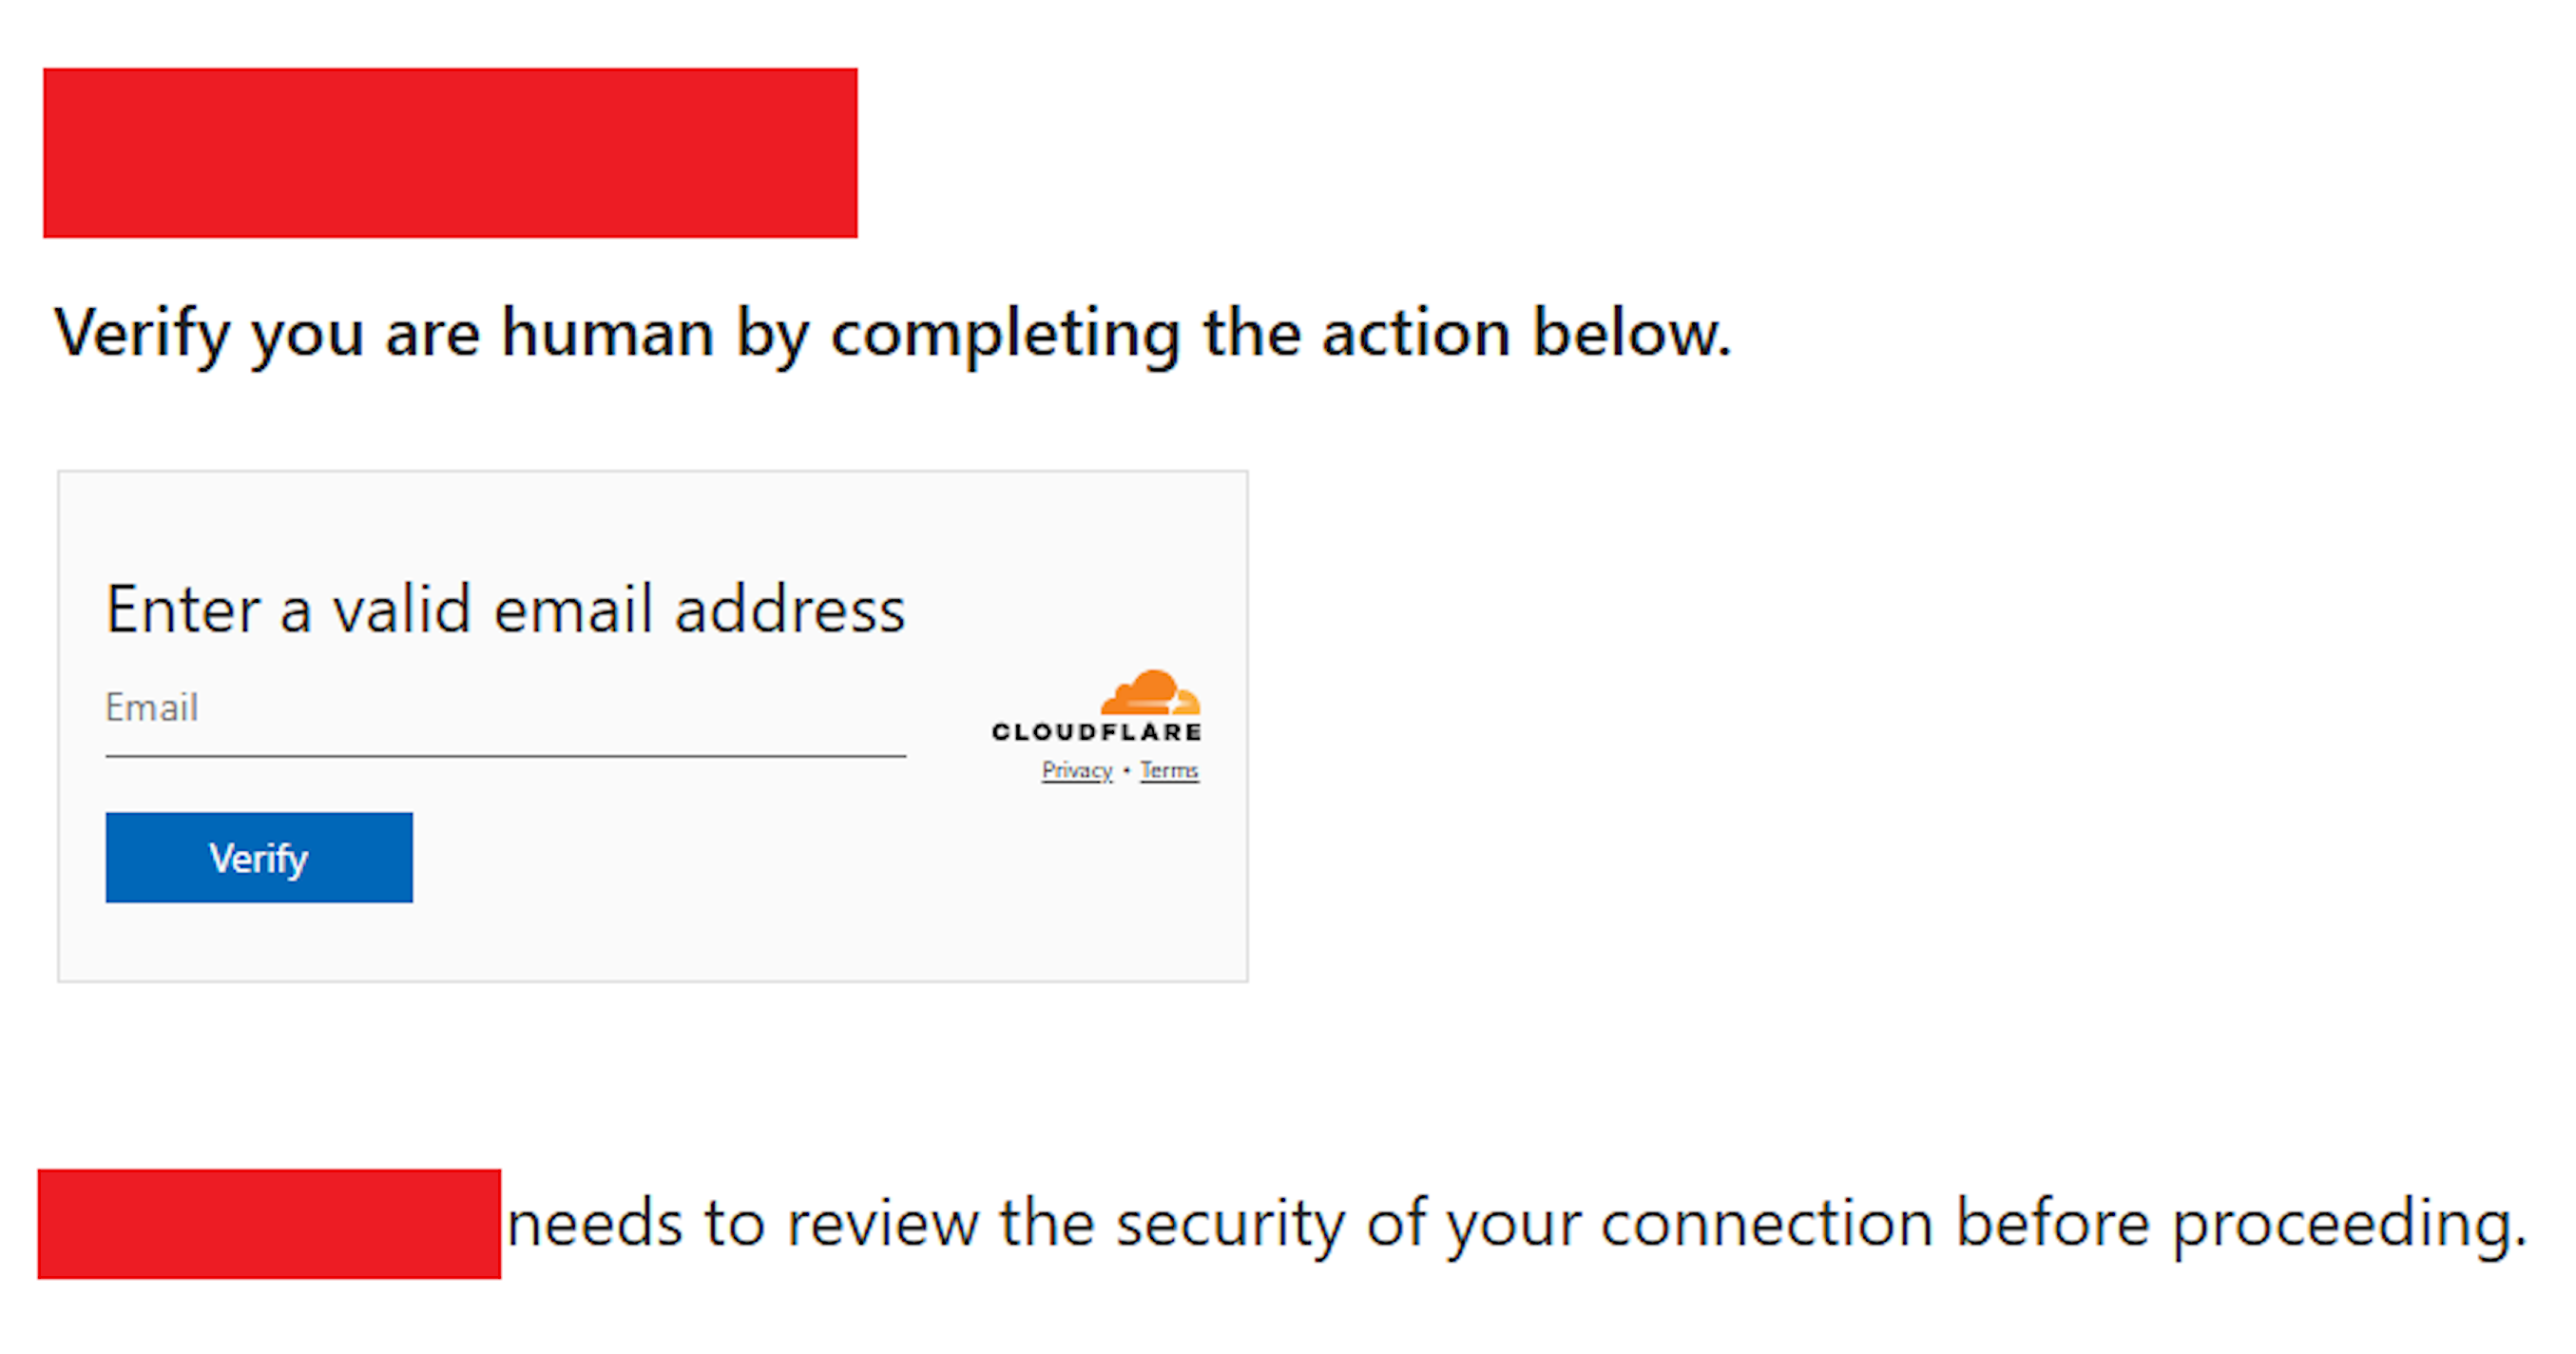
![Decoded JavaScript code, with compromised site removed: "[removed_domain]"](https://d2908q01vomqb2.cloudfront.net/22d200f8670dbdb3e253a90eee5098477c95c23d/2025/08/29/img2-1.png)
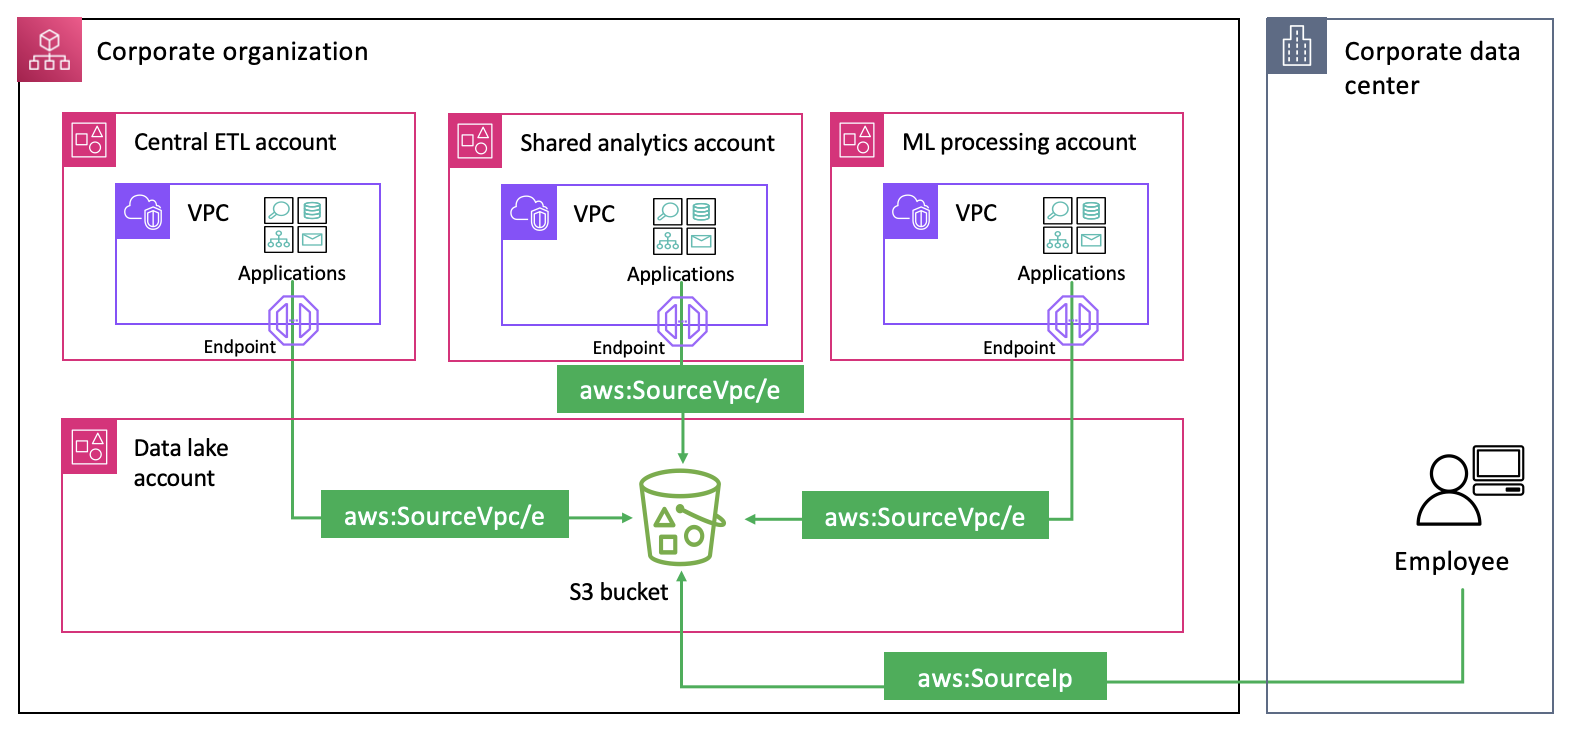


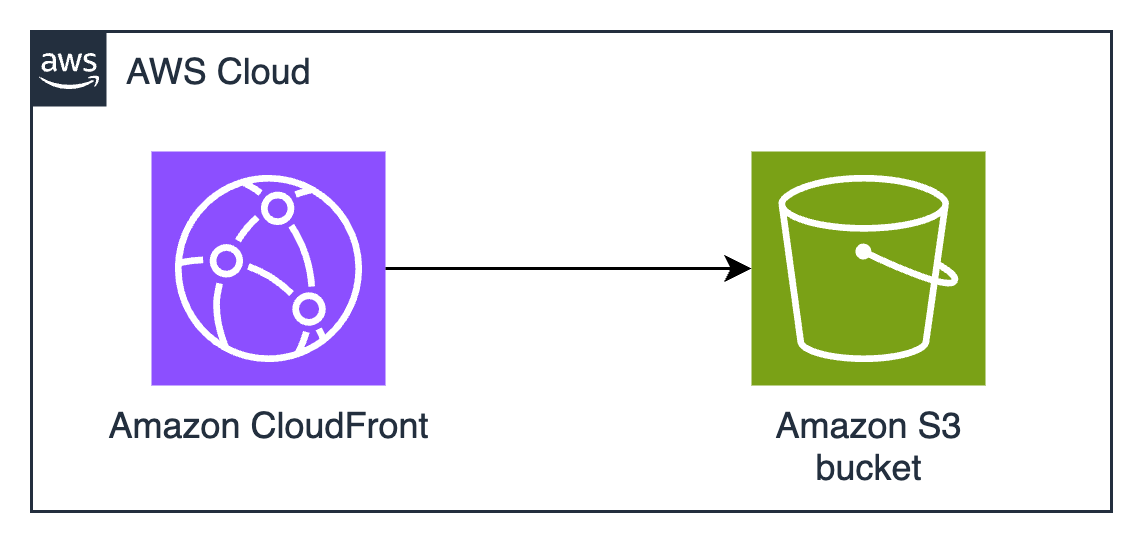
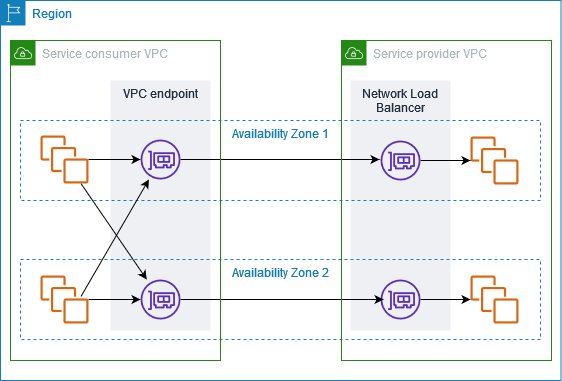
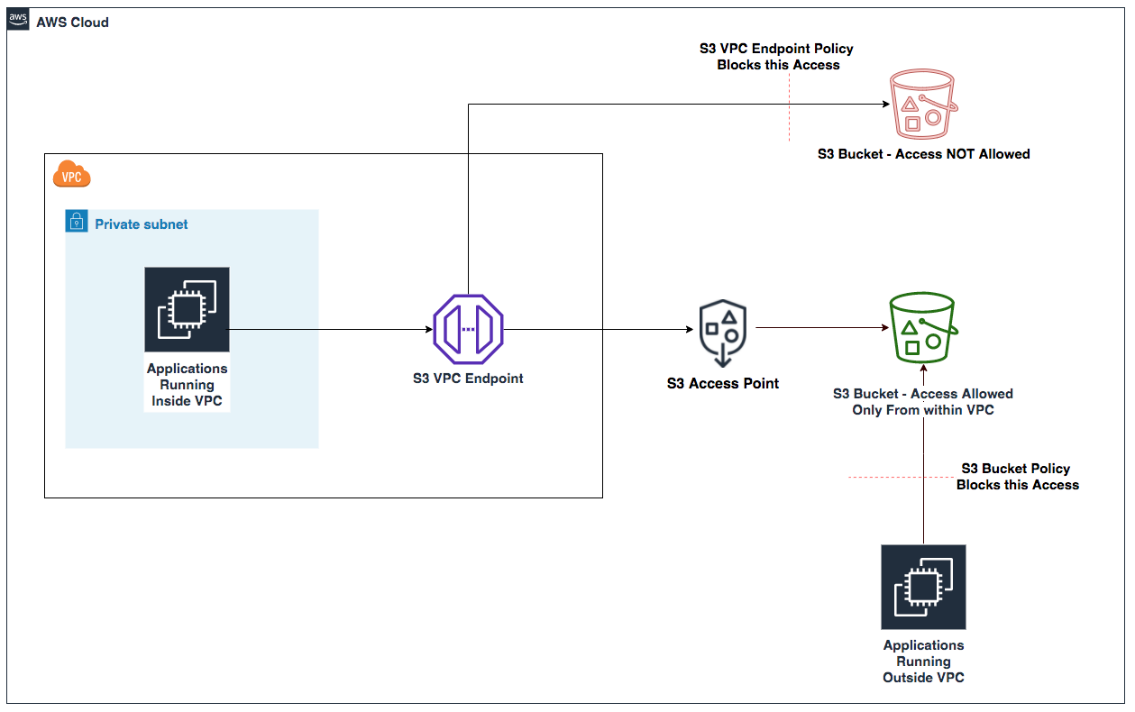
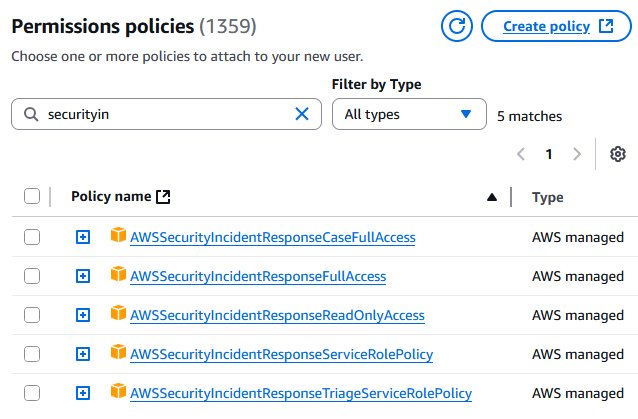
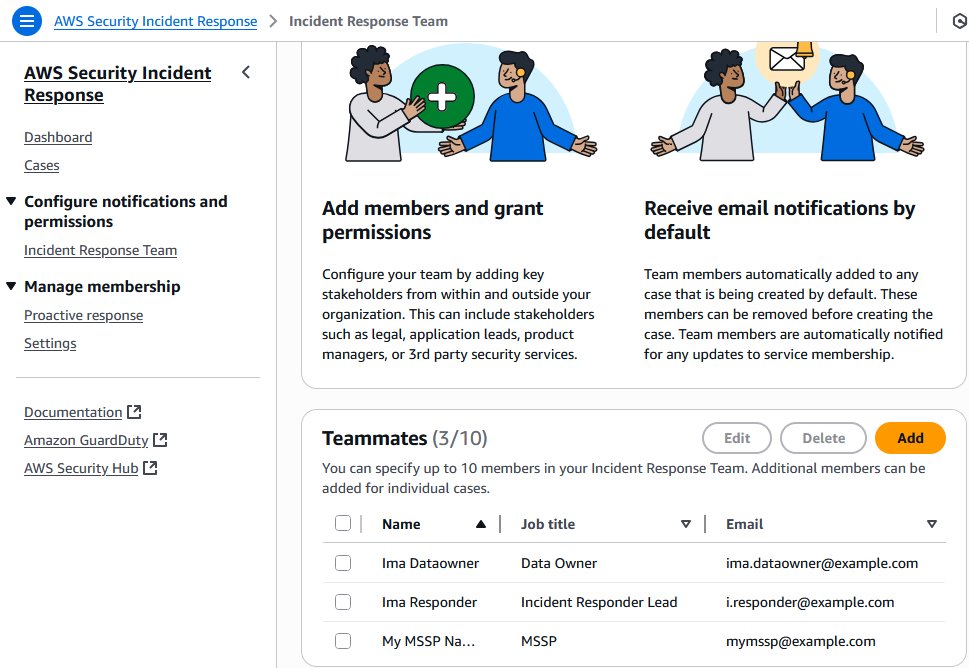
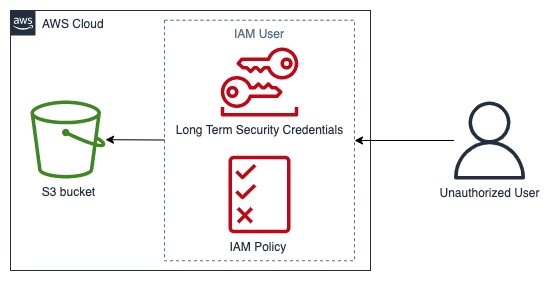
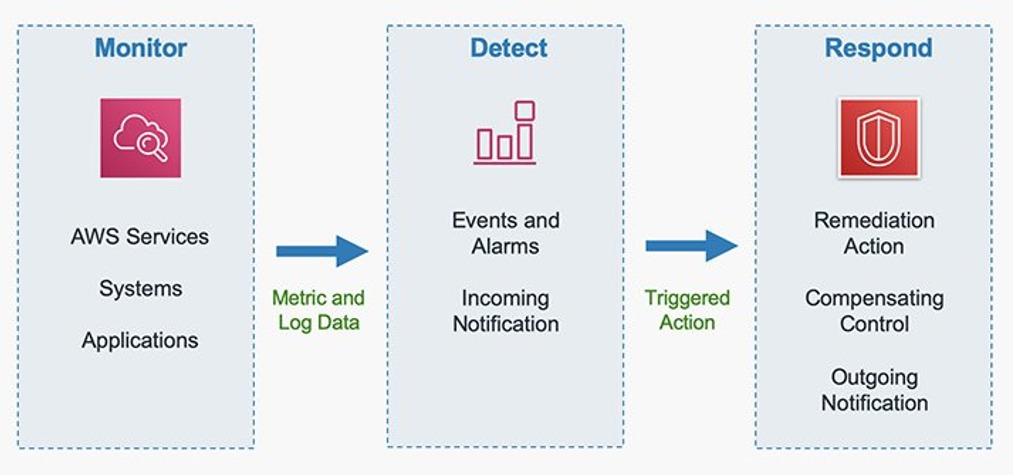
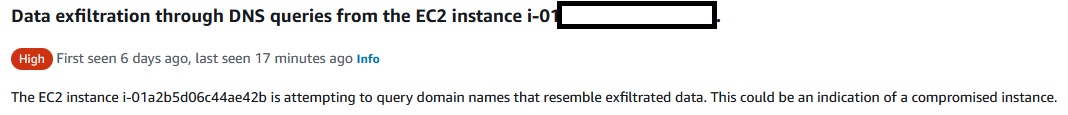
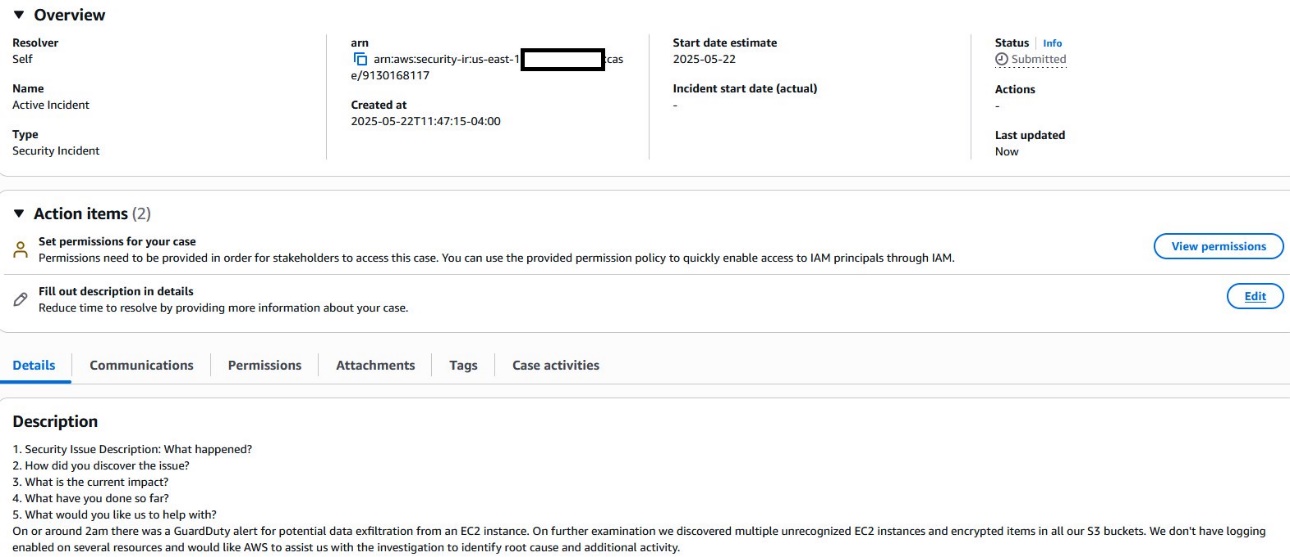
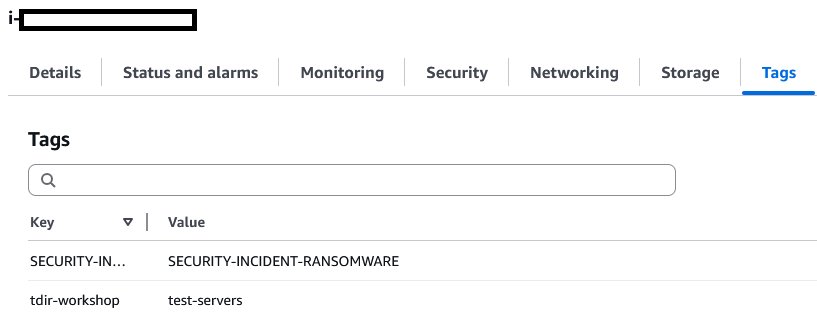
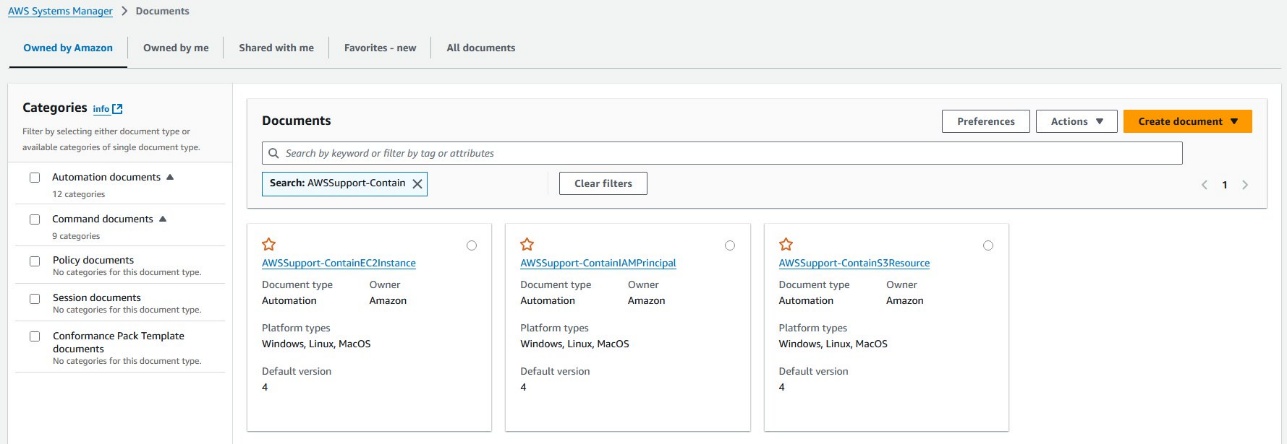


 Xiaoxue Xu is a Solutions Architect for AWS based in Toronto. She primarily works with financial services customers to help secure their workload and design scalable solutions on the AWS Cloud.
 Simran Singh is a Senior Solutions Architect at AWS. In this role, he assists our large enterprise customers in meeting their key business objectives using AWS. His areas of expertise include artificial intelligence and machine learning, security, and improving the experience of developers building on AWS.