Tag Archives: security

Everything you need to know about NIST’s new guidance in “SP 1800-35: Implementing a Zero Trust Architecture”

Post Syndicated from Aaron McAllister original https://blog.cloudflare.com/nist-sp-1300-85/

For decades, the United States National Institute of Standards and Technology (NIST) has been guiding industry efforts through the many publications in its Computer Security Resource Center. NIST has played an especially important role in the adoption of Zero Trust architecture, through its series of publications that began with NIST SP 800-207: Zero Trust Architecture, released in 2020.

NIST has released another Special Publication in this series, SP 1800-35, titled “Implementing a Zero Trust Architecture (ZTA)” which aims to provide practical steps and best practices for deploying ZTA across various environments.  NIST’s publications about ZTA have been extremely influential across the industry, but are often lengthy and highly detailed, so this blog provides a short and easier-to-read summary of NIST’s latest guidance on ZTA.

And so, in this blog post:

  • We summarize the key items you need to know about this new NIST publication, which presents a reference architecture for Zero Trust Architecture (ZTA) along with a series of “Builds” that demonstrate how different products from various vendors can be combined to construct a ZTA that complies with the reference architecture.

  • We show how Cloudflare’s Zero Trust product suite can be integrated with offerings from other vendors to support a Zero Trust Architecture that maps to the NIST’s reference architecture.

  • We highlight a few key features of Cloudflare’s Zero Trust platform that are especially valuable to customers seeking compliance with NIST’s ZTA reference architecture, including compliance with FedRAMP and new post-quantum cryptography standards.

Let’s dive into NIST’s special publication!

Overview of SP 1800-35

In SP 1800-35, NIST reminds us that:

A zero-trust architecture (ZTA) enables secure authorized access to assets — machines, applications and services running on them, and associated data and resources — whether located on-premises or in the cloud, for a hybrid workforce and partners based on an organization’s defined access policy.

NIST uses the term Subject to refer to entities (i.e. employees, developers, devices) that require access to Resources (i.e. computers, databases, servers, applications).  SP 1800-35 focuses on developing and demonstrating various ZTA implementations that allow Subjects to access Resources. Specifically, the reference architecture in SP 1800-35 focuses mainly on EIG or “Enhanced Identity Governance”, a specific approach to Zero Trust Architecture, which is defined by NIST in SP 800-207 as follows:

For [the EIG] approach, enterprise resource access policies are based on identity and assigned attributes. 

The primary requirement for [R]esource access is based on the access privileges granted to the given [S]ubject. Other factors such as device used, asset status, and environmental factors may alter the final confidence level calculation … or tailor the result in some way, such as granting only partial access to a given [Resource] based on network location.

Individual [R]esources or [policy enforcement points (PEP)] must have a way to forward requests to a policy engine service or authenticate the [S]ubject and approve the request before granting access.

While there are other approaches to ZTA mentioned in the original NIST SP 800-207, we omit those here because SP 1800-35 focuses mostly on EIG.

The ZTA reference architecture from SP 1800-35 focuses on EIG approaches as a set of logical components as shown in the figure below.  Each component in the reference architecture does not necessarily correspond directly to physical (hardware or software) components, or products sold by a single vendor, but rather to the logical functionality of the component.


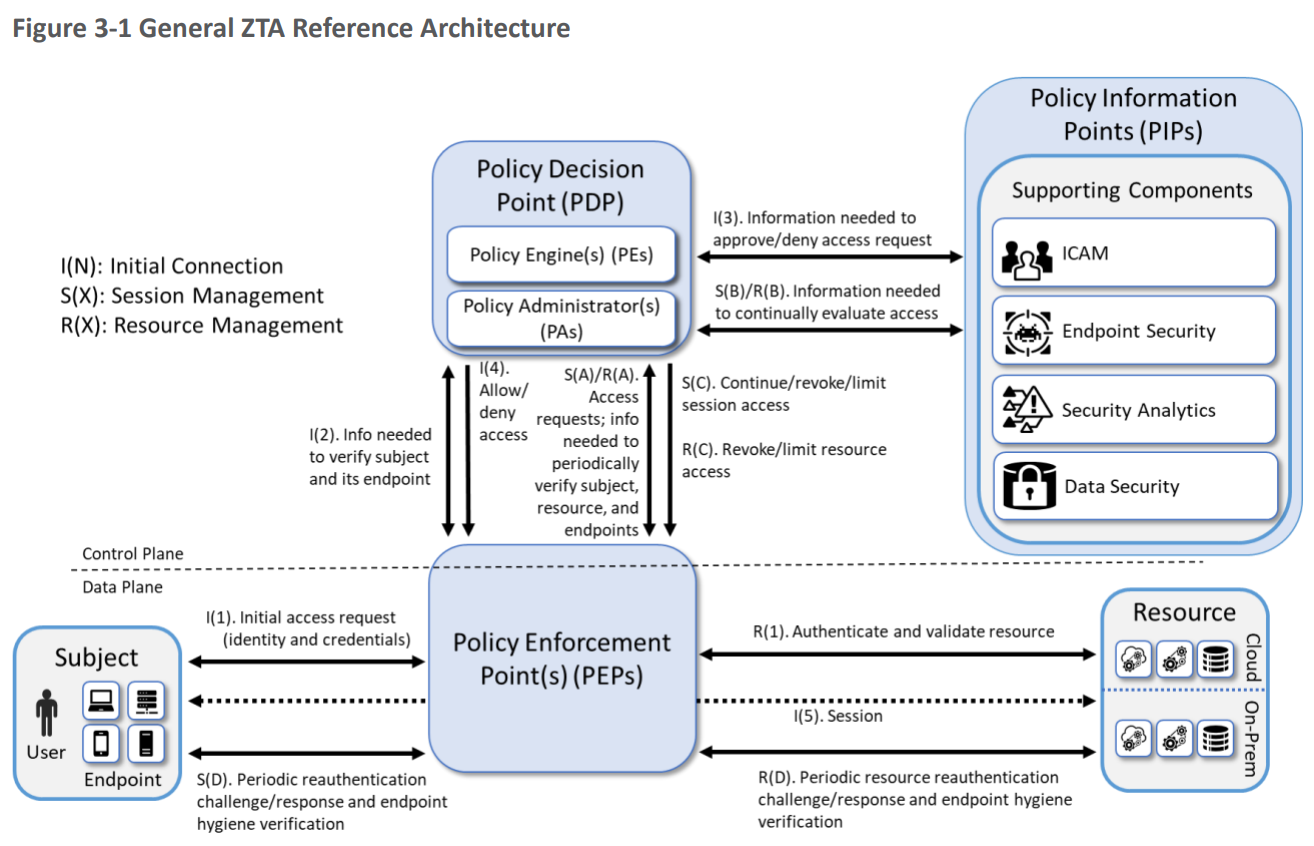
Figure 1: General ZTA Reference Architecture. Source: NIST, Special Publication 1800-35, “Implementing a Zero Trust Architecture (ZTA)”, 2025.

The logical components in the reference architecture are all related to the implementation of policy. Policy is crucial for ZTA because the whole point of a ZTA is to apply policies that determine who has access to what, when and under what conditions.

The core components of the reference architecture are as follows:

| Policy Enforcement Point(PEP) | The PEP protects the “trust zones” that host enterprise Resources, and handles enabling, monitoring, and eventually terminating connections between Subjects and Resources. You can think of the PEP as the dataplane that supports the Subject’s access to the Resources.

Policy Enforcement Point
(PEP)

The PEP protects the “trust zones” that host enterprise Resources, and handles enabling, monitoring, and eventually terminating connections between Subjects and Resources.  You can think of the PEP as the dataplane that supports the Subject’s access to the Resources.

Policy Engine

(PE)

The PE handles the ultimate decision to grant, deny, or revoke access to a Resource for a given Subject, and calculates the trust scores/confidence levels and ultimate access decisions based on enterprise policy and information from supporting components. 

Policy Administrator

(PA)

The PA executes the PE’s policy decision by sending commands to the PEP to establish and terminate the communications path between the Subject and the Resource.

Policy Decision Point (PDP)

The PDP is where the decision as to whether or not to permit a Subject to access a Resource is made.  The PIP included the Policy Engine (PE) and the Policy Administrator (PA).  You can think of the PDP as the control plane that controls the Subject’s access to the Resources.

The PDP operates on inputs from Policy Information Points (PIPs) which are supporting components that provide critical data and policy rules to the Policy Decision Point (PDP).

Policy Information Point

(PIP)

The PIPs provide various types of telemetry and other information needed for the PDP to make informed access decisions.  Some PIPs include:

  • ICAM, or Identity, Credential, and Access Management, covering user authentication, single sign-on, user groups and access control features that are typically offered by Identity Providers (IdPs) like Okta, AzureAD or Ping Identity.  
  • Endpoint security includes endpoint detection and response (EDR) or endpoint protection platforms (EPP) that protect end user devices like laptops and mobile devices.  An EPP primarily focuses on preventing known threats using features like antivirus protection. Meanwhile, an EDR actively detects and responds to threats that may have already breached initial defenses using forensics, behavioral analysis and incident response tools. EDR and EPP products are offered by vendors like CrowdStrikeMicrosoftSentinelOne, and more
  • Security Analytics and Data Security products use data collection, aggregation, and analysis to discover security threats using network traffic, user behavior, and other system data, such as, CrowdStrikeDatadogIBM QRadarMicrosoft SentinelNew RelicSplunk, and more.


NIST’s figure might suggest that supporting components in the PIP are mere plug-ins responding in real-time to the PDP.  However, for many vendors, the ICAM, EDR/EPP, security analytics, and data security PIPs often represent complex and distributed infrastructures.

Crawl or run, but don’t walk

Next, the SP 1800-35 introduces two more detailed reference architectures, the “Crawl Phase” and the “Run Phase”.  The “Run Phase” corresponds to the reference architecture that is shown in the figure above.  The “Crawl Phase” is a simplified version of this reference architecture that only deals with protecting on-premise Resources, and omits cloud Resources. Both of these phases focused on Enhanced Identity Governance approaches to ZTA, as we defined above. NIST stated, “We are skipping the EIG walk phase and have proceeded directly to the run phase“.

The SP 1800-35 then provides a sequence of detailed instructions, called “Builds”, that show how to implement “Crawl Phase” and “Run Phase” reference architectures using products sold by various vendors.

Since Cloudflare’s Zero Trust platform natively supports access to both cloud and on-premise resources, we will skip over the “Crawl Phase” and move directly to showing how Cloudflare’s Zero Trust platform can be used to support “Run Phase” of the reference architecture.

A complete Zero Trust Architecture using Cloudflare and integrations

Nothing in NIST SP 1800-35 represents an endorsement of specific vendor technologies. Instead, the intent of the publication is to offer a general architecture that applies regardless of the technologies or vendors an organization chooses to deploy.   It also includes a series of “Builds” using a variety of technologies from different vendors, that allow organizations to achieve a ZTA.   This section describes how Cloudflare fits in with a ZTA, enabling you to accelerate your ZTA deployment from Crawl directly to Run.

Regarding the “Builds” in SP 1800-35, this section can be viewed as an aggregation of the following three specific builds:

  • Enterprise 1 Build 3 (E1B3): Software-Defined Perimeter (SDP) with Cloudflare as the Policy Engine (PE).

  • Enterprise 2 Build 4 (E2B4): SDP and Secure Access Service Edge (SASE) with Cloudflare Secure Web Gateway, Cloudflare Zero Trust Network Access (ZTNA), and Cloudflare Cloud Access Security Broker as PEs.

  • Enterprise 3 Build 5 (E3B5): SDP and SASE with Microsoft Entra Conditional Access (formerly known as Azure AD Conditional Access) and Cloudflare Zero Trust as PEs.

Now let’s see how we can map Cloudflare’s Zero Trust platform to the ZTA reference architecture:


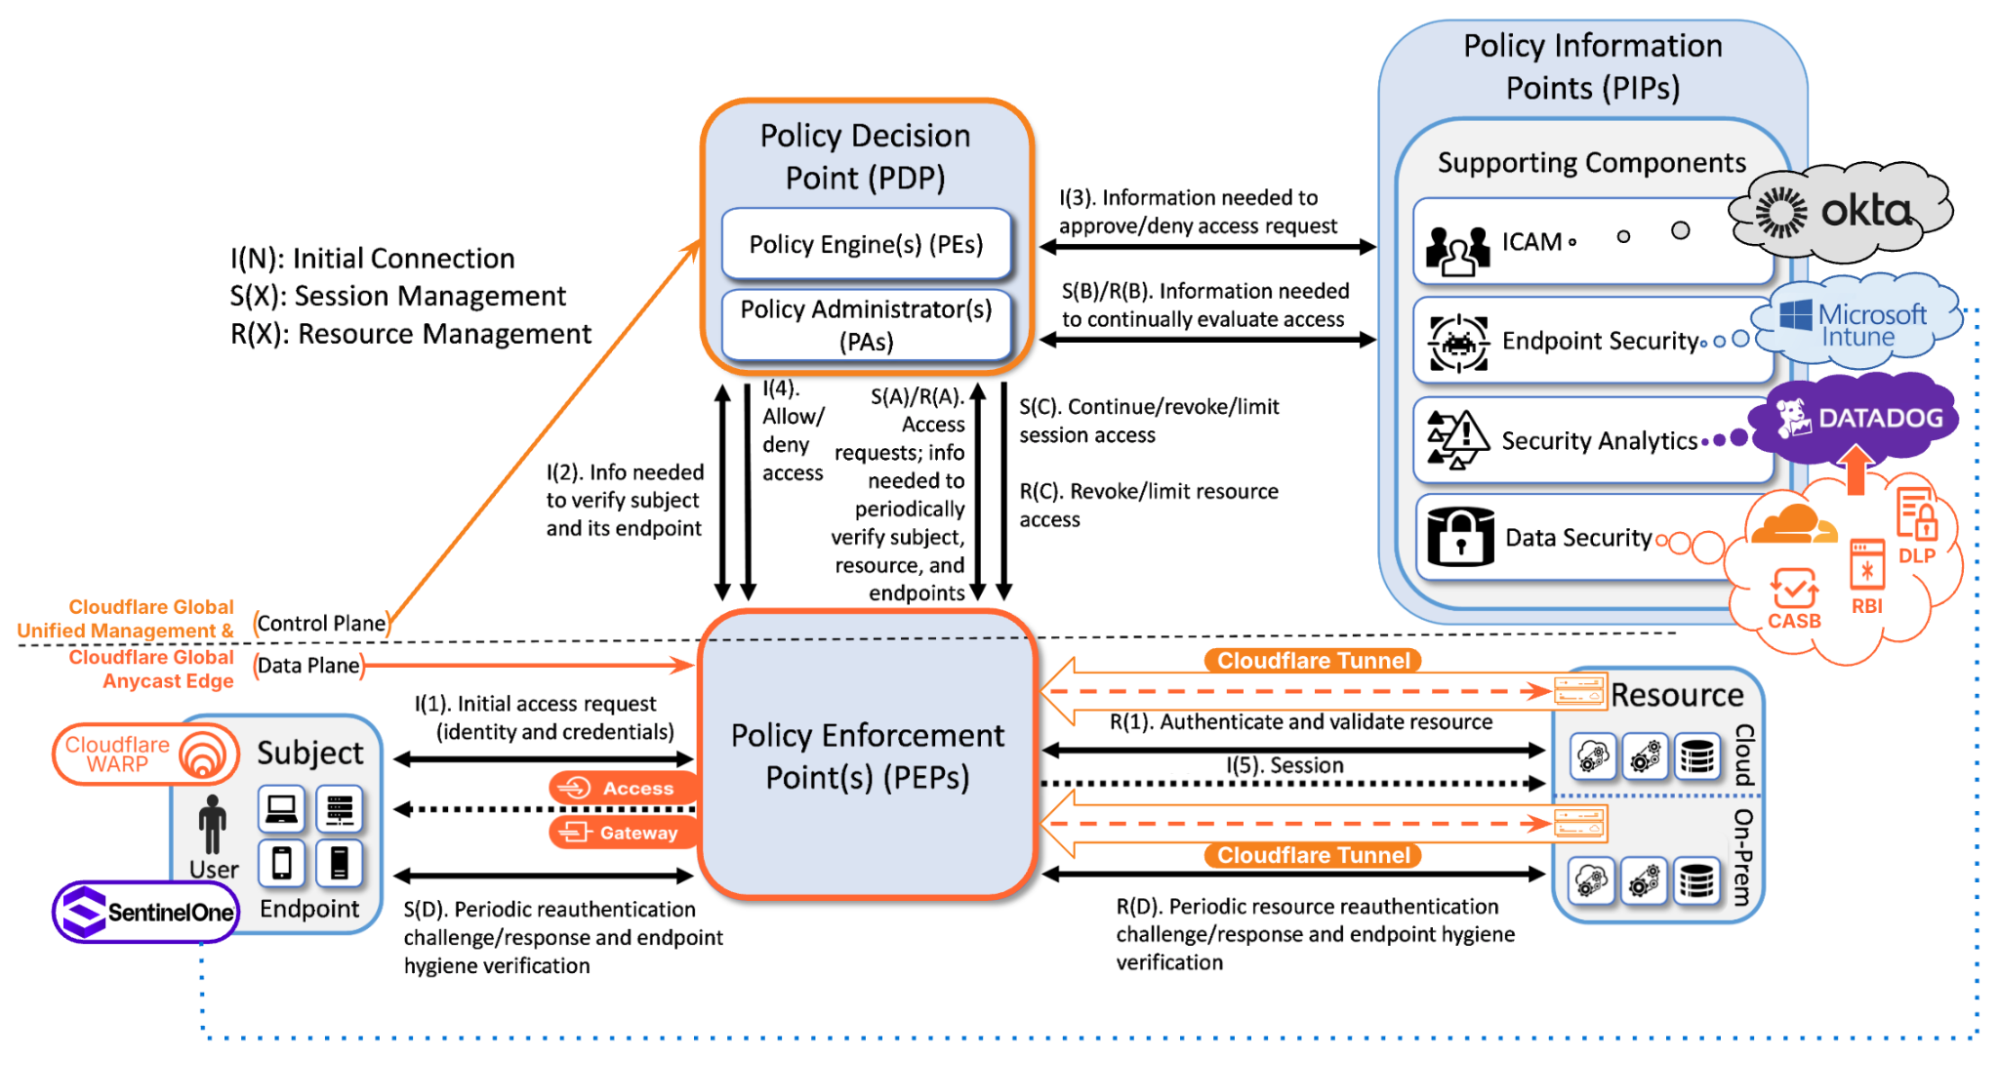
Figure 2: General ZTA Reference Architecture Mapped to Cloudflare Zero Trust & Key Integrations. Source: NIST, Special Publication 1800-35, “Implementing a Zero Trust Architecture (ZTA)”, 2025, with modification by Cloudflare.

Cloudflare’s platform simplifies complexity by delivering the PEP via our global anycast network and the PDP via our Software-as-a-Service (SaaS) management console, which also serves as a global unified control plane. A complete ZTA involves integrating Cloudflare with PIPs provided by other vendors, as shown in the figure above.

Now let’s look at several key points in the figure.

In the bottom right corner of the figure are Resources, which may reside on-premise, in private data centers, or across multiple cloud environments.  Resources are made securely accessible through Cloudflare’s global anycast network via Cloudflare Tunnel (as shown in the figure) or Magic WAN (not shown). Resources are shielded from direct exposure to the public Internet by placing them behind Cloudflare Access and Cloudflare Gateway, which are PEPs that enforce zero-trust principles by granting access to Subjects that conform to policy requirements.

In the bottom left corner of the figure are Subjects, both human and non-human, that need access to Resources.  With Cloudflare’s platform, there are multiple ways that Subjects can again access to Resources, including:

  • Agentless approaches that allow end users to access Resources directly from their web browsers. Alternatively, Cloudflare’s Magic WAN can be used to support connections from enterprise networks directly to Cloudflare’s global anycast network via IPsec tunnels, GRE tunnels or Cloudflare Network Interconnect (CNI).

  • Agent-based approaches use Cloudflare’s lightweight WARP client, which protects corporate devices by securely and privately sending traffic to Cloudflare’s global network.

Now we move onto the PEP (the Policy Enforcement Point), which is the dataplane of our ZTA.   Cloudflare Access is a modern Zero Trust Network Access solution that serves as a dynamic PEP, enforcing user-specific application access policies based on identity, device posture, context, and other factors.  Cloudflare Gateway is a Secure Web Gateway for filtering and inspecting traffic sent to the public Internet, serving as a dynamic PEP that provides DNS, HTTP and network traffic filtering, DNS resolver policies, and egress IP policies.

Both Cloudflare Access and Cloudflare Gateway rely on Cloudflare’s control plane, which acts as a PDP offering a policy engine (PE) and policy administrator (PA).  This PDP takes in inputs from PIPs provided by integrations with other vendors for ICAM, endpoint security, and security analytics.  Let’s dig into some of these integrations.

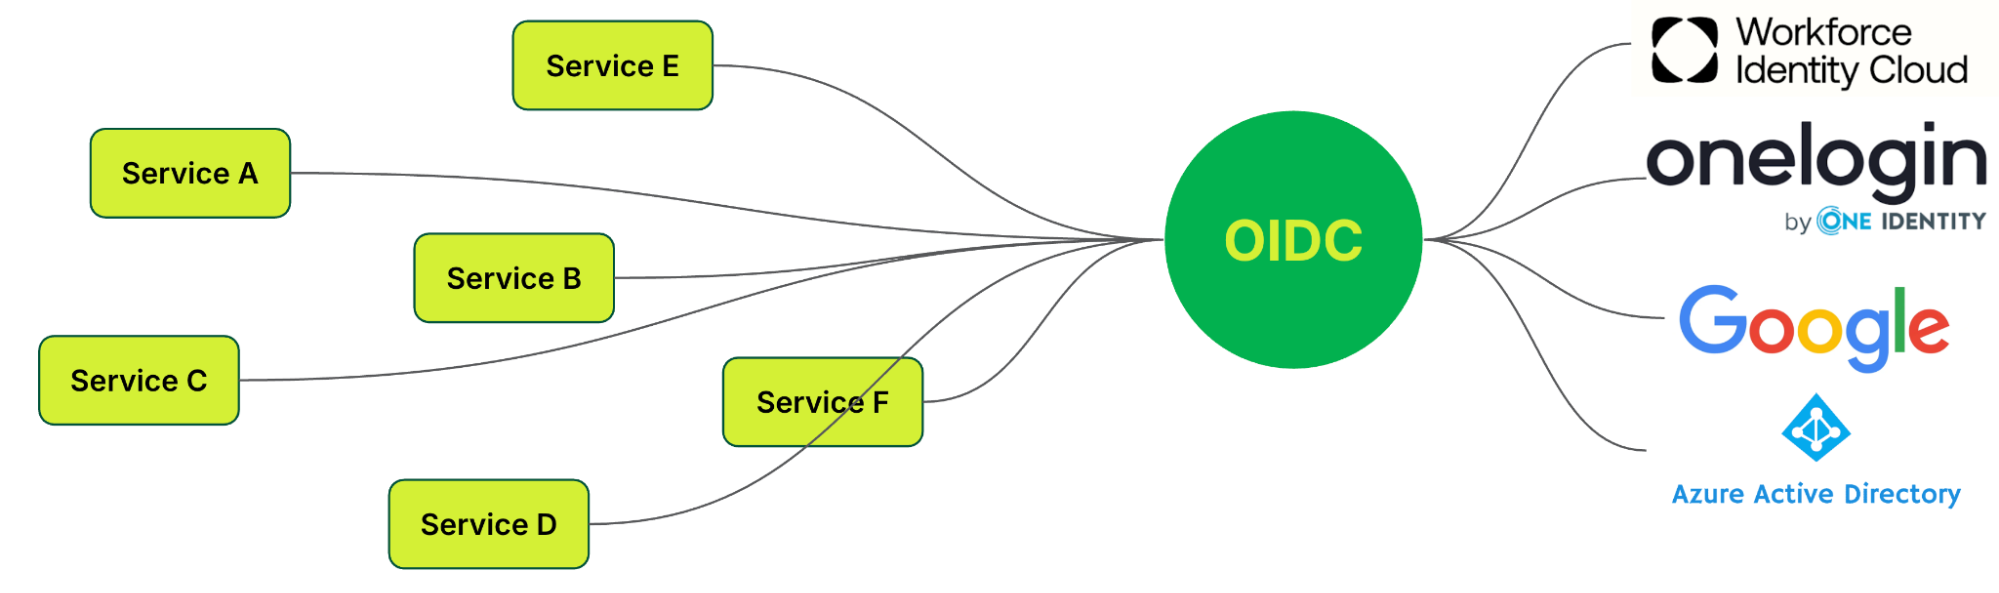
  • ICAM: Cloudflare’s control plane integrates with many ICAM providers that provide Single Sign On (SSO) and Multi-Factor Authentication (MFA). The ICAM provider authenticates human Subjects and passes information about authenticated users and groups back to Cloudflare’s control plane using Security Assertion Markup Language (SAML) or OpenID Connect (OIDC) integrations.  Cloudflare’s ICAM integration also supports AI/ML powered behavior-based user risk scoring, exchange, and re-evaluation.

    In the figure above, we depicted Okta as the ICAM provider, but Cloudflare supports many other ICAM vendors (e.g. Microsoft Entra, Jumpcloud, GitHub SSO, PingOne).   For non-human Subjects — such as service accounts, Internet of Things (IoT) devices, or machine identities — authentication can be performed through certificates, service tokens, or other cryptographic methods.

  • Endpoint security: Cloudflare’s control plane integrates with many endpoint security providers to exchange signals, such as device posture checks and user risk levels. Cloudflare facilitates this through integrations with endpoint detection and response EDR/EPP solutions, such as CrowdStrike, Microsoft, SentinelOne, and more. When posture checks are enabled with one of these vendors such as Microsoft, device state changes, ‘noncompliant’, can be sent to Cloudflare Zero Trust, automatically restricting access to Resources. Additionally, Cloudflare Zero Trust enables the ability to synchronize the Microsoft Entra ID risky users list and apply more stringent Zero Trust policies to users at higher risk. 

  • Security Analytics: Cloudflare’s control plane integrates with real-time logging and analytics for persistent monitoring.  Cloudflare’s own analytics and logging features monitor access requests and security events. Optionally, these events can be sent to a Security Information and Event Management (SIEM)  solution such as, CrowdStrike, Datadog, IBM QRadar, Microsoft Sentinel, New Relic, Splunk, and more using Cloudflare’s logpush integration.

    Cloudflare’s user risk scoring system is built on the OpenID Shared Signals Framework (SSF) Specification, which allows integration with existing and future providers that support this standard. SSF focuses on the exchange of Security Event Tokens (SETs), a specialized type of JSON Web Token (JWT). By using SETs, providers can share user risk information, creating a network of real-time, shared security intelligence. In the context of NIST’s Zero Trust Architecture, this system functions as a PIP, which is responsible for gathering information about the Subject and their context, such as risk scores, device posture, or threat intelligence. This information is then provided to the PDP, which evaluates access requests and determines the appropriate policy actions. The PEP uses these decisions to allow or deny access, completing the cycle of secure, dynamic access control.

  • Data security: Cloudflare’s Zero Trust offering provides robust data security capabilities across data-in-transit, data-in-use, and data-at-rest. Its Data Loss Prevention (DLP) safeguards sensitive information in transit by inspecting and blocking unauthorized data movement. Remote Browser Isolation (RBI) protects data-in-use by preventing malware, phishing, and unauthorized exfiltration while enabling secure web access. Meanwhile, Cloud Access Security Broker (CASB) ensures data-at-rest security by enforcing granular controls over SaaS applications, preventing unauthorized access and data leakage. Together, these capabilities provide comprehensive protection for modern enterprises operating in a cloud-first environment.

By leveraging Cloudflare’s Zero Trust platform, enterprises can simplify and enhance their ZTA implementation, securing diverse environments and endpoints while ensuring scalability and ease of deployment. This approach ensures that all access requests—regardless of where the Subjects or Resources are located—adhere to robust security policies, reducing risks and improving compliance with modern security standards.

Support for agencies and enterprises running towards Zero Trust Architecture

Cloudflare works with multiple enterprises, and federal and state agencies that rely on NIST guidelines to secure their networks.  So we take a brief detour to describe some unique features of Cloudflare’s Zero Trust platform that we’ve found to be valuable to these enterprises.

  • FedRAMP data centers.  Many government agencies and commercial enterprises have FedRAMP requirements, and Cloudflare is well-equipped to support them. FedRAMPs requirements sometimes require organizations to self-host software and services inside their own network perimeter, which can result in higher latency, degraded performance and increased cost.  At Cloudflare, we take a different approach. Organizations can still benefit from Cloudflare’s global network and unparalleled performance while remaining Fedramp compliant.  To support FedRAMP customers, Cloudflare’s dataplane (aka our PEP, or Policy Enforcement Point) consists of data centers in over 330 cities where customers can send their encrypted traffic, and 32 FedRAMP datacenters where traffic is sent to when sensitive dataplane operations are required (e.g. TLS inspection).  This architecture means that our customers do not need to self-host a PEP and incur the associated cost, latency, and performance degradation.

  • Post-quantum cryptography. NIST has announced that by 2030 all conventional cryptography (RSA and ECDSA) must be deprecated and upgraded to post-quantum cryptography.  But upgrading cryptography is hard and takes time, so Cloudflare aims to take on the burden of managing cryptography upgrades for our customers. That’s why organizations can tunnel their corporate network traffic though Cloudflare’s Zero Trust platform, protecting it against quantum adversaries without the hassle of individually upgrading each and every corporate application, system, or network connection. End-to-end quantum safety is available for communications from end-user devices, via web browser (today) or Cloudflare’s WARP device client (mid-2025), to secure applications connected with Cloudflare Tunnel.

Run towards Zero Trust Architecture with Cloudflare 

NIST’s latest publication, SP 1800-35, provides a structured approach to implementing Zero Trust, emphasizing the importance of policy enforcement, continuous authentication, and secure access management. Cloudflare’s Zero Trust platform simplifies this complex framework by delivering a scalable, globally distributed solution that is FedRAMP-compliant and integrates with industry-leading providers like Okta, Microsoft, Ping, CrowdStrike, and SentinelOne to ensure comprehensive protection.

A key differentiator of Cloudflare’s Zero Trust solution is our global anycast network, one of the world’s largest and most interconnected networks. Spanning 330+ cities across 120+ countries, this network provides unparalleled performance, resilience, and scalability for enforcing Zero Trust policies without negatively impacting the end user experience. By leveraging Cloudflare’s network-level enforcement of security controls, organizations can ensure that access control, data protection, and security analytics operate at the speed of the Internet — without backhauling traffic through centralized choke points. This architecture enables low-latency, highly available enforcement of security policies, allowing enterprises to seamlessly protect users, devices, and applications across on-prem, cloud, and hybrid environments.

Now is the time to take action. You can start implementing Zero Trust today by leveraging Cloudflare’s platform in alignment with NIST’s reference architecture. Whether you are beginning your Zero Trust journey or enhancing an existing framework, Cloudflare provides the tools, network, and integrations to help you succeed. Sign up for Cloudflare Zero Trust, explore our integrations, and secure your organization with a modern, globally distributed approach to cybersecurity.

Cloudflare Log Explorer is now GA, providing native observability and forensics

Post Syndicated from Jen Sells original https://blog.cloudflare.com/logexplorer-ga/

We are thrilled to announce the General Availability of Cloudflare Log Explorer, a powerful new product designed to bring observability and forensics capabilities directly into your Cloudflare dashboard. Built on the foundation of Cloudflare’s vast global network, Log Explorer leverages the unique position of our platform to provide a comprehensive and contextualized view of your environment.

Security teams and developers use Cloudflare to detect and mitigate threats in real-time and to optimize application performance. Over the years, users have asked for additional telemetry with full context to investigate security incidents or troubleshoot application performance issues without having to forward data to third party log analytics and Security Information and Event Management (SIEM) tools. Besides avoidable costs, forwarding data externally comes with other drawbacks such as: complex setups, delayed access to crucial data, and a frustrating lack of context that complicates quick mitigation. 

Log Explorer has been previewed by several hundred customers over the last year, and they attest to its benefits: 

“Having WAF logs (firewall events) instantly available in Log Explorer with full context — no waiting, no external tools — has completely changed how we manage our firewall rules. I can spot an issue, adjust the rule with a single click, and immediately see the effect. It’s made tuning for false positives faster, cheaper, and far more effective.” 

“While we use Logpush to ingest Cloudflare logs into our SIEM, when our development team needs to analyze logs, it can be more effective to utilize Log Explorer. SIEMs make it difficult for development teams to write their own queries and manipulate the console to see the logs they need. Cloudflare’s Log Explorer, on the other hand, makes it much easier for dev teams to look at logs and directly search for the information they need.”

With Log Explorer, customers have access to Cloudflare logs with all the context available within the Cloudflare platform. Compared to external tools, customers benefit from: 

  • Reduced cost and complexity: Drastically reduce the expense and operational overhead associated with forwarding, storing, and analyzing terabytes of log data in external tools.

  • Faster detection and triage: Access Cloudflare-native logs directly, eliminating cumbersome data pipelines and the ingest lags that delay critical security insights.

  • Accelerated investigations with full context: Investigate incidents with Cloudflare’s unparalleled contextual data, accelerating your analysis and understanding of “What exactly happened?” and “How did it happen?”

  • Minimal recovery time: Seamlessly transition from investigation to action with direct mitigation capabilities via the Cloudflare platform.

Log Explorer is available as an add-on product for customers on our self serve or Enterprise plans. Read on to learn how each of the capabilities of Log Explorer can help you detect and diagnose issues more quickly.

Monitor security and performance issues with custom dashboards

Custom dashboards allow you to define the specific metrics you need in order to monitor unusual or unexpected activity in your environment.

Getting started is easy, with the ability to create a chart using natural language. A natural language interface is integrated into the chart create/edit experience, enabling you to describe in your own words the chart you want to create. Similar to the AI Assistant we announced during Security Week 2024, the prompt translates your language to the appropriate chart configuration, which can then be added to a new or existing custom dashboard.

As an example, you can create a dashboard for monitoring for the presence of Remote Code Execution (RCE) attacks happening in your environment. An RCE attack is where an attacker is able to compromise a machine in your environment and execute commands. The good news is that RCE is a detection available in Cloudflare WAF.  In the dashboard example below, you can not only watch for RCE attacks, but also correlate them with other security events such as malicious content uploads, source IP addresses, and JA3/JA4 fingerprints. Such a scenario could mean one or more machines in your environment are compromised and being used to spread malware — surely, a very high risk incident!


A reliability engineer might want to create a dashboard for monitoring errors. They could use the natural language prompt to enter a query like “Compare HTTP status code ranges over time.” The AI model then decides the most appropriate visualization and constructs their chart configuration.

While you can create custom dashboards from scratch, you could also use an expert-curated dashboard template to jumpstart your security and performance monitoring. 

Available templates include: 

  • Bot monitoring: Identify automated traffic accessing your website

  • API Security: Monitor the data transfer and exceptions of API endpoints within your application

  • API Performance: See timing data for API endpoints in your application, along with error rates

  • Account Takeover: View login attempts, usage of leaked credentials, and identify account takeover attacks

  • Performance Monitoring: Identify slow hosts and paths on your origin server, and view time to first byte (TTFB) metrics over time

  • Security Monitoring: monitor attack distribution across top hosts and paths, correlate DDoS traffic with origin Response time to understand the impact of DDoS attacks.


Investigate and troubleshoot issues with Log Search 

Continuing with the example from the prior section, after successfully diagnosing that some machines were compromised through the RCE issue, analysts can pivot over to Log Search in order to investigate whether the attacker was able to access and compromise other internal systems. To do that, the analyst could search logs from Zero Trust services, using context, such as compromised IP addresses from the custom dashboard, shown in the screenshot below: 


Log Search is a streamlined experience including data type-aware search filters, or the ability to switch to a custom SQL interface for more powerful queries. Log searches are also available via a public API


Save time and collaborate with saved queries

Queries built in Log Search can now be saved for repeated use and are accessible to other Log Explorer users in your account. This makes it easier than ever to investigate issues together. 


Monitor proactively with Custom Alerting (coming soon)

With custom alerting, you can configure custom alert policies in order to proactively monitor the indicators that are important to your business. 

Starting from Log Search, define and test your query. From here you can opt to save and configure a schedule interval and alerting policy. The query will run automatically on the schedule you define.

Tracking error rate for a custom hostname

If you want to monitor the error rate for a particular host, you can use this Log Search query to calculate the error rate per time interval:

SELECT SUBSTRING(EdgeStartTimeStamp, 1, 14) || '00:00' AS time_interval,
       COUNT() AS total_requests,
       COUNT(CASE WHEN EdgeResponseStatus >= 500 THEN 1 ELSE NULL END) AS error_requests,
       COUNT(CASE WHEN EdgeResponseStatus >= 500 THEN 1 ELSE NULL END) * 100.0 / COUNT() AS error_rate_percentage
 FROM http_requests
WHERE EdgeStartTimestamp >= '2025-06-09T20:56:58Z'
  AND EdgeStartTimestamp <= '2025-06-10T21:26:58Z'
  AND ClientRequestHost = 'customhostname.com'
GROUP BY time_interval
ORDER BY time_interval ASC;

Running the above query returns the following results. You can see the overall error rate percentage in the far right column of the query results.


Proactively detect malware

We can identify malware in the environment by monitoring logs from Cloudflare Secure Web Gateway. As an example, Katz Stealer is malware-as-a-service designed for stealing credentials. We can monitor DNS queries and HTTP requests from users within the company in order to identify any machines that may be infected with Katz Stealer malware. 


And with custom alerts, you can configure an alert policy so that you can be notified via webhook or PagerDuty.

Maintain audit & compliance with flexible retention (coming soon)

With flexible retention, you can set the precise length of time you want to store your logs, allowing you to meet specific compliance and audit requirements with ease. Other providers require archiving or hot and cold storage, making it difficult to query older logs. Log Explorer is built on top of our R2 storage tier, so historical logs can be queried as easily as current logs. 

How we built Log Explorer to run at Cloudflare scale

With Log Explorer, we have built a scalable log storage platform on top of Cloudflare R2 that lets you efficiently search your Cloudflare logs using familiar SQL queries. In this section, we’ll look into how we did this and how we solved some technical challenges along the way.

Log Explorer consists of three components: ingestors, compactors, and queriers. Ingestors are responsible for writing logs from Cloudflare’s data pipeline to R2. Compactors optimize storage files, so they can be queried more efficiently. Queriers execute SQL queries from users by fetching, transforming, and aggregating matching logs from R2.


During ingestion, Log Explorer writes each batch of log records to a Parquet file in R2. Apache Parquet is an open-source columnar storage file format, and it was an obvious choice for us: it’s optimized for efficient data storage and retrieval, such as by embedding metadata like the minimum and maximum values of each column across the file which enables the queriers to quickly locate the data needed to serve the query.

Log Explorer stores logs on a per-customer level, just like Cloudflare D1, so that your data isn’t mixed with that of other customers. In Q3 2025, per-customer logs will allow you the flexibility to create your own retention policies and decide in which regions you want to store your data.

But how does Log Explorer find those Parquet files when you query your logs? Log Explorer leverages the Delta Lake open table format to provide a database table abstraction atop R2 object storage. A table in Delta Lake pairs data files in Parquet format with a transaction log. The transaction log registers every addition, removal, or modification of a data file for the table – it’s stored right next to the data files in R2.

Given a SQL query for a particular log dataset such as HTTP Requests or Gateway DNS, Log Explorer first has to load the transaction log of the corresponding Delta table from R2. Transaction logs are checkpointed periodically to avoid having to read the entire table history every time a user queries their logs.

Besides listing Parquet files for a table, the transaction log also includes per-column min/max statistics for each Parquet file. This has the benefit that Log Explorer only needs to fetch files from R2 that can possibly satisfy a user query. Finally, queriers use the min/max statistics embedded in each Parquet file to decide which row groups to fetch from the file.

Log Explorer processes SQL queries using Apache DataFusion, a fast, extensible query engine written in Rust, and delta-rs, a community-driven Rust implementation of the Delta Lake protocol. While standing on the shoulders of giants, our team had to solve some unique problems to provide log search at Cloudflare scale.

Log Explorer ingests logs from across Cloudflare’s vast global network, spanning more than 330 cities in over 125 countries. If Log Explorer were to write logs from our servers straight to R2, its storage would quickly fragment into a myriad of small files, rendering log queries prohibitively expensive.

Log Explorer’s strategy to avoid this fragmentation is threefold. First, it leverages Cloudflare’s data pipeline, which collects and batches logs from the edge, ultimately buffering each stream of logs in an internal system named Buftee. Second, log batches ingested from Buftee aren’t immediately committed to the transaction log; rather, Log Explorer stages commits for multiple batches in an intermediate area and “squashes” these commits before they’re written to the transaction log. Third, once log batches have been committed, a process called compaction merges them into larger files in the background.

While the open-source implementation of Delta Lake provides compaction out of the box, we soon encountered an issue when using it for our workloads. Stock compaction merges data files to a desired target size S by sorting the files in reverse order of their size and greedily filling bins of size S with them. By merging logs irrespective of their timestamps, this process distributed ingested batches randomly across merged files, destroying data locality. Despite compaction, a user querying for a specific time frame would still end up fetching hundreds or thousands of files from R2.

For this reason, we wrote a custom compaction algorithm that merges ingested batches in order of their minimum log timestamp, leveraging the min/max statistics mentioned previously. This algorithm reduced the number of overlaps between merged files by two orders of magnitude. As a result, we saw a significant improvement in query performance, with some large queries that had previously taken over a minute completing in just a few seconds.

Follow along for more updates

We’re just getting started! We’re actively working on even more powerful features to further enhance your experience with Log Explorer. Subscribe to the blog and keep an eye out for more updates in our Change Log to our observability and forensics offering soon.

Get access to Log Explorer

To get access to Log Explorer, reach out for a consultation or contact your account manager. Additionally, you can read more in our Developer Documentation.

Secure your Express application APIs in minutes with Amazon Verified Permissions

Post Syndicated from Trevor Schiavone original https://aws.amazon.com/blogs/security/secure-your-express-application-apis-in-minutes-with-amazon-verified-permissions/

Today, Amazon Verified Permissions announced the release of @verifiedpermissions/authorization-clients-js, an open source package that developers can use to implement external fine-grained authorization for Express.js web application APIs in minutes when using Verified Permissions.

Express is a minimal and flexible Node.js web application framework that provides a robust set of features for web and mobile applications. By using this standardized integration with Verified Permissions, developers can externalize authorization using up to 90 percent less code compared to writing their own custom integrations, saving them time and effort and improving application security posture by reducing the amount of custom integration code.

Why externalize authorization?

Traditionally, developers implemented authorization within their application by embedding authorization logic directly into application code. This embedded authorization logic is designed to support a few permissions, but as applications evolve, there is often a need to incrementally update the embedded authorization logic to support more complex use cases, resulting in code that is complex and difficult to maintain. As code complexity increases, further evolving the security model and performing audits of permissions becomes more challenging, resulting in an application that becomes more difficult to maintain over its lifecycle.

By externalizing authorization, you can decouple authorization logic from your application. This yields multiple benefits including freeing up development teams to focus on application logic and simplifying software audits.

One approach to externalize authorization from your application code is to use Cedar. Cedar is an open source language and software development kit (SDK) for writing and enforcing authorization policies for your applications. You specify fine-grained permissions as Cedar policies, and your application authorizes access requests by calling the Cedar SDK. For example, if you’re building a pet store application, you can use the following Cedar policy to control that only a user with a jobLevel of employee can access the POST /pets API.


permit (
	principal,
	action in [Action::"POST /pets"], 
	resource
) when {
	principal.jobLevel = "employee"
};

One option for using Cedar is to self-manage the implementation; you can find an example for this pattern in another post: Secure your application APIs in 5 minutes with Cedar.

Self-managed Cedar provides the benefits of externalizing authorization but requires ongoing operational management. Organizations are responsible for Cedar version upgrades, applying security patches, managing policies, and auditing authorizations. Another option for using Cedar is to use Verified Permissions. Verified Permissions removes these operational requirements by providing a managed service for Cedar. Verified Permissions manages scaling, simplifies policy governance by supporting centralized policy management, and logs policy changes and authorization requests to simplify auditing.

This post describes how web application developers can use the new Express package to simplify the integration of Express web applications with Verified Permissions. The step-by-step guide uses a sample Pet Store application to show how access to APIs can be restricted based on user groups. You can find the sample Pet Store application in the verifiedpermissions repository on GitHub.

Pet Store application API overview

The Pet Store application is used to manage a pet store. The pet store is built using Express with Node.js and exposes the APIs in the following table.

API Description
GET /api/pets Returns the list of available pets
GET /api/pets/{petId} Returns the specified pet found
POST /api/pets Adds a pet to the pet store
PUT /api/pets/{petId} Updates an existing pet
DELETE /api/pets/{petId} Removes a pet from the pet store

This application doesn’t allow all users to access all APIs. Instead, it enforces the following rules:

  • Administrators: Full access to pets and management functions
  • Employees: Can view, create, and update pets
  • Customers: Can view pets and create new pets

Implementing authorization for the Pet Store APIs

Let’s walk through how to secure your application APIs using Verified Permissions and the new package for Express. The initial application, with no authorization, can be found in the start folder; use this to follow along with the post. You can find a completed version of the application in the finish folder.

When completed, you’ll have implemented the application architecture shown in Figure 1. A React frontend application that uses Amazon Cognito for authentication. The application then includes the identity token returned from Cognito as an authorization header to the Express backend APIs. The Express backend, using the new Verified Permissions authorization middleware package, calls Verified Permissions to authorize the user request.

Figure 1: Architecture of the Pet Store application

Figure 1: Architecture of the Pet Store application

Prerequisites

Before you get started, make sure you have the following prerequisites in place.

Step 1: Set up the AWS CLI

Some of the commands require the AWS Command Line Interface (AWS CLI). See Installing or updating to the latest version of the AWS CLI and Configuring settings for the AWS CLI.

Step 2: Set up an OpenID Connect identity provider and a database

The Pet Store application uses an OpenID Connect (OIDC) identity provider to manage users. For this example, you use an Amazon Cognito user pool called PetStoreUserPool with three users, one Admin, one Employee, and one Customer.

The application also uses a Amazon DynamoDB database to store the pets.

You can set up Amazon Cognito and DynamoDB in your AWS account by running the following command in the /start directory.

./scripts/setup-infrastructure.sh

The setup script will prompt you to set passwords for the three users (passwords must be at least 8 characters and require at least one number, one uppercase letter, and one lowercase letter).

Note the outputs of running this script because you’ll use them in step 5 of Integrate Verified Permissions.

Note: In your own applications, you can set up Amazon Cognito by following the instructions in Create a new application in the Amazon Cognito console, or you can bring your own OIDC identity provider.

Step 3 (optional): Run the application

Now that the infrastructure is set up, you can run the application. In two separate terminals, run the following commands in the /start directory:

./scripts/run-backend-dev.sh
./scripts/run-frontend-dev.sh

Test the application by creating some pets.

Integrate Verified Permissions

With the prerequisites in place, the next step is to integrate Verified Permissions. Verified Permissions can be integrated into an Express application in six steps:

  1. Create a Verified Permissions policy store
  2. Add the Cedar and Verified Permissions authorization middleware packages
  3. Create and deploy a Cedar schema
  4. Create and deploy Cedar policies
  5. Connect the Verified Permissions policy store to your OIDC identity provider
  6. Update the application code to call Verified Permissions to authorize API access

The Verified Permissions integration happens with the Express web application backend. All commands in the section should be run in the /start/backend directory.

Step 1: Create a Verified Permissions policy store 

  1. Create a policy store in Verified Permissions using the AWS CLI by running the following command
    aws verifiedpermissions create-policy-store  --validation-settings "mode=STRICT"
    

    Example successful command output:

    {
        "policyStoreId": "AAAAbbbbCCCCdddd",
        "arn": "arn:aws:verifiedpermissions::111122223333:policy-store/AAAAbbbbCCCCdddd",
        "createdDate": "2025-06-05T19:30:37.896119+00:00",
        "lastUpdatedDate": "2025-06-05T19:30:37.896119+00:00"
    }
    

  2. Save the policyStoreId value from the command output to use in step 3.

Step 2: Add the Cedar and Verified Permissions authorization middleware packages

  • Run the following command to add two new dependencies on @verifiedpermissions/authorization-clients and @cedar-policy/authorization-for-expressjs
    npm i --save @verifiedpermissions/authorization-clients
    npm i --save @cedar-policy/authorization-for-expressjs
    

Step 3: Create and deploy the Cedar schema 

A Cedar schema defines the authorization model for an application, including the entity types in the application and the actions users are allowed to take. You attach your schema to your Verified Permissions policy stores, and when policies are added or modified, the service automatically validates the policies against the schema.

The @cedar-policy/authorization-for-expressjs package can analyze the OpenAPI specification of your application and generate a Cedar schema. Specifically, the paths object in the OpenAPI schema is required in your specification.

If you don’t have an OpenAPI spec, you can generate one using the tool of your choice. There are several open source libraries that you can use to do this for Express; you might need to add some code to your application, generate the OpenAPI spec, and then remove the code. Alternatively, some generative AI based tools such as the Amazon Q Developer CLI are effective at generating OpenAPI spec documents. Regardless of how you generate the spec, be sure to validate the correct output from the tool.

For the sample application an OpenAPI spec document has been included and is named openapi.json.

  1. Run the following command to generate the Cedar schema.
    npx @cedar-policy/authorization-for-expressjs generate-schema --api-spec schemas/openapi.json --namespace PetStoreApp --mapping-type SimpleRest
    

    Example successful command output:

    Cedar schema successfully generated. Your schema files are named: v2.cedarschema.json, v4.cedarschema.json.
    v2.cedarschema.json is compatible with Cedar 2.x and 3.x
    v4.cedarschema.json is compatible with Cedar 4.x and required by the nodejs Cedar plugins.
    

  2. Next, format the Cedar schema for use with the AWS CLI. The specific format required is described in the documentation Amazon Verified Permissions policy store schema. To format the Cedar schema run the following command.
    ../scripts/prepare-cedar-schema.sh v2.cedarschema.json v2.cedarschema.forAVP.json
    

    Example successful command output:

    Cedar schema prepared successfully: v2.cedarschema.forAVP.json
    You can now use it with AWS CLI:
    

  3. After the schema is formatted, run the following command to upload the schema to Verified Permissions. Note that you need to replace <policy store id> with the actual policy store ID, which is provided as an output from the command in step 1.
    aws verifiedpermissions put-schema --definition file://v2.cedarschema.forAVP.json --policy-store-id <policy store id>
    

    Example successful command output:

    {
        "policyStoreId": "AAAAbbbbCCCCdddd",
        "namespaces": [
            "PetStoreApp"
        ],
        "createdDate": "2025-06-03T20:19:33.480528+00:00",
        "lastUpdatedDate": "2025-06-05T19:42:45.198325+00:00"
    }
    

Step 4: Create and deploy Cedar policies

If no policies are configured, Cedar denies authorization requests. The next step is to create policies that will allow specific user groups access to specific resources. The Express framework integration helps bootstrap this process by generating example policies based on the previously generated schema. You can then then customize these policies based on your use cases.

  1. Run the following command to generate sample Cedar policies.
    npx @cedar-policy/authorization-for-expressjs generate-policies --schema v2.cedarschema.json
    

    Example successful command output:

    Cedar policy successfully generated in policies/policy_1.cedar
    Cedar policy successfully generated in policies/policy_2.cedar
    

    Two sample policies are generated in the /policies directory: policy_1.cedar and policy_2.cedar.

    policy_1.cedar provides permissions for users in the admin user group to perform any action on any resource.

    
    // policy_1.cedar
    // Allows admin usergroup access to everything
    permit (
    	principal in PetStoreApp::UserGroup::"admin",
    	action,
    	resource
    );
    

    policy_2.cedar provides more access to the individual actions defined in the Cedar schema with a place holder for a specific group.

    // policy_2.cedar
    // Allows more granular user group control, change actions as needed
    permit (
        principal in PetStoreApp::UserGroup::"ENTER_THE_USER_GROUP_HERE",
        action in
            [PetStoreApp::Action::"GET /pets",
             PetStoreApp::Action::"POST /pets",
             PetStoreApp::Action::"GET /pets/{petId}",
             PetStoreApp::Action::"PUT /pets/{petId}",
             PetStoreApp::Action::"DELETE /pets/{petId}"],
        resource
    );
    

    Note that if you specified an operationId in the OpenAPI specification, the action names defined in the Cedar Schema will use that operationId instead of the default <HTTP Method> /<PATH> format. In this case, make sure that the naming of your actions in your Cedar policies matches the naming of your actions in your Cedar schema.

    For example, if you want to call your action AddPet instead of POST /pets, you could set the operationId in your OpenAPI specification to AddPet. The resulting action in the Cedar policy would be PetStoreApp::Action::"AddPet"

    Create a third policy file called policy_3.cedar and then replace the contents of each file with the following policies. Replace <userpoolId> in each policy with the Cognito User Pool Id copied earlier.

    Note: In a real use case, consider renaming your Cedar policy files based on their contents, for example, allow_customer_group.cedar.

    // Defines permitted administrator user group actions
    permit (
        principal in PetStoreApp::UserGroup::"<userPoolId>|administrator",
        action,
        resource
    );
    

    // Defines permitted employee user group actions
    permit (
        principal in PetStoreApp::UserGroup::"<userPoolId>|employee",
        action in
            [PetStoreApp::Action::"GET /pets",
             PetStoreApp::Action::"POST /pets",
             PetStoreApp::Action::"GET /pets/{petId}",
             PetStoreApp::Action::"PUT /pets/{petId}"],
        resource
    );
    

    // Defines permitted customer user group actions
    permit (
        principal in PetStoreApp::UserGroup::"<userPoolId>|customer",
        action in
            [PetStoreApp::Action::"GET /pets",
             PetStoreApp::Action::"POST /pets",
             PetStoreApp::Action::"GET /pets/{petId}"],
        resource
    );
    

  2. The policies need to be formatted so that they work with the AWS CLI for Verified Permissions. The specific format is described in the AWS CLI Verified Permissions documentation. Run the following command to format the policies.
    ../scripts/convert_cedar_policies.sh
    

    Example successful command output:

    Converting policies/policy_1.cedar to policies/json/policy_1.json
    Created policies/json/policy_1.json
    Converting policies/policy_2.cedar to policies/json/policy_2.json
    Created policies/json/policy_2.json
    Converting policies/policy_3.cedar to policies/json/policy_3.json
    Created policies/json/policy_3.json
    Conversion complete. JSON policy files are in ../policies/json/
    

    The formatted policies will be output to the backend/policies/json/ directory.

  3. After formatting the policies, run the following three commands, one for each policy, to upload them to Verified Permissions. The policy store ID is returned after completing step 2. Replace <policy store id> with the actual policy store ID.
    aws verifiedpermissions create-policy  --definition file://policies/json/policy_1.json --policy-store-id <policy store id>
    aws verifiedpermissions create-policy  --definition file://policies/json/policy_2.json --policy-store-id <policy store id>
    aws verifiedpermissions create-policy  --definition file://policies/json/policy_3.json --policy-store-id <policy store id>
    

    Example successful command output:

    {
        "policyStoreId": "AAAAbbbbCCCCdddd",
        "policyId": "8AmzZYMw6Ux5DGBoX7w24m",
        "policyType": "STATIC",
        "principal": {
            "entityType": "PetStoreApp::UserGroup",
            "entityId": "<userPoolId>|administrator"
        },
        "createdDate": "2025-06-05T19:46:45.848602+00:00",
        "lastUpdatedDate": "2025-06-05T19:46:45.848602+00:00",
        "effect": "Permit"
    }
    

Alternatively, you can also copy and paste Cedar policies into Verified Permissions in the AWS Management Console.

Step 5: Connect the Verified Permissions policy store to your OIDC identity provider

By default, the Verified Permissions authorizer middleware reads a JSON Web Token (JWT) provided within the authorizationheader of the API request to get user information. Verified Permissions can validate the token in addition to performing authorization policy evaluation.

  1. To do this, create an identity source in Verified Permissions policy store. To simplify formatting in the AWS CLI command, we’ve defined the identity source configuration in identity-source-configuration.txtReplace the <userPoolArn> and <clientId> parameters in the following code block based on the outputs of running the setup-infrastructure.sh script in Step 2 of the prerequisites.
    // identity-source-configuration.txt
    {
        "cognitoUserPoolConfiguration": {
            "userPoolArn": "<userPoolArn>",
            "clientIds":["<clientId>"] ,
            "groupConfiguration": {
                  "groupEntityType": "PetStoreApp::UserGroup"
            }
        }
    }
    

  2. After you update the file, run the following command to update the Verified Permissions policy store. Replace <policy store id> with the actual policy store ID.
    aws verifiedpermissions create-identity-source --configuration file://identity-source-configuration.txt --policy-store-id <policy store id> --principal-entity-type PetStoreApp::User
    

Example successful command output:

{
    "createdDate": "2025-06-05T20:02:53.992782+00:00",
    "identitySourceId": "DTLvwdiKfdPmk2RWzSVfu2",
    "lastUpdatedDate": "2025-06-05T20:02:53.992782+00:00",
    "policyStoreId": "AAAAbbbbCCCCdddd"
}

Step 6: Update the application code to call Verified Permissions to authorize API access 

You now need to update the application to use the @verifiedpermissions/authorization-clients and @cedar-policy/authorization-for-expressjs dependencies. This will allow the application to call Verified Permissions to authorize the API requests.

  1. Add the dependencies and define the CedarAuthorizerMiddleware and AVPAuthorizer in the application by adding the following block of code to line 13 (directly after the import statements) of backend/app.ts. Replace <policystoreId> in the following code block with your actual Verified Permissions policy store ID.
    const { ExpressAuthorizationMiddleware } = require('@cedar-policy/authorization-for-expressjs');
    
    const { AVPAuthorizationEngine } = require('@verifiedpermissions/authorization-clients');
    
    const avpAuthorizationEngine = new AVPAuthorizationEngine({
        policyStoreId: <policyStoreId>,
        callType: 'identityToken'
    });
    
    const expressAuthorization = new ExpressAuthorizationMiddleware({
        schema: {
            type: 'jsonString',
            schema: fs.readFileSync(path.join(__dirname, '../v4.cedarschema.json'), 'utf8'),
        },
        authorizationEngine: avpAuthorizationEngine,
        principalConfiguration: { type: 'identityToken' },
        skippedEndpoints: [],
        logger: {
            debug: (s: any) => console.log(s),
            log: (s: any) => console.log(s),
        }
    });
    

  2. Configure the Express application to use the authorization middleware that you just defined. To do this, add the following line of code to the end of the block of app.use(..) statements that begin after the comment // Configure security and performance middleware (approximately line 48 depending on how you pasted the previous block of code).
    app.use(expressAuthorization.middleware);
    

You’ve now successfully set up authorization in your application by creating a Verified Permissions policy store, writing Cedar policies to define your authorization, and integrating your application with Verified Permissions.

Validating API security

You can use the frontend web application to verify that authorization has been applied to the APIs. In two separate terminals run the following commands in the /start directory

./scripts/run-backend-dev.sh
./scripts/run-frontend-dev.sh

In a browser navigate to http://localhost:3001 and sign in with one of the Amazon Cognito users you created earlier. Validate that the permissions policies are working as expected:

  • Administrators: Can view, create, update, and delete pets.
  • Employees: Can view, create, and update pets.
  • Customers: Can view pets and create new pets.

In the terminal for the Express application, you can see log output that provides additional details about the authorization decisions. For example, following an unauthorized action the terminal outputs the following:

Authorization result: {"type":"deny"}

Conclusion

The new @verifiedpermissions/authorization-clients-js package allows Express developers to integrate their application with Verified Permissions to decouple authorization logic from code. By decoupling your authorization logic and integrating your application with the Verified Permissions, you can improve developer productivity and simplify permissions and access audits.

To support analyzing and auditing permissions when writing cedar policies the open source Cedar project also recently open sourced the Cedar Analysis CLI to help developers perform policy analysis on their policies. You can learn more about this new tool in Introducing Cedar Analysis: Open Source Tools for Verifying Authorization Policies.

The framework packages are open source and available on GitHub under the Apache 2.0 license, with distribution through NPM. To learn more, see Amazon Verified Permissions and Cedar.

If you have feedback about this post, submit comments in the Comments section below.

Trevor Schiavone

Trevor Schiavone

Trevor is a Senior Solutions Architect at AWS. He works with customers to build secure, scalable, and innovative architectures. When not at work he’s usually out running, cycling, or travelling to new countries.

Rickard Lofstrom

Rickard Löfström

Ricard guides enterprises in building secure cloud environments as a Specialist Solution Architect in the AWS EMEA Security & Compliance team. He advises customers on implementing AWS security services, focusing on identity management, data protection, and infrastructure security controls. Rickard translates complex security requirements into technical solutions that enable organizations to meet their security objectives while maintaining operational efficiency.

Improve your security posture using Amazon threat intelligence on AWS Network Firewall

Post Syndicated from Amit Gaur original https://aws.amazon.com/blogs/security/improve-your-security-posture-using-amazon-threat-intelligence-on-aws-network-firewall/

Today, customers use AWS Network Firewall to safeguard their workloads against common security threats. However, they often have to rely on third-party threat feeds and scanners that have limited visibility in AWS workloads to protect against active threats. A self-managed approach to cloud security through traditional threat intelligence feeds and custom rules can result in delayed responses, leaving customers exposed to active threats that are relevant to AWS workloads. Customers are looking for an automated approach to analyzing threats and deploying mitigations across multiple enforcement points to establish consistent defenses and want a unified, AWS-native solution that can rapidly protect against active threats across their entire cloud infrastructure.

This post introduces active threat defense, a new Network Firewall managed rule group that offers protection against active threats relevant to workloads in AWS. Active threat defense uses the AWS global infrastructure visibility and extensive threat intelligence to deliver automated, intelligence-driven security measures. The feature uses the Amazon threat intelligence system MadPot, which continuously tracks attack infrastructure, including malware hosting URLs, botnet command and control servers, and crypto mining pools, identifying indicators of compromise (IOCs) for active threats.

Active threat defense comes as a rule group AttackInfrastructure, which protects against malicious network traffic by blocking communications with detected attack infrastructure. After the managed rule group is configured in your firewall policy, Network Firewall now automatically blocks suspicious traffic to malicious IPs, domains, and URLs for indicator categories such as command-and-control (C2s), malware staging hosts, sinkholes, out-of-band testing (OAST), and mining-pools. It implements comprehensive filtering of both inbound and outbound traffic for various protocols, including TCP, UDP, DNS, HTTPS, and HTTP, and uses specific, verified threat indicators to facilitate high accuracy and minimize false positives.

Network Firewall with active threat defense protects AWS workloads using the following mechanisms:

  • Threat prevention: Automatically blocks malicious traffic using Amazon threat intelligence to identify and prevent active threats targeting workloads in AWS
  • Rapid protection: Continuously updates Network Firewall rules based on newly discovered threats, enabling immediate protection against them
  • Streamlined operations: Findings in GuardDuty marked with the threat list name “Amazon Active Threat Defense” can now be automatically blocked when active threat defense is enabled on Network Firewall
  • Collective defense: Deep threat inspection (DTI) enables shared threat intelligence, improving protection for active threat defense managed rule group users

Figure 1 illustrates the use of the active threat defense managed rule group with Network Firewall. It shows the automatic creation of stateful rules in the AWS managed rule group using threat data collected from MadPot.

Figure 1: Network Firewall with active threat defense

Figure 1: Network Firewall with active threat defense

Getting started

The active threat defense managed rule group can be enabled directly within Network Firewall using the AWS Management Console, AWS Command Line Interface (AWS CLI), or AWS SDK. You can then associate the managed rule group with the Network Firewall policy. The rule group receives regular updates with new threat indicators and signatures, while automatically removing inactive or aged-out signatures.

Prerequisites

To get started with Network Firewall with active threat defense, visit the Network Firewall console or see the AWS Network Firewall Developers Guide. Active threat defense is supported in all AWS Regions where Network Firewall is available today, including the AWS GovCloud (US) Regions and China Regions.

If this is your first time using Network Firewall, make sure to complete the following prerequisites. If you already have a firewall policy and a firewall, you can skip this section.

  1. Create a firewall policy
  2. Create a firewall

Set up the active threat defense managed rule group

With the prerequisites in place, you can set up and use the active threat defence managed rule group.

To set up the managed rule group:

  1. In the AWS Network Firewall console, choose Firewall policies in the navigation pane.
  2. Select an existing firewall policy or the policy that you created as part of the prerequisites.

    Figure 2: Select the Network Firewall policy

    Figure 2: Select the Network Firewall policy

  3. Scroll down to Stateful rule groups. On the right-hand side, choose Actions and select Add managed stateful rule groups.

    Figure 3: Add a rule group

    Figure 3: Add a rule group

  4. On the Add managed stateful rule groups page, scroll down to active threat defense. Select the rule group AttackInfrastructure. Based on your requirements for Deep threat inspection, you can opt out if you don’t want Network Firewall to process service logs. Choose Add to policy.

    Figure 4: Add the rule group to the policy

    Figure 4: Add the rule group to the policy

  5. You can verify on the next page the managed rule group was added to the policy.

    Figure 5: Verify that the managed rule group was added to the policy

    Figure 5: Verify that the managed rule group was added to the policy

Pricing

For active threat defense pricing, see AWS Network Firewall pricing.

Considerations

The first consideration is to understand how Network Firewall is more effective in detecting and mitigating threats associated with HTTPS traffic when the TLS inspection feature is used alongside the active threat defense managed rule group. TLS inspection enables active threat defense to analyze the actual content of encrypted connections, allowing it to identify and block malicious URLs that might otherwise pass undetected. This process involves decrypting traffic, inspecting the contents for known malicious URL patterns or behaviors, and then re-encrypting the traffic if it’s deemed safe. For more information on the considerations on TLS inspection, see Considerations for TLS inspection. Organizations must balance the security benefits with potential latency introduction and make sure that they have proper controls in place to handle sensitive decrypted data.

Another consideration is the mitigation of false positives. When you use this managed rule group in your firewall policy, you can edit rule group alert settings to help identify false-positives as part of a mitigation strategy. For more information, see mitigating false-positives.

The final consideration is how the use of managed rule groups count against the limit of stateful rules for each policy. For more information, see AWS Network Firewall quotas and Setting rule group capacity in AWS Network Firewall.

Conclusion

In this post, you learned how to use the AWS Network Firewall active threat defense managed rule group to safeguard workloads against active threats.

If you have feedback about this post, submit comments in the Comments section below.

Amit Gaur

Amit Gaur

Amit, a Cloud Infrastructure Architect at AWS, brings his passion for technology and knowledge-sharing to the networking community. Specializing in network architecture design, he helps customers build highly scalable and resilient environments on AWS. Through technical guidance and architectural expertise, Amit enables customers to accelerate their cloud adoption journey while making sure their systems are built for scale and reliability.

Tim Sutton

Tim Sutton

Tim is a Senior Cloud Infrastructure Architect at AWS with over 20 years of experience in technology and brings extensive experience in cloud technologies, enterprise architecture, and business transformation. Tim is passionate about helping customers architect and implement scalable cloud solutions and achieve their business objectives through technology, as well as mentoring the next generation of cloud professionalst.

Prashanth Kalika

Prashanth Kalika

Prashanth has over 20 years of experience developing innovative and scalable solutions for networking, security, and cloud use cases. He currently focuses on developing advanced threat intelligence capabilities for AWS Firewall so customers can better protect their cloud workloads. Prashanth is passionate about building security solutions that help organizations stay ahead of evolving cyberthreats while maintaining robust network defenses.

Saleem Muhammad

Saleem Muhammad

Saleem is a Senior Manager of Product Management in AWS Network & Application Protection. He is passionate about building solutions that help customers to secure mission critical workloads. Before AWS, Saleem worked on incubation projects at multi-$B IT product and services organizations in the San Francisco Bay area.

Verify internal access to critical AWS resources with new IAM Access Analyzer capabilities

Post Syndicated from Micah Walter original https://aws.amazon.com/blogs/aws/verify-internal-access-to-critical-aws-resources-with-new-iam-access-analyzer-capabilities/

Today, we’re announcing a new capability in AWS IAM Access Analyzer that helps security teams verify which AWS Identity and Access Management (IAM) roles and users have access to their critical AWS resources. This new feature provides comprehensive visibility into access granted from within your Amazon Web Services (AWS) organization, complementing the existing external access analysis.

Security teams in regulated industries, such as financial services and healthcare, need to verify access to sensitive data stores like Amazon Simple Storage Service (Amazon S3) buckets containing credit card information or healthcare records. Previously, teams had to invest considerable time and resources conducting manual reviews of AWS Identity and Access Management (IAM) policies or rely on pattern-matching tools to understand internal access patterns.

The new IAM Access Analyzer internal access findings identify who within your AWS organization has access to your critical AWS resources. It uses automated reasoning to collectively evaluate multiple policies, including service control policies (SCPs), resource control policies (RCPs), and identity-based policies, and generates findings when a user or role has access to your S3 buckets, Amazon DynamoDB tables, or Amazon Relational Database Service (Amazon RDS) snapshots. The findings are aggregated in a unified dashboard, simplifying access review and management. You can use Amazon EventBridge to automatically notify development teams of new findings to remove unintended access. Internal access findings provide security teams with the visibility to strengthen access controls on their critical resources and help compliance teams demonstrate access control audit requirements.

Let’s try it out

To begin using this new capability, you can enable IAM Access Analyzer to monitor specific resources using the AWS Management Console. Navigate to IAM and select Analyzer settings under the Access reports section of the left-hand navigation menu. From here, select Create analyzer.

Screenshot of creating an Analyzer in the AWS Console

From the Create analyzer page, select the option of Resource analysis – Internal access. Under Analyzer details, you can customize your analyzer’s name to whatever you prefer or use the automatically generated name. Next, you need to select your Zone of trust. If your account is the management account for an AWS organization, you can choose to monitor resources across all accounts within your organization or the current account you’re logged in to. If your account is a member account of an AWS organization or a standalone account, then you can monitor resources within your account.

The zone of trust also determines which IAM roles and users are considered in scope for analysis. An organization zone of trust analyzer evaluates all IAM roles and users in the organization for potential access to a resource, whereas an account zone of trust only evaluates the IAM roles and users in that account.

For this first example, we assume our account is the management account and create an analyzer with the organization as the zone of trust.

Screenshot of creating an Analyzer in the AWS Console

Next, we need to select the resources we wish to analyze. Selecting Add resources gives us three options. Let’s first examine how we can select resources by identifying the account and resource type for analysis.

Screenshot of creating an Analyzer in the AWS Console

You can use Add resources by account dialog to choose resource types through a new interface. Here, we select All supported resource types and select the accounts we wish to monitor. This will create an analyzer that monitors all supported resource types. You can either select accounts through the organization structure (shown in the following screenshot) or paste in account IDs using the Enter AWS account ID option.

Screenshot of creating an Analyzer in the AWS Console

You can also choose to use the Define specific resource types dialog, which you can use to pick from a list of supported resource types (as shown in the following screenshot). By creating an analyzer with this configuration, IAM Access Analyzer will continually monitor both existing and new resources of the selected type within the account, checking for internal access.

Screenshot of creating an Analyzer in the AWS Console

After you’ve completed your selections, choose Add resources.

Screenshot of creating an Analyzer in the AWS Console

Alternatively, you can use the Add resources by resource ARN option.

Screenshot of creating an Analyzer in the AWS Console

Or you can use the Add resources by uploading a CSV file option to configure monitoring a list of specific resources at scale.

Screenshot of creating an Analyzer in the AWS Console

After you’ve completed the creation of your analyzer, IAM Access Analyzer will analyze policies daily and generate findings that show access granted to IAM roles and users within your organization. The updated IAM Access Analyzer dashboard now provides a resource-centric view. The Active findings section summarizes access into three distinct categories: public access, external access outside of the organization (requires creation of a separate external access analyzer), and access within the organization. The Key resources section highlights the top resources with active findings across the three categories. You can see a list of all analyzed resources by selecting View all active findings or Resource analysis on the left-hand navigation menu.

Screenshot of Access Analyzer findings

On the Resource analysis page, you can filter the list of all analyzed resources for further analysis.

Screenshot of creating an Analyzer in the AWS Console

When you select a specific resource, any available external access and internal access findings are listed on the Resource details page. Use this feature to evaluate all possible access to your selected resource. For each finding, IAM Access Analyzer provides you with detailed information about allowed IAM actions and their conditions, including the impact of any applicable SCPs and RCPs. This means you can verify that access is appropriately restricted and meets least-privilege requirements.

Screenshot of creating an Analyzer in the AWS Console

Pricing and availability

This new IAM Access Analyzer capability is available today in all commercial Regions. Pricing is based on the number of critical AWS resources monitored per month. External access analysis remains available at no additional charge. Pricing for EventBridge applies separately.

To learn more about IAM Access Analyzer and get started with analyzing internal access to your critical resources, visit the IAM Access Analyzer documentation.

How AWS improves active defense to empower customers

Post Syndicated from Stephen Goodman original https://aws.amazon.com/blogs/security/how-aws-improves-active-defense-to-empower-customers/

At AWS, security is the top priority, and today we’re excited to share work we’ve been doing towards our goal to make AWS the safest place to run any workload. In earlier posts on this blog, we shared details of our internal active defense systems, like MadPot (global honeypots), Mithra (domain graph neural network), and Sonaris (network mitigations). We’re still inventing new ways to improve the effectiveness of threat intelligence and automated response to detect and help prevent attacks. Today we’ll share advancements in active defense related to malware, software vulnerabilities, and AWS resource misconfigurations. Like the other posts we linked to, these are constantly improving capabilities that our customers get just for being on the AWS network. We’ll discuss these topics in more depth at re:inforce 2025 during Innovation Talk SEC302.

Stopping malware from spreading

Financially motivated threat actors try to gain access to a wide array of networked assets. The more resources they control, the more places they can hide, and the longer they can profit from their abusive operations. As such, threat actor malware often contains modules to scan for new targets, replicate binaries over the network, and then repeat. If left unchecked, such rapidly spreading behavior can lead to network congestion, service availability loss, and data destruction. We want to help prevent this behavior to the greatest degree possible.

One effective strategy we employ is identifying the threat actor’s key infrastructure where malware is centrally controlled. We use a variety of techniques to identify, verify, track, and disrupt threat infrastructure. Using network traffic logs, honeypot interactions, and malware samples from an array of sensor positions, we mitigate botnets, abusive proxies, and peer-to-peer malware. Over the past 12 months, AWS helped prevent over 4 million malware infection attempts across 315 thousand distinct Amazon Elastic Compute Cloud (Amazon EC2) instances. By protecting workloads from these malware infections, we not only protect our network and our customers, but also the broader internet from further malware expansion.

Advancements in threat hunting and mitigating software vulnerabilities

At Amazon, we’re proud to support software vulnerability research with programs for bug bounty, vulnerability disclosure, and open source contribution. We’ve also become a more active participant in the CVE process by becoming a CVE Numbering Authority (CNA) for the software and services provided by Amazon. Thanks to the public CVE database, we see vulnerability research accelerating as reported CVEs have grown by 21 percent year-over-year since 2013, with over 40 thousand CVEs published in 2024. This virtuous cycle of finding and resolving vulnerabilities improves cyber security over time, but AWS sees threat actors searching for unresolved vulnerabilities to gain unauthorized access to resources.

We’ve expanded MadPot and Sonaris to identify and stop a broader range of malicious vulnerability scanning and exploitation activity, protecting every AWS customer from vulnerability exposure. We’ve added hundreds of new detections and MadPot service emulations to identify real attacks. As we’ve expanded our visibility, we’ve continued blocking hundreds of millions of CVE exploit attempts daily across the AWS network.

As we’ve made these active defense systems better at stopping CVE exploit attacks, the total number of attacks has gone down by over 55 percent in the last 12 months, as shown in Figure 1. There are many factors outside our control in this observation, but we’re happy to see fewer CVE exploit attacks. This trend coincides with the detection, regionalization, latency, and guardrail improvements we’ve made in 2025. No system can block everything, so fewer exploit attempts mean less risk across a wide range of workloads.

Figure 1: Chart showing the decrease in global malicious vulnerability exploit attempts

Figure 1: Chart showing the decrease in global malicious vulnerability exploit attempts

This work to identify known exploits in the wild directly benefits users of vulnerability intelligence in Amazon Inspector, which provides an Amazon Inspector score for customers to prioritize where to spend security hardening resources. This includes the most recent date of observed exploitation attempts, the MITRE ATT&CK techniques associated with the exploit activity, and the industries targeted.

Protecting architectures built on AWS

AWS actively defends compute and network resources for our customers; we also defend the distinct AWS-native resources that customers rely on. AWS access key credentials are a critical resource that allow access to customer accounts. The AWS Identity and Access Management best practices share proven techniques for customers to keep their credentials from being abused. Through active defense, we do even more to help customers who haven’t yet adopted these best practices.

Each day, AWS helps prevent an average of 167 million malicious scanning connections seeking unintentionally exposed AWS access key pairs. In case access keys are discovered through other means, we’ve expanded our protection of customer-managed IAM credentials. When our threat intelligence analytics show that a customer-managed credential is known by a threat actor, we put mitigations in place to restrict access to highly privileged operations. We also send customized notifications to help customers identify how the credential was exposed. These efforts are paying off for our customers every day; the following response is a good example of what we hear regularly:

This is a key that we already rotated a few weeks ago based on another alarm from you. It turned out that the new rotated key happened to be in your second alarm to us. So it meant that the app that the key was linked to was still leaking it.

So on Monday we sat down with the dev team, found where the app was leaking some secrets from, we patched it, I rotated all the exposed secrets (it was more than the IAM key) and we plugged in the extra security in the app.

So thanks again for those alerts, they are very precious.
– AWS Customer

In a specific case of threat activity in November and December of 2024, customers reported ransomware activity against their objects in Amazon Simple Storage Service (Amazon S3) storage. We saw that these ransom threats were highly correlated with exposed customer-managed IAM keys. We applied quarantines to the exposed keys, taking care to make sure that normal customer operations could continue safely. We re-sent our proactive notifications to customers about keys that were likely exposed, because the risk of an attack was elevated. During this period, we worked together with customers to deactivate over 30 thousand exposed credentials. Since this threat activity began, AWS has helped prevent over 943 million malicious attempts to encrypt customer Amazon S3 objects.

These credential exposure detections flow into Amazon GuardDuty Extended Threat Detection, simplifying threat detection and response operations for modern cloud environments.

Better together

The approach AWS takes to active defense shows how security can be improved by layering protections across the infrastructure stack and using threat intelligence to drive risk reduction. By building active defense into our services at no extra cost, AWS helps our customers stay protected from a wide range of threats.

While we continue to constantly improve our protections for our customers, some of our work is by nature probabilistic, because we never see inside customer workloads. We don’t apply active defense in situations where the detection is ambiguous, because that might impact our customers’ production systems. To stay secure, customers should never let down their own defenses. AWS security services like AWS Identity and Access Management (IAM), AWS Shield Advanced, AWS WAF, AWS Network Firewall, Amazon GuardDuty, and Amazon Inspector provide prevention, detection, and response that customers can configure for their unique needs. The good news is that by working together, we’re making the internet safer for everyone.

If you have feedback about this post, submit comments in the Comments section below.

Stephen Goodman

Stephen Goodman

As a senior manager for Amazon active defense, Stephen leads data-driven programs to protect AWS customers and the internet from threat actors.

Tom Scholl

Tom Scholl

AWS VP and Distinguished Engineer, Tom collaborates with networks across the globe to stop cyberattacks by tracking traffic from bad actors at its source.

AWS CIRT announces the launch of the Threat Technique Catalog for AWS

Post Syndicated from Steve de Vera original https://aws.amazon.com/blogs/security/aws-cirt-announces-the-launch-of-the-threat-technique-catalog-for-aws/

Greetings from the AWS Customer Incident Response Team (AWS CIRT). AWS CIRT is a 24/7, specialized global Amazon Web Services (AWS) team that provides support to customers during active security events on the customer side of the AWS Shared Responsibility Model. We’re excited to announce the launch of the Threat Technique Catalog for AWS.

When the AWS CIRT assists customers with incident response during security investigations, we gather AWS service metadata on the types of tactics and techniques that threat actors have used against AWS customers. We use this information to build an internal dataset of indicators of compromise (IOCs) and threat patterns that provides insight into how threat actors are taking advantage of misconfigured AWS resources, overly permissive access, or the methods they use in attempting to achieve their objectives.

We capture this metadata and use it internally to continually improve AWS services to help make them more secure for our customers by making it more difficult for threat actors to perform unauthorized actions. For example, some of the metadata that the AWS CIRT has captured as a result of investigating security events where a threat actor has used the Amazon Bedrock service to consume tokens by invoking large language models (LLMs) has been used to supplement the Amazon GuardDuty IAM Anomalous Behavior finding. Earlier this year, the AWS CIRT identified an increase in data encryption events in Amazon S3 that used an encryption method known as server-side encryption using client-provided keys (SSE-C). AWS CIRT used the Threat Technique Catalog for AWS to classify the new techniques identified in these security events to communicate internally and with other Amazon security teams.

We’ve received feedback from AWS customers that information about the adversarial tactics, techniques, and procedures (TTPs) observed by the AWS CIRT would be valuable and helpful if made available to them, so they could use the information to configure their AWS resources more securely. Over the previous year, we’ve been working with MITRE to make these techniques and sub-techniques available to the global security community. As a result of this collaboration, MITRE has updated and added some of these techniques to MITRE ATT&CK® as part of their October 2024 update cycle (for example, Data Destruction: Lifecycle-Triggered Deletion).

“We greatly appreciated the insight AWS shared with us, and it inspired improvements to a number of techniques in the October release of MITRE ATT&CK. For ATT&CK to keep up with the latest threats, community contributions that benefit the ecosystem are needed, and we value AWS being a part of the ATT&CK community.”
Adam Pennington, project lead, MITRE ATT&CK, MITRE

Companies, entities, and organizations use ATT&CK to help them understand, prioritize and protect against the threats to their on-premises environments, and we believe that taking advantage of an already existing framework to present these adversarial techniques will provide AWS customers and the global security community with the ability to identify and categorize threats on their AWS infrastructure the same way that the AWS CIRT does.

The Threat Technique Catalog for AWS—based on MITRE ATT&CK Cloud—extends these contributions and includes categories of adversarial techniques that are specific to AWS and have been observed by the AWS CIRT; in addition to information on ways to mitigate those techniques and how to detect them. For example, you can go to the Threat Technique Catalog for AWS, filter by the AWS services in your account, and review the content that will help make your environment more secure. The Getting Started section includes additional ways that you can use the Threat Technique Catalog for AWS. We will continue to update and provide additional changes to the Threat Technique Catalog for AWS to help guide you into making your AWS environment more secure and will continue collaborating with MITRE to advise them of new and trending threat actor techniques.

To get started, visit the Threat Technique Catalog for AWS.

© 2025 The MITRE Corporation. This work is reproduced and distributed with the permission of The MITRE Corporation.

If you have feedback about this post, submit comments in the Comments section below.

Steve de Vera

Steve de Vera

Steve is a manager in the AWS Customer Incident Response Team (CIRT) with a focus on threat research and threat intelligence. He is passionate about American-style BBQ and is a certified competition BBQ judge. He has a dog named Brisket.

Cydney Stude

Cydney Stude

Cydney is a Security Engineer with the AWS Customer Incident Response Team (CIRT), specializing in incident response and cloud security. Cydney focuses on technical depth and real-world experience handling complex cloud challenges. Outside of work, Cydney enjoys salsa dancing and adventuring with her german shepherd.

Nathan Bates

Nathan Bates

Nathan is a Sr. Security Engineer within Global Services Security. He specializes in data, analytics, and reporting services for vulnerability management, policy compliance, asset assurance, incident response, and threat intelligence. Nathan is passionate about high performance driving, racing cars, playing guitar, and making music.

Celebrating 11 years of Project Galileo’s global impact

Post Syndicated from Jocelyn Woolbright original https://blog.cloudflare.com/celebrating-11-years-of-project-galileo-global-impact/

June 2025 marks the 11th anniversary of Project Galileo, Cloudflare’s initiative to provide free cybersecurity protection to vulnerable organizations working in the public interest around the world. From independent media and human rights groups to community activists, Project Galileo supports those often targeted for their essential work in human rights, civil society, and democracy building.

A lot has changed since we marked the 10th anniversary of Project Galileo. Yet, our commitment remains the same: help ensure that organizations doing critical work in human rights have access to the tools they need to stay online.  We believe that organizations, no matter where they are in the world, deserve reliable, accessible protection to continue their important work without disruption.

For our 11th anniversary, we’re excited to share several updates including:

  • An interactive Cloudflare Radar report providing insights into the cyber threats faced by at-risk public interest organizations protected under the project. 

  • An expanded commitment to digital rights in the Asia-Pacific region with two new Project Galileo partners.

  • New stories from organizations protected by Project Galileo working on the frontlines of civil society, human rights, and journalism from around the world.


Tracking and reporting on cyberattacks with the Project Galileo 11th anniversary Radar report 

To mark Project Galileo’s 11th anniversary, we’ve published a new Radar report that shares data on cyberattacks targeting organizations protected by the program. It provides insights into the types of threats these groups face, with the goal of better supporting researchers, civil society, and vulnerable groups by promoting the best cybersecurity practices. Key insights include:

  • Our data indicates a growing trend in DDoS attacks against these organizations, becoming more common than attempts to exploit traditional web application vulnerabilities.

  • Between May 1, 2024, to March 31, 2025, Cloudflare blocked 108.9 billion cyber threats against organizations protected under Project Galileo. This is an average of nearly 325.2 million cyber attacks per day over the 11-month period, and a 241% increase from our 2024 Radar report. 

  • Journalists and news organizations experienced the highest volume of attacks, with over 97 billion requests blocked as potential threats across 315 different organizations. The peak attack traffic was recorded on September 28, 2024. Ranked second was the Human Rights/Civil Society Organizations category, which saw 8.9 billion requests blocked, with peak attack activity occurring on October 8, 2024.

  • Cloudflare onboarded the Belarusian Investigative Center, an independent journalism organization, on September 27, 2024, while it was already under attack. A major application-layer DDoS attack followed on September 28, generating over 28 billion requests in a single day. 

  • Many of the targets were investigative journalism outlets operating in regions under government pressure (such as Russia and Belarus), as well as NGOs focused on combating racism and extremism, and defending workers’ rights.

  • Tech4Peace, a human rights organization focused on digital rights, was targeted by a 12-day attack beginning March 10, 2025, that delivered over 2.7 billion requests. The attack saw prolonged, lower-intensity attacks and short, high-intensity bursts. This deliberate variation in tactics reveals a coordinated approach, showing how attackers adapted their methods throughout the attack.

The full Radar report includes additional information on public interest organizations, human and civil rights groups, environmental organizations, and those involved in disaster and humanitarian relief. The dashboard also serves as a valuable resource for policymakers, researchers, and advocates working to protect public interest organizations worldwide.

Global partners are the key to Project Galileo’s continued growth

Partnerships are core to Project Galileo success. We rely on 56 trusted civil society organizations around the world to help us identify and support groups who could benefit from our protection. With our partners’ help, we’re expanding our reach to provide tools to communities that need protection the most. Today, we’re proud to welcome two new partners to Project Galileo who are championing digital rights, open technologies, and civil society in Asia and around the world. 


EngageMedia is a nonprofit organization that brings together advocacy, media, and technology to promote digital rights, open and secure technology, and social issue documentaries. Based in the Asia-Pacific region, EngageMedia collaborates with changemakers and grassroots communities to protect human rights, democracy, and the environment.

As part of our partnership, Cloudflare participated in a 2025 Tech Camp for Human Rights Defenders hosted by EngageMedia, which brought together around 40 activist-technologists from across Asia-Pacific. Among other things, the camp focused on building practical skills in digital safety and website resilience against online threats. Cloudflare presented on common attack vectors targeting nonprofits and human rights groups, such as DDoS attacks, phishing, and website defacement, and shared how Project Galileo helps organizations mitigate these risks. We also discussed how to better promote digital security tools to vulnerable groups. The camp was a valuable opportunity for us to listen and learn from organizations on the front lines, offering insights that continue to shape our approach to building effective, community-driven security solutions.


Founded in 2014 by leaders of Taiwan’s open tech communities, the Open Culture Foundation (OCF) supports efforts to protect digital rights, promote civic tech, and foster open collaboration between government, civil society, and the tech community. Through our partnership, we aim to support more than 34 local civil society organizations in Taiwan by providing training and workshops to help them manage their website infrastructure, address vulnerabilities such as DDoS attacks, and conduct ongoing research to tackle the security challenges these communities face.

Stories from the field  

We continue to be inspired by the amazing work and dedication of the organizations that participate in Project Galileo. Helping protect these organizations and allowing them to focus on their work is a fundamental part of helping build a better Internet. Here are some of their stories:

  • Fair Future Foundation (Indonesia): non-profit that provides health, education, and access to essential resources like clean water and electricity in ultra-rural Southeast Asia. 

  • Youth Initiative for Human Rights (Serbia): regional NGO network promoting human rights, youth activism, and reconciliation in the Balkans.

  • Belarusian Investigative Center (Belarus): media organization that conducts in-depth investigations into corruption, sanctions evasion, and disinformation in Belarus and neighboring regions. 

  • The Greenpeace Canada Education Fund (GCEF) (Canada): non-profit that conducts research, investigations, and public education on climate change, biodiversity, and environmental justice. 

  • Insight Crime (LATAM): nonprofit think tank and media organization that investigates and analyzes organized crime and citizen security in Latin America and the Caribbean. 

  • Diez.md (Moldova): youth-focused Moldovan news platform offering content in Romanian and Russian on topics like education, culture, social issues, election monitoring and news. 

  • Engage Media (APAC): nonprofit dedicated to defending digital rights and supporting advocates for human rights, democracy, and environmental sustainability across the Asia-Pacific. 

  • Pussy Riot (Europe): a global feminist art and activist collective using art, performance, and direct action to challenge authoritarianism and human rights violations. 

  • Immigrant Legal Resource Center (United States): nonprofit that works to advance immigrant rights by offering legal training, developing educational materials, advocating for fair policies, and supporting community-based organizations.

  • 5wf Foundation (Netherlands): wildlife conservation non-profit that supports front-line conservation teams globally by providing equipment to protect threatened species and ecosystems.

These case studies offer a window into the diverse, global nature of the threats these groups face and the vital role cybersecurity plays in enabling them to stay secure online. Check out their stories and more: cloudflare.com/project-galileo-case-studies/

Continuing our support of vulnerable groups around the world 

In 2025, many of our Project Galileo partners have faced significant funding cuts, affecting their operations and their ability to support communities, defend human rights, and champion democratic values. Ensuring continued support for those services, despite financial and logistical challenges, is more important than ever. We’re thankful to our civil society partners who continue to assist us in identifying groups that need our support. Together, we’re working toward a more secure, resilient, and open Internet for all. To learn more about Project Galileo and how it supports at-risk organizations worldwide, visit cloudflare.com/galileo.

Effortless enterprise authentication at Grab: Dex in action

Post Syndicated from Grab Tech original https://engineering.grab.com/dex-in-action

Introduction

Grab, Southeast Asia’s leading superapp, has created many internal applications to support its diverse range of internal and external business needs. Authentication1 and authorisation2 serve as fundamental components of application development, as robust identity and access management are essential for all systems.

We recognised the need for a centralised internal system to manage access, authentication, and authorisation. This system would streamline access management, ensure compliance with audit requirements, enhance developer velocity, and simplify authentication and authorisation processes for both developers and business operations.

Grab created Concedo to fulfill this requirement by providing a mechanism for services to configure their access control based on their specific role to permission matrix (R2PM)3. This allows for quick and easy integration with Concedo, enabling developers to expedite the shipping of their systems without investing excessive time in building the authentication and authorisation module.

The authentication mechanism, based on Google’s OAuth2.04, includes custom features that enhance identity for service integration. However, this customisation isn’t standard, creating integration challenges with external platforms like Databricks and Datadog. These platforms then use their own authentication and authorisation, resulting in a fragmented and undesirable sign-on experience for users.

Figure 1. Undesired user sign-on experience due to fragmented authentication approaches.

The inconsistency in user experience also resulted in complications. The lack of standardisation led to difficulties in establishing authentication and authorisation for individual applications. Additionally, it created substantial administrative overhead due to the necessity of managing multiple identities. The absence of standardisation also hindered transparency in access control across all applications.

This led us to inquire how a standardised protocol could be established to function seamlessly across all applications, regardless of whether they were developed internally or sourced from external platforms.

Figure 2. Desired state, having something in between the different identity providers (IdP).

Choosing among industry standards

We wanted to build a platform to serve both authentication and authorisation, providing a seamless integration and user sign-on experience. We then asked ourselves, “What are the current industry standards we can leverage on?”.

  • Security Assertion Markup Language (SAML): An authentication protocol which leverages heavily on session cookies to manage each authentication session.
  • Open Authorisation (OAuth): An authorisation protocol which focuses on granting access for particular details rather than providing user identity information.
  • OpenID Connect (OIDC)5: An authentication protocol built on OAuth 2.0, enabling single sign-on (SSO). OIDC unifies and standardises user authentication, making it a solution for organisations with numerous applications.

OIDC enhances user experience by redirecting them to an identity provider (IdP) like Google or Microsoft for authentication when accessing an application. Upon successful verification, the IdP sends a secure token with the user’s identity information back to the application, granting access without the need for additional credentials.

With OIDC, authentication and authorisation are fully implemented, enabling seamless integration across platforms, including mobile, API, and browser-based applications, while also providing SSO functionality.

Figure 3. Desired state with the protocol decided.

OIDC seemed like an ideal solution, but it came with potential drawbacks:

  • OIDC relies on trusting a third-party authentication service. Any disruption to this service could result in downtime.
  • Compromised credentials could affect access to multiple services.

In the following section, we will explore our strategies in mitigating these challenges effectively.

Implementing the chosen standard

With OIDC chosen as the standard, the focus shifted to implementation.

We have always been a supporter of open source projects. Rather than building a platform from the ground up, we leveraged existing solutions while seeking opportunities to contribute back to the open source community.

The team explored Cloud Native Computing Foundation (CNCF) projects and discovered Dex – A federated OpenID connect provider that aims to allow integration of any IdP into an application using OIDC. Dex was selected as our open-source platform of choice due to its alignment with our high-level objectives.

Figure 4. Desired state with Dex as the platform foundation.

How Dex works

Figure 5. High level architecture of Dex. [Source](https://dexidp.io/docs/)

When a user or machine tries to access a protected application or service, they are redirected to Dex for authentication. Dex acts as a middleman (identity aggregator) between the user and various IdPs to establish an authenticated session.

Figure 6. Simplified sequence diagram of how authentication works for Dex.

Dex’s key features include enabling SSO experiences, allowing users to access multiple applications after authenticating through a single provider. Dex also supports multiple IdP use cases and provides standardised OIDC authentication tokens.

Dex implementation separated application authentication concerns, established a single source of truth for identity, enabled new IdP additions, ensured adherence to security best practices, and provided scalability for deployments of all sizes.

How Dex is streamlining authentication and authorisation

Token delegation

When services communicate with each other, one service often assigns an identity to ensure that authorisation can be carried out on a specific service. For example, in figure 7, a service account or robot account is typically used as an identity so that service B can identify the caller.

Figure 7. Service identification through service account.

Although service accounts are the recommended approach for enabling Service B to identify the caller, they come with challenges that must be addressed:

  • Service account compromise: Service accounts often have high-level privileges and typically broad access to Service B. If compromised, they pose a significant security risk, making careful management essential.
  • Access control issue: The other approach creates unnecessary complexity by requiring Service A to handle user-level permissions for Service B. This violates the principle of separation of concerns.

To address this issue, Dex introduced a token exchange feature.

Figure 8. Token exchange example with trusted peers established.

The token exchange process involves two main components; token minting and trust relationship.

Token minting

  1. The user (Alice) logs into Service A.
  2. Service A, acting as a trusted peer, is authorised to mint tokens.
  3. Service A generates a token valid for both Service A and Service B. This is reflected in the token’s “aud” (audience) field: “aud”: “serviceA serviceB”

Trust relationship

  • Service B must be configured to trust Service A as a peer.
  • Service B accepts tokens minted by Service A.

This approach differs from the service account-based scenario by using a trust-based peer relationship. Service A is authorised to mint tokens for Service B providing a more sophisticated but preferred method. The token is properly scoped for both services, ensuring a clear audit trail of token issuance, while reducing token manipulation risks.

Kill switch

As highlighted earlier,

OIDC relies on trusting a third-party authentication service. Any disruption to this service could result in downtime.

Dex’s ability to support multiple IdPs enables traffic to be shifted to a different IdP if one, such as Google, experiences an outage. This “kill switch” mechanism ensures that integrated services are not disrupted and do not require any changes to mitigate the issue. It is only triggered during specific IdP outages.

Figure 9. Trigger kill switch without having other services changing from their end.

Looking forward

Following the successful implementation of Dex as the unified authentication provider, the next phase in enhancing our identity and access management infrastructure is to leverage this robust identity foundation to establish a unified and simplified authorisation model. This initiative is driven by the recognition that the current authorisation landscape remains fragmented and complex, leading to potential inefficiencies and security vulnerabilities.

By centralising authorisation and aligning it with the unified identity provided by Dex, we can streamline access control, improve user experience, and strengthen security across our applications and services. This will involve consolidating authorisation policies, standardising access control mechanisms, and simplifying the management of user permissions.

Shoutout to the awesome Concedo team for driving Dex integration and to our leadership for steering the way toward a simpler, unified authentication and authorisation journey!

Join us

Grab is a leading superapp in Southeast Asia, operating across the deliveries, mobility and digital financial services sectors. Serving over 800 cities in eight Southeast Asian countries, Grab enables millions of people everyday to order food or groceries, send packages, hail a ride or taxi, pay for online purchases or access services such as lending and insurance, all through a single app. Grab was founded in 2012 with the mission to drive Southeast Asia forward by creating economic empowerment for everyone. Grab strives to serve a triple bottom line – we aim to simultaneously deliver financial performance for our shareholders and have a positive social impact, which includes economic empowerment for millions of people in the region, while mitigating our environmental footprint.

Powered by technology and driven by heart, our mission is to drive Southeast Asia forward by creating economic empowerment for everyone. If this mission speaks to you, join our team today!

Definition of terms

  1. Authentication: Who you are. Making sure you are who you say you are by verifying your identity. 

  2. Authorisation: What you can do. Defining the resources or actions you are allowed to access or perform after your identity has been verified. 

  3. Role-to-Permission Matrix (R2PM): A structured framework used to map roles within an organisation to the permissions or access rights each role has in a system, application, or process. This matrix serves as a critical component in access control and identity management, ensuring that users have appropriate access based on their roles while minimising the risk of unauthorised access. 

  4. Open Authorisation (OAuth 2.0): Protocol for authorisation. For example, Google Login on third-party portals allows your identity to remain with Google, but third-party portals can obtain limited access to specific data such as your profile photo. 

  5. OpenID Connect (OIDC): Identity protocol built on top of OAuth 2.0. On top of authorisation provided by OAuth 2.0, it verifies and provides a trusted identity. 

How to secure your instances with multi-factor authentication

Post Syndicated from Sangavi P original https://aws.amazon.com/blogs/compute/how-to-secure-your-instances-with-multi-factor-authentication/

At AWS, security is our top priority. We strongly recommend implementing comprehensive security controls across all application layers to ensure defense-in-depth. This multi-layered approach helps protect your workloads, data, and infrastructure from potential threats. In this post, we walk through implementing an additional layer of authentication security for your Amazon Linux 2023 (AL2023) Amazon Elastic Compute Cloud (Amazon EC2) instances by using two-factor authentication while connecting to the instance through Secure Shell (SSH).

SSH Access Security Fundamentals

The most common tool to connect to Linux servers is SSH. When an EC2 instance is launched, you are prompted to either create a new key pair or use an existing key pair to connect to the EC2 instance using SSH. The key pair is a combination of a private and public key, where the public key is stored within the instance in the ~/.ssh/authorized_keys file, while the private key is stored in the user’s machine. A compromised local machine containing SSH private keys poses a significant security risk. An attacker who obtains both the private key and the corresponding EC2 instance username could gain unauthorized SSH access to your instance with the same permissions as the compromised user account. To prevent anyone with the private keypair from accessing the instance you should implement two-factor auth through multi-factor authentication (MFA).

Configuring security groups to allow unrestricted SSH access (0.0.0.0/0) to EC2 instances’ public IP addresses creates a significant security vulnerability. This practice exposes your instances to potential brute force attacks and unauthorized access attempts from anywhere on the internet. To overcome this, we either recommend a user restricts the access to only “My IP” in the security group, or to have a bastion host or a jump box in front of your instances and access your instances through your bastion host. Implementing MFA on top of this would tighten the security while accessing the instances through SSH.

The following figure shows a common architecture anti-pattern:

The following figure shows the recommended architectures:

Prerequisites

Before proceeding, install the Google Authenticator app on your mobile device – you’ll need it to generate one-time passwords (OTPs) for Multi-Factor Authentication (MFA) on your Amazon Linux 2023 instances.

Configuration Steps

Install Google Authenticator in the EC2 instance

Login to the instance and install Google Authenticator and its dependencies.

$ sudo dnf install google-authenticator qrencode -y

Configuring Google Authenticator

After installing the package, the application has to be initialized to generate a key for the user that you are logged in as (for example ec2-user) to add the authentication to that user account. Execute the following command to initialize the application.

google-authenticator

You are asked if the authentication tokens used should be time-based. In this example, you use time-based tokens.

Do you want authentication tokens to be time-based (y/n) y

This generates a QR code that you should scan using your Google Authenticator app. Then, enter the verification code from the application in the terminal after scanning, or manually enter the account name, which is any name, to recognize the instance and the secret key displayed in the terminal in the application to register your instance. After confirming the code, the system will generate emergency scratch codes. Store these codes securely – they serve as backup authentication methods if you lose access to your Google Authenticator app or mobile device. Each scratch code can be used only once.

After registering the instance details in the mobile application through QR code or manual operation, in the SSH terminal you are asked if the google_authenticator file should be updated for user ec2-user. Typing y saves the secret key, scratch codes, and the other configuration options that you select later on in the file. Run the initialization app and go through the same procedure for each user account to enable MFA on each account.

Do you want me to update your "/home/ec2-user/.google_authenticator" file (y/n) y

Choose y for the following question to refuse multiple uses of the same authentication token to enhance security and prevent a man-in-the-middle attack.

Do you want to disallow multiple uses of the same authentication token? 
This restricts you to one login about every 30s, but it increases your chances 
to notice or even prevent man-in-the-middle attacks (y/n) y

Choose n for the following question to have three valid codes in a 1:30-minute window unless you are facing issues.

By default, a new token is generated every 30 seconds by the mobile app.
In order to compensate for possible time-skew between the client and the server, 
we allow an extra token before and after the current time. 
This allows for a time skew of up to 30 seconds between authentication server and client. 
If you experience problems with poor time synchronization, 
you can increase the window from its default size of 3 permitted codes 
(one previous code, the current code, the next code) to 17 permitted codes 
(the 8 previous codes, the current code, and the 8 next codes). 
This will permit for a time skew of up to 4 minutes between client and server. 
Do you want to do so? (y/n) n

Choose y for the following question to enable rate-limiting to protect against brute-force logic attempts.

If the computer that you are logging into isn't hardened against brute-force 
login attempts, you can enable rate-limiting for the authentication module.
By default, this limits attackers to no more than 3 login attempts every 30s. 
Do you want to enable rate-limiting (y/n) y

Configure SSH to use the Google Pluggable Authentication module

By default PAM is not configured to use MFA for SSH connections. Now that you have the MFA module configured and running, you must modify the PAM configurations to use MFA authentication.

sudo vi /etc/pam.d/sshd

There are two options for configuration to choose from based on your requirement.

Option 1: Configuring MFA for all users in the instance

Add the following to the bottom of the file to use Google Authenticator to enforce MFA for SSH connections. When this option is enabled, the system will prompt all users for MFA during SSH connections, regardless of whether MFA has been configured for their individual accounts. This applies to every user attempting to access the instance, which may disrupt access for users without MFA configuration.

Important: Before implementing this setting, ensure all users who need instance access have properly configured MFA to prevent potential lockouts.

auth required pam_google_authenticator.so 
auth required pam_permit.so

Option 2: Configuring for specific users without affecting others

If there are other service accounts or users within the instance that should be able to log in without MFA, then add nullok at the end of the following statement. This means that users who don’t run Google Authenticator initialization won’t be asked for a second authentication.

auth required pam_google_authenticator.so nullok 
auth required pam_permit.so

Comment out the password requirement, as SSH key pairs provide stronger security than password-based authentication. In this configuration, users will need both an SSH key and a verification code from Google Authenticator to establish an SSH connection – eliminating password prompts while maintaining robust security through two-factor authentication. Note that if you leave password authentication enabled (by not commenting out this line), users will be required to provide three factors: their SSH key, password and MFA code to access the instance.

#auth       substack     password-auth

Save the file. You must change the SSH configuration to make it prompt for a second authentication. Run the following command to make changes in the configuration file.

sudo vi /etc/ssh/sshd_config.d/50-redhat.conf 

Then, change ChallengeResponseAuthentication no to ChallengeResponseAuthentication yes.

Lastly, you must let SSH know that it should use key pair along with interactive authentication for the MFA module to login. At the bottom of the file, add the following:

AuthenticationMethods publickey,keyboard-interactive

Save the file. Restart the SSH service running in the instance to let the changes take effect. Restarting the SSH service (the SSH daemon) stops the main sshd process and starts a new one, but it doesn’t disconnect existing SSH sessions.

sudo /etc/init.d/sshd restart

To test the solution, open a new terminal window and SSH into the instance, and you are asked for a verification code. Keep your session in the original terminal window open while you SSH from your new window.

Type the code that’s generated on your Google Authenticator app and you are logged in to your instance.

Using MFA allows to add a further layer of security to Amazon Linux 2023 EC2 instances while logging in.

Cleanup

To avoid incurring charges, please stop or terminate the launched Amazon EC2 instance if not in use.

Conclusion

In this post, you learned how to enhance your Amazon Linux 2023 EC2 instance security by implementing multi-factor authentication (MFA) with Google Authenticator. This setup requires users to provide both their SSH key pair and a time-based one-time password from their application when connecting to instances, adding an essential extra layer of protection.

Resolving a request smuggling vulnerability in Pingora

Post Syndicated from Edward Wang original https://blog.cloudflare.com/resolving-a-request-smuggling-vulnerability-in-pingora/

On April 11, 2025 09:20 UTC, Cloudflare was notified via its Bug Bounty Program of a request smuggling vulnerability in the Pingora OSS framework discovered by a security researcher experimenting to find exploits using Cloudflare’s Content Delivery Network (CDN) free tier which serves some cached assets via Pingora.

Customers using the free tier of Cloudflare’s CDN or users of the caching functionality provided in the open source pingora-proxy and pingora-cache crates could have been exposed.  Cloudflare’s investigation revealed no evidence that the vulnerability was being exploited, and was able to mitigate the vulnerability by April 12, 2025 06:44 UTC within 22 hours after being notified.

What was the vulnerability?

The bug bounty report detailed that an attacker could potentially exploit an HTTP/1.1 request smuggling vulnerability on Cloudflare’s CDN service. The reporter noted that via this exploit, they were able to cause visitors to Cloudflare sites to make subsequent requests to their own server and observe which URLs the visitor was originally attempting to access.

We treat any potential request smuggling or caching issue with extreme urgency.  After our security team escalated the vulnerability, we began investigating immediately, took steps to disable traffic to vulnerable components, and deployed a patch. 

We are sharing the details of the vulnerability, how we resolved it, and what we can learn from the action. No action is needed from Cloudflare customers, but if you are using the Pingora OSS framework, we strongly urge you to upgrade to a version of Pingora 0.5.0 or later.

What is request smuggling?

Request smuggling is a type of attack where an attacker can exploit inconsistencies in the way different systems parse HTTP requests. For example, when a client sends an HTTP request to an application server, it typically passes through multiple components such as load balancers, reverse proxies, etc., each of which has to parse the HTTP request independently. If two of the components the request passes through interpret the HTTP request differently, an attacker can craft a request that one component sees as complete, but the other continues to parse into a second, malicious request made on the same connection.


Request smuggling vulnerability in Pingora

In the case of Pingora, the reported request smuggling vulnerability was made possible due to a HTTP/1.1 parsing bug when caching was enabled.

The pingora-cache crate adds an HTTP caching layer to a Pingora proxy, allowing content to be cached on a configured storage backend to help improve response times, and reduce bandwidth and load on backend servers.

HTTP/1.1 supports “persistent connections”, such that one TCP connection can be reused for multiple HTTP requests, instead of needing to establish a connection for each request. However, only one request can be processed on a connection at a time (with rare exceptions such as HTTP/1.1 pipelining). The RFC notes that each request must have a “self-defined message length” for its body, as indicated by headers such as Content-Length or Transfer-Encoding to determine where one request ends and another begins.

Pingora generally handles requests on HTTP/1.1 connections in an RFC-compliant manner, either ensuring the downstream request body is properly consumed or declining to reuse the connection if it encounters an error. After the bug was filed, we discovered that when caching was enabled, this logic was skipped on cache hits (i.e. when the service’s cache backend can serve the response without making an additional upstream request).

This meant on a cache hit request, after the response was sent downstream, any unread request body left in the HTTP/1.1 connection could act as a vector for request smuggling. When formed into a valid (but incomplete) header, the request body could “poison” the subsequent request. The following example is a spec-compliant HTTP/1.1 request which exhibits this behavior:

GET /attack/foo.jpg HTTP/1.1
Host: example.com
<other headers…>
content-length: 79

GET / HTTP/1.1
Host: attacker.example.com
Bogus: foo

Let’s say there is a different request to victim.example.com that will be sent after this one on the reused HTTP/1.1 connection to a Pingora reverse proxy. The bug means that a Pingora service may not respect the Content-Length header and instead misinterpret the smuggled request as the beginning of the next request:

GET /attack/foo.jpg HTTP/1.1
Host: example.com
<other headers…>
content-length: 79

GET / HTTP/1.1 // <- “smuggled” body start, interpreted as next request
Host: attacker.example.com
Bogus: fooGET /victim/main.css HTTP/1.1 // <- actual next valid req start
Host: victim.example.com
<other headers…>

Thus, the smuggled request could inject headers and its URL into a subsequent valid request sent on the same connection to a Pingora reverse proxy service.

CDN request smuggling and hijacking

On April 11, 2025, Cloudflare was in the process of rolling out a Pingora proxy component with caching support enabled to a subset of CDN free plan traffic. This component was vulnerable to this request smuggling attack, which could enable modifying request headers and/or URL sent to customer origins.

As previously noted, the security researcher reported that they were also able to cause visitors to Cloudflare sites to make subsequent requests to their own malicious origin and observe which site URLs the visitor was originally attempting to access. During our investigation, Cloudflare found that certain origin servers would be susceptible to this secondary attack effect. The smuggled request in the example above would be sent to the correct origin IP address per customer configuration, but some origin servers would respond to the rewritten attacker Host header with a 301 redirect. Continuing from the prior example:

GET / HTTP/1.1 // <- “smuggled” body start, interpreted as next request
Host: attacker.example.com
Bogus: fooGET /victim/main.css HTTP/1.1 // <- actual next valid req start
Host: victim.example.com
<other headers…>

HTTP/1.1 301 Moved Permanently // <- susceptible victim origin response
Location: https://attacker.example.com/
<other headers…>

When the client browser followed the redirect, it would trigger this attack by sending a request to the attacker hostname, along with a Referrer header indicating which URL was originally visited, making it possible to load a malicious asset and observe what traffic a visitor was trying to access.

GET / HTTP/1.1 // <- redirect-following request
Host: attacker.example.com
Referrer: https://victim.example.com/victim/main.css
<other headers…>

Upon verifying the Pingora proxy component was susceptible, the team immediately disabled CDN traffic to the vulnerable component on 2025-04-12 06:44 UTC to stop possible exploitation. By 2025-04-19 01:56 UTC and prior to re-enablement of any traffic to the vulnerable component, a patch fix to the component was released, and any assets cached on the component’s backend were invalidated in case of possible cache poisoning as a result of the injected headers.

Remediation and next steps

If you are using the caching functionality in the Pingora framework, you should update to the latest version of 0.5.0. If you are a Cloudflare customer with a free plan, you do not need to do anything, as we have already applied the patch for this vulnerability.

Timeline

All timestamps are in UTC.

  • 2025-04-11 09:20 – Cloudflare is notified of a CDN request smuggling vulnerability via the Bug Bounty Program.

  • 2025-04-11 17:16 to 2025-04-12 03:28 – Cloudflare confirms vulnerability is reproducible and investigates which component(s) require necessary changes to mitigate.

  • 2025-04-12 04:25 – Cloudflare isolates issue to roll out of a Pingora proxy component with caching enabled and prepares release to disable traffic to this component.

  • 2025-04-12 06:44 – Rollout to disable traffic complete, vulnerability mitigated.

Conclusion

We would like to sincerely thank James Kettle & Wannes Verwimp, who responsibly disclosed this issue via our Cloudflare Bug Bounty Program, allowing us to identify and mitigate the vulnerability. We welcome further submissions from our community of researchers to continually improve the security of all of our products and open source projects.

Whether you are a customer of Cloudflare or just a user of our Pingora framework, or both, we know that the trust you place in us is critical to how you connect your properties to the rest of the Internet. Security is a core part of that trust and for that reason we treat these kinds of reports and the actions that follow with serious urgency. We are confident about this patch and the additional safeguards that have been implemented, but we know that these kinds of issues can be concerning. Thank you for your continued trust in our platform. We remain committed to building with security as our top priority and responding swiftly and transparently whenever issues arise.

How to automate incident response for Amazon EKS on Amazon EC2

Post Syndicated from Jonathan Nguyen original https://aws.amazon.com/blogs/security/how-to-automate-incident-response-for-amazon-eks-on-amazon-ec2/

Triaging and quickly responding to security events is important to minimize impact within an AWS environment. Acting in a standardized manner is equally important when it comes to capturing forensic evidence and quarantining resources. By implementing automated solutions, you can respond to security events quickly and in a repeatable manner. Before implementing automated security solutions, it’s important for your security team to have a defined process and understanding of which actions to take for specific AWS resources.

In a previous two-part post, we discussed using Amazon GuardDuty and Amazon Detective to detect security issues for an Amazon Elastic Kubernetes Service (Amazon EKS) cluster. In this post, we walk through the differences of Amazon Elastic Cloud Compute (Amazon EC2) and EKS clusters on EC2 when responding to security events. By understanding the differences between the two AWS resource types, you can enhance your existing EC2 incident response (IR) automation to include EKS. Then, we walk you through the deployment and use of a sample solution based on the Automated Forensics Orchestrator for Amazon EC2 solution to automate the end-to-end incident response process for EKS, which includes acquisition, isolation, investigation and reporting.

If you’re familiar with the differences between responding and investigating Amazon EC2 and Amazon EKS resources and want to skip to the solution, skip to the Solution prerequisites.

Note: Amazon EKS on AWS Fargate, which is an AWS managed serverless computing engine, isn’t covered in this post.

Amazon EC2 compared to Amazon EKS resources for incident response

Although Amazon EKS clusters are running on EC2 instances, it’s important to understand the differences between the two and how to handle incident response automation for each resource type. EC2 is a virtual machine where you can install customized applications and packages to complete a task. Amazon EKS is an AWS managed service that you can use to run Kubernetes on EC2 instances without needing to install, operate, and maintain your own Kubernetes control plane or nodes. You can use existing plugins and tooling from the Kubernetes community. EKS clusters can have managed node groups, which create and manage the underlying EC2 instances. Because of Kubernetes cluster architecture, multiple EC2 instances within a node group can be tied to a single EKS cluster. There can also be multiple pods—each running different processes—running on an EC2 instance. GuardDuty can monitor and detect security events for EKS resources and provide information to help identify which resources are impacted, such as EKS cluster name, Kubernetes workload details, tags, and AWS Identity and Access Management (IAM) principals.

For incident response automation purposes, security teams need to understand the relationship between Amazon EKS and Amazon EC2 to determine the appropriate response to a possible security event. For example, if GuardDuty identifies Execution:Kubernetes/AnomalousBehavior.ExecInPod, you might want to investigate the command invoked on the identified pod along with other pods within the EKS cluster. To expand the investigation, you would need to capture and investigate evidence on the entire EKS cluster, which can include multiple EC2 instances.

Accessing Amazon EKS clusters using kubectl

To collect relevant forensic evidence, such as volatile memory, there might be instances where you need to run commands on Amazon EKS clusters. Kubectl is a command line tool that you can use to manage and run commands on EKS clusters using the Kubernetes API. Access with kubectl is limited to the container environment and doesn’t provide full shell access to the host. Although AWS Systems Manager (AWS SSM) can be used to interact with an EKS cluster’s EC2 instances, kubectl allows administrators to manage pods, scale applications, and view cluster logs. We dive into specific actions where kubectl is used in the later sections of this post.

When automating the workflow of response actions to an Amazon EKS cluster, you can incorporate the kubectl commands within Amazon Lambda functions. To invoke commands using kubectl, you need to get credentials for the EKS cluster to:

  1. Authenticate to an IAM principal authorized to work with Amazon EKS
  2. Obtain the EKS cluster endpoint
  3. Verify the certificate authority data for the EKS endpoint
  4. Generate a bearer token from the IAM principal
  5. Create a kubeconfig configuration dictionary

For more detailed information, see A Container-Free Way to Configure Kubernetes Using AWS Lambda and a deep dive into simplified Amazon EKS access management.

Capturing volatile memory on EKS

Volatile memory (RAM) in a memory dump is important because it contains the EC2 instance’s in-progress operations. Volatile memory is extremely important in determining the root cause of a security event. Although the commands for capturing volatile memory between EC2 instances and Amazon EKS clusters are similar, there is one important difference to keep in mind. For Linux operating systems, you can use the insmod command with the appropriate LiME kernel module (.ko file) to capture volatile memory:

sudo insmod $lime.ko "path=/path/to/dump.mem format=lime"

For Amazon EKS cluster EC2 instances, there can be multiple pods on a single EC2 instance. Knowing which process ID (PID) is associated to a pod is important to map the actions that could have resulted in a security event or compromise.

Figure 1: EKS cluster node list

Figure 1: EKS cluster node list

To get a list of PIDs on the EC2 instance, as shown in Figure 1, the following crictl command needs to be invoked:

crictl inspect $(crictl ps | grep [pod-name] | awk '{print $1}') | grep -i pid

After the crictl command is invoked, you will see the output of existing PIDs for the EC2 instance to use in the nsenter command, as shown in the following figure.

Figure 2: EKS node process ID list

Figure 2: EKS node process ID list

To create a mapping between a pod and the PID from a memory dump, the following nsenter command needs to be invoked on the target EC2 instance:

nsenter -t $PID -u hostname

After the nsenter command is invoked, you will see the output of pod and PID information for the EC2 instance, as shown in the following figure.

Figure 3: EKS node process ID to pod mapping commands

Figure 3: EKS node process ID to pod mapping commands

After you have the pod-to-PID mapping, you can export that information for later investigation. If you skip this step, the memory dump output will still have the PID information, but you won’t be able to map it back to previously running pods. It’s important to work with your security teams during forensic investigations to determine if this information is used during an investigation and update the automated workflow accordingly.

Network segmentation on EKS

After relevant forensic artifacts, such as volatile memory, disk volumes, and application logs, are collected from an Amazon EKS cluster, you might want to isolate compromised resources from the rest of your application resources. During resource isolation, EC2 instances can be isolated using security groups and network access control lists (NACLs). For EKS clusters, you can cordon the worker node, which makes the node tainted and unschedulable. When a node is cordoned, the Kubernetes scheduler is also blocked from placing new pods on the node. Another mechanism for isolating the EKS cluster is applying a Network Policy to deny ingress or egress traffic to the pod. Network policies, like NACLs, are stateless and control network traffic at the IP address or port level in an EKS cluster.

Depending on the scope of isolation, you can take the following approaches to isolating a pod on an EKS cluster in your automation.

  • Apply a network policy – You can add a network policy rule to limit ingress or egress from your pod. This will not impact other pods in the cluster unless there are additional rules applied. You would use this option if you’re sure that the compromise hasn’t gained access to the underlying EC2 instance.
  • Cordon the node – Removing the node won’t impact other nodes on the cluster but will block the scheduling of pods on the node. It doesn’t affect other nodes within the cluster.
  • Apply a security group – Applying a security group can impact the entire EC2 instance and limit traffic between Amazon EKS cluster nodes, the Kubernetes control plane, the cluster’s worker nodes, and external destinations. This is an option if you believe the underlying EC2 instance has been compromised.
  • Add a NACL rule – Like the security group option, this will impact the entire EC2 instance. Depending on the rule, it can also affect non-EKS workloads within the subnet.

Identity and access management for EKS

In addition to the IAM role associated to an EC2 instance profile, Amazon EKS uses service-linked IAM roles and Kubernetes role-based authorization control (RBAC) configuration. The IAM principal that creates the EKS cluster has system:masters permissions within the RBAC configuration on the EKS cluster. RBAC provides Kubernetes identities access for cluster-specific components and workflows. In addition to default identities created on EKS clusters, application-specific roles can be used within an EKS cluster. For example, IAM roles for service accounts (IRSA) can be used to associate an IAM role with a Kubernetes service account and assigned to containers within an EKS Pod. IRSA can help implement least privilege by restricting the Pod’s container to retrieve credentials for the IAM role associated with the Kubernetes service account. For a deeper dive into EKS IAM and how IAM roles are used within EKS, see Identity and access management for Amazon EKS.

Deciding how to revoke Amazon EKS permissions using automation can be challenging because revoking the AWS Security Token Service (AWS STS) credentials or changing the instance profile on the EC2 instance will impact all pods on the EC2 instance. Updating or changing the RBAC configurations on an EKS cluster requires application-specific knowledge to determine which identities are authorized to have specific permissions. It’s important to discuss with your application and security teams how permissions should be handled in the event of a compromised EKS cluster.

Moving to automated EKS incident response

Now that you understand the nuances of Amazon EKS on Amazon EC2 as it relates to incident response, you can decide how to incorporate functionality to respond to EKS in an existing solution your team might be using. It’s also important to understand where a human-in-the-loop needs to be incorporated to follow internal processes and procedures. Before incorporating automation into IR capabilities, you should walk through each step and verify the action the automation takes to make sure that the security and application teams are aligned. In this post, we incorporated Amazon EKS IR capabilities across acquisition, isolation, and investigation into the Automated Forensics Orchestrator for Amazon EC2 solution.

Solution prerequisites

For this walkthrough, you need to have the following elements in place:

Solution overview

The solution follows a similar pattern and workflow as the Automated Forensics Orchestrator for Amazon EC2 but has been customized for Amazon EKS.

Figure 4: Automated Forensics Orchestrator for Amazon EKS architecture

Figure 4: Automated Forensics Orchestrator for Amazon EKS architecture

The workflow, as shown in Figure 4, is:

  1. In the AWS application account, GuardDuty monitors for malicious activities that are specific to Amazon EKS resources. For example, a pod within an EKS cluster is invoking API commands using an unauthenticated system:anonymous user. GuardDuty findings are sent to Security Hub in the security account using native integration.
  2. Security Hub custom actions send finding information to Amazon EventBridge to invoke automated downstream workflows.
  3. For a specified event, EventBridge provides the EKS resource information for the forensics process to target and initiates an AWS Step Functions workflow.
  4. Step Functions triages the request as follows:
    1. Gets the EKS information, including which EC2 instances the pod is hosted on.
    2. Determines if isolation is required based on the Security Hub custom action.
    3. Determines if acquisition is required based on tags associated with the EC2 instance. The current tag that is evaluated is the following:
      • Tag name: IsTriageRequired
      • Tag key: true or false
    4. Initiates the acquisition flow based on triaging output
  5. Triaging details are stored in Amazon DynamoDB.
  6. The following two acquisition flows are initiated in parallel:
    1. Memory forensics flow – The Step Functions workflow captures the memory data and stores it in Amazon Simple Storage Service (Amazon S3). Post memory acquisition completion, the node is isolated by cordoning the node, creating a network policy, and applying a restricted security group to the cluster. To help maintain the chain of custody, a new security group is attached to the targeted instance and removes access for users, admins, or developers.
    2. Note: The isolation action is initiated based on the selected Security Hub custom action.

    3. Disk forensics flow – The Step Functions workflow takes a snapshot of the Amazon Elastic Block Storage (Amazon EBS) volume and shares it with the forensic account.
  7. Acquisition details are stored in DynamoDB.
  8. After the disk or memory acquisition process is complete, and the evidence has been captured successfully, a notification is sent to an investigation Step Functions state machine to begin the automated investigation of the captured data.
  9. The investigation Step Functions starts a forensic instance from a forensic AMI loaded with customer forensic tools:
    1. Loads the memory data from Amazon S3 for memory investigation.
    2. Creates an Amazon EBS volume from the snapshot and attaches it for disk analysis.
  10. Systems Manager documents (SSM documents) are used to run a forensic investigation.
  11. DynamoDB stores the state of the forensic tasks and their result when the jobs are complete. Investigation job details are stored in DynamoDB.
  12. Investigation details are shared with customers using Amazon Simple Notification Service (Amazon SNS).
  13. Forensic AMI is used by investigation Step Functions to perform memory and disk investigation.

Solution deployment

You can deploy the Amazon EKS IR automation solution using the AWS CDK or synthesizing a CDK into AWS CloudFormation templates and deploying them using AWS Management Console. Although the solution can be deployed in a single AWS account, the AWS Security Reference Architecture (AWS SRA) recommends that you use separate AWS accounts for forensic evidence and security tooling. The solution deployment follows AWS SRA recommendations.

The latest code for the Amazon EKS IR automation solution can be found at sample-eks-incident-response-automation, where you can also contribute to the sample code. For instructions and more information about using the AWS CDK, see Getting Started with AWS CDK.

Deploy the automation that collects, stores, and investigates forensic artifacts in the forensic AWS account:

  1. To build the app when navigating to the project’s root folder, use the following commands.
    • npm ci
    • npm run-build-lambda
  2. Run the following commands in your terminal while authenticated in your forensic solution AWS account. Be sure to replace <INSERT_AWS_ACCOUNT> with your account number and replace <INSERT_REGION> with the AWS Region that you want the solution deployed to.
  3. cdk bootstrap aws://<INSERT_AWS_ACCOUNT>/<INSERT_REGION>
    
    cdk deploy --all -c account=<INSERT Forensic AWS Account> -c region=<INSERT_FORENSIC_SOLUTION_REGION> --require-approval=never -c secHubAccount=<INSERT SECURITY_HUB_AGGREGATOR_AWS_ACCOUNT> -c STACK_BUILD_TARGET_ACCT=forensicAccount
    

    Example:

    cdk deploy —all -c account=1234567890 -c region=us-east-1 —require-approval=never -c secHubAccount=0987654321 -c STACK_BUILD_TARGET_ACCT=forensicAccount

Deploy the Security Hub custom action and EventBridge in the Security Hub Region of the delegated administrator account where security findings are consolidated:

  1. To build the app when navigating to the project’s root folder, use the following commands.
    • npm ci
    • npm run build-lambda
  2. Run the following commands in your terminal while authenticated in your Security Hub aggregator AWS account. Be sure to replace <INSERT_AWS_ACCOUNT> with your account number and replace <INSERT_REGION> with the AWS Region that you want the solution deployed to.
  3. cdk bootstrap aws://<INSERT_AWS_ACCOUNT>/<INSERT_REGION>
    	
    	cdk deploy --all -c account=<INSERT_SECURITY_HUB_AGGREGATOR_AWS_ACCOUNT> -c region=<INSERT_FORENSIC_SOLUTION_REGION> --require-approval=never -c forensicAccount=<INSERT_FORENSIC_SOLUTION_AWS_ACCOUNT> -c STACK_BUILD_TARGET_ACCT=securityHubAccount -c sechubregion=<INSERT_SECURITY_HUB_AGGREGRATOR_REGION>
    

    Example:

    cdk deploy --all -c account=0987654321 -c region=us-east-1 --require-approval=never -c forensicAccount=1234567890 -c STACK_BUILD_TARGET_ACCT=securityHubAccount -c sechubregion=us-east-1

Deploy the cross-account IAM role the security automation will use in the application AWS account where the EKS workload exists:

  1. Sign in to the AWS CloudFormation console of the application AWS account.
  2. Launch the CloudFormation cross-account-role.yml stack.
  3. Pass the following CloudFormation input parameters:
    1. solutionInstalledAccount=<Forensic Solution AWS Account Number>
    2. solutionAccountRegion=<Region of solution deployment>
    3. kmsKey=<ARN of the application account EBS volume encryption KMS key>

Use the solution to respond to an EKS GuardDuty alert

You can now use the automated solution on an Amazon EKS cluster with a GuardDuty finding that’s integrated with Security Hub. If you need to create GuardDuty findings, see How to generate security findings to help your security team with incident response simulations.

After you have an EKS security finding, you can go through either one of the IR workflows:

  • Forensic triage – This workflow evaluates in-scope EKS resources, collects volatile and non-volatile memory, conducts an investigation, and exports investigation artifacts to a forensic S3 bucket.
  • Forensic isolation – In addition to components of the previous workflow, the in-scope EKS resources are quarantined at the network and IAM layers.

In this example, you’ll use the forensic isolation workflow because that covers the end-to-end capabilities of the solution.

Run the forensic isolation workflow:

  1. Open the AWS Security Hub console in the Security Hub aggregator account.
  2. Choose Findings in the navigation pane and then select a security finding for Amazon EKS.
  3. Select the custom action for Forensic Isolation. This will start the workflow in the Security Hub aggregator account and invoke the Step Functions in the forensic account.
  4. Open the AWS Step Functions console in the forensic account.
  5. In the navigation pane, choose State Machines and then select the Forensic-Triage-Function to view the workflow graph status. In the following figure, the Step Functions workflow has successfully completed.
    Figure 5: EKS triage Step Functions graph view

    Figure 5: EKS triage Step Functions graph view

    1. In the Get Resource Info Case step, the pod name from the GuardDuty finding is extracted to identify the EKS cluster it’s part of and the related EC2 resources.
    2. Note: Per the solution, a guardrail is added to block action on an EC2 instance that is part of an EKS cluster with the IsTriageRequired tag with a value set to false. If automation is invoked against a protected EC2 instance resource, acquisitionFlow is skipped and a notification will be sent to the SNS topic.

  6. Because the EKS cluster isn’t excluded through the IsTriageRequired tag, a parallel invocation of Step Functions is invoked to capture forensic evidence.
  7. Select the Disk-Forensics-Acquisition-Function. The workflow here is similar to a normal EC2 incident response flow to capture snapshots and EBS volumes with the caveat that the EKS cluster can have multiple EC2 instances. In the following figure, the Step Functions workflow has successfully completed.
    Figure 6: Disk forensics acquisition Step Functions graph view

    Figure 6: Disk forensics acquisition Step Functions graph view

  8. Select the Memory-Forensics-Acquisition-Function; In the following figure, the Step Function workflow has successfully completed.
    Figure 7: Memory forensics acquisition Step Functions graph view

    Figure 7: Memory forensics acquisition Step Functions graph view

    1. As previously mentioned, you will need to determine if you want to map pods to process ID (PID) as part of this workflow. The automation captures the volatile memory where you will be able see the PIDs on the EC2 instance but does not map the PID to node for deeper investigation.
    2. Note: One reason you might not want to automatically map pods to PIDs is to minimize interaction with the possibly compromised cluster and quickly move towards isolation.

    3. After the Is Memory Acquisition Complete step is complete and if the Security Hub custom action for Forensic Isolation was selected, the isolation workflow of the EKS cluster begins. The isolation workflow will go through EKS-specific steps to:
      1. Label the affected pods on the EKS cluster.
      2. Apply a network policy to the affected pods.
      3. Revoke IAM role sessions.
      4. Cordon the node.
  9. Note: Depending on your desired workflow, you can edit these steps or add additional isolation steps to change instance profiles, security groups, or NACL rules.

  10. To expedite the investigation process, the Forensic-Investigation-Function is invoked when the Memory-Forensics-Acquisition-Function is completed and separately by the Disk-Forensics-Acquisition-Function. This is because of the disk and memory forensic evidence collection completing at different times. A forensic EC2 instance will be launched and begin conducting the investigation on the forensic artifacts. The completed investigation artifacts will be sent to Amazon S3 as they’re completed.
    1. You can use the console to view EKS artifacts within the dedicated S3 bucket in the forensic AWS account.
    2. Figure 8: Completed memory investigation artifacts for EKS

      Figure 8: Completed memory investigation artifacts for EKS

    3. The forensic investigation results from the automated workflow are also saved to the dedicated S3 bucket in the forensic AWS account.
Figure 9: Completed disk investigation artifacts for EKS

Figure 9: Completed disk investigation artifacts for EKS

As part of the automation, the forensic investigation EC2 instance in the forensic account is terminated after investigation is completed. The automation can be updated to retain the EC2 instance to so that your security teams can continue their investigation and review investigation artifacts to expedite root cause analysis.

As previously mentioned, the workflow you just went through encompasses both investigation and isolation of Amazon EKS resources. If your security teams want to conduct a more thorough investigation prior to isolating EKS resources, select the Forensic Triage custom action in Security Hub. Additionally, if you want to update the solution to be invoked from your security incident and event management (SIEM) tool, you can directly invoke the Forensic-Triage-Function Step Functions from your SIEM.

Clean up

For the cross-account IAM role in the application account, you can:

  1. Go to the AWS CloudFormation console for the application account and Region where you deployed the cross-account IAM role, select the cross-account-role stack.
  2. Choose the option to Delete the stack.

To clean up the CDK stacks, run the following command in the source folder in the Security Hub aggregator account and forensic account.

cdk destroy --all

Conclusion

In this post, we showed you the differences between Amazon EKS and Amazon EC2 resources and how to handle EKS automation for incident response. Even though EKS clusters are on EC2 instances, it’s important to understand the differences before implementing an automated solution that will affect EKS resources. We also walked through the deployment of an EKS-customized Automated Forensics Orchestrator for Amazon EC2 solution and showed you the end-to-end IR lifecycle to respond to a possible EKS compromise. The same approach to customize existing EC2 IR automated solutions can be used to expand support for EKS resources within your AWS environment to increase your security posture.

If you have feedback about this post, submit comments in the comments section that follows. If you have questions about this post, start a thread on re:Post.

Jonathan Nguyen
Jonathan Nguyen

Jonathan is a Principal Security Solution Architect at AWS. He helps large financial services customers develop a comprehensive security strategy and solutions to meet their security and compliance requirements in AWS.
Gopinath Jagadesan
Gopinath Jagadesan

Gopi is a Senior Solution Architect at AWS. In his role, he works with Amazon as his customer helping design, build, and deploy well architected solutions on AWS. He holds a master’s degree in electrical and computer engineering from the University of Illinois at Chicago. Outside of work, he enjoys playing soccer and spending time with his family and friends.

Vulnerability transparency: strengthening security through responsible disclosure

Post Syndicated from Sri Pulla original https://blog.cloudflare.com/vulnerability-transparency-strengthening-security-through-responsible/

In an era where digital threats evolve faster than ever, cybersecurity isn’t just a back-office concern — it’s a critical business priority. At Cloudflare, we understand the responsibility that comes with operating in a connected world. As part of our ongoing commitment to security and transparency, Cloudflare is proud to have joined the United States Cybersecurity and Infrastructure Security Agency’s (CISA) “Secure by Design” pledge in May 2024. 

By signing this pledge, Cloudflare joins a growing coalition of companies committed to strengthening the resilience of the digital ecosystem. This isn’t just symbolic — it’s a concrete step in aligning with cybersecurity best practices and our commitment to protect our customers, partners, and data. 

A central goal in CISA’s Secure by Design pledge is promoting transparency in vulnerability reporting. This initiative underscores the importance of proactive security practices and emphasizes transparency in vulnerability management — values that are deeply embedded in Cloudflare’s Product Security program. ​We believe that openness around vulnerabilities is foundational to earning and maintaining the trust of our customers, partners, and the broader security community.

Why transparency in vulnerability reporting matters

Transparency in vulnerability reporting is essential for building trust between companies and customers. In 2008, Linus Torvalds noted that disclosure is inherently tied to resolution: “So as far as I’m concerned, disclosing is the fixing of the bug”, emphasizing that resolution must start with visibility. While this mindset might apply well to open-source projects and communities familiar with code and patches, it doesn’t scale easily to non-expert users and enterprise users who require structured, validated, and clearly communicated disclosures regarding a vulnerability’s impact. Today’s threat landscape demands not only rapid remediation of vulnerabilities but also clear disclosure of their nature, impact and resolution. This builds trust with the customer and contributes to the broader collective understanding of common vulnerability classes and emerging systemic flaws.

What is a CVE?

Common Vulnerabilities and Exposures (CVE) is a catalog of publicly disclosed vulnerabilities and exposures. Each CVE includes a unique identifier, summary, associated metadata like the Common Weakness Enumeration (CWE) and Common Platform Enumeration (CPE), and a severity score that can range from None to Critical. 

The format of a CVE ID consists of a fixed prefix, the year of the disclosure and an arbitrary sequence number ​​like CVE-2017-0144. Memorable names such as “EternalBlue”  (CVE-2017-0144)  are often associated with high-profile exploits to enhance recall.

What is a CNA?

As an authorized CVE Numbering Authority (CNA), Cloudflare can assign CVE identifiers for vulnerabilities discovered within our products and ecosystems. Cloudflare has been actively involved with MITRE’s CVE program since its founding in 2009. As a CNA, Cloudflare assumes the responsibility to manage disclosure timelines ensuring they are accurate, complete, and valuable to the broader industry. 

Cloudflare CVE issuance process

Cloudflare issues CVEs for vulnerabilities discovered internally and through our Bug Bounty program when they affect open source software and/or our distributed closed source products.

The findings are triaged based on real-world exploitability and impact. Vulnerabilities without a plausible exploitation path, in addition to findings related to test repositories or exposed credentials like API keys, typically do not qualify for CVE issuance.

We recognize that CVE issuance involves nuance, particularly for sophisticated security issues in a complex codebase (for example, the Linux kernel). Issuance relies on impact to users and the likelihood of the exploit, which depends on the complexity of executing an attack. The growing number of CVEs issued industry-wide reflects a broader effort to balance theoretical vulnerabilities against real-world risk. 

In scenarios where Cloudflare was impacted by a vulnerability, but the root cause was within another CNA’s scope of products, Cloudflare will not assign the CVE. Instead, Cloudflare may choose other mediums of disclosure, like blog posts.

How does Cloudflare disclose a CVE?

Our disclosure process begins with internal evaluation of severity and scope, and any potential privacy or compliance impacts. When necessary, we engage our Legal and Security Incident Response Teams (SIRT). For vulnerabilities reported to Cloudflare by external entities via our Bug Bounty program, our standard disclosure timeline is within 90 days. This timeline allows us to ensure proper remediation, thorough testing, and responsible coordination with affected parties. While we are committed to transparent disclosure, we believe addressing and validating fixes before public release is essential to protect users and uphold system security. For open source projects, we also issue security advisories on the relevant GitHub repositories. Additionally, we encourage external researchers to publish/blog about their findings after issues are remediated. Full details and process of Cloudflare’s external researcher/entity disclosure policy can be found via our Bug Bounty program policy page

Outcomes

To date, Cloudflare has issued and disclosed multiple CVEs. Because of the security platforms and products that Cloudflare builds, vulnerabilities have primarily been in the areas of denial of service, local privilege escalation, logical flaws, and improper input validation. Cloudflare also believes in collaboration and open sources of some of our software stack, therefore CVEs in these repositories are also promptly disclosed.

Cloudflare disclosures can be found here. Below are some of the most notable vulnerabilities disclosed by Cloudflare:

CVE-2024-1765: quiche: Memory Exhaustion Attack using post-handshake CRYPTO frames

Cloudflare quiche (through version 0.19.1/0.20.0) was affected by an unlimited resource allocation vulnerability causing rapid increase of memory usage of the system running a quiche server or client.

A remote attacker could take advantage of this vulnerability by repeatedly sending an unlimited number of 1-RTT CRYPTO frames after previously completing the QUIC handshake.

Exploitation was possible for the duration of the connection, which could be extended by the attacker.

quiche 0.19.2 and 0.20.1 are the earliest versions containing the fix for this issue.

CVE-2024-0212: Cloudflare WordPress plugin enables information disclosure of Cloudflare API (for low-privilege users)

The Cloudflare WordPress plugin was found to be vulnerable to improper authentication. The vulnerability enables attackers with a lower privileged account to access data from the Cloudflare API.

The issue has been fixed in version >= 4.12.3 of the plugin

CVE-2023-2754 – Plaintext transmission of DNS requests in Windows 1.1.1.1 WARP client

The Cloudflare WARP client for Windows assigns loopback IPv4 addresses for the DNS servers, since WARP acts as a local DNS server that performs DNS queries securely. However, if a user is connected to WARP over an IPv6-capable network, the WARP client did not assign loopback IPv6 addresses but rather Unique Local Addresses, which under certain conditions could point towards unknown devices in the same local network, enabling an attacker to view DNS queries made by the device.

This issue was patched in version 2023.7.160.0 of the WARP client (Windows).

CVE-2025-0651 – Improper privilege management allows file manipulations 

An improper privilege management vulnerability in Cloudflare WARP for Windows allowed file manipulation by low-privilege users. Specifically, a user with limited system permissions could create symbolic links within the C:\ProgramData\Cloudflare\warp-diag-partials directory. When the “Reset all settings” feature is triggered, the WARP service — running with SYSTEM-level privileges — followed these symlinks and may delete files outside the intended directory, potentially including files owned by the SYSTEM user.

This vulnerability affected versions of WARP prior to 2024.12.492.0.

CVE-2025-23419: TLS client authentication can be bypassed due to ticket resumption (disclosed Cloudflare impact via blog post)

Cloudflare’s mutual TLS implementation caused a vulnerability in the session resumption handling. The underlying issue originated from BoringSSL’s process to resume TLS sessions. BoringSSL stored client certificates, which were reused from the original session (without revalidating the full certificate chain) and the original handshake’s verification status was not re-validated. 

While Cloudflare was impacted by the vulnerability, the root cause was within NGINX’s implementation, making F5 the appropriate CNA to assign the CVE. This is an example of alternate mediums of disclosure that Cloudflare sometimes opt for. This issue was fixed as per guidance from the respective CVE — please see our blog post for more details.

Conclusion

Irrespective of the industry, if your organization builds software, we encourage you to familiarize yourself with CISA’s “Secure by Design” principles and create a plan to implement them in your company. The CISA Secure by Design pledge is built around seven security goals, prioritizing the security of customers, and challenges organizations to think differently about security. 

As we continue to enhance our security posture, Cloudflare remains committed to enhancing our internal practices, investing in tooling and automation, and sharing knowledge with the community. CVE transparency is not a one-time initiative — it’s a sustained effort rooted in openness, discipline, and technical excellence. By embedding these values in how we design, build and secure our products, we aim to meet and exceed expectations set out in the CISA pledge and make the Internet more secure, faster and reliable!

For more updates on our CISA progress, review our related blog posts. Cloudflare has delivered five of the seven CISA Secure by Design pledge goals, and we aim to complete the remainder of the pledge goals in May 2025.

Securing Amazon S3 presigned URLs for serverless applications

Post Syndicated from Raaga N.G original https://aws.amazon.com/blogs/compute/securing-amazon-s3-presigned-urls-for-serverless-applications/

Modern serverless applications must be capable of seamlessly handling large file uploads. This blog demonstrates how to leverage Amazon Simple Storage Service (Amazon S3) presigned URLs to allow your users to securely upload files to S3 without requiring explicit permissions in the AWS Account. This blog post specifically focuses on the security ramifications of using S3 presigned URLs, and explains mitigation steps that serverless developers can take to improve the security of their systems using S3 presigned URLs. Additionally, the blog post also walks through an AWS Lambda function that adheres to the provided recommendations, ensuring a robust and secure approach to handling S3 presigned URLs. For more information on S3 presigned URLs, see Working with presigned URLs.

Presigned URL Workflow for Serverless Applications

The following architecture diagram illustrates a serverless application that generates an S3 presigned URL. By using S3 presigned URLs, serverless applications can offload to S3 the computation required to receive files. The diagram captures a seven-step process between the client, Amazon API Gateway, the Lambda function, and S3.

A typical workflow to upload a file to a serverless application hosted on S3 includes the following steps:

  1. Client submits a request to upload a file.
  2. API Gateway receives the client request and invokes a Lambda function that then generates the S3 presigned URL.
  3. The Lambda function makes a getSignedUrl API call to S3.
  4. S3 returns the presigned URL for the object to be uploaded.
  5. The Lambda function returns a presigned URL to the API.
  6. Client receives the S3 presigned URL to upload the file.
  7. Client uploads the file directly to S3 using the presigned URL.

How to Secure Presigned URLs

When designing a serverless application that utilizes S3 presigned URLs to store data in S3, a developer must consider several primary security aspects. S3 presigned URLs are public resources that do not authenticate users, and anyone in possession of a valid S3 presigned URL can access the associated resource. Consequently, it is important to implement additional security measures to ensure that these URLs are not misused or accessed by unauthorized parties. The following blog post contains techniques you can use to make your presigned URLs more secure.

1. Add a Content-MD5 checksum using the X-Amz-Signed header

When you upload an object to S3, you can include a precalculated checksum of the object as part of your request. S3 will perform an integrity check and verify if the object sent is the same as the object received. S3 supports the use of MD5 checksums to verify the integrity of objects uploaded. You provide the MD5 digest by including a Content-MD5 header in the initial PUT request. Upon receiving the object, S3 will calculate the MD5 digest and compare it with the one you originally provided. The upload operation succeeds only if both MD5 digests match, ensuring end-to-end data integrity. If an unintended party gets their hands on the S3 presigned URL, then they will not be able to use it without possessing the same object. This provides protection against arbitrary file uploads.

The key element for a developer to remember is that when the client uploads the file to the S3 presigned URL, it must supply the correct MD5 in Base64 using the Content-MD5 header. Developers can see a sample serverless application with client-side code to extract the MD5 digest, request a S3 presigned URL, and upload a file in this GitHub repositoryThis sample application uses NodeJS v20 in the Lambda function.

2. Expire the S3 presigned URLs 

An S3 presigned URL remains valid for the period of time specified when the URL is generated. It is important to ensure that the S3 presigned URL does not remain accessible for longer than required as it can be reused when still valid. You can define the expiration time of the S3 presigned URL by either passing X-Amz-Expires as a query parameter or by setting the expiresIn parameter when using the AWS SDK for JavaScript.

S3 validates the expiration time and date at the time of initial HTTP Request. However, to support situations where the connection drops and the client needs to restart uploading a file, you may want your S3 presigned URL to remain valid for the entire anticipated time needed to upload the file to S3. The challenge is to generate an S3 presigned URL that is valid long enough to accommodate the file’s upload, yet still short enough that you prevent reuse.

A solution we propose to overcome these challenges is to dynamically set the S3 presigned URL’s expiration time by using the browser Network Information API. Using this new API, when the client browser places the initial request for an S3 presigned URL, the client also transmits the file’s size and the network type, so the Lambda function can calculate the anticipated transfer time.

Within the Lambda function, we can now estimate the transfer time for this size of file on this type of network, using sample code as featured in this GitHub repository.

With the estimated transfer time calculated, the Lambda function can now request the S3 presigned URL and set the expiresIn parameter to the transfer time, resulting in an S3 presigned URL that is only available for the time needed to upload that size of file on this type of network.

If you are using the AWS SDK, you may also be using AWS Signature Version 4 (SigV4) to sign your requests. To create a defense in depth approach, which will place a ceiling on total expiration time, you can utilize condition keys in bucket policies. For an example policy, see Limiting presigned URL capabilities.

3. Generating a UUID to replace the uploaded filename

When an application allows a user to upload files, the application exposes itself to various security threats, such as path traversal attacks. Path traversal vulnerabilities allow attackers to access files that are not meant to be accessed or to overwrite files outside the intended directory structure. In order to secure your applications against such vulnerabilities, the most effective approach is to incorporate user input validation and sanitization. You can sanitize the filename by replacing it with a generated UUID (Universally Unique Identifier).

You can see an example function in the server-side code for Lambda in this GitHub repository.

4. Applying the Principle of Least Privilege and using a separate Lambda function to create S3 presigned URLs

The capabilities of an S3 presigned URL are constrained by the permissions of the principal that created it. To offer fine-grained access, the very first step in limiting use of an S3 presigned URL should be building a specific Lambda function that generates these URLs. By having a Lambda function dedicated to this purpose, you do not risk an overly permissive Lambda function. The second step is to limit your specific Lambda function’s access to S3.

Adhering to the Principle of Least Privilege, it’s important to restrict the Lambda function’s permissions to only the required prefixes in the bucket and allow it to perform only the required actions on the bucket, instead of granting full bucket access. This minimizes the potential attack surface and mitigates the risk of unintended data exposure or modification. It is important to limit the permissions to the minimum required set of actions and resources.

This example AWS Identity and Access Management (IAM) policy demonstrates how to grant the Lambda function read access (GET) to objects within the "Example-Prefix" prefix of a specific S3 bucket. The IAM policy is attached to the Lambda function via an execution role, which together establish what actions the Lambda function can perform.

{
  "Version": "2012-10-17",
  "Statement": [
    {
      "Sid": "ReadStatement",
      "Action": [
        "s3:GetObject"
      ],
      "Resource": [
        "arn:aws:s3:::EXAMPLE-BUCKET/Example-Prefix/",
        "arn:aws:s3:::EXAMPLE-BUCKET/Example-Prefix/*"
      ],
      "Effect": "Allow"
    }
  ]
}

This example IAM policy demonstrates how to grant the Lambda function permissions to upload (PUT) objects within the "Example-Prefix" prefix of a specific S3 bucket.

{   
    "Version": "2012-10-17",
    "Statement": [
        {   
            "Sid": "UploadStatement",
            "Action": [
                "s3:PutObject",
                "s3:ListBucket"
            ],
            "Resource": [
                "arn:aws:s3:::EXAMPLE-BUCKET/Example-Prefix/",
                "arn:aws:s3:::EXAMPLE-BUCKET/Example-Prefix/*"
            ],
            "Effect": "Allow"
        }
    ]
}

This approach will ensure that your Lambda function possesses the minimum required permissions to perform its intended tasks and reduces the risk of unintended data access or modification.

If you want to restrict the use of S3 presigned URLs and all S3 access to a particular network path, you can also define a network-path restriction policy on the S3 Bucket. This restriction on the bucket requires that all requests to the bucket originate from a specified network. AWS Prescriptive Guidance says, an extension of least privilege is to maintain a data perimeter that’s consistent with your organization’s needs. The goal of an AWS perimeter is to ensure that the access is allowed only if the request is coming from a trusted entity, for trusted resources from a trusted network. These data perimeters are applicable to S3 presigned URLs as well.

5.Creating one-time use S3 presigned URLs

Serverless applications developers may want each S3 presigned URL to only be used once. Developers can incorporate a token-based mechanism to facilitate secure one-time use of an S3 presigned URL. This involves generating unique tokens for each authorized user or client and associating these tokens with the S3 presigned URLs. When a client attempts to access the resource using the S3 presigned URL, they must provide the corresponding token for validation. This additional layer of security ensures that only authorized entities can access the S3 presigned URLs and the associated resources. Furthermore, you can leverage a database to track the issued tokens and expire them after each use. A solution to implement such a mechanism has been discussed in detail in How to securely transfer files with presigned URLs.

Cleaning up

You may clean up the sample application by deleting the API Gateway, Lambda function, and S3 bucket. In addition, please do not forget to delete any IAM execution roles you created for the Lambda function.

Conclusion

In this blog we have discussed various considerations that a developer must make when designing an application that leverages S3 presigned URLs. By incorporating robust security measures, such as proper access control, input sanitization, expiration handling and integrity checks, developers can mitigate potential risks when using S3 presigned URLs.

AI lifecycle risk management: ISO/IEC 42001:2023 for AI governance

Post Syndicated from Abdul Javid original https://aws.amazon.com/blogs/security/ai-lifecycle-risk-management-iso-iec-420012023-for-ai-governance/

As AI becomes central to business operations, so does the need for responsible AI governance. But how can you make sure that your AI systems are ethical, resilient, and aligned with compliance standards?

ISO/IEC 42001, the international management system standard for AI, offers a framework to help organizations implement AI governance across the lifecycle. In this post, we walk through how ISO/IEC 42001 enables effective AI governance, review the risk management requirements, and explore how you can use threat modeling as a practical technique to meet those expectations.

AI governance

AI governance refers to the organizational structures, policies, and controls that enable AI systems to be used responsibly, ethically, and safely. Governance spans the entire AI lifecycle and includes the following activities:

  • Setting the intended purpose and stakeholder alignment
  • Managing data, models, and deployment risks
  • Designing in explainability, bias mitigation, and traceability
  • Establishing accountability, monitoring, and decommissioning practices

These activities are the foundation of a formal framework that you can use to establish governance processes, identify and manage risk, and implement processes for continuous improvement

AI lifecycle

While ISO 42001 provides a framework for AI governance, ISO/IEC 22989:2022 describes what an AI system is and how it evolves. Governance should be implemented at every stage of the AI lifecycle to manage AI risks effectively. According to the ISO/IEC 22989:2022 standard, an organization’s AI life cycle might include these stages:

  1. Inception: Identifying needs, goals, and feasibility
  2. Design and development: Defining system architecture, data flows, and training models
  3. Verification and validation: Testing and confirming that the system meets requirements and performs as intended
  4. Deployment: Releasing the system into its operational environment
  5. Operation and monitoring: Running the system, logging activity, and monitoring performance and outcomes
  6. Re-evaluation: Assessing whether the system continues to meet objectives under changing conditions
  7. Retirement: Decommissioning the system and addressing long-term data and access risks

Understanding the AI lifecycle, shown in Figure 1 that follows, is critical for identifying and mitigating AI risks. While these seven stages are provided directly in ISO 22989:2022, your organization might define its AI lifecycle stages differently to suit its business context. We refer to these stages as we explore the components of an AI management system, from initial AI system scoping, through threat monitoring and risk assessment, to monitoring the established governance program.

Figure 1: Example of AI system lifecycle model stages and high-level processes based on ISO/IEC 22989:2022

Figure 1: Example of AI system lifecycle model stages and high-level processes based on ISO/IEC 22989:2022

Risk management in ISO/IEC 42001:2023

After an organization has identified and assessed AI risks (Clause 6.1 of ISO/IEC 42001:2023), operational controls to mitigate those risks must be implemented (Clause 8.2), and those controls and the AI system itself should be continuously monitored, documented, and improved (Clauses 9 and 10). AI impact assessments (AIIAs) are critical in high-risk use cases, complementing baseline risk assessments by focusing on societal, ethical, and legal impacts. AIIAs are like data protection impact assessments (DPIAs) for high-risk personal data processing under many privacy regulations. DPIAs are specifically designed to assess risks to individuals’ privacy and data protection rights under laws such as the GDPR. While AIIAs help organizations maintain responsible AI governance, DPIAs can be used in parallel to help verify that AI systems comply with data protection laws, together providing a holistic view of risks and safeguards across both ethical and legal dimensions.

You are free to select the AIIA tools or methodologies that best fit your use case. Two widely accepted frameworks are:

  • ISO 31000: A general-purpose enterprise risk management standard that helps identify, evaluate, and treat risks in a structured and repeatable way. It aligns well with organizations seeking to embed AI risk into their broader enterprise risk management (ERM) programs.
  • NIST AI Risk Management Framework (AI RMF): A NIST framework specifically designed for AI systems. It introduces tailored concepts such as explainability, robustness, fairness, and accountability, with actionable guidance organized into four core functions: Map, measure, manage, and govern.

ISO 42001 provides structured methods to conduct risk and impact assessments. Threat modeling tools such as:

  • STRIDE (spoofing, tampering, repudiation, information disclosure, denial of service, and elevation of privilege). STRIDE aims to make sure that a system meets security requirements for confidentiality, integrity and availability.
  • DREAD (damage potential, reproducibility, exploitability, affected users, and discoverability) is a framework that can assess severity of individual threats.
  • OWASP (Open Worldwide Application Security Project) for machine learning (ML) enables analysis of AI system vulnerabilities, adversarial risks, and privacy threats.

Trustworthy AI is the result of strategic governance, structured methodologies, and technical analysis.

Figure 2 that follows shows the tiered structure of AI risk governance, moving from high-level governance to detailed technical assessments. On the left side, there’s a downward flow representing the increasing depth of controls, while the right side shows an upward scale indicating escalating AI risks.

  • At the top layer, ISO/IEC 42001:2023 defines formal requirements for AI governance, including risk assessment mandates, control implementation, and lifecycle oversight.
  • The middle layer features widely adopted risk assessment methodologies and frameworks, such as ISO 31000 and the NIST AI Risk Management Framework (RMF), which provide structured methods to identify, evaluate, and mitigate AI risks.
  • At the base, are detailed threat modeling tools—including STRIDE, DREAD, PASTA, LINDDUN, and OWASP for ML—that support deep analysis of AI systems for vulnerabilities related to security, privacy, data protection, and adversarial threats.

Together, these layers form a comprehensive approach to AI risk governance, aligning strategic oversight with operational and technical defenses.

Figure 2: A layered approach to AI risk management aligned with ISO/IEC 42001. ISO/IEC 42001 defines AI governance for responsible AI

Figure 2: A layered approach to AI risk management aligned with ISO/IEC 42001. ISO/IEC 42001 defines AI governance for responsible AI

Threat modeling for AI risk identification

Threat modeling identifies AI lifecycle technical risks such as exploit surfaces, adversarial threats, and misuse scenarios that complement organizational risk analysis and impact assessments. This post takes a broader AI lifecycle view, showing you how threat modeling complements other risk strategies within the context of ISO/IEC 42001:2023. Additionally, AWS has published AI threat modeling guidance, such as:

The following table is an example STRIDE threat model for a generative AI resource using AWS services by AI lifecycle stage and risk type. This illustrates technical threat remediation through AWS cloud native governance features.

STRIDE category Example threat Lifecycle stage Risk type AWS feature for governance
Spoofing A fake identity uses the AI system to generate phishing emails or misinformation Inception Security AWS IAM Identity Center and Amazon Cognito for multi-factor authentication (MFA), Amazon GuardDuty for threat detection
Tampering A malicious prompt injection or API injection alters the model behavior or bypasses filters Design development Integrity Amazon Bedrock Guardrails, Amazon API Gateway and AWS WAF rules, AWS CloudTrail for input auditing
Repudiation Users deny prompt activity or content creation, and there’s no logging Verification and validation Accountability CloudTrail, Amazon Bedrock invocation logs, Amazon SageMaker ML Lineage Tracking for traceability
Information disclosure Sensitive internal data—such as code or personally identifiable information (PII)—accidentally learned and reproduced by the large language model (LLM) Operation and monitoring Privacy, Security SageMaker Clarify, AWS VPC PrivateLink, AWS Key Management Service (AWS KMS) encryption, Amazon Bedrock data handling commitments
Denial of service Bad actors overload the AI endpoint with prompt spam, degrading service Deployment Availability AWS Shield, API rate limiting using API Gateway, auto scaling with SageMaker endpoints
Elevation of privilege An internal user modifies system prompts or updates to override content filters Reevaluation Ethics and access control AWS Identity and Access Management (IAM) roles, Amazon Bedrock Guardrails, AWS Config, service control policies (SCPs)

While STRIDE is used here for illustrative clarity, it’s just one of several threat modeling approaches that can be applied depending on the system context. Other widely recognized methods include:

By integrating these threat modeling practices into ISO/IEC 42001’s risk-based approach, organizations are not just “checking compliance boxes” they’re operationalizing trustworthy, secure, and accountable AI governance throughout the full system lifecycle.

Threat modeling touchpoints across the AI lifecycle

ISO 42001:2023 uses the STRIDE threat modeling framework to align specific security threats to each stage. Each lifecycle stage is associated with particular threat types, relevant Annex references from the ISO standard, and examples of what to monitor.

  • Inception (Annex A.8.1): Focuses on spoofing and fake identity input risks.
  • Design and Development (Annex A.9.1): Linked to tampering threats.
  • Verification and Validation (Annex A.7.1): Concerns around repudiation, such as lack of model decision logs.
  • Deployment (Annex A.5.1): Addresses information disclosure vulnerabilities.
  • Operation and Monitoring (Annex A.10.3): Maps to denial-of-service attacks.
  • Re-evaluation (Annex A.8.6): Highlights risks of privilege escalation.

AI threat modeling isn’t a one-time task but must be applied continuously across each lifecycle stage, supported by ISO 42001’s annexes and STRIDE categories.

Figure 3: An illustration of how organizations can use ISO/IEC 42001:2023 as a structured framework for AI risk management, using threat modeling as a key technique across the AI lifecycle

Figure 3: An illustration of how organizations can use ISO/IEC 42001:2023 as a structured framework for AI risk management, using threat modeling as a key technique across the AI lifecycle

AWS tools for AI governance and risk management

AWS governance service capabilities support the controls required in the Statement of Applicability (SoA) under ISO/IEC 42001. These services and features help organizations operationalize responsible AI practices at scale and align with ISO/IEC 42001’s emphasis on structured, accountable AI lifecycle management.

  • Amazon SageMaker Model Cards: Provides standardized documentation for ML models including purpose, performance, and limitations. In the governance context, model cards help maintain transparency, accountability, and auditability of model behavior and use.
  • Amazon SageMaker Clarify: Detects bias in datasets and models and supports explainability of predictions. This directly supports governance controls related to fairness, non-discrimination, and explainability.
  • Amazon SageMaker Ground Truth: Provides high-quality, human-in-the-loop data labeling workflows. It supports data governance by making sure labeled datasets are accurate, consistent, and traceable.
  • Amazon Bedrock Guardrails: Can be used to define safety filters for generative AI, such as avoiding toxic content or harmful outputs. This facilitates alignment with ethical and content governance policies.
  • AWS CloudTrail and AWS Config: Enable audit logging and continuous monitoring of system changes. These are essential for accountability, traceability, and compliance reporting within AI governance frameworks.
  • AWS Identity and Access Management (IAM), AWS Key Management Service (AWS KMS), and AWS PrivateLink: IAM controls access, AWS KMS provides encryption and key management, and PrivateLink enables private connectivity. These features are critical for enforcing access governance, securing data, and maintaining privacy standards.
  • AWS Generative AI Lens: A part of the AWS Well-Architected Framework tool. It provides structured guidance for evaluating and improving the design of generative AI systems. It helps organizations implement responsible AI practices, manage risks

Conducting AI impact assessments for high risk use cases

While general risk assessments (Clause 6.1 of ISO/IEC 42001) are required for AI systems, ISO/IEC 42001 also calls for AIIAs in situations where the AI system poses high potential impact to individuals, groups, or society. AIIAs should result in a documented report of identified risks associated with the target AI activity, in addition to the severity of potential negative outcomes. These risks should be integrated into the AI management system (AIM) and monitored over time. Several stakeholders and specialists might need to provide input in the assessment process, such as legal, risk, compliance, data management, and security teams. Identified risks should be mitigated where possible, and a determination made about whether the residual risk is acceptable.

AIIAs help answer questions such as:

  • Is the AI use justifiable, ethical, and proportionate?
  • Could the system cause discrimination, exclusion, or loss of rights?
  • What safeguards should be built to protect affected people?

AIIA is required:

  • If the system makes or informs decisions that materially affect people
  • If the system is deployed in sensitive domains (such as healthcare, finance, or public services)
  • If risks to fundamental rights, fairness, or trust are flagged during initial risk assessments

AIAA should cover:

  • Purpose and scope of the AI system
  • Stakeholder and impact mapping
  • Legal, ethical, and social risk evaluation
  • Transparency and recourse mechanisms
  • Recommendations for mitigation

AIIA process workflow

Figure 4 that follows illustrates a generic AIIA workflow that includes initiating, scoping, assessing impact, planning mitigation, and documenting the outcome to evaluate how an AI system can affect individuals, groups, and society. Organizations can tailor this process to the AI system context, business objectives, and compliance requirements for their use case.

Figure 4: Sample prescriptive process with key phases on conducting an AIIA

Figure 4: Sample prescriptive process with key phases on conducting an AIIA

AIIA outcome

AIIA reports should capture the core purpose of the exercise: to evaluate how an AI system might affect individuals, communities, and society at large and to make sure that potential risks are addressed through appropriate mitigation strategies. While formats might vary across industries, an AIIA outcome typically includes key sections such as summary of system purpose, a mapping of affected stakeholders, a contextual analysis of legal and social factors, an evaluation of likely impacts (including fairness, bias, and autonomy risks) and a plan for a mitigation, oversight, and monitoring. Governance details such as sign off responsibility and reassessment triggers should also be included.

Whether you’re starting from scratch or adapting an existing template, these foundational elements will help make sure that your documentation supports transparency, accountability, and ethical AI deployment.

Templates:

Mapping AI lifecycle risks to ISO/IEC 42001 controls

After you have identified risks through techniques such as threat modeling and impact assessments, the next step is to make sure that they’re mitigated through the appropriate ISO/IEC 42001 controls. Using the lifecycle stages defined in ISO/IEC 22989:2022, you can map AI risks identified during the threat hunting process to the corresponding ISO/IEC 42001:2023 clauses and Annex A controls. This mapping helps you align your AI development and governance efforts with a standards-based risk framework.

AI lifecycle stage Identified risk Relevant ISO/IEC 42001 clauses Risk mitigation – Annex A controls
Inception Spoofing: Impersonation Clause 4, Clause 5 A.6.1 (Governance roles), A.5.1
Design and development Tampering: Unauthorized changes Clause 6.1, Clause 8.2 A.8.2, A.9.1
Verification and validation Repudiation: No traceability Clause 8.2 A.8.5, A.7.1
Deployment Elevation of privilege: Unauthorized model tweaks Clause 8.2, Clause 9.1 A.10.2, A.6.1
Operation and monitoring Denial of service: System overload Clause 9.1, Clause 10.1 A.8.3, A.10.3
Re-evaluation Drift and new threat vectors Clause 9.3, Clause 10.2 A.10.2, A.6.4
Retirement Information disclosure: Residual risks Clause 8.3, Clause 10.2 A.9.4, A.5.2

Maintaining AI governance

Like most technology risk and governance programs, AI management must be continuously monitored and maintained. ISO 42001 requires an organization to have leadership support and sufficient resources to operate effectively over time. This means that AI governance should be built into every process in the AI development and maintenance journey. AIIAs and threat modeling should be conducted at least annually on existing systems, and prior to the deployment of any new AI function. Policies should be reviewed at least annually and after major change to the AI system. Internal audits should review and monitor compliance with controls continuously, and organizations seeking ISO certification will require annual external audits. Progress toward governance goals and metrics on the status of known AI risks should be reported to the highest level of leadership in a live dashboard, and incidents of negative outcomes related to AI use should be tracked and analyzed to improve the AI system.

Conclusion

Managing AI risk effectively means aligning technical, organizational, and ethical considerations throughout the AI system lifecycle. ISO/IEC 42001 provides structure and accountability. Threat modeling techniques such as STRIDE, MITRE ATLAS, and OWASP for LLM surface deep technical risks. AWS services and features such as SageMaker Model Cards, SageMaker Clarify, and Amazon Bedrock Guardrails help embed governance into layers of AI development.

By combining technical tools, structured assessments, and standards-driven controls, you can build AI systems that are trustworthy, resilient, and aligned with societal expectations.

For additional guidance on achieving, maintaining, and automating compliance in the cloud, contact AWS Security Assurance Services (AWS SAS) or their account team. AWS SAS is a PCI QSAC and HITRUST Assessor Firm that can help by tying together applicable audit standards to AWS service specific features and functionality. They help you build on frameworks such as ISO 42001, PCI DSS, HITRUST CSF, NIST-CSF and Privacy Framework, SOC 2, HIPAA, ISO 27001 and 27701, and more. In addition, AWS Professional Services can also help you plan and map your compliance journey.

Disclaimer: The risk strategies and threat modeling guidance shared in this blog are intended to provide general direction and practical insight into implementing AI risk management under ISO/IEC 42001:2023. However, organizations are responsible for conducting their own context-specific risk assessments, as mandated by the standard. This blog should not be interpreted as an exhaustive approach to or guarantee of compliance with ISO/IEC 42001.

If you have feedback about this post, submit comments in the Comments section below.

Abdul Javid

Abdul Javid

Abdul is a Senior Security Assurance Consultant and a PECB ISO 42001 Lead Auditor and IAPP Certified AI Governance Professional. He draws on his extensive experience to guide AWS customers on compliance matters. He holds an M.S. in Computer Science from IIT Chicago and numerous certifications from IAPP, AWS, ISO, HITRUST, ISACA, PMI, PCI DSS, and ISC2.

Amber Welch

Amber Welch

Amber is a Senior Privacy Consultant with AWS Security Assurance Services and a PECB-certified ISO 42001 Lead Auditor. With extensive security and privacy management experience across industries, she advises AWS customers on compliance and risk management. She holds an M.A. in English – Technical Communication, CIPM and CIPP-E certifications, and is a thought leader in AI privacy, contributing to the AWS Privacy Reference Architecture.

Best practices for least privilege configuration in Amazon MWAA

Post Syndicated from Elizabeth Davis original https://aws.amazon.com/blogs/big-data/best-practices-for-least-privilege-configuration-in-amazon-mwaa/

Amazon Managed Workflows for Apache Airflow (Amazon MWAA) provides a secure and managed environment to run Apache Airflow on AWS. Airflow is often used in highly regulated industries, such as finance and healthcare. These customers might want to further restrict access and traffic to enhance security posture than what the Amazon MWAA default configurations provide. This post covers some recommended practices.

The principle of least privilege is a fundamental tenet that should be followed diligently. When it comes to configuring AWS services, it’s essential to grant only the minimum required permissions to resources, avoiding overly broad or permissive policies.

In this post, we explore how to apply the principle of least privilege to your Amazon MWAA environment by tightening network security using security groups, network access control lists (ACLs), and virtual private cloud (VPC) endpoints. We also discuss the Amazon MWAA execution and deployment roles and their respective permissions.

Understanding the Amazon MWAA environment

When an Amazon MWAA environment is created, resources are created in an AWS managed service VPC and your customer managed VPC. In the customer VPC provided at environment creation, the necessary resources to run the Airflow environment are deployed, including schedulers and workers running on Amazon Elastic Container Service (Amazon ECS) clusters. These clusters are deployed in your VPC and they assume Elastic Network Interfaces (ENIs) with private IP addresses in the customer account. These ENIs span private subnets across two Availability Zones to connect to the Airflow database and web server, which reside in the service-owned account (if in private access mode). The following diagram illustrates this architecture.

MWAA Architecture

VPC security groups act as virtual firewalls that can control network traffic at the ENI level, or instance level. Security groups are stateful, meaning that inbound traffic is automatically permitted outbound and vice versa. The default security group configuration in a VPC starts with is no inbound rules and an outbound rule allowing all traffic. By definition, a security group with no inbound rules denies all ingress traffic that wasn’t allowed out through the 0.0.0.0/0 outbound rule.

Amazon MWAA offers two web server access modes inside the customer VPC: public and private. Public web server mode must have a way for traffic to access the web servers in the customer-owned VPC through the public internet. This requires routing to the public internet using public subnets and a NAT gateway. A NAT gateway can be used to provide internet access for resources in private subnets. With private access mode, the security group for the Amazon MWAA environment doesn’t need to allow traffic to and from the NAT gateway, only granting access to the Airflow UI to users with appropriate permissions from within the VPC. An Application Load Balancer is only provisioned in public mode to route traffic to the public web servers. The customer must provision the rest of the networking components.

If your Amazon MWAA environment needs to communicate with resources outside your VPC (such as external data sources or APIs), you might need to configure appropriate security group rules and routing to allow the necessary traffic. In such cases, you would typically use a NAT gateway or VPN connection to facilitate the communication between your Amazon MWAA environment and the external resources and VPC endpoints for AWS resources.

For tighter security restrictions, an environment with private routing without internet access is possible, and finer-grained security group rules can be applied and VPC endpoint policies can be used. Because this post is focusing on least privilege, we will focus on the minimum security requirements needed for an Amazon MWAA environment.

Security groups: Minimizing permissions

Your Amazon MWAA environment will have a security group associated with your VPC’s environment resources. This security group is also used by the ENIs created by the interface VPC endpoint that is used to communicate with the database and web server. By default, security groups deny all inbound traffic and security group rules need to be explicitly stated, denoting the ports and source that the instance will allow network traffic from. At a minimum, the Amazon MWAA environment must allow for traffic to and from the Amazon Aurora PostgreSQL-Compatible Edition metadata database that is owned and managed by Amazon MWAA. The metadata database is a crucial component of Airflow that acts as a centralized source of truth for task execution, configuration, and monitoring. Both the scheduler and workers require access to this database to perform their respective roles in orchestrating and running tasks. This database listens on TCP port 5432. Additionally, the web server traffic can be restricted to HTTPS through TCP port 443. At a minimum, the Amazon MWAA security group must have the two inbound rules, detailed in the following table.

Type Protocol Port Range Source Type Source
Custom TCP TCP 5432 Custom sg-xxxxx / my-mwaa-vpc-security-group
HTTPS TCP 443 Custom sg-xxxxx / my-mwaa-vpc-security-group

Many customers have other AWS resources residing in VPCs, to which the Amazon MWAA workers need access. These resources can be granted network access in a private routing configuration using security groups as well. If the resource sits in the same security group, add an additional inbound rule with the port needed. For example, if an Amazon Redshift cluster sits in the same security group, add the following rule.

Type Protocol Port Range Source Type Source
Custom TCP TCP 5439 Custom sg-xxxxx / my-mwaa-vpc-security-group

If the Redshift cluster is in a different security group, change the source to the Redshift security group.

Type Protocol Port Range Source Type Source
Custom TCP TCP 5439 Custom sg-xxxxx / redshift-security-group

If the resources are in another VPC, then VPC peering must be enabled before referencing that other VPC’s security group. For resources that don’t reside in a subnet, a VPC endpoint will also provide private routing to and from the Amazon MWAA environment and those resources. For example, a VPC endpoint for Amazon Simple Storage Service (Amazon S3) can provide enhanced security, improved performance, and lower costs.

Network ACLs: Minimizing permissions

Network ACLs can manage (by allow or deny rules) inbound and outbound traffic at the subnet level. An ACL is stateless, which means that inbound and outbound rules must be specified separately and explicitly. It is used to specify the types of network traffic that are allowed in or out from the instances in a VPC network.

Every Amazon VPC has a default ACL that allows all inbound and outbound traffic, with a rule as follows.

Rule number Type Protocol Port Range Source Allow/Deny
100 All IPv4 traffic All All 0.0.0.0/0 Allow
* All IPv4 traffic All All 0.0.0.0/0 Deny

You can edit the default ACL rules or create a custom ACL and attach it to your subnets. A subnet can only have one ACL attached to it at any time, but one ACL can be attached to multiple subnets. To implement least privilege in your Amazon MWAA environment, restrict the inbound ACL to allow traffic from the metadata database and web server and restrict the outbound to allow traffic to only the clients in the private subnet. Note the following examples use example private IPs for the subnets used.

Inbound NACL

Rule number Type Protocol Port Range Source Allow/Deny Comments
100 Custom TCP TCP 5432 10.192.21.0/16 Allow Allow inbound database traffic from private subnet
110 HTTPS TCP 443 10.192.21.0/16 Allow Allow inbound HTTPS traffic from private subnet
* All traffic All All 0.0.0.0/0 Deny Denies all inbound IPv4 traffic not already handled by a preceding rule (not modifiable)

Outbound NACL

Rule number Type Protocol Port Range Source Allow/Deny Comments
100 Custom TCP TCP 1024-65535 10.192.21.0/24 Allow Allows outbound return IPv4 traffic to clients in private subnet
* All traffic All All 0.0.0.0/0 Deny Denies all outbound IPv4 traffic not already handled by a preceding rule (not modifiable)

VPC endpoints: Minimizing permissions

When you create an Amazon MWAA environment, it is deployed within a VPC. This allows you to control the network access and security of your Airflow deployment. However, some customer workloads executing in the Amazon MWAA environment might need to orchestrate tasks using other AWS services, such as Amazon S3 to access files, AWS Glue to start ETL (extract, transform, and load) jobs, or Amazon Redshift for running data warehouse queries, which reside outside of your VPC. To establish a secure and private connection between your Amazon MWAA environment and these external AWS services, you can use VPC endpoints. The purpose of VPC endpoints in Amazon MWAA is to provide a secure and private connection between your Amazon MWAA environment and other AWS services within your VPC. VPC endpoints are virtual devices that are provisioned within your VPC and act as an entry point for the specified AWS service, allowing your Amazon MWAA environment to communicate with the service using a private IP address, without needing to go through the public internet. The following diagram illustrates this architecture.

VPCEndpointsMWAA

VPC endpoints allow you to keep your Amazon MWAA environment’s network traffic within the AWS network, reducing the exposure to the public internet and enhancing the overall security of your Airflow deployment. Although private VPC endpoints are automatically created for the database and web server, to create a least privileged environment without internet access, additional VPC endpoints will be needed for the additional Amazon MWAA required resources. Amazon S3, Amazon Simple Queue Service (Amazon SQS), Amazon CloudWatch, and optionally AWS Key Management Service (AWS KMS) will need VPC endpoints created. For more details, see Creating the required VPC service endpoints in an Amazon VPC with private routing. Outside of the necessary services, many customers run Amazon MWAA workflows that orchestrate additional AWS services, such as Amazon Redshift, Amazon EMR, and AWS Glue. Let’s look at an example VPC endpoint that we want to use to connect to Amazon Redshift, which is commonly called in the Airflow DAGS using the Redshift Operator for workflows that interact with Amazon Redshift as a data warehouse. For more information on creating Amazon VPC interface endpoints, see Access an AWS service using an interface VPC endpoint.

Create a VPC endpoint

Complete the following steps to create a VPC endpoint using Amazon Virtual Private Cloud (Amazon VPC):

  1. On the Amazon VPC console, create a new VPC endpoint for the amazonaws.region.redshift service, where region is the AWS Region where your Amazon MWAA environment and Redshift cluster are located. Make sure that private DNS is enabled.
  2. Create a VPC endpoint policy. This can be used to limit access to the Redshift cluster only to the Amazon MWAA environment, preventing unauthorized access from other resources. The following is an example policy:
{
  "Version": "2012-10-17",
  "Statement": [
    {
      "Effect": "Allow",
      "Principal": {
        "AWS": [
          "arn:aws:iam::123456789012:role/YourMWAAExecutionRoleName"
        ]
      },
      "Action": [
        "redshift:DescribeClusters",
        "redshift:DescribeClusterParameters",
        "redshift:DescribeClusterSecurityGroups",
        "redshift:DescribeClusterSubnetGroups",
        "redshift:DescribeEventSubscriptions",
        "redshift:DescribeLoggingStatus",
        "redshift:DescribeReservedNodeOfferings",
        "redshift:DescribeReservedNodes",
        "redshift:DescribeTableRestoreStatus",
        "redshift:DescribeTags",
        "redshift:GetClusterCredentials",
        "redshift:ListTagsForResource",
        "redshift:PurchaseReservedNodeOffering",
        "redshift:ResetClusterParameterGroup",
        "redshift:RestoreFromClusterSnapshot",
        "redshift:RevokeClusterSecurityGroupIngress",
        "redshift:RevokeSnapshotAccess",
        "redshift:ViewQueriesInConsole"
      ],
      "Resource": "arn:aws:redshift:us-east-1:123456789012:cluster/my-redshift-cluster"
    }
  ]
}

The policy contains the following parameters:
  • The Version field specifies the policy language version.
  • The Statement section contains a single statement that allows the specified actions on the Redshift cluster.
  • The Effect field is set to Allow, which means the policy grants the specified permissions.
  • The Principal field specifies the AWS Identity and Access Management (IAM) role associated with your Amazon MWAA execution role, which is authorized to access the Redshift cluster.
  • The Action field lists the specific Redshift actions that the Amazon MWAA execution role is allowed to perform, such as describing the cluster, getting cluster credentials, and restoring from a snapshot.
  • The Resource field specifies the Amazon Resource Name (ARN) of the Redshift cluster that the policy applies to.
  1. Associate the VPC endpoint with the correct route table. This route table should be used by the subnets where your Amazon MWAA environment is deployed. If using a VPC interface endpoint, associate the endpoint with the two private subnets and security group used by Amazon MWAA.
  2. Make sure that the security groups associated with the Amazon MWAA environment and the Redshift cluster allow the necessary inbound and outbound traffic between them. This typically includes allowing access on the Redshift port (typically 5439) from the Amazon MWAA environment’s security group.
  3. On the Amazon MWAA console, under Admin, Connections, update the Redshift connection details to use the VPC endpoint address instead of the public Redshift endpoint. This makes sure that the connection between Amazon MWAA and Amazon Redshift is secure and stays within the VPC.

By configuring VPC endpoints for the AWS services your Amazon MWAA environment needs to access, you can provide secure, private, and efficient communication between your Airflow deployment and AWS resources.

Restricting traffic within AWS with a customer managed endpoints for Amazon MWAA resources

As mentioned earlier, Amazon MWAA integrates with various AWS services, such as CloudWatch for logging, Amazon S3 for DAGs and requirements, Amazon SQS as a messaging middleware, and optionally AWS KMS for encryption. You can create VPC endpoints for these services to make sure traffic stays within the AWS network. Access to these endpoints can be restricted by allowing only the Amazon MWAA security group as the ingress source. For details on how to create these endpoints and policies, see Introducing shared VPC support on Amazon MWAA. If the Amazon MWAA environment was updated after April 2, 2024, it will be on AWS Fargate v1.4 and will not use Amazon Elastic Container Registry (Amazon ECR) and therefore you will not need to create a VPC endpoint for it.

Managing permissions to deploy an Amazon MWAA environment

To create and deploy an Amazon MWAA environment, you need to have the appropriate permissions granted to your IAM user or role. The required permissions can be granted through an IAM policy attached to your user or role. When you create an Amazon MWAA environment, you can specify an execution role that will be assumed by the Airflow workers to perform tasks. The execution role should have the necessary permissions to access the required AWS services and resources based on your workflow requirements. It’s important to follow the principle of least privilege when granting permissions to IAM roles and users. You should only grant the minimum permissions required for your Amazon MWAA environment and Airflow workflows to function correctly.

Amazon MWAA trust policy

Amazon MWAA needs to be able to assume the execution role in order to perform actions on your behalf.  To do this, create a trust policy, allowing the Amazon MWAA service the ability to AssumeRole. To avoid the confused deputy problem, we add a condition to the trust policy, and replace the AWS account number and Region as needed. The following is an example policy:

{
    "Version": "2012-10-17",
    "Statement": [
      {
        "Effect": "Allow",
        "Principal": {
            "Service": ["airflow.amazonaws.com","airflow-env.amazonaws.com"]
        },
        "Action": "sts:AssumeRole",
        "Condition":{
            "ArnLike":{
               "aws:SourceArn":"arn:aws:airflow:your-region:123456789012:environment/your-environment-name"
            },
            "StringEquals":{
               "aws:SourceAccount":"123456789012"
            }
         }
      }
   ]
}

VPC endpoint permissions for the deployer role

Although the service-linked role creates the VPC endpoints, the deployer role requires permissions to create VPC endpoints and perform a dry run. You can limit these permissions by allowing the ec2:CreateVpcEndpoint action and specifying resource ARNs for VPC endpoints, VPCs, subnets, and security groups. Additionally, you can use the aws:CalledVia condition key to restrict access to the airflow.amazonaws.com service.

Amazon MWAA execution role: Required permissions

When creating an Amazon MWAA environment, you need to specify an execution role that grants the necessary permissions for Airflow to interact with other AWS services. Instead of using a wildcard policy, you can create a custom policy with the minimum required permissions.

The following is an example of an execution role policy that allows Amazon MWAA to interact with various services using an AWS managed key:

{
    "Version": "2012-10-17",
    "Statement": [
        {
            "Effect": "Allow",
            "Action": "airflow:PublishMetrics",
            "Resource": "arn:aws:airflow:{your-region}:{your-account-id}:environment/{your-environment-name}"
        },
        { 
            "Effect": "Deny",
            "Action": "s3:ListAllMyBuckets",
            "Resource": [
                "arn:aws:s3:::{your-s3-bucket-name}",
                "arn:aws:s3:::{your-s3-bucket-name}/*"
            ]
        },
        { 
            "Effect": "Allow",
            "Action": [ 
                "s3:GetObject*",
                "s3:GetBucket*",
                "s3:List*"
            ],
            "Resource": [
                "arn:aws:s3:::{your-s3-bucket-name}",
                "arn:aws:s3:::{your-s3-bucket-name}/*"
            ]
        },
        {
            "Effect": "Allow",
            "Action": [
                "logs:CreateLogStream",
                "logs:CreateLogGroup",
                "logs:PutLogEvents",
                "logs:GetLogEvents",
                "logs:GetLogRecord",
                "logs:GetLogGroupFields",
                "logs:GetQueryResults"
            ],
            "Resource": [
                "arn:aws:logs:{your-region}:{your-account-id}:log-group:airflow-{your-environment-name}-*"
            ]
        },
        {
            "Effect": "Allow",
            "Action": [
                "logs:DescribeLogGroups"
            ],
            "Resource": [
                "*"
            ]
        },
        {
            "Effect": "Allow",
            "Action": [
                "s3:GetAccountPublicAccessBlock"
            ],
            "Resource": [
                "*"
            ]
        },
        {
            "Effect": "Allow",
            "Action": "cloudwatch:PutMetricData",
            "Resource": "*"
        },
        {
            "Effect": "Allow",
            "Action": [
                "sqs:ChangeMessageVisibility",
                "sqs:DeleteMessage",
                "sqs:GetQueueAttributes",
                "sqs:GetQueueUrl",
                "sqs:ReceiveMessage",
                "sqs:SendMessage"
            ],
            "Resource": "arn:aws:sqs:{your-region}:*:airflow-celery-*"
        },
        {
            "Effect": "Allow",
            "Action": [
                "kms:Decrypt",
                "kms:DescribeKey",
                "kms:GenerateDataKey*",
                "kms:Encrypt"
            ],
            "Resource": "arn:aws:kms:your-region:your-account-id:key/your-kms-cmk-id",
            "Condition": {
                "StringLike": {
                    "kms:ViaService": [
                        "sqs.{your-region}.amazonaws.com",
                        "s3.{your-region}.amazonaws.com"
                    ]
                }
            }
        }
    ]
}

This policy grants Amazon MWAA the necessary permissions to interact with CloudWatch Logs, Amazon S3, Amazon SQS, and AWS KMS when using the AWS managed key offering, while explicitly specifying the resources it can access. You can further refine this policy based on your specific requirements.

The following is an example of an execution policy that allows Amazon MWAA to interact with various services using a KMS customer managed key:

{
    "Version": "2012-10-17",
    "Statement": [
        { 
            "Effect": "Deny",
            "Action": "s3:ListAllMyBuckets",
            "Resource": [
                "arn:aws:s3:::{your-s3-bucket-name}",
                "arn:aws:s3:::{your-s3-bucket-name}/*"
            ]
        }, 
        { 
            "Effect": "Allow",
            "Action": [ 
                "s3:GetObject*",
                "s3:GetBucket*",
                "s3:List*"
            ],
            "Resource": [
                "arn:aws:s3:::{your-s3-bucket-name}",
                "arn:aws:s3:::{your-s3-bucket-name}/*"
            ]
        },
        {
            "Effect": "Allow",
            "Action": [
                "logs:CreateLogStream",
                "logs:CreateLogGroup",
                "logs:PutLogEvents",
                "logs:GetLogEvents",
                "logs:GetLogRecord",
                "logs:GetLogGroupFields",
                "logs:GetQueryResults"
            ],
            "Resource": [
                "arn:aws:logs:{your-region}:{your-account-id}:log-group:airflow-{your-environment-name}-*"
            ]
        },
        {
            "Effect": "Allow",
            "Action": [
                "logs:DescribeLogGroups"
            ],
            "Resource": [
                "*"
            ]
        },
        {
            "Effect": "Allow",
            "Action": [
                "s3:GetAccountPublicAccessBlock"
            ],
            "Resource": [
                "*"
            ]
        },
        {
            "Effect": "Allow",
            "Action": "cloudwatch:PutMetricData",
            "Resource": "*"
        },
        {
            "Effect": "Allow",
            "Action": [
                "sqs:ChangeMessageVisibility",
                "sqs:DeleteMessage",
                "sqs:GetQueueAttributes",
                "sqs:GetQueueUrl",
                "sqs:ReceiveMessage",
                "sqs:SendMessage"
            ],
            "Resource": "arn:aws:sqs:{your-region}:*:airflow-celery-*"
        },
        {
            "Effect": "Allow",
            "Action": [
                "kms:Decrypt",
                "kms:DescribeKey",
                "kms:GenerateDataKey*",
                "kms:Encrypt"
            ],
            "Resource": "arn:aws:kms:{your-region}:{your-account-id}:key/{your-kms-cmk-id}",
            "Condition": {
                "StringLike": {
                    "kms:ViaService": [
                        "sqs.{your-region}.amazonaws.com",
                        "s3.{your-region}.amazonaws.com"
                    ]
                }
            }
        }
    ]
}

For the use case of using the customer managed key, attach the following JSON policy to the key to provide access to the Airflow logs in CloudWatch Logs:

{
    "Sid": "Allow logs access",
    "Effect": "Allow",
    "Principal": {
        "Service": "logs.{your-region}.amazonaws.com"
    },
    "Action": [
        "kms:Encrypt*",
        "kms:Decrypt*",
        "kms:ReEncrypt*",
        "kms:GenerateDataKey*",
        "kms:Describe*"
    ],
    "Resource": "*",
    "Condition": {
        "ArnLike": {
            "kms:EncryptionContext:aws:logs:arn": "arn:aws:logs:{your-region}:{your-account-id}:*"
        }
    }
}

You can attach multiple policies to the execution role as needed to allow your workers to access additional AWS resources. For example, let’s explore how to enable Amazon EMR access. You can create a JSON policy that contains the narrowest permissions you can configure, as in the following example:

{
    "Version": "2012-10-17",
    "Statement": [
        {
            "Effect": "Allow",
            "Action": [
                "elasticmapreduce:DescribeStep",
                "elasticmapreduce:AddJobFlowSteps",
                "elasticmapreduce:RunJobFlow"
            ],
            "Resource": "arn:aws:elasticmapreduce:*:xxxxxxxxxxxx:cluster/*"
        },
        {
            "Effect": "Allow",
            "Action": "iam:PassRole",
            "Resource": [
                "arn:aws:iam::xxxxxxxxxxxx:role/EMR_EC2_DefaultRole",
                "arn:aws:iam::xxxxxxxxxxxx:role/EMR_DefaultRole"
            ]
        }
    ]
}

Conclusion

In this post, we discussed best practices for least privilege configuration in Amazon MWAA. By following these approaches, you can adhere to the principle of least privilege and maintain a secure posture within your Amazon MWAA environment, without compromising functionality or relying on overly permissive policies. Security is always top priority; to learn more about security in Amazon MWAA, see Security in Amazon Managed Workflows for Apache Airflow and Security best practices on Amazon MWAA.


About the Authors

elizaws-headshotElizabeth Davis is a Sr Solutions Architect at Amazon Web Services (AWS). She currently works with educational technology companies and has a passion for serverless and data orchestration technologies. She has been an Amazon MWAA as a subject matter expert (SME) for the last 3+ years.

mark headshotMark Richman is a Principal Solutions Architect at Amazon Web Services with 30 years of experience building complex web and enterprise software. He contributes to Apache Airflow, bringing his expertise in cloud computing and serverless technologies to the open-source platform. Mark is also an accomplished writer and speaker who has authored commercial publications and AWS courses while regularly presenting at industry events.

Combining Snyk’s Insight with Amazon Q Developer’s Assistance to Streamline Secure Development

Post Syndicated from Omar Faruk original https://aws.amazon.com/blogs/devops/combining-snyks-insight-with-amazon-q-developers-assistance-to-streamline-secure-development/

Developers today face a constant balancing act – building new features and functionality while also ensuring the security and reliability of their codebase. Two powerful tools, Snyk and Amazon Q Developer, can work in tandem to help developers navigate this challenge with greater efficiency and efficacy.

Snyk is a leading developer security platform that empowers developers to seamlessly secure their code, open-source dependencies, container images, and cloud infrastructure all from a single, unified platform. Amazon Q Developer is a generative AI-powered assistant designed to accelerate a variety of tasks across the software development lifecycle. By combining the security insights from Snyk with the assistive capabilities of Amazon Q Developer, developers can streamline their workflows and focus on delivery.

Getting started with Amazon Q Developer and Snyk IDE Plugins

To get started with Amazon Q Developer, you need to have an AWS Builder ID or be part of an organization with an AWS IAM Identity Center instance that allows you to use Amazon Q. To use Amazon Q Developer agents for software development in Visual Studio Code, start by installing the Amazon Q extension. Find the latest version of the extension on the Amazon Q Developer page. The extension is also available for JetBrains, Eclipse (Preview), and Visual Studio IDEs. For a detailed list of supported IDEs and the features available in each, refer to the Amazon Q Developer documentation.

To get started with Snyk, sign up for a free Snyk account or log in with your existing account. To use Snyk in your IDE to automatically find security issues, review the IDE documentation and install Snyk using your IDE extension marketplace. After Snyk is installed, navigate to the Snyk panel in your IDE and follow the on-screen instructions to authenticate with your Snyk account.

After authenticating, Snyk will automatically scan your entire codebase for security issues. Snyk will continue scanning periodically as you write code or generate code with Amazon Q Developer.

Walkthrough

Let’s explore how Snyk and Amazon Q Developer can be used together through a few examples. Imagine that you maintain an open-source project. As a new Snyk user, you would like to find and fix the security issues in the project. In this first and simple scenario, Snyk has identified many cases of security vulnerabilities in specific lines of code. Among the vulnerabilities, we’ll focus on the Information Exposure vulnerability.

Snyk's IDE plugin shares a list of vulnerabilities and an overview, such as the line of code with the vulnerability and detail, of the vulnerability when it is selected.

Figure 1 – Snyk IDE Plugin displaying vulnerability analysis of an Information Exposure issue, showing severity, affected code, and prevention tips.

Rather than manually researching and implementing the fix, you can simply highlight the flagged line, invoke Amazon Q Developer’s inline chat by pressing ⌘+I (Mac) or Ctrl+I (Windows), and request assistance. Amazon Q Developer will analyze the issue, propose the necessary code changes, and provide you with an inline diff to review and accept. This allows for rapid remediation of security flaws saving time while improving the code.

Activating inline Q Developer and making a prompt for the agent to resolve the information exposure vulnerability identified by Snyk.

Figure 2 – Activating Amazon Q Developer inline code generation to fix the detected information exposure vulnerability.

We are happy with the change Amazon Q Developer proposed, so we’ll simply hit enter to accept the suggestions. Of course, we could always hit escape to reject the suggestion if needed.

Q Developer makes an inline code suggestion to resolve the information exposure vulnerability.

Figure 3 – Amazon Q Developer displaying an inline code generation to fix the detected information exposure vulnerability.

In addition to the inline chat, you can pass the vulnerability details directly from the Snyk plugin’s Problems view into the Amazon Q Developer /dev agentic capability.

In the chat interface of Q Developer, the /dev agentic capability allows longer conversation, broader workspace context, and handle changes within multiple files and topics. When this workflow is invoked, the Amazon Q Developer Agent will generate code based on the description and existing code in the workspace, provide a list of suggestions to review and add to the workspace, and if needed, iterate on the code based on feedback.

Copying the information of the information exposure vulnerability from Snyk plugin and requesting a fix using /dev agent capability.

Figure 4 – Using Amazon Q’s /dev agent to implement project-wide fixes for Snyk-detected vulnerabilities across multiple files.

Not all issues are trivial as the prior example. In a more complex case, Snyk may surface a vulnerability that requires a deeper understanding of the code and the potential risk. Let’s look at another issue that Snyk identified in the project we have been discussing.

Snyk identified cross-site scripting vulnerability and explains the line of code, details, and prevention tips of the vulnerability.

Figure 5 – Snyk Plugin highlighting a cross-site scripting (XSS) vulnerability, showing the affected code line and prevention recommendations.

Here, you can switch to Amazon Q Developer’s chat interface, provide the details of the issue, and ask for a more thorough explanation. Amazon Q Developer can then dive into the codebase, explain the problem in detail, and walk you through the appropriate fixes. This collaborative approach empowers developers to make informed decisions and gain broader knowledge, rather than simply implementing a suggestion.

Chat interface that takes a prompt from user to explain why Snyk flagged an cross-site scripting vulnerability and its impact.

Figure 6 – Amazon Q Developer’s chat interface explaining an XSS vulnerability and its security implications through natural language dialogue.

Note that Amazon Q Developer provides links to documentation and other sources for further reading. In addition, you can continue discussing the issue to learn more. For example, imagine that you want to understand real world breaches that have occurred as a result of the issues that Synk has identified. Q provides a few examples for me to learn more.

A natural language query in the chat interface if there has been any major breaches caused by the issue of cross-site scripting. Q responds with popular and impactful incidents.

Figure 7 – Amazon Q Developer discussing notable real-world XSS breach examples and their security impacts.

Beyond fixing issues, Amazon Q Developer can also assist with other development tasks identified by Snyk, such as updating dependencies, refactoring code, or optimizing cloud infrastructure. By integrating these two tools, developers can streamline security scanning, issue investigation, and remediation, dramatically increasing their overall productivity.

Conclusion

In this blog, we took a look at how Snyk and Amazon Q Developer are a powerful duo in the modern developer’s toolkit. Integrating Snyk’s leading security insights with the generative AI capabilities of Amazon Q Developer empowers developers to more efficiently identify, comprehend, and address security vulnerabilities. This combination enables developers to upskill and enhance their own abilities as they work to resolve security issues. Get started with installing the Amazon Q Developer in the IDE and Snyk plugin.


Connect with AWS Partner Snyk.

Snyk – AWS Partner Spotlight

Snyk empowers the world’s developers to build secure applications and equip security teams to meet the demands of the digital world. Used by 1,200 customers worldwide, Snyk’s Developer Security Platform automatically integrates with a developer’s workflow and is purpose-built for security teams to collaborate with their development teams.

Snyk on AWS Marketplace

About the authors:

Omar Faruk

Omar Faruk is a DevOps Partner Solutions Architect at Amazon Web Services. He helps DevSecOps partners to design, build and operate their and shared customers’ workloads in AWS. He is passionate about CI/CD, Infrastructure as Code, and next-generation developer experience. Outside work, he enjoys family time and travel.

David Schott

David is a seasoned DevSecOps Solutions Engineer with 15+ years of experience helping Fortune 100 companies optimize their software delivery security and efficiency. After driving DevOps adoption and CI development at CloudBees, he now focuses on DevSecOps at Snyk, where he collaborates with strategic partners to enable secure innovation at scale.

How we simplified NCMEC reporting with Cloudflare Workflows

Post Syndicated from Mahmoud Salem original https://blog.cloudflare.com/simplifying-ncmec-reporting-with-cloudflare-workflows/

Cloudflare plays a significant role in supporting the Internet’s infrastructure. As a reverse proxy by approximately 20% of all websites, we sit directly in the request path between users and the origin, helping to improve performance, security, and reliability at scale. Beyond that, our global network powers services like delivery, Workers, and R2 — making Cloudflare not just a passive intermediary, but an active platform for delivering and hosting content across the Internet.

Since Cloudflare’s launch in 2010, we have collaborated with the National Center for Missing and Exploited Children (NCMEC), a US-based clearinghouse for reporting child sexual abuse material (CSAM), and are committed to doing what we can to support identification and removal of CSAM content.

Members of the public, customers, and trusted organizations can submit reports of abuse observed on Cloudflare’s network. A minority of these reports relate to CSAM, which are triaged with the highest priority by Cloudflare’s Trust & Safety team. We will also forward details of the report, along with relevant files (where applicable) and supplemental information to NCMEC.

The process to generate and submit reports to NCMEC involves multiple steps, dependencies, and error handling, which quickly became complex under our original queue-based architecture. In this blog post, we discuss how Cloudflare Workflows helped streamline this process and simplify the code behind it.

Life before Cloudflare Workflows

When we designed our latest NCMEC reporting system in early 2024, Cloudflare Workflows did not exist yet. We used the Workers platform Queues as a solution for managing asynchronous tasks, and structured our system around them.

Our goal was to ensure reliability, fault tolerance, and automatic retries. However, without an orchestrator, we had to manually handle state, retries, and inter-queue messaging. While Queues worked, we needed something more explicit to help debug and observe the more complex asynchronous workflows we were building on top of the messaging system that Queues gave us.

In our queue-based architecture each report would go through multiple steps:

  1. Validate input: Ensure the report has all necessary details.

  2. Initiate report: Call the NCMEC API to create a report.

  3. Fetch impounded files (if applicable): Retrieve files stored in R2.

  4. Upload files: Send files to NCMEC via API.

  5. Finalize report: Mark the report as completed.


A diagram of our queue-based architecture 

Each of these steps was handled by a separate queue, and if an error occurred, the system would retry the message several times before marking the report as failed. But errors weren’t always straightforward — for instance, if an external API call consistently failed due to bad input or returned an unexpected response shape, retries wouldn’t help. In those cases, the report could get stuck in an intermediate state, and we’d often have to manually dig through logs across different queues to figure out what went wrong.

Even more frustrating, when handling failed reports, we relied on a “Reaper” — a cron job that ran every hour to resubmit failed reports. Since a report could fail at any step, the Reaper had to deduce which queue failed and send a message to begin reprocessing. This meant:

  • Debugging was a nightmare: Tracing the journey of a single report meant jumping between logs for multiple queues.

  • Retries were unreliable: Some queues had retry logic, while others relied on the Reaper, leading to inconsistencies.

  • State management was painful: We had no clear way to track whether a report was halfway through the pipeline or completely lost, except by looking through the logs.

  • Operational overhead was high: Developers frequently had to manually inspect failed reports and resubmit them.

Queues gave us a solid foundation for moving messages around, but it wasn’t meant to handle orchestration. What we’d really done was build a bunch of loosely connected steps on top of a message bus and hoped it would all hold together. It worked, for the most part, but it was clunky, hard to reason about, and easy to break. Just understanding how a single report moved through the system meant tracing messages across multiple queues and digging through logs.

We knew we needed something better: a way to define workflows explicitly, with clear visibility into where things were and what had failed. But back then, we didn’t have a good way to do that without bringing in heavyweight tools or writing a bunch of glue code ourselves. When Cloudflare Workflows came along, it felt like the missing piece, finally giving us a simple, reliable way to orchestrate everything without duct tape.

The solution: Cloudflare Workflows

Once Cloudflare Workflows was announced, we saw an immediate opportunity to replace our queue-based architecture with a more structured, observable, and retryable system. Instead of relying on a web of multiple queues passing messages to each other, we now have a single workflow that orchestrates the entire process from start to finish. Critically, if any step failed, the Workflow could pick back up from where it left off, without having to repeat earlier processing steps, re-parsing files, or duplicating uploads.

With Cloudflare Workflows, each report follows a clear sequence of steps:

  1. Creating the report: The system validates the incoming report and initiates it with NCMEC.

  2. Checking for impounded files: If there are impounded files associated with the report, the workflow proceeds to file collection.

  3. Gathering files: The system retrieves impounded files stored in R2 and prepares them for upload.

  4. Uploading files to NCMEC: Each file is uploaded to NCMEC using their API, ensuring all relevant evidence is submitted.

  5. Adding file metadata: Metadata about the uploaded files (hashes, timestamps, etc.) is attached to the report.

  6. Finalizing the report: Once all files are processed, the report is finalized and marked as complete.

Here’s a simplified version of the orchestrator:

import { WorkflowEntrypoint, WorkflowEvent, WorkflowStep } from 'cloudflare:workers';


export class ReportWorkflow extends WorkflowEntrypoint<Env, ReportType> {
  async run(event: WorkflowEvent<ReportType>, step: WorkflowStep) {
    const reportToCreate: ReportType = event.payload;
    let reportId: number | undefined;


    try {
      await step.do('Create Report', async () => {
        const createdReport = await createReportStep(reportToCreate, this.env);
        reportId = createdReport?.id;
      });


      if (reportToCreate.hasImpoundedFiles) {
        await step.do('Gather Files', async () => {
          if (!reportId) throw new Error('Report ID is undefined.');
          await gatherFilesStep(reportId, this.env);
        });


        await step.do('Upload Files', async () => {
          if (!reportId) throw new Error('Report ID is undefined.');
          await uploadFilesStep(reportId, this.env);
        });


        await step.do('Add File Metadata', async () => {
          if (!reportId) throw new Error('Report ID is undefined.');
          await addFilesInfoStep(reportId, this.env);
        });
      }


      await step.do('Finalize Report', async () => {
        if (!reportId) throw new Error('Report ID is undefined.');
        await finalizeReportStep(reportId, this.env);
      });
    } catch (error) {
      console.error(error);
      throw error;
    }
  }
}

Not only can tasks be broken into discrete steps, but the Workflows dashboard gives us real-time visibility into each report processed and the status of each step in the workflow!

This allows us to easily see active and completed workflows, identify which steps failed and where, and retry failed steps or terminate workflows. These features revolutionize how we troubleshoot issues, providing us with a tool to deep dive into any issues that arise and retry steps with a click of a button.

Below are two dashboard screenshots, one of our running workflows and the second of an inspection of the success and failures of each step in the workflow. Some workflows look slower or “stuck” — that’s because failed steps are retried with exponential backoff. This helps smooth over transient issues like flaky APIs without manual intervention.


Cloudflare Workflows Dashboard for our NCMEC Workflow


Cloudflare Workflows Dashboard containing a breakout of the NCMEC Workflow Steps

Cloudflare Workflows transformed how we handle NCMEC incident reports. What was once a complex, queue-based architecture is now a structured, retryable, and observable process. Debugging is easier, error handling is more robust, and monitoring is seamless. 

Deploy your own Workflows

If you’re also building larger, multi-step applications, or have an existing Workers application that has started to approach what we ended up with for our incident reporting process, then you can typically wrap that code within a Workflow with minimal changes. Workflows can read from R2, write to KV, query D1 and call other APIs just like any other Worker, but are designed to help orchestrate asynchronous, long-running tasks.

To get started with Workflows, you can head to the Workflows developer documentation and/or pull down the starter project and dive into the code immediately:

$ npm create cloudflare@latest workflows-starter -- 
--template="cloudflare/workflows-starter"

Learn more about Cloudflare Workflows, and about using the Cloudflare CSAM Scanning Tool.

Cloudflare’s commitment to CISA Secure-By-Design pledge: delivering new kernels, faster

Post Syndicated from Brandon Harris original https://blog.cloudflare.com/cloudflare-delivers-on-commitment-to-cisa/

As cyber threats continue to exploit systemic vulnerabilities in widely used technologies, the United States Cybersecurity and Infrastructure Agency (CISA) produced best practices for the technology industry with their Secure-by-Design pledge. Cloudflare proudly signed this pledge on May 8, 2024, reinforcing our commitment to creating resilient systems where security is not just a feature, but a foundational principle.

We’re excited to share and provide transparency into how our security patching process meets one of CISA’s goals in the pledge: Demonstrating actions taken to increase installation of security patches for our customers.

Balancing security patching and customer experience 

Managing and deploying Linux kernel updates is one of Cloudflare’s most challenging security processes. In 2024, over 1000 CVEs were logged against the Linux kernel and patched. To keep our systems secure, it is vital to perform critical patch deployment across systems while maintaining the user experience. 

A common technical support phrase is “Have you tried turning it off and then on again?”.  One may be  surprised how often this tactic is used — it is also an essential part of how Cloudflare operates at scale when it comes to applying our most critical patches. Frequently restarting systems exercises the restart process, applies the latest firmware changes, and refreshes the filesystem. Simply put, the Linux kernel requires a restart to take effect.

However, considering that a single Cloudflare server may be processing hundreds of thousands of requests at any point in time, rebooting it would impact user experience. As a result, a calculated approach is required, and traffic must be carefully removed from the server before it can safely reboot. 

First, the server is marked for maintenance. This action alerts our load balancing system, unimog, to stop sending traffic to this server. Next, the server waits for this flow of traffic to terminate, and once public traffic is gone, the server begins to disable internal traffic. Internal traffic has multiple purposes, such as determining optimal routing, service discovery, and system health checks. Once the server is no longer actively serving any traffic, it can safely restart, using the new kernel.

Kernel lifecycle at Cloudflare

This diagram is a high level view of the lifecycle of the Linux kernel at Cloudflare. The list of kernel versions shown is a point in time example snapshot from kernel.org.


First, a new kernel is released by the upstream kernel developers. We follow the longterm stable branch of the kernel. Each new kernel release is pulled into our internal repository automatically, where the kernel is built and tested. Once all testing has successfully passed, several flavors of the kernel are built and readied for a preliminary deployment.

The first stage of deployment is an internal environment that receives no traffic. Once it is confirmed that there are no crashes or unintended behavior, it is promoted to a production environment with traffic generated by Cloudflare employees as eyeballs.

Cloudflare employees are connected via Zero Trust to this environment. This allows our telemetry to collect information regarding CPU utilization, memory usage, and filesystem behavior, which is then analyzed for deviations from the previous kernel. This is the first time that a new kernel is interacting with live traffic and real users in a Cloudflare environment. 

Once we are satisfied with kernel performance and behavior, we begin to deploy this kernel to customer traffic. This progression starts as a small percentage of traffic in multiple datacenters and ends in one large regional datacenter. This is an important qualification phase for a new kernel, as we need to collect data on real world traffic. Once we are satisfied with performance and behavior, we have a candidate release that can go everywhere.

When a new kernel is ready for release, an automated cycle named the Edge Reboot Release is initiated. The Edge Reboot Release begins and completes every 30 days. This guarantees that we are running an up-to-date kernel in our infrastructure every month.

What about patches for the kernel that are needed faster than the standard cycle? We can live patch changes to close those gaps faster, and we have even written about closing one of these CVE’s.

Automating kernel updates in our Control Plane 

The Cloudflare network is 50 ms from 95% of the world’s Internet-connected population. The Control Plane runs different workloads than our network, and is composed of 80 different clustered workloads responsible for persistence of information and decisions that feed the Cloudflare network. Until 2024, the Control Plane kernel maintenance was performed ad-hoc, and this caused the working kernel for Control Plane workloads to fall behind on patches. Under the pledge, this had to change and become just as consistent as the rest of our network.


Consider a relational database as an example workload, as illustrated in the diagram above. One would need a copy available to restart the original in order to provide a seamless end user experience. This copy is called a database replica. That replica should then be promoted to become the primary serving database. Now that a new primary is serving traffic, the old primary is free to restart. If a database replica reboot is needed, an additional replica would be needed to take its place, allowing another safe restart. In this example, we have 2 different ways to restart a member of the clustered workload. Every clustered workload has different safe methodologies to restart one of its members.

Reboau (short for reboot automation) is an internally-built tool to manage custom reboot logic in the Control Plane. Reboau offers additional efficiencies described as “rack aware”, meaning it can operate on a rack of servers vs. a single server at a time. This optimization is helpful for a clustered workload, where it may be more efficient to drain and reboot a rack versus a single server. It also leverages metrics to determine when it is safe to lose a clustered member, execute the reboot, and ensure the system is healthy through the process.

In 2024, Cloudflare migrated Control Plane workloads to leverage Reboau and follow the same kernel upgrade cadence as the network. Now all of our infrastructure benefits from faster patching of the Linux kernel, to improve security and reliability for our customers.

Conclusion 

Irrespective of the industry, if your organization builds software, we encourage you to familiarize yourself with CISA’s ‘Secure by Design’ principles and create a plan to implement them in your company. The CISA Secure by Design pledge is built around seven security goals, prioritizing the security of customers, and challenges organizations to think differently about security. 

By implementing automated security patching through kernel updates, Cloudflare has demonstrated measurable progress in implementing functionality that allows automatic deployment of software patches by default. This process highlights Cloudflare’s commitment to protecting our infrastructure and keeping our customers against emerging vulnerabilities.

For more updates on our CISA progress, you check out our blog. Cloudflare has delivered five of the seven CISA Secure by Design pledge goals, and we aim to complete the entirety of the pledge goals by May 2025.

Improving email security with Amazon SES Mail Manager and Hornetsecurity’s Vade Advanced Email Security Add On

Post Syndicated from Zip Zieper original https://aws.amazon.com/blogs/messaging-and-targeting/improving-email-security-with-amazon-ses-mail-manager-and-hornetsecuritys-vade-advanced-email-security-add-on/

Email continues to be a critical communication channel for businesses, powering essential communications across time zones and locations. But as cyber threats grow more sophisticated, how can organizations protect their most vulnerable communication channel? With the increasing complexity of email-based security risks, businesses need robust solutions to safeguard their digital communications. Today, we’re excited to announce the launch of Hornetsecurity’s Vade Advanced Email Security Add On for Amazon Simple Email Service (SES) Mail Manager, a powerful new tool in the fight against email-borne threats.

Amazon SES: Powering email communication at scale

Amazon SES is a cloud-based email service that helps you automate high-volume email communications seamlessly. In May 2024, we launched Mail Manager, introducing email relay and gateway features that help you manage email traffic, ensure compliance and enforce corporate policies. The launch also included an introduction to Mail Manager Email Add Ons which provides optional access to a collection of powerful security tools from certified providers that help you manage and filter incoming emails. Add Ons from our partners deliver advanced email security with flexible, meter-based pricing that is easily activated and integrated into your email workflows directly from the Mail Manager console or Mail Manager APIs.

In this blog, we’ll introduce Hornetsecurity’s Vade Email Add On for Amazon SES Mail Manager, and demonstrate how to enable its advanced email security capabilities to help protect your critical email communications.

Introducing the Vade Email Add On by Hornet Security

Hornetsecurity, a global leader in email security, produces next-generation cloud-based security, compliance, backup, and security awareness solutions that help companies and organizations of all sizes around the world. Its email filters process billions of emails daily, using a vast global email database to power their artificial intelligence (AI) engine. This approach allows the Vade Email Add On to continuously refine and adapt to the latest email threats and filter-bypassing techniques.

The Vade Email Add On brings Vade’s expertise directly to you, providing a seamless and powerful email security solution within the familiar AWS environment:

“Enhance your email service with advanced cybersecurity capabilities by integrating Vade Email Security’s state-of-the-art filtering solution. This Add On empowers users with automated, real-time defense against spam, malware, and phishing—ensuring safer communication. Vade’s AI-powered technology employs a multi-layered approach—combining heuristics, behavioral analysis, and natural language processing—to analyze messages in real time. Strengthen your platform by ensuring ongoing protection against evolving cyber threats.”

Advanced Email Security with the Vade Add On for Mail Manager

Hornetsecurity’s Vade Add On for Mail Manager provides automated, real-time defense against spam, malware, and phishing, which help ensure safer communication, including:

  • Advanced Threat Detection: Identifies and blocks sophisticated phishing attempts, malware, and ransomware, providing comprehensive protection against a wide range of cyber threats.
  • Behavioral Analysis: Examines the behavior patterns of message senders and content based on over 130 potential data points in each message to detect anomalies and potential threats.
  • Patented AI Technology: Leverages proprietary AI algorithms to analyze communication patterns and detect misuse of your service’s digital assets. This technology is powered by our global network of over 1 billion protected mailboxes.
  • Real-Time Scanning: Instantly analyze attachments without delaying delivery, thanks to its real time code interpreter.
  • Ease of Use: Seamless integration with Mail Manager rules, scanning only messages that meet specific criteria.

The Vade Email Add-On integrates with Mail Manager’s rules engine. This engine routes messages based on Vade’s scan results and optional detailed verdicts. These verdicts enable precise categorization and handling of incoming emails, improving security and email management.

Configure the Vade Email Add On

In the following example, we’ll walk thru the steps needed to subscribe and configure a rule set with two rules that are processed in priority order:

  • Rule 1drop-all-malicious-emails This rule has a condition that uses Vade to scan all incoming email and identify messages that are malicious (contain malware or phishing). These messages are then processed by Rule 1’s “Drop action“. Messages that are deemed “safe” are passed to Rule 2 after automatically being inspected and marked as “likely to be spam”, or “not-spam”.
  • Rule 2forward-to-mailbox Messages passed into Rule 2 are immediately forwarded to the user’s mailbox. In our example, we’re using Amazon WorkMail and Mail Manager’s built-in “Deliver to mailbox” action.
    • The Vade Add On also distinguishes between spam and clean email, and automatically adds a corresponding header to each message (see below) that can be used to route spam into the user’s “junk” folder.
      • X-SES-Vade-Advanced-Email-Security-AddonVerdict: spam:high
    • Thanks to the seamless integration between Mail Manager Add Ons and WorkMail, messages marked as spam are automatically sent to the user’s Junk folder, enhancing both security and user experience.

Vade Email Add On workflow

Follow the steps below to configure the Vade Email Add On using the Amazon SES console for the simple mail flow described above (note – the SES Mail Manager API can be used in lieu of the console).

  1. Open the Amazon SES console and in the left navigation rail, expand Mail Manager and click Email Add Ons.
  2. Select the Vade Add On, read the description. Click Subscribe and read the Terms and Conditions. Click Subscribe again to activate the Vade Advanced Email Security Add On in your SES account.
    • Pricing is detailed in the Email Add On description page. When this blog was published the price per 1,000 emails processed = $0.415 USD (subject to change, please refer to SES Pricing for the most up to date information).

Vade Email Add On

  1. In the left navigation rail under Mail Manager, click Rule Sets.
  2. Create a new Rule set ( process-via-vade ) (or modify an existing Rule set).
    1. Create a rule ( drop-all-malicious-emails )
    2. Under Rule conditions, click select property and select Vade Advanced Email Security Category from the drop-down menu (note the property modifiers allow for increasingly detailed inspection / results for the scan).
    3. Click the Select operator drop-down and select Equals from the menu.
    4. Click the Value drop-down and select Phishing and Malware.
    5. Under Actions, select Drop action to stop processing and discard messages that are found to be malicious.

Rule 1 - drop-all-malicious-emails

  1. Create rule ( forward-to-mailbox ) to process messages that were passed along by Rule 1.
  2. Under Actions, select Deliver to mailbox (note – if not using Amazon WorkMail, you would select a previously configured SMTPRelay action to send messages to your inbox provider. See this blog for more info).
    1. Provide your WorkMail ARN
    2. Select an IAM role that has permission for SES Mail Manager to access to your WorkMail mailbox

Rule 2 - forward-to-mailbox

  1. Save the Rule set (it will look like this):

New Vade Rule Set

  1. To use this new Rule set, add it to an active Mail Manager Ingress endpoint. When you click save, the Ingress endpoint will begin using the new Rule set immediately.

The Vade Add-On’s rule conditions (below) enable granular control of email routing. When combined with customizable actions, these rules create an automated email handling system that matches your business needs.

VADE result mapping

Conclusion

Hornetsecurity’s Vade Email Add On for Amazon SES Mail Manager represents a significant step forward in email security for Amazon SES Mail Manager customers. By combining an advanced artificial intelligence (AI)-driven security engine with the powerful management capabilities of Mail Manager, you can enhance your defense against email-borne threats while maintaining precise control over your email workflows.

Get started today and take your email security to the next level with the Vade Add On for Amazon SES Mail Manager

We encourage you to try the Vade Add On for Amazon SES Mail Manager and experience the benefits of enhanced email security firsthand. To learn more about implementation details and best practices, please visit:

Join the Conversation:
Connect with other administrators and security professionals on the AWS re:Post community to share insights and learn best practices.