Building responsive APIs with Amazon API Gateway response streaming

Post Syndicated from Anton Aleksandrov original https://aws.amazon.com/blogs/compute/building-responsive-apis-with-amazon-api-gateway-response-streaming/

Today, AWS announced support for response streaming in Amazon API Gateway to significantly improve the responsiveness of your REST APIs by progressively streaming response payloads back to the client. With this new capability, you can use streamed responses to enhance user experience when building LLM-driven applications (such as AI agents and chatbots), improve time-to-first-byte (TTFB) performance for web and mobile applications, stream large files, and perform long-running operations while reporting incremental progress using protocols such as server-sent events (SSE).

In this post you will learn about this new capability, the challenges it addresses, and how to use response streaming to improve the responsiveness of your applications.

Overview

Consider this scenario – you’re running an AI-powered agentic application that uses an Amazon Bedrock foundation model. Your users interact with the application through an API, asking complex questions that require detailed responses. Before response streaming, users would send their prompts and wait to eventually receive the application response, sometimes for tens of seconds. This awkward pause between questions and responses created a disconnected, unnatural experience.

With the new API Gateway response streaming capability, the interaction through the API becomes much more fluid and natural. As soon as your application starts processing the model response, you can stream it back to your users using the API Gateway.

The following animation illustrates this significant user experience improvement. The prompt on the left is processed using a non-streaming response with user having to wait for several seconds to receive the result. The prompt on the right is using the new API Gateway response streaming, significantly reducing TTFB and improving user experience.

Figure 1. Comparing user experience before (left) and after (right) enabling API Gateway response streaming when returning a response from a Bedrock foundational model.

Your users can now see AI responses appear in real-time, word by word, just like watching someone type. This immediate feedback makes your applications feel more responsive and engaging, keeping users connected throughout the interaction. In addition, you don’t have to worry about response size limits or implement complex workarounds – the streaming happens automatically and efficiently, letting you focus on building great user experiences rather than managing infrastructure constraints.

Understanding response steaming

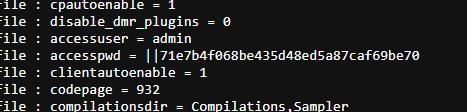
In the traditional request-response model, responses must be fully computed before being sent to the client. This can negatively impact user experience – the client must wait for the complete response to be generated on the server-side and transmitted over-the-wire. This is especially pronounced in interactive, latency-sensitive cloud applications such as AI agents, chatbots, virtual assistants, or music generators.

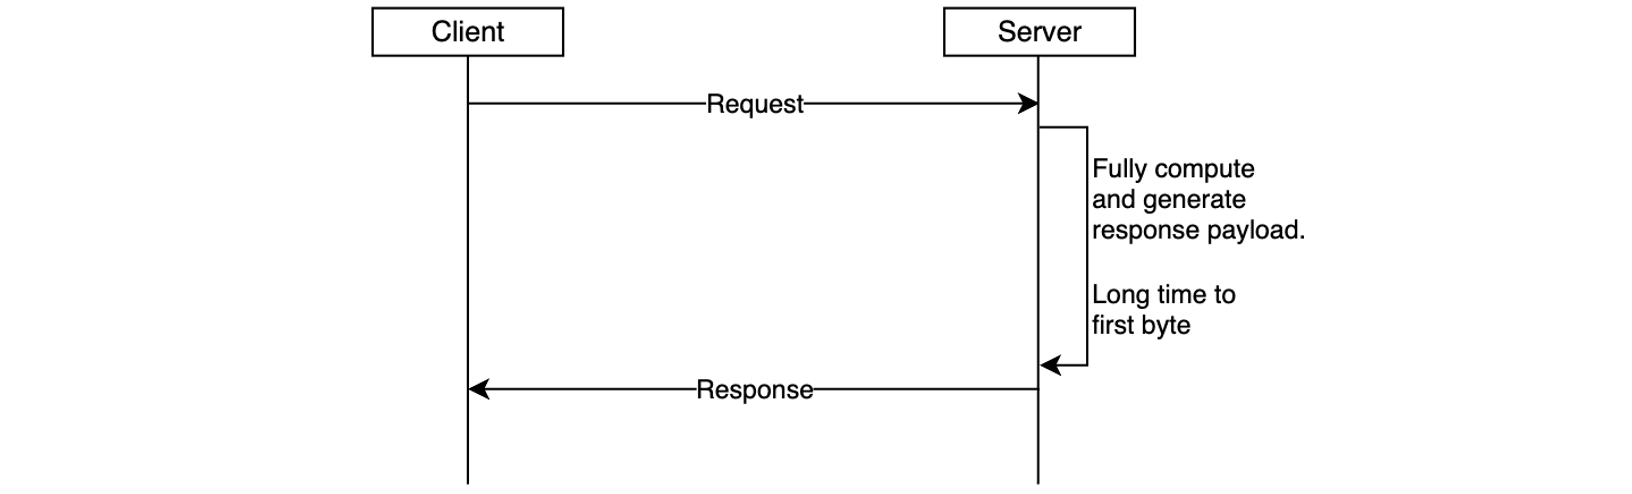
Figure 2. Response is returned to the client only after it’s been fully generated, increasing time-to-first-byte latency.

Another important scenario is returning larger response payloads, such as images, large documents, or datasets. In some cases, these payloads may exceed the 10 MB response size limit or default integration timeout limit of 29 seconds of API Gateway. Before the launch of response streaming, developers worked around these limitations by using pre-signed Amazon S3 URLs to download large responses or accepting lower RPS for an increase in timeout. While functional, these workarounds introduced additional latency and architectural complexity.

With response streaming support you can address these challenges. You can now update your REST APIs to return streamed responses, significantly enhancing user experience, improving TTFB performance, supporting response payload sizes to exceed 10 MB, and serving requests that can take up to 15 minutes.

Figure 3. Response streaming reduces time-to-first-byte and improves user experience.

The response streaming capability is already delivering significant performance for organizations:

“Working closely with the AWS teams to enable response streaming was instrumental in advancing our roadmap to deliver the most performant storefront experiences for our largest customers at Salesforce Commerce Cloud. Our collaboration exceeded our Core Web Vital goals; we saw our Total Blocking Time metrics drop by over 98%, which will enable our customers to drive higher revenue and conversion rates.”, says Drew Lau, Senior Director of Product Management at Salesforce.

Response streaming is supported for any HTTP-proxy integration, AWS Lambda functions (using proxy integration mode), and private integrations. To get started, configure your API integration to stream the response from your backend, as described in the following sections, and redeploy your API for changes to take effect.

Getting started with response streaming

To enable response streaming for your REST APIs, update your integration configuration to set the response transfer mode to STREAM. This enables API Gateway to start streaming the response to the client as soon as response bytes become available. When using response streaming, you can configure request timeout up to 15 minutes. For best time to first byte user experience, AWS strongly recommends your backend integration also implements response streaming.

You can enable response streaming in several different ways, as illustrated in the following snippets:

Using the API Gateway console, when creating method integrations, select Stream for the Response transfer mode.

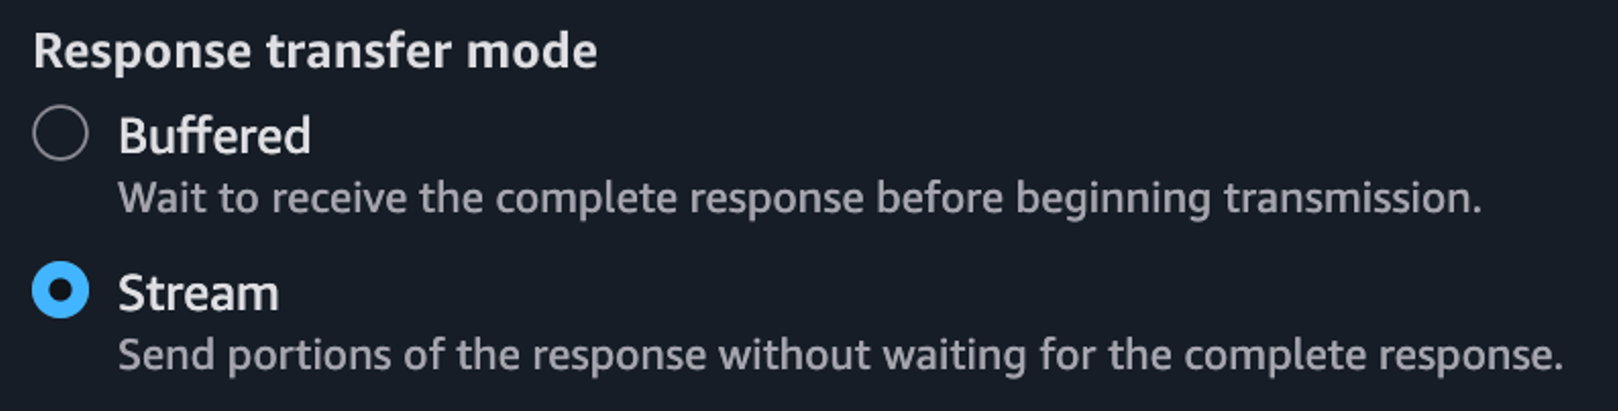
Figure 4. Enabling response streaming in API Gateway Console.

Setting response transfer mode using the Open API spec:

paths:
  /products:
    get:
      x-amazon-apigateway-integration:
        httpMethod: "GET"
        uri: "https://example.com"
        type: "http_proxy"
        timeoutInMillis: 300000
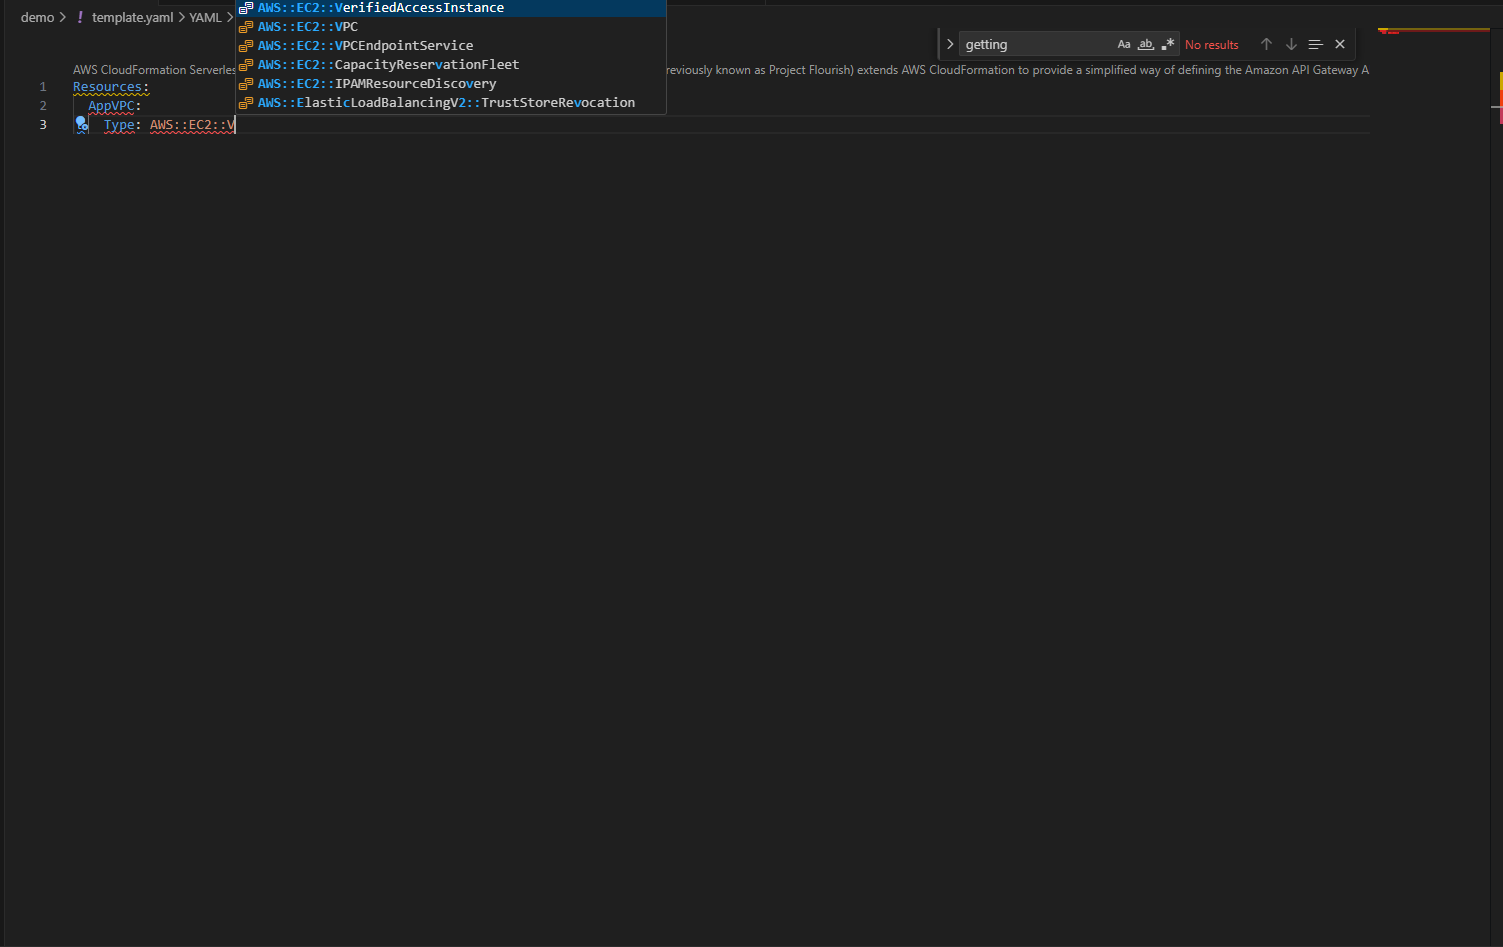
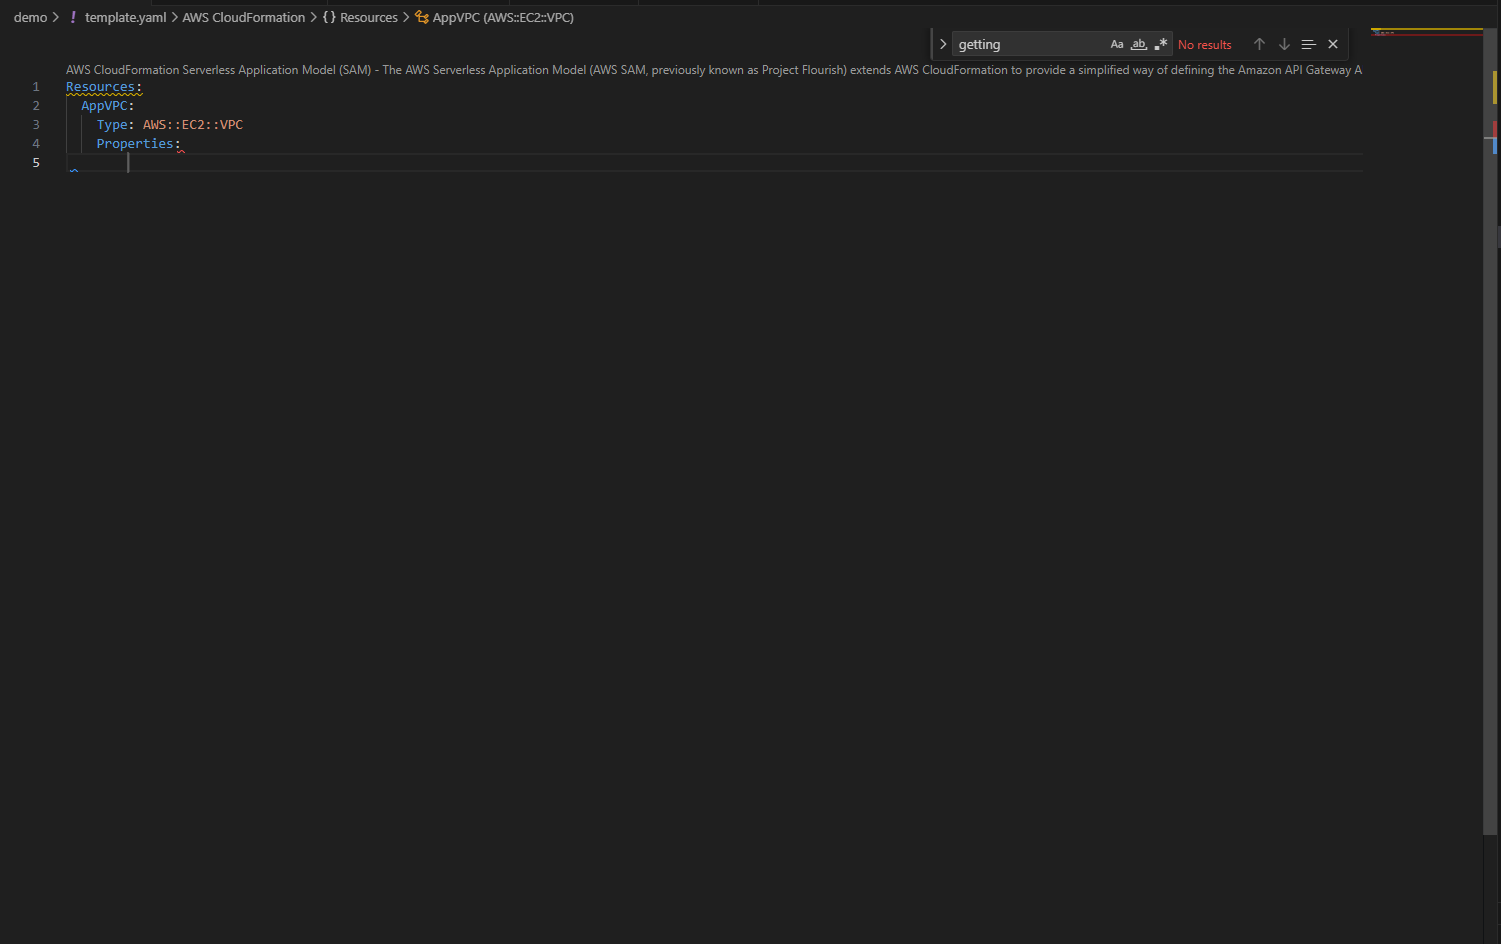
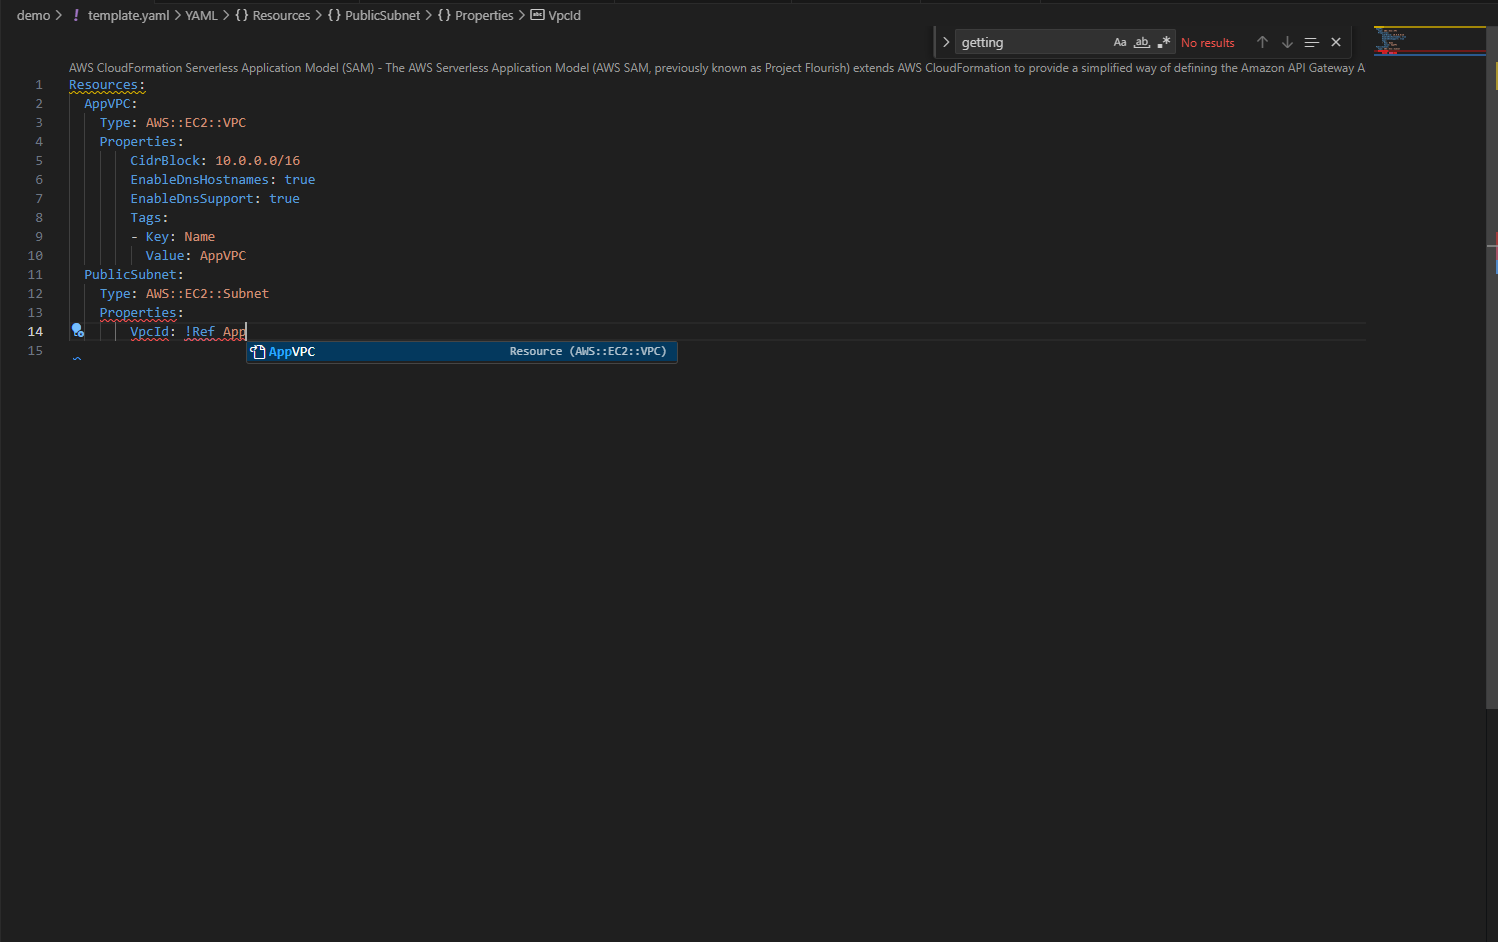
        responseTransferMode: "STREAM"

Setting response transfer mode using infrastructure-as-code (IaC) frameworks, such as AWS CloudFormation. Note the /response-streaming-invocations Uri fragment, it tells API Gateway to use the Lambda InvokeWithResponseStreaming endpoint:

MyProxyResourceMethod:
  Type: 'AWS::ApiGateway::Method'
  Properties:
    RestApiId: !Ref LambdaSimpleProxy
    ResourceId: !Ref ProxyResource
    HttpMethod: ANY
    Integration:
      Type: AWS_PROXY
      IntegrationHttpMethod: POST
      ResponseTransferMode: STREAM
      Uri: !Sub arn:aws:apigateway:${APIGW_REGION}:lambda:path/2021-11-
           15/functions/${FN_ARN}/response-streaming-invocations

Updating response transfer mode using the AWS CLI:

aws apigw update-integration \
   --rest-api-id a1b2c2 \
   --resource-id aaa111 \
   --http-method GET \
   --patch-operations "op='replace',path='/responseTransferMode',value=STREAM" \
   --region us-west-2

Using response streaming with Lambda functions

When using Lambda functions as a downstream integration endpoint, your Lambda functions must be streaming-enabled. The API Gateway uses the InvokeWithResponseStreaming API to invoke functions, as illustrated in the following diagram, and requires Lambda proxy integration. See the API Gateway documentation for additional guidance.

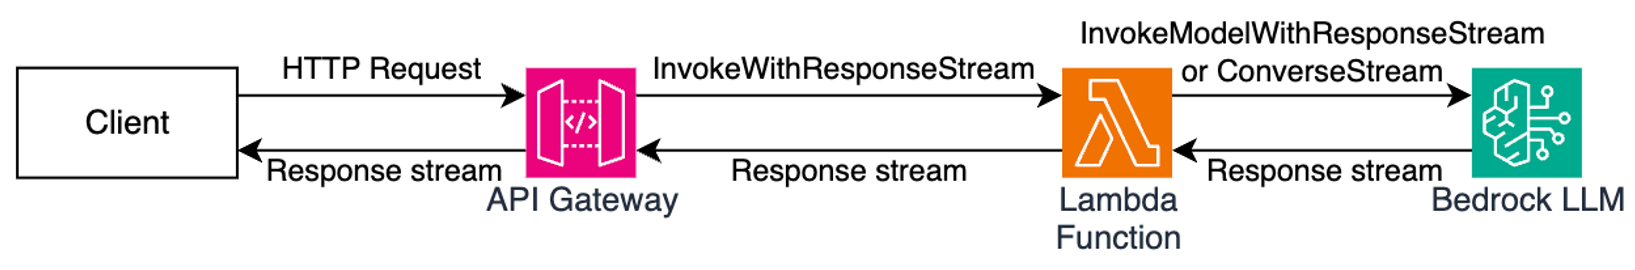
Figure 5. Using API Gateway response streaming with Lambda functions for interactive AI applications.

When you use response streaming with Lambda functions, API Gateway expects the handler response stream to contain the following components (in order):

  • JSON response metadata – Must be a valid JSON object and can only contain statusCode, headers, multiValueHeaders, and cookies fields (all optional). Metadata cannot be an empty string; at a minimum it must be an empty JSON object.
  • The 8-null-byte delimiter – Lambda adds this delimiter automatically when you use the built-in awslambda.HttpResponseStream.from() method, as illustrated below. When not using this method, you’re responsible for adding the delimiter yourself.
  • Response payload – Can be empty.

The following code snippet illustrates how you can return a streamed response from your Lambda functions so it will be compatible with API Gateway response streaming:

export const handler = awslambda.streamifyResponse(
   async (event, responseStream, context) => {

      const httpResponseMetadata = {
         statusCode: 200,
         headers: {
            'Content-Type': 'text/plain',
            'X-Custom-Header': 'some-value'
         }
      };

      responseStream = awslambda.HttpResponseStream.from(
         responseStream,
         httpResponseMetadata
      );

      responseStream.write('hello');
      await new Promise(r => setTimeout(r, 1000));
      responseStream.write(' world');
      await new Promise(r => setTimeout(r, 1000));
      responseStream.write('!!!');
      responseStream.end();
   }
);

Refer to the API Gateway documentation for further implementation guidelines.

Using response streaming with HTTP Proxy integrations

You can stream HTTP responses from your applications used as downstream integration endpoints, for example web servers running on Amazon Elastic Container Service (Amazon ECS) or Amazon Elastic Kubernetes Service (Amazon EKS). In this case, you must use HTTP_PROXY integration and specify the response transfer mode as STREAM (using the console, AWS CLI, or IaC). Redeploy your API after modifying it.

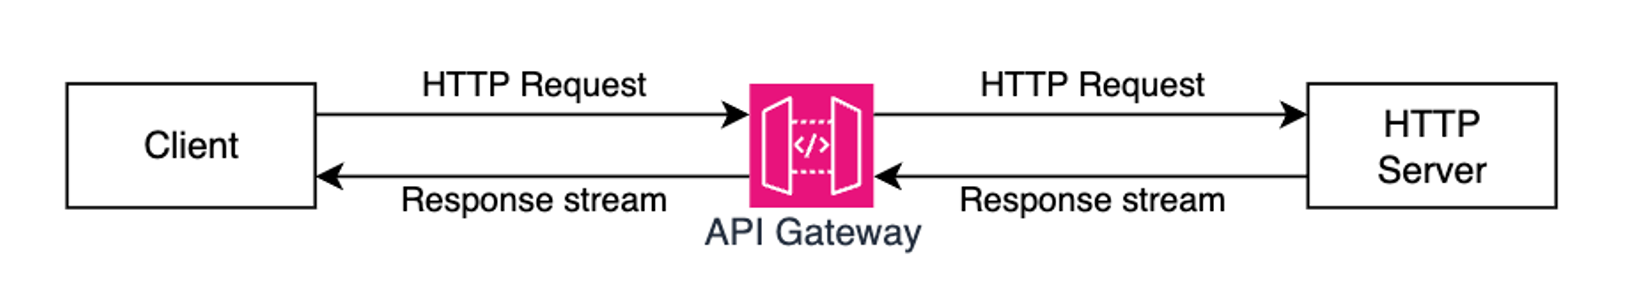
Figure 6. Using API Gateway response streaming with HTTP server applications.

Once API Gateway receives a streaming response from your application, it will wait until the HTTP headers block transfer is complete. Then, it will send to the client an HTTP response status code and headers, followed by the content from your application as it gets received by the API Gateway service. It will continue streaming response from your application to the client until the stream ends (up to 15 minutes).

Many popular API and web application development frameworks provide response streaming abstractions. The following code snippet illustrates how you can implement HTTP response streaming using FastAPI:

app = FastAPI()

async def stream_response():
   yield b"Hello "
   await asyncio.sleep(1)
   yield b"World "
   await asyncio.sleep(1)
   yield b"!"

@app.get("/")
async def main():
   return StreamingResponse(stream_response(), media_type="text/plain")

Adding real-time response streaming to your HTTP clients

Different HTTP clients have different ways to process streamed response fragments as they arrive. The following code snippet illustrates how to process a streamed response with a Node.js application:

const request = http.request(options, (response)=>{
   response.on('data', (chunk) => {
      console.log(chunk);
   });

   response.on('end', () => {
      console.log('Response complete’);
   });
});

request.end();

When using CURL, you can use the –no-buffer argument to print response fragments as they arrive.

curl --no-buffer {URL}

Sample code

Clone this sample project from GitHub to see API Gateway response streaming in action. Follow instructions in the README.md to provision the sample project in your AWS account.

Considerations

Before you enable response streaming, consider:

  • Response streaming is available for REST APIs and can be used with HTTP_PROXY integrations, Lambda integrations (in proxy mode), and private integrations.
  • You can use API Gateway response streaming with any endpoint type, such as Regional, Private, and Edge-optimized, with or without custom domain names.
  • When using response streaming, you can configure response timeouts up to 15 minutes, according to your scenario requirements.
  • All streaming responses from Regional or Private endpoints are subject to a 5-minute idle timeout. All streaming responses from edge-optimized endpoints are subject to a 30-second idle timeout.
  • Within each streaming response, the first 10MB of response payload is not subject to any bandwidth restrictions. Response payload data exceeding 10MB is restricted to 2MB/s.
  • Response streaming is compatible with API Gateway security capabilities such as authorizers, WAF, access controls, TLS/mTLS, request throttling, and access logging.
  • When processing streamed responses, the following features are not supported: response transformation with VTL, integration response caching, and content encoding.
  • Always protect your APIs against unauthorized access and other potential security threats by implementing proper authorization with Lambda Authorizers or Amazon Cognito User Pools. Read REST API protection documentation and API Gateway security documentation for additional details.

Observability

You can continue using existing observability capabilities, such as execution logs, access logs, AWS X-Ray integration, and Amazon CloudWatch metrics with API Gateway response streaming.

In addition to the existing access logs variables, the following new variables are available:

  • $content.integration.responseTransferMode – the response transfer mode of your integration. This can be either BUFFERED or STREAMED.
  • $context.integration.timeToAllHeaders – the time between when API Gateway establishes the integration connection to when it receives all integration response headers from the client.
  • $context.integration.timeToFirstContent – the time between when API Gateway establishes the integration connection to when it receives the first content bytes.

See API Gateway documentation for more information.

Pricing

With this new capability, you continue to pay the same API Invoke rates for streamed responses. Each 10MB of response data, rounded up to the nearest 10MB, is billed as a single request. See API Gateway pricing page for additional details.

Conclusion

The new response streaming capability for Amazon API Gateway enhances how you can build and deliver responsive APIs in the cloud. With immediate streaming of response data as it becomes available, you can significantly improve time-to-first-byte performance and overcome traditional payload size and timeout limitations. This is particularly valuable for AI-powered applications, file transfers, and interactive web experiences that demand real-time responsiveness.

To learn more about API Gateway response streaming see the service documentation.

To learn more about building Serverless architectures see Serverless Land.

Simplified developer access to AWS with ‘aws login’

Post Syndicated from Shreya Jain original https://aws.amazon.com/blogs/security/simplified-developer-access-to-aws-with-aws-login/

Getting credentials for local development with AWS is now simpler and more secure. A new AWS Command Line Interface (AWS CLI) command, aws login, lets you start building immediately after signing up for AWS without creating and managing long-term access keys. You use the same sign-in method you already use for the AWS Management Console.

In this blog, we’ll show you how to get temporary credentials to your workstation for use with the AWS CLI, AWS Software Development Kits (AWS SDKs), and tools or applications built using them with the new aws login command.

Getting started with programmatic access to AWS

You can use the aws login command with your AWS Management Console sign-in method, as described in the following sections.

Scenario 1: Using IAM credentials (root or IAM user)

To obtain programmatic credentials using your root or IAM user username and password:

  1. Install the latest AWS CLI (version 2.32.0 or later).
  2. Run the aws login command.
  3. If you have not set a default Region, the CLI prompts you to specify the AWS Region of your choice (e.g., us-east-2, eu-central-1). The CLI remembers which Region you set once you enter it into this prompt.
    Figure 1: CLI Region prompt

    Figure 1: CLI Region prompt

  4. The CLI opens your default browser.
  5. Follow the instructions in the browser window:
    1. If you have already signed into the AWS Management Console, you will see a screen that says, “Continue with an active session.”
      Figure 2: Sign in to AWS - active session selection

      Figure 2: Sign in to AWS – active session selection

    2. If you haven’t signed into the AWS Management Console, you will see the sign-in options page. Select “Continue with Root or IAM user” and log in to your AWS account.
      Figure 3: AWS Sign in to AWS - Sign-in options

      Figure 3: AWS Sign in to AWS – Sign-in options

  6. Success! You’re ready to run AWS CLI commands. Try the aws sts get-caller-identity command to verify the identity you’re currently using.
    Figure 4: Sign in to AWS - completion

    Figure 4: Sign in to AWS – completion

Scenario 2: Using federated sign-in

This scenario applies when you authenticate through your organization’s identity provider. To retrieve programmatic credentials for roles you assumed with federation:

  1. Complete steps 1–4 from Scenario 1, then continue with the following instructions.
  2. Follow the instructions in the browser window:
    1. If you have already signed into the AWS Management Console, the browser provides you with the option to select your active IAM role session from federated sign-in to the console. This enables you to switch between 5 active AWS sessions if you have multi-session support enabled on your AWS Management Console.
      Figure 5: Sign in to AWS - active IAM role session selection

      Figure 5: Sign in to AWS – active IAM role session selection

    2. If you have not signed into the AWS Management Console or want to get temporary credentials for a different IAM role, sign into your AWS account using your current authentication mechanism in another browser tab. Upon successful login, switch back to this tab and select the “Refresh” button. Your console session should now be available under the active sessions.
  3. Return to the AWS CLI once you have successfully completed the aws login process.

Regardless of the console sign-in method you choose, the temporary credentials issued by the aws login command are automatically rotated by the AWS CLI, AWS Tools for PowerShell and AWS SDKs every 15 minutes. They are valid up to the set session duration of the IAM principal (maximum of 12 hours). After reaching the session duration limit, you will be prompted to log in again.

Figure 6: AWS Sign in - session expiration

Figure 6: AWS Sign in – session expiration

Accessing AWS using local developer tools

The aws login command supports switching between multiple AWS accounts and roles using profiles. You can configure a profile with aws login --profile <PROFILE_NAME> and run AWS commands with the profile using: aws sts get-caller-identity --profile <PROFILE_NAME>. The short-term credentials issued by aws login work with more than the AWS CLI. You can also use them with:

  • AWS SDKs: If you use AWS SDKs for development, the SDK clients can use these temporary credentials to authenticate with AWS.
  • AWS Tools for PowerShell: Use the Invoke-AWSLogin command.
  • Remote development servers: Use aws login --remote on a remote server without browser access, to deliver temporary credentials from your device with browser access to the AWS console.
  • Older versions of AWS SDKs that do not support the new console credentials provider: Any software written using these older SDKs can support credentials delivered by aws login by using the credential_process provider with the AWS CLI.

Controlling access to aws login with IAM policies

The aws login command is controlled by two IAM actions: signin:AuthorizeOAuth2Access and signin:CreateOAuth2Token. Use the SignInLocalDevelopmentAccess managed policy or add these actions to your IAM policies to allow IAM users and IAM roles with console access to use this feature.

AWS Organizations customers looking to control the usage of this login feature on member accounts can deny the two actions above using Service Control Policies (SCPs). These IAM actions and their resources are usable in all relevant IAM policies.

AWS recommends using centralized root access management in AWS Organizations to eliminate long-term root credentials from member accounts. This feature allows security teams to perform privileged tasks through short-term, task-scoped root sessions from a central management account. After you enable centralized root management and delete root credentials on member accounts, root login to member accounts is denied, which also prevents programmatic access with root credentials using aws login. For developers using root credentials or IAM users, aws login delivers short-lived credentials to development tools, providing a secure alternative to long-term static access keys.

Logging and security of programmatic access using aws login

AWS Sign-In logs API activity through AWS CloudTrail, which now includes two new events specific to aws login. The service logs two new event names called AuthorizeOAuth2Access and CreateOauth2Token in the AWS Region where the user logs in.

Here’s a CloudTrail sample for an AuthorizeOAuth2Access event:

{
    "eventVersion": "1.11",
    "userIdentity": {
        "type": "AssumedRole",
        "principalId": "AROATJHQDX737YZP72NTF:testuser”,
        "arn": "arn:aws:sts::225989345271:assumed-role/Admin/testuser,
        "accountId": “111111111111”,
        "sessionContext": {
            "sessionIssuer": {
                "type": "Role",
                "principalId": "AROATJHQDX737YZP72NTF",
                "arn": "arn:aws:iam::111111111111:role/Admin",
                "accountId": “11111111111”,
                "userName": "Admin"
            },
            "attributes": {
                "creationDate": "2025-11-17T22:50:14Z",
                "mfaAuthenticated": "false"
            }
        }
    },
    "eventTime": "2025-11-17T22:51:32Z",
    "eventSource": "signin.amazonaws.com",
    "eventName": "AuthorizeOAuth2Access",
    "awsRegion": "us-east-1",
    "sourceIPAddress": “192.0.2.2”,
    "userAgent": "Mozilla/5.0 (Macintosh; Intel Mac OS X 10_15_7) AppleWebKit/537.36 (KHTML, like Gecko) Chrome/142.0.0.0 Safari/537.36",
    "requestParameters": {
        "scope": "openid",
        "redirect_uri": "http://127.0.0.1:53037/oauth/callback",
        "code_challenge_method": "SHA-256",
        "client_id": "arn:aws:signin:::devtools/same-device"
    },
    "responseElements": null,
    "additionalEventData": {
        "success": "true",
        "x-amzn-vpce-id": ""
    },
    "requestID": "e2854c76-1cba-4360-9fd1-5037b591466b",
    "eventID": "59e1720d-3deb-44ff-933d-6828be2a860a",
    "readOnly": true,
    "eventType": "AwsApiCall",
    "managementEvent": true,
    "recipientAccountId": “111111111111”,
    "eventCategory": "Management",
    "tlsDetails": {
        "tlsVersion": "TLSv1.3",
        "cipherSuite": "TLS_AES_128_GCM_SHA256",
        "clientProvidedHostHeader": "us-east-1.signin.aws.amazon.com"
    }
}

Here’s a CloudTrail sample for a CreateOAuth2Token event:

{
    "eventVersion": "1.11",
    "userIdentity": {
        "type": "AssumedRole",
        "principalId": "AROATJHQDX737YZP72NTF:testuser-Isengard",
        "arn": "arn:aws:sts::111111111111:assumed-role/Admin/testuser-Isengard",
        "accountId": "111111111111",
        "sessionContext": {
            "sessionIssuer": {
                "type": "Role",
                "principalId": "AROATJHQDX737YZP72NTF",
                "arn": "arn:aws:iam::111111111111:role/Admin",
                "accountId": "111111111111",
                "userName": "Admin"
            },
            "attributes": {
                "creationDate": "2025-11-18T20:38:10Z",
                "mfaAuthenticated": "false"
            }
        }
    },
    "eventTime": "2025-11-18T20:38:44Z",
    "eventSource": "signin.amazonaws.com",
    "eventName": "CreateOAuth2Token",
    "awsRegion": "us-east-1",
    "sourceIPAddress": "192.0.2.2",
    "userAgent": "aws-cli/2.32.0 md/awscrt#0.28.4 ua/2.1 os/macos#24.6.0 md/arch#arm64 lang/python#3.13.9 md/pyimpl#CPython m/b,AA,Z,E cfg/retry-mode#standard md/installer#exe sid/35033f4ca1bd md/prompt#off md/command#login",
    "requestParameters": {
        "client_id": "arn:aws:signin:::devtools/same-device"
    },
    "responseElements": null,
    "additionalEventData": {
        "success": "true",
        "x-amzn-vpce-id": ""
    },
    "requestID": "94562943-c85b-4dc1-bf72-43b0fd42d6de",
    "eventID": "0b338fac-6a10-4740-b34d-1bb6923e799e",
    "readOnly": true,
    "eventType": "AwsApiCall",
    "managementEvent": true,
    "recipientAccountId": "111111111111",
    "eventCategory": "Management",
    "tlsDetails": {
        "tlsVersion": "TLSv1.3",
        "cipherSuite": "TLS_AES_128_GCM_SHA256",
        "clientProvidedHostHeader": "us-east-1.signin.aws.amazon.com"
    }
}

The aws login command uses the OAuth 2.0 authorization code flow with PKCE (Proof Key for Code Exchange) to protect against authorization code interception attacks. This provides a secure alternative to setting up IAM user access keys for getting started with development on AWS. For guidance on additional modern authentication approaches and alternatives to long-term IAM access keys, see the AWS Security Blog post “Beyond IAM access keys: Modern authentication approaches for AWS.”

Conclusion

The login for AWS local development feature is a secure-by-default enhancement that helps customers eliminate the use of long-term credentials for programmatic access with AWS. With aws login, you can start building immediately using the same credentials you use to sign in to the AWS Management Console. This feature is now available across all AWS commercial Regions (excluding China and GovCloud) at no additional cost to customers.

For more information, visit the authentication and access section in the CLI user guide.

If you have feedback about this post, submit comments in the Comments section below.

Shreya Jain

Shreya Jain

Shreya is a Senior Technical Product Manager in AWS Identity. She is energized by bringing clarity and simplicity to complex ideas. When she’s not applying her creative energy at work, you’ll find her at Pilates, dancing, or discovering her next favorite coffee shop.

Sowjanya Rajavaram

Sowjanya Rajavaram

Sowjanya is a Sr Solutions Architect who specializes in Identity and Security in AWS. She works on helping customers of all sizes solve their identity and access management problems. She enjoys traveling and exploring new cultures and food.

AWS designated as a critical third-party provider under EU’s DORA regulation

Post Syndicated from Andrew Vennekotter original https://aws.amazon.com/blogs/security/aws-designated-as-a-critical-third-party-provider-under-eus-dora-regulation/

Amazon Web Services has been designated as a critical third-party provider (CTPP) by the European Supervisory Authorities (ESAs) under the European Union’s Digital Operational Resilience Act (DORA).

This designation is a key milestone in the EU’s implementation of DORA, which took effect in January 2025 and aims to strengthen the operational resilience of the EU financial sector. Under this regulation, certain third-party information and communications technology (ICT) service providers identified as playing a critical role for financial entities in the EU are subject to direct joint oversight by the European Banking Authority (EBA), the European Securities and Markets Authority (ESMA), and the European Insurance and Occupational Pensions Authority (EIOPA).

AWS recognizes the significance of this oversight for our financial services customers as they advance their digital transformation and modernization efforts, which remain essential to their long-term resilience and competitiveness.

What the CTPP designation means for customers

  • Financial institutions that use AWS services should note that AWS is engaged in an active oversight relationship with the ESAs.
  • AWS will maintain its commitment to operational resilience as part of the oversight activities associated with the designation.
  • Customers can use AWS security, resilience, and compliance features while maintaining control over their own cloud environments and compliance journeys.

Proven readiness for DORA oversight

AWS has been engaging with EU institutions, national competent authorities, and the broader financial regulatory community for years, helping to build a more resilient and secure financial system.

Our readiness for this oversight process builds on our demonstrated experience in meeting rigorous operational and regulatory standards. AWS has made, and will continue to make, investments in compliance, risk management, operational resilience, and transparency, which are critical pillars of DORA.

Being designated as a CTPP means AWS will now participate in a formal oversight process. We expect that this process will promote a deeper understanding of how AWS and other cloud technologies help enhance the resilience of the financial services industry.

Supporting customers through DORA implementation

Although AWS is now subject to direct oversight under DORA, we remain equally focused on supporting our financial services customers that are subject to the regulation.

Operational resilience is both a compliance requirement for DORA and a business necessity. Our services are designed to help financial institutions achieve high availability, durability, and scalability, while maintaining robust controls and visibility into their operations.

Our dedicated team of security and compliance specialists is ready to assist financial organizations in understanding how AWS security and compliance features can help them fulfill their obligations under DORA and how AWS services help to support their compliance strategies. We offer detailed documentation, whitepapers, and compliance guides tailored to DORA’s key requirements, such as the AWS User Guide to DORA and Amazon Web Services’ Approach to Operational Resilience in the Financial Sector & Beyond. To learn more about our security and compliance resources, visit the AWS Trust Center. Customers can also download our third-party attestations and certifications through AWS Artifact.

If you have feedback about this post, submit comments in the Comments section below.

Andrew Vennekotter

Andrew Vennekotter

Andrew is the Head of Regulatory Assurance for EMEA within the AWS Security organization. He combines 16 years of public sector experience in technology policy, cybersecurity, counterterrorism, and security policy at NASA and the U.S. State Department with nine years of experience in software engineering, information security, and responsible AI. In his spare time, he enjoys hiking, coming up with new dad jokes, and pretending to be a novelist.

Accelerate workflow development with enhanced local testing in AWS Step Functions

Post Syndicated from Donnie Prakoso original https://aws.amazon.com/blogs/aws/accelerate-workflow-development-with-enhanced-local-testing-in-aws-step-functions/

Today, I’m excited to announce enhanced local testing capabilities for AWS Step Functions through the TestState API, our testing API.

These enhancements are available through the API, so you can build automated test suites that validate your workflow definitions locally on your development machines, test error handling patterns, data transformations, and mock service integrations using your preferred testing frameworks. This launch introduces an API-based approach for local unit testing, providing programmatic access to comprehensive testing capabilities without deploying to Amazon Web Services (AWS).

There are three key capabilities introduced in this enhanced TestState API:

  • Mocking support – Mock state outputs and errors without invoking downstream services, enabling true unit testing of state machine logic. TestState validates mocked responses against AWS API models with three validation modes: STRICT (this is the default and validates all required fields), PRESENT (validates field types and names), and NONE (no validation), providing high-fidelity testing.

  • Support for all state types – All state types, including advanced states such as Map states (inline and distributed), Parallel states, activity-based Task states, .sync service integration patterns, and .waitForTaskToken service integration patterns, can now be tested. This means you can use TestState API across your entire workflow definition and write unit tests to verify control flow logic, including state transitions, error handling, and data transformations.

  • Testing individual states – Test specific states within a full state machine definition using the new stateName parameter. You can provide the complete state machine definition one time and test each state individually by name. You can control execution context to test specific retry attempts, Map iteration positions, and error scenarios.

Getting started with enhanced TestState
Let me walk you through these new capabilities in enhanced TestState.

Scenario 1: Mock successful results

The first capability is mocking support, which you can use to test your workflow logic without invoking actual AWS services or even external HTTP requests. You can either mock service responses for fast unit testing or test with actual AWS services for integration testing. When using mocked responses, you don’t need AWS Identity and Access Management (IAM) permissions.

Here’s how to mock a successful AWS Lambda function response:

aws stepfunctions test-state --region us-east-1 \
--definition '{
  "Type": "Task",
  "Resource": "arn:aws:states:::lambda:invoke",
  "Parameters": {"FunctionName": "process-order"},
  "End": true
}' \
--mock '{"result":"{\"orderId\":\"12345\",\"status\":\"processed\"}"}' \
--inspection-level DEBUG

This command tests a Lambda invocation state without actually calling the function. TestState validates your mock response against the Lambda service API model so your test data matches what the real service would return.

The response shows the successful execution with detailed inspection data (when using DEBUG inspection level):

{
    "output": "{\"orderId\":\"12345\",\"status\":\"processed\"}",
    "inspectionData": {
        "input": "{}",
        "afterInputPath": "{}",
        "afterParameters": "{\"FunctionName\":\"process-order\"}",
        "result": "{\"orderId\":\"12345\",\"status\":\"processed\"}",
        "afterResultSelector": "{\"orderId\":\"12345\",\"status\":\"processed\"}",
        "afterResultPath": "{\"orderId\":\"12345\",\"status\":\"processed\"}"
    },
    "status": "SUCCEEDED"
}

When you specify a mock response, TestState validates it against the AWS service’s API model so your mocked data conforms to the expected schema, maintaining high-fidelity testing without requiring actual AWS service calls.

Scenario 2: Mock error conditions
You can also mock error conditions to test your error handling logic:

aws stepfunctions test-state --region us-east-1 \
--definition '{
  "Type": "Task",
  "Resource": "arn:aws:states:::lambda:invoke",
  "Parameters": {"FunctionName": "process-order"},
  "End": true
}' \
--mock '{"errorOutput":{"error":"Lambda.ServiceException","cause":"Function failed"}}' \
--inspection-level DEBUG

This simulates a Lambda service exception so you can verify how your state machine handles failures without triggering actual errors in your AWS environment.

The response shows the failed execution with error details:

{
    "error": "Lambda.ServiceException",
    "cause": "Function failed",
    "inspectionData": {
        "input": "{}",
        "afterInputPath": "{}",
        "afterParameters": "{\"FunctionName\":\"process-order\"}"
    },
    "status": "FAILED"
}

Scenario 3: Test Map states
The second capability adds support for previously unsupported state types. Here’s how to test a Distributed Map state:

aws stepfunctions test-state --region us-east-1 \
--definition '{
  "Type": "Map",
  "ItemProcessor": {
    "ProcessorConfig": {"Mode": "DISTRIBUTED", "ExecutionType": "STANDARD"},
    "StartAt": "ProcessItem",
    "States": {
      "ProcessItem": {
        "Type": "Task", 
        "Resource": "arn:aws:states:::lambda:invoke",
        "Parameters": {"FunctionName": "process-item"},
        "End": true
      }
    }
  },
  "End": true
}' \
--input '[{"itemId":1},{"itemId":2}]' \
--mock '{"result":"[{\"itemId\":1,\"status\":\"processed\"},{\"itemId\":2,\"status\":\"processed\"}]"}' \
--inspection-level DEBUG

The mock result represents the complete output from processing multiple items. In this case, the mocked array must match the expected Map state output format.

The response shows successful processing of the array input:

{
    "output": "[{\"itemId\":1,\"status\":\"processed\"},{\"itemId\":2,\"status\":\"processed\"}]",
    "inspectionData": {
        "input": "[{\"itemId\":1},{\"itemId\":2}]",
        "afterInputPath": "[{\"itemId\":1},{\"itemId\":2}]",
        "afterResultSelector": "[{\"itemId\":1,\"status\":\"processed\"},{\"itemId\":2,\"status\":\"processed\"}]",
        "afterResultPath": "[{\"itemId\":1,\"status\":\"processed\"},{\"itemId\":2,\"status\":\"processed\"}]"
    },
    "status": "SUCCEEDED"
}

Scenario 4: Test Parallel states
Similarly, you can test Parallel states that execute multiple branches concurrently:

aws stepfunctions test-state --region us-east-1 \
--definition '{
  "Type": "Parallel",
  "Branches": [
    {"StartAt": "Branch1", "States": {"Branch1": {"Type": "Pass", "End": true}}},
    {"StartAt": "Branch2", "States": {"Branch2": {"Type": "Pass", "End": true}}}
  ],
  "End": true
}' \
--mock '{"result":"[{\"branch1\":\"data1\"},{\"branch2\":\"data2\"}]"}' \
--inspection-level DEBUG

The mock result must be an array with one element per branch. By using TestState, your mock data structure matches what a real Parallel state execution would produce.

The response shows the parallel execution results:

{
    "output": "[{\"branch1\":\"data1\"},{\"branch2\":\"data2\"}]",
    "inspectionData": {
        "input": "{}",
        "afterResultSelector": "[{\"branch1\":\"data1\"},{\"branch2\":\"data2\"}]",
        "afterResultPath": "[{\"branch1\":\"data1\"},{\"branch2\":\"data2\"}]"
    },
    "status": "SUCCEEDED"
}

Scenario 5: Test individual states within complete workflows
You can test specific states within a full state machine definition using the stateName parameter. Here’s an example testing a single state, though you would typically provide your complete workflow definition and specify which state to test:

aws stepfunctions test-state --region us-east-1 \
--definition '{
  "Type": "Task",
  "Resource": "arn:aws:states:::lambda:invoke",
  "Parameters": {"FunctionName": "validate-order"},
  "End": true
}' \
--input '{"orderId":"12345","amount":99.99}' \
--mock '{"result":"{\"orderId\":\"12345\",\"validated\":true}"}' \
--inspection-level DEBUG

This tests a Lambda invocation state with specific input data, showing how TestState processes the input and transforms it through the state execution.

The response shows detailed input processing and validation:

{
    "output": "{\"orderId\":\"12345\",\"validated\":true}",
    "inspectionData": {
        "input": "{\"orderId\":\"12345\",\"amount\":99.99}",
        "afterInputPath": "{\"orderId\":\"12345\",\"amount\":99.99}",
        "afterParameters": "{\"FunctionName\":\"validate-order\"}",
        "result": "{\"orderId\":\"12345\",\"validated\":true}",
        "afterResultSelector": "{\"orderId\":\"12345\",\"validated\":true}",
        "afterResultPath": "{\"orderId\":\"12345\",\"validated\":true}"
    },
    "status": "SUCCEEDED"
}

These enhancements bring the familiar local development experience to Step Functions workflows, helping me to get instant feedback on changes before deploying to my AWS account. I can write automated test suites to validate all Step Functions features with the same reliability as cloud execution, providing confidence that my workflows will work as expected when deployed.

Things to know
Here are key points to note:

  • Availability – Enhanced TestState capabilities are available in all AWS Regions where Step Functions is supported.
  • Pricing – TestState API calls are included with AWS Step Functions at no additional charge.
  • Framework compatibility – TestState works with any testing framework that can make HTTP requests, including Jest, pytest, JUnit, and others. You can write test suites that validate your workflows automatically in your continuous integration and continuous delivery (CI/CD) pipeline before deployment.
  • Feature support – Enhanced TestState supports all Step Functions features including Distributed Map, Parallel states, error handling, and JSONata expressions.
  • Documentation – For detailed options for different configurations, refer to the TestState documentation and API reference for the updated request and response model.

Get started today with enhanced local testing by integrating TestState into your development workflow.

Happy building!
Donnie

Optimize latency-sensitive workloads with Amazon EC2 detailed NVMe statistics

Post Syndicated from Sanjeev Malladi original https://aws.amazon.com/blogs/compute/optimize-latency-sensitive-workloads-with-amazon-ec2-detailed-nvme-statistics/

Amazon Elastic Cloud Compute (Amazon EC2) instances with locally attached NVMe storage can provide the performance needed for workloads demanding ultra-low latency and high I/O throughput. High-performance workloads, from high-frequency trading applications and in-memory databases to real-time analytics engines and AI/ML inference, need comprehensive performance tracking. Operating system tools like iostat and sar provide valuable system-level insights, and Amazon CloudWatch offers important disk IOPs and throughput measurements, but high-performance workloads can benefit from even more detailed visibility into instance store performance.

For latency-sensitive applications where every millisecond counts, enhanced performance monitoring tools provide deep visibility into storage systems, so your teams can track and analyze behavior at a 1 second granularity. This detailed insight can help your organization detect bottlenecks quickly, fine-tune application performance, and deliver reliable service.

In this post, we discuss how you can use Amazon EC2 detailed performance statistics for instance store NVMe volumes, a set of new metrics that provide per-second granularity, to provide real-time visibility into your locally attached storage performance. These statistics are similar to the Amazon EBS detailed performance statistics, providing a consistent monitoring experience across both storage types. You can access these statistics directly from your NVMe devices attached to the Amazon EC2 instance using nvme-cli or using CloudWatch agent to monitor I/O performance at the storage level. We also provide examples of how to use these statistics to identify performance bottlenecks.

Feature overview

Amazon EC2 Nitro-based instances with locally attached NVMe instance storage now offer 11 comprehensive metrics at per-second granularity. These metrics, similar to EBS volume metrics, include queue length measurements, IOPS, throughput data, and IO latency histograms for the locally attached NVMe instance storage. Additionally, they also include IO size-specific latency histograms to provide even more detailed insights into performance patterns of the local NVMe instance storage. These metrics are collected and presented separately for each individual NVMe volume available on an instance.

The statistics are presented in three main formats:

    1. Cumulative counters that track IO operations, throughput, and read/write times
    2. Real-time queue length, displaying the current value at the time of your query
    3. Latency histograms visualizing the distribution of IO operations across different latency ranges by displaying both cumulative view and IO size-specific distributions

Prerequisites

To access detailed performance statistics for local instance storage, complete the following steps:

    1. Launch a new Amazon EC2 Nitro instance or use an existing one, then connect to it using SSH or your preferred connection method.
    2. Identify the NVMe device associated with the local storage to query for the performance statistics. For example, you can run the nvme-cli command in the CLI to output all NVMe devices on the instance.
      $ sudo nvme list.

      The following is an example output of the list command that lists the NVMe devices on the instance and their volume Serial Numbers (SN; masked in the below output for privacy). In this demonstration, consider that the local storage used by your application is /dev/nvme1n1.

      Terminal output showing five NVMe devices: one EBS volume and four EC2 instance storage volumes with 3.75TB capacity each

    3. If you are using Amazon Linux 2023 version 2023.8.20250915 (or later) or Amazon Linux 2 2.0.20251014.0 (or later) you can proceed to Step 4 because nvme-cli will use the latest version. If you are using an earlier Amazon Linux version, update the nvme-cli using the following command, where 2023.8.20250915 can be replaced with the latest Amazon Linux 2023 version:
      $ sudo dnf upgrade --releasever=2023.8.20250915
    4. Run the nvme-cli, with the correct permissions, and pass the device as a parameter. You can use --help to get details on the command usage:
      $ sudo nvme amzn stats --help

      Example output:
      Command help output for 'nvme amzn stats' showing usage syntax and format options
      If you prefer output in a JSON format, you can provide the -o json parameter to the command.

      $ sudo nvme amzn stats /dev/nvme1n1 -o json

      The following output (without the -o json parameter) shows cumulative read/write operations, read/write bytes, total processing time (read and write in microseconds), and duration (in microseconds) when application attempted to exceed the instance’s IOPS/throughput limits.
      Storage performance metrics showing read operations count, total bytes, and timing statistics for an EC2 NVMe volume
      It also displays read/write I/O latency histograms, with each row representing completed I/O operations within a specific bin of time (in microseconds).
      Read latency distribution histogram showing operation counts across different microsecond ranges, with peak activity in 2048-4096 rangeWrite latency distribution histogram showing zero operations across all time ranges, indicating no write activity
      If you want to view the latency histograms across 5 different IO bands: (0, 512 Byte], (512B, 4KiB], (4KiB, 8KiB], (8KiB 32KiB], (32 KiB, MAX], you can provide --details or -d parameter to the command:

      $ sudo nvme amzn stats -d /dev/nvme1n

      The following image is an excerpt of the above command’s output, showing the additional latency histograms (read and write) of the 5 different IO bands.
      Dual read/write I/O latency histogram analyzing small block operations from 0-512 bytes with peak at 4096-8192 rangePerformance analysis histogram showing I/O patterns for 512-4K blocks with significant activity in 512-1024 rangeDual histogram showing I/O latency patterns for 4K-8K block operations with concentrated activity at 4096-8192Performance analysis histogram displaying I/O patterns for 8K-32K blocks with peak activity in 4096-8192 rangeComprehensive I/O latency histogram analyzing largest block sizes from 32K to maximum with concentrated activity in 4096-8192

You can run the stats command at a per second granularity. You can also write scripts to pull the stats at a desired interval (every second or any other duration) with each subsequent output reflecting the updated cumulative totals for the metrics. Calculating the difference in the statistics across the last two outputs allows you to derive insight into the instance storage profile during the interval. Below is a sample script you can use to pull the stats at a default interval of 1 second or at your desired interval.

#!/bin/bash 
# interval of 1 second 
INTERVAL=${1:-1} 
while true; do 
	echo "=== $(date) ===" 
	sudo nvme amzn stats /dev/nvme1 || break 
	echo 
	sleep $INTERVAL 
done

You can save this script, make it executable and run it at either the default 1-second interval or provide a custom interval when executing the script. For example, if you saved the script as nvme_stats.sh, you could use the following commands to make it executable and run to get the output at the default 1-second interval (assuming you are in the same directory as that of nvme_stats.sh).

chmod +x nvme_stats.sh
./nvme_stats.sh

If, for instance, you want to get the output at every 5 seconds, you can use the command below (after making the script executable)

./nvme_stats.sh 5

You can also integrate with CloudWatch using CloudWatch agent to collect and publish these statistics for historical tracking, trend visualization through dashboards, and performance-based alerts to correlate with application metrics and automated notifications for performance issues.

Deriving insights from the Amazon EC2 instance store NVMe detailed performance statistics

Similar to EBS detailed performance statistics, you can use Amazon EC2 instance store NVMe statistics to troubleshoot various workload performance issues. As mentioned in the preceding section, you can also use the detailed statistics to view I/O latency histograms to observe the spread of I/O latency within the period. You can use the read/write operations and time spent statistics to calculate the average latency. The detailed statistics show the average latency at per-second granularity.

The next two example scenarios demonstrate key performance analysis using the statistics. In Scenario 1, we will use the EC2 Instance Local Storage Performance Exceeded (us) metric to check if I/O demands exceed instance storage capabilities, helping with instance right-sizing for sufficient I/O application performance. In Scenario 2, we will use IO-size specific histograms (using --details) to diagnose how large block writes affect subsequent read performance – an issue typically hidden by traditional monitoring tools’ aggregated metrics across all IO sizes.

Scenario 1: Identifying when applications exceed instance storage performance limits

Understanding whether your application’s I/O demands exceed your instance store volumes’ capabilities is important for performance troubleshooting. When applications generate I/O workloads that consistently attempt to exceed the IOPS and throughput limits of specific Amazon EC2 instance types, you’ll experience increased latency and degraded performance. The EC2 Instance Local Storage Performance Exceeded (us) metric helps identify these scenarios by showing the duration (in microseconds) when workloads exceeded supported instance performance. A non-zero value or increasing count between snapshots indicates your current instance size or type may not provide sufficient I/O performance for your application.

The following section shows how to identify if an application is sending more IOPS than the instance’s local storage can support.

The example scenario: An application on an i3en.xlarge instance shows elevated write latency of >1ms. You want to determine if the application’s workload is exceeding the instance’s NVMe volume supported performance.

    1. Select the Instance Storage NVMe device you want to analyze – Identify the instance you want to analyze for the application experiencing elevated latency.
    2. Identify the NVMe device – Use the following nvme-cli command, and identify the NVMe device associated with that instance storage.
      $ sudo nvme list

      Example scenario: We used the list and identified /dev/nvme1n1 as the NVMe device associated with the i3en.xlarge instance that is running the application which is currently seeing elevated write latency >1ms (while read latency is <50us as per normal conditions), so now we want to. analyze it.

    3. Collect statistics for the device at a single point in time or at desired intervals – Collect the detailed performance statistics using the nvme-cli command or use the sample script provided in previous section to capture statistics at the desired intervals, if needed.
      $ sudo nvme amzn stats /dev/nvme1n1

      Example scenario: We choose to collect the statistics only once after noticing elevated write latency of the application.

    4. Analyze the statistics to check if the application demands more than the supported performance of the instance storage – Confirm existence of overall I/O latency degradation by comparing two sets of read/write I/O latency histograms taken some time apart.Example scenario: The following output shows Read IO histogram of the NVMe local instance storage taken 40 seconds apart with no read IO latency issues (as normal read latency for this workload is < 50 us).

      Metric captured at time T:
      AWS EC2 storage performance histogram showing read latency distribution, peak at 16-32 microsecond bucket
      Metric captured at time T+40s:
      AWS EC2 storage performance data showing increased read latency concentration in 16-32 microsecond bucket
      The following output shows Write IO histogram taken 40 seconds apart. We can discern that many write IOs fall into the 1ms – 2ms latency range, which is not expected for this application.
      Metric captured at time T:
      AWS EC2 storage write performance data showing majority of operations between 1-2ms latency
      Metric captured at time T+40s:
      AWS EC2 storage performance metrics showing increased write operations clustered in 1-2ms latency range

    5. Analyze the EC2 Instance Local Storage Performance Exceeded (us) metric which shows total time (in microseconds) IOPS requests exceed volume limits. Ideally, the incremental count of this metric between two snapshot times should be minimal, as any value above 0 indicates that the workload demanded more IOPS than the volume could deliver.Example scenario: Comparing metrics 40 seconds apart shows that for more than 34 seconds, the application’s IOPS demands surpassed the IOPS supported by the local instance storage. This explains elevated write latency: excess IOPS above what the underlying storage can physically handle queue the operations, increasing wait times. This indicates that the i3en.xlarge instance chosen to run this application cannot meet the application’s performance requirements, suggesting either upgrading to a larger instance size or re-evaluating the instance type itself.
      Metric captured at time T:
      EC2 Instance Local Storage Performance exceeded output of nvme-cli for the described scenario at time T
      Metric captured at time T+40s:
      EC2 Instance Local Storage Performance exceeded output of nvme-cli for the described scenario at time T+40 with increased count of metric

It’s important to have the right instance size to avoid performance bottlenecks to your application. Refer to the Amazon EC2 instance documentation for more information on the different instances and their storage size.

Scenario 2: Identifying the block size causing elevated latency in your applications

Many storage performance issues arise from complex interactions between read and write operations with different I/O sizes, which traditional system-level monitoring tools like iostat or sar cannot effectively diagnose due to their aggregated metrics across all I/O sizes. EC2 instance store NVMe detailed performance statistics solves this by providing I/O-size specific latency histograms through the --details option in NVMe CLI. These histograms show latency data for different I/O size ranges: (0, 512 Byte], (512B, 4KiB], (4KiB, 8KiB], (8KiB, 32KiB], (32KiB, MAX], for a more precise correlation between application workload patterns and I/O size-specific latency metrics for targeted optimizations.

In this example scenario, your application performs small reads (typically <=4KiB, like metadata read) followed by large writes (>=32KiB) and shows unexpectedly high read latency. This common issue occurs when large writes impact subsequent read operations’ performance, creating a cascading effect on overall I/O performance.

    1. Gather read and write IO latency by size ranges – Use the NVMe CLI with the --details option to gather read and write IO latency by size ranges:
      $ sudo nvme amzn stats /dev/nvme1n1 --details

    2. Confirm existence of overall IO latency degradation – In the example scenario, examining overall IO latency, both read (left) and write (right) operations are showing higher than expected latency.
      NVMe storage read latency histogram highlighting concentrated IO operations in 4K-16K microsecond rangeNVMe storage write latency histogram highlighting concentrated IO operations in 8-32K microsecond range
    3. Examine the output for patterns across different IO size bands – Analyzing latency by operation sizes shows small read operations (512 bytes to 4K), typically fast, are experiencing unexpected latency spikes while large writes (32K+) show significant delays. Small reads should theoretically maintain good performance regardless of other I/O activities.
      NVMe storage read/write latency histogram highlighting concentrated IO operations in 8-16K microsecond range for IO band of 512 - 4KNVMe storage read/write latency histogram highlighting concentrated IO operations in 8-16K microsecond range in IO band 32K and above
      The observed pattern indicates that the backed-up large write operations create system-wide congestion, affecting all I/O operations of types and sizes. Despite the storage system’s capability to handle small reads efficiently, the queued large writes slow down both read and write operations at the application level.

Based on this analysis, we can implement several targeted optimizations to the application, like using smaller block sizes for write operations when possible, or batching smaller writes instead of performing large single writes.

Clean up

If you created an Amazon EC2 instance with NVMe volume for this exercise, then terminate and delete the appropriate instance to avoid future costs.

Conclusion

Amazon EC2 detailed performance statistics for instance store NVMe volumes provide real-time, sub-minute storage performance monitoring, similar to the detailed performance statistics available for Amazon EBS volumes. This offers consistent monitoring experience across both storage types, with additional IO-size based latency histograms for instance storage for better optimization of I/O patterns, and more effective troubleshooting.

To learn more about Amazon EC2 instance store NVMe volumes, optimization techniques for latency-sensitive workloads or other Amazon EC2 related topics, visit the Amazon EC2 documentation page or explore our other AWS Storage Blog posts on performance optimization.

We’d love to hear how you’re using these statistics to enhance your workloads, or if you have any questions, in the comments section below.

Introducing Rapid7 Curated Intelligence Rules for AWS Network Firewall

Post Syndicated from Rapid7 original https://www.rapid7.com/blog/post/cds-rapid7-curated-intelligence-rules-aws-network-firewall

Outsmart attackers with smarter rules

Managing network security in a dynamic cloud environment is a constant challenge. As traffic volume grows and threat actors evolve their tactics, organizations need protection that can scale effortlessly while delivering robust, intelligent defense. That’s where a service like AWS Network Firewall becomes essential, and we’re excited to partner with AWS to make it even more powerful.

What is AWS Network Firewall?

AWS Network Firewall (AWS NWF) is a managed service that provides essential, auto-scaling network protections for Amazon Virtual Private Clouds (VPCs). While its flexible rules engine offers granular control, defining and maintaining the right rules to defend against evolving threats is a complex and resource-intensive task.

Manually creating and updating rules often leads to coverage gaps and creates significant operational overhead. To simplify this process and empower teams to act with confidence, Rapid7 is proud to announce the availability of Curated Intelligence Rules for AWS Network Firewall. As an AWS partner, we convert our curated intelligence on Indicators of Compromise (IOCs) from into high-quality rule groups, delivering expert-vetted threat intelligence directly within your native AWS experience.

Harnessing industry-leading threat intelligence

In the world of threat intelligence, more isn’t always better. Too many low-fidelity alerts generate noise, distract analysts, and leave teams chasing false positives. At Rapid7, our approach is different. We focus on delivering high-fidelity intelligence, enabling customers to zero in on the threats most relevant to their unique environments. 

Rapid7 Curated Intelligence Rules embody this same approach, and are built on three key principles:


Focus on quality over quantity – Rules emphasize meaningful, low-noise detection directly aligned with current, real-world threats, significantly reducing alert fatigue.

Curated global intelligence – Rule sets are powered by high-quality, region-specific data from unique sources, providing unparalleled visibility and context for actionable detections.

Dynamic and self-cleaning rule sets – Threat intelligence is not static. Using Rapid7’s proprietary , rules are automatically retired when an IOC passes a certain threshold, ensuring the delivered intelligence is always fresh, relevant, and current.

We’re launching with two distinct rule sets, each designed to address today’s most pressing threats:

  • Advanced Persistent Threat (APT) campaigns: Targets the subtle and persistent techniques used by state-sponsored and sophisticated threat actors.

  • Ransomware & cybercrime: Focuses on the tools, infrastructure, and indicators associated with financially motivated attacks.

These rule sets are updated daily to ensure you have the most current protections. Furthermore, our intelligence is dynamic. When an IOC passes a certain threshold in our proprietary Decay Scoring system, we remove it from the rule set. This process guarantees that the intelligence you receive is always current and actionable, significantly reducing alert fatigue.

The operational advantage

These Curated Intelligence Rules deliver immediate and tangible value, allowing your team to:

  • Automate threat protection: Reduce overhead with curated, continuously updated detections delivered natively within AWS Network Firewall.

  • Adopt protections faster: Deploy protections powered by Rapid7 Labs intelligence with just a few clicks in the console.

  • Maintain predictable operations: Rely on AWS-validated updates, clear rule group metadata, and transparent per-GB metering.

Common use cases addressed

Our rule sets provide practical defense against a wide range of attack scenarios. You can:

  • Block command and control (C2) communication from known malware families

  • Detect network reconnaissance activity associated with advanced persistent threats

  • Prevent data exfiltration to malicious domains linked to cybercrime groups

  • Identify and stop the download of malware payloads from compromised websites

  • Alert on traffic to newly registered domains used in malicious activities

Get started with Curated Intelligence Rules for AWS NFW today

Ready to enhance your cloud security with curated, actionable intelligence? Add our rule sets to your and strengthen your organization’s defenses in minutes.
››› Visit the listing in the AWS Marketplace to learn more.

Simplify cloud security with managed rules from AWS Marketplace for AWS Network Firewall

Post Syndicated from Dhanil Parwani original https://aws.amazon.com/blogs/security/simplify-cloud-security-with-managed-rules-from-aws-marketplace-for-aws-network-firewall/

AWS Network Firewall now supports managed rules curated by AWS Partners—giving you pre-built threat intelligence and security controls that reduce the need to create and maintain your own rule sets. This new capability helps organizations strengthen their network security posture with continuously updated AWS partner managed protection.

What are managed rules from AWS Marketplace for Network Firewall?

Managed rules from AWS Marketplace are curated by AWS Partners who automatically update rules to address emerging threats, providing you comprehensive protection without the operational overhead of managing custom rules. As shown in Figure 1, you can now deploy Network Firewall managed rules from AWS Marketplace in a few clicks, reducing the time it takes you to create custom security rules. You can use the AWS Management Console to choose from a variety of specialized rule groups tailored to different industry needs, compliance requirements, and threat landscapes.

Figure 1: Adding managed rules from AWS Marketplace for AWS Network Firewall

Figure 1: Managed rules from AWS Marketplace for AWS Network Firewall

Key benefits and use cases

Managing firewalls across multiple virtual private clouds (VPCs) can become challenging when it comes to keeping up with creating, maintaining, and updating custom rule sets. This only increases with the growing number of firewalls that require constant monitoring to protect against emerging threats and new attack vectors. While AWS Managed Rules rule groups provide a solid foundation, managed rules from AWS Marketplace help customers add expert-curated rules with a few clicks.

You can associate managed rules from AWS Marketplace partners directly to your AWS Network Firewall and see them in action in one of the many network firewall deployment models as shown in Deployment models for AWS Network Firewall with VPC routing enhancements. These rules seamlessly fit into your traffic inspection patterns and don’t require additional routing-related configuration changes.

Keeping up to date on the constantly changing threat landscape can be time-consuming and expensive. AWS Marketplace partners automatically update managed rule groups and provide new versions of rule groups when new vulnerabilities and threats emerge. Continuously updated rules lead to a more robust security posture.

Prerequisites

To start using managed rules from AWS Marketplace, you need to meet the following prerequisites:

You can use managed rules from AWS Marketplace partners with all Network Firewall deployment models.

Set up AWS Marketplace managed rules

With the prerequisites in place, you’re ready to set up managed rules from AWS Marketplace.

To set up managed rules:

  1. Sign in to the Amazon Virtual Private Cloud (Amazon VPC) console.
  2. In the navigation pane, choose Network Firewall and then choose Network Firewall rule groups.
  3. Choose AWS Marketplace.

    Figure 2: AWS Marketplace rule groups

    Figure 2: AWS Marketplace rule groups

  4. Under AWS Marketplace, you’ll see different types of rule groups curated by AWS Partners. You can select the partner and the rule group you want to apply as part of your Network Firewall policies. Locate the partner and rule group that you want to add and choose View subscription options next to that rule group.

    Figure 3: View subscription options for partner rule groups in AWS Marketplace

    Figure 3: View subscription options for partner rule groups in AWS Marketplace

  5. After you choose View subscription options, you’ll see the Subscription options window. Review the options and then choose Subscribe.

    Figure 4: Review subscription options and subscribe to partner product

    Figure 4: Review subscription options and subscribe to partner product

  6. When subscribed, go to Firewall Policies and choose from an existing firewall policy or create a new one as described in Creating a firewall policy.

    Figure 5: Choose a firewall policy to associate rule groups

    Figure 5: Choose a firewall policy to associate rule groups

  7. After you select the firewall policy, choose Actions and then select Add Partner managed rule groups.
    Figure 6: Add partner managed rule groups

    Figure 6: Add partner managed rule groups

  8. After you choose Add partner managed rule groups, select the previously subscribed rule groups.
    Figure 7: Select the rule groups

    Figure 7: Select the rule groups

  9. Choose Add to policy and confirm the rule groups were added to your firewall policy. You can modify rule groups later if necessary.

The firewall policy with partner managed rule groups is now ready to be associated to your Network Firewall as noted in Step 7 of Create a firewall.

Launch partners

We had the pleasure to work with the following partners at the launch of managed rules from AWS Marketplace for Network Firewall. Here is what some of our partners (in alphabetical order) have been saying. We continue to work with our partners to create more managed rule groups over time, which you can follow at AWS Network Firewall Partners.

Check Point Software

From pioneering stateful firewalls to our AI-powered, cloud-delivered security solutions, Check Point Software is committed to safeguarding organizations with an industry-leading 99.9% prevention rate. Check Point Managed Rules for AWS Network Firewall simplifies security by providing pre-configured rule sets designed by Check Point ThreatCloud AI experts. Delivered directly through AWS Marketplace, these rules enhance protection against hundreds of Common Vulnerabilities and Exposures (CVEs) and OWASP Top 10 vulnerabilities reducing manual effort and strengthening your cloud security posture.

Fortinet

Fortinet, a global leader in cybersecurity and trusted name in next-generation firewalls, now brings its AI-driven threat intelligence to AWS Network Firewall. The new Fortinet Managed IPS Rules deliver continuously updated, automated protection against exploits, malware, and command-and-control threats—enhancing AWS security without added complexity.

Infoblox

Infoblox unites networking, security and cloud with a protective DDI platform that delivers enterprise resilience and agility. Trusted by more than 13,000 customers, including the majority of Fortune 100 companies as well as emerging innovators, we seamlessly integrate, secure and automate critical network services so businesses can move fast without compromise.

Lumen

Lumen is thrilled to launch Defender Managed Rules for AWS Network Firewall, available now on AWS Marketplace. In partnership with AWS, this managed rule group brings proactive Black Lotus Labs-powered threat intelligence directly into AWS environments—enabling organizations to automatically block risky IPs using real-time, backbone-level data from Lumen’s global network. With seamless AWS Management Console integration and automatic updates, security and network teams can strengthen cloud defenses with expert-curated protection—no manual rule writing needed.

Rapid7

Rapid7 Managed Rules for AWS Network Firewall converts our curated, high-fidelity threat intelligence into dynamic, self-cleaning rule groups, delivering expert-vetted protection directly into your native AWS environment. Instantly deploy current protections against today’s most pressing threats, allowing your team to act with confidence and significantly reduce alert fatigue.

ThreatSTOP

ThreatSTOP delivers continuously updated threat intelligence that automatically blocks malicious domains and IPs through AWS Network Firewall. Building on its proven protection for AWS WAF, ThreatSTOP extends the same trusted enforcement to the network layer to protect both inbound and outbound traffic. The managed rules leverage thousands of curated global sources and proprietary research from the ThreatSTOP Security, Intelligence, and Research team to block command-and-control, phishing, and malware traffic in real time. Available in AWS Marketplace, ThreatSTOP helps organizations strengthen their cloud security posture, reduce unwanted connections, and maintain compliance with ITAR and OFAC requirements.

Trend Micro

Trend Micro, a leader in cloud-native application protection platforms (CNAPP), brings deep expertise in securing cloud environments to AWS customers. Backed by Trend Zero Day Initiative (ZDI), Trend Micro delivers curated, continuously updated malware rule groups, with CVE and exploit protection coming soon. Using early threat intelligence from ZDI, protections are published faster than other vendors, helping AWS customers stay ahead of attackers.

Partner statements represent their own views and claims. AWS does not independently verify partner performance metrics.

Conclusion

With managed rules from AWS Marketplace, customers can find, buy, and deploy industry-leading threat intelligence directly from the AWS Network Firewall console. By using these pre-built rules, security teams can focus on strategic initiatives while maintaining strong network protection. Evaluate available partner offerings and select rules that align with your security requirements and compliance needs.

Visit the AWS Network Firewall Documentation to learn more about implementing partner managed rules for your organization.

If you have feedback about this post, submit comments in the Comments section below. If you have questions about this post, start a new thread on AWS Network Firewall re:Post or contact AWS Support.

Dhanil Parwani
Dhanil Parwani

Dhanil is a Senior Partner Solutions Architect at AWS. He works closely with networking, security, and AI partners to build solutions and capabilities to enable and simplify their migrations and operations in the cloud. He holds an MS in telecommunications from the University of Colorado Boulder and has a passion for computer networking. Outside of work, Dhanil is an avid traveler and enjoys cheering on Liverpool, FC.
Amish Shah
Amish Shah

Amish is a seasoned product leader with more than 15 years of experience developing innovative and scalable solutions for networking, security, and cloud use cases. He currently leads the AWS Network Firewall service, where he helps develop security solutions that protect AWS workloads. Outside of work, Amish enjoys playing cricket and soccer, loves to travel, and has recently started collecting niche fragrances..

Streamlined multi-tenant application development with tenant isolation mode in AWS Lambda

Post Syndicated from Donnie Prakoso original https://aws.amazon.com/blogs/aws/streamlined-multi-tenant-application-development-with-tenant-isolation-mode-in-aws-lambda/

Multi-tenant applications often require strict isolation when processing tenant-specific code or data. Examples include software-as-a-service (SaaS) platforms for workflow automation or code execution where customers need to ensure that execution environments used for individual tenants or end users remain completely separate from one another. Traditionally, developers have addressed these requirements by deploying separate Lambda functions for each tenant or implementing custom isolation logic within shared functions which increased architectural and operational complexity.

Today, AWS Lambda introduces a new tenant isolation mode that extends the existing isolation capabilities in Lambda. Lambda already provides isolation at the function level, and this new mode extends isolation to the individual tenant or end-user level within a single function. This built-in capability processes function invocations in separate execution environments for each tenant, enabling you to meet strict isolation requirements without additional implementation effort to manage tenant-specific resources within function code.

Here’s how you can enable tenant isolation mode in the AWS Lambda console:

When using the new tenant isolation capability, Lambda associates function execution environments with customer-specified tenant identifiers. This means that execution environments for a particular tenant aren’t used to serve invocation requests from other tenants invoking the same Lambda function.

The feature addresses strict security requirements for SaaS providers processing sensitive data or running untrusted tenant code. You maintain the pay-per-use and performance characteristics of AWS Lambda while gaining execution environment isolation. Additionally, this approach delivers the security benefits of per-tenant infrastructure without the operational overhead of managing dedicated Lambda functions for individual tenants, which can quickly grow as customers adopt your application.

Getting started with AWS Lambda tenant isolation
Let me walk you through how to configure and use tenant isolation for a multi-tenant application.

First, on the Create function page in the AWS Lambda console, I choose Author from scratch option.

Then, under Additional configurations, I select Enable under Tenant isolation mode. Note that, tenant isolation mode can only be set during function creation and can’t be modified for existing Lambda functions.

Next, I write Python code to demonstrate this capability. I can access the tenant identifier in my function code through the context object. Here’s the full Python code:

import json
import os
from datetime import datetime

def lambda_handler(event, context):
    tenant_id = context.tenant_id
    file_path = '/tmp/tenant_data.json'

    # Read existing data or initialize
    if os.path.exists(file_path):
        with open(file_path, 'r') as f:
            data = json.load(f)
    else:
        data = {
            'tenant_id': tenant_id,
            'request_count': 0,
            'first_request': datetime.utcnow().isoformat(),
            'requests': []
        }

    # Increment counter and add request info
    data['request_count'] += 1
    data['requests'].append({
        'request_number': data['request_count'],
        'timestamp': datetime.utcnow().isoformat()
    })

    # Write updated data back to file
    with open(file_path, 'w') as f:
        json.dump(data, f, indent=2)

    # Return file contents to show isolation
    return {
        'statusCode': 200,
        'body': json.dumps({
            'message': f'File contents for {tenant_id} (isolated per tenant)',
            'file_data': data
        })
    }

When I’m finished, I choose Deploy. Now, I need to test this capability by choosing Test. I can see on the Create new test event panel that there’s a new setting called Tenant ID.

If I try to invoke this function without a tenant ID, I’ll get the following error “Add a valid tenant ID in your request and try again.”

Let me try to test this function with a tenant ID called tenant-A.

I can see the function ran successfully and returned request_count: 1. I’ll invoke this function again to get request_count: 2.

Now, let me try to test this function with a tenant ID called tenant-B.

The last invocation returned request_count: 1 because I never invoked this function with tenant-B. Each tenant’s invocations will use separate execution environments, isolating the cached data, global variables, and any files stored in /tmp.

This capability transforms how I approach multi-tenant serverless architecture. Instead of wrestling with complex isolation patterns or managing hundreds of tenant-specific Lambda functions, I let AWS Lambda automatically handle the isolation. This keeps tenant data isolated across tenants, giving me confidence in the security and separation of my multi-tenant application.

Additional things to know
Here’s a list of additional things you need to know:

  • Performance — Same-tenant invocations can still benefit from warm execution environment reuse for optimal performance.
  • Pricing — You’re charged when Lambda creates a new tenant-aware execution environment, with the price depending on the amount of memory you allocate to your function and the CPU architecture you use. For more details, view AWS Lambda pricing.
  • Availability — Available now in all commercial AWS Regions except Asia Pacific (New Zealand), AWS GovCloud (US), and China Regions.

This launch simplifies building multi-tenant applications on AWS Lambda, such as SaaS platforms for workflow automation or code execution. Learn more about how to configure tenant isolation for your next multi-tenant Lambda function in the AWS Lambda Developer Guide.

Happy building!
Donnie

New business metadata features in Amazon SageMaker Catalog to improve discoverability across organizations

Post Syndicated from Channy Yun (윤석찬) original https://aws.amazon.com/blogs/aws/new-business-metadata-features-in-amazon-sagemaker-catalog-to-improve-discoverability-across-organizations/

Amazon SageMaker Catalog, which is now built in to Amazon SageMaker, can help you collect and organize your data with the accompanying business context people need to understand it. It automatically documents assets generated by AWS Glue and Amazon Redshift, and it connects directly with Amazon Quick Sight, Amazon Simple Storage Service (Amazon S3) buckets, Amazon S3 Tables, and AWS Glue Data Catalog (GDC).

With only a few clicks, you can curate data inventory assets with the required business metadata by adding or updating business names (asset and schema), descriptions (asset and schema), read me, glossary terms (asset and schema), and metadata forms. You can also create AI-generated suggestions, review and refine descriptions, and publish enriched asset metadata directly to the catalog. This helps reduce manual documentation effort, improves metadata consistency, and accelerates asset discoverability across organizations.

Starting today, you can use new capabilities in Amazon SageMaker Catalog metadata to improve business metadata and search:

  • Column-level metadata forms and rich descriptions – You can create custom metadata forms to capture business-specific information directly in individual columns. Columns also support markdown-enabled rich text descriptions for comprehensive data documentation and business context.
  • Enforce metadata rules for glossary terms for asset publishing – You can use metadata enforcement rules for glossary terms, meaning data producers must use approved business vocabulary when publishing assets. By standardizing metadata practices, your organization can improve compliance, enhance audit readiness, and streamline access workflows for greater efficiency and control.

These new SageMaker Catalog metadata capabilities help address consistent data classification and improve discoverability across your organizational catalogs. Let’s take a closer look at each capability.

Column-level metadata forms and rich descriptions
You can now use custom metadata forms and rich text descriptions at the column level, extending existing curation capabilities for business names, descriptions, and glossary term classifications. Custom metadata form field values and rich text content are indexed in real time and become immediately discoverable through search.

To edit column-level metadata, select the schema of your catalog asset used in your project and choose the View/Edit action for each column.

When you choose one of the columns as an asset owner, you can define custom key-value metadata forms and markdown descriptions to provide detailed column documentation.

Now data analysts in your organization can search using custom form field values and rich text content, alongside existing column names, descriptions, and glossary terms.

Enforce metadata rules for glossary terms for asset publishing
You can define mandatory glossary term requirements for data assets during the publishing workflow. Your data producers must now classify their assets with approved business terms from organizational glossaries before publication, promoting consistent metadata standards and improving data discoverability. The enforcement rules validate that required glossary terms are applied, preventing assets from being published without proper business context.

To enable a new metadata rule for glossary terms, choose Add in your domain units under the Domain Management section in the Govern menu.

Now you can select either Metadata forms or Glossary association as a type of requirement for the rule. When you select Glossary association, you can choose up to 5 required glossary terms per rule.

If you attempt to publish assets without adding the required glossary terms, the error message prompting you to enforce the glossary rule appears.

Standardizing metadata and aligning data schemas with business language enhances data governance and improves search relevance, helping your organization better understand and trust published data.

You can use AWS Command Line Interface (AWS CLI) and AWS SDKs to use these features. To learn more, visit the Amazon SageMaker Unified Studio data catalog in the Amazon SageMaker Unified Studio User Guide.

Now available
The new metadata capabilities are now available in AWS Regions where Amazon SageMaker Catalog is available.

Give it a try and send feedback to AWS re:Post for Amazon SageMaker Catalog or through your usual AWS Support contacts.

Channy

AWS Control Tower introduces a Controls Dedicated experience

Post Syndicated from Veliswa Boya original https://aws.amazon.com/blogs/aws/aws-control-tower-introduces-a-controls-dedicated-experience/

Today, we’re announcing a Controls Dedicated experience in AWS Control Tower. With this feature, you can use Amazon Web Services (AWS) managed controls without the need to set up resources you don’t need, which means you get started faster if you already have an established multi-account environment and want to use AWS Control Tower only for its managed controls. The Controls Dedicated experience gives you seamless access to the comprehensive collection of managed controls in the Control Catalog to incrementally enhance your governance stance.

Until now, customers were required to adopt and configure many recommended best practices which meant implementing a full AWS landing zone at the time of setting up a multi-account environment. This setup included defining the prescribed organizational structure, required services, and more, in AWS Control Tower to start using landing zone. This approach is helpful to ensure a well-architected multi-account environment, however, for customers who already have an established, well-architected multi-account environment and only want to use AWS managed controls, it was more challenging for them to adopt AWS Control Tower. The new Controls Dedicated experience provides a faster and more flexible way of using AWS Control Tower.

How it works
Here’s how I define managed controls using the Controls Dedicated experience in AWS Control Tower in one of my accounts.

I start by choosing Enable AWS Control Tower on the AWS Control Tower landing page.

I have the option to set up a full environment, or only set up controls using the Controls Dedicated experience. I opt to set up controls by choosing I have an existing environment and want to enable AWS Managed Controls. Next, I set up the rest of the information, such as choosing the Home Region from the dropdown list so that AWS Control Tower resources are provisioned in this Region during enablement. I also select Turn on automatic account enrollment for AWS Control Tower to enroll accounts automatically when I move them into a registered organization unit. The rest of the information is optional; I choose Enable AWS Control Tower to finalize the process, and the landing zone setup begins.

Behind the scenes, AWS Control Tower installed the required service-linked AWS Identity and Access Management (IAM) roles, and to use detective controls, service-linked Config Recorder in AWS Config in the account where I’m deploying the AWS managed controls. The setup is completed, and now I have all the infrastructure required to use the controls in this account. The dashboard gives a summary of the environment such as the organizational units that were created, the shared accounts, the selected IAM configuration, the preventive controls to enforce policies, and detective controls to detect configuration violations.


I choose View enabled controls for a list of all controls that were installed during this process.

Good to know
Usually, an existing AWS Organizations account is required before you can use AWS Control Tower. If you’re using the console to create controls and don’t already have an Organizations account, one will be set up on your behalf.

Earlier, I mentioned a service-linked Config Recorder. With a service-linked Config Recorder, AWS Control Tower prevents the resource types needed for deployed managed controls from being altered. You have flexibility and the ability to keep your own Config Recorders, and only the configuration items for the resource types that are required by your managed detective controls will be enabled, which optimizes your AWS Config costs.

Now available
Controls Dedicated experience in AWS Control Tower is available today in all AWS Regions where AWS Control Tower is available.

To learn more, visit our AWS Control Tower page. For more information related to pricing, refer to AWS Control Tower pricing. Send feedback to AWS re:Post for AWS Control Tower or through your usual AWS Support contacts.

Veliswa.

Monitor network performance and traffic across your EKS clusters with Container Network Observability

Post Syndicated from Donnie Prakoso original https://aws.amazon.com/blogs/aws/monitor-network-performance-and-traffic-across-your-eks-clusters-with-container-network-observability/

Organizations are increasingly expanding their Kubernetes footprint by deploying microservices to incrementally innovate and deliver business value faster. This growth places increased reliance on the network, giving platform teams exponentially complex challenges in monitoring network performance and traffic patterns in EKS. As a result, organizations struggle to maintain operational efficiency as their container environments scale, often delaying application delivery and increasing operational costs.

Today, I’m excited to announce Container Network Observability in Amazon Elastic Kubernetes Service (Amazon EKS), a comprehensive set of network observability features in Amazon EKS that you can use to better measure your network performance in your system and dynamically visualize the landscape and behavior of network traffic in EKS.

Here’s a quick look at Container Network Observability in Amazon EKS:

Container Network Observability in EKS addresses observability challenges by providing enhanced visibility of workload traffic. It offers performance insights into network flows within the cluster and those with cluster-external destinations. This makes your EKS cluster network environment more observable while providing built-in capabilities for more precise troubleshooting and investigative efforts.

Getting started with Container Network Observability in EKS

I can enable this new feature for a new or existing EKS cluster. For a new EKS cluster, during the Configure observability setup, I navigate to the Configure network observability section. Here, I select Edit container network observability. I can see there are three included features: Service map, Flow table, and Performance metric endpoint, which are enabled by Amazon CloudWatch Network Flow Monitor.

On the next page, I need to install the AWS Network Flow Monitor Agent.

After it’s enabled, I can navigate to my EKS cluster and select Monitor cluster.

This will bring me to my cluster observability dashboard. Then, I select the Network tab.


Comprehensive observability features
Container Network Observability in EKS provides several key features, including performance metrics, service map, and flow table with three views: AWS service view, cluster view, and external view.

With Performance metrics, you can now scrape network-related system metrics for pods and worker nodes directly from the Network Flow Monitor agent and send them to your preferred monitoring destination. Available metrics include ingress/egress flow counts, packet counts, bytes transferred, and various allowance exceeded counters for bandwidth, packets per second, and connection tracking limits. The following screenshot shows an example of how you can use Amazon Managed Grafana to visualize the performance metrics scraped using Prometheus.


With the Service map feature, you can dynamically visualize intercommunication between workloads in your cluster, making it straightforward to understand your application topology with a quick look. The service map helps you quickly identify performance issues by highlighting key metrics such as retransmissions, retransmission timeouts, and data transferred for network flows between communicating pods.

Let me show you how this works with a sample e-commerce application. The service map provides both high-level and detailed views of your microservices architecture. In this e-commerce example, we can see three core microservices working together: the GraphQL service acts as an API gateway, orchestrating requests between the frontend and backend services.

When a customer browses products or places an order, the GraphQL service coordinates communication with both the products service (for catalog data, pricing, and inventory) and the orders service (for order processing and management). This architecture allows each service to scale independently while maintaining clear separation of concerns.

For deeper troubleshooting, you can expand the view to see individual pod instances and their communication patterns. The detailed view reveals the complexity of microservices communication. Here, you can see multiple pod instances for each service and the network of connections between them.

This granular visibility is crucial for identifying issues like uneven load distribution, pod-to-pod communication bottlenecks, or when specific pod instances are experiencing higher latency. For example, if one GraphQL pod is making disproportionately more calls to a particular products pod, you can quickly spot this pattern and investigate potential causes.

Use the Flow table to monitor the top talkers across Kubernetes workloads in your cluster from three different perspectives, each providing unique insights into your network traffic patterns.

Flow table – Monitor the top talkers across Kubernetes workloads in your cluster from three different perspectives, each providing unique insights into your network traffic patterns:

  • AWS service view shows which workloads generate the most traffic to Amazon Web Services (AWS) services such as Amazon DynamoDB and Amazon Simple Storage Service (Amazon S3), so you can optimize data access patterns and identify potential cost optimization opportunities.
  • The Cluster view reveals the heaviest communicators within your cluster (east-west traffic), which means you can spot chatty microservices that might benefit from optimization or colocation strategies
  • External viewidentifies workloads with the highest traffic to destinations outside AWS (internet or on premises), which is useful for security monitoring and bandwidth management.

The flow table provides detailed metrics and filtering capabilities to analyze network traffic patterns. In this example, we can see the flow table displaying cluster view traffic between our e-commerce services. The table shows that the orders pod is communicating with multiple products pods, transferring amounts of data. This pattern suggests the orders service is making frequent product lookups during order processing.

The filtering capabilities are useful for troubleshooting, for example, to focus on traffic from a specific orders pod. This granular filtering helps you quickly isolate communication patterns when investigating performance issues. For instance, if customers are experiencing slow checkout times, you can filter to see if the orders service is making too many calls to the products service, or if there are network bottlenecks between specific pod instances.

Additional things to know
Here are key points to note about Container Network Observability in EKS:

  • Pricing – For network monitoring, you pay standard Amazon CloudWatch Network Flow Monitor pricing.
  • Availability – Container Network Observability in EKS is available in all commercial AWS regions where Amazon CloudWatch Network Flow Monitor is available.
  • Export metrics to your preferred monitoring solution – Metrics are available in OpenMetrics format, compatible with Prometheus and Grafana. For configuration details, refer to Network Flow Monitor documentation.

Get started with Container Network Observability in Amazon EKS today to improve network observability in your cluster.

Happy building!
Donnie

Announcing CloudFormation IDE Experience: End-to-End Development in Your IDE

Post Syndicated from Damola Oluyemo original https://aws.amazon.com/blogs/devops/announcing-cloudformation-ide-experience-end-to-end-development-in-your-ide/

If you’ve developed AWS CloudFormation templates, you know the drill; write YAML(YAML Ain’t Markup Language) in your IDE(Integrated Development Environment), switch to the AWS Management Console to validate, jump to documentation to verify property names. Then run CFN Lint(Cloudformation Linter) in your terminal, deploy and wait, then troubleshoot failures back in the console. This constant context switching between your IDE, AWS Console, documentation pages, and validation tools fragments your workflow and kills productivity. What should take 30 minutes often stretches into hours of iteration cycles.

Today, we’re excited to introduce the CloudFormation IDE Experience, a comprehensive solution that brings the entire CloudFormation development lifecycle into your IDE. No more context switching. No more fragmented workflows. Just one unified, intelligent development experience from authoring to deployment.

In this post, you’ll learn how the Cloudformation IDE Experience transforms your workflow with intelligent authoring, real-time validation, AWS integration, and more.

What is the CloudFormation IDE Experience?

The CloudFormation IDE Experience reimagines how you build infrastructure as code by creating an end-to-end development loop entirely within your IDE. Unlike generic YAML or JSON editors, this is a CloudFormation-first solution built specifically for infrastructure developers.

This solution covers the complete lifecycle; from intelligent authoring with smart code completion and navigation that understands CloudFormation semantics, to real-time multi-layer validation that catches issues before deployment. It provides direct AWS integration for seamless resource imports and stack visibility, monitors configuration drift between your templates and deployed resources, and includes server-side pre-deployment checks that prevent common deployment failures.
The result? A development environment that understands your infrastructure code as deeply as your IDE understands your application code.

Core Features

Quick Project Setup with CFN Init

CFN Init streamlines project setup by creating a structured CloudFormation project with environment configurations in seconds. Run “CFN Init: Initialize Project” from the Command Palette, configure your environments (dev, staging, production), and associate each with an AWS profile.

The CloudFormation Explorer displays your environments, letting you switch between them with a single click. Each environment maintains its own deployment settings and parameter values, eliminating manual configuration and ensuring consistent deployments across your infrastructure lifecycle.

Intelligent Authoring with Intelligent Code Completion

The IDE understands CloudFormation semantics and provides context-aware suggestions as you type. Only required properties appear automatically, while optional properties surface on hover, so when you add a Properties section to an EC2 VPC resource, nothing appears because it has no required properties. Create a subnet, however, and VpcId appears immediately because it’s required.

When you use !GetAtt or !Ref, the IDE knows exactly which attributes and resources are available. Navigation features like go-to-definition for logical IDs and hover tooltips let you explore complex templates without losing context. The IDE also provides full support for CloudFormation intrinsic functions and pseudo parameters.

Multi-Layer Validation System

The IDE provides comprehensive validation at multiple levels:

Static Validation (Real-time)

  • CloudFormation Guard Integration: Security and compliance checks using AWS Security pillar rules. For example, it automatically flags insecure configurations like MapPublicIpOnLaunch: true on subnets
  • CFN Lint Integration: Advanced syntax and logic validation, including overlapping CIDR block detection, resource dependency validation, and property checks beyond basic schema validation

Interactive Error Resolution
When errors occur, the IDE doesn’t just highlight them, it helps you fix them. Contextual error messages explain what’s wrong and why it matters, while one-click quick fixes automatically correct common issues like missing required properties or invalid reference formats. If you reference a non-existent resource, the IDE suggests valid alternatives from your template. Reference an invalid attribute with !GetAtt, the IDE immediately shows which attributes are actually available for that resource type.

AWS Resource Integration (CCAPI)

Import existing AWS resources directly into your templates using the Cloud Control API (CCAPI). Browse live resources and view all CloudFormation stacks in your AWS account from within the IDE. Pull resource configurations directly into your template with one click, complete with accurate property values. This transforms existing infrastructure into Infrastructure-as-Code without manual reconstruction or switching to the console to look up property values.

Server-Side Validation

Before you deploy, the IDE performs comprehensive server-side validation through AWS’s intelligent validation service that analyzes your CloudFormation templates against real-world deployment patterns and catches issues static analysis can’t detect.

The AWS’s intelligent validation service uses AWS-managed hooks to analyze your change sets before execution across three categories. Enhanced template validation covers CFN Lint blind spots like transforms and parameter values. Primary identifier conflict detection finds existing resources with the same identifiers before you attempt deployment. Resource state validation checks resource readiness ensuring, for example, that Amazon Simple Storage Service(S3) buckets are empty before deletion attempts.

This validation is based on analysis of the top CloudFormation failure patterns, helping you catch issues before they cause rollbacks or failed states.

Getting Started

Getting started with the CloudFormation IDE Experience is straightforward:

Prerequisite:

  1. Install an IDE that supports the CloudFormation extension, such as Visual Studio Code, Kiro
  2. Download the CloudFormation extension for your platform (available through the AWS Toolkit)
  3. Install the extension following the standard VS Code extension installation process

No complex dependency management or schema updates required—all configuration and updates are handled automatically.

Let’s See How It Works

Let’s walk through a practical example that demonstrates the IDE experience in action. We’ll build a simple Amazon Virtual Private Cloud (Amazon VPC) infrastructure with subnets and an S3 bucket.

Setting Up Your Project

Start by initializing a new CloudFormation project. Open the Command Palette, run “CFN Init: Initialize Project”, choose your project location, and set up environments. For this example, create a “beta” environment and associate it with your AWS development profile. The IDE creates your project structure with configuration files ready to use. You can now select your “beta” environment from the CloudFormation Explorer to ensure all deployments use the correct settings.

Figure 1: Initializing a CloudFormation project with environment configuration

Starting with Intelligent Authoring

Create a new CloudFormation template and start typing AWS::EC2::VPC. The IDE provides intelligent completions as you type.

Cloudformation IDE extension intelligent completion

Figure 2.0: Resource type auto-completion with CloudFormation-aware IntelliSense

When you add the Properties section, notice something interesting: nothing appears automatically. That’s because Amazon Elastic Compute Cloud (Amazon EC2) VPC has no required properties.

Cloudformation IDE extension doesn't suggest optional properties
Figure 2.1: No automatic suggestions for VPC properties since none are required

Hover over Properties to see all available options with their types and documentation links.

Hover information displaying optional properties and their documentation

Figure 2.2: Hover information displaying optional properties and their documentation

Add a CIDR block, then create a subnet. This time, when you type Properties, VpcId appears immediately because it’s required.

Required properties VpcID automatically suggested for EC2 Subnet
Figure 2.3: Required properties VpcID automatically suggested for EC2 Subnet

The IDE provides the resource names in your template, and when you use !GetAtt or !Ref, it knows which attributes are available for each resource type.

Type-aware completions for intrinsic functions like !GetAtt & !Ref

Figure 2.4: Type-aware completions for intrinsic functions like !GetAtt & !Ref

Real-Time Validation in Action

As you continue building, add MapPublicIpOnLaunch: true to make a public subnet. Immediately, a blue squiggly line appears.

CloudFormation Guard warning highlighted in real-time

Figure 3: CloudFormation Guard warning highlighted in real-time

Hovering reveals a CloudFormation Guard warning from the AWS Security pillar rules: this configuration isn’t recommended for security compliance.

Security compliance warning with detailed explanation

Figure 3.1: Security compliance warning with detailed explanation

Create a second subnet by copying the first, but now red squiggly lines appear. CFN Lint has detected overlapping CIDR blocks between your two subnets – an issue that would fail during deployment. You can fix it immediately with the contextual information provided.

CFN Lint error detection for overlapping CIDR blocks providing detailed error information helping you resolve the issue quickly
Figure 3.2: CFN Lint error detection for overlapping CIDR blocks providing detailed error information helping you resolve the issue quickly

Importing Existing Resources

Now you need an S3 bucket. Instead of writing it from scratch, open the Resource Explorer panel on the left. Using CCAPI integration, you can see all your existing AWS resources. Select an S3 bucket and click “Import resource state”. The IDE pulls in the complete resource configuration with all properties already set. You can now iterate on this resource without needing to remember or look up all the configuration details.

Automatically imported resource configuration from live AWS resources

Figure 4: Automatically imported resource configuration from live AWS resources

Developer Experience Benefits

The CloudFormation IDE Experience delivers measurable improvements across productivity and quality:

Productivity Gains:

  • Reduced context switching: Keep your entire workflow in one place
  • Faster iteration cycles: Catch and fix issues in seconds, not minutes or hours
  • Shift-left validation: Identify problems before deployment, not after
  • Intelligent assistance: Spend less time in documentation, more time building

Quality Improvements:

  • Proactive error prevention: Multi-layer validation catches issues early
  • Security by default: Built-in compliance checks from CloudFormation Guard
  • Best practice enforcement: Automated guidance aligned with AWS recommendations
  • Deployment confidence: Pre-deployment validation reduces rollback scenarios

What previously took hours of troubleshooting and multiple deployment attempts now becomes a confident 30-minute development cycle.

“I will definitely use these features; they help to reduce the feedback loop and speed up the development of IaC templates.” – AWS Community Builder

Things to Know

Platform Support

The CloudFormation IDE Experience is available for:

  • Visual Studio Code: Full feature support
  • Kiro: Full feature support
  • Cursor: Full feature support
  • JetBrains IDEs: Complete integration across the IntelliJ family (Fast Follow)
  • Operating Systems: macOS (ARM), Linux (x64) and Windows(…)

Conclusion

The CloudFormation IDE Experience eliminates the context switching that fragments your workflow. Write, validate, and deploy all from one environment. What used to take hours of iteration now takes minutes.

Ready to get started? Install the CloudFormation extension from the AWS Toolkit for VS Code and experience the difference. For detailed setup instructions and feature documentation, see the CloudFormation IDE Experience guide.

About the Authors:

Damola Oluyemo

Damola Oluyemo is a Solutions Architect at Amazon Web Services focused on Enterprise customers. He helps customers design cloud solutions while exploring the potential of Infrastructure as Code and generative AI in software development.

Jehu Gray

Jehu Gray is a Prototyping Architect at Amazon Web Services where he helps customers design solutions that fits their needs. He enjoys exploring what’s possible with IaC.

Amazon introduces two benchmark datasets for evaluating AI agents’ ability on code migration

Post Syndicated from Linbo Liu original https://aws.amazon.com/blogs/devops/amazon-introduces-two-benchmark-datasets-for-evaluating-ai-agents-ability-on-code-migration/

Introduction: Repository-Level Code Migration

Code migration is a repository-level transformation process that modernizes entire software projects to run on new platforms, frameworks, or runtime environments while preserving their original functionality and structure. Rather than focusing on isolated files or APIs, it operates across the full repository, spanning source code, dependencies, build systems, and configuration files to ensure consistency and correctness at scale. Typical examples include upgrading Java repositories from legacy versions such as Java 8 to modern Long-Term Support releases like Java 17 or 21, migrating .NET Framework repositories to .NET Core, and upgrading AWS Lambda projects in Python or Node.js to the latest runtime versions.

Code migration is a challenging software engineering (SWE) task that involves runtime upgrade, deprecated API replacement, test framework optimization, and syntax modernization. As we build agentic solutions for code migration, the community needs a standardized benchmark dataset and an evaluation framework to measure how well these systems actually perform. To close this gap, we introduce two benchmark datasets: MigrationBench on Java and Poly-MigrationBench as an extension to other programming languages. These datasets are designed not only to benchmark the effectiveness of Large Language Models (LLMs) in repository-level migration, but also to provide the community with a standardized evaluation framework for reproducible experiments.

Solution Overview

MigrationBench: Repository-Level Java Migration

MigrationBench is a comprehensive repository-level benchmark focused on Java upgrades. Specifically, it evaluates the ability of LLMs and other tools to migrate code from Java 8 to newer Long-Term Support (LTS) versions such as Java 17 and Java 21.

The full dataset includes 5,102 open-source Java 8 Maven repositories collected from GitHub, alongside a representative subset of 300 repositories curated for research requiring fewer compute resources. MigrationBench also provides an evaluation framework for validating Java Maven repository upgrades.

Our data collection process follows a carefully designed pipeline with multiple filtering stages to ensure the quality and relevance of the repositories we include. We begin by collecting Java Maven projects, focusing on repositories written in Java that use Maven as their build tool. Next, we apply a license filter, retaining only repositories under MIT or Apache 2.0 licenses to ensure open and permissible usage. We then apply a quality filter, keeping only repositories with at least three GitHub stars to exclude toy or inactive projects. For each repository, we search for the latest buildable commit that is compatible with Java 8, ensuring a valid starting point for migration. We also remove redundant repositories based on their snapshot hashes. Finally, we further exclude repositories without any unit tests or integration tests, which are essential components to validate migration correctness in a robust way. For more details, checkout our paper MigrationBench: Repository-Level Code Migration Benchmark from Java 8 and the GitHub repository.

Poly-MigrationBench: Extending Beyond Java

While MigrationBench focuses exclusively on Java, the real-world code migration problem spans multiple ecosystems. To address this broader scope, we develop Poly-MigrationBench, an extension that introduces additional languages and platforms. We applied a similar data curation process as MigrationBench to additionally collect

  • 100 .NET Framework repositories. They are to be migrated to .NET core.
  • 74 Node.js repositories with version less than Node.js 22. They are to be migrated to Node.js 22.
  • 83 Python repositories with Python version less than 3.13. They are to be migrated to Python 3.13.

The above datasets are publicly available on GitHub: https://github.com/amazon-science/Poly-MigrationBench

Together, these datasets enable researchers to explore cross-language and cross-platform migration challenges at scale.

Use Case 1: Cross-Platform .NET Migration

One pressing migration challenge lies in moving .NET applications from Windows environments running on the legacy .NET Framework to Linux environments powered by .NET Core. This migration is critical for organizations seeking cross-platform compatibility, improved performance, and modern deployment practices such as containerization.

To support research in this area, we curated a benchmark of 100 open-source .NET Framework repositories from GitHub. These projects were carefully selected for diversity and quality, offering a real world foundation for evaluating migration tools and automated systems. The migration goal is clear: transition .NET Framework repositories to .NET Core on Linux while preserving functional equivalence.

Use Case 2: Node.js Upgrade for AWS Lambda Applications

Another timely migration need involves Lambda functions written in Node.js. Node.js 20, currently supported by Lambda, is scheduled for end-of-support in April 2026 (reference). After this deadline, projects running on Node.js 20 will no longer receive critical security patches or bug fixes.

For increased security and to avoid accumulating technical debt, developers building Lambda applications are proactively upgrading to Node.js 22. To evaluate LLMs’ effectiveness in automating this migration, Poly-MigrationBench provides a dataset of 74 open-source Node.js repositories using Node.js versions no later than 20. The task is to upgrade them to Node.js 22 while ensuring functional correctness is preserved.

Use-case 3: AWS Lambda Python Migrations

We also release benchmarks on Lambda Python repositories to the community to facilitate research and evaluation of automated Lambda function migrations in Python code. According to AWS documentation, Python 3.10 and 3.11 are scheduled to reach end of support for Lambda in June 2026. This approaching deadline highlights the urgency of migrating existing Lambda functions to newer runtimes and underscores the critical need for scalable, reliable, and LLM-driven migration solutions. To facilitate evaluation on this task, we collect 83 Python AWS Lambda repositories with Python version no later than 3.12. The objective is to migrate these repositories to Python 3.13.

Get Started

We’ve open-sourced both the datasets and the evaluation framework on Hugging Face and GitHub to make it easy for the community to explore, reproduce, and extend our work. Alongside them, we also released a baseline solution, SD-Feedback, for MigrationBench, while leaving the development of more sophisticated agentic migration systems as a open challenge for the research community.

MigrationBench

To download the MigrationBench dataset, visit our Hugging Face collection. For evaluation, simply clone our GitHub repository and follow the steps in the README.md.

Poly-MigrationBench

To access the Poly-MigrationBench dataset and evaluation commands, clone our GitHub repository.

For a deeper dive into how the benchmarks were curated and how the evaluation framework was designed, check out our paper:

MigrationBench: Repository-Level Code Migration Benchmark from Java 8

Conclusion

Code migration is an essential but complex task for maintaining long-term software reliability and security. With MigrationBench and Poly-MigrationBench, we aim to provide the community with systematic, large-scale benchmarks that enable reproducible research and practical evaluation of automated migration approaches.

Authors

Linbo Liu

Linbo Liu is an Applied Scientist at Amazon Web Services. He works on coding agents optimization and post-training.

Yiyi Guo

Yiyi Guo is a Senior Product Manager at Amazon Web Services. She works on agentic AI, software migration and modernization in AWS Transform.

Luke Huan

Luke Huan is a Senior Principal Scientist at Amazon Web Services. He works on agentic AI, generative AI, AI4code and supports AWS Transform.

Safely Handle Configuration Drift with CloudFormation Drift-Aware Change Sets

Post Syndicated from JJ Lei original https://aws.amazon.com/blogs/devops/safely-handle-configuration-drift-with-cloudformation-drift-aware-change-sets/

Introduction

Is configuration drift preventing you from accessing the speed, safety, and governance benefits of AWS CloudFormation for infrastructure management? Configuration drift occurs when cloud resources are modified outside of CloudFormation, leading to a mismatch in the actual state and template definition of resources. Drift tends to accumulate from infrastructure changes that engineers make via the AWS Management Console to resolve production incidents or troubleshoot malfunctioning applications. Drift can cause unexpected changes during subsequent IaC deployments or leave resources in a non-compliant state. Unresolved drift can lead to cost increases when resources are over-provisioned outside of template definitions, or compliance violations that may result in audit penalties. Additionally, drift makes it hard to reproduce applications for testing or disaster recovery.

CloudFormation now offers drift-aware change sets that allow you to safely handle configuration drift and keep your infrastructure in sync with your templates. In this post, we will explore the process of leveraging drift-aware change sets to resolve common scenarios in which drift impacts the availability or security of your application.

Solution Overview

Drift-aware change sets are a type of CloudFormation change sets that can bring drifted resources in line with template definitions and preview the required changes to actual infrastructure states before deployment. Drift-aware change sets surface a three-way comparison of your new template, actual resource states, and previous template before deployment, allowing you to prevent unexpected overwrites of drift. Additionally, drift-aware change sets offer you a systematic mechanism to restore drifted resources to approved template definitions, strengthening the reproducibility and compliance posture of applications. You can create drift-aware change sets either from the CloudFormation Management Console or from the AWS CLI or SDK by passing the --deployment-mode REVERT_DRIFT parameter to the CreateChangeSet API.

Prerequisites

AWS CLI latest version with CloudFormation permissions configured.

AWS Identity and Access Management (IAM) permissions required: Permissions to create and manage CloudFormation stacks, AWS Lambda functions, Security Groups, Amazon Simple Storage Service (Amazon S3) buckets, and IAM roles. PowerUserAccess or Administrator access recommended for testing.

• Test environment (non-production AWS account recommended)

• Basic CloudFormation knowledge (stacks, templates, change sets)

Important Note: These sample templates are provided for educational purposes only and should not be used in production environments without proper security review and testing. You are responsible for testing, securing, and optimizing these templates based on your specific quality control practices and standards. Deploying these templates may incur AWS charges for creating or using AWS resources. Work with your security and legal teams to meet your organizational security, regulatory, and compliance requirements before any production deployment.

Scenario 1: Prevent Dangerous Overwrites

This scenario demonstrates how drift-aware change sets prevent dangerous overwrites when Lambda function memory is increased outside of CloudFormation during an outage, and a subsequent template update could accidentally reduce memory, causing performance issues.

Story: Your team deploys a Lambda function with 128 MB memory via CloudFormation. During a production outage, an engineer increases the memory to 512 MB through the Lambda Console to resolve performance issues. Later, another developer updates the template to 256 MB for a code change, unaware of the console modification. Without drift-aware change sets, CloudFormation would unexpectedly reduce memory from 512 MB to 256 MB—potentially causing the outage to recur.

User journey: Create stack with 128MB => Increase memory to 512MB via console during outage => Create drift-aware change set with 256MB template => Review three-way comparison showing dangerous memory reduction => Cancel change set to prevent outage => Update template to match production state (512MB) => Create and execute drift-aware change set with updated template (512MB) to resolve drift

Scenario Flow

1. Create Stack

Deploy CloudFormation stack with Lambda function (128 MB memory).

Figure 1

CloudFormation stack “lambda-memory-drift-test” successfully deployed with CREATE_COMPLETE status

2. Emergency Memory Increase (Console)

Manually increase Lambda memory to 512 MB through AWS Console (simulating emergency performance fix during outage).

Figure 2

Initial Lambda function showing 128 MB memory as configured in template

Figure 3

Lambda memory increased to 512 MB through console during outage, creating drift from template

3. Create Drift-Aware Change Set

Create change set with 256 MB template using drift-aware mode to reveal the dangerous memory reduction.

Figure 4

CloudFormation console showing the new “Drift aware change set” option selected. This compares the new template with the live state of your stack and shows changes to drifted resources before deployment, unlike standard change sets that only compare templates.

aws cloudformation create-change-set \
--stack-name lambda-memory-drift-test \
--change-set-name detect-memory-overwrite \
--template-body file://lambda-memory-drift-scenario-256mb.yaml \
--deployment-mode REVERT_DRIFT \
--capabilities CAPABILITY_IAM \
--region us-east-1

4. Review Change Set – The Critical Three-Way Comparison

Examine the drift-aware change set to see the dangerous memory reduction that would occur.

Figure 5

Critical insight revealed: The change set shows Live resource state (512 MB) vs Proposed resource state (256 MB), revealing a dangerous memory reduction that would impact performance.

Figure 6: view drift

Drift analysis: Clicking “View drift” reveals the complete picture – Previous template (128 MB) vs Live resource state (512 MB). This shows the live state has 4x more memory than the original template, indicating emergency changes were made during the outage that must be preserved.

Key Insight: The drift-aware change set reveals that:

  • Previous template: 128 MB (original deployment)
  • Live resource state: 512 MB (emergency change during outage)
  • Proposed template: 256 MB (new deployment)

This would cause a dangerous reduction from 512 MB to 256 MB, potentially recreating the original performance issue. Without drift-aware change sets, this critical information would be hidden.

5. Recreate Drift-aware Change Set with Updated Template (512MB) to Resolve Drift

Update the template to match the live production state (512 MB) and create a new drift-aware change set to safely resolve the drift.

Figure 7

Resolution confirmed: The drift-aware change set shows both Live resource state and Proposed resource state at 512 MB, with change set action ” Sync with live”. This verifies that the updated template now matches production, preventing the dangerous memory reduction and safely resolving the drift without impacting performance.

CloudFormation Templates

Initial Template (128 MB):

Resources:
  DriftTestFunction:
    Type: AWS::Lambda::Function
    Properties:
      Runtime: python3.9
      Handler: index.lambda_handler
      MemorySize: 128
      ReservedConcurrentExecutions: 5
      Role: !GetAtt LambdaExecutionRole.Arn
      Code:
        ZipFile: |
          def lambda_handler(event, context):
              return {'statusCode': 200, 'body': 'Hello!'}
  LambdaExecutionRole:
    Type: AWS::IAM::Role
    Properties:
      AssumeRolePolicyDocument:
        Statement:
          - Effect: Allow
            Principal:
              Service: lambda.amazonaws.com
            Action: sts:AssumeRole
      ManagedPolicyArns:
        - arn:aws:iam::aws:policy/service-role/AWSLambdaBasicExecutionRole

Updated Template (256 MB – lambda-memory-drift-scenario-256mb.yaml):

Resources:
  DriftTestFunction:
    Type: AWS::Lambda::Function
    Properties:
      Runtime: python3.9
      Handler: index.lambda_handler
      MemorySize: 256
      ReservedConcurrentExecutions: 5
      Role: !GetAtt LambdaExecutionRole.Arn
      Code:
        ZipFile: |
          def lambda_handler(event, context):
              return {'statusCode': 200, 'body': 'Hello!'}
  LambdaExecutionRole:
    Type: AWS::IAM::Role
    Properties:
      AssumeRolePolicyDocument:
        Statement:
          - Effect: Allow
            Principal:
              Service: lambda.amazonaws.com
            Action: sts:AssumeRole
      ManagedPolicyArns:
        - arn:aws:iam::aws:policy/service-role/AWSLambdaBasicExecutionRole

CLI Commands

  1. Create stack:
aws cloudformation create-stack --stack-name lambda-memory-drift-test --template-body file://lambda-memory-drift-scenario.yaml --capabilities CAPABILITY_IAM --region us-east-1
  1. Get function name:
aws cloudformation describe-stack-resources --stack-name lambda-memory-drift-test --logical-resource-id DriftTestFunction --query 'StackResources[0].PhysicalResourceId' --output text --region us-east-1
  1. Create drift-aware change set:
aws cloudformation create-change-set --stack-name lambda-memory-drift-test --change-set-name detect-memory-overwrite --template-body file://lambda-memory-drift-scenario-256mb.yaml --deployment-mode REVERT_DRIFT --capabilities CAPABILITY_IAM --region us-east-1
  1. Describe change set:
aws cloudformation describe-change-set --change-set-name detect-memory-overwrite --stack-name lambda-memory-drift-test --region us-east-1

Scenario 2: Remediate Unauthorized Changes

This scenario demonstrates how drift-aware change sets systematically remediate unauthorized changes when a developer adds temporary debugging rules to a security group but forgets to remove them, creating a compliance violation.

Story: Your team deploys a security group with only HTTP access via CloudFormation for compliance. During debugging, a developer adds SSH access (port 22) through the AWS Console for their IP address to troubleshoot an application issue. They forget to remove this rule after debugging. Later, security compliance requires reverting to the original template state. A standard change set shows no changes since the template is unchanged, but a drift-aware change set can detect and systematically remove the unauthorized SSH rule.

User journey: Create stack with HTTP-only access => Add SSH rule via console for debugging => Forget to remove SSH rule => Create drift-aware change set with REVERT_DRIFT mode => Review change set showing SSH rule removal => Execute change set to restore compliance

Scenario Flow

1. Create Stack

Deploy CloudFormation stack with security group allowing only HTTP traffic.

Figure 8

CloudFormation stack “sg-revert-drift-test” successfully deployed with DriftTestSecurityGroup resource

2. Make Unauthorized Changes (Console)

Manually add SSH ingress rule through AWS Console (simulating developer debugging access that wasn’t removed).

Figure 9: http only

Initial security group showing only HTTP (port 80) access as configured in template – compliant state

Figure 10: ssh-added

Security group now shows 2 permission entries: SSH (port 22) for specific IP and HTTP (port 80) for all traffic. The SSH rule creates drift and a compliance violation that needs systematic removal.

3. Create Drift-Aware Change Set

Create change set using REVERT_DRIFT mode to systematically remove the unauthorized SSH rule.

Figure 11

Creating drift-aware change set for security group compliance restoration. Note the “Drift aware change set” option is selected to compare with live state and detect unauthorized changes.

aws cloudformation create-change-set \
--stack-name sg-revert-drift-test \
--change-set-name revert-ssh-drift \
--use-previous-template \
--deployment-mode REVERT_DRIFT \
--region us-east-1

4. Review Change Set – Systematic Compliance Restoration

Examine the drift-aware change set to see systematic removal of unauthorized SSH rule.

Figure 12

Compliance violation detected: The drift -aware change set shows that the SSH rule in the live resource state (rule 232 for IP 15.248.7.53/32 on port 22) is not present in the proposed resource state derived from the template. This unauthorized SSH rule violates security policy and will be systematically removed

Key Insight: The drift-aware change set enables systematic compliance restoration by:

  • Previous template: Only HTTP (port 80) access – compliant state
  • Live resource state: HTTP + SSH (port 22) for 15.248.7.53/32 – compliance violation
  • Action: Remove unauthorized SSH rule to restore compliance

This provides a systematic, auditable way to remove unauthorized changes rather than manual cleanup.

Figure 13

Stack events showing successful execution of the drift-aware change set – SSH rule removed

CloudFormation Templates

security-group-drift-scenario.yaml:

Resources:
  DriftTestSecurityGroup:
    Type: AWS::EC2::SecurityGroup
    Properties:
      GroupDescription: "Security group for drift testing"
      SecurityGroupIngress:
        - IpProtocol: tcp
          FromPort: 80
          ToPort: 80
          CidrIp: 0.0.0.0/0
          Description: "Allow HTTP traffic for demo purposes"
      SecurityGroupEgress:
        - IpProtocol: -1
          CidrIp: 0.0.0.0/0
          Description: "Allow all outbound traffic"

CLI Commands

  1. Create stack:
aws cloudformation create-stack --stack-name sg-revert-drift-test --template-body file://security-group-drift-scenario.yaml --region us-east-1
  1. Get security group ID:
aws ec2 describe-security-groups --filters "Name=tag:aws:cloudformation:stack-name,Values=sg-revert-drift-test" --query 'SecurityGroups[0].GroupId' --output text --region us-east-1
  1. Create drift-aware change set:
aws cloudformation create-change-set --stack-name sg-revert-drift-test --change-set-name revert-ssh-drift --template-body file://security-group-drift-scenario.yaml --deployment-mode REVERT_DRIFT --region us-east-1
  1. Describe change set:
aws cloudformation describe-change-set --change-set-name revert-ssh-drift --stack-name sg-revert-drift-test --region us-east-1

Scenario 3: Recreate Deleted Resources

This scenario demonstrates drift detection when a dependent resource (logs bucket) is accidentally deleted outside of CloudFormation during troubleshooting. The main application bucket depends on this logs bucket for access logging. You need to recreate the deleted resource while maintaining the existing infrastructure dependencies.

Story: Your team deploys a main S3 bucket with a dependent logs bucket for access logging via CloudFormation. During troubleshooting, an operator accidentally deletes the logs bucket through the AWS Console. The main bucket still exists but its logging configuration now references a non-existent bucket. You need to recreate the deleted logs bucket while maintaining the dependency relationship.

User journey: Create stack with main and logs buckets => Accidentally delete logs bucket => Create drift-aware change set with REVERT_DRIFT mode => Review change set showing LogBucket will be recreated => Execute change set to restore deleted resource

Scenario Flow

1. Create Stack

Deploy CloudFormation stack with main S3 bucket and dependent logs bucket.

Figure 14

CloudFormation stack “s3-deletion-drift-test” successfully deployed with both LogBucket and MainBucket resources in CREATE_COMPLETE status

2. Accidental Deletion (Console)

Manually delete the logs bucket through AWS Console (simulating accidental deletion during troubleshooting).

Figure 15

LogBucket accidentally deleted outside of CloudFormation during troubleshooting, creating drift – the MainBucket still exists but its logging configuration now references a non-existent bucket

3. Create Drift-Aware Change Set

Create change set using REVERT_DRIFT mode to recreate the deleted LogBucket.

Figure 16

Creating drift-aware change set with “Drift aware change set” option selected to detect and recreate the deleted resource by comparing template with live state

aws cloudformation create-change-set \
--stack-name s3-deletion-drift-test \
--change-set-name recreate-deleted-bucket \
--use-previous-template \
--deployment-mode REVERT_DRIFT \
--region us-east-1

4. Review Change Set – Resource Recreation

Examine change set to see LogBucket recreation while preserving MainBucket dependencies.

Figure 17

Change set preview showing LogBucket will be recreated to restore the deleted resource and MainBucket updated to maintain infrastructure dependencies

Key Insight: The drift-aware change set detects that:

  • Template expectation: Both LogBucket and MainBucket should exist
  • Live resource state: Only MainBucket exists, LogBucket is missing
  • Action: Recreate LogBucket with original configuration to restore logging functionality

This enables systematic recovery of accidentally deleted resources while maintaining infrastructure dependencies.

CloudFormation Templates

s3-drift-scenario.yaml:

Resources:
  LogBucket:
    Type: AWS::S3::Bucket
    Properties:
      BucketEncryption:
        ServerSideEncryptionConfiguration:
          - ServerSideEncryptionByDefault:
              SSEAlgorithm: AES256
      PublicAccessBlockConfiguration:
        BlockPublicAcls: true
        BlockPublicPolicy: true
        IgnorePublicAcls: true
        RestrictPublicBuckets: true
      VersioningConfiguration:
        Status: Enabled
  
  MainBucket:
    Type: AWS::S3::Bucket
    Properties:
      BucketEncryption:
        ServerSideEncryptionConfiguration:
          - ServerSideEncryptionByDefault:
              SSEAlgorithm: AES256
      PublicAccessBlockConfiguration:
        BlockPublicAcls: true
        BlockPublicPolicy: true
        IgnorePublicAcls: true
        RestrictPublicBuckets: true
      VersioningConfiguration:
        Status: Enabled
      LoggingConfiguration:
        DestinationBucketName: !Ref LogBucket

CLI Commands

  1. Create stack:
aws cloudformation create-stack --stack-name s3-deletion-drift-test --template-body file://s3-drift-scenario.yaml --region us-east-1
  1. Get LogBucket name:
aws cloudformation describe-stack-resources --stack-name s3-deletion-drift-test --logical-resource-id LogBucket --query 'StackResources[0].PhysicalResourceId' --output text --region us-east-1
  1. Create drift-aware change set:
aws cloudformation create-change-set --stack-name s3-deletion-drift-test --change-set-name recreate-deleted-bucket --template-body file://s3-drift-scenario.yaml --deployment-mode REVERT_DRIFT --region us-east-1
  1. Describe change set:
aws cloudformation describe-change-set --change-set-name recreate-deleted-bucket --stack-name s3-deletion-drift-test --region us-east-1

Best Practices

When working with drift-aware change sets, consider these best practices:

Always review three-way comparisons before executing change sets to understand the full impact

Use REVERT_DRIFT deployment mode when you want to bring resources back to template compliance

Document emergency changes made outside of CloudFormation to inform future template updates

Implement change management processes to minimize unauthorized drift

Regular drift detection helps identify configuration changes before they become problematic

Test drift-aware change sets in non-production environments first

Cleanup

Important: Execute these cleanup commands promptly after completing the scenarios to avoid incurring unnecessary AWS charges. Resources such as Lambda functions, S3 buckets (even if empty), and security groups may incur costs if left running. Ensure all stacks are successfully deleted by verifying the DELETE_COMPLETE status.

Commands to delete all test resources:

# Scenario 1: Lambda Memory Drift
aws cloudformation delete-stack --stack-name lambda-memory-drift-test --region us-east-1

# Scenario 2: Security Group Drift
aws cloudformation delete-stack --stack-name sg-revert-drift-test --region us-east-1

# Scenario 3: S3 Bucket Deletion Drift
aws cloudformation delete-stack --stack-name s3-deletion-drift-test --region us-east-1

# Verify all stacks are deleted
aws cloudformation list-stacks --stack-status-filter DELETE_COMPLETE --region us-east-1

Note: CloudFormation will automatically clean up all resources created by the stacks, including Lambda functions, security groups, and S3 buckets.

Conclusion

Drift-aware change sets enable you to mitigate the operational and security risks of configuration drift, allowing you to confidently automate and govern your infrastructure updates with CloudFormation. Through the scenarios described in this post, you have seen how you can leverage drift-aware change sets to prevent outages in production environments, maintain the integrity of your test environments, and manage the compliance posture of all environments. Remember to thoroughly review the infrastructure changes previewed by drift-aware change sets before executing deployments.

Available Now

Drift-aware change sets are available in AWS Regions where CloudFormation is available. Please refer to the AWS Region table to learn more.

New Amazon Threat Intelligence findings: Nation-state actors bridging cyber and kinetic warfare

Post Syndicated from CJ Moses original https://aws.amazon.com/blogs/security/new-amazon-threat-intelligence-findings-nation-state-actors-bridging-cyber-and-kinetic-warfare/

The new threat landscape

The line between cyber warfare and traditional kinetic operations is rapidly blurring. Recent investigations by Amazon threat intelligence teams have uncovered a new trend that they’re calling cyber-enabled kinetic targeting in which nation-state threat actors systematically use cyber operations to enable and enhance physical operations. Traditional cybersecurity frameworks often treat digital and physical threats as separate domains. However, research by Amazon demonstrates that this separation is increasingly artificial. Multiple nation-state threat groups are pioneering a new operational model where cyber reconnaissance directly enables kinetic targeting.

We’re seeing a fundamental shift in how nation-state actors approach warfare. These aren’t just cyber attacks that happen to cause physical damage; they are coordinated campaigns where digital operations are specifically designed to support physical military objectives.

Unique visibility at Amazon

The ability of Amazon Threat Intelligence to identify these campaigns stems from their unique position in the global threat landscape:

  • Threat intelligence telemetry: Amazon global cloud operations provide visibility into threats across diverse environments, including intelligence from Amazon MadPot honeypot systems, which enable the detection of suspicious patterns, actor infrastructure, and the network pathways used in these cyber-enabled kinetic targeting campaigns.
  • Opt-in customer data: Real-world data about attempted threat actor activities provided on an opt-in basis from enterprise environments.
  • Industry partner collaboration: Threat intelligence sharing with leading security organizations and government agencies provides additional context and validation for observed activities.

Through this multi-source approach, Amazon can connect dots that might otherwise remain invisible to individual organizations or even government agencies operating in isolation.

Case study 1: Imperial Kitten’s maritime campaign

The first case study involves Imperial Kitten, a threat group suspected of operating on behalf of Iran’s Islamic Revolutionary Guard Corps (IRGC). The timeline reveals the progression from digital reconnaissance to physical attack:

  • December 4, 2021: Imperial Kitten compromises a maritime vessel’s Automatic Identification System (AIS) platform, gaining access to critical shipping infrastructure. The Amazon Threat Intelligence team identifies the compromise and works with the affected organization to remediate the security event.
  • August 14, 2022: The threat actor expands their maritime targeting of additional vessel platforms. In one incident, they gained access to CCTV cameras aboard a maritime vessel, which provided real-time visual intelligence.
  • January 27, 2024: Imperial Kitten conducts targeted searches for AIS location data for a specific shipping vessel. This represents a clear shift from broad reconnaissance to targeted intelligence gathering.
  • February 1, 2024: US Central Command reports a missile strike by Houthi forces against the exact vessel that Imperial Kitten had been tracking. While the missile strike was ultimately ineffective, the correlation between the cyber reconnaissance and kinetic strike is unmistakable.

This case demonstrates how cyber operations can provide adversaries with the precise intelligence needed to conduct targeted physical attacks against maritime infrastructure—a critical component of global commerce and military logistics.

Case study 2: MuddyWater’s Jerusalem operations

The second case study involves MuddyWater, a threat group attributed by the US government to Rana Intelligence Computer Company, operating at the behest of Iran’s Ministry of Intelligence and Security (MOIS). This case reveals an even more direct connection between cyber operations and kinetic targeting.

  • May 13, 2025: MuddyWater provisions a server specifically for cyber network operations, establishing the infrastructure needed for their campaign.
  • June 17, 2025: The threat actor uses their server infrastructure to access another compromised server containing live CCTV streams from Jerusalem. This provides real-time visual intelligence of potential targets within the city.
  • June 23, 2025: Iran launches widespread missile attacks against Jerusalem. On the same day, Israeli authorities report that Iranian forces were exploiting compromised security cameras to gather real-time intelligence and adjust missile targeting.

The timing is not coincidental. As reported by The Record, Israeli officials urged citizens to disconnect internet-connected security cameras, warning that Iran was exploiting them to “gather real-time intelligence and adjust missile targeting.”

Technical infrastructure and methods

Research by Amazon reveals the sophisticated technical infrastructure supporting these operations. The threat actors employ a multi-layered approach:

  1. Anonymizing VPN networks: Threat actors route their traffic through anonymizing VPN services to obscure their true origins and make attribution more difficult.
  2. Actor-controlled servers: Dedicated infrastructure provides persistent access and command-and-control capabilities for ongoing operations.
  3. Compromised enterprise systems: The ultimate targets—enterprise servers hosting critical infrastructure like CCTV systems, maritime platforms, and other intelligence-rich environments.
  4. Real-time data streaming: Live feeds from compromised cameras and sensors provide actionable intelligence that can be used to adjust targeting in near real time.

Defining a new category of warfare

The research team proposes new terminology to describe these hybrid operations. Traditional frameworks fall short:

  • Cyber-kinetic operations typically refer to cyber attacks that cause physical damage to systems
  • Hybrid warfare is too broad, encompassing multiple types of warfare without specific focus on the cyber-physical integration

Amazon researchers suggest cyber-enabled kinetic targeting as a more precise term for campaigns where cyber operations are specifically designed to enable and enhance kinetic military operations.

Implications for defenders

For the cybersecurity community, this research serves as both a warning and a call to action. Defenders must adapt their strategies to address threats that span both digital and physical domains. Organizations that historically believed they weren’t of interest to threat actors could now be targeted for tactical intelligence. We must expand our threat models, enhance our intelligence sharing, and develop new defensive strategies that account for the reality of cyber-enabled kinetic targeting across diverse adversaries.

  • Expanded threat modeling: Organizations must consider not just the direct impact of cyberattacks, but how compromised systems might be used to support physical attacks against themselves or others.
  • Critical infrastructure protection: Operators of maritime systems, urban surveillance networks, and other infrastructure must recognize that their systems might be valuable not just for espionage, but as targeting aids for kinetic operations.
  • Intelligence sharing: The cases demonstrate the critical importance of threat intelligence sharing between private sector organizations, government agencies, and international partners.
  • Attribution challenges: When cyber operations directly enable kinetic attacks, the attribution and response frameworks become more complex, potentially requiring coordination between cybersecurity, military, and diplomatic channels.

Looking forward

We believe that cyber-enabled kinetic targeting will become increasingly common across multiple adversaries. Nation-state actors are recognizing the force multiplier effect of combining digital reconnaissance with physical attacks. This trend represents a fundamental evolution in warfare, where the traditional boundaries between cyber and kinetic operations are dissolving.

Indicators of Compromise

IOC Value, IOC Type, First Seen, Last Seen, Annotation
18[.]219.14.54, IPv4, 2025-05-13, 2025-06-17, MuddyWater Command and Control IP address
85[.]239.63.179, IPv4, 2023-08-13, 2025-09-19, Imperial Kitten proxy IP address
37[.]120.233.84, IPv4, 2021-01-01, 2022-11-01, Imperial Kitten proxy IP address
95[.]179.207.105, IPv4, 2020-11-11, 2022-04-09, Imperial Kitten proxy IP address

This blog post is based on research presented at CYBERWARCON by David Magnotti, Principal Engineer, and Dlshad Othman, Senior Threat Intelligence Engineer, both of Amazon Threat Intelligence. The authors thank US Central Command for their transparency in reporting military activities and acknowledge the ongoing support of customers and partners in these critical investigations.

If you have feedback about this post, submit comments in the Comments section below. If you have questions about this post, contact AWS Support.

CJ Moses

CJ Moses

CJ Moses is the CISO of Amazon Integrated Security. In his role, CJ leads security engineering and operations across Amazon. His mission is to enable Amazon businesses by making the benefits of security the path of least resistance. CJ joined Amazon in December 2007, holding various roles including Consumer CISO, and most recently AWS CISO, before becoming CISO of Amazon Integrated Security September of 2023.

Prior to joining Amazon, CJ led the technical analysis of computer and network intrusion efforts at the Federal Bureau of Investigation’s Cyber Division. CJ also served as a Special Agent with the Air Force Office of Special Investigations (AFOSI). CJ led several computer intrusion investigations seen as foundational to the security industry today.

CJ holds degrees in Computer Science and Criminal Justice, and is an active SRO GT America GT2 race car driver.

CVE-2025-13315, CVE-2025-13316: Critical Twonky Server Authentication Bypass (NOT FIXED)

Post Syndicated from Ryan Emmons original https://www.rapid7.com/blog/post/cve-2025-13315-cve-2025-13316-critical-twonky-server-authentication-bypass-not-fixed

Overview

Twonky Server version 8.5.2 is susceptible to two vulnerabilities that facilitate administrator authentication bypass on Linux and Windows. An unauthenticated attacker can improperly access a privileged web API endpoint to leak application logs, which contain encrypted administrator credentials (CVE-2025-13315). As a result of the use of hardcoded encryption keys, the attacker can then decrypt these credentials and login as an administrator to Twonky Server (CVE-2025-13316). Exploitation results in the unauthenticated attacker gaining plain text administrator credentials, full administrator access to the Twonky Server instance, and control of all stored media files. These vulnerabilities are tracked as CVE-2025-13315 and CVE-2025-13316.

These vulnerabilities have not been patched. Despite making contact with the vendor, and the vendor confirming receipt of our technical disclosure document, the vendor ceased communications after disclosure. They stated that a patch wouldn’t be possible, even with a disclosure timeline extension, and subsequent follow-up attempts on our part were unsuccessful. As such, the vulnerable version 8.5.2 is the latest available.

Product description

Twonky Server is media server software marketed to both organizations and individuals. It’s generally designed to run on embedded systems, such as NAS devices and routers, for media organization, access, and streaming. At the time of publication, Shodan returns approximately 850 Twonky Server services exposed to the public internet.

Credit

These issues were discovered and reported to Lynx Technology by Ryan Emmons, Staff Security Researcher at Rapid7. The vulnerabilities are being disclosed in accordance with Rapid7’s vulnerability disclosure policy. This work is based on the previous Twonky Server research published by Sven Krewitt.

Vulnerability details

CVE

Description

CVSS

CVE-2025-13315

An unauthenticated remote attacker can bypass web service API authentication controls to leak a log file and read the administrator’s username and encrypted password.

9.3 (Critical)

CVE-2025-13316

The application uses hardcoded encryption keys across installations. An attacker with an encrypted administrator password value can decrypt it into plain text using these hardcoded keys.

8.2 (High)

The testing target was Twonky Server 8.5.2, the latest version available at the time of research. Rapid7 identified two security vulnerabilities as part of this research project, which are outlined in the table above. These vulnerabilities were tested against Twonky Server installed on two different operating systems: Ubuntu Linux 22.04.1 and Windows Server 2022. When exploited, these vulnerabilities effectively serve as a patch bypass for the security mitigations introduced in response to the two vulnerabilities disclosed by Risk Based Security in 2021.

CVE-2025-13315

In 2021, the security firm Risk Based Security disclosed an improper API access vulnerability in Twonky Server, for which no CVE is assigned. Their approach was to leak the administrator’s username and obfuscated password via requests to /rpc/get_option?accessuser and /rpc/get_option?accesspwd, which previously did not enforce authentication checks. In the patch, authentication checks were implemented for the /rpc web API. However, some administrator RPC API endpoints, such as log_getfile, are still accessible without authentication via alternative routing.

00461ddf                                if (!check_path(&arg1[2], "/rpc/info_status"))
00461ddf                                {
00461fc8                                    if (check_path(&arg1[2], "/rpc/stop"))
00461fcf                                        goto label_461de5;
00461fcf                                    
00461fe4                                    if (check_path(&arg1[2], "/rpc/stream_active"))
00461fe4                                        goto label_461de5;
00461fe4                                    
00461ff9                                    if (check_path(&arg1[2], "/rpc/byebye"))
00461ff9                                        goto label_461de5;
00461ff9                                    
0046200e                                    if (check_path(&arg1[2], "/rpc/wakeup"))
0046200e                                        goto label_461de5;
0046200e                                    
00462023                                    if (check_path(&arg1[2], "/rpc/get_option?language"))
00462023                                        goto label_461de5;
00462023                                    
00462043                                    if (check_path(&arg1[2], "/rpc/get_option?multiusersupportenabled")
00462043                                            || !(var_480_1 & 1))
[..SNIP..]
004621af                                            *(uint64_t*)((char*)arg1 + 0x828) = "text/plain; charset=utf-8";
004621af                                            
004621c9                                            if (check_path(&arg1[2], "/rpc/log_getfile"))
004621c9                                            {
004622bf                                                char* rax_59 = getlogfile();

The decompiled binary contains the string “/nmc/rpc/”, which is referenced in various functions containing request routing logic within the codebase.

Twonky1.png

Jumping right into dynamic testing, we observed that some RPC requests with the /nmc/rpc prefix succeeded without authentication. 

An example is depicted below, calling the log_getfile web API endpoint with the typical /rpc prefix without authenticating.

Twonky2.png

Requesting the same API endpoint with the /nmc/rpc prefix instead, the log file is returned without authentication.

Twonky3.png

During startup, the application will log the accesspwd encrypted administrator password.

Twonky4.png

It’s also possible to call other authenticated APIs, such as the one to shut down the server, without authentication by leveraging the same /nmc/rpc prefix. When paired with CVE-2025-13316, an unauthenticated attacker can leak the administrator’s username and encrypted password, then decrypt the password to bypass authentication and take over the media server.

CVE-2025-13316

In 2021, the security firm Risk Based Security disclosed a weak password obfuscation vulnerability in Twonky Server, for which no CVE is assigned. It appears that, as a remediation strategy, the Blowfish encryption algorithm was introduced in subsequent versions of Twonky Server. The twonkyserver compiled executable defines twelve encryption keys.

008c7fe0  char const (* blowfish_constants)[0x11] = data_634d38 {"E8ctd4jZwMbaV587"}
008c7fe8  char const (* data_8c7fe8)[0x11] = data_634d49 {"TGFWfWuW3cw28trN"}
008c7ff0  char const (* data_8c7ff0)[0x11] = data_634d5a {"pgqYY2g9atVpTzjY"}
008c7ff8  char const (* data_8c7ff8)[0x11] = data_634d6b {"KX7q4gmQvWtA8878"}
008c8000  char const (* data_8c8000)[0x11] = data_634d7c {"VJjh7ujyT8R5bR39"}
008c8008  char const (* data_8c8008)[0x11] = data_634d8d {"ZMWkaLp9bKyV6tXv"}
008c8010  char const (* data_8c8010)[0x11] = data_634d9e {"KMLvvq6my7uKkpxf"}
008c8018  char const (* data_8c8018)[0x11] = data_634daf {"jwEkNvuwYCjsDzf5"}
008c8020  char const (* data_8c8020)[0x11] = data_634dc0 {"FukE5DhdsbCjuKay"}
008c8028  char const (* data_8c8028)[0x11] = data_634dd1 {"SpKNj6qYQGjuGMdd"}
008c8030  char const (* data_8c8030)[0x11] = data_634de2 {"qLyXuAHPTF2cPGWj"}
008c8038  char const (* data_8c8038)[0x11] = data_634df3 {"rKz7NBhM3vYg85mg"}

When an administrator password is set, the application uses one of these hardcoded keys as a Blowfish encryption key for the administrator password. After performing the encryption process, the encrypted password value is embedded in a string formatted as ||{HEX_INDEX}{HEX_CIPHERTEXT} and subsequently written to the configuration file.

00581260    int32_t enc_passwd(char* arg1, char* arg2, int32_t arg3)
00581260    {
00581260        int32_t result;
00581268        result = !arg3;
00581268        
00581276        if (!(!arg1 | result) && arg2)
00581276        {
00581289            uint64_t maxlen = (uint64_t)arg3;
0058129d            memset(arg2, 0, maxlen);
005812a5            result = strlen(arg1);
005812a5            
005812ac            if (result)
005812ac            {
005812ae                char rax = *(uint8_t*)arg1;
005812ae                
005812b4                // Checking if password is already encrypted(legacy)
005812b4                if (rax == ':')
005812b4                {
00581374                    if (arg1[1] == ':')
0058138c                        return snprintf(arg2, maxlen, "%s", arg1);
005812b4                }
005812b4                else if (rax == '|' && arg1[1] == '|')
0058138c                    return snprintf(arg2, maxlen, "%s", arg1);
0058138c                
005812d1                srand(j_sub_597230());  // seed?
005812fc                uint64_t rdx_4 = (uint64_t)(sub_464c10() % 0xc);
005812fe                char* r14_1 = (&blowfish_constants)[rdx_4];
00581316                void var_1088;
00581316                result = maybe_BF_set_key(&var_1088, r14_1, strlen(r14_1));
00581316                
0058131d                if (!result)
0058131d                {
0058133e                    void* rax_9 = maybe_BF_encrypt(&var_1088, arg1);
0058135b                    // String to write to config file in format ||{INDEX}{CIPHERTEXT}
0058135b                    snprintf(arg2, maxlen, "||%X%s", (uint64_t)rdx_4, rax_9);

Since these keys are static across Twonky Server installations and versions, an attacker with knowledge of the encrypted administrator password can trivially decrypt it to plain text and authenticate to Twonky Server as an administrator. The output of a Metasploit module exploit that pairs CVE-2025-13315 and CVE-2025-13316 for authentication bypass is depicted below.

msf auxiliary(gather/twonky_authbypass_logleak) > run
[*] Running module against 192.168.181.129
[*] Confirming the target is vulnerable
[+] The target is Twonky Server v8.5.2
[*] Attempting to leak encrypted password
[+] The target returned the encrypted password and key index: 14ee76270058c6e3c9f8cecaaebed4fc5206a1d2066d4f78, 7
[*] Decrypting password using key: jwEkNvuwYCjsDzf5
[+] Credentials decrypted: USER=admin PASS=R7Password123!!!
[*] Auxiliary module execution completed

Mitigation guidance

In lieu of any patches or mitigation guidance from the vendor, affected organizations and individuals are advised to restrict Twonky Server traffic to only trusted IPs. Additionally, any administrator credentials configured in Twonky Server should be assumed to be compromised.

Rapid7 customers

Exposure Command, InsightVM and Nexpose customers will be able to assess their exposure to CVE-2025-13315 and CVE-2025-13316 with unauthenticated vulnerability checks expected to be available in today’s (November 19) content release.

Disclosure timeline

August 5, 2025: Rapid7 reaches out to a Lynx Technology contact email address.

August 6, 2025: A Lynx Technology representative replies and confirms that the address is the proper path to disclose vulnerabilities.

August 12, 2025: Rapid7 shares the disclosure document with technical details and a proof-of-concept exploit.

August 18, 2025: Lynx Technology confirms that the document has been received and shared with management.

September 3, 2025: Rapid7 follows up and requests a ~60-day disclosure date of October 13.

September 5, 2025: Lynx Technology replies and acknowledges the 60-day timeline as standard practice, but states that resource constraints prevent a patch from being issued on that timeline.

September 9, 2025: Rapid7 replies and offers to accommodate beyond the standard 60-day timeline with a ~90-day timeline, the week of November 17, 2025.

September 30, 2025: Rapid7 follows up in the same ticket thread and reiterates the offer to extend to a 90-day timeline.

October 28, 2025: Rapid7 opens a new ticket and reiterates the offer to extend the timeline.

November 13, 2025: Rapid7 follows up and reiterates the intent to publish materials in November. 

November 14, 2025: Rapid7 follows up and reiterates the upcoming publication, with no response.

November 19, 2025: This disclosure.

The collective thoughts of the interwebz