How To Hunt For UEFI Malware Using Velociraptor

Post Syndicated from Matthew Green original https://blog.rapid7.com/2024/02/29/how-to-hunt-for-uefi-malware-using-velociraptor/

How To Hunt For UEFI Malware Using Velociraptor

UEFI threats have historically been limited in number and mostly implemented by nation state actors as stealthy persistence. However, the recent proliferation of Black Lotus on the dark web, Trickbot enumeration module (late 2022), and Glupteba (November 2023) indicates that this historical trend may be changing.

With this context, it is becoming important for security practitioners to understand visibility and collection capabilities for UEFI threats. This post covers some of these areas and presents several recent Velociraptor artifacts that can be used in the field. Rapid7 has also released a white paper providing detailed information about how UEFI malware works and some of the most common types.

Background

Unified Extensible Firmware Interface, or UEFI, is the interface between a system’s hardware and its operating system (OS). The technology can be viewed as an updated BIOS capability to improve and add security to the boot process.

The two main types of UEFI persistence are:

  1. Serial Peripheral Interface (SPI) based
  • Firmware payload implant that is resilient to even a hard disk format.
  • Difficult to implement — there are risks associated with implementing and potentially bricking a machine if there are mistakes with the firmware.
  • Difficult to detect at scale — defenders need to extract firmware which typically requires a signed driver, then running tools for analysis.
  • Typically an analyst would dump firmware, then extract variables and other interesting files like PEs for deep dive analysis.

2. EFI System Partition (ESP) based

  • A special FAT partition that stores bootloaders and sits late in the EFI boot process.
  • Much easier to implement, only requiring root privileges and to bypass Secure Boot.
  • Does not survive a machine format.

EFI Secure Variables API visibility

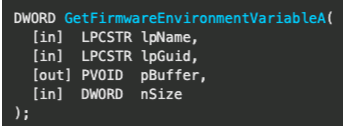
EFI Secure Variables (or otherwise known as NVRAM) is how the system distributes components from the firmware during boot. From an analysis point of view, whilst dumping the firmware is difficult needing manual workflow, all operating systems provide some visibility from user space. This blog will discuss the Windows API; however, for reference Linux and macOS provides similar data.
How To Hunt For UEFI Malware Using Velociraptor

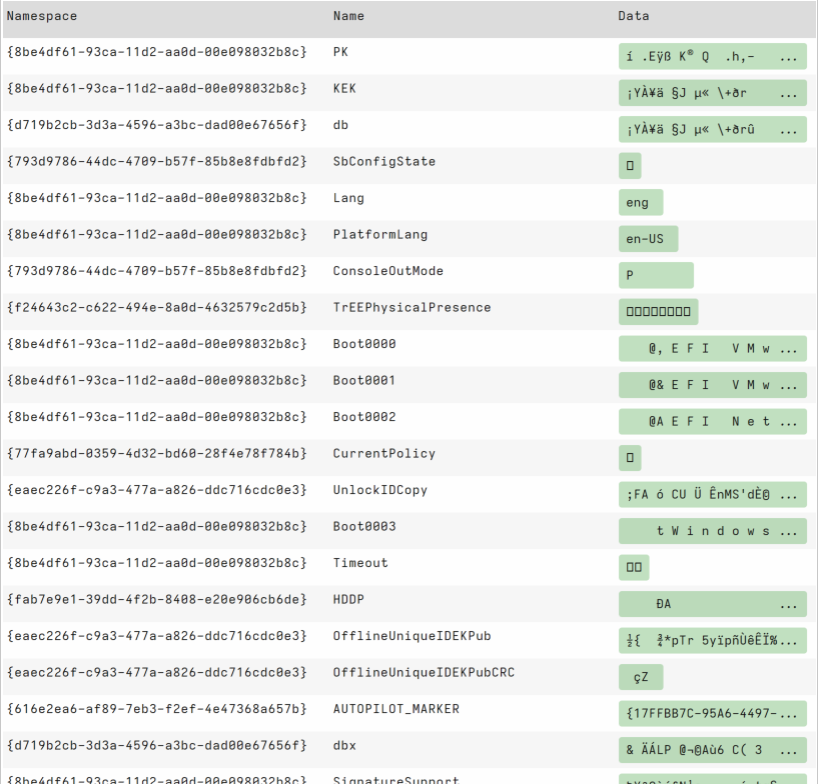
GetFirmwareEnvironmentVariable (Windows) can collect the name, namespace guid and value of EFI secure variables. This collection can be used to check current state including key/signature database and revocation.

Some of the data points it enables extracting are:

  • Platform Key (PK) — top level key.
  • Key Exchange Key (KEK)  — used to sign Signatures Database and Forbidden Signatures Database updates.
  • Signature database (db) — contains keys and/or hashes of allowed EFI binaries.
  • Forbidden signatures database (dbx) — contains keys and/or hashes of denylisted EFI binaries.
  • Other boot configuration settings.

It’s worth noting that this technique is relying on the Windows API and could be subverted with capable malware, but the visibility can provide leads for an analyst around boot configuration or signatures. There are also “boot only” NVRAM variables that can not be accessed outside boot, so a manual chip dump would need to be collected.
How To Hunt For UEFI Malware Using Velociraptor
Example of extracting EFI secure variables

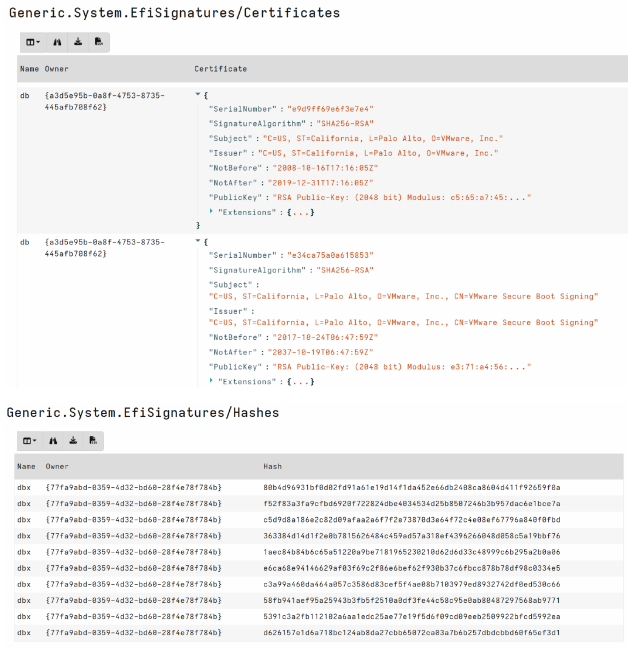
Velociraptor has a community contributed capability: Generic.System.EfiSignatures. This artifact collects EFI Signature information from the client to check for unknown certificates and revoked hashes. This is a great artifact for data stacking across machines and is built by parsing data values from the efivariables() plugin.
How To Hunt For UEFI Malware Using Velociraptor

EFI System Partition (ESP) visibility

The ESP is a FAT partitioned file system that contains boot loaders and other critical files used during the boot process which do not change regularly. As such, it can be a relatively simple task to find abnormalities using forensics.

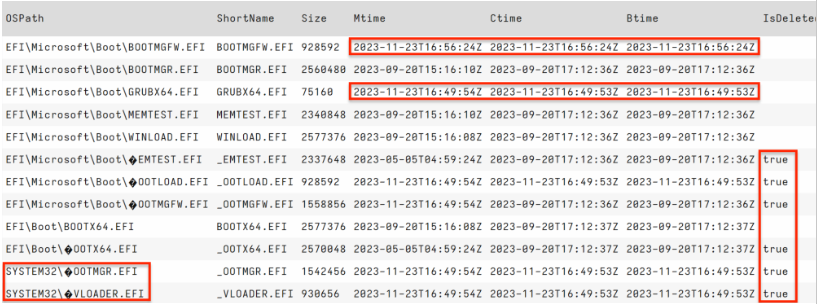
For example, parsing the File Allocation Table we can review metadata around path, timestamps, and deleted status that may provide leads for analysis.
How To Hunt For UEFI Malware Using Velociraptor
Viewing FAT metadata on *.EFI files

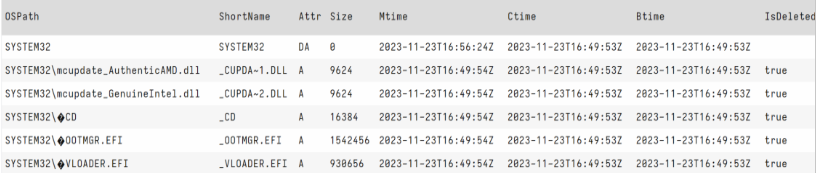
In the screenshot above we observe several EFI bootloader files with timestamps out of alignment. We would typically expect these files to have the same timestamps around operating system install. We can also observe deleted files and the existence of a System32 folder in the temporal range of these entries.

The EFI/ folder should be the only folder in the ESP root so querying for any paths that do not begin with EFI/ is a great hunt that detects our lead above. You can see in my screenshot below, the BlackLotus staging being bubbled to the top adding filtering for this use case.
How To Hunt For UEFI Malware Using Velociraptor
BlackLotus staging: Non ESP/ files

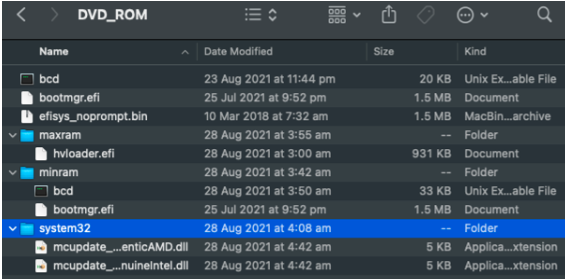
Interestingly, BlackLotus was known to use the Baton Drop exploit so we can compare to the publicly available Baton Drop and observe similarities to deleted files on the ESP.
How To Hunt For UEFI Malware Using Velociraptor
Publicly available Baton Drop iso contents on Github

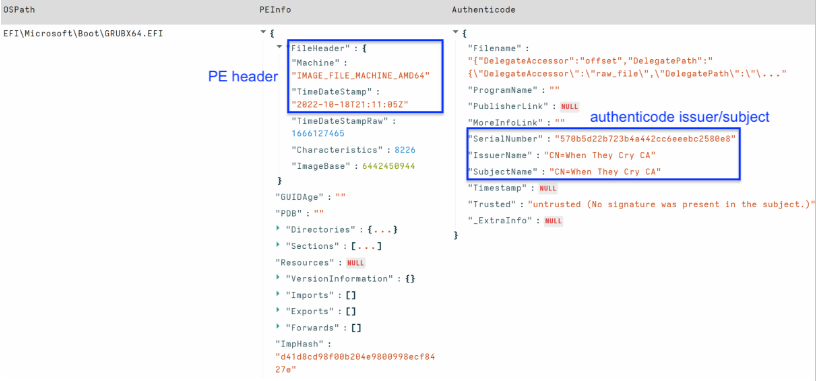
The final component of ESP-based visibility is checking the bytes of file contents. We can run YARA to look for known malware traits, or obtain additional file type metadata that can provide leads for analysis. The screenshot below highlights the well known Black Lotus certificate information and PE header timestamp.

How To Hunt For UEFI Malware Using Velociraptor
BlackLotus PE header, suspicious Authenticode
How To Hunt For UEFI Malware Using Velociraptor
BlackLotus YARA hit in ESP

Available Velociraptor artifacts for this visibility of the ESP are:

  1. Windows.Forensics.UEFI — This artifact enables disk analysis over an EFI System Partition (ESP). The artifact queries the specified physical disk, parses the partition table to target the ESP File Allocation Table (FAT). The artifact returns file information, and PE enrichment as typical EFI files are in the PE format.
  2. Windows.Detection.Yara.UEFI — This artifact expands on basic enumeration of the ESP and enables running yara over the EFI system partition.

Measured Boot log visibility

Bootkit security has always been a “race to the bottom.” If the malware could load prior to security tools, a defender would need to assume they may be defeated. Since Windows 8, Measured Boot is a feature implemented to help protect machines from early boot malware. Measured Boot checks each startup component — from firmware to boot drivers — and stores this information in the Trusted Platform Module (TPM). A binary log is then made available to verify the boot state of the machine. The default Measured Boot log location is C:\Windows\Logs\MeasuredBoot\*.log and a new file is recorded for each boot.

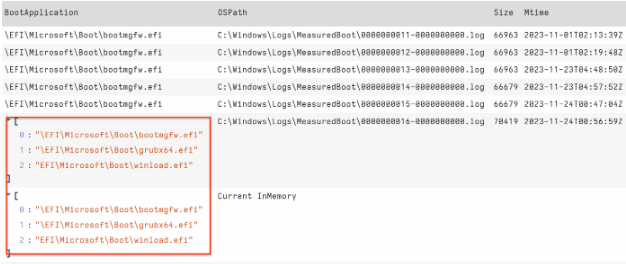
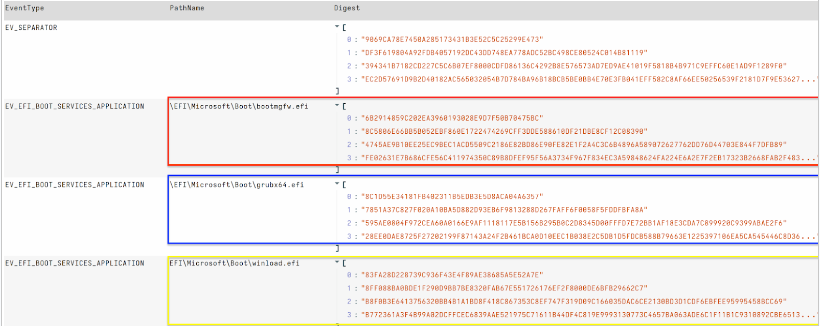
Windows.Forensics.UEFI.BootApplication parses Windows MeasuredBoot TCGLogs to extract PathName of events, which can assist detection of potential ESP based persistence (EV_EFI_Boot_Services_Application). The artifact leverages Velociraptor tools to deploy and execute Matt Graeber’s excellent powershell module TCGLogTools to parse TCGLogs on disk and memory.
How To Hunt For UEFI Malware Using Velociraptor

We can see when running on an infected machine that the BOOT application path has clearly changed from the default: \EFI\Microsoft\Boot\bootmgfw.efi. Therefore, Boot Application is a field that is stackable across the network.

We can also output extended values, including digest hashes for verification.
How To Hunt For UEFI Malware Using Velociraptor

Other forensic artifacts

There are many other generic forensic artifacts analysts could focus on for assisting detection of a UEFI threat. From malware network activity to unexpected errors in the event log associated with Antivirus/Security tools on the machine.

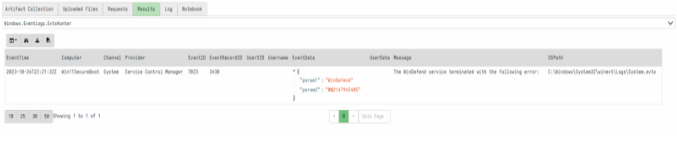
For example: BlackLotus made an effort to evade detection by changing Windows Defender access tokens to SE_PRIVILEGE_REMOVED. This technique keeps the Defender service running but effectively disables it. While Velociraptor may not have protected process privileges to check tokens directly, we can check for other indicators such as errors associated with use.
How To Hunt For UEFI Malware Using Velociraptor

Similarly, Memory integrity (HVCI) is a feature of virtualization-based security (VBS) in Windows. It provides a stronger virtualization environment via isolation and kernel memory allocations.The feature is related to Secure Boot and can be disabled for malware that needs a lower integrity environment to run. It requires setting the configuration registry key value to 0.

HKLM\SYSTEM\CurrentControlSet\Control\DeviceGuard\Scenarios\HypervisorEnforcedCodeIntegrity\Value

0 – disabled

1 – enabled
Windows.Registry.HVCI available on the artifact exchange can be used to query for this key value.

How To Hunt For UEFI Malware Using Velociraptor

Conclusion

Despite UEFI threats possessing intimidating capabilities, security practitioners can deploy some visibility with current tools for remote investigation. Forensically parsing disk and not relying on the Windows API, or reviewing other systemic indicators that may signal compromise, is a practical way to detect components of these threats. Knowing collection capabilities, the gaps, and how to mitigate these is just as important as knowing the threat.

In this post we have covered some of Velociraptor’s visibility for UEFI threats and we have only scratched the surface for those who know their environment and can query it effectively. Rapid7 supports Velociraptor open source, providing the community with Velociraptor and open source features unavailable even in some paid tools.

References:

  1. ESET, Martin Smolar – BlackLotus UEFI bootkit: Myth confirmed
  2. Microsoft Incident Response – Guidance for investigating attacks using CVE-2022-21894: The BlackLotus campaign
  3. Trellix Insights: TrickBot offers new TrickBoot
  4. Palo Alto Unit 42: Diving Into Glupteba’s UEFI Bootkit
  5. Sentinel1: Moving from common sense knowledge about uefi to actually dumping uefi firmware

Intel Rebrands its FPGA Business Altera in an Awesome Branding Move

Post Syndicated from Patrick Kennedy original https://www.servethehome.com/intel-rebrands-its-fpga-business-altera-in-an-awesome-branding-move/

In an awesome branding move, Intel’s FPGA business spin-off will be named “Altera”. Along with the name, we have a few roadmap updates

The post Intel Rebrands its FPGA Business Altera in an Awesome Branding Move appeared first on ServeTheHome.

[$] A sandbox mode for the kernel

Post Syndicated from corbet original https://lwn.net/Articles/963734/

The Linux kernel follows a monolithic design, and that brings a well-known
problem: all code in the kernel has access to the entirety of the kernel’s
address space. As a result, a bug in (for example) an obscure driver may
well be exploitable to wreak havoc on core-kernel data structures. Various
attempts have been made over the years to increase the degree of isolation
within the kernel. The latest of these, “SandBox
Mode”
proposed by Petr Tesařík, makes it possible for the kernel to run
some limited code safely, but it has encountered a bit of a chilly reception.

Data governance in the age of generative AI

Post Syndicated from Krishna Rupanagunta original https://aws.amazon.com/blogs/big-data/data-governance-in-the-age-of-generative-ai/

Data is your generative AI differentiator, and a successful generative AI implementation depends on a robust data strategy incorporating a comprehensive data governance approach. Working with large language models (LLMs) for enterprise use cases requires the implementation of quality and privacy considerations to drive responsible AI. However, enterprise data generated from siloed sources combined with the lack of a data integration strategy creates challenges for provisioning the data for generative AI applications. The need for an end-to-end strategy for data management and data governance at every step of the journey—from ingesting, storing, and querying data to analyzing, visualizing, and running artificial intelligence (AI) and machine learning (ML) models—continues to be of paramount importance for enterprises.

In this post, we discuss the data governance needs of generative AI application data pipelines, a critical building block to govern data used by LLMs to improve the accuracy and relevance of their responses to user prompts in a safe, secure, and transparent manner. Enterprises are doing this by using proprietary data with approaches like Retrieval Augmented Generation (RAG), fine-tuning, and continued pre-training with foundation models.

Data governance is a critical building block across all these approaches, and we see two emerging areas of focus. First, many LLM use cases rely on enterprise knowledge that needs to be drawn from unstructured data such as documents, transcripts, and images, in addition to structured data from data warehouses. Unstructured data is typically stored across siloed systems in varying formats, and generally not managed or governed with the same level of rigor as structured data. Second, generative AI applications introduce a higher number of data interactions than conventional applications, which requires that the data security, privacy, and access control policies be implemented as part of the generative AI user workflows.

In this post, we cover data governance for building generative AI applications on AWS with a lens on structured and unstructured enterprise knowledge sources, and the role of data governance during the user request-response workflows.

Use case overview

Let’s explore an example of a customer support AI assistant. The following figure shows the typical conversational workflow that is initiated with a user prompt.

The workflow includes the following key data governance steps:

  1. Prompt user access control and security policies.
  2. Access policies to extract permissions based on relevant data and filter out results based on the prompt user role and permissions.
  3. Enforce data privacy policies such as personally identifiable information (PII) redactions.
  4. Enforce fine-grained access control.
  5. Grant the user role permissions for sensitive information and compliance policies.

To provide a response that includes the enterprise context, each user prompt needs to be augmented with a combination of insights from structured data from the data warehouse and unstructured data from the enterprise data lake. On the backend, the batch data engineering processes refreshing the enterprise data lake need to expand to ingest, transform, and manage unstructured data. As part of the transformation, the objects need to be treated to ensure data privacy (for example, PII redaction). Finally, access control policies also need to be extended to the unstructured data objects and to vector data stores.

Let’s look at how data governance can be applied to the enterprise knowledge source data pipelines and the user request-response workflows.

Enterprise knowledge: Data management

The following figure summarizes data governance considerations for data pipelines and the workflow for applying data governance.

Data governance steps in data pipelines

In the above figure, the data engineering pipelines include the following data governance steps:

  1. Create and update a catalog through data evolution.
  2. Implement data privacy policies.
  3. Implement data quality by data type and source.
  4. Link structured and unstructured datasets.
  5. Implement unified fine-grained access controls for structured and unstructured datasets.

Let’s look at some of the key changes in the data pipelines namely, data cataloging, data quality, and vector embedding security in more detail.

Data discoverability

Unlike structured data, which is managed in well-defined rows and columns, unstructured data is stored as objects. For users to be able to discover and comprehend the data, the first step is to build a comprehensive catalog using the metadata that is generated and captured in the source systems. This starts with the objects (such as documents and transcript files) being ingested from the relevant source systems into the raw zone in the data lake in Amazon Simple Storage Service (Amazon S3) in their respective native formats (as illustrated in the preceding figure). From here, object metadata (such as file owner, creation date, and confidentiality level) is extracted and queried using Amazon S3 capabilities. Metadata can vary by data source, and it’s important to examine the fields and, where required, derive the necessary fields to complete all the necessary metadata. For instance, if an attribute like content confidentiality is not tagged at a document level in the source application, this may need to be derived as part of the metadata extraction process and added as an attribute in the data catalog. The ingestion process needs to capture object updates (changes, deletions) in addition to new objects on an ongoing basis. For detailed implementation guidance, refer to Unstructured data management and governance using AWS AI/ML and analytics services. To further simplify the discovery and introspection between business glossaries and technical data catalogs, you can use Amazon DataZone for business users to discover and share data stored across data silos.

Data privacy

Enterprise knowledge sources often contain PII and other sensitive data (such as addresses and Social Security numbers). Based on your data privacy policies, these elements need to be treated (masked, tokenized, or redacted) from the sources before they can be used for downstream use cases. From the raw zone in Amazon S3, the objects need to be processed before they can be consumed by downstream generative AI models. A key requirement here is PII identification and redaction, which you can implement with Amazon Comprehend. It’s important to remember that it will not always be feasible to strip away all the sensitive data without impacting the context of the data. Semantic context is one of the key factors that drive the accuracy and relevance of generative AI model outputs, and it’s critical to work backward from the use case and strike the necessary balance between privacy controls and model performance.

Data enrichment

In addition, additional metadata may need to be extracted from the objects. Amazon Comprehend provides capabilities for entity recognition (for example, identifying domain-specific data like policy numbers and claim numbers) and custom classification (for example, categorizing a customer care chat transcript based on the issue description). Furthermore, you may need to combine the unstructured and structured data to create a holistic picture of key entities, like customers. For example, in an airline loyalty scenario, there would be significant value in linking unstructured data capture of customer interactions (such as customer chat transcripts and customer reviews) with structured data signals (such as ticket purchases and miles redemption) to create a more complete customer profile that can then enable the delivery of better and more relevant trip recommendations. AWS Entity Resolution is an ML service that helps in matching and linking records. This service helps link related sets of information to create deeper, more connected data about key entities like customers, products, and so on, which can further improve the quality and relevance of LLM outputs. This is available in the transformed zone in Amazon S3 and is ready to be consumed downstream for vector stores, fine-tuning, or training of LLMs. After these transformations, data can be made available in the curated zone in Amazon S3.

Data quality

A critical factor to realizing the full potential of generative AI is dependent on the quality of the data that is used to train the models as well as the data that is used to augment and enhance the model response to a user input. Understanding the models and their outcomes in the context of accuracy, bias, and reliability is directly proportional to the quality of data used to build and train the models.

Amazon SageMaker Model Monitor provides a proactive detection of deviations in model data quality drift and model quality metrics drift. It also monitors bias drift in your model’s predictions and feature attribution. For more details, refer to Monitoring in-production ML models at large scale using Amazon SageMaker Model Monitor. Detecting bias in your model is a fundamental building block to responsible AI, and Amazon SageMaker Clarify helps detect potential bias that can produce a negative or a less accurate result. To learn more, see Learn how Amazon SageMaker Clarify helps detect bias.

A newer area of focus in generative AI is the use and quality of data in prompts from enterprise and proprietary data stores. An emerging best practice to consider here is shift-left, which puts a strong emphasis on early and proactive quality assurance mechanisms. In the context of data pipelines designed to process data for generative AI applications, this implies identifying and resolving data quality issues earlier upstream to mitigate the potential impact of data quality issues later. AWS Glue Data Quality not only measures and monitors the quality of your data at rest in your data lakes, data warehouses, and transactional databases, but also allows early detection and correction of quality issues for your extract, transform, and load (ETL) pipelines to ensure your data meets the quality standards before it is consumed. For more details, refer to Getting started with AWS Glue Data Quality from the AWS Glue Data Catalog.

Vector store governance

Embeddings in vector databases elevate the intelligence and capabilities of generative AI applications by enabling features such as semantic search and reducing hallucinations. Embeddings typically contain private and sensitive data, and encrypting the data is a recommended step in the user input workflow. Amazon OpenSearch Serverless stores and searches your vector embeddings, and encrypts your data at rest with AWS Key Management Service (AWS KMS). For more details, see Introducing the vector engine for Amazon OpenSearch Serverless, now in preview. Similarly, additional vector engine options on AWS, including Amazon Kendra and Amazon Aurora, encrypt your data at rest with AWS KMS. For more information, refer to Encryption at rest and Protecting data using encryption.

As embeddings are generated and stored in a vector store, controlling access to the data with role-based access control (RBAC) becomes a key requirement to maintaining overall security. Amazon OpenSearch Service provides fine-grained access controls (FGAC) features with AWS Identity and Access Management (IAM) rules that can be associated with Amazon Cognito users. Corresponding user access control mechanisms are also provided by OpenSearch Serverless, Amazon Kendra, and Aurora. To learn more, refer to Data access control for Amazon OpenSearch Serverless, Controlling user access to documents with tokens, and Identity and access management for Amazon Aurora, respectively.

User request-response workflows

Controls in the data governance plane need to be integrated into the generative AI application as part of the overall solution deployment to ensure compliance with data security (based on role-based access controls) and data privacy (based on role-based access to sensitive data) policies. The following figure illustrates the workflow for applying data governance.

Data governance in user prompt workflow

The workflow includes the following key data governance steps:

  1. Provide a valid input prompt for alignment with compliance policies (for example, bias and toxicity).
  2. Generate a query by mapping prompt keywords with the data catalog.
  3. Apply FGAC policies based on user role.
  4. Apply RBAC policies based on user role.
  5. Apply data and content redaction to the response based on user role permissions and compliance policies.

As part of the prompt cycle, the user prompt must be parsed and keywords extracted to ensure alignment with compliance policies using a service like Amazon Comprehend (see New for Amazon Comprehend – Toxicity Detection) or Guardrails for Amazon Bedrock (preview). When that is validated, if the prompt requires structured data to be extracted, the keywords can be used against the data catalog (business or technical) to extract the relevant data tables and fields and construct a query from the data warehouse. The user permissions are evaluated using AWS Lake Formation to filter the relevant data. In the case of unstructured data, the search results are restricted based on the user permission policies implemented in the vector store. As a final step, the output response from the LLM needs to be evaluated against user permissions (to ensure data privacy and security) and compliance with safety (for example, bias and toxicity guidelines).

Although this process is specific to a RAG implementation and is applicable to other LLM implementation strategies, there are additional controls:

  • Prompt engineering – Access to the prompt templates to invoke need to be restricted based on access controls augmented by business logic.
  • Fine-tuning models and training foundation models – In cases where objects from the curated zone in Amazon S3 are used as training data for fine-tuning the foundation models, the permissions policies need to be configured with Amazon S3 identity and access management at the bucket or object level based on the requirements.

Summary

Data governance is critical to enabling organizations to build enterprise generative AI applications. As enterprise use cases continue to evolve, there will be a need to expand the data infrastructure to govern and manage new, diverse, unstructured datasets to ensure alignment with privacy, security, and quality policies. These policies need to be implemented and managed as part of data ingestion, storage, and management of the enterprise knowledge base along with the user interaction workflows. This makes sure that the generative AI applications not only minimize the risk of sharing inaccurate or wrong information, but also protect from bias and toxicity that can lead to harmful or libelous outcomes. To learn more about data governance on AWS, see What is Data Governance?

In subsequent posts, we will provide implementation guidance on how to expand the governance of the data infrastructure to support generative AI use cases.


About the Authors

Krishna Rupanagunta leads a team of Data and AI Specialists at AWS. He and his team work with customers to help them innovate faster and make better decisions using Data, Analytics, and AI/ML. He can be reached via LinkedIn.

Imtiaz (Taz) Sayed is the WW Tech Leader for Analytics at AWS. He enjoys engaging with the community on all things data and analytics. He can be reached via LinkedIn.

Raghvender Arni (Arni) leads the Customer Acceleration Team (CAT) within AWS Industries. The CAT is a global cross-functional team of customer facing cloud architects, software engineers, data scientists, and AI/ML experts and designers that drives innovation via advanced prototyping, and drives cloud operational excellence via specialized technical expertise.

Zaraz launches new pricing

Post Syndicated from Yo'av Moshe original https://blog.cloudflare.com/zaraz-announces-new-pricing

In July, 2023, we announced that Zaraz was transitioning out of beta and becoming available to all Cloudflare users. Zaraz helps users manage and optimize the ever-growing number of third-party tools on their websites — analytics, marketing pixels, chatbots, and more — without compromising on speed, privacy, or security. Soon after the announcement went online, we received feedback from users who were concerned about the new pricing system. We discovered that in some scenarios the proposed pricing could cause high charges, which was not the intention, and so we promised to look into it. Since then, we have iterated over different pricing options, talked with customers of different sizes, and finally reached a new pricing system that we believe is affordable, predictable, and simple. The new pricing for Zaraz will take effect on April 15, 2024, and is described below.

Introducing Zaraz Events

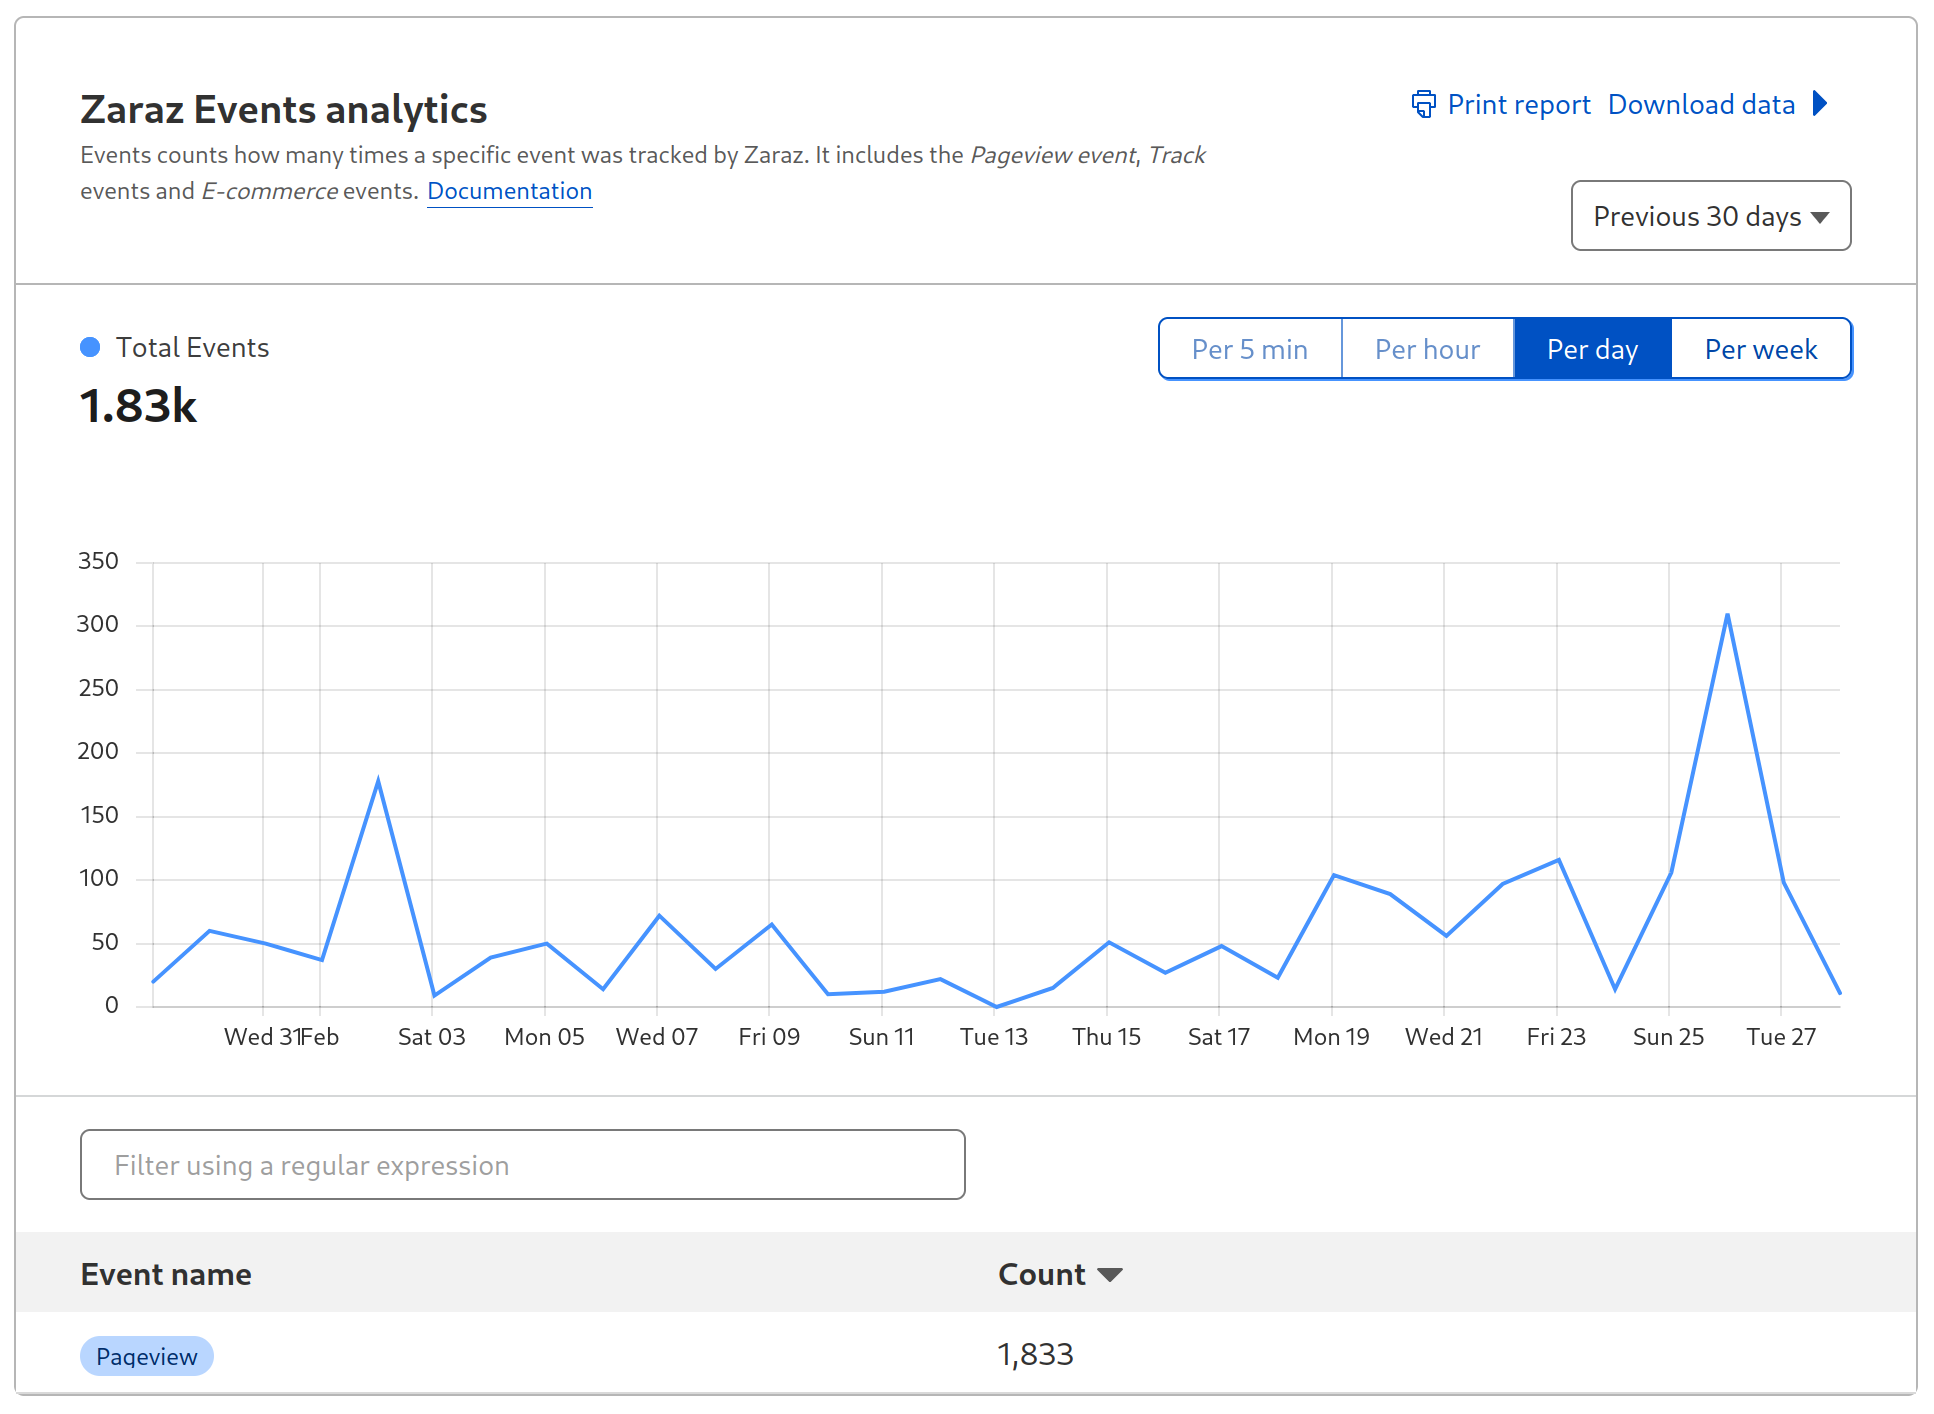
One of the biggest changes we made was changing the metric we used for pricing Zaraz. One Zaraz Event is an event you’re sending to Zaraz, whether that’s a pageview, a zaraz.track event, or similar. You can easily see the total number of Zaraz Events you’re currently using under the Monitoring section in the Cloudflare Zaraz Dashboard. Every Cloudflare account can use 1,000,000 Zaraz Events completely for free, every month.

The Zaraz Monitoring page shows exactly how many Zaraz Events your website is using

We believe that Zaraz Events are a better representation of the usage of Zaraz. As the web progresses and as Single-Page-Applications are becoming more and more popular, the definition of a “pageview”, which was used for the old pricing system, is becoming more and more vague. Zaraz Events are agnostic to different tech stacks, and work the same when using the Zaraz HTTP API. It’s a simpler metric that should better reflect the way Zaraz is used.

Predictable costs for high volume websites

With the new Zaraz pricing model, every Cloudflare account gets 1,000,000 Zaraz Events per month for free. If your account needs more than that, every additional 1,000,000 Zaraz Events are only $5 USD, with volume discounting available for Enterprise accounts. Compared with other third-party managers and tag management software, this new pricing model makes Zaraz an affordable and user-friendly solution for server-side loading of tools and tags.

Available for all

We also decided that all Zaraz features should be available for everyone. We want users to make the most of Zaraz, no matter how big or small their website is. This means that advanced features like making custom HTTP requests, using the Consent Management API, loading custom Managed Components, configuring custom endpoints, using the Preview & Publish Workflow, and even using the Zaraz Ecommerce features are now available on all plans, from Free to Enterprise.

Try it out

We’re announcing this new affordable price for Zaraz while retaining all the features that make it the perfect solution for managing third-party tools on your website. Zaraz is a one-click installation that requires no server, and it’s lightning fast thanks to Cloudflare’s network, which is within 50 milliseconds of approximately 95% of the Internet-connected population. Zaraz is extremely extensible using the Open Source format of Managed Components, allowing you to change tools and create your own, and it’s transparent about what information is shared with tools on your website, allowing you to control and improve the privacy of your website visitors.

Zaraz recently completed the migration of all tools to Managed Components. This makes tools on your website more like apps on your phone, allowing you to granularly decide what permissions to grant tools. For example, it allows you to prevent a tool from making client-side network requests or storing cookies. With the Zaraz Context Enricher you can create custom data manipulation processes in a Cloudflare Worker, and do things like attach extra information to payloads from your internal CRM, or automatically remove and mask personally-identifiable information (PII) like email addresses before it reaches your providers.

We would like to thank all the users that provided us with their feedback. We acknowledge that the previous pricing might have caused some to think twice about choosing Zaraz, and we hope that this will encourage them to reconsider. Cloudflare Zaraz is a tool that is meant first and foremost to serve the people building websites on the Internet, and we thank everyone for sharing their feedback to help us get to a better product in the end.

The new pricing for Zaraz will take effect starting April 15, 2024.

Security updates for Thursday

Post Syndicated from jake original https://lwn.net/Articles/964039/

Security updates have been issued by Debian (chromium), Fedora (moodle), Red Hat (kernel, kernel-rt, and postgresql:15), Slackware (wpa_supplicant), SUSE (Java and rear27a), and Ubuntu (libcpanel-json-xs-perl, libuv1, linux-aws, linux-aws-5.15, linux-azure, linux-azure-5.4, linux-lowlatency, linux-lowlatency-hwe-6.5, linux-oem-6.5, python-openstackclient, and unbound).

Remediating new DNSSEC resource exhaustion vulnerabilities

Post Syndicated from Vicky Shrestha original https://blog.cloudflare.com/remediating-new-dnssec-resource-exhaustion-vulnerabilities


Cloudflare has been part of a multivendor, industry-wide effort to mitigate two critical DNSSEC vulnerabilities. These vulnerabilities exposed significant risks to critical infrastructures that provide DNS resolution services. Cloudflare provides DNS resolution for anyone to use for free with our public resolver 1.1.1.1 service. Mitigations for Cloudflare’s public resolver 1.1.1.1 service were applied before these vulnerabilities were disclosed publicly. Internal resolvers using unbound (open source software) were upgraded promptly after a new software version fixing these vulnerabilities was released.

All Cloudflare DNS infrastructure was protected from both of these vulnerabilities before they were disclosed and is safe today. These vulnerabilities do not affect our Authoritative DNS or DNS firewall products.

All major DNS software vendors have released new versions of their software. All other major DNS resolver providers have also applied appropriate mitigations. Please update your DNS resolver software immediately, if you haven’t done so already.

Background

Domain name system (DNS) security extensions, commonly known as DNSSEC, are extensions to the DNS protocol that add authentication and integrity capabilities. DNSSEC uses cryptographic keys and signatures that allow DNS responses to be validated as authentic. DNSSEC protocol specifications have certain requirements that prioritize availability at the cost of increased complexity and computational cost for the validating DNS resolvers. The mitigations for the vulnerabilities discussed in this blog require local policies to be applied that relax these requirements in order to avoid exhausting the resources of validators.

The design of the DNS and DNSSEC protocols follows the Robustness principle: “be conservative in what you do, be liberal in what you accept from others”. There have been many vulnerabilities in the past that have taken advantage of protocol requirements following this principle. Malicious actors can exploit these vulnerabilities to attack DNS infrastructure, in this case by causing additional work for DNS resolvers by crafting DNSSEC responses with complex configurations. As is often the case, we find ourselves having to create a pragmatic balance between the flexibility that allows a protocol to adapt and evolve and the need to safeguard the stability and security of the services we operate.

Cloudflare’s public resolver 1.1.1.1 is a privacy-centric public resolver service. We have been using stricter validations and limits aimed at protecting our own infrastructure in addition to shielding authoritative DNS servers operated outside our network. As a result, we often receive complaints about resolution failures. Experience shows us that strict validations and limits can impact availability in some edge cases, especially when DNS domains are improperly configured. However, these strict validations and limits are necessary to improve the overall reliability and resilience of the DNS infrastructure.

The vulnerabilities and how we mitigated them are described below.

Keytrap vulnerability (CVE-2023-50387)

Introduction

A DNSSEC signed zone can contain multiple keys (DNSKEY) to sign the contents of a DNS zone and a Resource Record Set (RRSET) in a DNS response can have multiple signatures (RRSIG). Multiple keys and signatures are required to support things like key rollover, algorithm rollover, and multi-signer DNSSEC. DNSSEC protocol specifications require a validating DNS resolver to try every possible combination of keys and signatures when validating a DNS response.

During validation, a resolver looks at the key tag of every signature and tries to find the associated key that was used to sign it. A key tag is an unsigned 16-bit number calculated as a checksum over the key’s resource data (RDATA). Key tags are intended to allow efficient pairing of a signature with the key which has supposedly created it.  However, key tags are not unique, and it is possible that multiple keys can have the same key tag. A malicious actor can easily craft a DNS response with multiple keys having the same key tag together with multiple signatures, none of which might validate. A validating resolver would have to try every combination (number of keys multiplied by number of signatures) when trying to validate this response. This increases the computational cost of the validating resolver many-fold, degrading performance for all its users. This is known as the Keytrap vulnerability.

Variations of this vulnerability include using multiple signatures with one key, using one signature with multiple keys having colliding key tags, and using multiple keys with corresponding hashes added to the parent delegation signer record.

Mitigation

We have limited the maximum number of keys we will accept at a zone cut. A zone cut is where a parent zone delegates to a child zone, e.g. where the .com zone delegates cloudflare.com to Cloudflare nameservers. Even with this limit already in place and various other protections built for our platform, we realized that it would still be computationally costly to process a malicious DNS answer from an authoritative DNS server.

To address and further mitigate this vulnerability, we added a signature validations limit per RRSET and a total signature validations limit per resolution task. One resolution task might include multiple recursive queries to external authoritative DNS servers in order to answer a single DNS question. Clients queries exceeding these limits will fail to resolve and will receive a response with an Extended DNS Error (EDE) code 0. Furthermore, we added metrics which will allow us to detect attacks attempting to exploit this vulnerability.

NSEC3 iteration and closest encloser proof vulnerability (CVE-2023-50868)

Introduction

NSEC3 is an alternative approach for authenticated denial of existence. You can learn more about authenticated denial of existence here. NSEC3 uses a hash derived from DNS names instead of the DNS names directly in an attempt to prevent zone enumeration and the standard supports multiple iterations for hash calculations. However, because the full DNS name is used as input to the hash calculation, increasing hashing iterations beyond the initial doesn’t provide any additional value and is not recommended in RFC9276. This complication is further inflated while finding the closest enclosure proof. A malicious DNS response from an authoritative DNS server can set a high NSEC3 iteration count and long DNS names with multiple DNS labels to exhaust the computing resources of a validating resolver by making it do unnecessary hash computations.

Mitigation

For this vulnerability, we applied a similar mitigation technique as we did for Keytrap. We added a limit for total hash calculations per resolution task to answer a single DNS question. Similarly, clients queries exceeding this limit will fail to resolve and will receive a response with an EDE code 27. We also added metrics to track hash calculations allowing early detection of attacks attempting to exploit this vulnerability.

Timeline

Date and time in UTC

Event

2023-11-03 16:05

John Todd from Quad9 invites Cloudflare to participate in a joint task force to discuss a new DNS vulnerability. 

2023-11-07 14:30

A group of DNS vendors and service providers meet to discuss the vulnerability during IETF 118. Discussions and collaboration continues in a closed chat group hosted at DNS-OARC

2023-12-08 20:20

Cloudflare public resolver 1.1.1.1 is fully patched to mitigate Keytrap vulnerability (CVE-2023-50387)

2024-01-17 22:39

Cloudflare public resolver 1.1.1.1 is fully patched to mitigate NSEC3 iteration count and closest encloser vulnerability (CVE-2023-50868)

2024-02-13 13:04

Unbound package is released 

2024-02-13 23:00

Cloudflare internal CDN resolver is fully patched to mitigate both CVE-2023-50387 and CVE-2023-50868

Credits

We would like to thank Elias Heftrig, Haya Schulmann, Niklas Vogel, Michael Waidner from the German National Research Center for Applied Cybersecurity ATHENE, for discovering the Keytrap vulnerability and doing a responsible disclosure.

We would like to thank Petr Špaček from Internet Systems Consortium (ISC) for discovering the NSEC3 iteration and closest encloser proof vulnerability and doing a responsible disclosure.

We would like to thank John Todd from Quad9  and the DNS Operations Analysis and Research Center (DNS-OARC) for facilitating coordination amongst various stakeholders.

And finally, we would like to thank the DNS-OARC community members, representing various DNS vendors and service providers, who all came together and worked tirelessly to fix these vulnerabilities, working towards a common goal of making the internet resilient and secure.

How the “Frontier” Became the Slogan of Uncontrolled AI

Post Syndicated from B. Schneier original https://www.schneier.com/blog/archives/2024/02/how-the-frontier-became-the-slogan-of-uncontrolled-ai.html

Artificial intelligence (AI) has been billed as the next frontier of humanity: the newly available expanse whose exploration will drive the next era of growth, wealth, and human flourishing. It’s a scary metaphor. Throughout American history, the drive for expansion and the very concept of terrain up for grabs—land grabs, gold rushes, new frontiers—have provided a permission structure for imperialism and exploitation. This could easily hold true for AI.

This isn’t the first time the concept of a frontier has been used as a metaphor for AI, or technology in general. As early as 2018, the powerful foundation models powering cutting-edge applications like chatbots have been called “frontier AI.” In previous decades, the internet itself was considered an electronic frontier. Early cyberspace pioneer John Perry Barlow wrote “Unlike previous frontiers, this one has no end.” When he and others founded the internet’s most important civil liberties organization, they called it the Electronic Frontier Foundation.

America’s experience with frontiers is fraught, to say the least. Expansion into the Western frontier and beyond has been a driving force in our country’s history and identity—and has led to some of the darkest chapters of our past. The tireless drive to conquer the frontier has directly motivated some of this nation’s most extreme episodes of racism, imperialism, violence, and exploitation.

That history has something to teach us about the material consequences we can expect from the promotion of AI today. The race to build the next great AI app is not the same as the California gold rush. But the potential that outsize profits will warp our priorities, values, and morals is, unfortunately, analogous.

Already, AI is starting to look like a colonialist enterprise. AI tools are helping the world’s largest tech companies grow their power and wealth, are spurring nationalistic competition between empires racing to capture new markets, and threaten to supercharge government surveillance and systems of apartheid. It looks more than a bit like the competition among colonialist state and corporate powers in the seventeenth century, which together carved up the globe and its peoples. By considering America’s past experience with frontiers, we can understand what AI may hold for our future, and how to avoid the worst potential outcomes.

America’s “Frontier” Problem

For 130 years, historians have used frontier expansion to explain sweeping movements in American history. Yet only for the past thirty years have we generally acknowledged its disastrous consequences.

Frederick Jackson Turner famously introduced the frontier as a central concept for understanding American history in his vastly influential 1893 essay. As he concisely wrote, “American history has been in a large degree the history of the colonization of the Great West.”

Turner used the frontier to understand all the essential facts of American life: our culture, way of government, national spirit, our position among world powers, even the “struggle” of slavery. The endless opportunity for westward expansion was a beckoning call that shaped the American way of life. Per Turner’s essay, the frontier resulted in the individualistic self-sufficiency of the settler and gave every (white) man the opportunity to attain economic and political standing through hardscrabble pioneering across dangerous terrain.The New Western History movement, gaining steam through the 1980s and led by researchers like Patricia Nelson Limerick, laid plain the racial, gender, and class dynamics that were always inherent to the frontier narrative. This movement’s story is one where frontier expansion was a tool used by the white settler to perpetuate a power advantage.The frontier was not a siren calling out to unwary settlers; it was a justification, used by one group to subjugate another. It was always a convenient, seemingly polite excuse for the powerful to take what they wanted. Turner grappled with some of the negative consequences and contradictions of the frontier ethic and how it shaped American democracy. But many of those whom he influenced did not do this; they celebrated it as a feature, not a bug. Theodore Roosevelt wrote extensively and explicitly about how the frontier and his conception of white supremacy justified expansion to points west and, through the prosecution of the Spanish-American War, far across the Pacific. Woodrow Wilson, too, celebrated the imperial loot from that conflict in 1902. Capitalist systems are “addicted to geographical expansion” and even, when they run out of geography, seek to produce new kinds of spaces to expand into. This is what the geographer David Harvey calls the “spatial fix.”Claiming that AI will be a transformative expanse on par with the Louisiana Purchase or the Pacific frontiers is a bold assertion—but increasingly plausible after a year dominated by ever more impressive demonstrations of generative AI tools. It’s a claim bolstered by billions of dollars in corporate investment, by intense interest of regulators and legislators worldwide in steering how AI is developed and used, and by the variously utopian or apocalyptic prognostications from thought leaders of all sectors trying to understand how AI will shape their sphere—and the entire world.

AI as a Permission Structure

Like the western frontier in the nineteenth century, the maniacal drive to unlock progress via advancement in AI can become a justification for political and economic expansionism and an excuse for racial oppression.

In the modern day, OpenAI famously paid dozens of Kenyans little more than a dollar an hour to process data used in training their models underlying products such as ChatGPT. Paying low wages to data labelers surely can’t be equated to the chattel slavery of nineteenth-century America. But these workers did endure brutal conditions, including being set to constantly review content with “graphic scenes of violence, self-harm, murder, rape, necrophilia, child abuse, bestiality, and incest.” There is a global market for this kind of work, which has been essential to the most important recent advances in AI such as Reinforcement Learning with Human Feedback, heralded as the most important breakthrough of ChatGPT.

The gold rush mentality associated with expansion is taken by the new frontiersmen as permission to break the rules, and to build wealth at the expense of everyone else. In 1840s California, gold miners trespassed on public lands and yet were allowed to stake private claims to the minerals they found, and even to exploit the water rights on those lands. Again today, the game is to push the boundaries on what rule-breaking society will accept, and hope that the legal system can’t keep up.

Many internet companies have behaved in exactly the same way since the dot-com boom. The prospectors of internet wealth lobbied for, or simply took of their own volition, numerous government benefits in their scramble to capture those frontier markets. For years, the Federal Trade Commission has looked the other way or been lackadaisical in halting antitrust abuses by Amazon, Facebook, and Google. Companies like Uber and Airbnb exploited loopholes in, or ignored outright, local laws on taxis and hotels. And Big Tech platforms enjoyed a liability shield that protected them from punishment the contents people posted to their sites.

We can already see this kind of boundary pushing happening with AI.

Modern frontier AI models are trained using data, often copyrighted materials, with untested legal justification. Data is like water for AI, and, like the fight over water rights in the West, we are repeating a familiar process of public acquiescence to private use of resources. While some lawsuits are pending, so far AI companies have faced no significant penalties for the unauthorized use of this data.

Pioneers of self-driving vehicles tried to skip permitting processes and used fake demonstrations of their capabilities to avoid government regulation and entice consumers. Meanwhile, AI companies’ hope is that they won’t be held to blame if the AI tools they produce spew out harmful content that causes damage in the real world. They are trying to use the same liability shield that fostered Big Tech’s exploitation of the previous electronic frontiers—the web and social media—to protect their own actions.

Even where we have concrete rules governing deleterious behavior, some hope that using AI is itself enough to skirt them. Copyright infringement is illegal if a person does it, but would that same person be punished if they train a large language model to regurgitate copyrighted works? In the political sphere, the Federal Election Commission has precious few powers to police political advertising; some wonder if they simply won’t be considered relevant if people break those rules using AI.

AI and American Exceptionalism

Like The United States’ historical frontier, AI has a feel of American exceptionalism. Historically, we believed we were different from the Old World powers of Europe because we enjoyed the manifest destiny of unrestrained expansion between the oceans. Today, we have the most CPU power, the most data scientists, the most venture-capitalist investment, and the most AI companies. This exceptionalism has historically led many Americans to believe they don’t have to play by the same rules as everyone else.

Both historically and in the modern day, this idea has led to deleterious consequences such as militaristic nationalism (leading to justifying of foreign interventions in Iraq and elsewhere), masking of severe inequity within our borders, abdication of responsibility from global treaties on climate and law enforcement, and alienation from the international community. American exceptionalism has also wrought havoc on our country’s engagement with the internet, including lawless spying and surveillance by forces like the National Security Agency.

The same line of thinking could have disastrous consequences if applied to AI. It could perpetuate a nationalistic, Cold War–style narrative about America’s inexorable struggle with China, this time predicated on an AI arms race. Moral exceptionalism justifies why we should be allowed to use tools and weapons that are dangerous in the hands of a competitor, or enemy. It could enable the next stage of growth of the military-industrial complex, with claims of an urgent need to modernize missile systems and drones through using AI. And it could renew a rationalization for violating civil liberties in the US and human rights abroad, empowered by the idea that racial profiling is more objective if enforced by computers.The inaction of Congress on AI regulation threatens to land the US in a regime of de facto American exceptionalism for AI. While the EU is about to pass its comprehensive AI Act, lobbyists in the US have muddled legislative action. While the Biden administration has used its executive authority and federal purchasing power to exert some limited control over AI, the gap left by lack of legislation leaves AI in the US looking like the Wild West—a largely unregulated frontier.The lack of restraint by the US on potentially dangerous AI technologies has a global impact. First, its tech giants let loose their products upon the global public, with the harms that this brings with it. Second, it creates a negative incentive for other jurisdictions to more forcefully regulate AI. The EU’s regulation of high-risk AI use cases begins to look like unilateral disarmament if the US does not take action itself. Why would Europe tie the hands of its tech competitors if the US refuses to do the same?

AI and Unbridled Growth

The fundamental problem with frontiers is that they seem to promise cost-free growth. There was a constant pressure for American westward expansion because a bigger, more populous country accrues more power and wealth to the elites and because, for any individual, a better life was always one more wagon ride away into “empty” terrain. AI presents the same opportunities. No matter what field you’re in or what problem you’re facing, the attractive opportunity of AI as a free labor multiplier probably seems like the solution; or, at least, makes for a good sales pitch.

That would actually be okay, except that the growth isn’t free. America’s imperial expansion displaced, harmed, and subjugated native peoples in the Americas, Africa, and the Pacific, while enlisting poor whites to participate in the scheme against their class interests. Capitalism makes growth look like the solution to all problems, even when it’s clearly not. The problem is that so many costs are externalized. Why pay a living wage to human supervisors training AI models when an outsourced gig worker will do it at a fraction of the cost? Why power data centers with renewable energy when it’s cheaper to surge energy production with fossil fuels? And why fund social protections for wage earners displaced by automation if you don’t have to? The potential of consumer applications of AI, from personal digital assistants to self-driving cars, is irresistible; who wouldn’t want a machine to take on the most routinized and aggravating tasks in your daily life? But the externalized cost for consumers is accepting the inevitability of domination by an elite who will extract every possible profit from AI services.

Controlling Our Frontier Impulses

None of these harms are inevitable. Although the structural incentives of capitalism and its growth remain the same, we can make different choices about how to confront them.

We can strengthen basic democratic protections and market regulations to avoid the worst impacts of AI colonialism. We can require ethical employment for the humans toiling to label data and train AI models. And we can set the bar higher for mitigating bias in training and harm from outputs of AI models.

We don’t have to cede all the power and decision making about AI to private actors. We can create an AI public option to provide an alternative to corporate AI. We can provide universal access to ethically built and democratically governed foundational AI models that any individual—or company—could use and build upon.

More ambitiously, we can choose not to privatize the economic gains of AI. We can cap corporate profits, raise the minimum wage, or redistribute an automation dividend as a universal basic income to let everyone share in the benefits of the AI revolution. And, if these technologies save as much labor as companies say they do, maybe we can also all have some of that time back.

And we don’t have to treat the global AI gold rush as a zero-sum game. We can emphasize international cooperation instead of competition. We can align on shared values with international partners and create a global floor for responsible regulation of AI. And we can ensure that access to AI uplifts developing economies instead of further marginalizing them.

This essay was written with Nathan Sanders, and was originally published in Jacobin.

Extending Zabbix: the power of scripting

Post Syndicated from Giedrius Stasiulionis original https://blog.zabbix.com/extending-zabbix-the-power-of-scripting/27401/

Scripts can extend Zabbix in various different aspects. If you know your ways around a CLI, you will be able to extend your monitoring capabilities and streamline workflows related to most Zabbix components.

What I like about Zabbix is that it is very flexible and powerful tool right out of the box. It has many different ways to collect, evaluate and visualize data, all implemented natively and ready to use.

However, in more complex environments or custom use cases, you will inevitably face situations when something can’t be collected (or displayed) in a way that you want. Luckily enough, Zabbix is flexible even here! It provides you with ways to apply your knowledge and imagination so that even most custom monitoring scenarios would be covered. Even though Zabbix is an open-source tool, in this article I will talk about extending it without changing its code, but rather by applying something on top, with the help of scripting. I will guide you through some examples, which will hopefully pique your curiosity and maybe you will find them interesting enough to experiment and create something similar for yourself.

Although first idea which comes to ones mind when talking about scripts in Zabbix is most likely data collection, it is not the only place where scripts can help. So I will divide those examples / ideas into three sub categories:

  • Data collection
  • Zabbix internals
  • Visualization

Data collection

First things first. Data collection is a starting point for any kind of monitoring. There are multiple ways how to collect data in “custom” ways, but the easiest one is to use UserParameter capabilities. Basics of it are very nicely covered by official documentation or in other sources, e.g. in this video by Dmitry Lambert, so I will skip the “Hello World” part and provide some more advanced ideas which might be useful to consider. Also, the provided examples use common scripting themes/scenarios and you can find many similar solutions in the community, so maybe this will serve better as a reminder or a showcase for someone who has never created any custom items before.

Data collection: DB checks

There is a lot of good information on how to setup DB checks for Zabbix, so this is just a reminder, that one of the ways to do it is via custom scripts. I personally have done it for various different databases: MySQL, Oracle, PostgreSQL, OpenEdge Progress. Thing is ODBC is not always a great or permitted way to go, since some security restrictions might be in place and you can’t get direct access to DB from just anywhere you want. Or you want to transform your retrieved data in a ways that are complex and could hardly be covered by preprocessing. Then you have to rely on Zabbix agent running those queries either from localhost where DB resides or from some other place which is allowed to connect to your DB. Here is an example how you can do it for PostgreSQL

#!/bin/bash

my_dir="$(dirname ${0})"
conf_file="${my_dir}/sms_queue.conf"

[[ ! -f $conf_file ]] && echo -1 && exit 1

. ${conf_file}

export PGPASSWORD="${db_pass}"

query="SELECT COUNT(*) FROM sms WHERE sms.status IN ('retriable', 'validated');"

psql -h "${db_host}" -p "${db_port}" -U "${db_user}" -d "${db}" -c "${query}" -At 2>/dev/null

[[ $? -ne 0 ]] && echo -1 && exit 1

exit 0

Now what’s left is to feed the output of this script into Zabbix via UserParameter. Similar approach can be applied to Oracle (via sqlplus) or MySQL.

Data collection: log delay statistics

I once faced a situation when some graphs which are based on log data started having gaps. It meant something was wrong either with data collection (Zabbix agent) or with data not being there at the moment of collection (so nothing to collect). Quick check suggested it was the second one, but I needed to prove it somehow.

Since these log lines had timestamps of creation, it was a logical step to try to measure, how much do they differ from “current time” of reading. And this is how I came up with the following custom script to implement such idea.

First of all, we need to read the file, say once each minute. We are talking about log with several hundreds of thousands lines per minute, so this script should be made efficient. It should read the file in portions created between two script runs. I have explained such reading in details here so now we will not focus on it.

Next what this script does is it greps timestamps only from each line and counts immediately number of unique lines with the same timestamp (degree of seconds). That is where it becomes fast – it doesn’t need to analyze each and every line individually but it can analyze already grouped content!

Finally, delay is calculated based on the difference between “now” and collected timestamps, and those counters are exactly what is then passed to Zabbix.

#!/bin/bash

my_log="${1}"

my_project="${my_log##*\/}"
my_project="${my_project%%.log}"

me="$(basename ${0})"
my_dir="/tmp/log_delays/${my_project}"

[[ ! -d ${my_dir} ]] && mkdir -p ${my_dir}

# only one instance of this script at single point of time
# this makes sure you don't damage temp files

me_running="${my_dir}/${me}.running"

# allow only one process
# but make it more sophisticated:
# script is being run each minute
# if .running file is here for more than 10 minutes, something is wrong
# delete .running and try to run once again

[[ -f $me_running && $(($(date +%s)-$(stat -c %Y $me_running))) -lt 600 ]] && exit 1

touch $me_running

[[ "${my_log}" == "" || ! -f "${my_log}" ]] && exit 1

log_read="${my_dir}/${me}.read"

# get current file size in bytes

current_size=$(wc -c < "${my_log}")

# remember how many bytes you have now for next read
# when run for first time, you don't know the previous

[[ ! -f "${log_read}" ]] && echo "${current_size}" > "${log_read}"

bytes_read=$(cat "${log_read}")
echo "${current_size}" > "${log_read}"

# if rotated, let's read from the beginning

if [[ ${bytes_read} -gt ${current_size} ]]; then
  bytes_read=0
fi


# get the portion

now=$(date +%s)

delay_1_min=0
delay_5_min=0
delay_10_min=0
delay_30_min=0
delay_45_min=0
delay_60_min=0
delay_rest=0

while read line; do

  [[ ${line} == "" ]] && continue

  line=(${line})

  ts=$(date -d "${line[1]}+00:00" +%s)

  delay=$((now-ts))

  if [[ ${delay} -lt 60 ]]; then
    delay_1_min=$((${delay_1_min}+${line[0]}))
  elif [[ ${delay} -lt 300 ]]; then
    delay_5_min=$((${delay_5_min}+${line[0]}))
  elif [[ ${delay} -lt 600 ]]; then
    delay_10_min=$((${delay_10_min}+${line[0]}))
  elif [[ ${delay} -lt 1800 ]]; then
    delay_30_min=$((${delay_30_min}+${line[0]}))
  elif [[ ${delay} -lt 2700 ]]; then
    delay_45_min=$((${delay_45_min}+${line[0]}))
  elif [[ ${delay} -lt 3600 ]]; then
    delay_60_min=$((${delay_60_min}+${line[0]}))
  else
    delay_rest=$((${delay_rest}+${line[0]}))
  fi

done <<< "$(tail -c +$((bytes_read+1)) "${my_log}" | head -c $((current_size-bytes_read)) | grep -Po "(?<=timestamp\":\")(\d{4}-\d{2}-\d{2}T\d{2}:\d{2}:\d{2})(?=\.)" | sort | uniq -c | sort -k1nr)"

echo "delay_1_min=${delay_1_min}
delay_5_min=${delay_5_min}
delay_10_min=${delay_10_min}
delay_30_min=${delay_30_min}
delay_45_min=${delay_45_min}
delay_60_min=${delay_60_min}
delay_rest=${delay_rest}"


rm -f "${me_running}"

exit 0

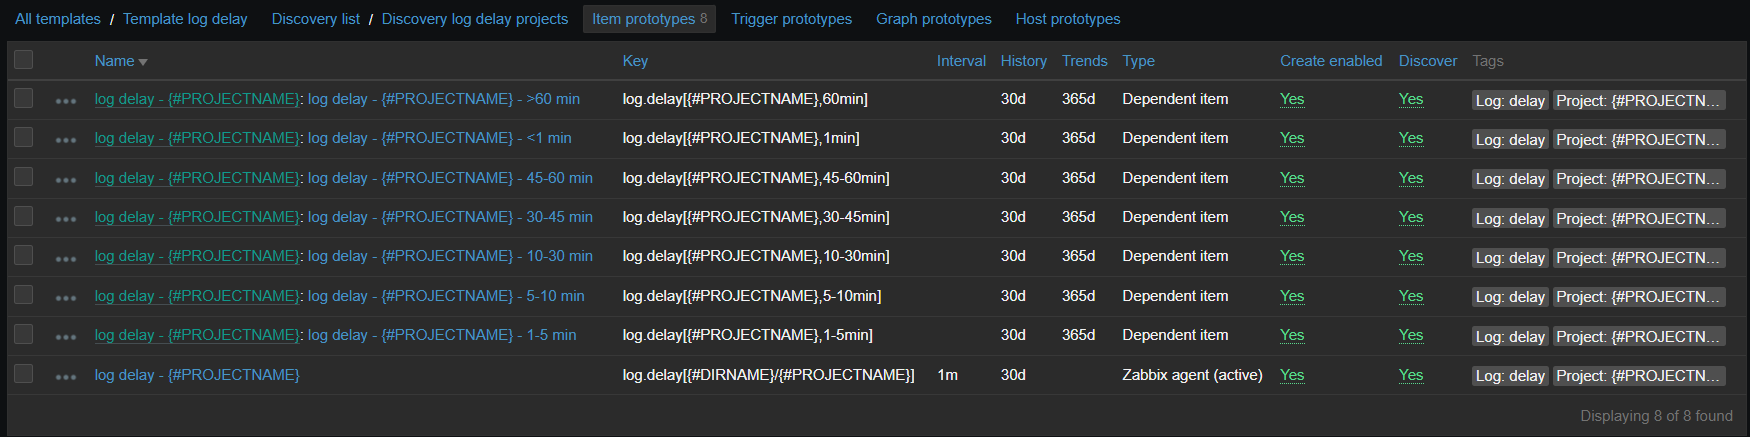
Now on Zabbix side, there is an item running this script and 7 dependent items, representing the degree of delay. Since there are many logs for which this data is collected, it is all put into LLD based on contents of specific directory:

vfs.dir.get[/var/log/logs,".*log$",,,,,1000]

This LLD then provides two macros:

And item prototypes will look like:

Those dependent items have one simple preprocessing step which takes needed number out of the script output:

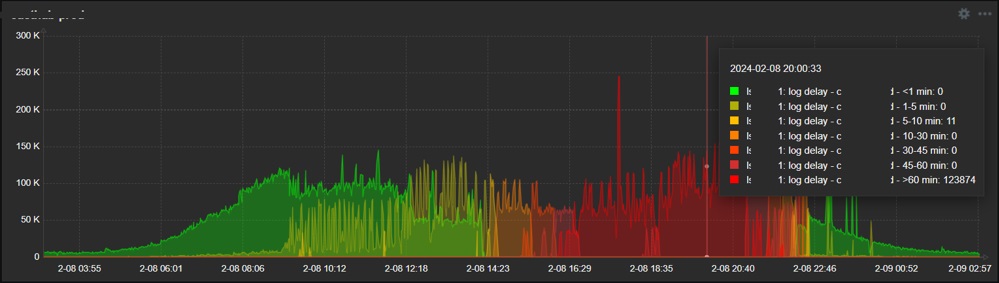
So the final result is the nice graph in dashboard, showing exactly when and what degree delays do appear:

So as you see, it is relatively easy to collect just about any data you wish, once you know how. As you can see from these examples, it might be something more complex but it can also be just a simple one-liner – in any case it should be obvious that possibilities are endless when talking about scripts in data collection. If something is executable from the CLI and has a valuable output, go ahead and collect it!

Zabbix internals

Another area where scripts can be really useful is adjusting how Zabbix behaves or controlling this behavior automatically. And in this case, we will employ Zabbix API, since it’s designed exactly for such or similar purposes.

Zabbix internals: automatically disabling problematic item

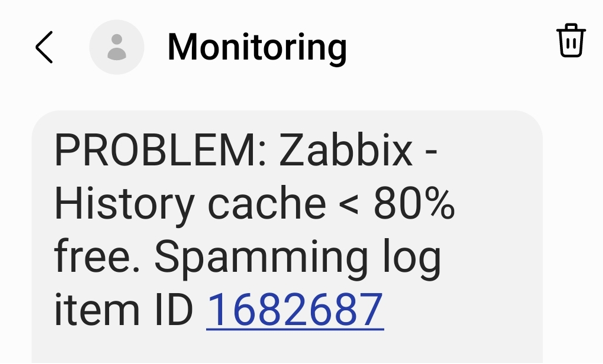
In our environment, we have many logs to be analyzed. And some of them sometimes go crazy – something that we intend to catch starts appearing there too often and requires attention – typically we would have to adjust the regexp, temporarily suppress some patterns and inform responsible teams about too extensive logging. If you don’t (or can’t) pay attention quick, it might kill Zabbix – history write cache starts filling up. So what we do is automatically detect such an item with most values received during some most recent short period of time and automatically disable it.

First of all there are two items – the one measuring history write cache and the other one extracting top item in the given table

[root@linux ~]# zabbix_agentd -t zabbix.db.max[history_log,30] 2>/dev/null
zabbix.db.max[history_log,30] [t|463 1997050]
[root@linux ~]#

First number here is values gathered during provided period, second one is item id. The script behind this item looks like this

[root@linux ~]# grep zabbix.db.max /etc/zabbix/zabbix_agentd.d/userparameter_mysql.conf
UserParameter=zabbix.db.max[*],HOME=/etc/zabbix mysql -BN -e "USE zabbix; SELECT count(*), itemid FROM $1 WHERE clock >= unix_timestamp(NOW() - INTERVAL $2 MINUTE) GROUP BY itemid ORDER BY count(*) DESC LIMIT 1;"
[root@linux ~]#

And now relying on the history write cache item values showing us drop, we construct a trigger:

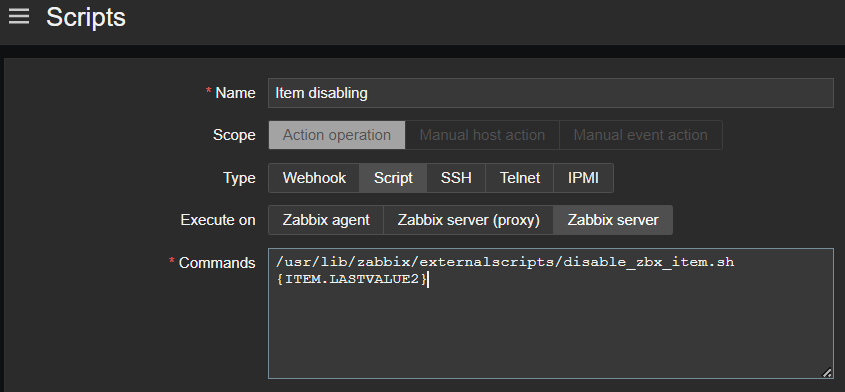
And as a last step, such trigger invokes action, which is running the script that disables the item with given ID with the help of Zabbix API, method “item.update”

Now we are able to avoid unexpected behavior of our data sources affecting Zabbix performance, all done automatically – thanks to the scripts!

Zabbix internals: add host to group via frontend scripts

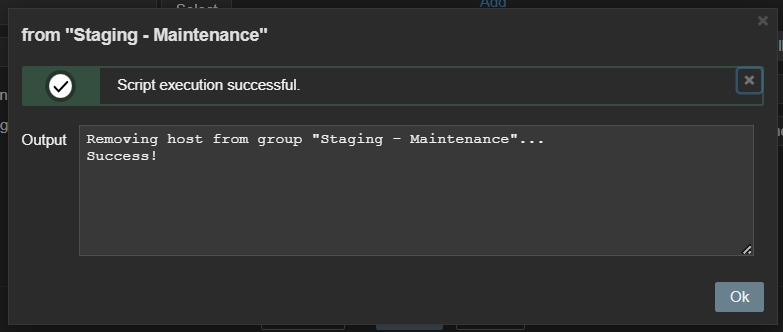
Zabbix maintenance mode is a great feature allowing us to reduce noise or avoid some false positive alerts once specific host is known to have issues. At some point we found it would be convenient to be able to add (or remove) specific host into (from) maintenance directly from “Problems” window. And that is possible and achieved via a frontend script, again with the help of Zabbix API, this time methods “host.get”, “hostgroup.get”, “hostgroup.massadd” and “hostgroup.massremove”

Data visualization

Zabbix has many different widgets that are able to cover various different ways of displaying your collected data. But in some cases, you might find yourself missing some small type of “something” which would allow your dashboards to shine even more – at least I constantly face it. Starting From version 6.4 Zabbix allows you to create your own widgets but it might be not such a straightforward procedure if you have little or no programming experience. However, you can employ two already existing widgets in order to customize your dashboard look in pretty easy way.

Data visualization: URL widget

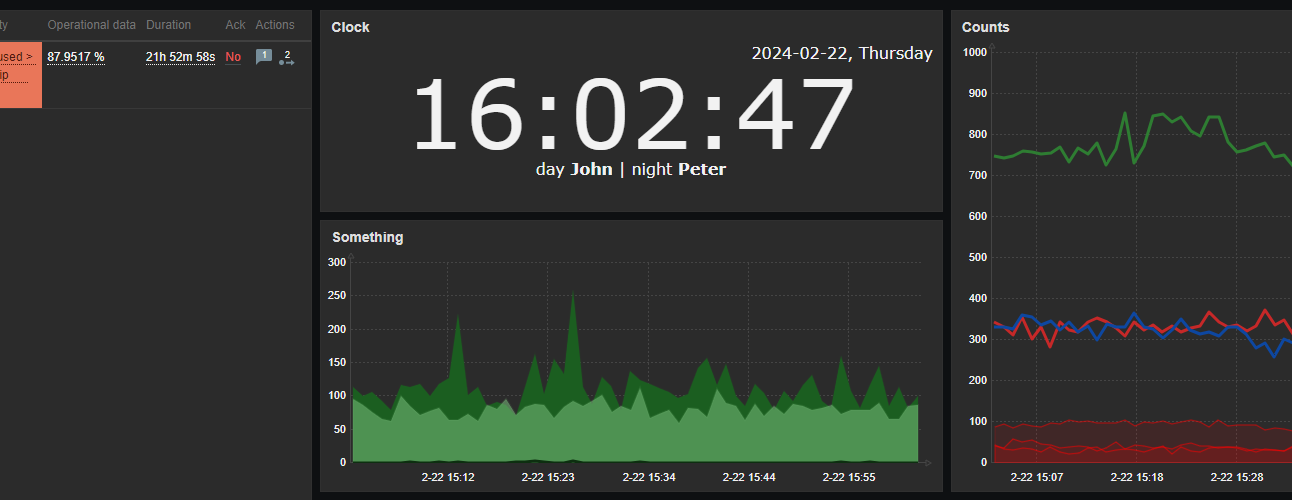
First one example is done using the URL widget. You might feed just about any content there, so if you have any web development skills, you can easily create something which would look like custom widget. Here is an example. I need a clock but not the one already provided by Zabbix as a separate clock widget – I want to have a digital clock and I also want this clock to have a section, which would display the employee on duty now and in an upcoming shift. So with a little bit of HTML, CSS and JavaScript / AJAX, I have this

With styles properly chosen, such content can be smoothly integrated into dashboards, along with other widgets.

Data visualization: plain text widget with HTML formatting

Another useful widget which is often overlooked is the “Plain text” widget – in combination with the following parameters:

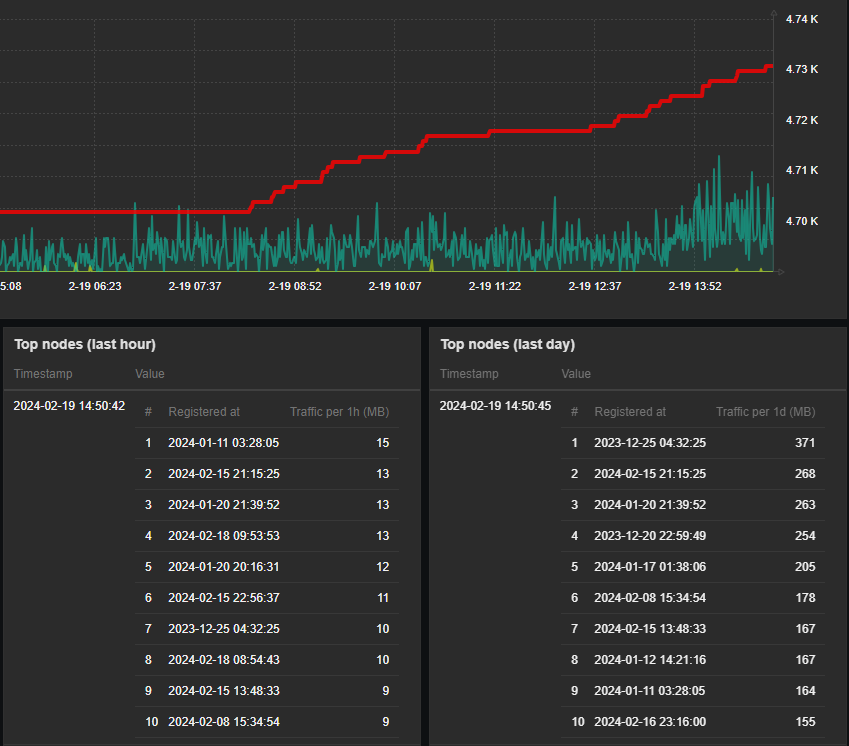
It becomes a very powerful tool to display nicely formatted data snapshots. Simple yet very good example here would be to display some content, which requires human readable structure – a table.

So again, integration with other dashboard widgets is so smooth – with just some custom HTML / CSS around your data you wrap it into something that looks like brand new “table” widget. Isn’t it awesome? And you are of course not limited to tables… Just use your imagination!

Conclusion

Although I personally prefer bash as the first option to solve things, there is no big difference regarding which scripting or programming languages to choose when extending Zabbix in these ways. Just try anything you feel most comfortable with.

I hope that examples shown here inspired you in some ways. Happy scripting!

The post Extending Zabbix: the power of scripting appeared first on Zabbix Blog.

След смъртта на Навални, руската опозиция се активира във въоръжена борба срещу Путин Легион за свободата на Русия действа и в България

Post Syndicated from Екип на Биволъ original https://bivol.bg/legion_freedom_russia.html

четвъртък 29 февруари 2024


Военизирана организация на руски граждани и етнически руснаци, живеещи в Украйна и в емиграция отправи свое послание към българската общественост. Структурата се нарича Легион за Свобода на Русия /Легион Свобода…

Да купуваме ли имот сега или да изчакаме?

Post Syndicated from VassilKendov original https://kendov.com/%D0%B4%D0%B0-%D0%BA%D1%83%D0%BF%D1%83%D0%B2%D0%B0%D0%BC%D0%B5-%D0%BB%D0%B8-%D0%B8%D0%BC%D0%BE%D1%82-%D1%81%D0%B5%D0%B3%D0%B0-%D0%B8%D0%BB%D0%B8-%D0%B4%D0%B0-%D0%B8%D0%B7%D1%87%D0%B0%D0%BA%D0%B0%D0%BC/

В кои случаи е обоснована покупката на недвижим имот в момента?

– При защита на спестяванията от инфлация
– Решаване на реален проблем с местообитанието
– При пране на средства с произход корупция или забранени дейности
– При доходи от собствен бизнес, поради очакване на свиване на кредитирането


Моля използвайте приложената форма за записване на час за среща
[contact-form-7]

The post Да купуваме ли имот сега или да изчакаме? appeared first on Kendov.com.

AMD EPYC Bergamo Has Massive Consolidation Benefits

Post Syndicated from Patrick Kennedy original https://www.servethehome.com/amd-epyc-bergamo-has-massive-consolidation-benefits-supermicro/

We show the massive consolidation with AMD EPYC Bergamo. An 8x GPU AI server can fit in the power and space saved with just 3 Bergamo servers

The post AMD EPYC Bergamo Has Massive Consolidation Benefits appeared first on ServeTheHome.

Top Architecture Blog Posts of 2023

Post Syndicated from Andrea Courtright original https://aws.amazon.com/blogs/architecture/top-architecture-blog-posts-of-2023/

2023 was a rollercoaster year in tech, and we at the AWS Architecture Blog feel so fortunate to have shared in the excitement. As we move into 2024 and all of the new technologies we could see, we want to take a moment to highlight the brightest stars from 2023.

As always, thanks to our readers and to the many talented and hardworking Solutions Architects and other contributors to our blog.

I give you our 2023 cream of the crop!

#10: Build a serverless retail solution for endless aisle on AWS

In this post, Sandeep and Shashank help retailers and their customers alike in this guided approach to finding inventory that doesn’t live on shelves.

Building endless aisle architecture for order processing

Figure 1. Building endless aisle architecture for order processing

Check it out!

#9: Optimizing data with automated intelligent document processing solutions

Who else dreads wading through large amounts of data in multiple formats? Just me? I didn’t think so. Using Amazon AI/ML and content-reading services, Deependra, Anirudha, Bhajandeep, and Senaka have created a solution that is scalable and cost-effective to help you extract the data you need and store it in a format that works for you.

AI-based intelligent document processing engine

Figure 2: AI-based intelligent document processing engine

Check it out!

#8: Disaster Recovery Solutions with AWS managed services, Part 3: Multi-Site Active/Passive

Disaster recovery posts are always popular, and this post by Brent and Dhruv is no exception. Their creative approach in part 3 of this series is most helpful for customers who have business-critical workloads with higher availability requirements.

Warm standby with managed services

Figure 3. Warm standby with managed services

Check it out!

#7: Simulating Kubernetes-workload AZ failures with AWS Fault Injection Simulator

Continuing with the theme of “when bad things happen,” we have Siva, Elamaran, and Re’s post about preparing for workload failures. If resiliency is a concern (and it really should be), the secret is test, test, TEST.

Architecture flow for Microservices to simulate a realistic failure scenario

Figure 4. Architecture flow for Microservices to simulate a realistic failure scenario

Check it out!

#6: Let’s Architect! Designing event-driven architectures

Luca, Laura, Vittorio, and Zamira weren’t content with their four top-10 spots last year – they’re back with some things you definitely need to know about event-driven architectures.

Let's Architect

Figure 5. Let’s Architect artwork

Check it out!

#5: Use a reusable ETL framework in your AWS lake house architecture

As your lake house increases in size and complexity, you could find yourself facing maintenance challenges, and Ashutosh and Prantik have a solution: frameworks! The reusable ETL template with AWS Glue templates might just save you a headache or three.

Reusable ETL framework architecture

Figure 6. Reusable ETL framework architecture

Check it out!

#4: Invoking asynchronous external APIs with AWS Step Functions

It’s possible that AWS’ menagerie of services doesn’t have everything you need to run your organization. (Possible, but not likely; we have a lot of amazing services.) If you are using third-party APIs, then Jorge, Hossam, and Shirisha’s architecture can help you maintain a secure, reliable, and cost-effective relationship among all involved.

Invoking Asynchronous External APIs architecture

Figure 7. Invoking Asynchronous External APIs architecture

Check it out!

#3: Announcing updates to the AWS Well-Architected Framework

The Well-Architected Framework continues to help AWS customers evaluate their architectures against its six pillars. They are constantly striving for improvement, and Haleh’s diligence in keeping us up to date has not gone unnoticed. Thank you, Haleh!

Well-Architected logo

Figure 8. Well-Architected logo

Check it out!

#2: Let’s Architect! Designing architectures for multi-tenancy

The practically award-winning Let’s Architect! series strikes again! This time, Luca, Laura, Vittorio, and Zamira were joined by Federica to discuss multi-tenancy and why that concept is so crucial for SaaS providers.

Let's Architect

Figure 9. Let’s Architect

Check it out!

And finally…

#1: Understand resiliency patterns and trade-offs to architect efficiently in the cloud

Haresh, Lewis, and Bonnie revamped this 2022 post into a masterpiece that completely stole our readers’ hearts and is among the top posts we’ve ever made!

Resilience patterns and trade-offs

Figure 10. Resilience patterns and trade-offs

Check it out!

Bonus! Three older special mentions

These three posts were published before 2023, but we think they deserve another round of applause because you, our readers, keep coming back to them.

Thanks again to everyone for their contributions during a wild year. We hope you’re looking forward to the rest of 2024 as much as we are!

Introducing Terraform support for Amazon OpenSearch Ingestion

Post Syndicated from Rahul Sharma original https://aws.amazon.com/blogs/big-data/introducing-terraform-support-for-amazon-opensearch-ingestion/

Today, we are launching Terraform support for Amazon OpenSearch Ingestion. Terraform is an infrastructure as code (IaC) tool that helps you build, deploy, and manage cloud resources efficiently. OpenSearch Ingestion is a fully managed, serverless data collector that delivers real-time log, metric, and trace data to Amazon OpenSearch Service domains and Amazon OpenSearch Serverless collections. In this post, we explain how you can use Terraform to deploy OpenSearch Ingestion pipelines. As an example, we use an HTTP source as input and an Amazon OpenSearch Service domain (Index) as output.

Solution overview

The steps in this post deploy a publicly accessible OpenSearch Ingestion pipeline with Terraform, along with other supporting resources that are needed for the pipeline to ingest data into Amazon OpenSearch. We have implemented the Tutorial: Ingesting data into a domain using Amazon OpenSearch Ingestion, using Terraform.

We create the following resources with Terraform:

The pipeline that you create exposes an HTTP source as input and an Amazon OpenSearch sink to save batches of events.

Prerequisites

To follow the steps in this post, you need the following:

  • An active AWS account.
  • Terraform installed on your local machine. For more information, see Install Terraform.
  • The necessary IAM permissions required to create the AWS resources using Terraform.
  • awscurl for sending HTTPS requests through the command line with AWS Sigv4 authentication. For instructions on installing this tool, see the GitHub repo.

Create a directory

In Terraform, infrastructure is managed as code, called a project. A Terraform project contains various Terraform configuration files, such as main.tf, provider.tf, variables.tf, and output.df . Let’s create a directory on the server or machine that we can use to connect to AWS services using the AWS Command Line Interface (AWS CLI):

mkdir osis-pipeline-terraform-example

Change to the directory.

cd osis-pipeline-terraform-example

Create the Terraform configuration

Create a file to define the AWS resources.

touch main.tf

Enter the following configuration in main.tf and save your file:

terraform {
  required_providers {
    aws = {
      source  = "hashicorp/aws"
      version = "~> 5.36"
    }
  }

  required_version = ">= 1.2.0"
}

provider "aws" {
  region = "eu-central-1"
}

data "aws_region" "current" {}
data "aws_caller_identity" "current" {}
locals {
    account_id = data.aws_caller_identity.current.account_id
}

output "ingest_endpoint_url" {
  value = tolist(aws_osis_pipeline.example.ingest_endpoint_urls)[0]
}

resource "aws_iam_role" "example" {
  name = "exampleosisrole"
  assume_role_policy = jsonencode({
    Version = "2012-10-17"
    Statement = [
      {
        Action = "sts:AssumeRole"
        Effect = "Allow"
        Sid    = ""
        Principal = {
          Service = "osis-pipelines.amazonaws.com"
        }
      },
    ]
  })
}

resource "aws_opensearch_domain" "test" {
  domain_name           = "osi-example-domain"
  engine_version = "OpenSearch_2.7"
  cluster_config {
    instance_type = "r5.large.search"
  }
  encrypt_at_rest {
    enabled = true
  }
  domain_endpoint_options {
    enforce_https       = true
    tls_security_policy = "Policy-Min-TLS-1-2-2019-07"
  }
  node_to_node_encryption {
    enabled = true
  }
  ebs_options {
    ebs_enabled = true
    volume_size = 10
  }
 access_policies = <<EOF
{
  "Version": "2012-10-17",
  "Statement": [
    {
      "Effect": "Allow",
      "Principal": {
        "AWS": "${aws_iam_role.example.arn}"
      },
      "Action": "es:*"
    }
  ]
}

EOF

}

resource "aws_iam_policy" "example" {
  name = "osis_role_policy"
  description = "Policy for OSIS pipeline role"
  policy = jsonencode({
    Version = "2012-10-17",
    Statement = [
        {
          Action = ["es:DescribeDomain"]
          Effect = "Allow"
          Resource = "arn:aws:es:${data.aws_region.current.name}:${local.account_id}:domain/*"
        },
        {
          Action = ["es:ESHttp*"]
          Effect = "Allow"
          Resource = "arn:aws:es:${data.aws_region.current.name}:${local.account_id}:domain/osi-test-domain/*"
        }
    ]
})
}

resource "aws_iam_role_policy_attachment" "example" {
  role       = aws_iam_role.example.name
  policy_arn = aws_iam_policy.example.arn
}

resource "aws_cloudwatch_log_group" "example" {
  name = "/aws/vendedlogs/OpenSearchIngestion/example-pipeline"
  retention_in_days = 365
  tags = {
    Name = "AWS Blog OSIS Pipeline Example"
  }
}

resource "aws_osis_pipeline" "example" {
  pipeline_name               = "example-pipeline"
  pipeline_configuration_body = <<-EOT
            version: "2"
            example-pipeline:
              source:
                http:
                  path: "/test_ingestion_path"
              processor:
                - date:
                    from_time_received: true
                    destination: "@timestamp"
              sink:
                - opensearch:
                    hosts: ["https://${aws_opensearch_domain.test.endpoint}"]
                    index: "application_logs"
                    aws:
                      sts_role_arn: "${aws_iam_role.example.arn}"   
                      region: "${data.aws_region.current.name}"
        EOT
  max_units                   = 1
  min_units                   = 1
  log_publishing_options {
    is_logging_enabled = true
    cloudwatch_log_destination {
      log_group = aws_cloudwatch_log_group.example.name
    }
  }
  tags = {
    Name = "AWS Blog OSIS Pipeline Example"
  }
  }

Create the resources

Initialize the directory:

terraform init

Review the plan to see what resources will be created:

terraform plan

Apply the configuration and answer yes to run the plan:

terraform apply

The process might take around 7–10 minutes to complete.

Test the pipeline

After you create the resources, you should see the ingest_endpoint_url output displayed. Copy this value and export it in your environment variable:

export OSIS_PIPELINE_ENDPOINT_URL=<Replace with value copied>

Send a sample log with awscurl. Replace the profile with your appropriate AWS profile for credentials:

awscurl --service osis --region eu-central-1 -X POST -H "Content-Type: application/json" -d '[{"time":"2014-08-11T11:40:13+00:00","remote_addr":"122.226.223.69","status":"404","request":"GET http://www.k2proxy.com//hello.html HTTP/1.1","http_user_agent":"Mozilla/4.0 (compatible; WOW64; SLCC2;)"}]' https://$OSIS_PIPELINE_ENDPOINT_URL/test_ingestion_path

You should receive a 200 OK as a response.

To verify that the data was ingested in the OpenSearch Ingestion pipeline and saved in the OpenSearch, navigate to the OpenSearch and get its domain endpoint. Replace the <OPENSEARCH ENDPOINT URL> in the snippet given below and run it.

awscurl --service es --region eu-central-1 -X GET https://<OPENSEARCH ENDPOINT URL>/application_logs/_search | json_pp 

You should see the output as below:

Clean up

To destroy the resources you created, run the following command and answer yes when prompted:

terraform destroy

The process might take around 30–35 minutes to complete.

Conclusion

In this post, we showed how you can use Terraform to deploy OpenSearch Ingestion pipelines. AWS offers various resources for you to quickly start building pipelines using OpenSearch Ingestion and use Terraform to deploy them. You can use various built-in pipeline integrations to quickly ingest data from Amazon DynamoDB, Amazon Managed Streaming for Apache Kafka (Amazon MSK), Amazon Security Lake, Fluent Bit, and many more. The following OpenSearch Ingestion blueprints allow you to build data pipelines with minimal configuration changes and manage them with ease using Terraform. To learn more, check out the Terraform documentation for Amazon OpenSearch Ingestion.


About the Authors

Rahul Sharma is a Technical Account Manager at Amazon Web Services. He is passionate about the data technologies that help leverage data as a strategic asset and is based out of New York city, New York.

Farhan Angullia is a Cloud Application Architect at AWS Professional Services, based in Singapore. He primarily focuses on modern applications with microservice software patterns, and advocates for implementing robust CI/CD practices to optimize the software delivery lifecycle for customers. He enjoys contributing to the open source Terraform ecosystem in his spare time.

Arjun Nambiar is a Product Manager with Amazon OpenSearch Service. He focusses on ingestion technologies that enable ingesting data from a wide variety of sources into Amazon OpenSearch Service at scale. Arjun is interested in large scale distributed systems and cloud-native technologies and is based out of Seattle, Washington.

Muthu Pitchaimani is a Search Specialist with Amazon OpenSearch Service. He builds large-scale search applications and solutions. Muthu is interested in the topics of networking and security, and is based out of Austin, Texas.

The collective thoughts of the interwebz