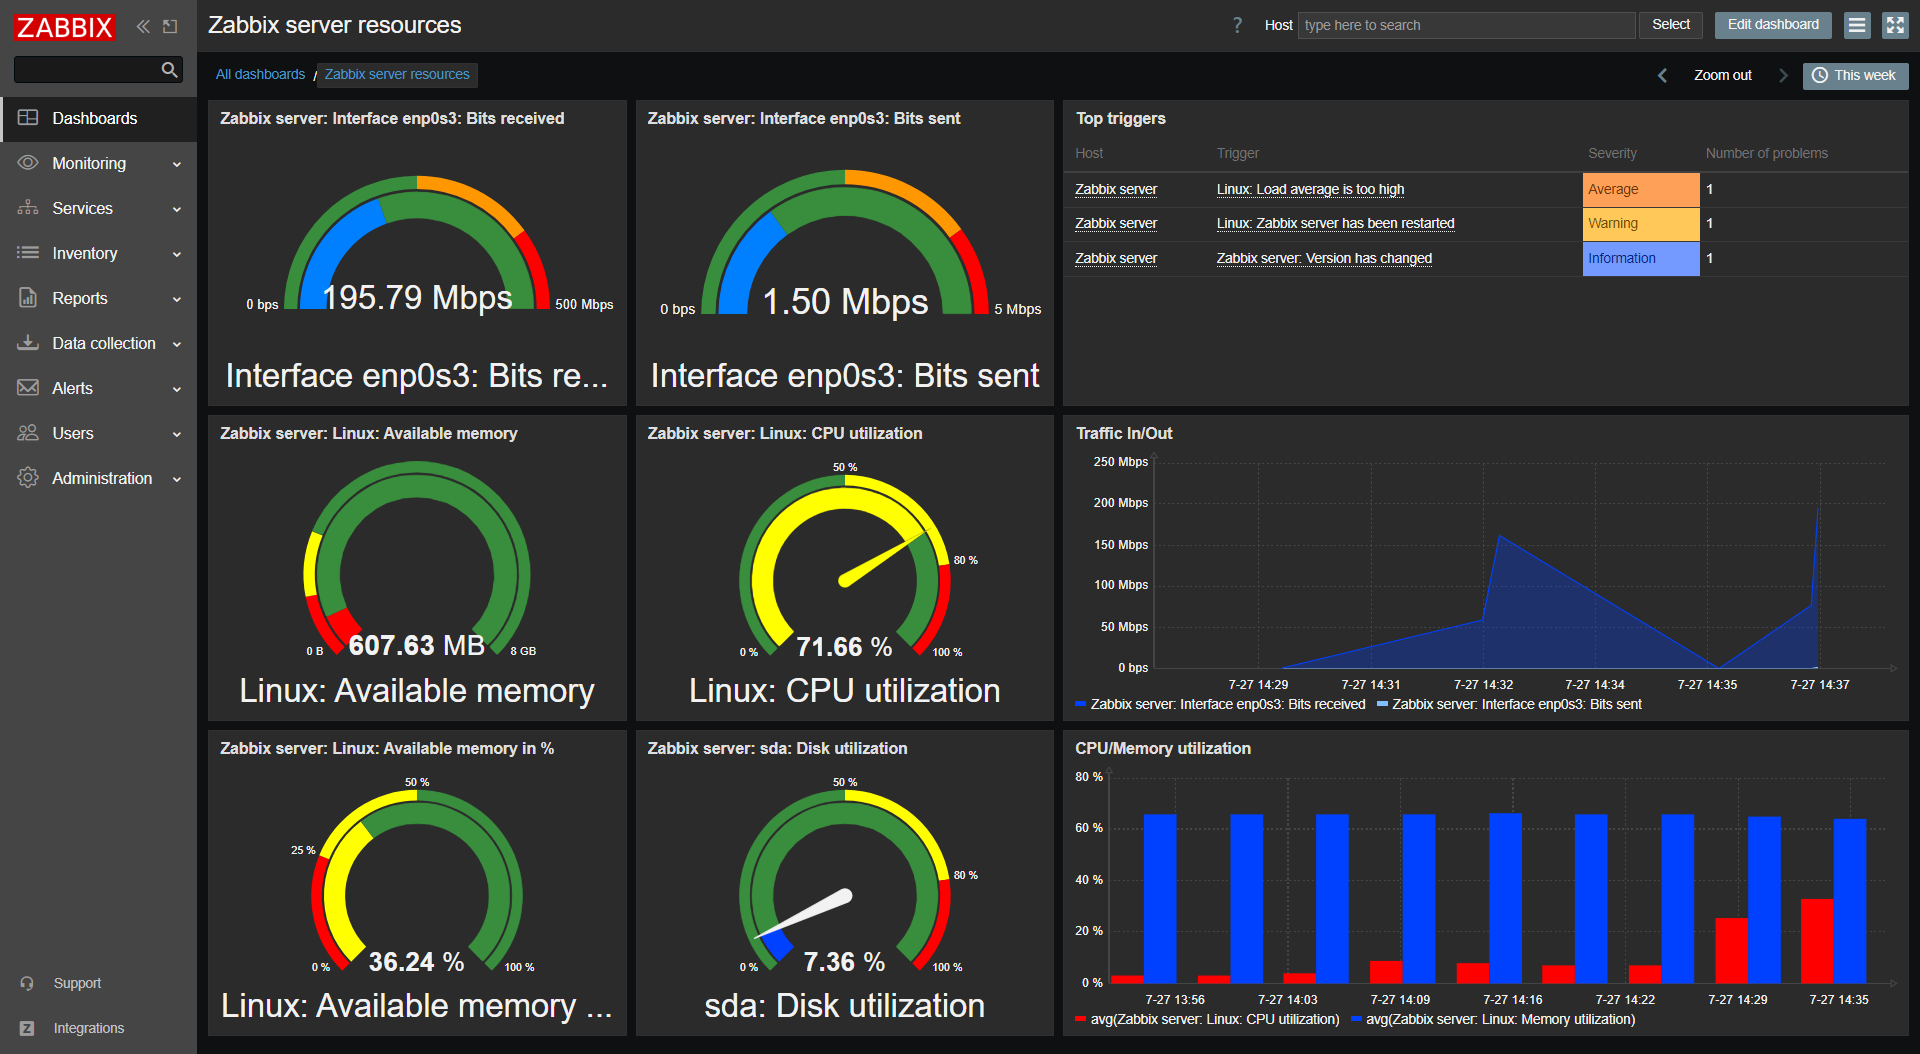
Post Syndicated from Janis Eidaks original https://blog.zabbix.com/deploying-zabbix-components-with-docker-and-docker-compose/30025/
Installing Zabbix from packages can feel overwhelming, due to the availability of different configuration options. The detailed and comprehensive documentation certainly helps to check the purpose of these multiple options, what values can be set in their fields, and if one is required for your planned deployment. There are quite a few official Zabbix blog posts about Zabbix in containers, and this post is aimed at showcasing how additional Zabbix components can be easily set up in a docker environment, along with docker run and docker compose examples.
For those who would prefer to use Zabbix in a containerized environment such as Docker, or who want to try out Zabbix quickly, this guide is for you (you can also check out the other Zabbix Docker blog posts). You can also mix and match Zabbix components installed from packages or built from source with those running in containers.
Please follow the official guide on how to set up the docker here.
To better understand the Zabbix architecture for those who are trying out Zabbix for the first time, I will give you an overview that should make it much easier to follow and understand Zabbix.
Zabbix consists of 3 main components (the bare minimum to get started):
- Zabbix Server – responsible for everything related to data collection, trigger evaluation, event generation, and alerting.
- Zabbix Frontend – responsible for the configuration (modifying or changing the configuration of the monitoring targets) and visualization (dashboards, graphs, tables, and widgets).
- Database – this is where the Zabbix configuration and monitoring history data are stored.
You can monitor your targets with the bare minimum setup; however, more comprehensive and complete monitoring can be achieved by using the C-based Zabbix-agent or GO-based Zabbix-agent2 in combination with templates, user parameters, and more. To set up the minimum necessary Zabbix components, you can use this example in the guide.
There are also official guides available on the Zabbix documentation page (for both: the docker run and docker compose) or the Docker/Github.
As of this writing , these official Zabbix docker components are available from the docker hub page:
- Zabbix Server (with MySQL/PostgreSQL database)
- Zabbix Proxy (with MySQL/SQLite3 database)
- Zabbix Frontend (Apache/Nginx with MySQL/PostgreSQL DB)
- Zabbix Agent (TLS encryption)
- Zabbix Agent2 (TLS encryption)
- Zabbix Java Gateway
- Zabbix SNMP traps
- Zabbix Web Service
Tags are used to select which OS container an image will be based on, as well as which Zabbix component version you wish to employ. If you only specify tag value – latest, you will get the latest Zabbix version based on the Alpine Linux. The images based on Linux Alpine are more lightweight than the other distros.
When something does not work as expected or fails, check the container error logs! This will be useful for debugging purposes and will help to narrow down the cause of an issue. Additionally, when debugging you can also specify additional options, such as specific lines of log, timestamp since or until, or following the log file content.
# docker logs --tail 50 container_name_or_id
    --details        Show extra details provided to logs
-f, --follow         Follow log output
    --since string   Show logs since timestamp (e.g. "2013-01-02T13:23:37Z") or relative (e.g. "42m" for 42 minutes)
-n, --tail string    Number of lines to show from the end of the logs (default "all")
-t, --timestamps     Show timestamps
    --until string   Show logs before a timestamp (e.g. "2013-01-02T13:23:37Z") or relative (e.g. "42m" for 42 minutes)
In some rare cases, when there is a container issue (everything else is correct, worked before, etc.), restarting the docker service can sometimes solve the issue.
So, what is different if you have only used Zabbix installed from packages? The examples below illustrate the differences in configuration options based on different Zabbix deployment methods: a) package-based/compiled installation, b) docker run command, and c) docker compose file example. First of all, you will have to specify environment variables in the docker run command or docker compose file. The list of available environment variables for each docker image is available in both docker hub and Github.
A). Package-based config
# vi /etc/zabbix/zabbix_server.conf
...
DBName=zabbix
DBUser=zabbix_usr
DBPassword=zabbix_pwd
...
B).Docker run config
docker run --name zbxsrv -t \
...
-e MYSQL_DATABASE=zabbix\
-e MYSQL_USER=zabbix_usr \
-e MYSQL_PASSWORD=zabbix_pwd\
...
C). Docker compose config
# vi /../...yaml
...
  environment:
   MYSQL_DATABASE=zabbix
   MYSQL_USER=zabbix_usr
   MYSQL_PASSWORD=zabbix_pwd
The environment variables are represented as key-value pairs, e.g., VAR=VAL. The values can optionally be unquoted or double-quoted. If some environment variable value contains special characters, you will need to escape them. To properly escape them, check out the docker documentation page.
You can create custom, user-defined networks to connect multiple containers to the same network. On such networks, containers can resolve each other by name or alias. If needed, you can assign a specific IP address to a container (if the address is already used, you will get an error).
# docker network create --subnet 172.20.0.0/16 --ip-range 172.20.240.0/20 zabbix-net
Docker run
In this section, we have an example of docker run commands for two Zabbix components: Zabbix proxy and Java gateway. When using custom, user-defined networks, you can use container names for communication between containers instead of using IP addresses. Here, instead of defining the IP address for Zabbix Java gateway, the container name is used. You can set a static IP address for your container or let docker do it for you, but confirm if the change of the IP address will not cause issues in case your container gets a different IP address. This can become an issue if you use an IP address in some configuration fields instead of a container name.
A lot of parameters are specified using environment variables with the option -e. Also, 3 different ports are exposed on your host machine. To keep the SQLite3 database file upon container deletion, the container directory containing database file is mounted to host directory (the proxy DB is usually used as a buffer storage before sending data to Zabbix server and usually is not used to store data beyond the moment when the data is sent).
docker run --name zabbix-proxy-active-01 \
-e ZBX_HOSTNAME="Zabbix-proxy-active-01" \
-e ZBX_SERVER_HOST=46.101.140.98 \
-e ZBX_PROXYMODE="0" \
-e ZBX_JAVAGATEWAY_ENABLE=true \
-e ZBX_JAVAGATEWAY=zabbix-java-gateway-proxy \
-e ZBX_JAVAGATEWAYPORT=10052 \
-e ZBX_STARTJAVAPOLLERS=5 \
--network=zabbix-net \
-e ZBX_LISTENPORT=10101  \
-p 10101:10101 \
-p 10050:10050 \
-p 10051:10051 \
-v /var/lib/zabbix/db_data:/var/lib/zabbix/db_data \
--restart unless-stopped \
--init -d zabbix/zabbix-proxy-sqlite3:alpine-7.2.4
docker run --name zabbix-java-gateway-proxy \
--network=zabbix-net \
--restart unless-stopped \
-d zabbix/zabbix-java-gateway:alpine-7.2.4
You can start each of these Zabbix components using the docker run command, however, any change to the container configuration will require you to stop the container, delete it, and execute the docker run command again. You also have another option – you could create a docker compose file and write the necessary configuration in yaml format. When you need to add some changes to the container configuration, run the docker compose down command to remove containers, edit the docker compose file, and run docker compose up command to start them up again with the new configuration:
- docker compose -f ./docker_compose_v3_proxy.yaml down
- docker compose -f ./docker_compose_v3_proxy.yaml up -d
If you have not mounted volume or directory to container for the data you want to keep, you can copy the data from the container to your host. Otherwise, that data will be gone if you delete the container or use the docker compose down command. So, it is important to set up the persistent storage/volume for the data that needs retaining, so you don’t lose important data from the container when container configuration is changed. You also need to expose the ports for the necessary services for the appropriate components (if they are set up on on separate hosts): zabbix-server, zabbix-proxy, zabbix-agent/zabbix-agent2 (default ports: 10050 for Zabbix agent passive mode, 10051 for Zabbix-agent active mode, some different port for proxy, 10052 for Java gateway).
Here we have the same docker run options written to docker compose file, including the environment variables, mounted directories and exposed ports. You can specify as many services as needed and start them just with docker compose command.
docker_compose_v3_proxy.yaml
services:
  zabbix-proxy-active-01:
    image: "${PROXY_SQLITE3_IMAGE}:${ALPINE_IMAGE_TAG}"
    environment:
      ZBX_HOSTNAME: Zabbix-proxy-active-01
      ZBX_SERVER_HOST: ${ZBX_SERVER_HOST}
      ZBX_PROXYMODE: 0
      ZBX_LISTENPORT: 10101
      ZBX_JAVAGATEWAY_ENABLE: true
      ZBX_JAVAGATEWAY: zabbix-java-gateway-proxy
      ZBX_JAVAGATEWAYPORT: 10052
      ZBX_STARTJAVAPOLLERS: 5
    volumes:
      - /var/lib/zabbix/db_data:/var/lib/zabbix/db_data:rw
    networks:
      - backend
    ports:
      - 10101:10101
      - 10050:10050
      - 10051:10051
    restart: unless-stopped

  zabbix-java-gateway-proxy:
    image: "${JAVA_GW_IMAGE}:${ALPINE_IMAGE_TAG}"
    networks:
      - backend
    restart: unless-stopped

networks:
  backend:
    name: zabbix-net
    external: true
.env
PROXY_SQLITE3_IMAGE=zabbix/zabbix-proxy-sqlite3
JAVA_GW_IMAGE = zabbix/zabbix-java-gateway
ALPINE_IMAGE_TAG=alpine-7.2.4
ZBX_SERVER_HOST=46.101.140.98
You can also use official Zabbix-supplied docker compose files, try them out, and modify them as needed.
You can read more about the official docker compose files here.
Containerized Zabbix components allow us to use test different scenarios within the docker:
- Creating HA Zabbix-server nodes
- Creating multiple proxies
- Creating multiple agents
- Adding more Java gateways
- Creating multiple frontends
- Easily configure Browser monitoring
- Configure SNMP traps
- Easily make scheduled reports
Deploying multiple redundant Zabbix servers
To enable HA Zabbix server mode, modify both the Zabbix-server container and Zabbix-frontend container configuration environment variables.
For the HA Zabbix server mode, add 2 environment variables:
- ZBX_HANODENAME
- ZBX_NODEADDRESS
All of the containers are set with the user-defined network, therefore I will use the container name in the ZBX_HANODENAME option instead of the static address, as it will be resolved by docker. If you need to use a different listen port for the trapper, you need to define it using the environment variable ZBX_LISTENPORT. You can omit the port in variable ZBX_HANODENAME, as the ZBX_LISTENPORT (default is 10051) will be applied automatically.
Here is the docker run example for the Zabbix-server HA mode.
docker run --name zabbix-server-mysql-ha1 -t \
-e DB_SERVER_HOST="mysql-server" \
-e MYSQL_DATABASE="zabbix" \
-e MYSQL_USER="zabbix" \
-e MYSQL_PASSWORD="zabbix_pwd" \
-e MYSQL_ROOT_PASSWORD="root_pwd" \
-e ZBX_HANODENAME="zabbix-server-HA1" \
-e ZBX_NODEADDRESS="zabbix-server-mysql-ha1" \
--network=zabbix-net \
-p 10151:10051 \
--restart unless-stopped \
-d zabbix/zabbix-server-mysql:alpine-7.2.4
docker run --name zabbix-server-mysql-ha2 -t \
-e DB_SERVER_HOST="mysql-server" \
-e MYSQL_DATABASE="zabbix" \
-e MYSQL_USER="zabbix" \
-e MYSQL_PASSWORD="zabbix_pwd" \
-e MYSQL_ROOT_PASSWORD="root_pwd" \
-e ZBX_HANODENAME="zabbix-server-HA2" \
-e ZBX_NODEADDRESS="zabbix-server-mysql-ha2" \
--network=zabbix-net \
-p 10251:10051 \
--restart unless-stopped \
-d zabbix/zabbix-server-mysql:alpine-7.2.4
From the frontend container, remove these two environment variables:
- ZBX_SERVER_HOST
- ZBX_SERVER_PORT
docker run --name zabbix-web-nginx-mysql -t \
-e ZBX_SERVER_HOST="zabbix-server-mysql" \
-e ZBX_SERVER_PORT=10051
-e DB_SERVER_HOST="mysql-server" \
-e MYSQL_DATABASE="zabbix" \
-e MYSQL_USER="zabbix" \
-e MYSQL_PASSWORD="zabbix_pwd" \
-e MYSQL_ROOT_PASSWORD="root_pwd" \
--network=zabbix-net \
-p 80:8080 \
--restart unless-stopped \
-d zabbix/zabbix-web-nginx-mysql:alpine-7.2.4
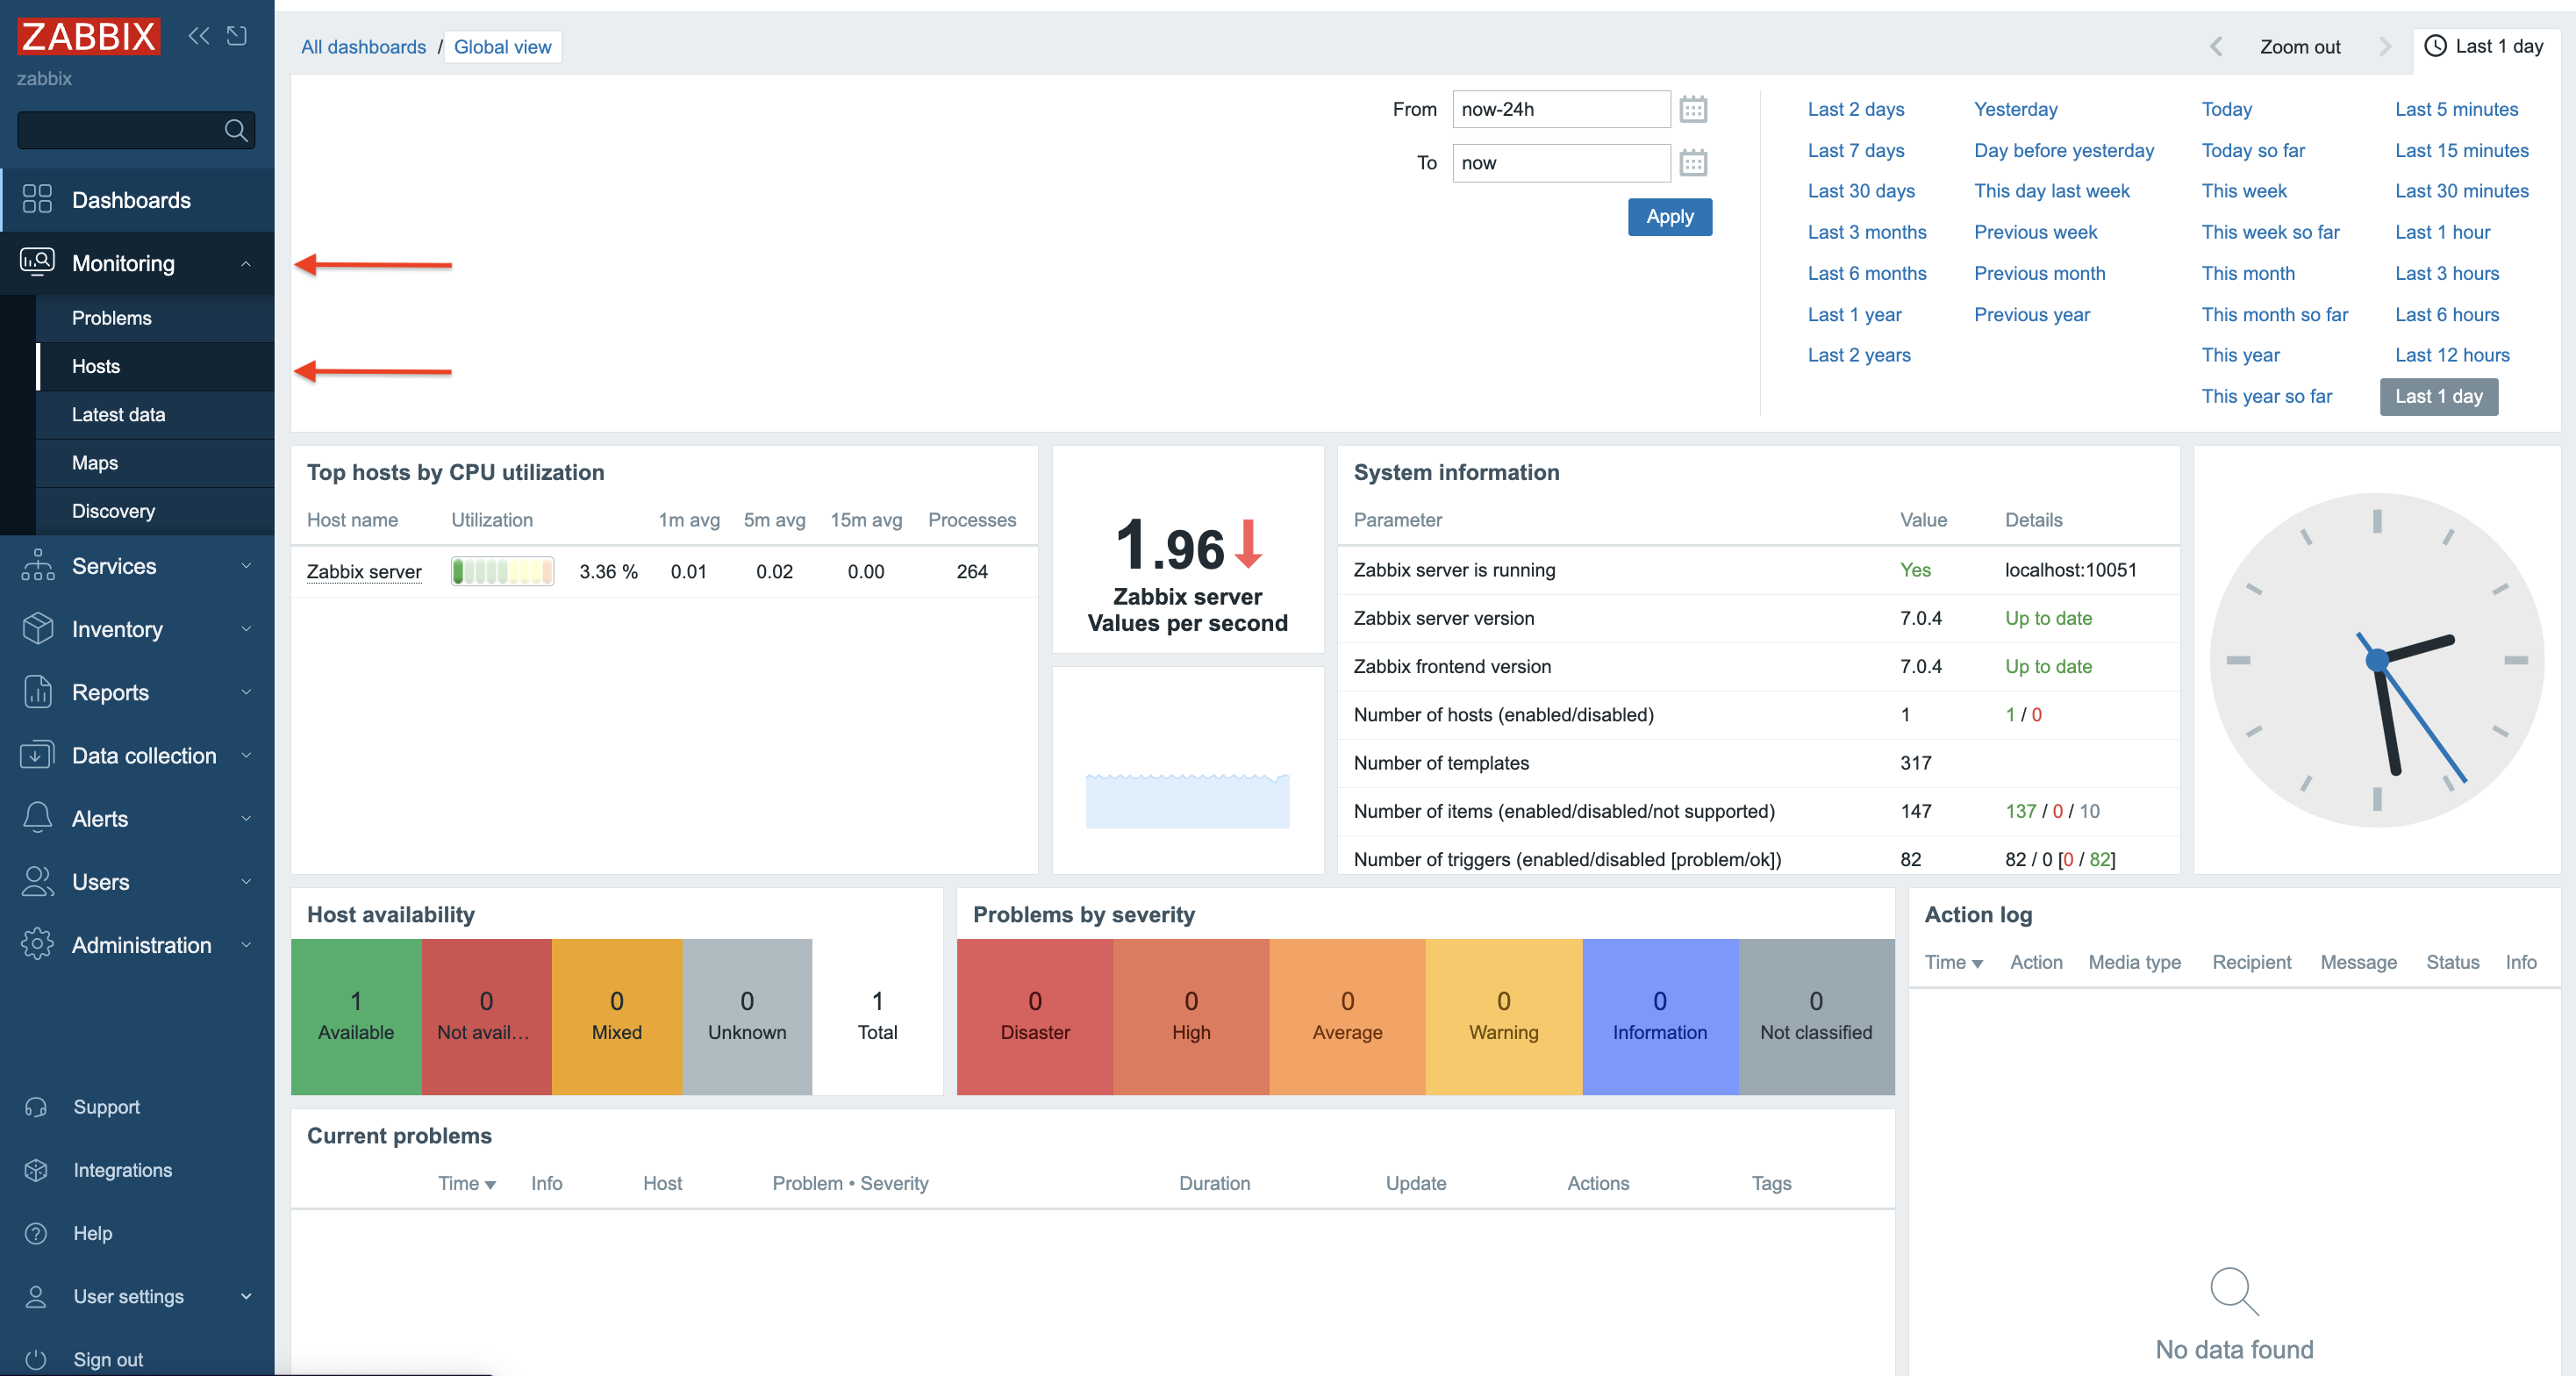
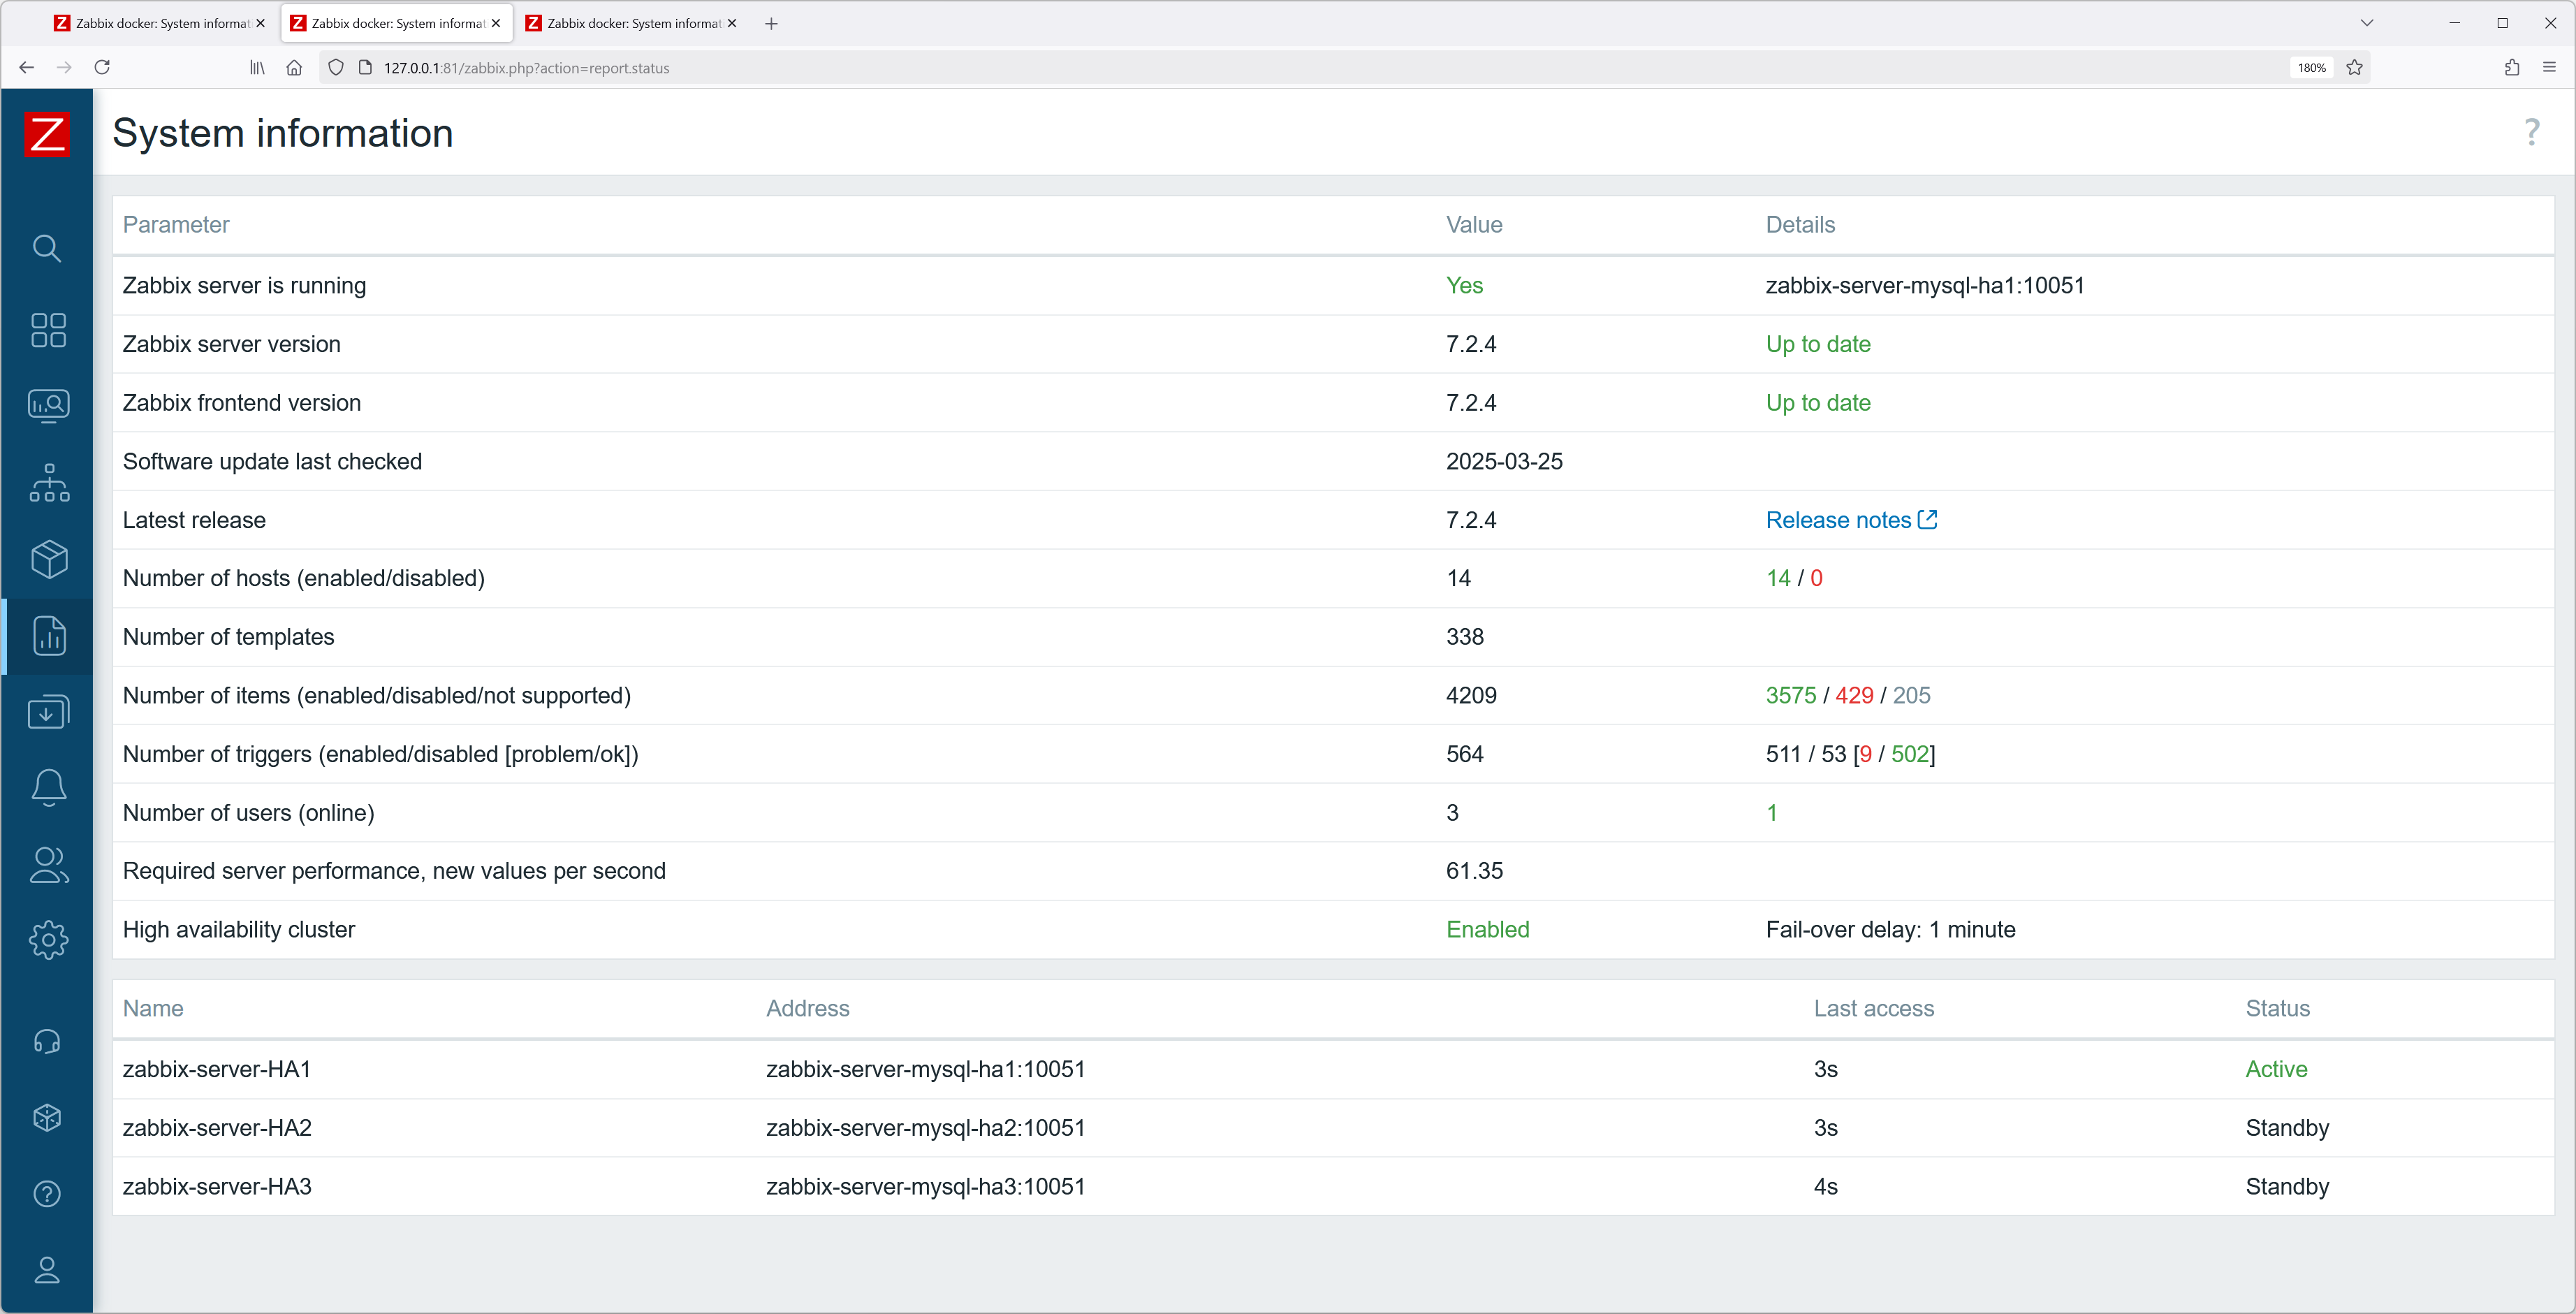
Once both container configurations are modified, you should be able to see the currently added HA server nodes and their states without issues.

Fig. 1. Containers of HA Zabbix server containers

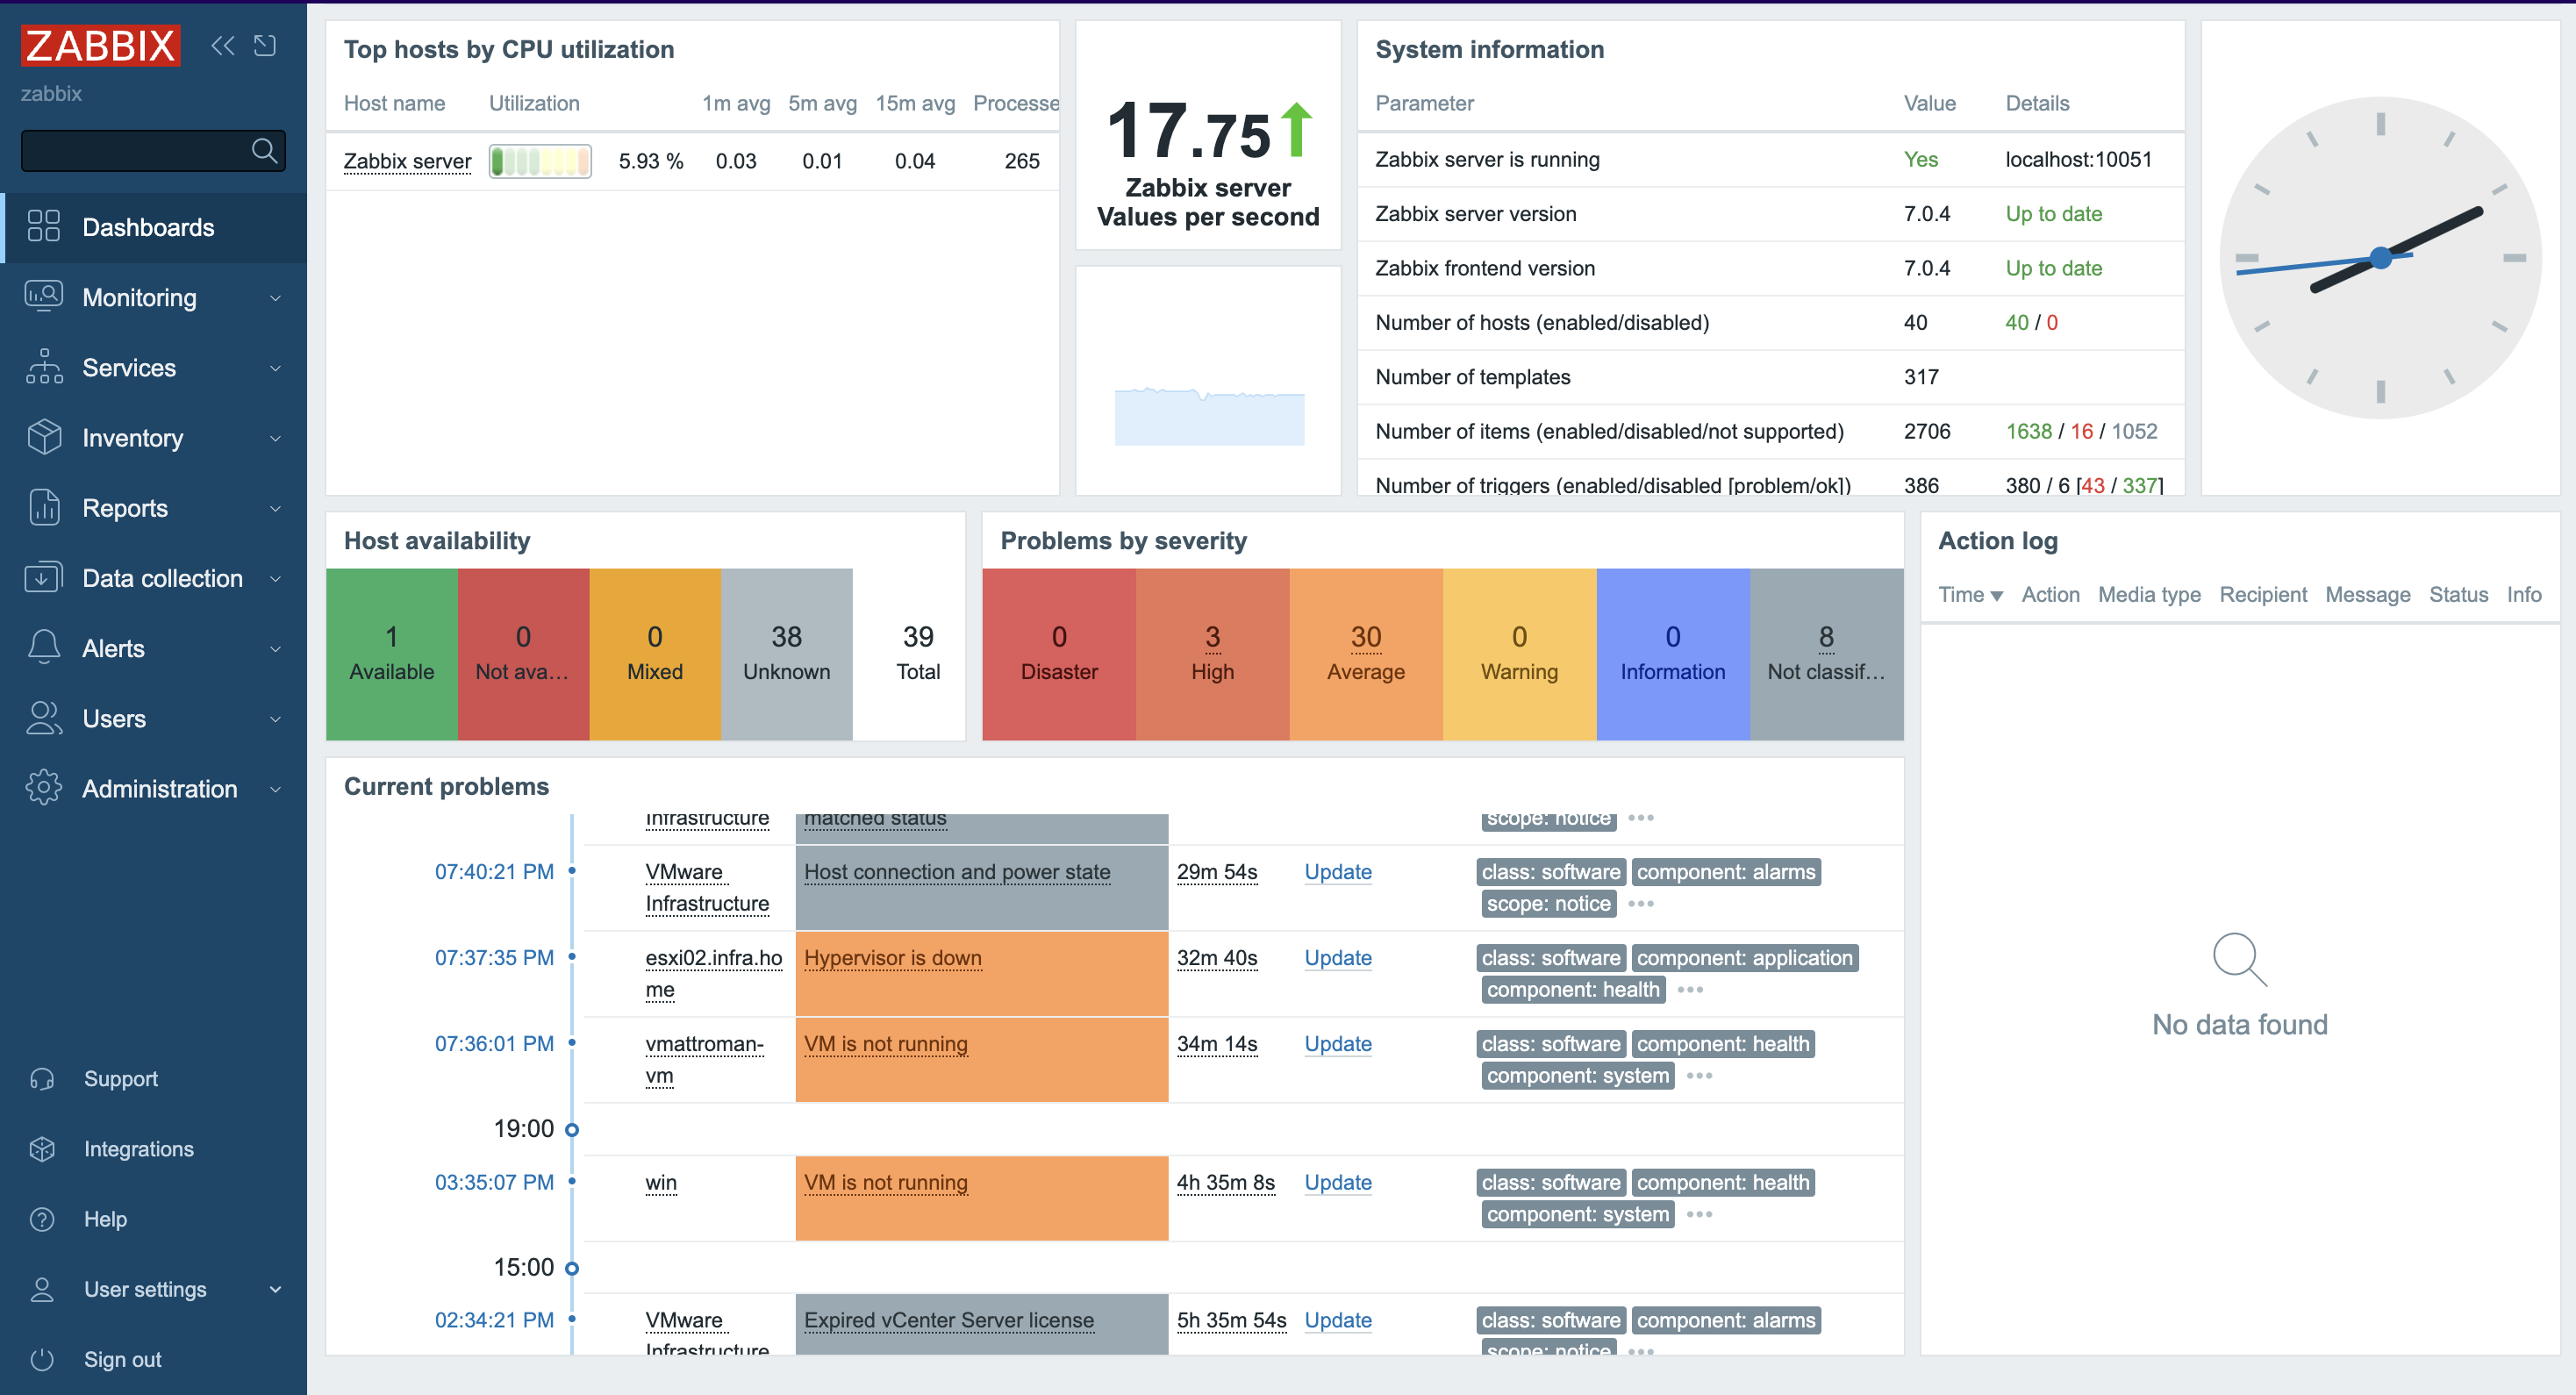
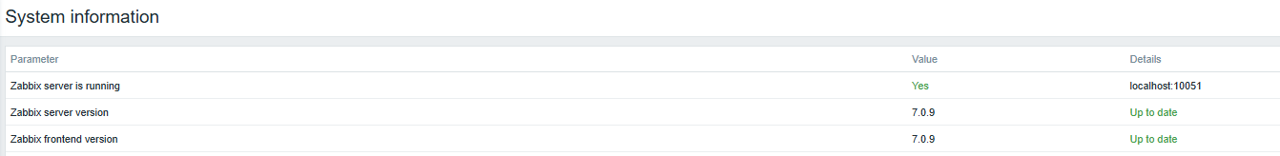
Fig. 2. Dashboard – system information
You can also execute commands on the container:
# docker exec -it container_name_or_id sh -c "zabbix_server -R ha_status"

Fig. 3. Executing command on container
Containers of HA Zabbix server containers
I’t’s possible to allocate an interactive pseudo-TTY shell, by adding option -ti and specifying shell after the container name or id.
# docker exec -ti container_name_or_id /bin/bash

Fig. 4. Executing command from within container
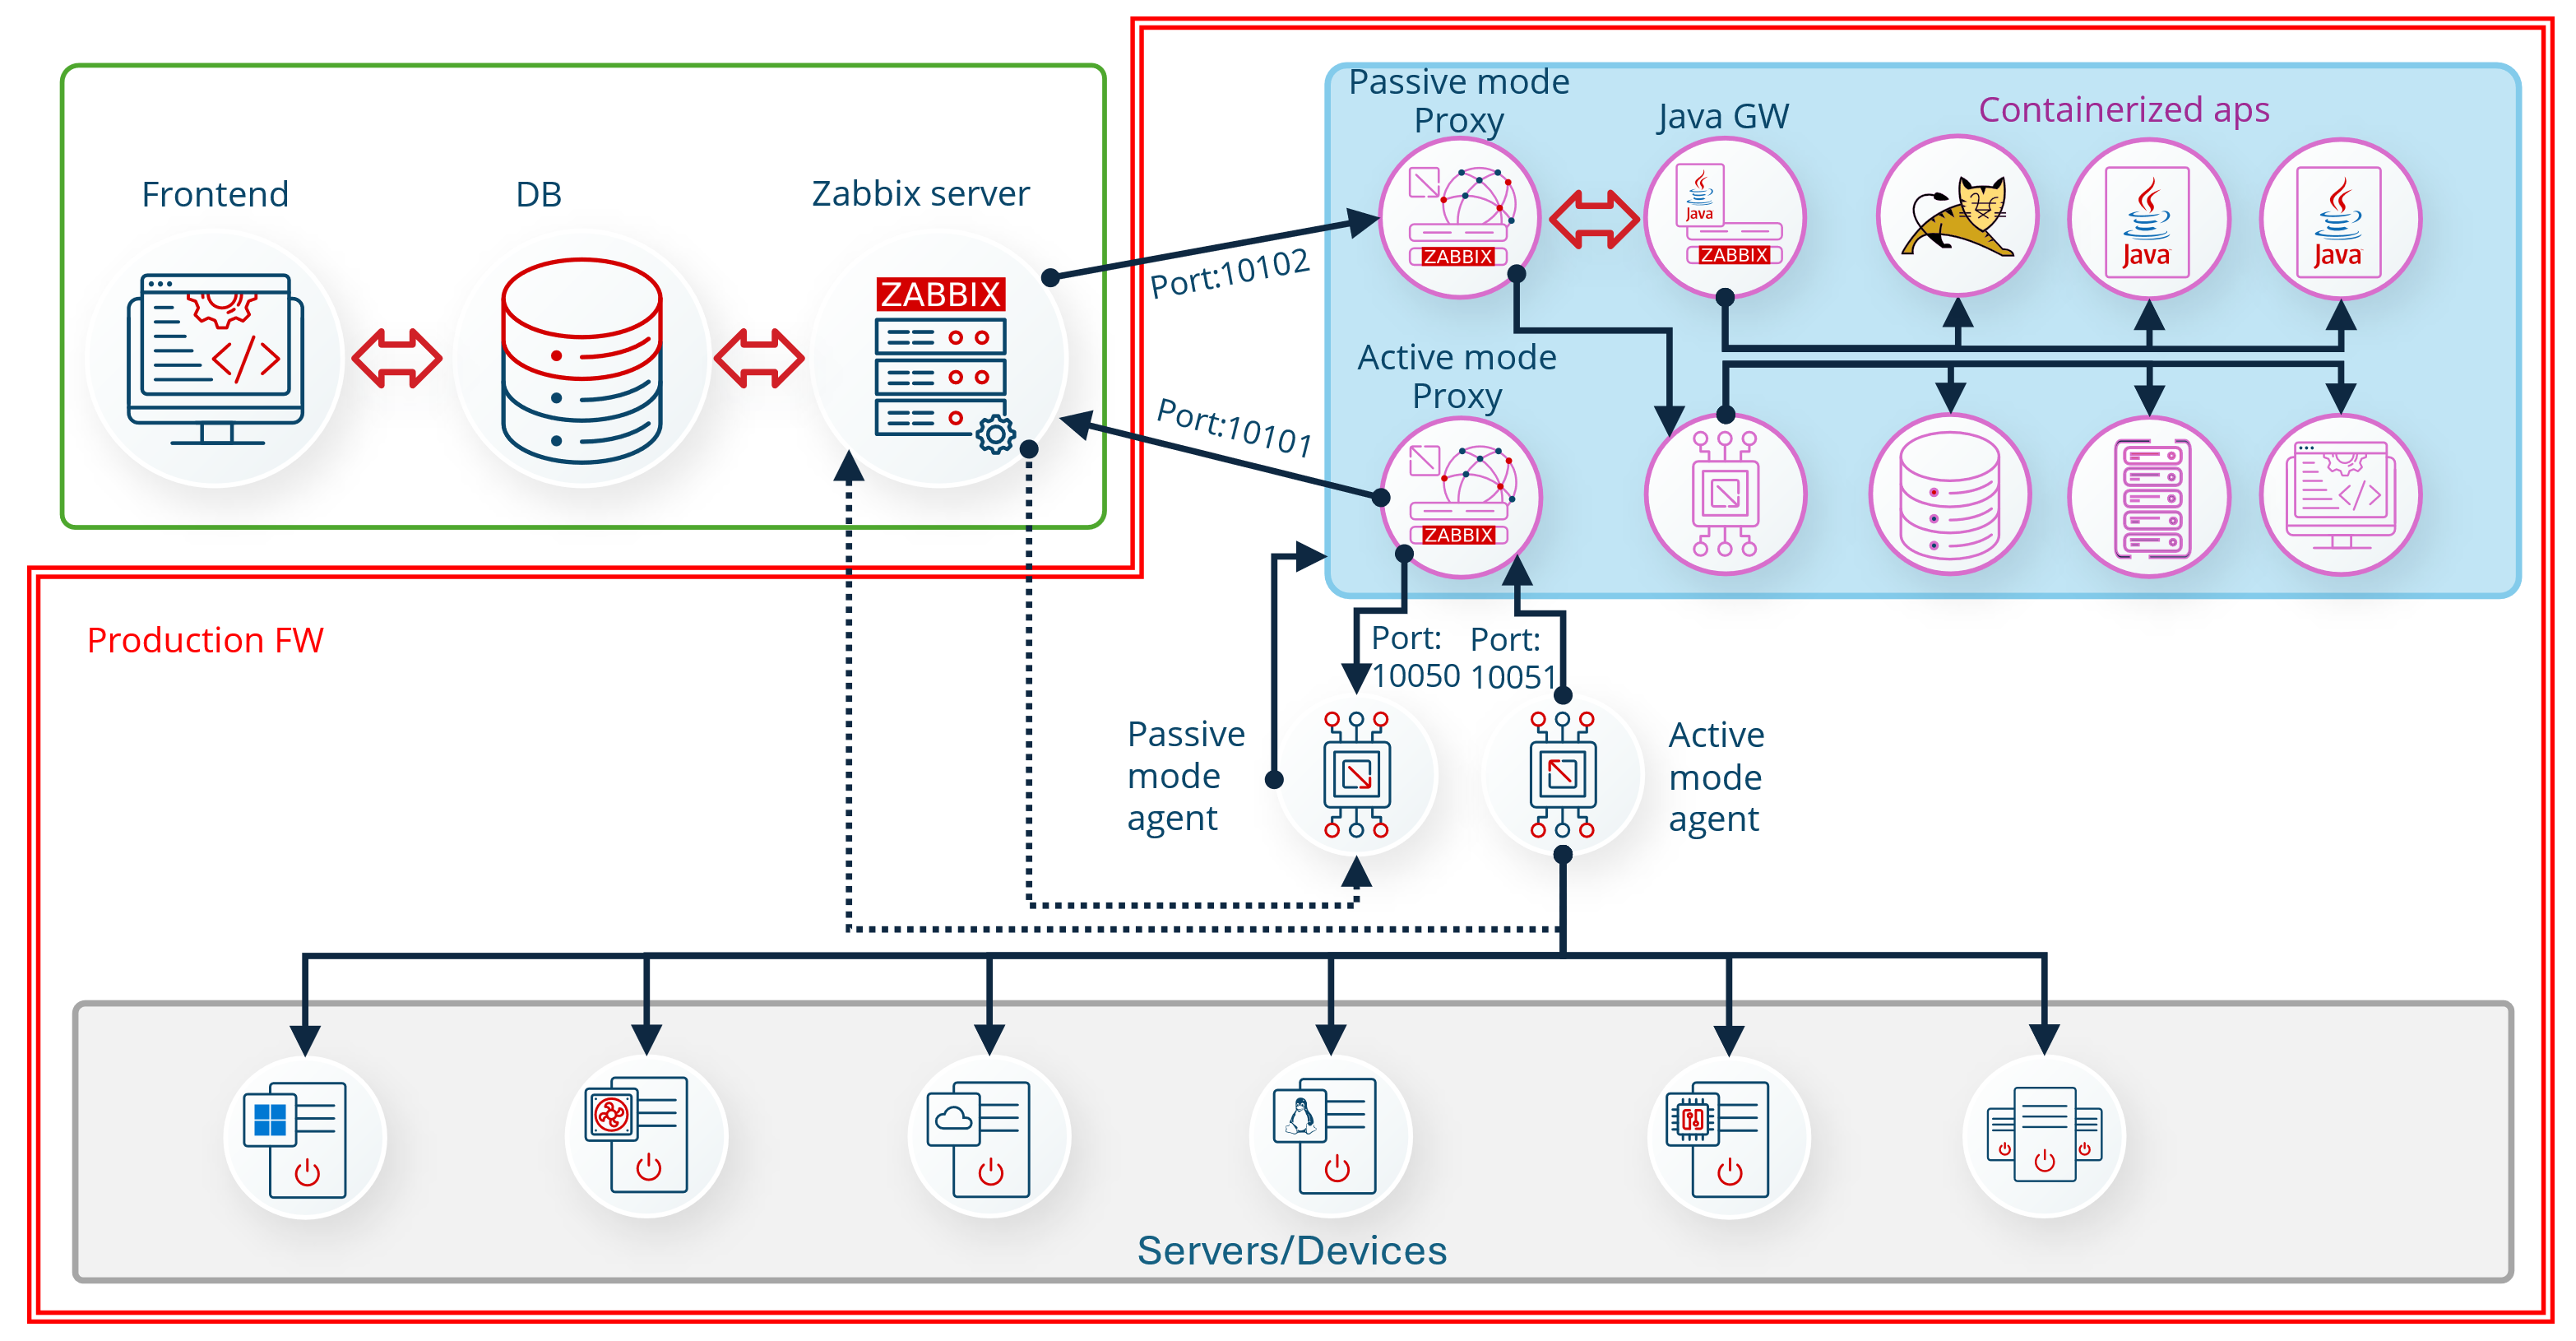
You can also start multiple proxies at once in docker. This can help to offload preprocessing to the proxy, gather data from the targets behind the firewall, and send collected data back to the Zabbix server, only requiring one port.

Fig. 5.Overall block diagram of Zabbix monitoring opportunities
Deploying multiple Zabbix proxies
First, you must choose the proxy mode and set the environment variable ZBX_PROXYMODE.
For active mode proxy, please define the server host address for a single server or addresses separated by a semicolon in the case of HA Zabbix server configuration (example shown below).
docker run --name zabbix-proxy-active-01 \
-e ZBX_HOSTNAME="Zabbix-proxy-active-01" \
-e ZBX_SERVER_HOST="zabbix-server-mysql-ha1;zabbix-server-mysql-ha2;zabbix-server-mysql-ha3" \
-e ZBX_PROXYMODE="0" \
--network=zabbix-net \
-e ZBX_LISTENPORT=10101  \
-p 10101:10101 \
-v /var/lib/zabbix/db_data:/var/lib/zabbix/db_data \
--restart unless-stopped \
--init -d zabbix/zabbix-proxy-sqlite3:alpine-7.2.4
For passive mode proxy, define the server host address for a single server or addresses separated by a comma in the case of HA Zabbix server configuration (example shown below).
docker run --name zabbix-proxy-passive-01 \
-e ZBX_HOSTNAME="Zabbix-proxy-passive-01" \
-e ZBX_SERVER_HOST="zabbix-server-mysql-ha1,zabbix-server-mysql-ha2,zabbix-server-mysql-ha3" \
-e ZBX_PROXYMODE="1" \
--network=zabbix-net \
-e ZBX_LISTENPORT=10102 \
-p 10102:10102 \
-v /var/lib/zabbix/db_data:/var/lib/zabbix/db_data \
--restart unless-stopped \
--init -d zabbix/zabbix-proxy-sqlite3:alpine-7.2.4
docker_compose_v3_proxies.yaml
services:
  zabbix-proxy-active-01:
    image: "${PROXY_SQLITE3_IMAGE}:${ALPINE_IMAGE_TAG}"
    environment:
      ZBX_HOSTNAME: zabbix-proxy-active-01
      ZBX_SERVER_HOST: zabbix-server-mysql-ha1;zabbix-server-mysql-ha2;zabbix-server-mysql-ha3
      ZBX_PROXYMODE: 0
      ZBX_LISTENPORT: 10101
    volumes:
      - /var/lib/zabbix/db_data:/var/lib/zabbix/db_data:rw
    networks:
      - backend
    ports:
      - 10101:10101
    restart: unless-stopped

  zabbix-proxy-passive-01:
    image: "${PROXY_SQLITE3_IMAGE}:${ALPINE_IMAGE_TAG}"
    environment:
      ZBX_HOSTNAME: zabbix-proxy-passive-01
      ZBX_SERVER_HOST: zabbix-server-mysql-ha1,zabbix-server-mysql-ha2,zabbix-server-mysql-ha3
      ZBX_PROXYMODE: 1
      ZBX_LISTENPORT: 10102
    volumes:
      - /var/lib/zabbix/db_data:/var/lib/zabbix/db_data:rw
    networks:
      - backend
    ports:
      - 10102:10102
    restart: unless-stopped
networks:
  backend:
    name: zabbix-net
    external: true
.env
PROXY_SQLITE3_IMAGE=zabbix/zabbix-proxy-sqlite3
JAVA_GW_IMAGE = zabbix/zabbix-java-gateway
ALPINE_IMAGE_TAG=alpine-7.2.4
ZBX_SERVER_HOST=46.101.140.98
The proxy name in the frontend must be the same as the value set in proxy environment variable ZBX_HOSTNAME! Also, in frontend for active proxies, you don’t need to add the proxy address.
Next, you can set hosts to be monitored by Zabbix-proxies, but make sure to update the agent configuration, so agents accept connections from proxy.

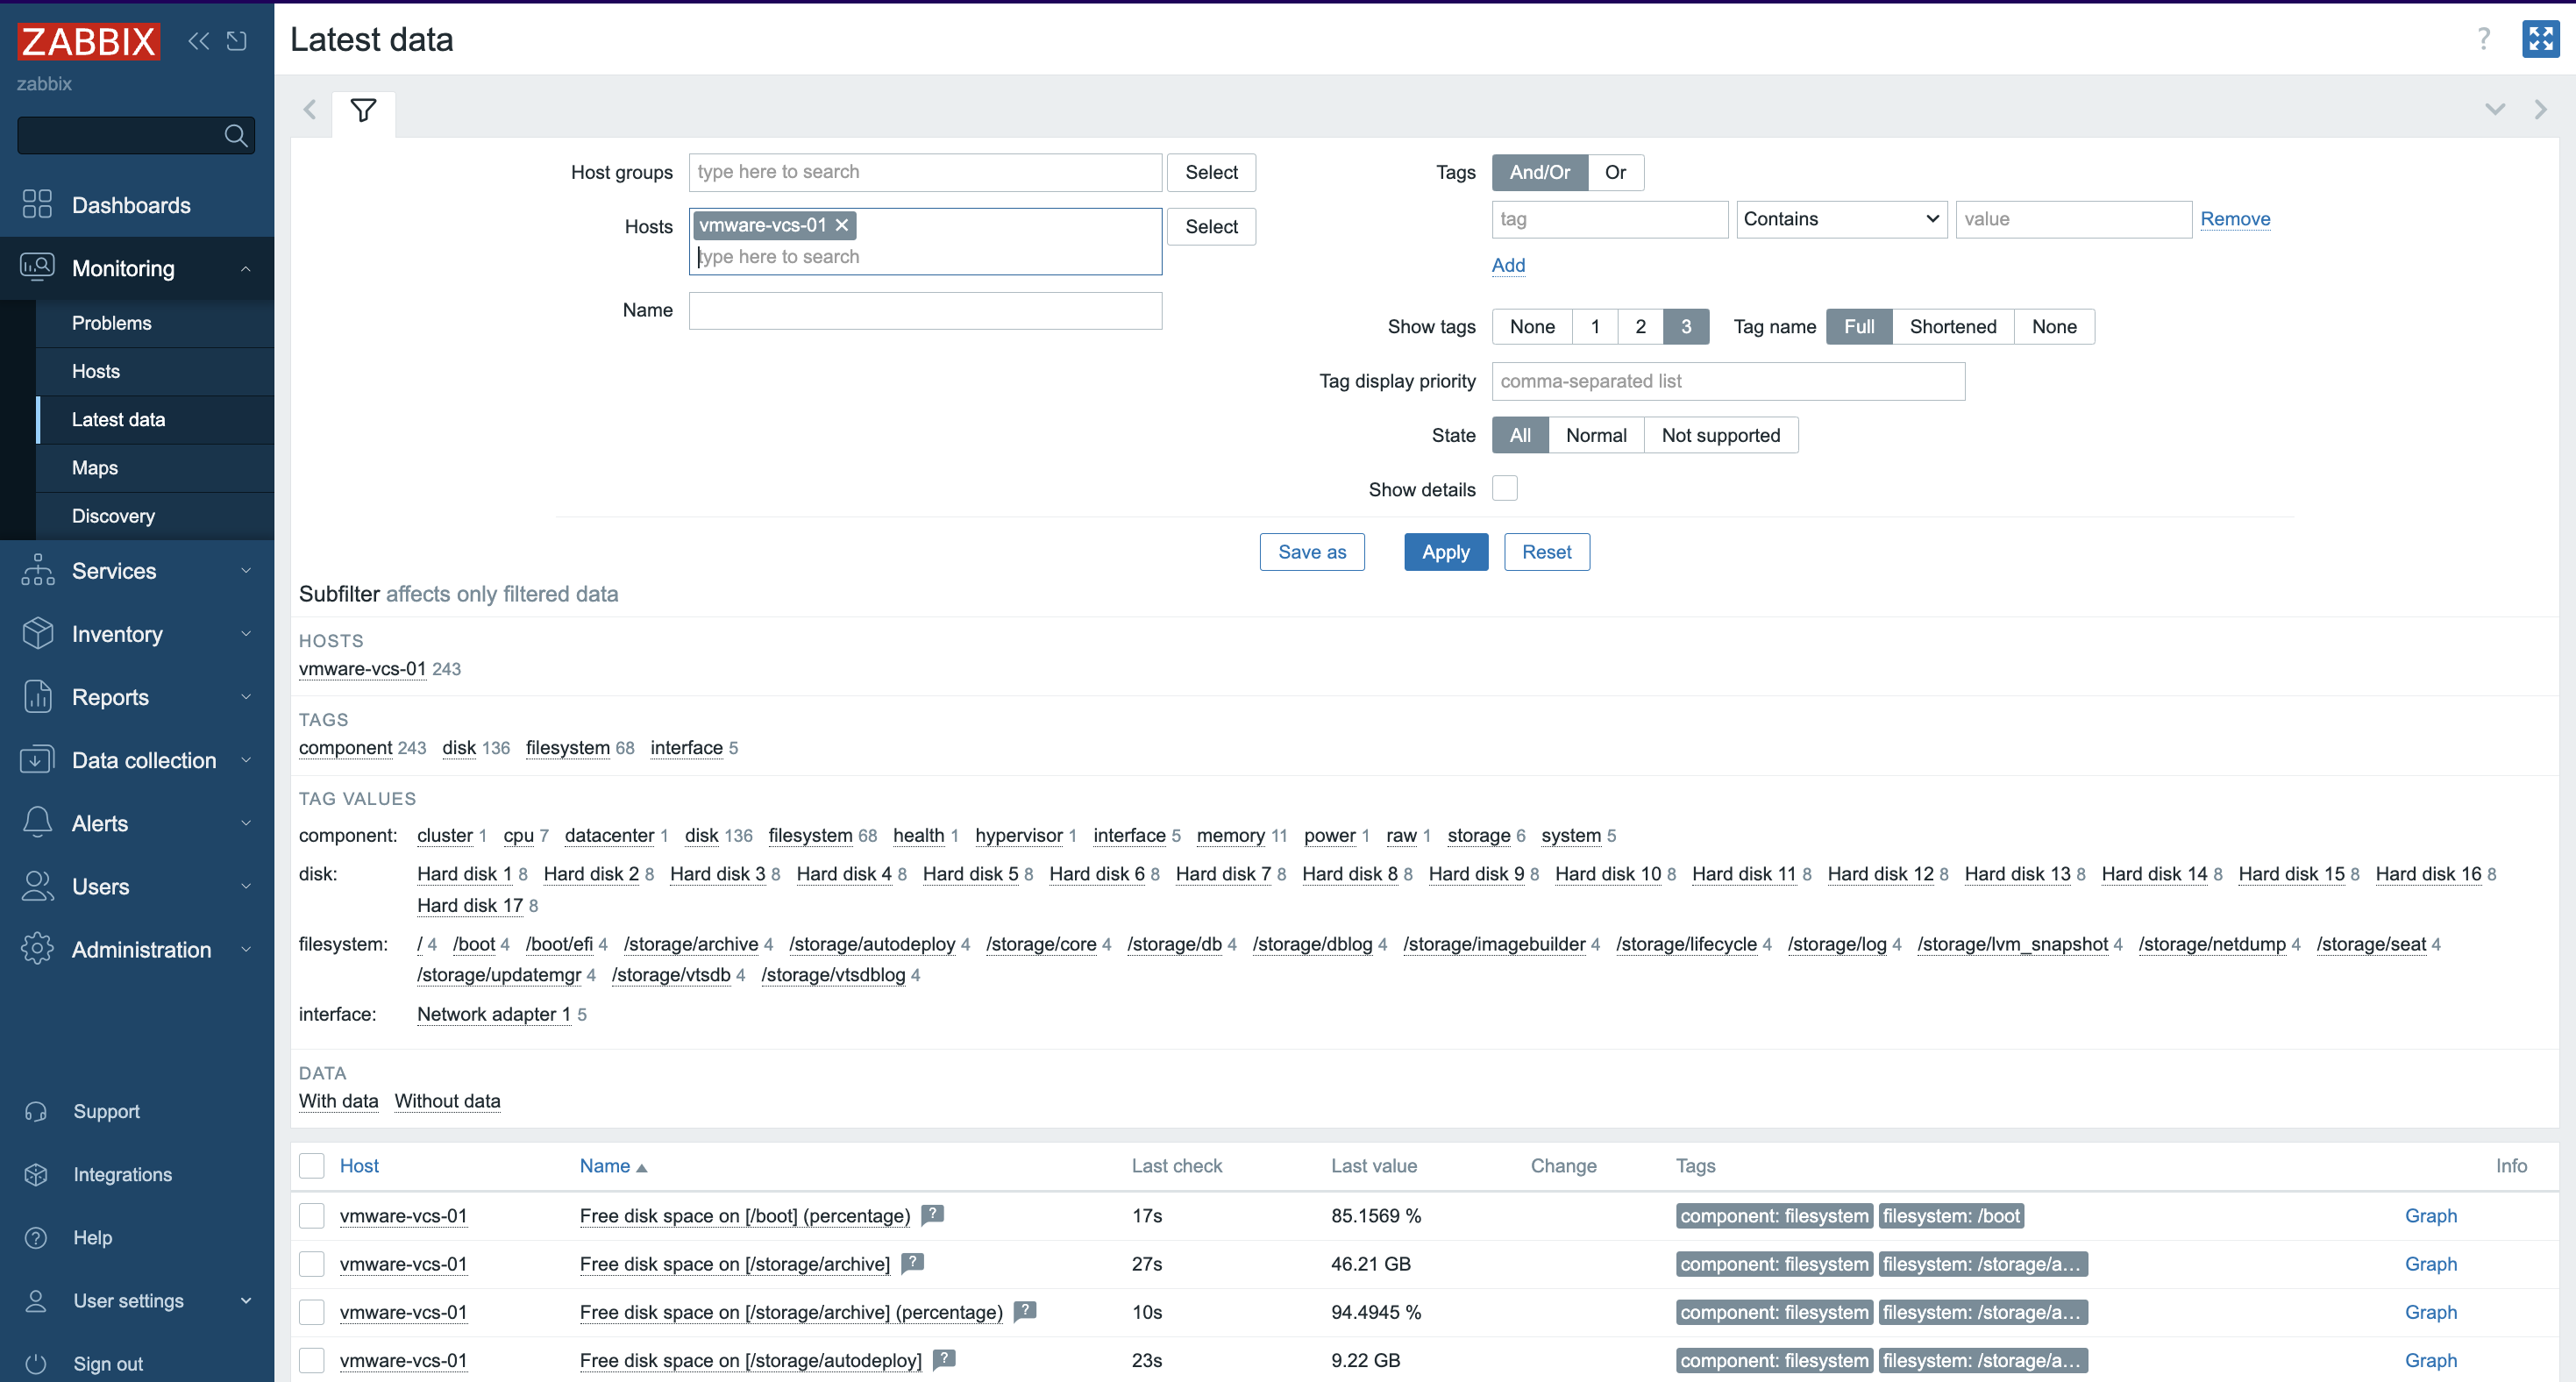
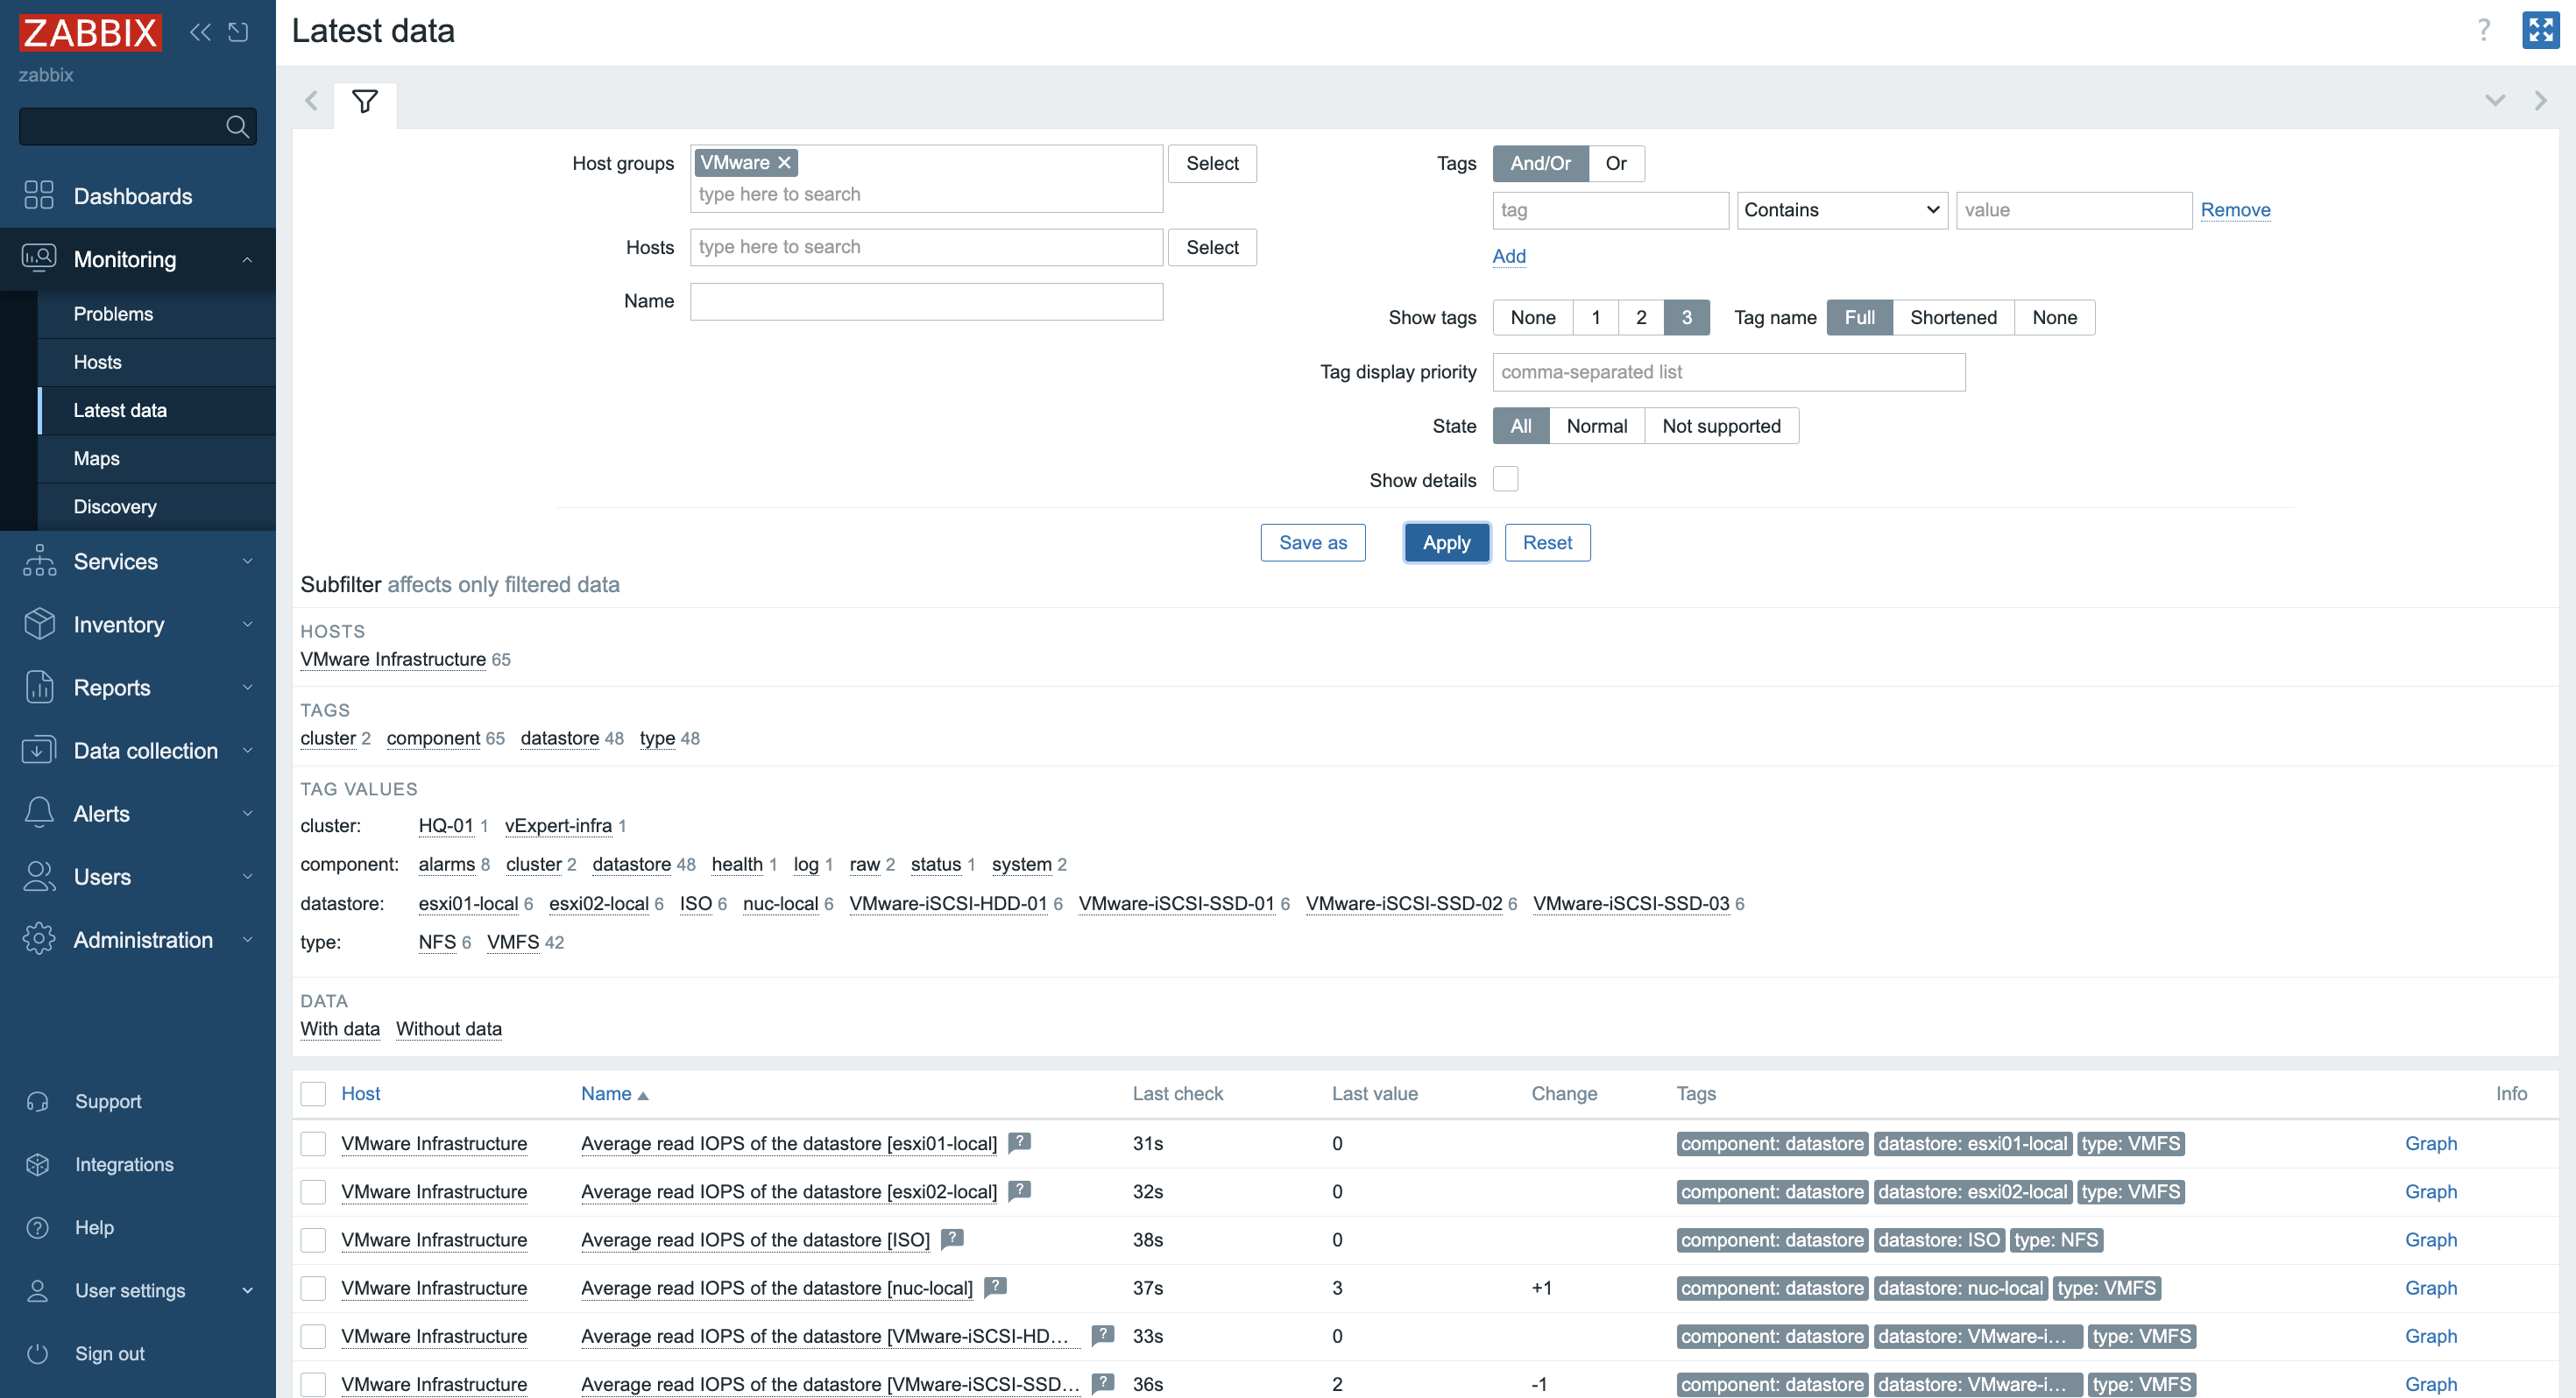
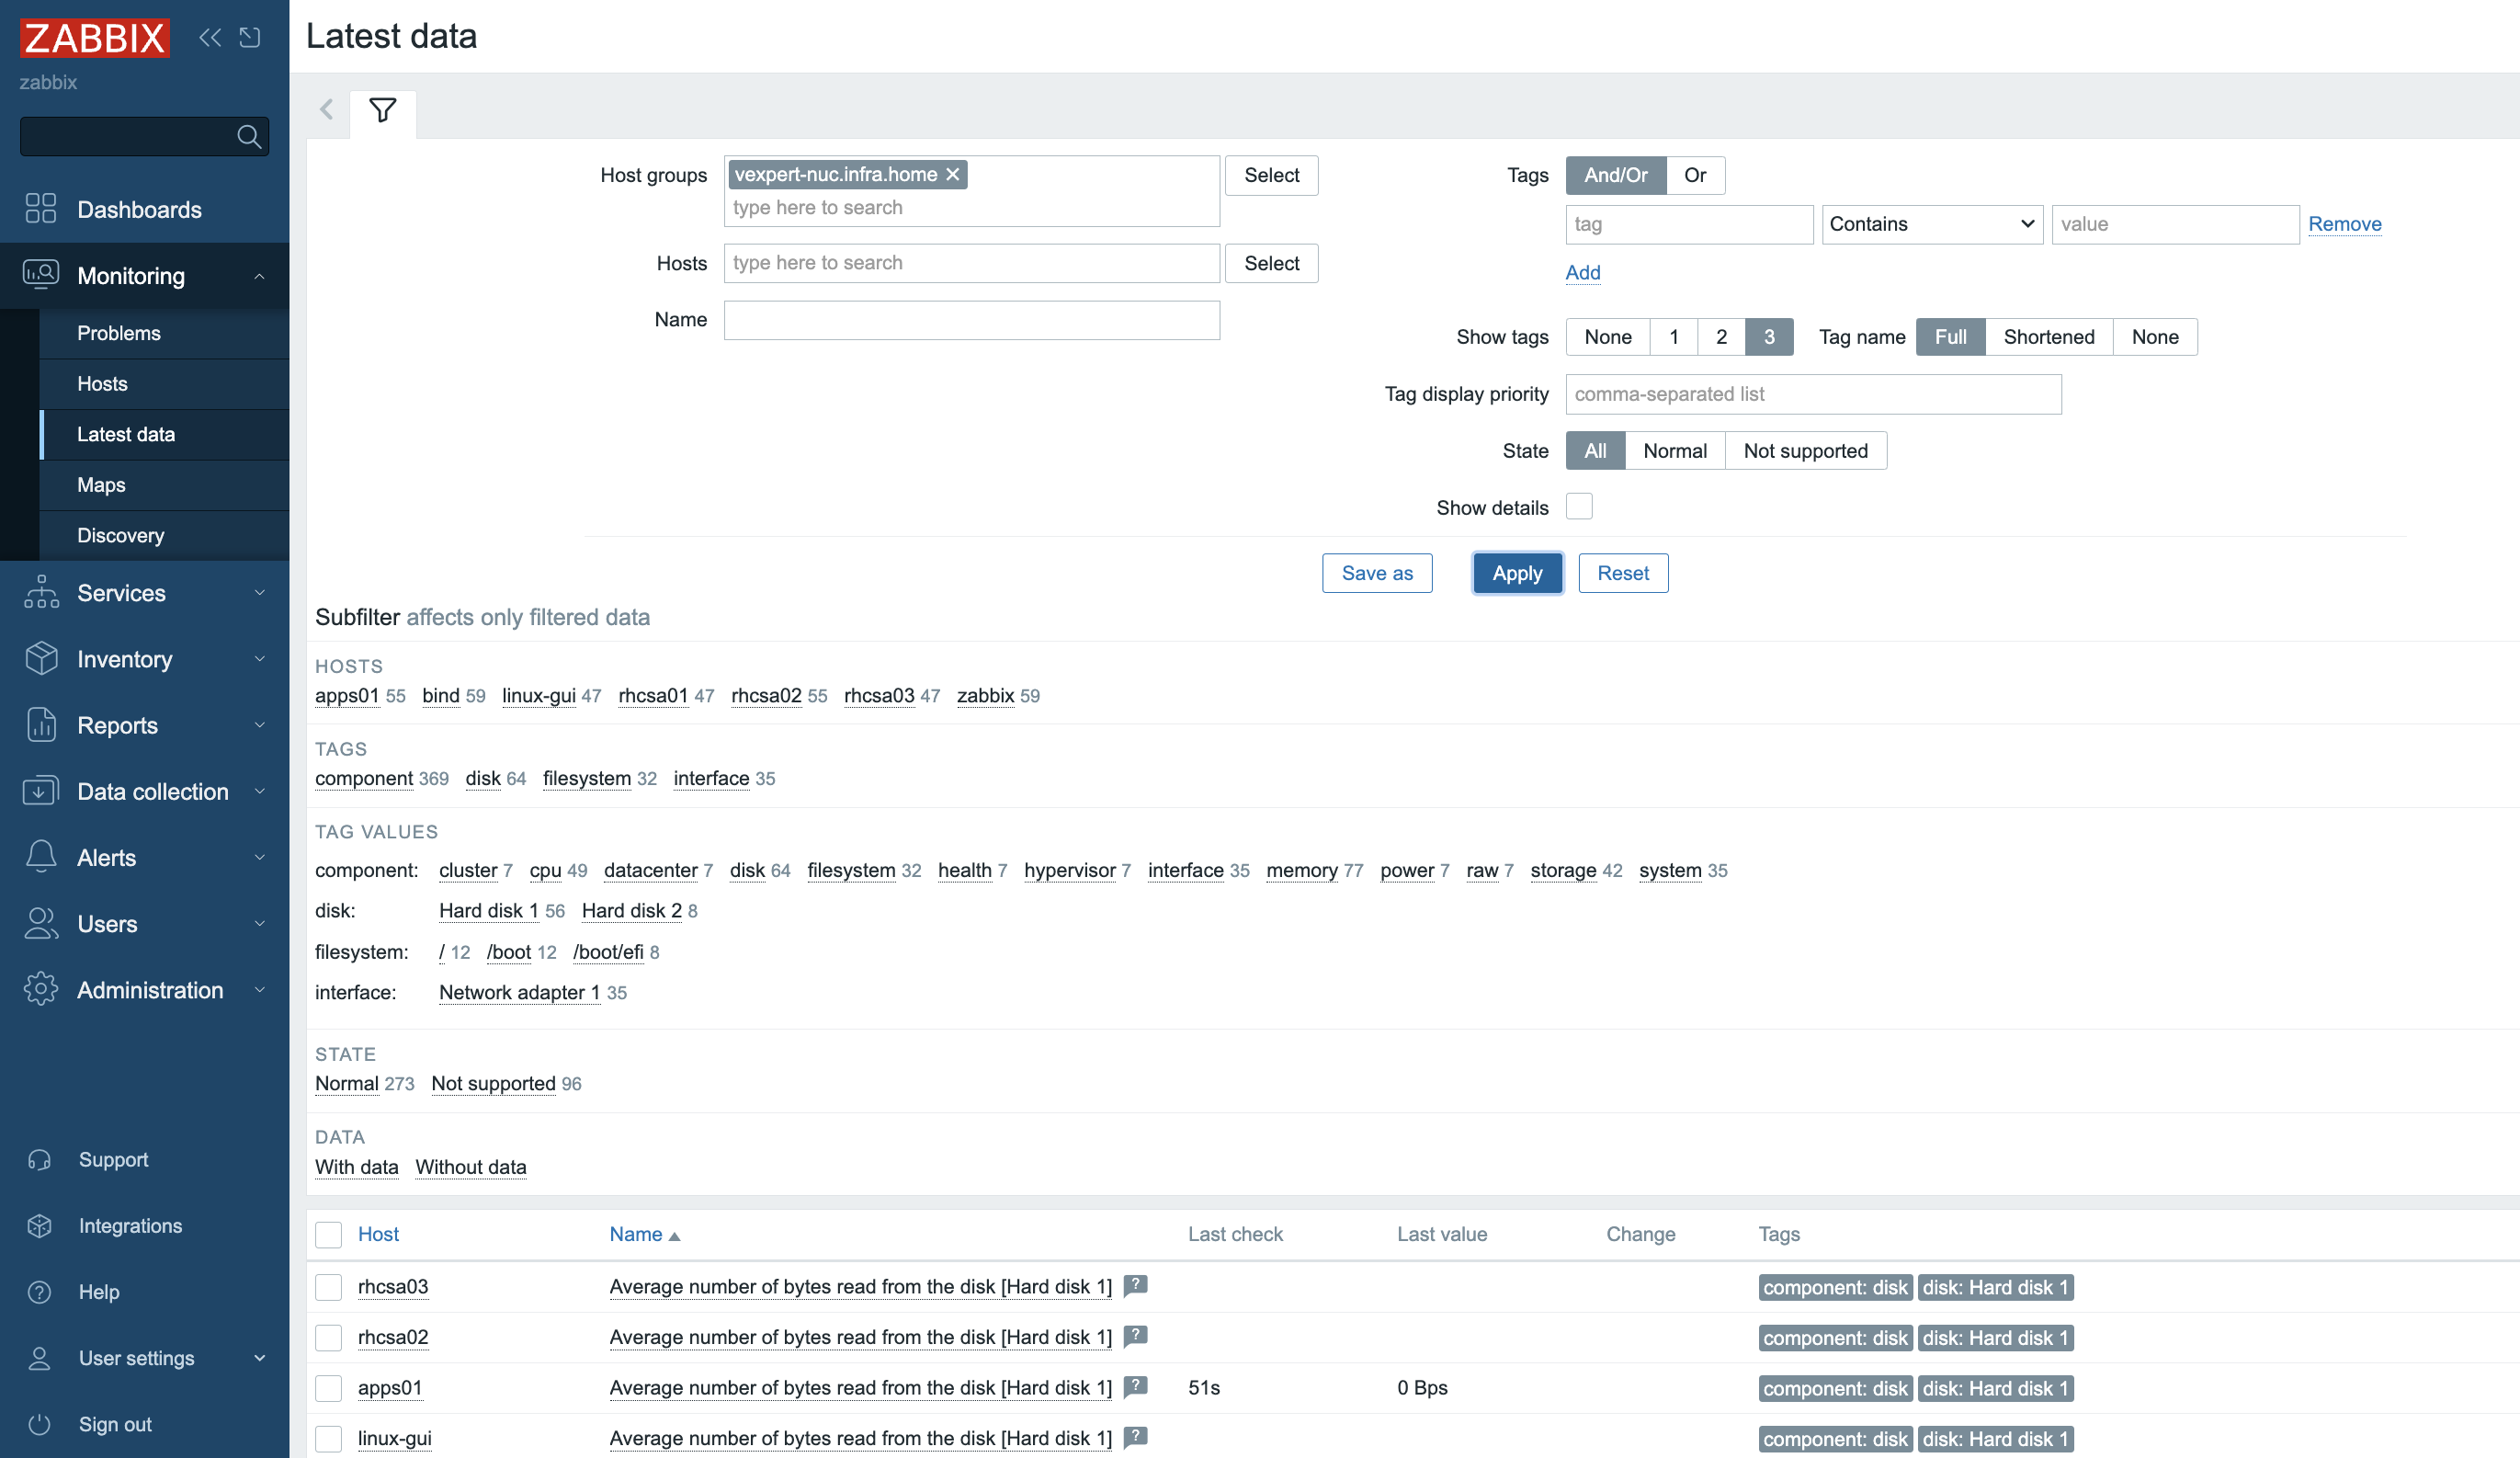
Fig. 6. Hosts monitored by proxy

Fig. 7.List of proxies and hosts monitored by them
Configuring Proxy groups
You can create as many proxy containers as necessary in Docker, and you can also create proxy groups for load balancing (it is based on the number of hosts per proxy).
First, create a proxy group in the frontend:
- Set proxy group name
- Select failover period
- Minimum number of proxies

Fig. 8.Creating a new proxy group
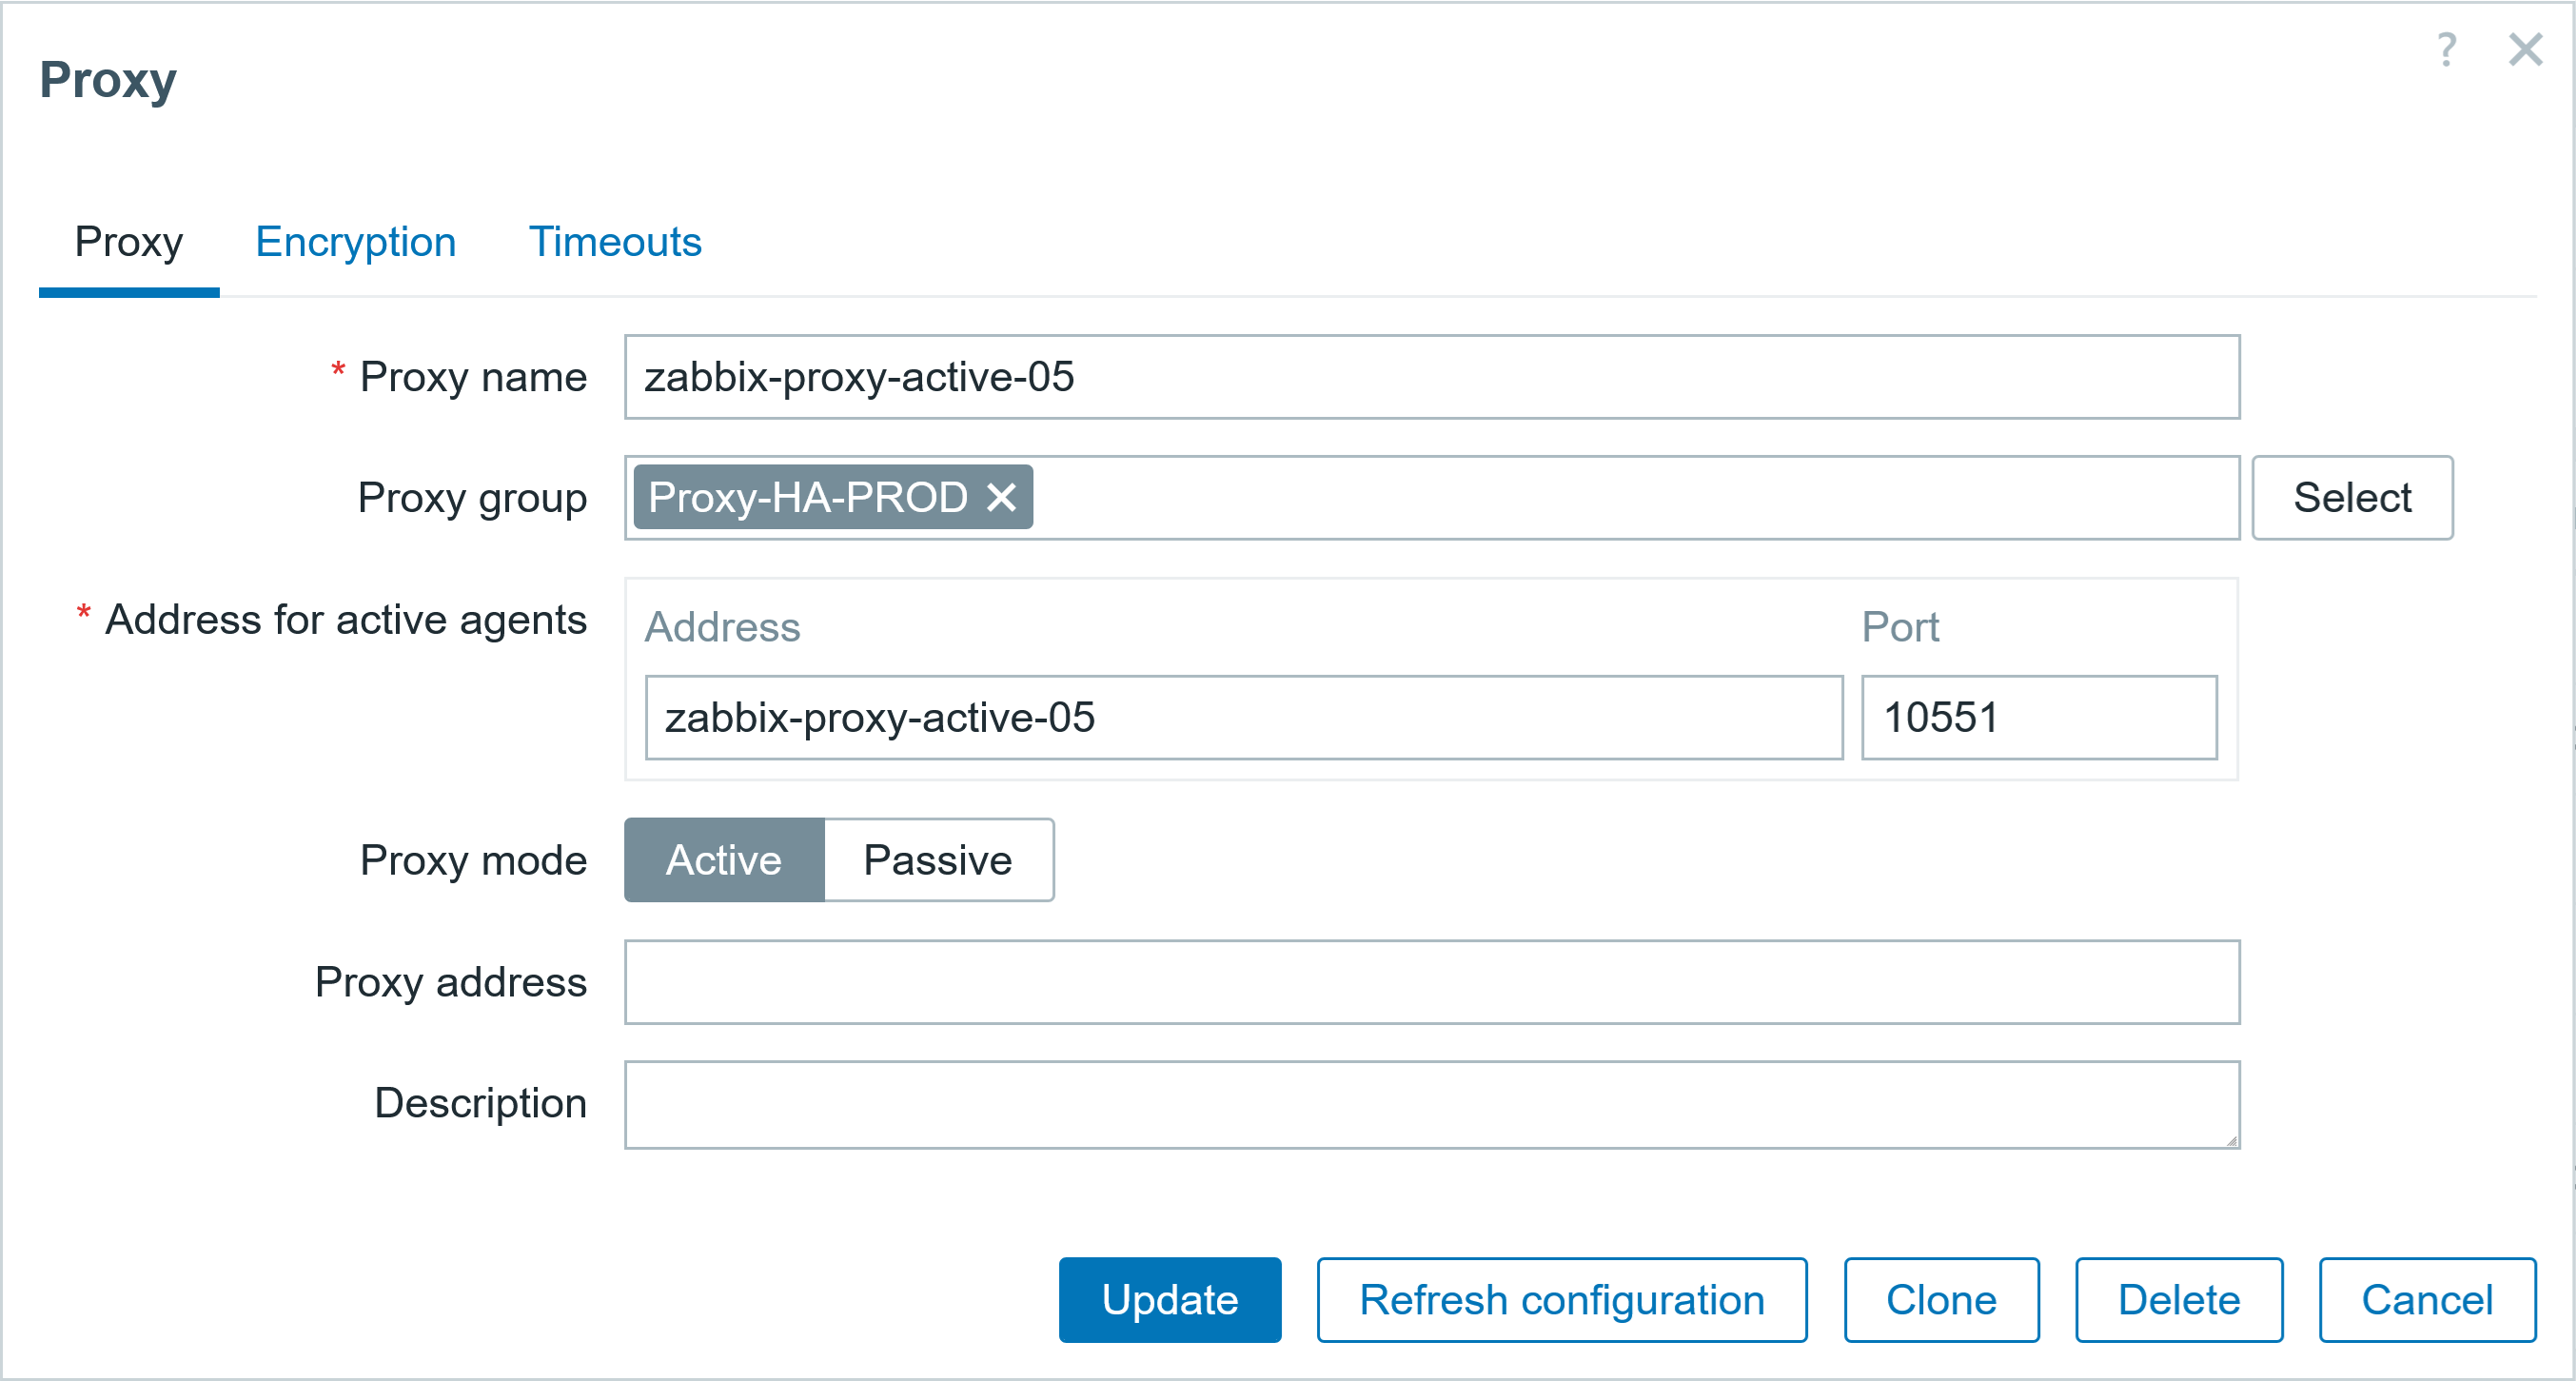
Next, add proxies to the proxy group, and specify the address for active agents and port for the active agents.

Fig. 9. Adding proxy to proxy group
Do not forget to change Zabbix agent configuration for hosts now monitored through the proxy group (add proxy groups IPs/DNS to Server and ServerActive options).

Fig. 10. Creating a new host and monitoring it through proxy group
You can see additional information regarding the proxies in the Frontend section: Administration/ Proxies.

Fig. 11. List of all configured proxies and those belonging to proxy group
Adding more Java gateways
Zabbix server or proxy can communicate with only one Zabbix java gateway, however, you are not limited tin how many Zabbix proxies you create together with Zabbix Java Gateway. You can make an unlimited number of pairs, consisting of Zabbix proxy with Zabbix Java Gateway.
For the containerized Zabbix server, you will need to add these 4 environment variables:
ZBX_JAVAGATEWAY_ENABLE=true
ZBX_JAVAGATEWAY=zabbix-java-gateway-server
ZBX_JAVAGATEWAYPORT=10052
ZBX_STARTJAVAPOLLERS=5
And start the Java gateway for the zabbix-server in docker:
docker run --name zabbix-java-gateway-server -t \
--network=zabbix-net \
--restart unless-stopped \
-d zabbix/zabbix-java-gateway:alpine-7.2.4
Or if you want to add java gateway to the Zabbix proxy, then add these 4 environment variables to Zabbix proxy in docker:
ZBX_JAVAGATEWAY_ENABLE=true
ZBX_JAVAGATEWAY=zabbix-java-gateway-proxy
ZBX_JAVAGATEWAYPORT=10052
ZBX_STARTJAVAPOLLERS=5
And start the java gateway as a container:
docker run --name zabbix-java-gateway-proxy -t \
--network=zabbix-net \
--restart unless-stopped \
-d zabbix/zabbix-java-gateway:alpine-7.2.4
And here we have a host, monitored by zabbix-agent2 through zabbix-proxy-active-02

Fig. 12. Host monitored by proxy with configured Java gateway
Upgrading docker proxies with SQLite3 database
If you have older Zabbix components already running in docker and you have upgraded the server, you will also need to upgrade the proxies.
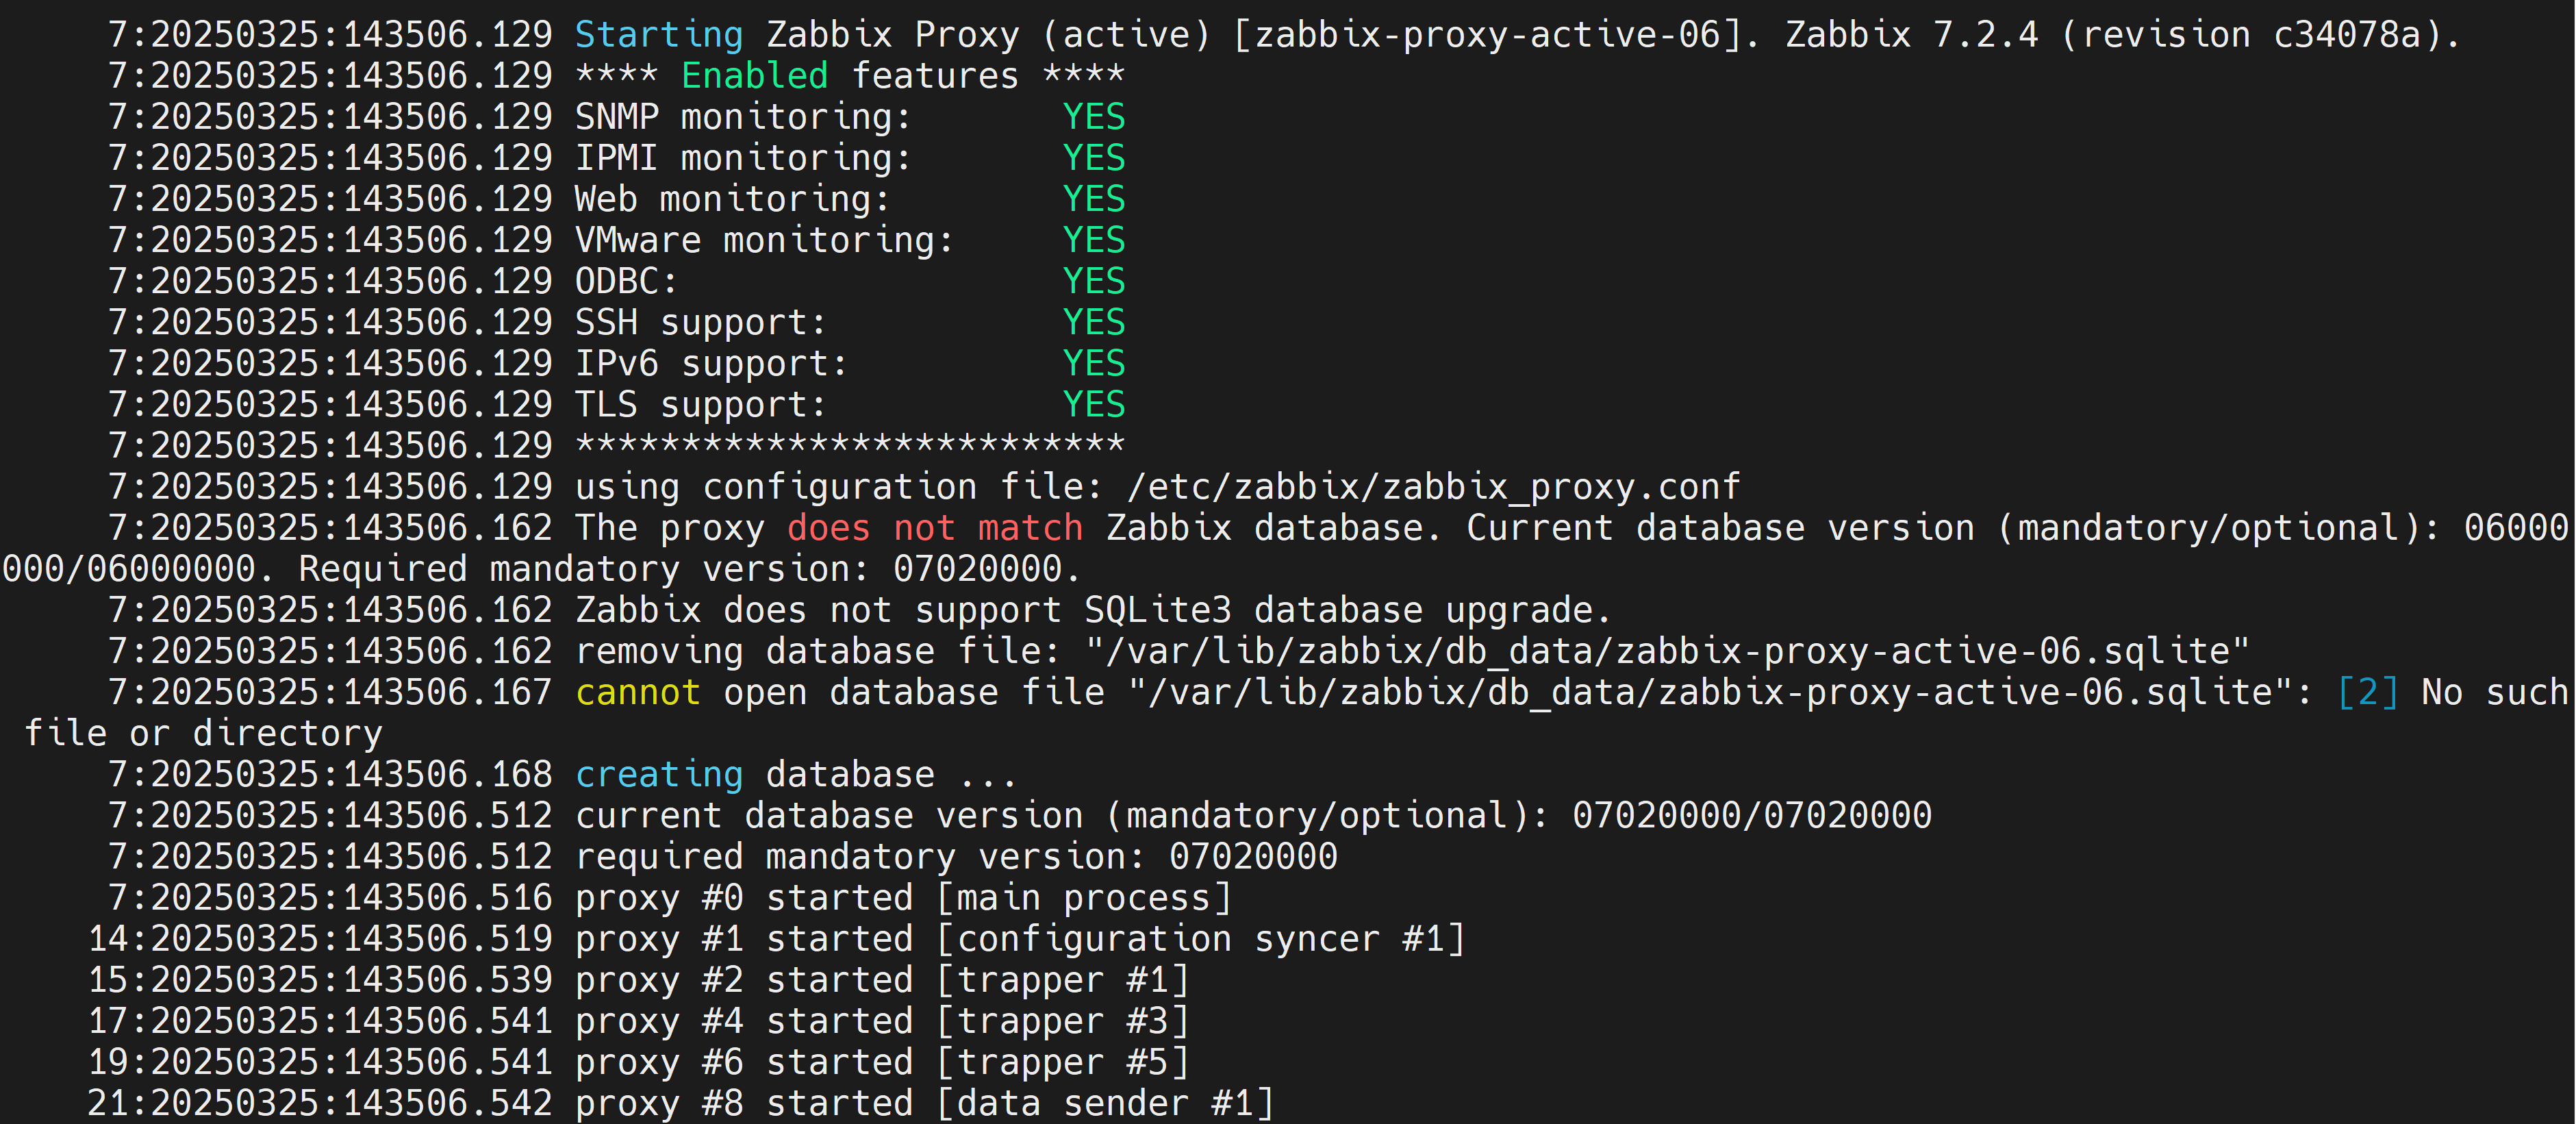
If you have a container created from the proxy zabbix-proxy-sqlite3 image and want to upgrade it, you will lose the existing data stored in the SQLite3 database. For most users, the database functions as a buffer to temporarily keep the data until it’s sent to Zabbix server and the loss of the proxy database file data is of no consequence.
Once you have updated the image for the container, the proxy will detect the existing old database version on startup. If the directory is mounted to database file, it will delete the database file and create a new one. This will impact those who keep data after sending it to Zabbix server and use the data from the proxy database for other purposes.

Fig. 13. Database upgrade for proxy container with SQLite3 database
Upgrading docker proxies with MySQL database
To upgrade the MySQL database for proxy, log in in the MySQL database, set the log_bin_trust_function_creators flag to 1. Change the proxy image version to a newer one and start the container.
mysql> set global log_bin_trust_function_creators = 1;
If you have not set the flag, you will receive an error of database upgrade.

Fig. 14. Failed database upgrade for proxy with MySQL database
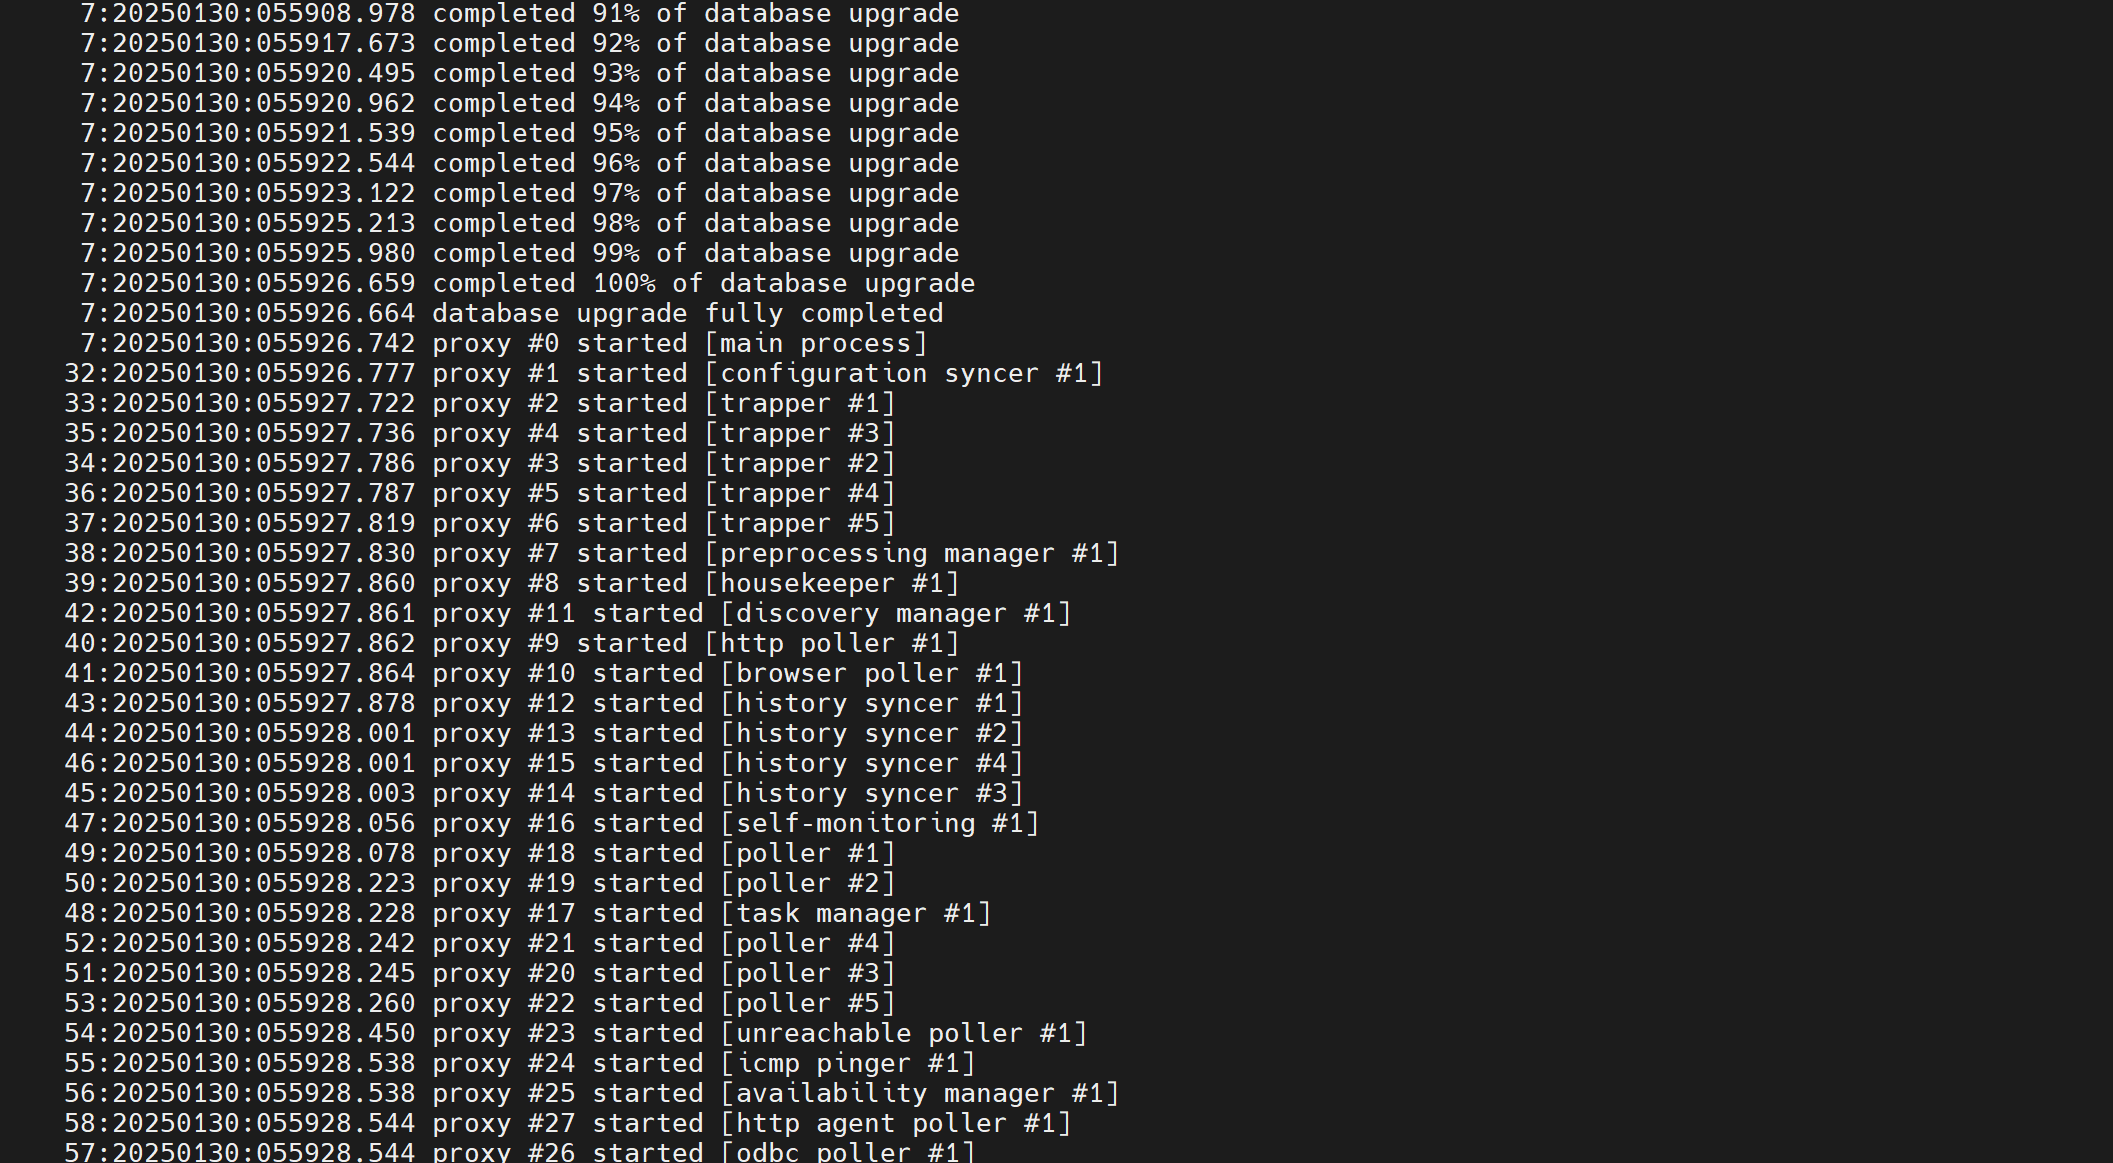
Replace the previous version of the proxy image with the new one, check the log file, and check the docker logs to see when the database schema upgrade has finished. After the upgrade, set the flag back to 0.
mysql> set global log_bin_trust_function_creators = 0;
The upgrade has been successful, and the proxy service has started after that.

Fig. 15. Successful database upgrade for proxy with MySQL database
An official docker image for the proxy with Postgresql database support is not available due to the extensive number of existing images and different versions.
Deploying multiple frontends
You can launch as many frontends as you need if you are experiencing a sudden surge in Zabbix users. Just specify which port to assign for it and you are good to go (don’t forget to also open the port in the firewall).
docker run --name zabbix-web-nginx-mysql1 -t \
-e DB_SERVER_HOST="mysql-server" \
-e MYSQL_DATABASE="zabbix" \
-e MYSQL_USER="zabbix" \
-e MYSQL_PASSWORD="zabbix_pwd" \
-e MYSQL_ROOT_PASSWORD="root_pwd" \
--network=zabbix-net \
-p 80:8080 \
--restart unless-stopped \
-d zabbix/zabbix-web-nginx-mysql:alpine-7.2.4

Fig. 16. One started Zabbix frontend container in docker
docker run --name zabbix-web-nginx-mysql2 -t \
-e DB_SERVER_HOST="mysql-server" \
-e MYSQL_DATABASE="zabbix" \
-e MYSQL_USER="zabbix" \
-e MYSQL_PASSWORD="zabbix_pwd" \
-e MYSQL_ROOT_PASSWORD="root_pwd" \
--network=zabbix-net \
-p 81:8080 \
--restart unless-stopped \
-d zabbix/zabbix-web-nginx-mysql:alpine-7.2.4

Fig. 17. Two started Zabbix frontend containers in docker
docker run --name zabbix-web-nginx-mysql3 -t \
-e DB_SERVER_HOST="mysql-server" \
-e MYSQL_DATABASE="zabbix" \
-e MYSQL_USER="zabbix" \
-e MYSQL_PASSWORD="zabbix_pwd" \
-e MYSQL_ROOT_PASSWORD="root_pwd" \
--network=zabbix-net \
-p 82:8080 \
--restart unless-stopped \
-d zabbix/zabbix-web-nginx-mysql:alpine-7.2.4

Fig. 18. Three started Zabbix frontend containers in docker

Fig. 19. Multiple frontends accessed through different ports
Browser monitoring
Browser monitoring setup has never been easier! Just add two parameters to zabbix-server container config:
ZBX_WEBDRIVERURL=selenium:4444
ZBX_STARTBROWSERPOLLERS=2
And start the web driver in the docker (with a standalone chrome browser):
docker run --name selenium -t\
--network=zabbix-net \
--restart unless-stopped \
-p 4444:4444 \
--shm-size="1g" \
-d selenium/standalone-chrome:latest
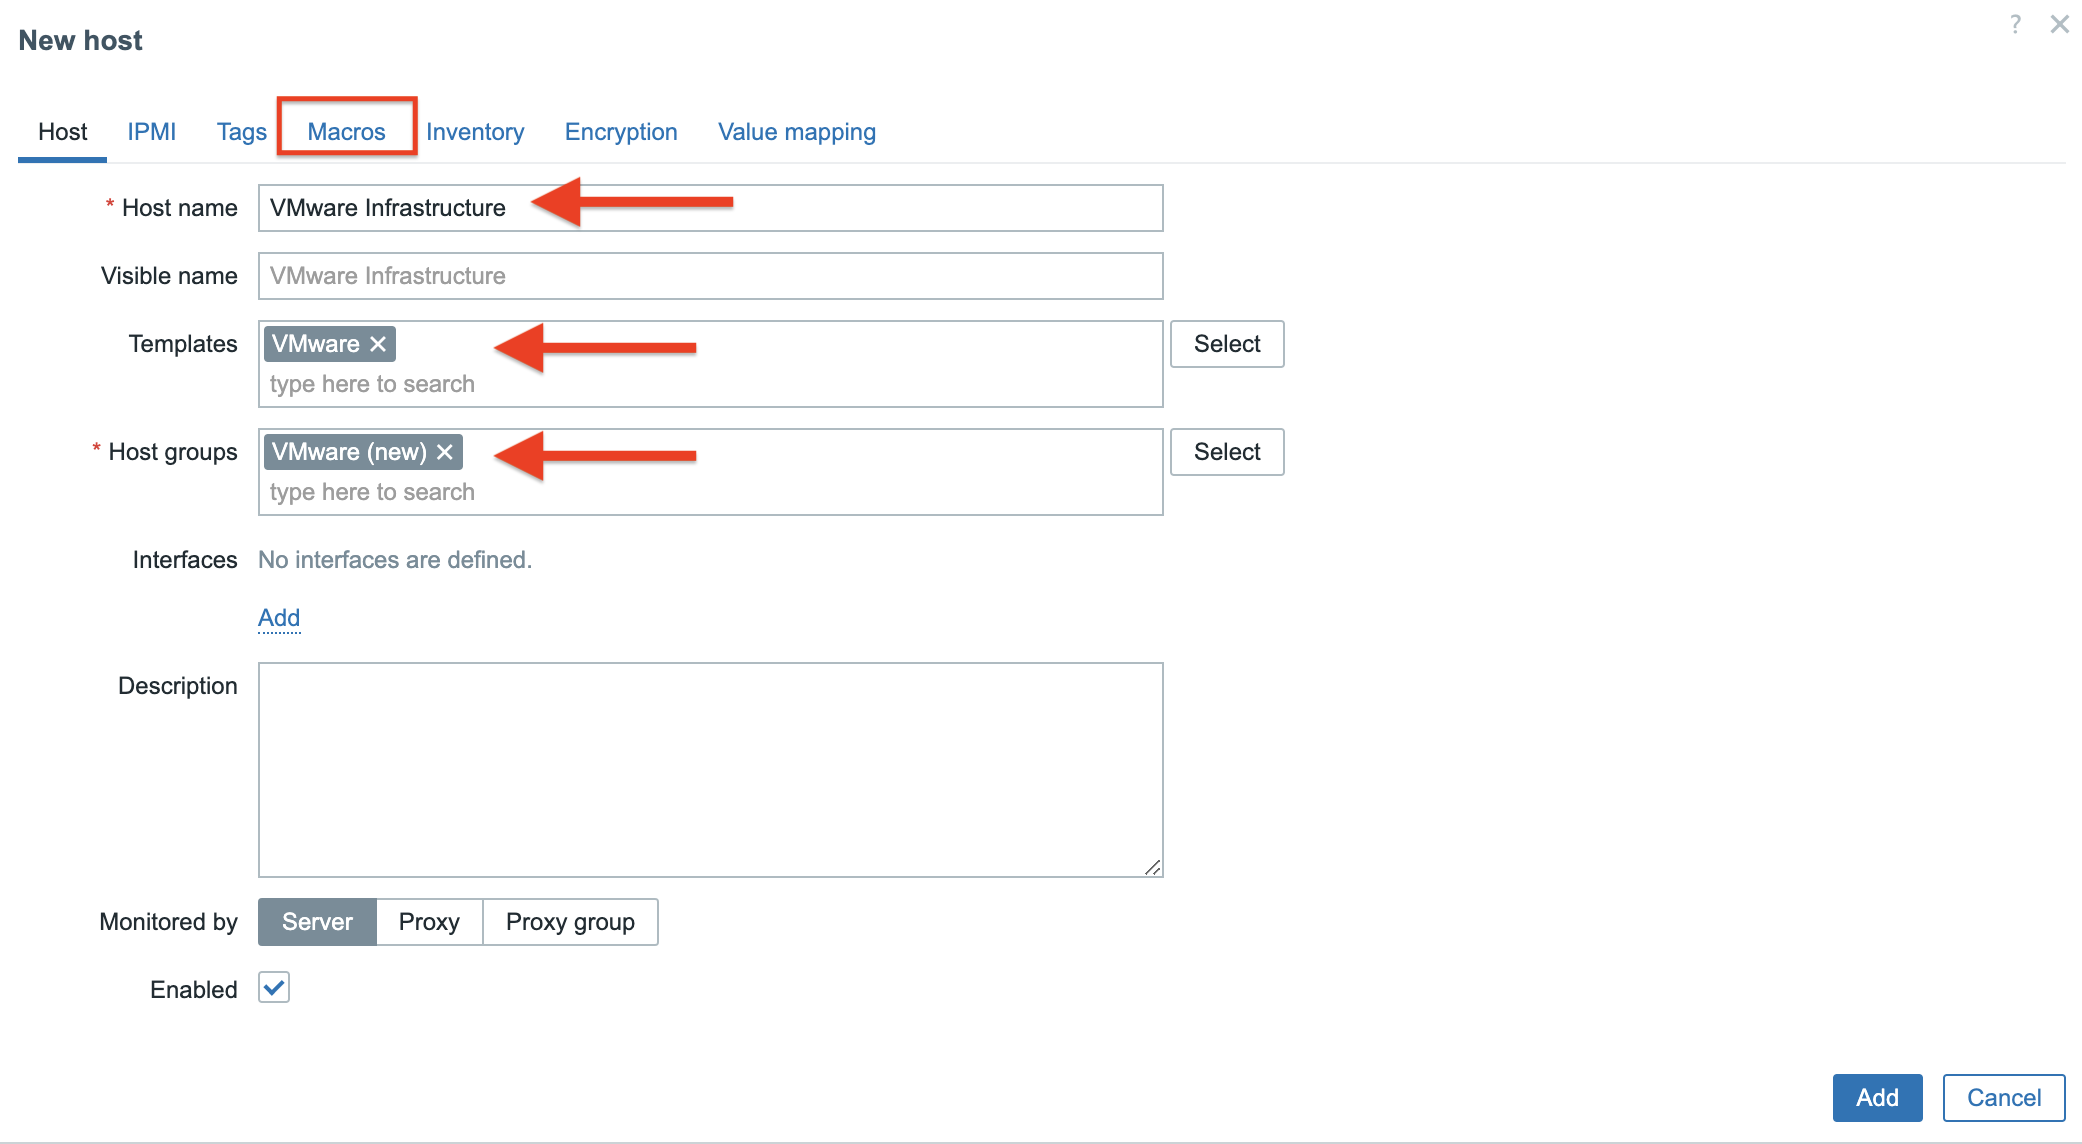
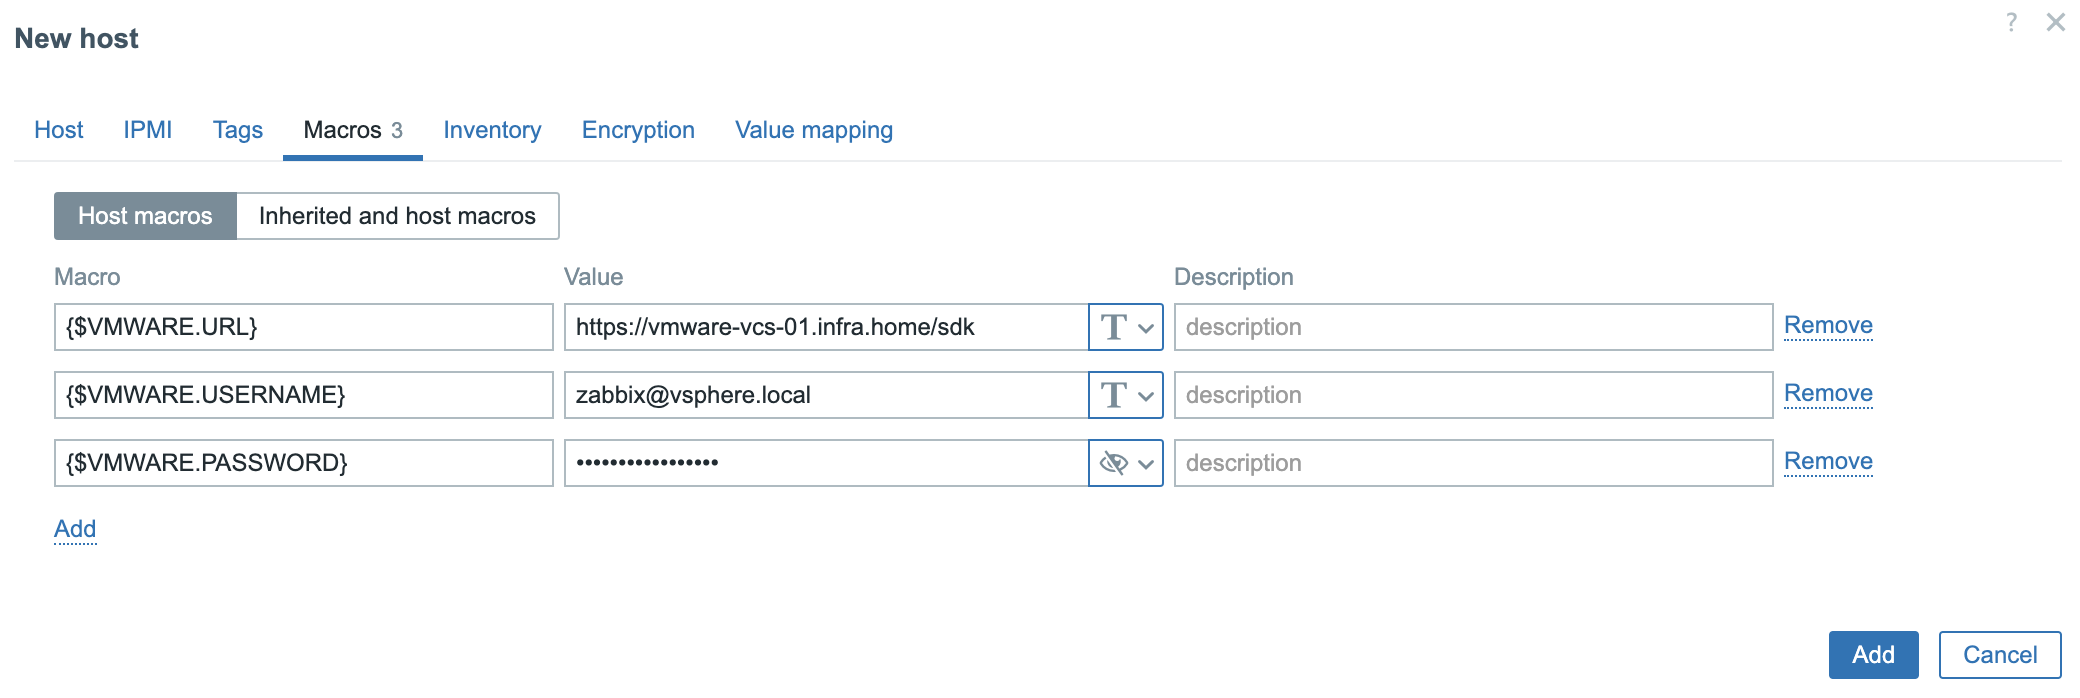
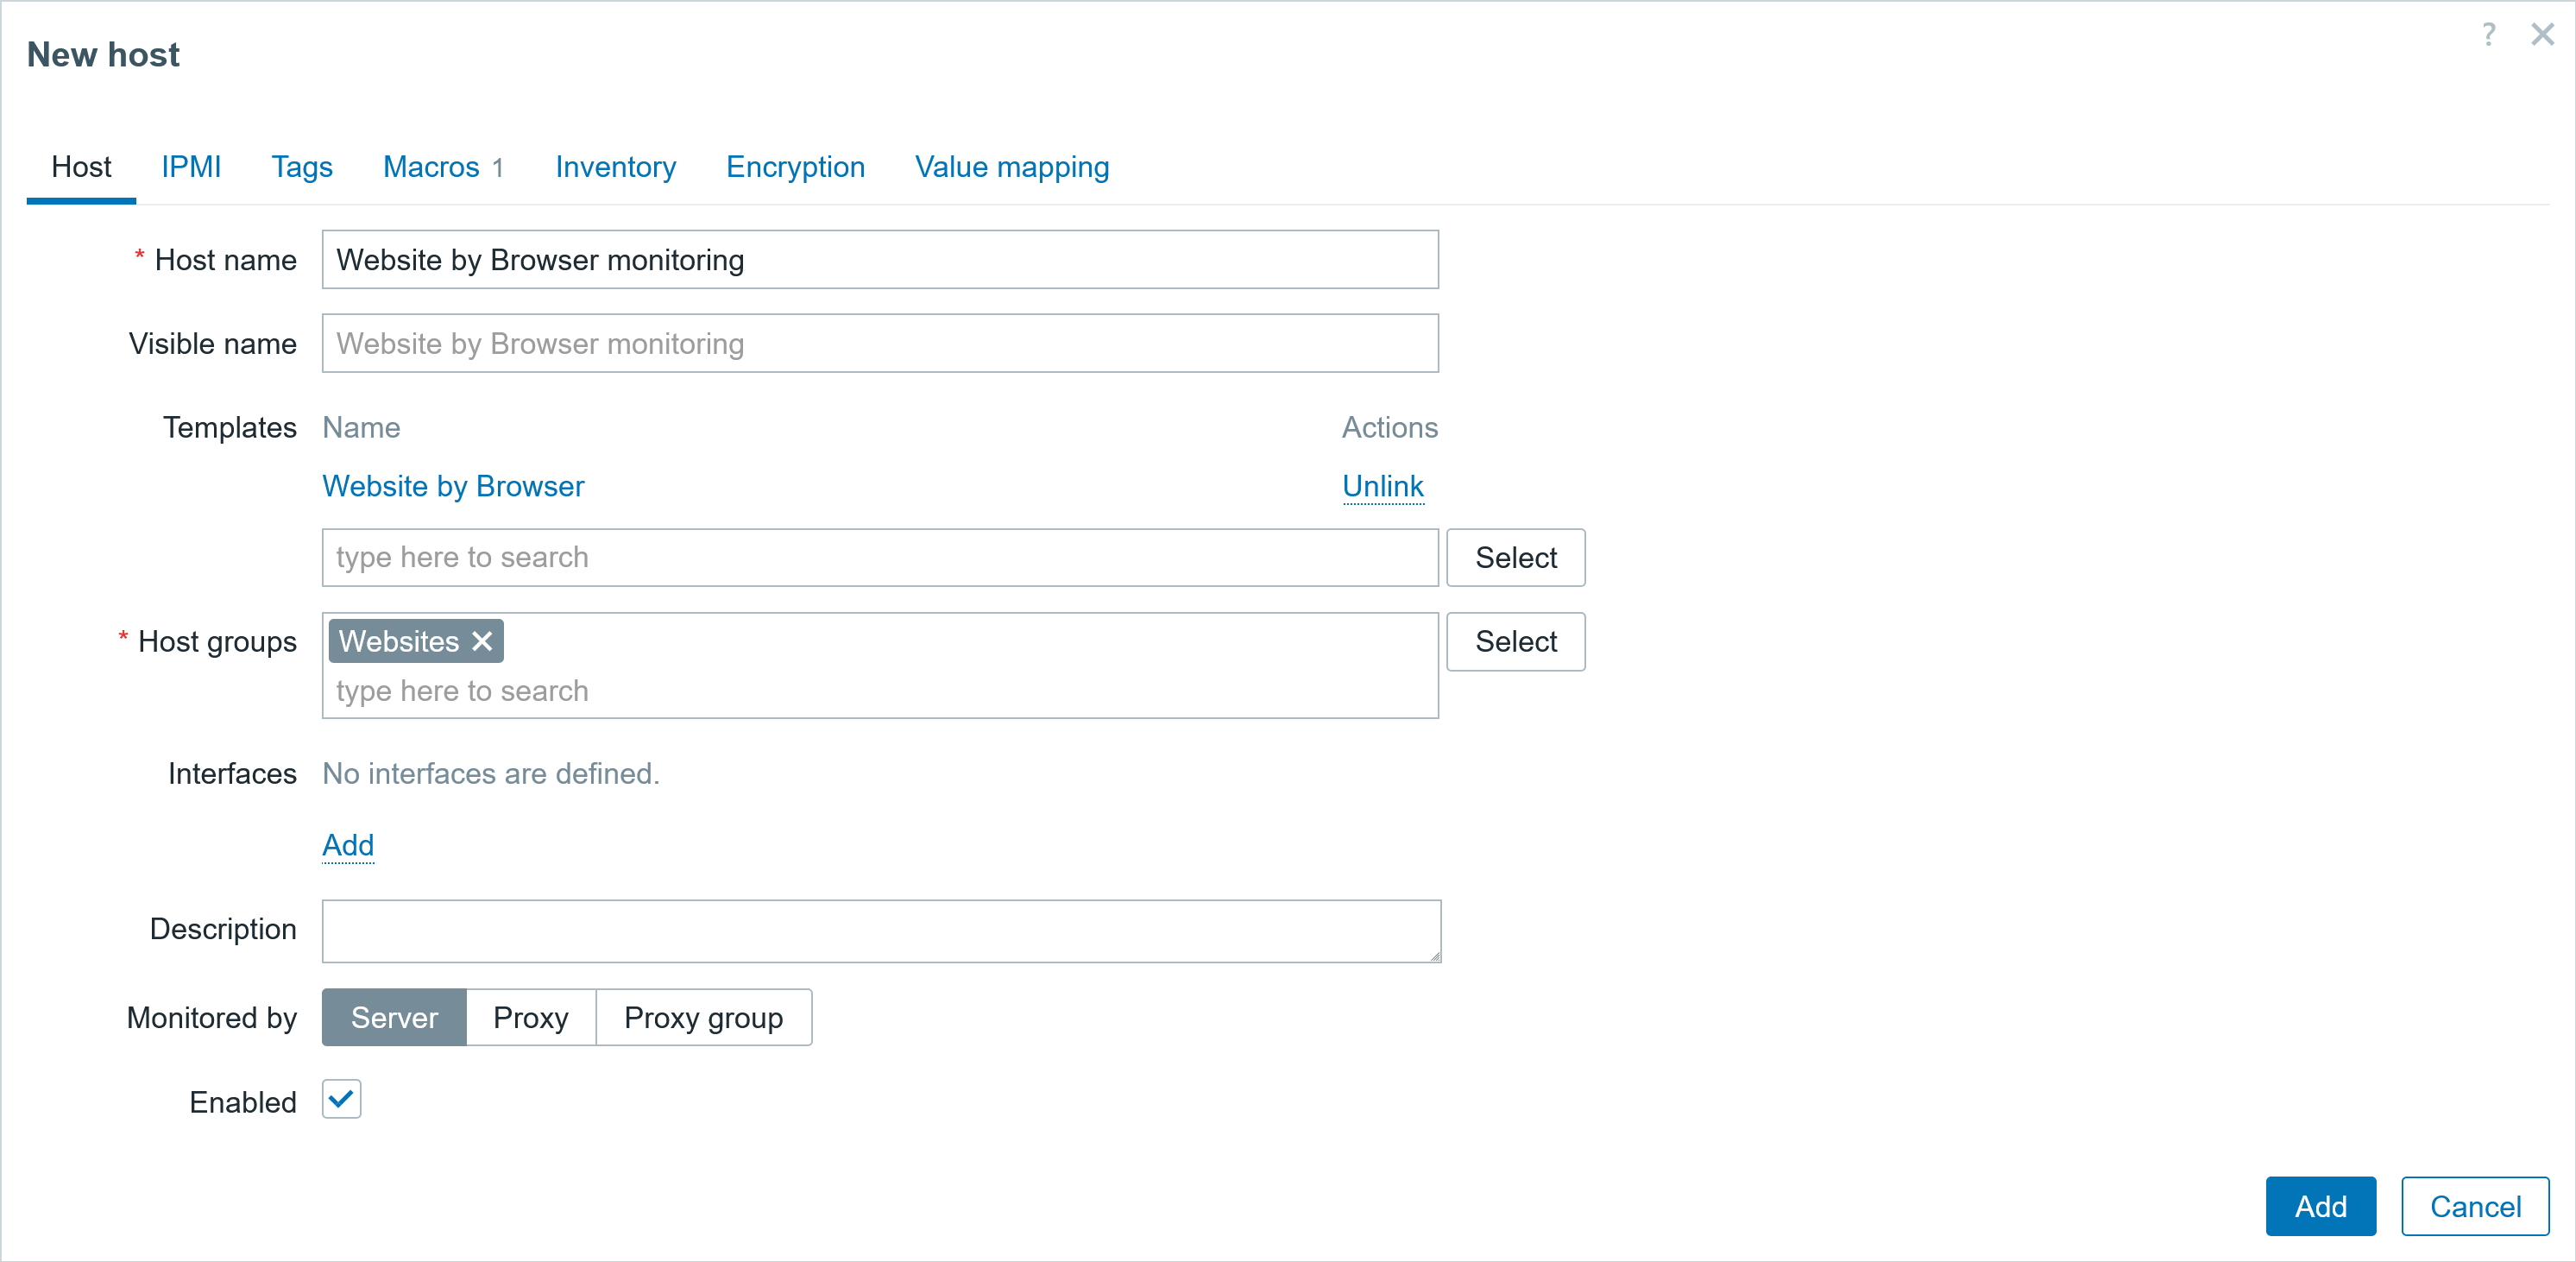
Next step: create a new host, add the template, specify which page to monitor with Macro values, and it’s DONE!!!!

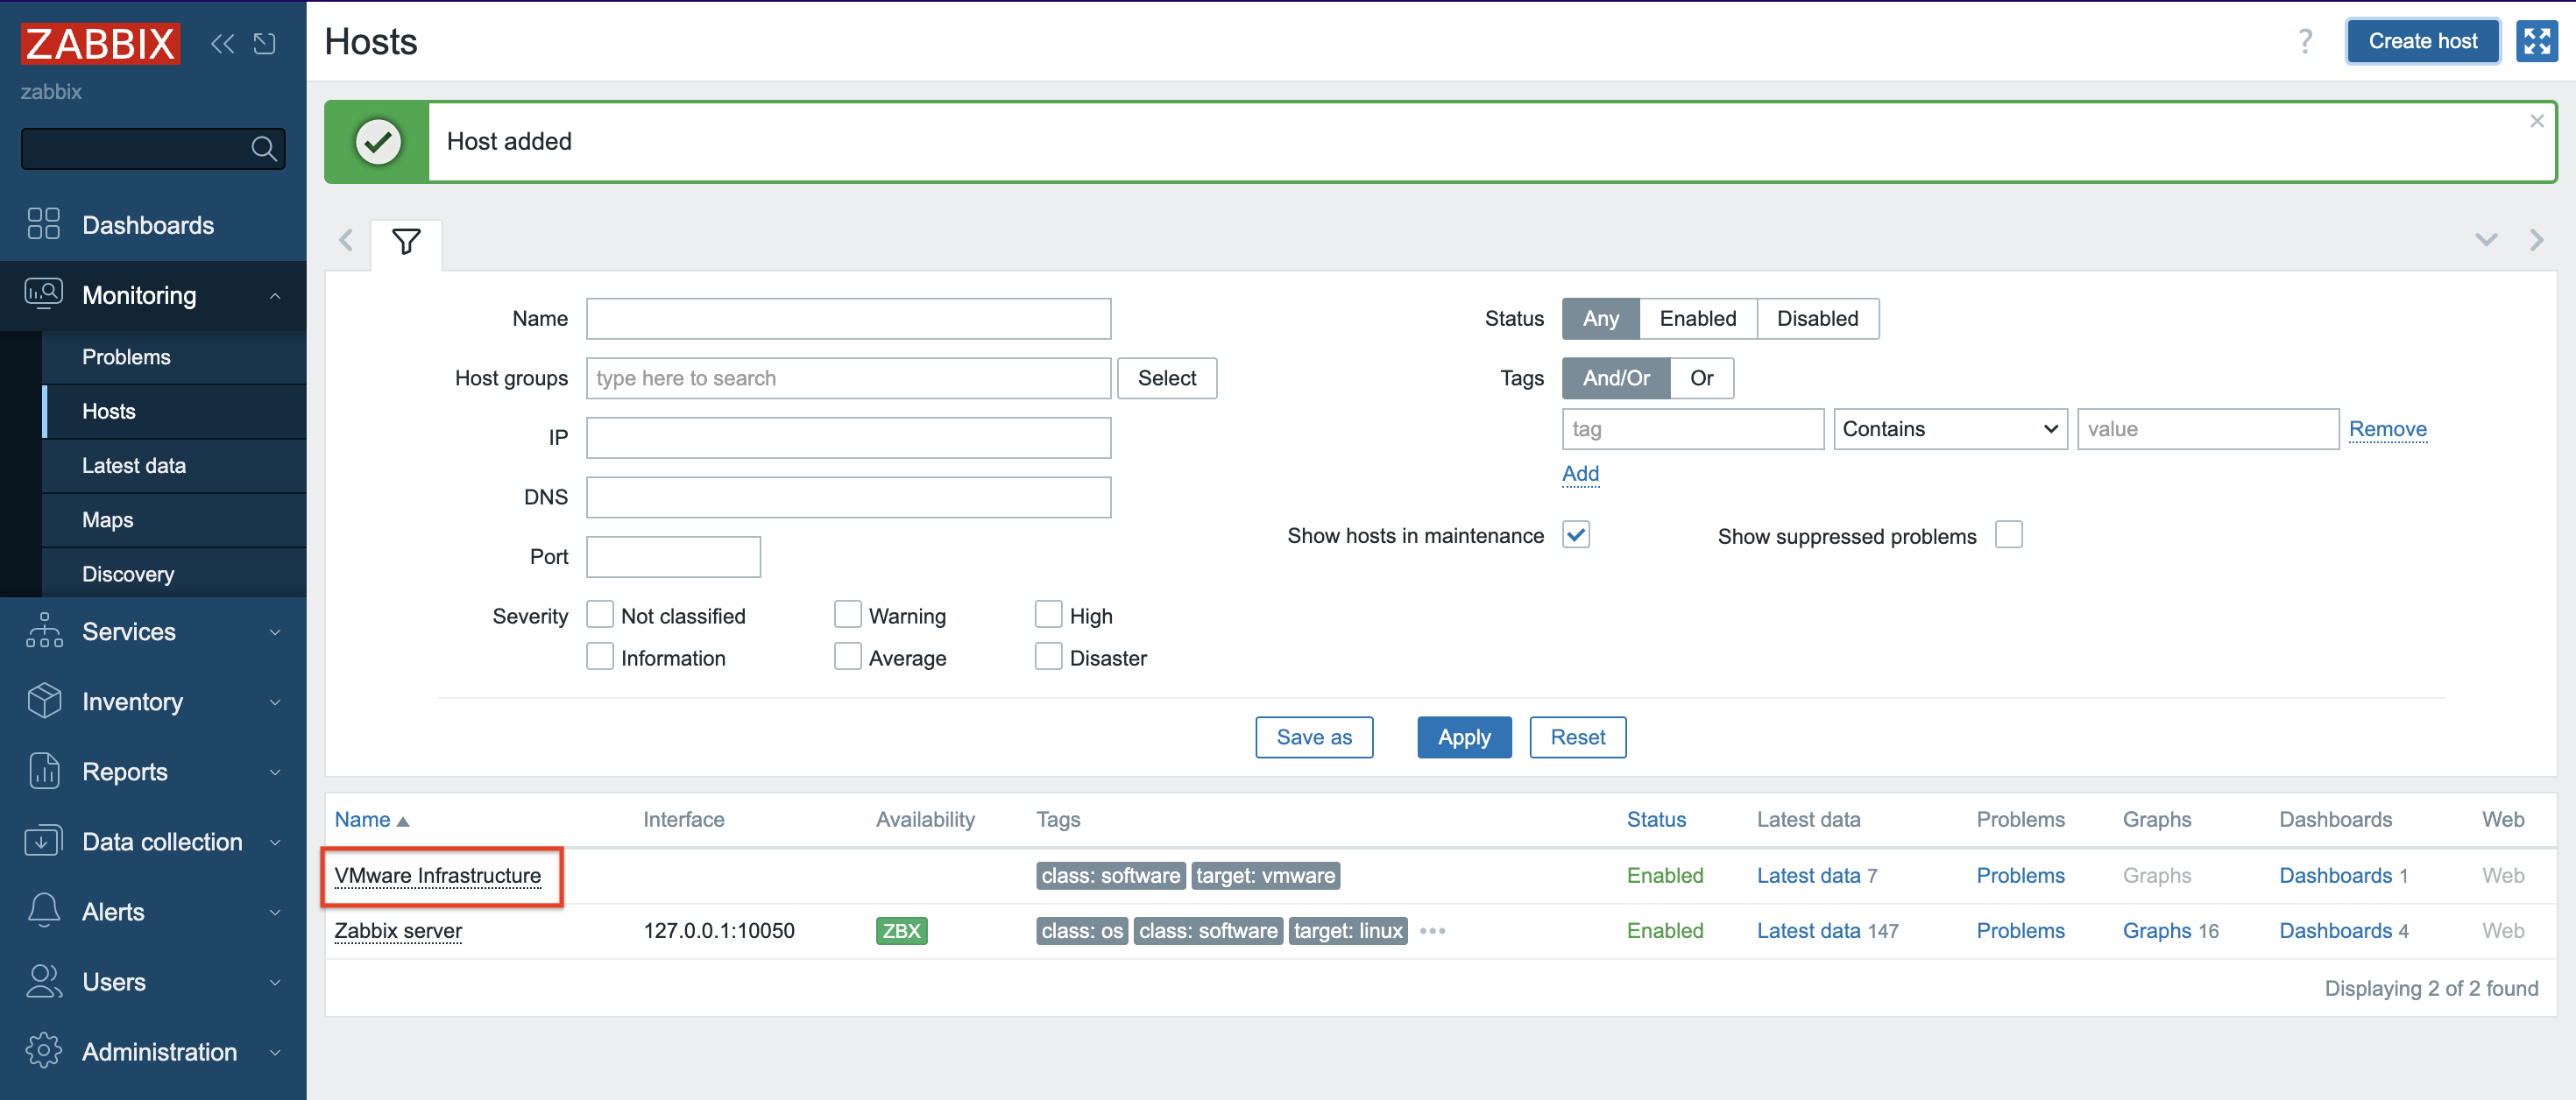
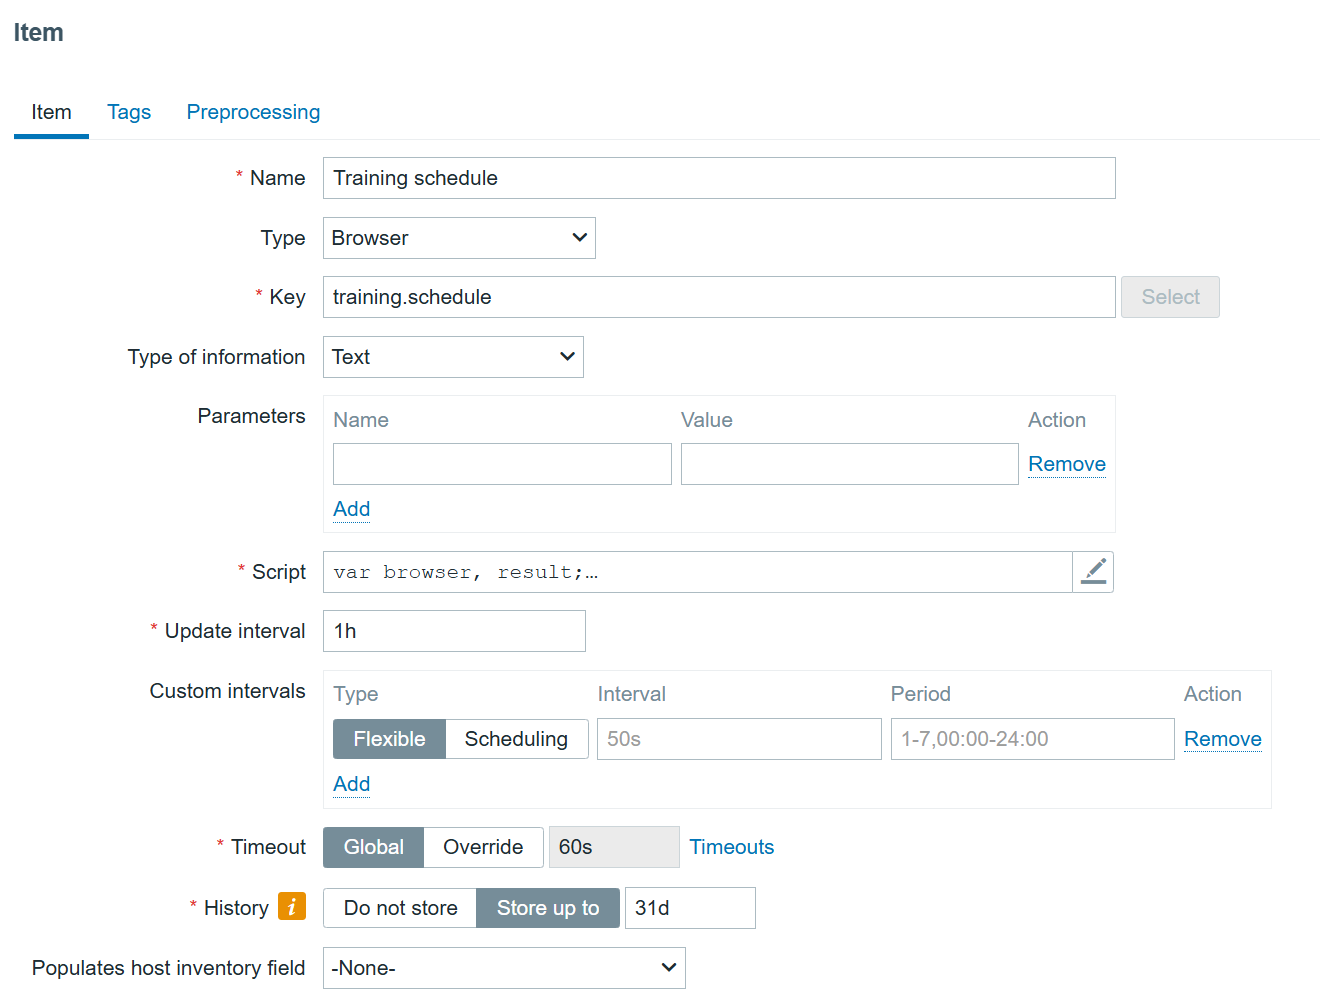
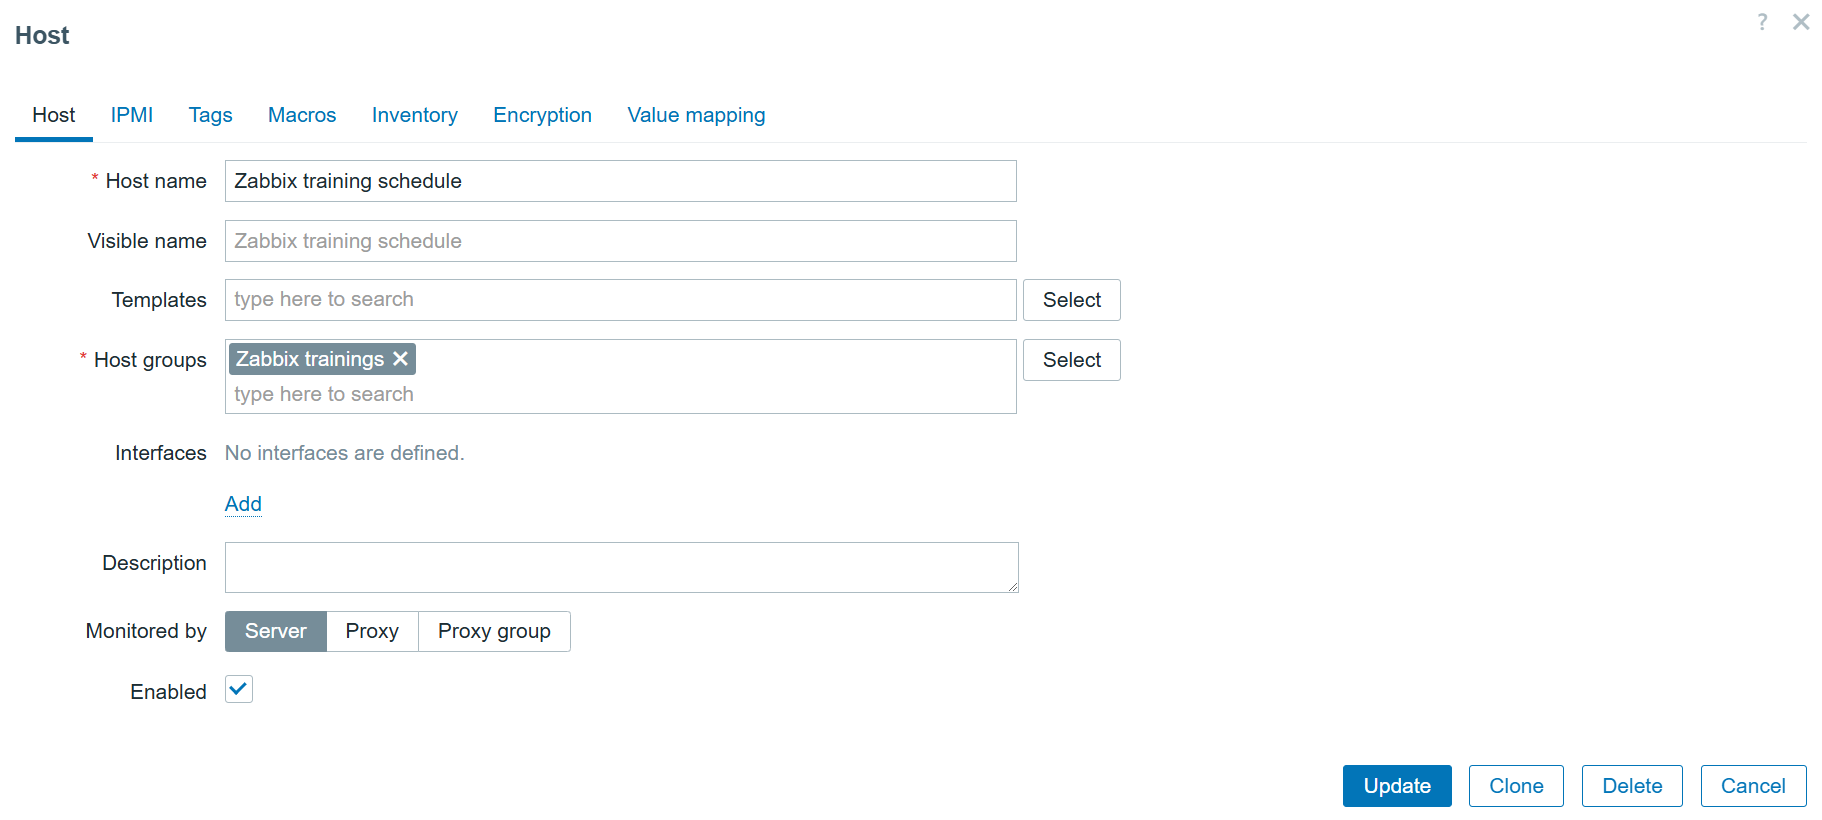
Fig. 20. Creating host for monitoring website

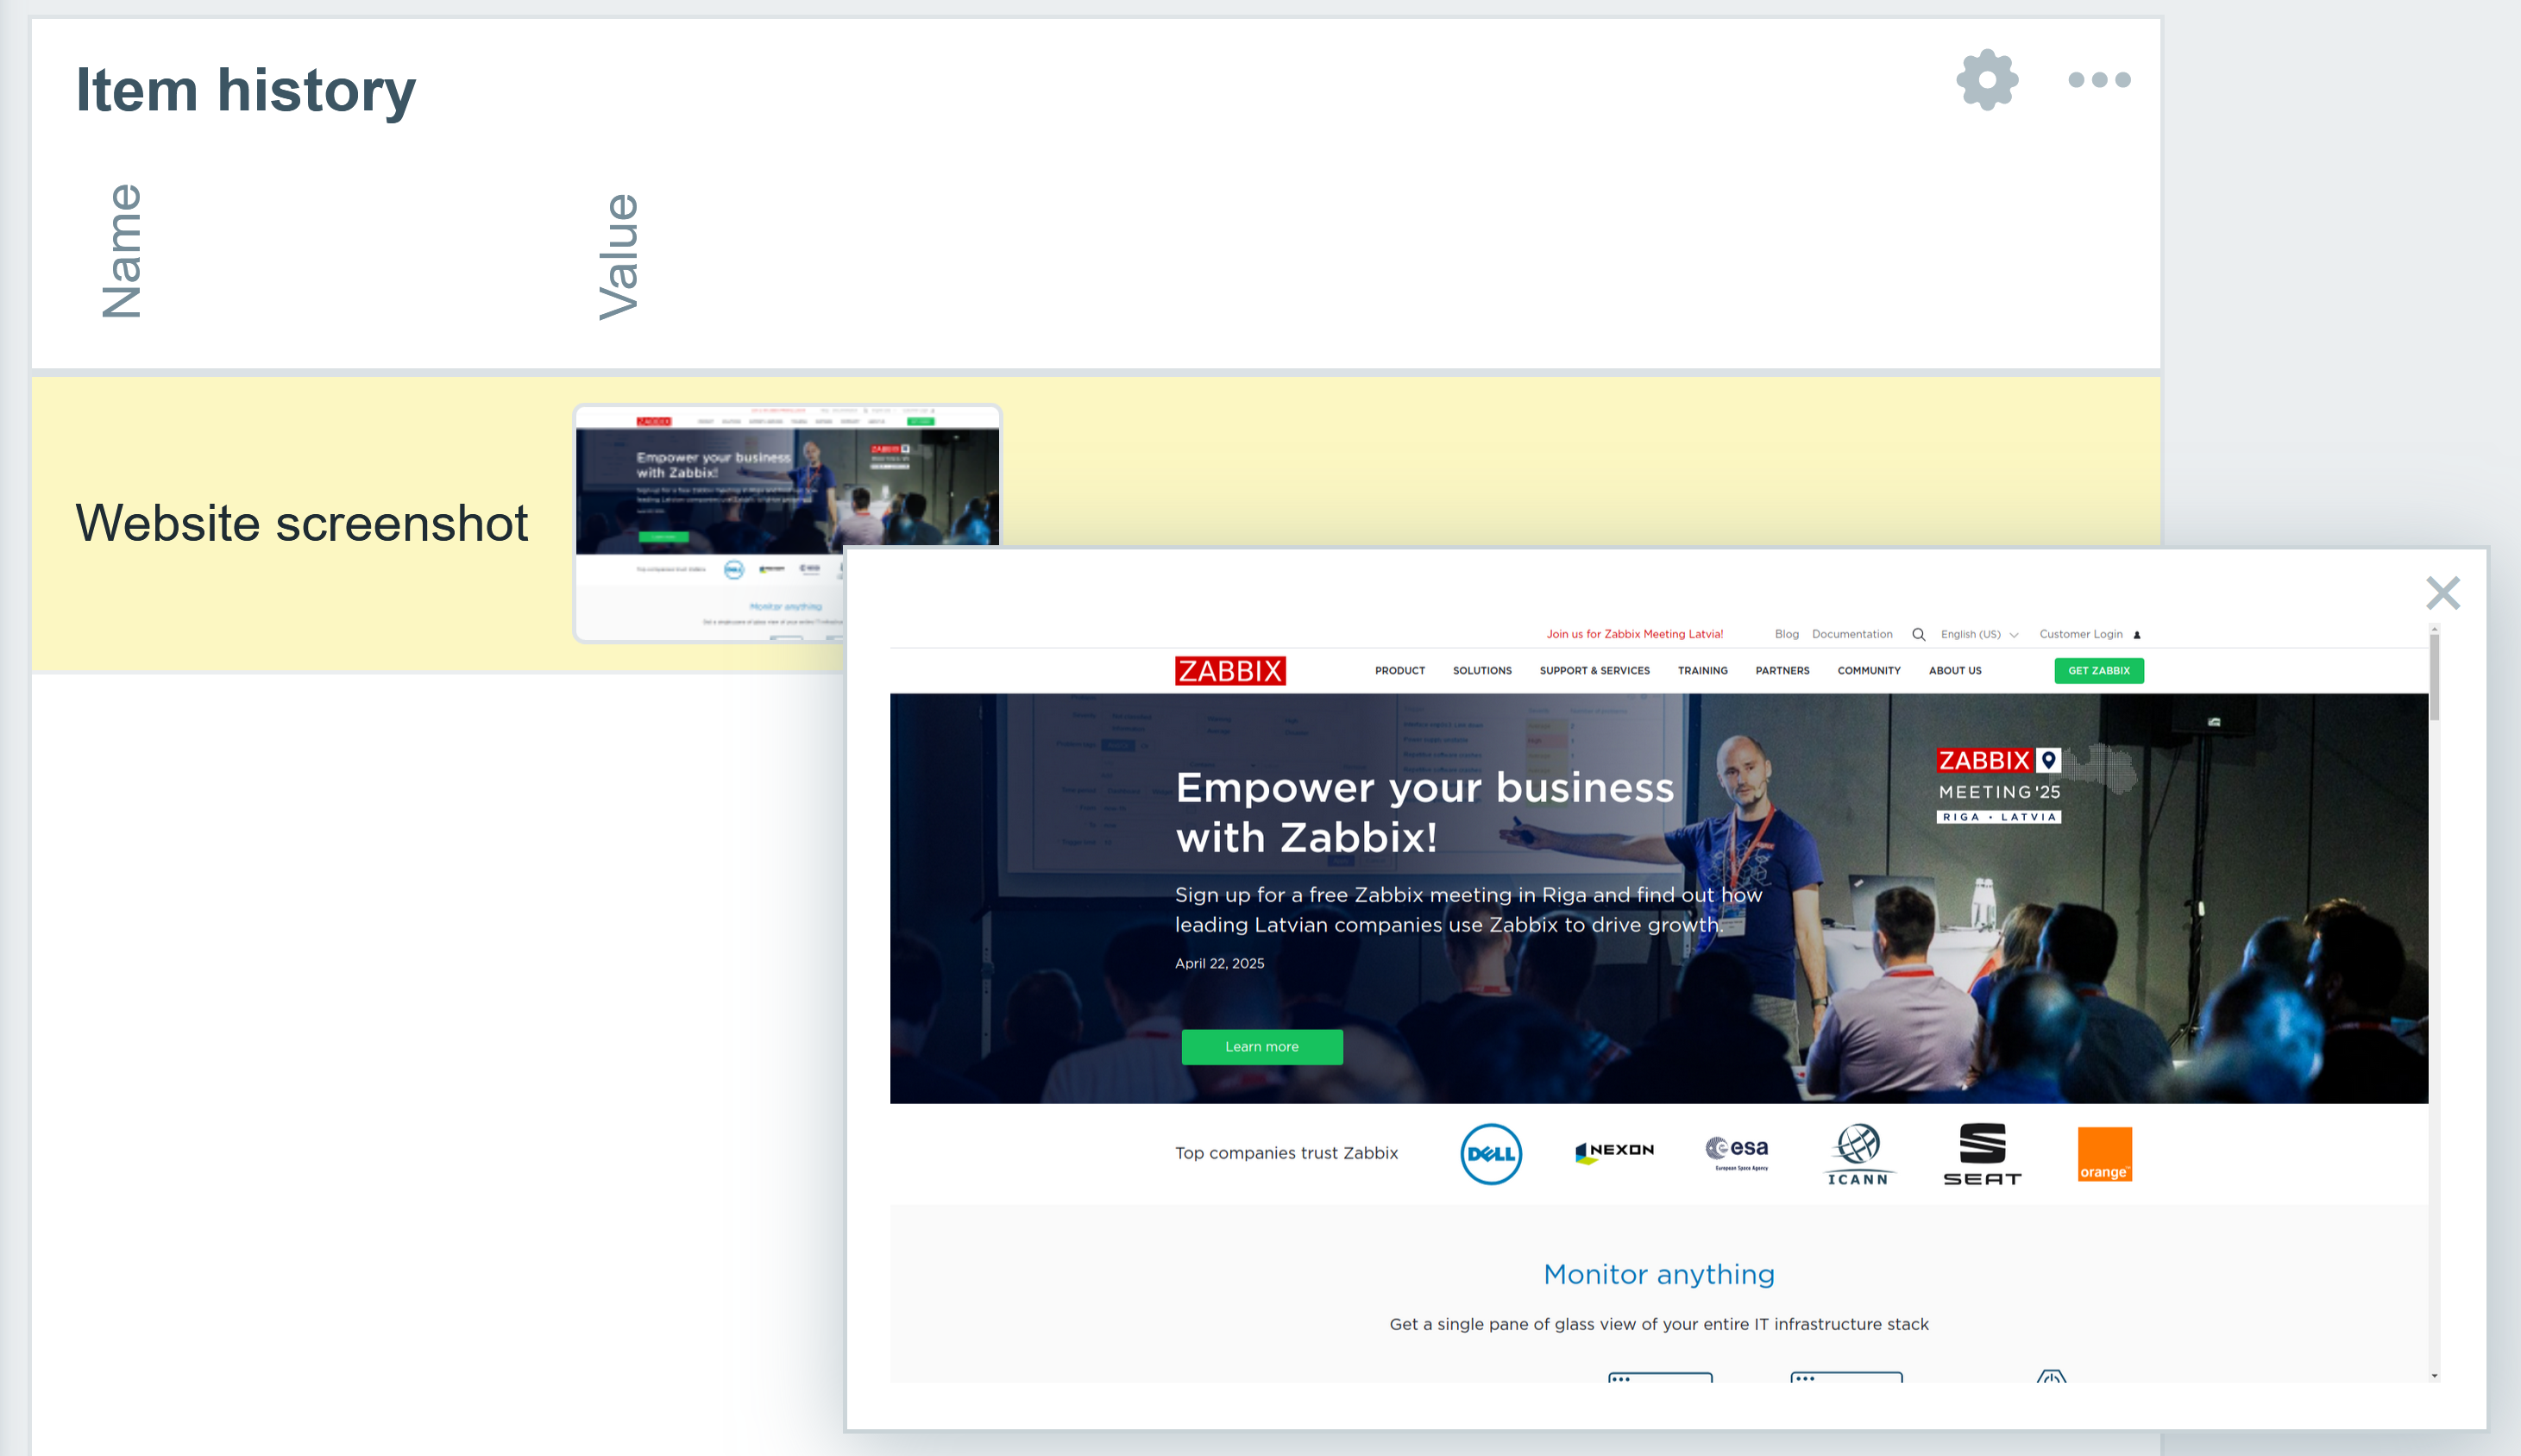
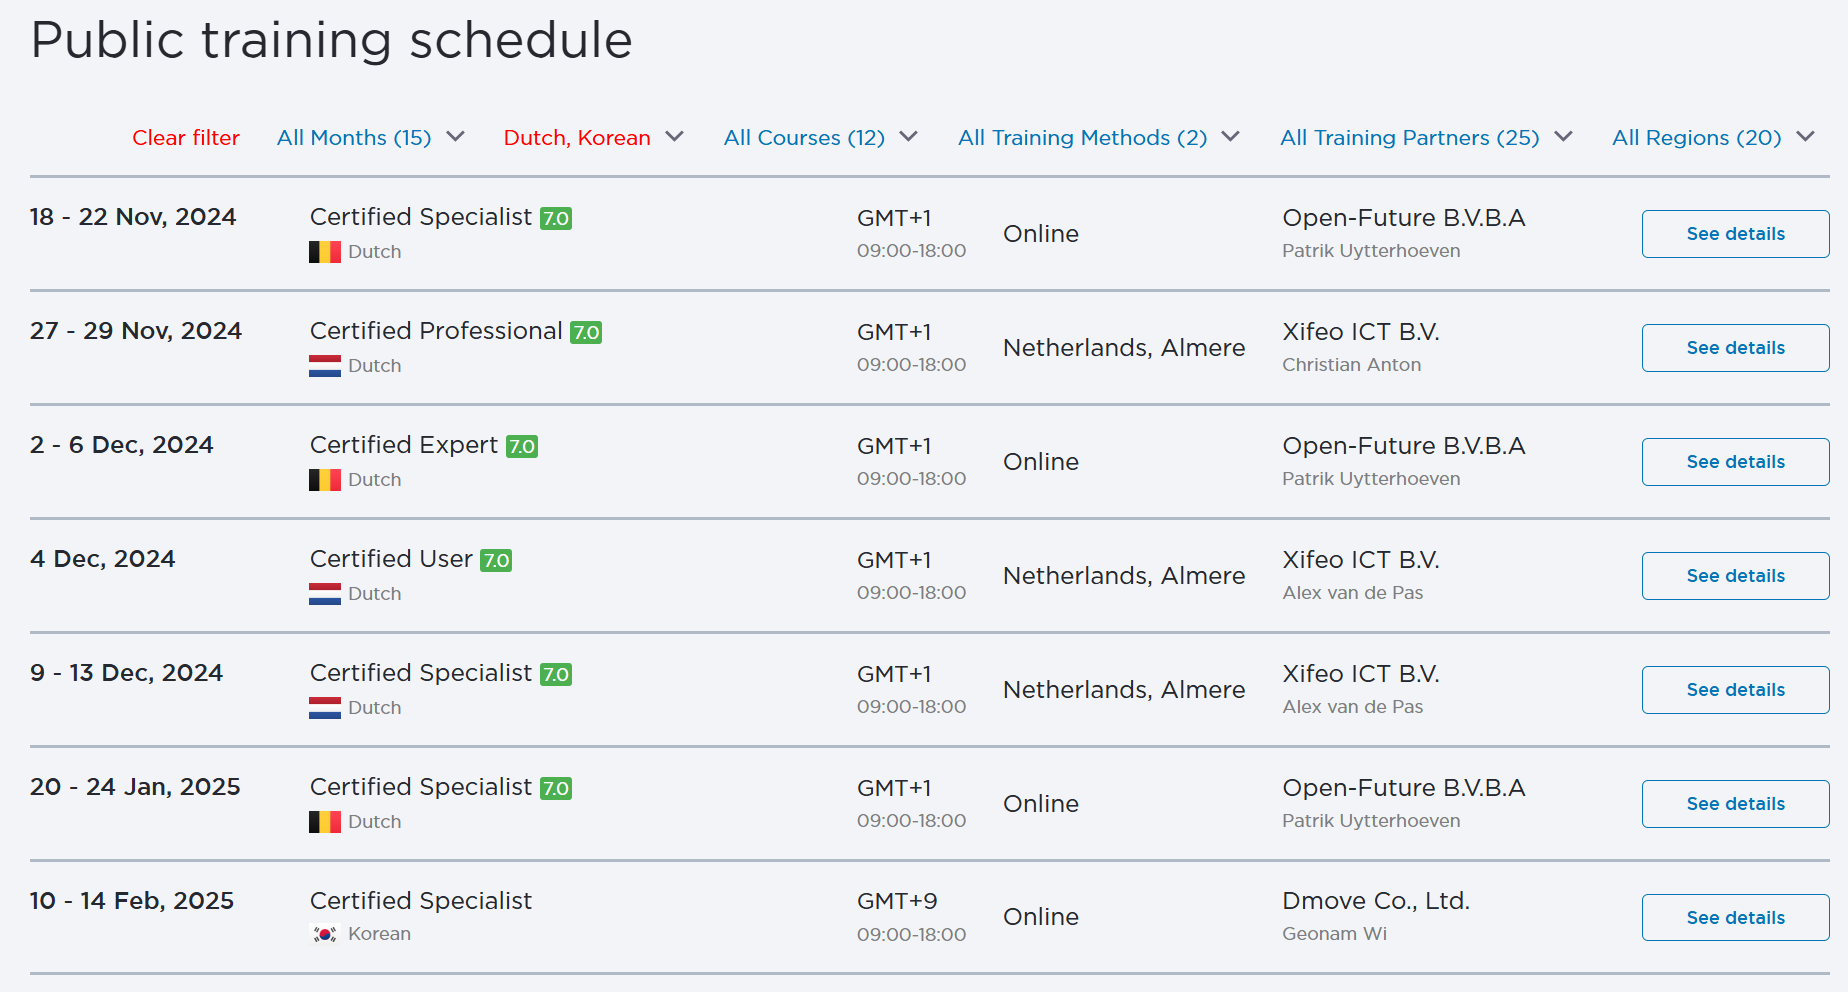
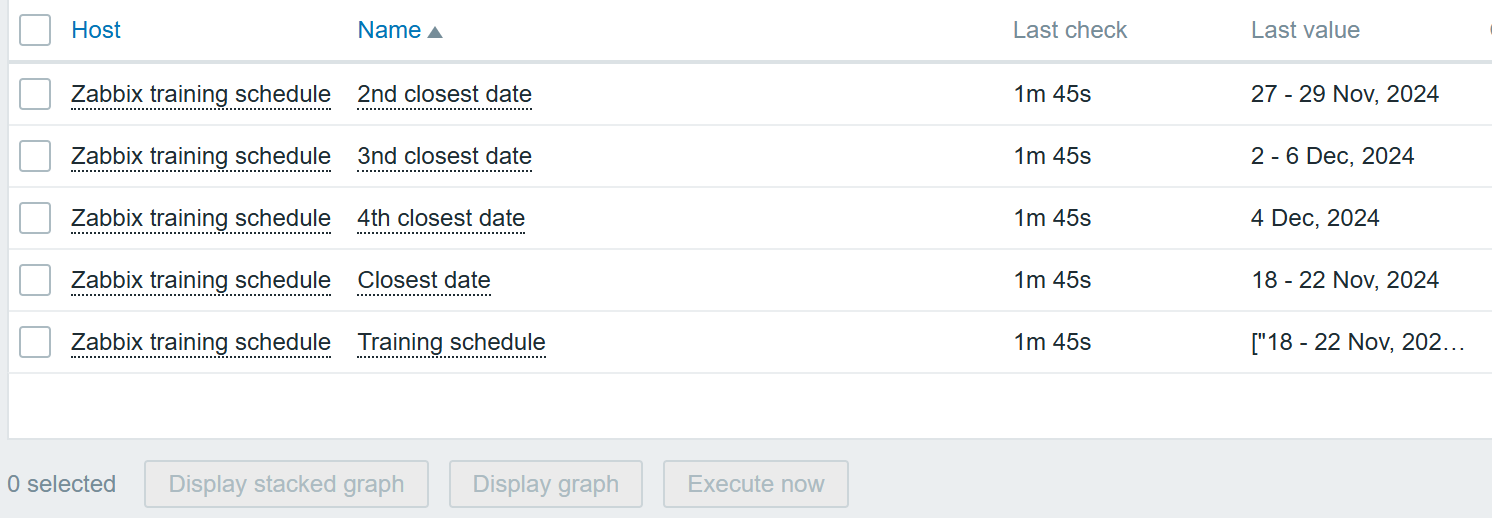
Fig. 21. Screenshot of the monitored website
SNMP traps
For the snmptraps to work, the same directory must be shared among the zabbix-server and zabbix-snmptrap container. On the Zabbix-server side, you need to explicitly set snmp environment variable ZBX_ENABLE_SNMP_TRAPS to true and mount directory /var/lib/zabbix/snmptraps.
You also need to add the same volume to the snmptrap container.
And run the snmptraps container (make sure there is no permission issue for the directory)
docker run --name zabbix-snmptraps -t \
-v /var/lib/zabbix/snmptraps:/var/lib/zabbix/snmptraps:rw \
--network=zabbix-net \
-p 162:1162/udp \
--restart unless-stopped \
-d zabbix/zabbix-snmptraps:alpine-7.2-latest

Fig. 22. Received SNMP trap message
Scheduled reports
You can also easily configure scheduled reports by adding 2 additional environment variables to the Zabbix-server. In my case, both of these containers are in the same custom user network, therefore I will use the container name zabbix-web-service in the ZBX_WEBSERVICEURL option.
ZBX_STARTREPORTWRITERS=5
ZBX_WEBSERVICEURL=http://zabbix-web-service:10053/report
Start the Zabbix-web service, specify also these 2 parameters (you can skip those if defaults are used). You can also allow any incoming connections by setting ZBX_ALLOWEDIP=0.0.0.0/0. We discourage this, however.
ZBX_ALLOWEDIP=zabbix-server-mysql
ZBX_LISTENPORT=10053
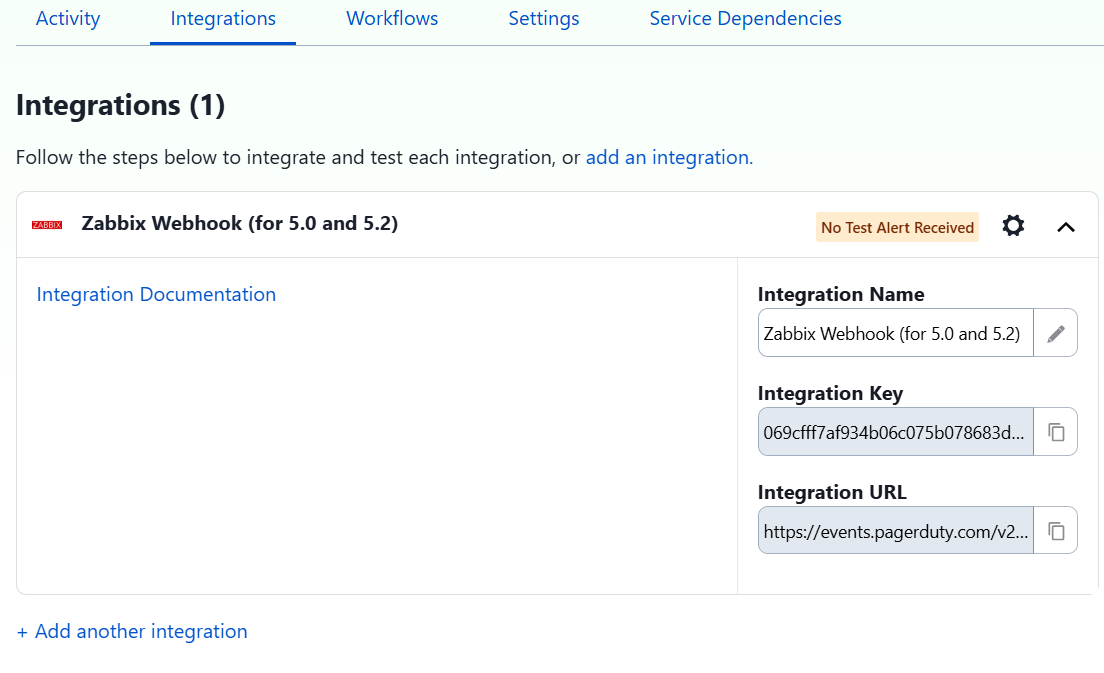
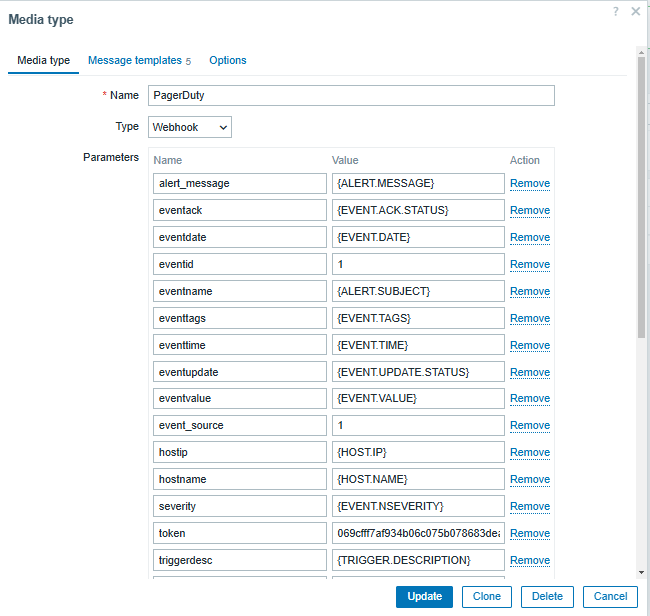
Before testing scheduled reports, make sure you have enabled and configured the email media type.

Fig. 23. Configured and enabled media type
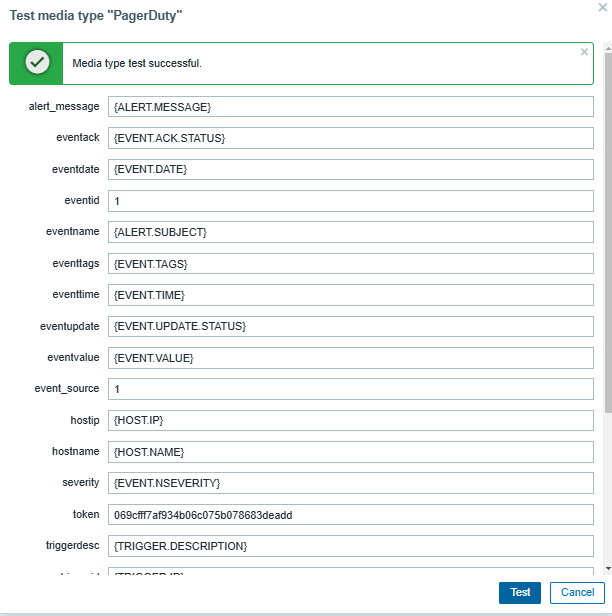
It is also encouraged to test it and check that you have received the test email.

Fig. 24. Successful media type test response

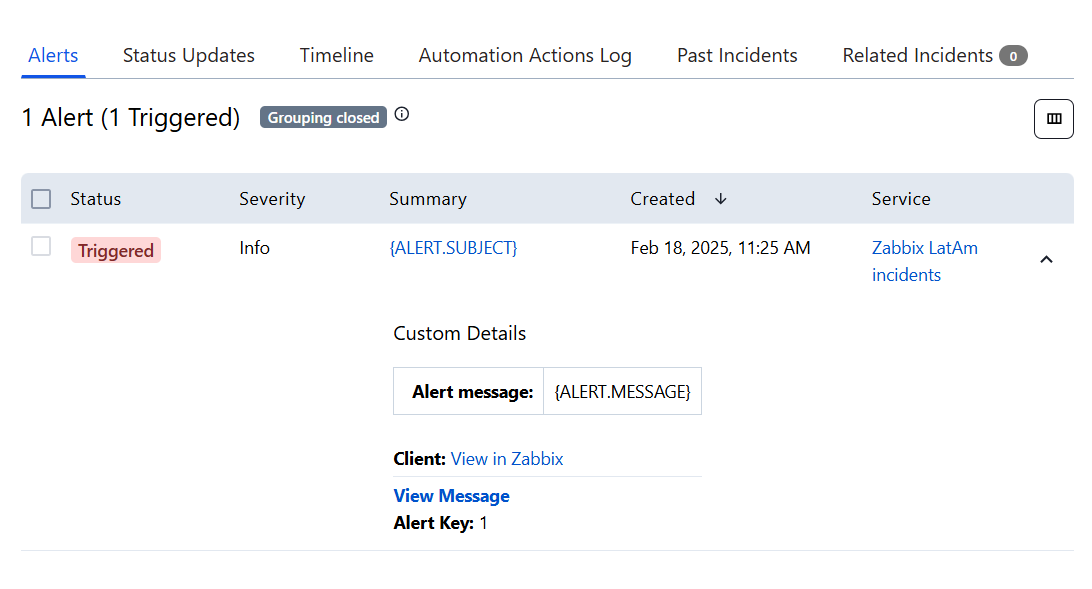
Fig. 25. Received test response on the selected media type.
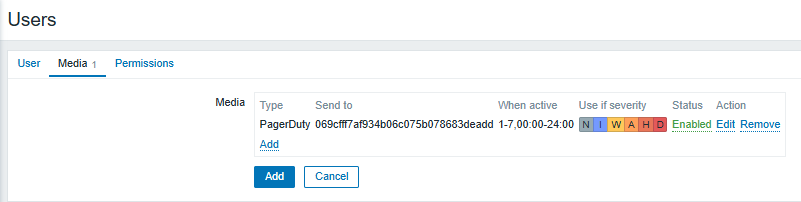
Next, configure the user media where the scheduled report will be sent.

Fig. 26.Media type defined for the user
Last, but not least, set the frontend URL in the section Administration/General/Other section. In my case, I set the container name of the frontend and specify the port.
for Apache: http://<server_ip_or_name>/zabbix
for Nginx: http://<server_ip_or_name>

Fig. 27. Configured frontend address for the Frontend URL option
Next, create a scheduled report based on the dashboard of your choice.

Fig. 28.Configuring scheduled report
Check that you have received the test report in your mail.

Fig. 29.Successful scheduled report test.

Fig. 30. Received scheduled report test in the email
Now you know how to set up scheduled reports!
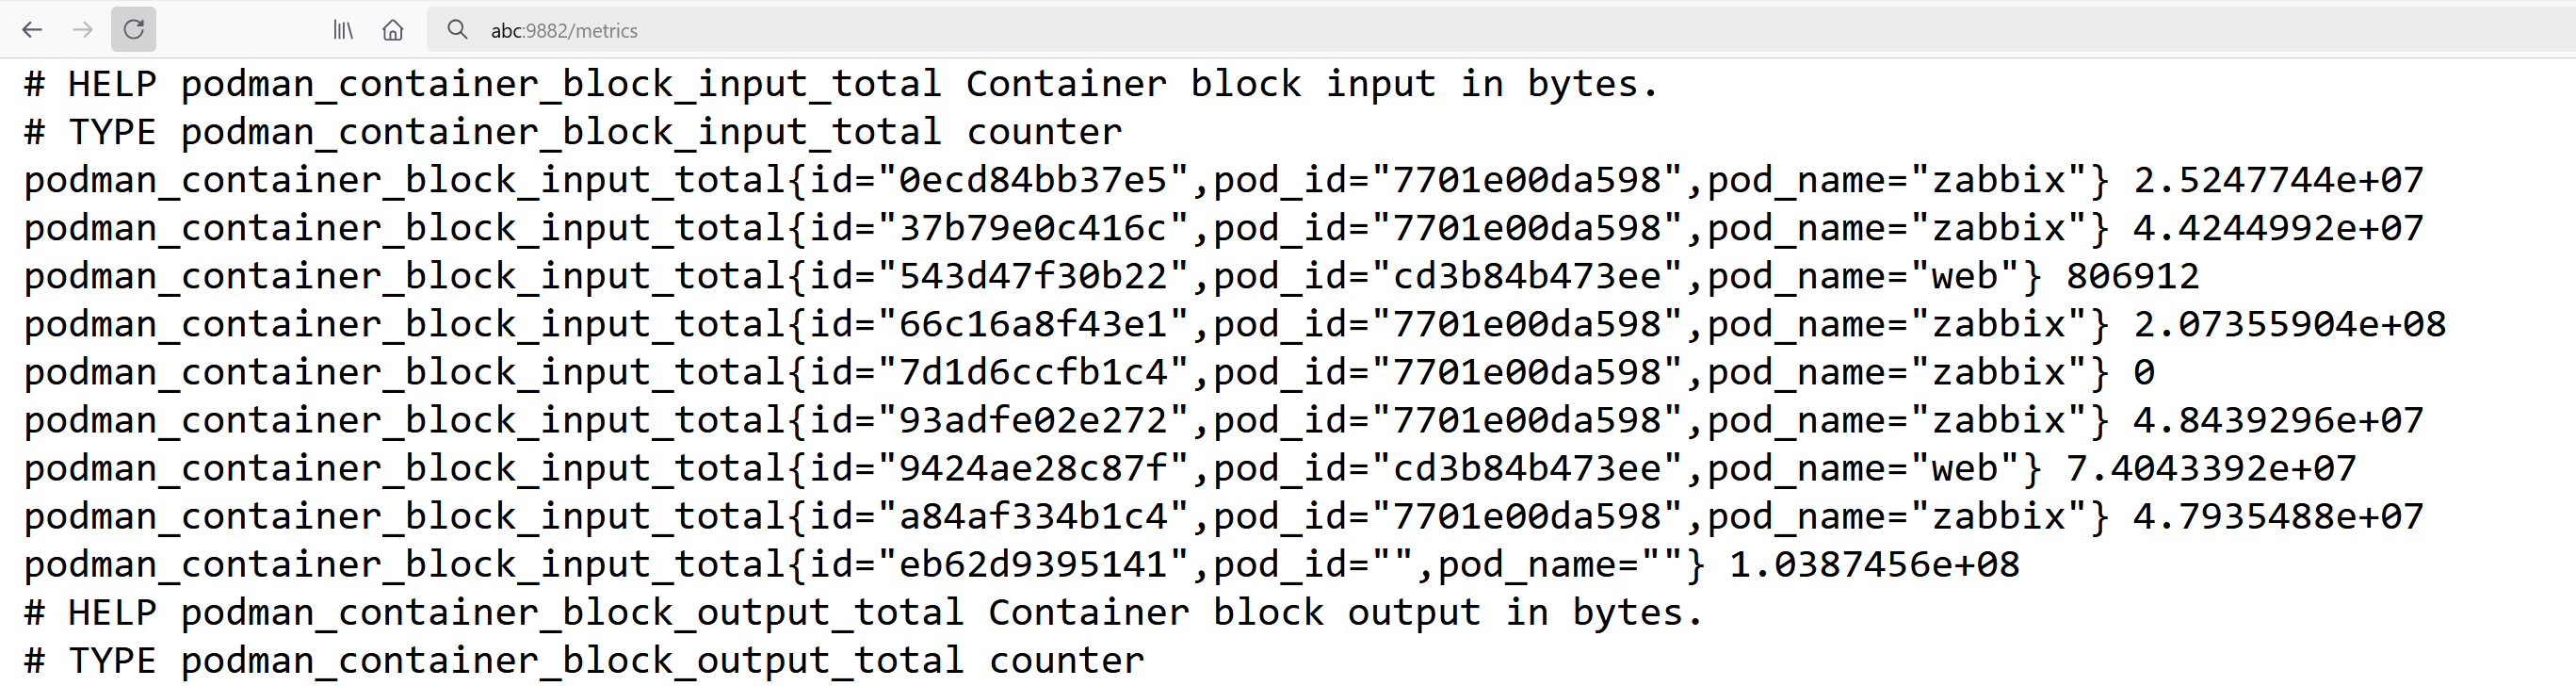
Docker container monitoring
You can also monitor Docker containers with a containerized Zabbix instance*
* Disclaimer: If docker service is not running, Zabbix monitoring will also not function and you will not receive notifications and alerts.
You can also monitor your docker instance with the Zabbix agent 2, however, you will be required to install Zabbix-agent 2 on the host either as a package or build it from the source.
You will also need to give user zabbix access to the docker.sock file. Just add user zabbix to group docker:
# usermod -aG docker zabbix
Otherwise, you will get an error message in items:
Cannot fetch data: Get "http://1.28/info": dial unix /var/run/docker.sock: connect: permission denied.
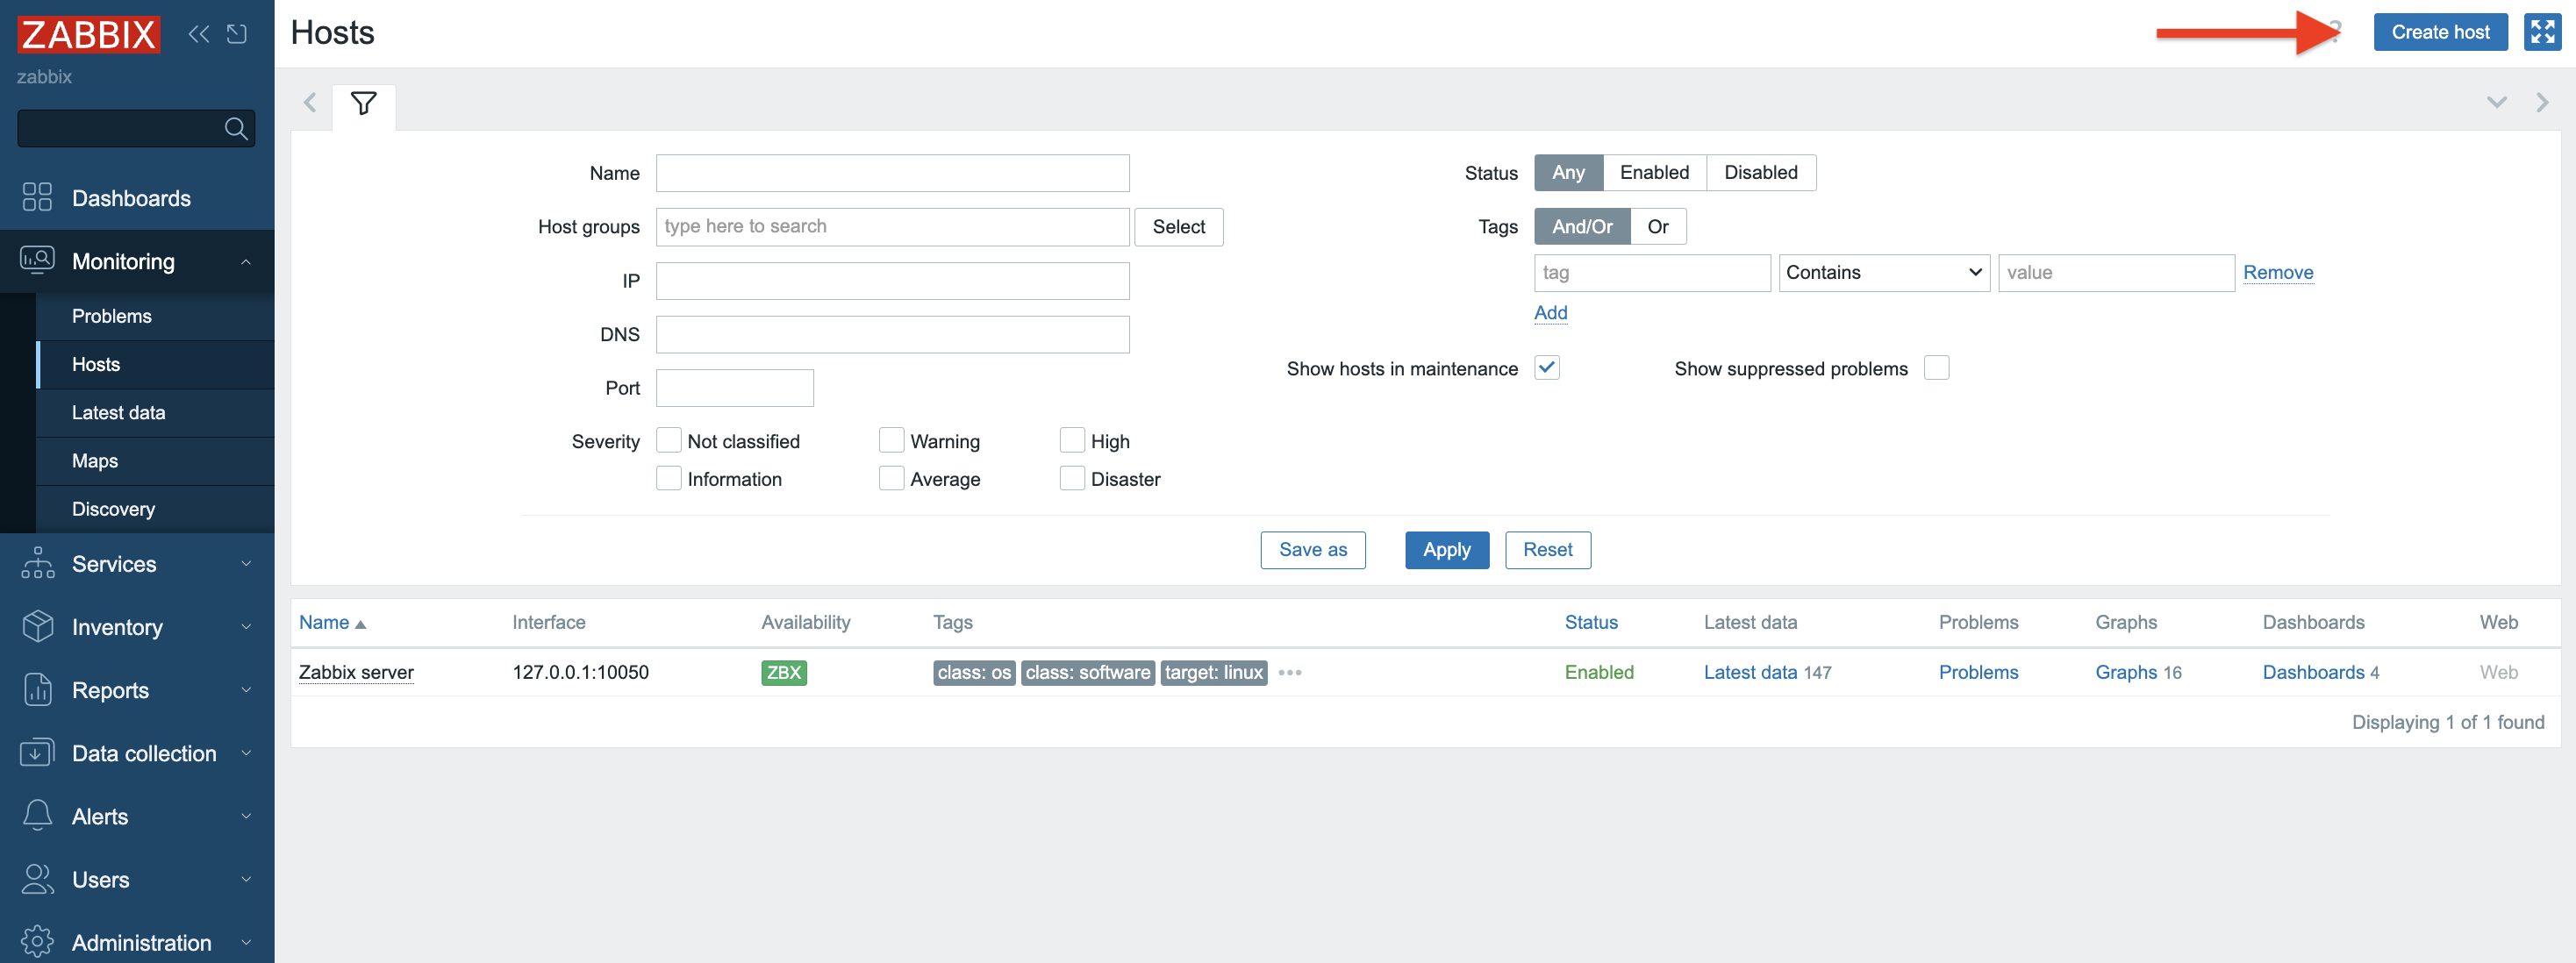
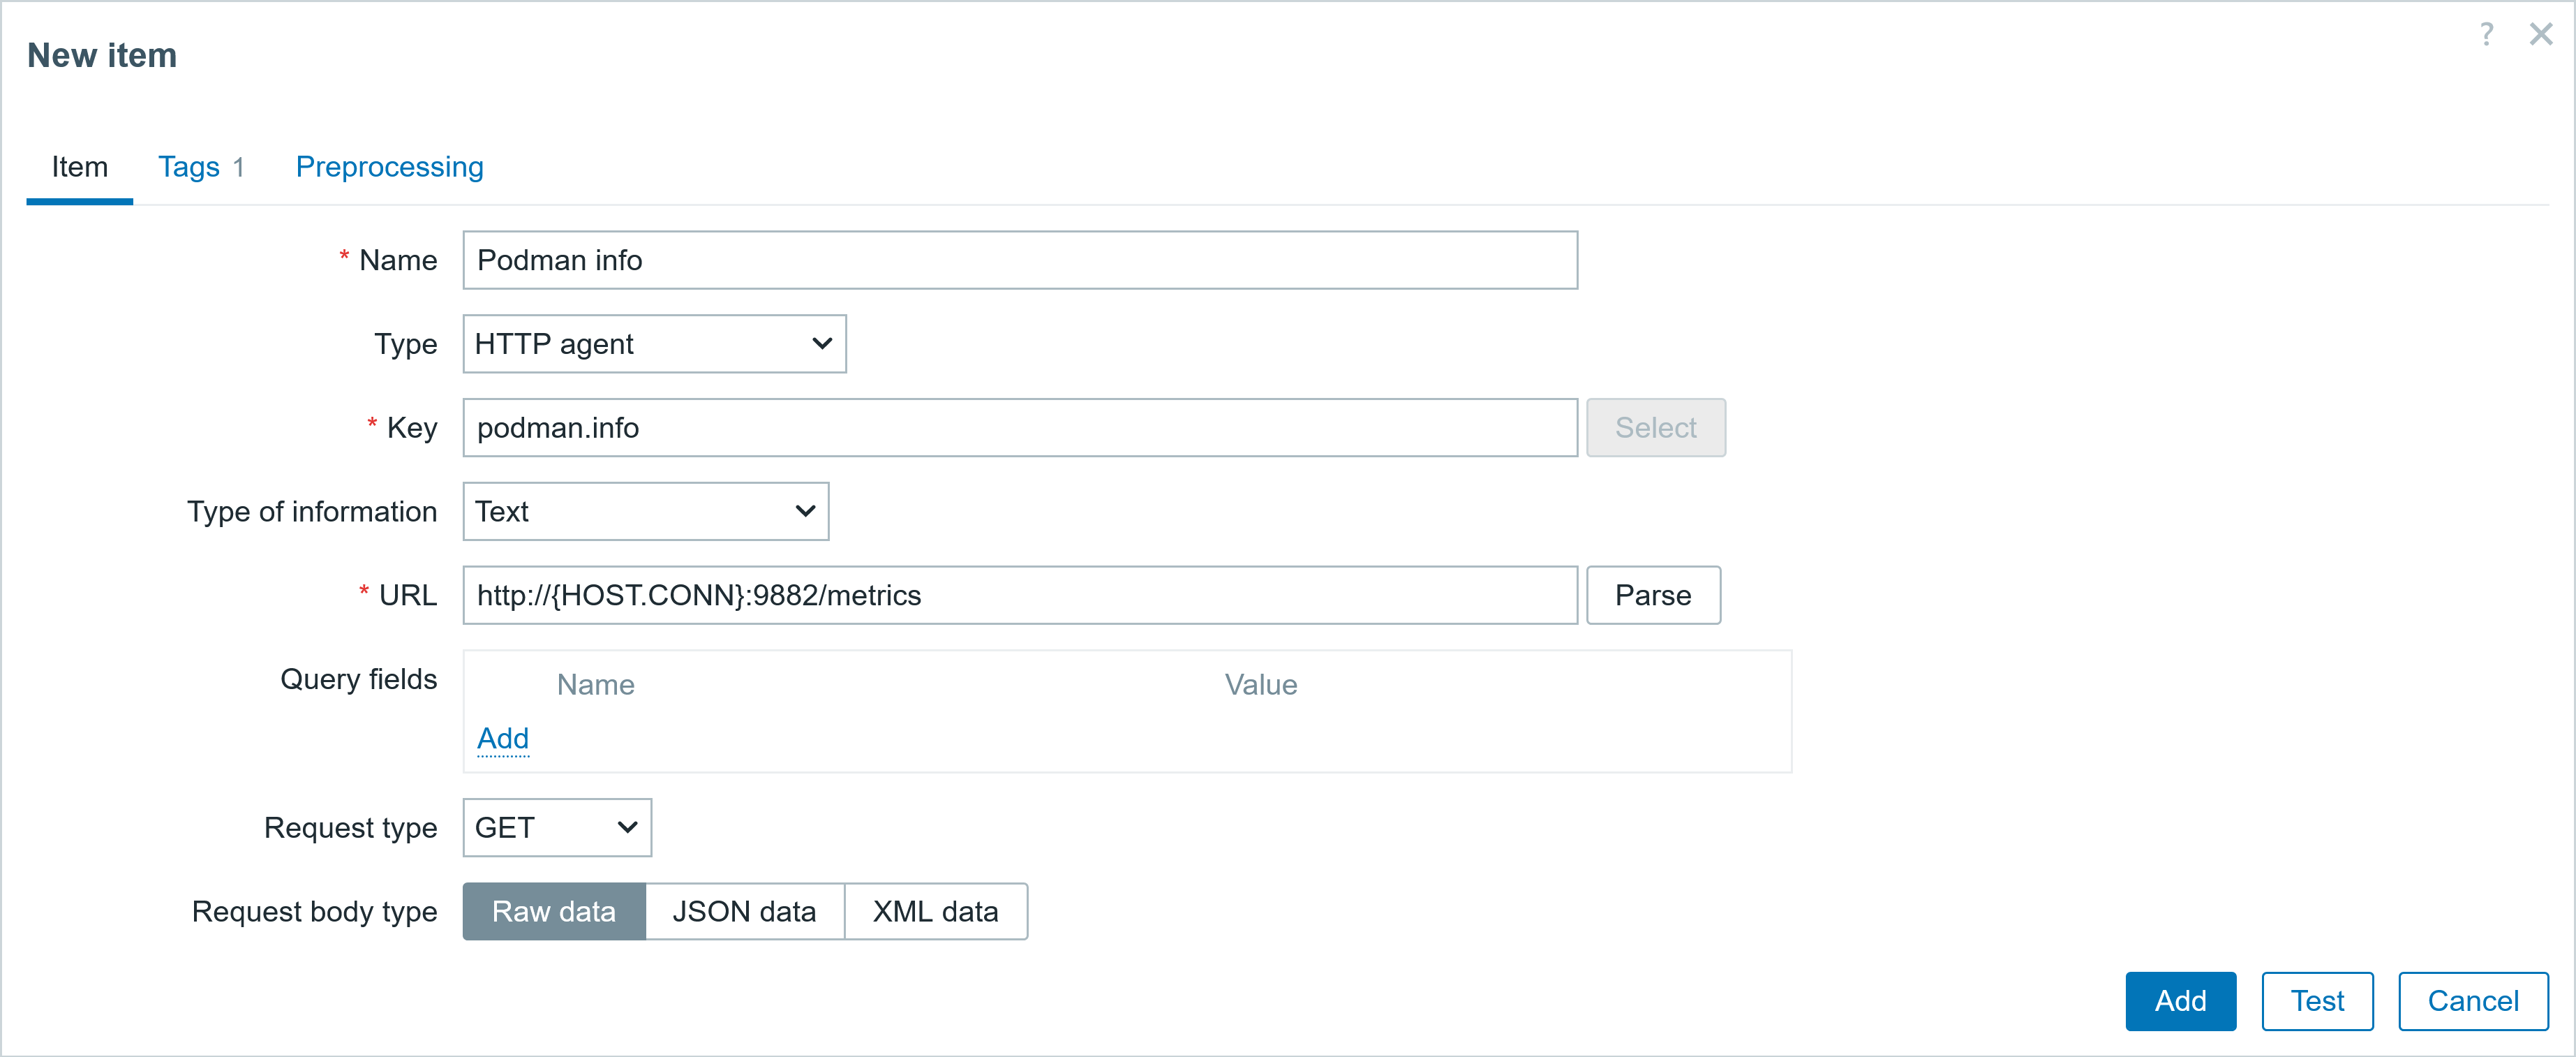
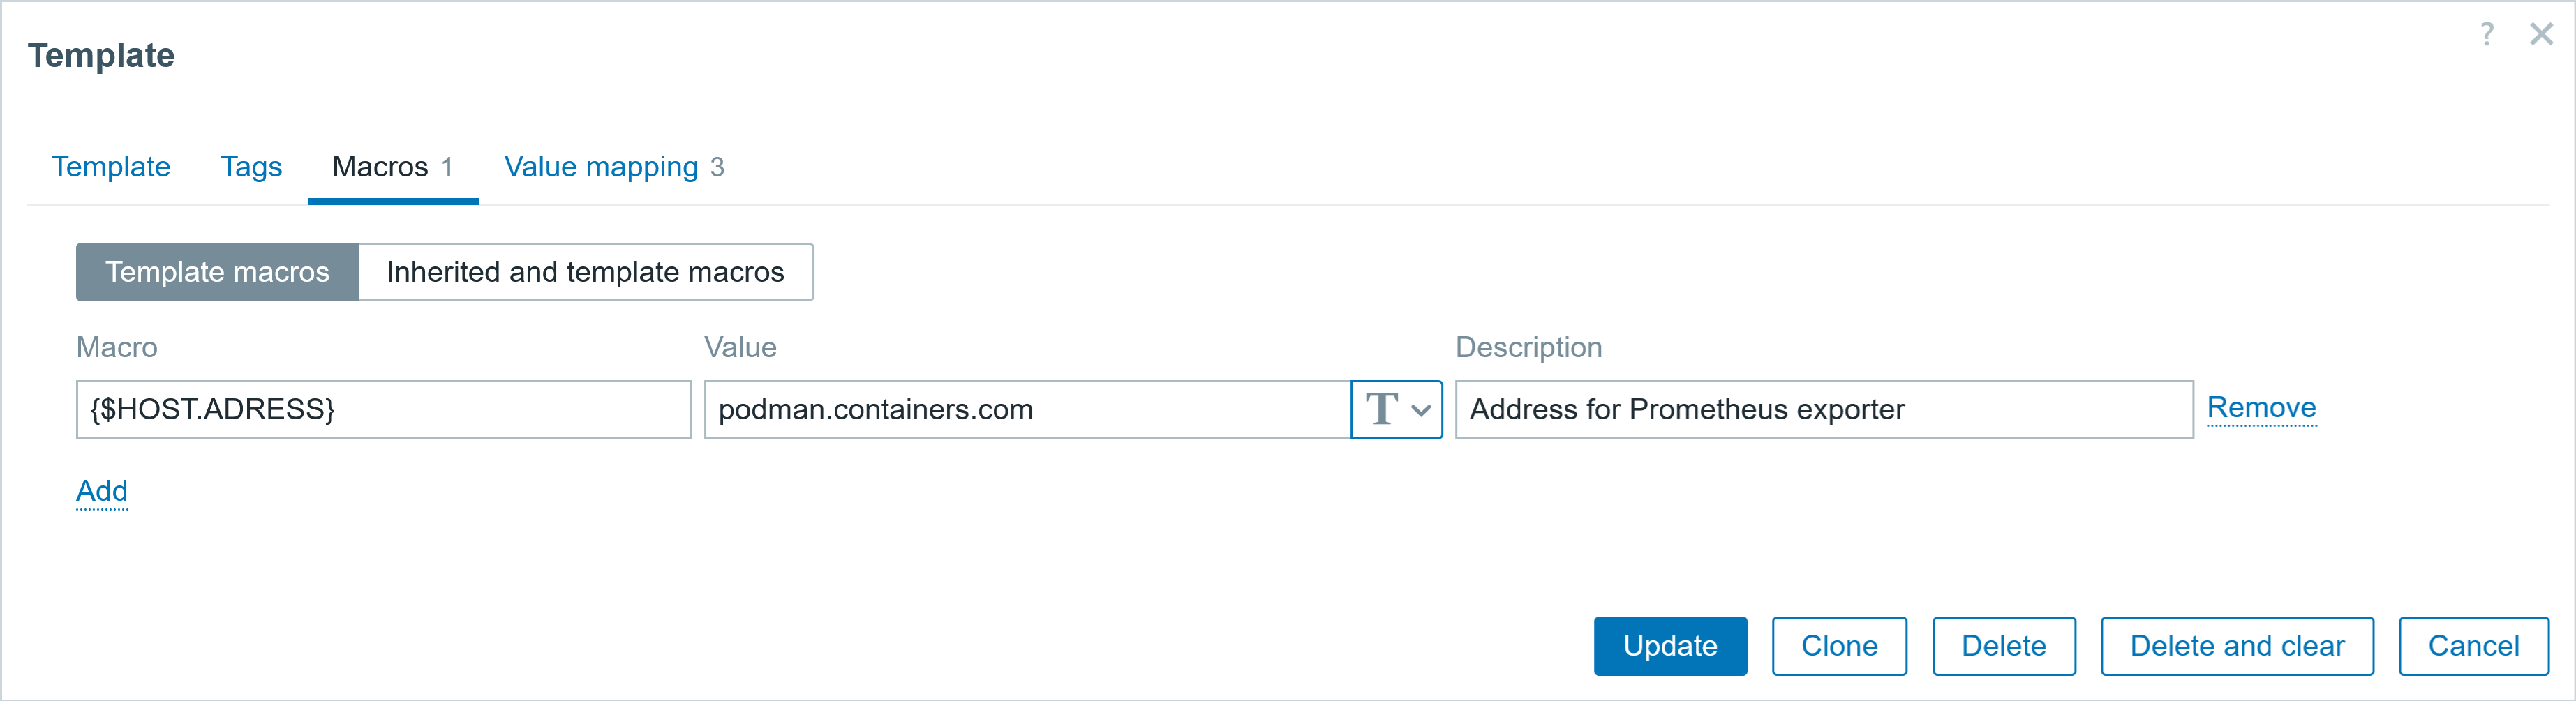
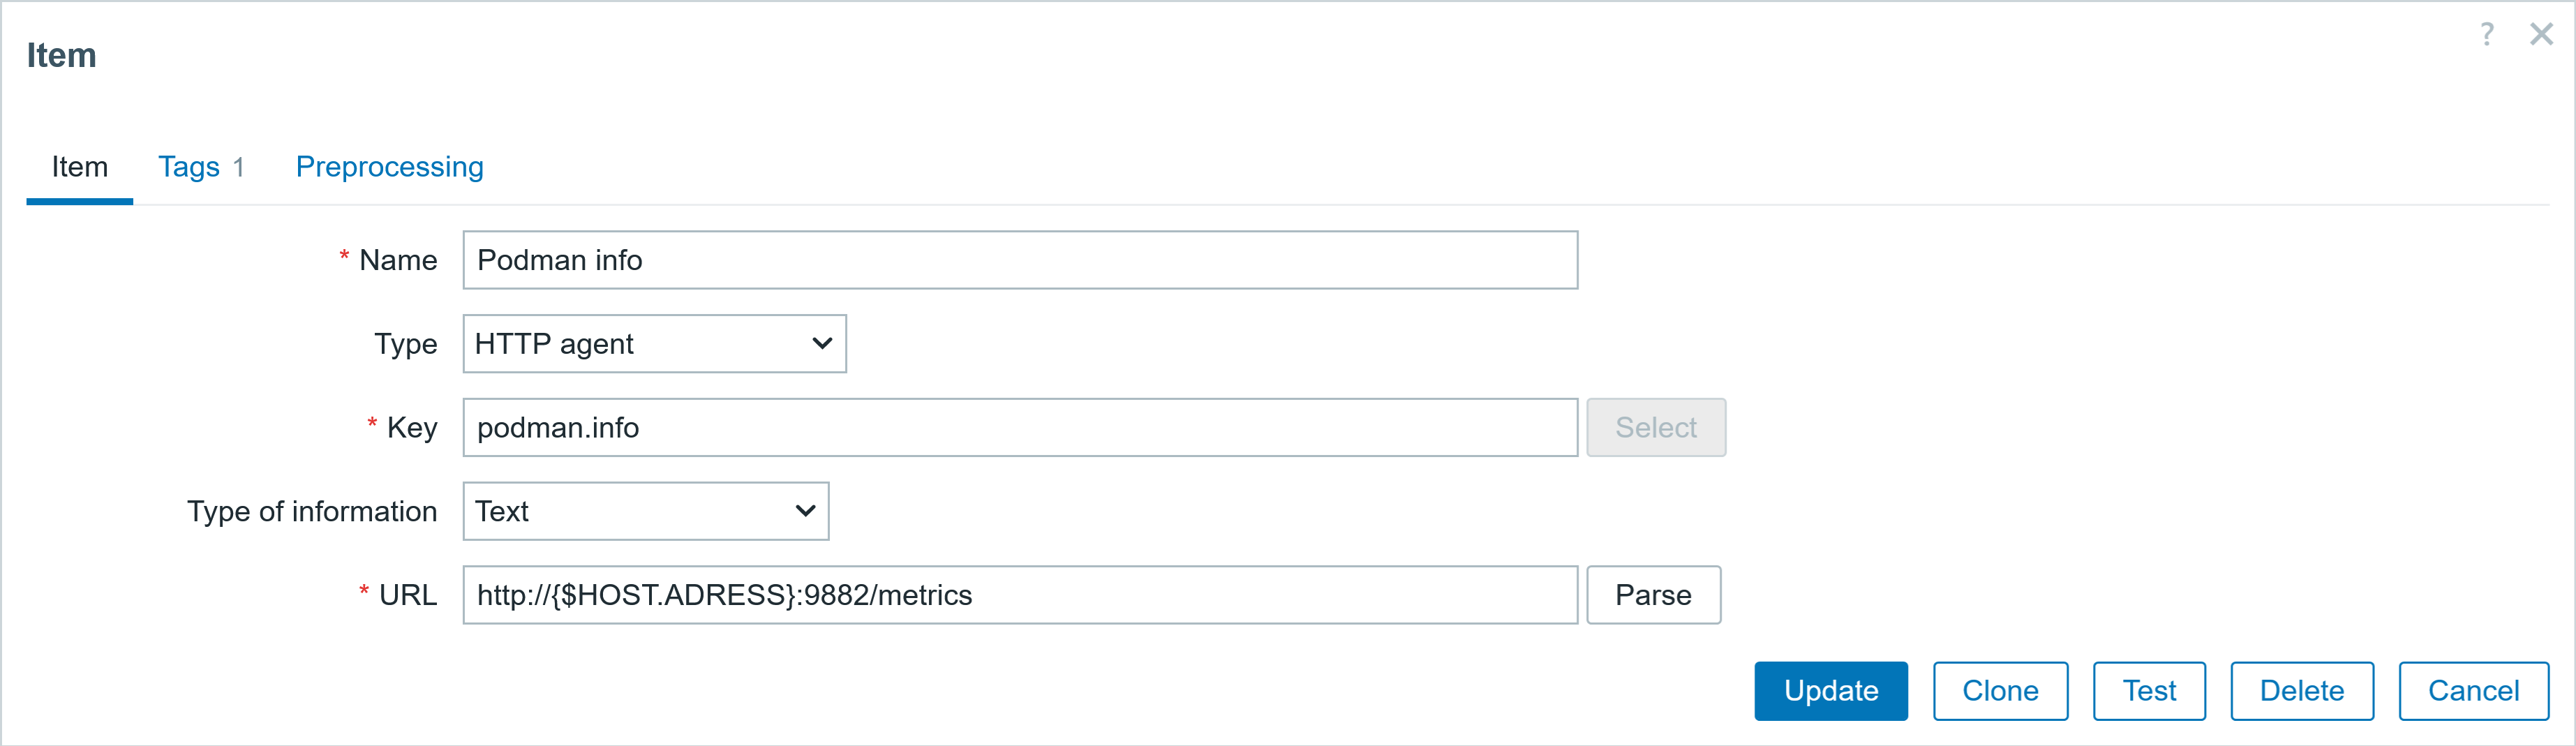
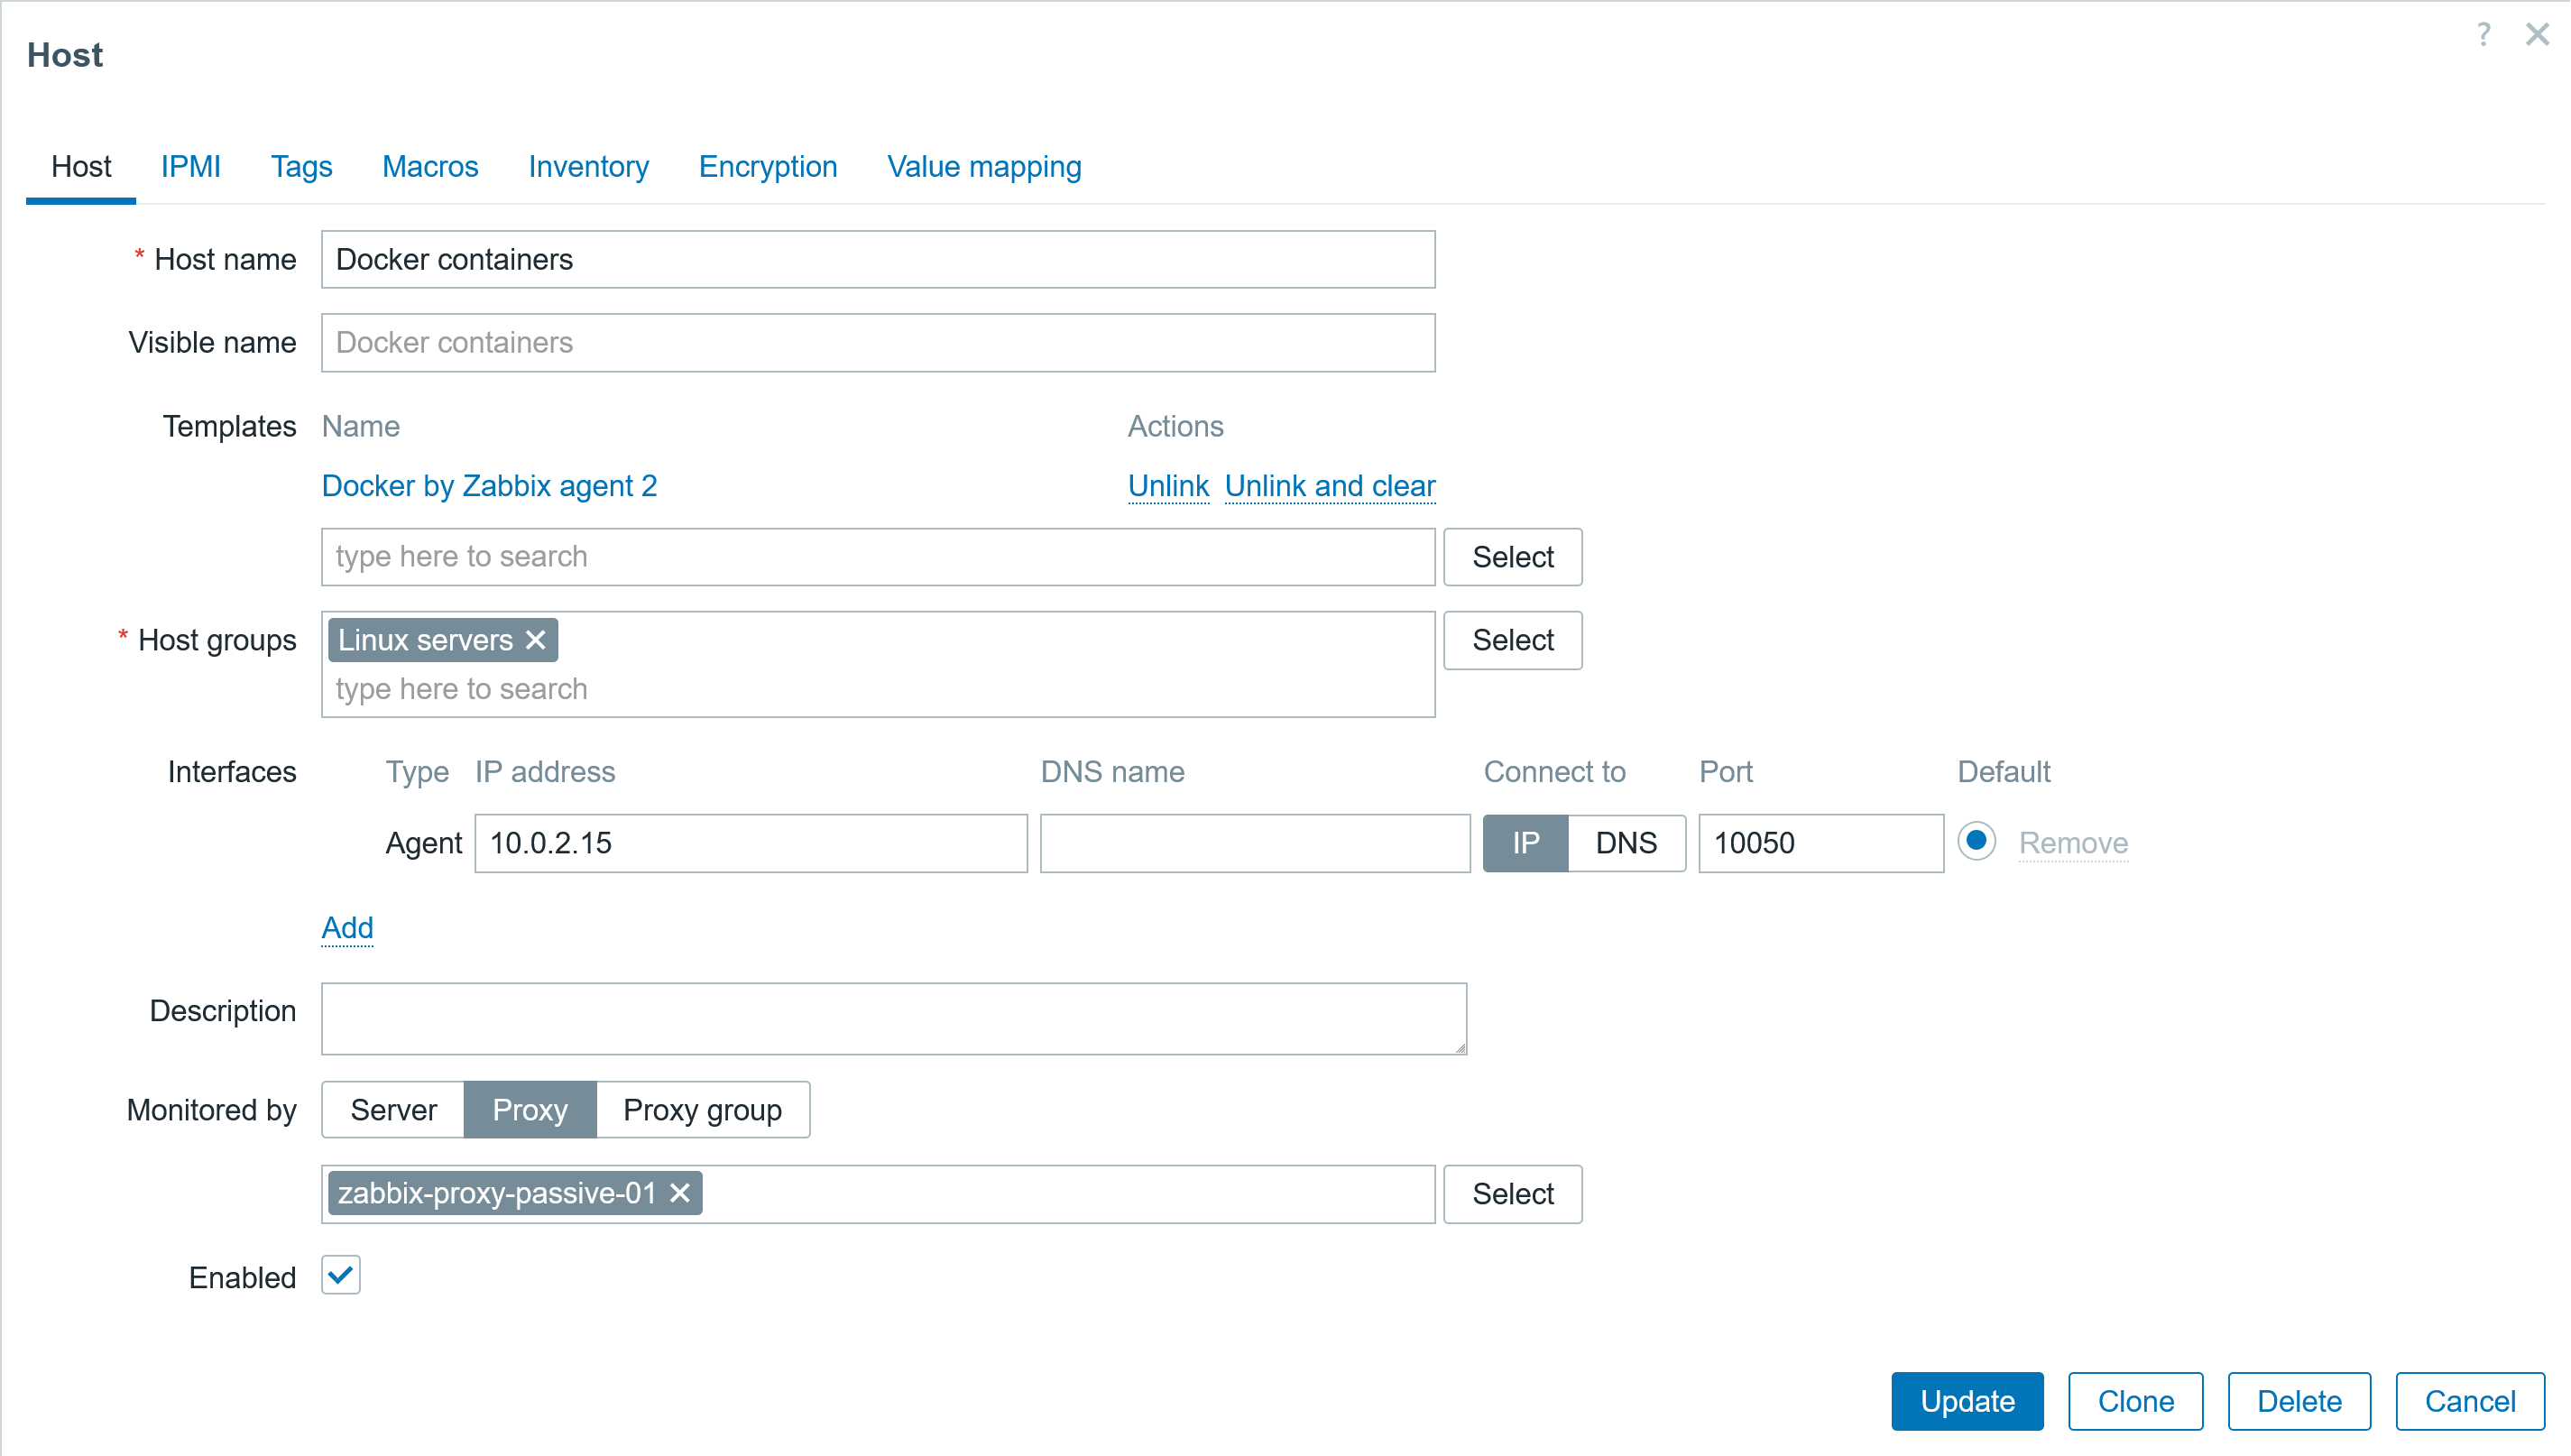
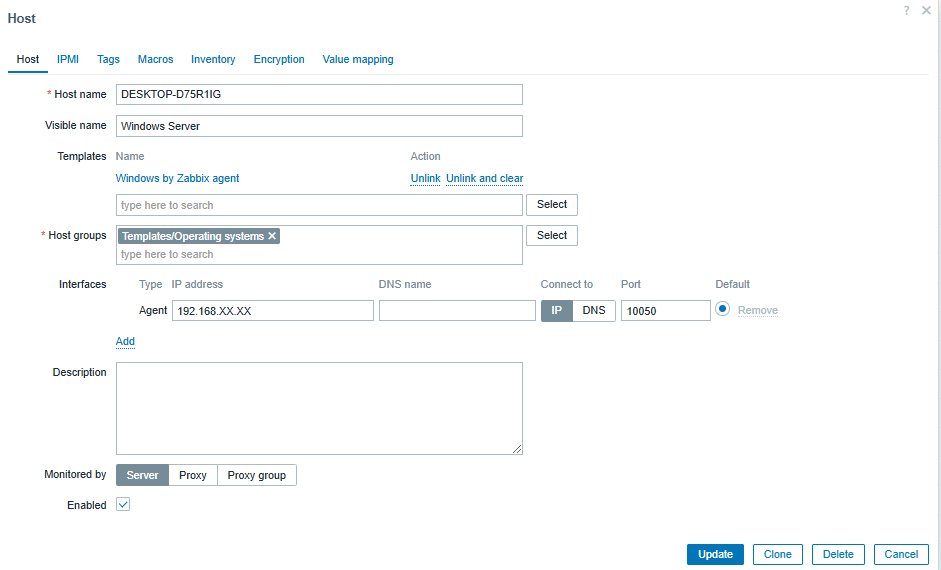
Go back to the frontend and create a Host for monitoring the docker containers:
- Link template: Docker by Zabbix agent 2
- Add host to host group
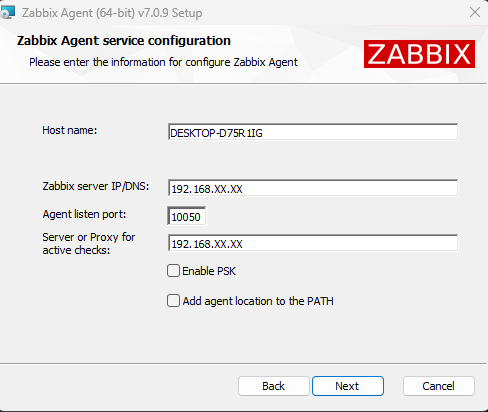
- Specify host address or dns name, set the correct connect to option, and specify the agent port (if a default port is used, then set 10050).

Fig. 31. Configuring the host for monitoring the docker container
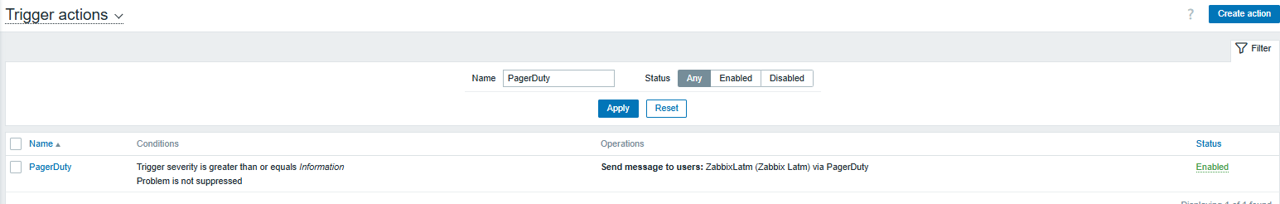
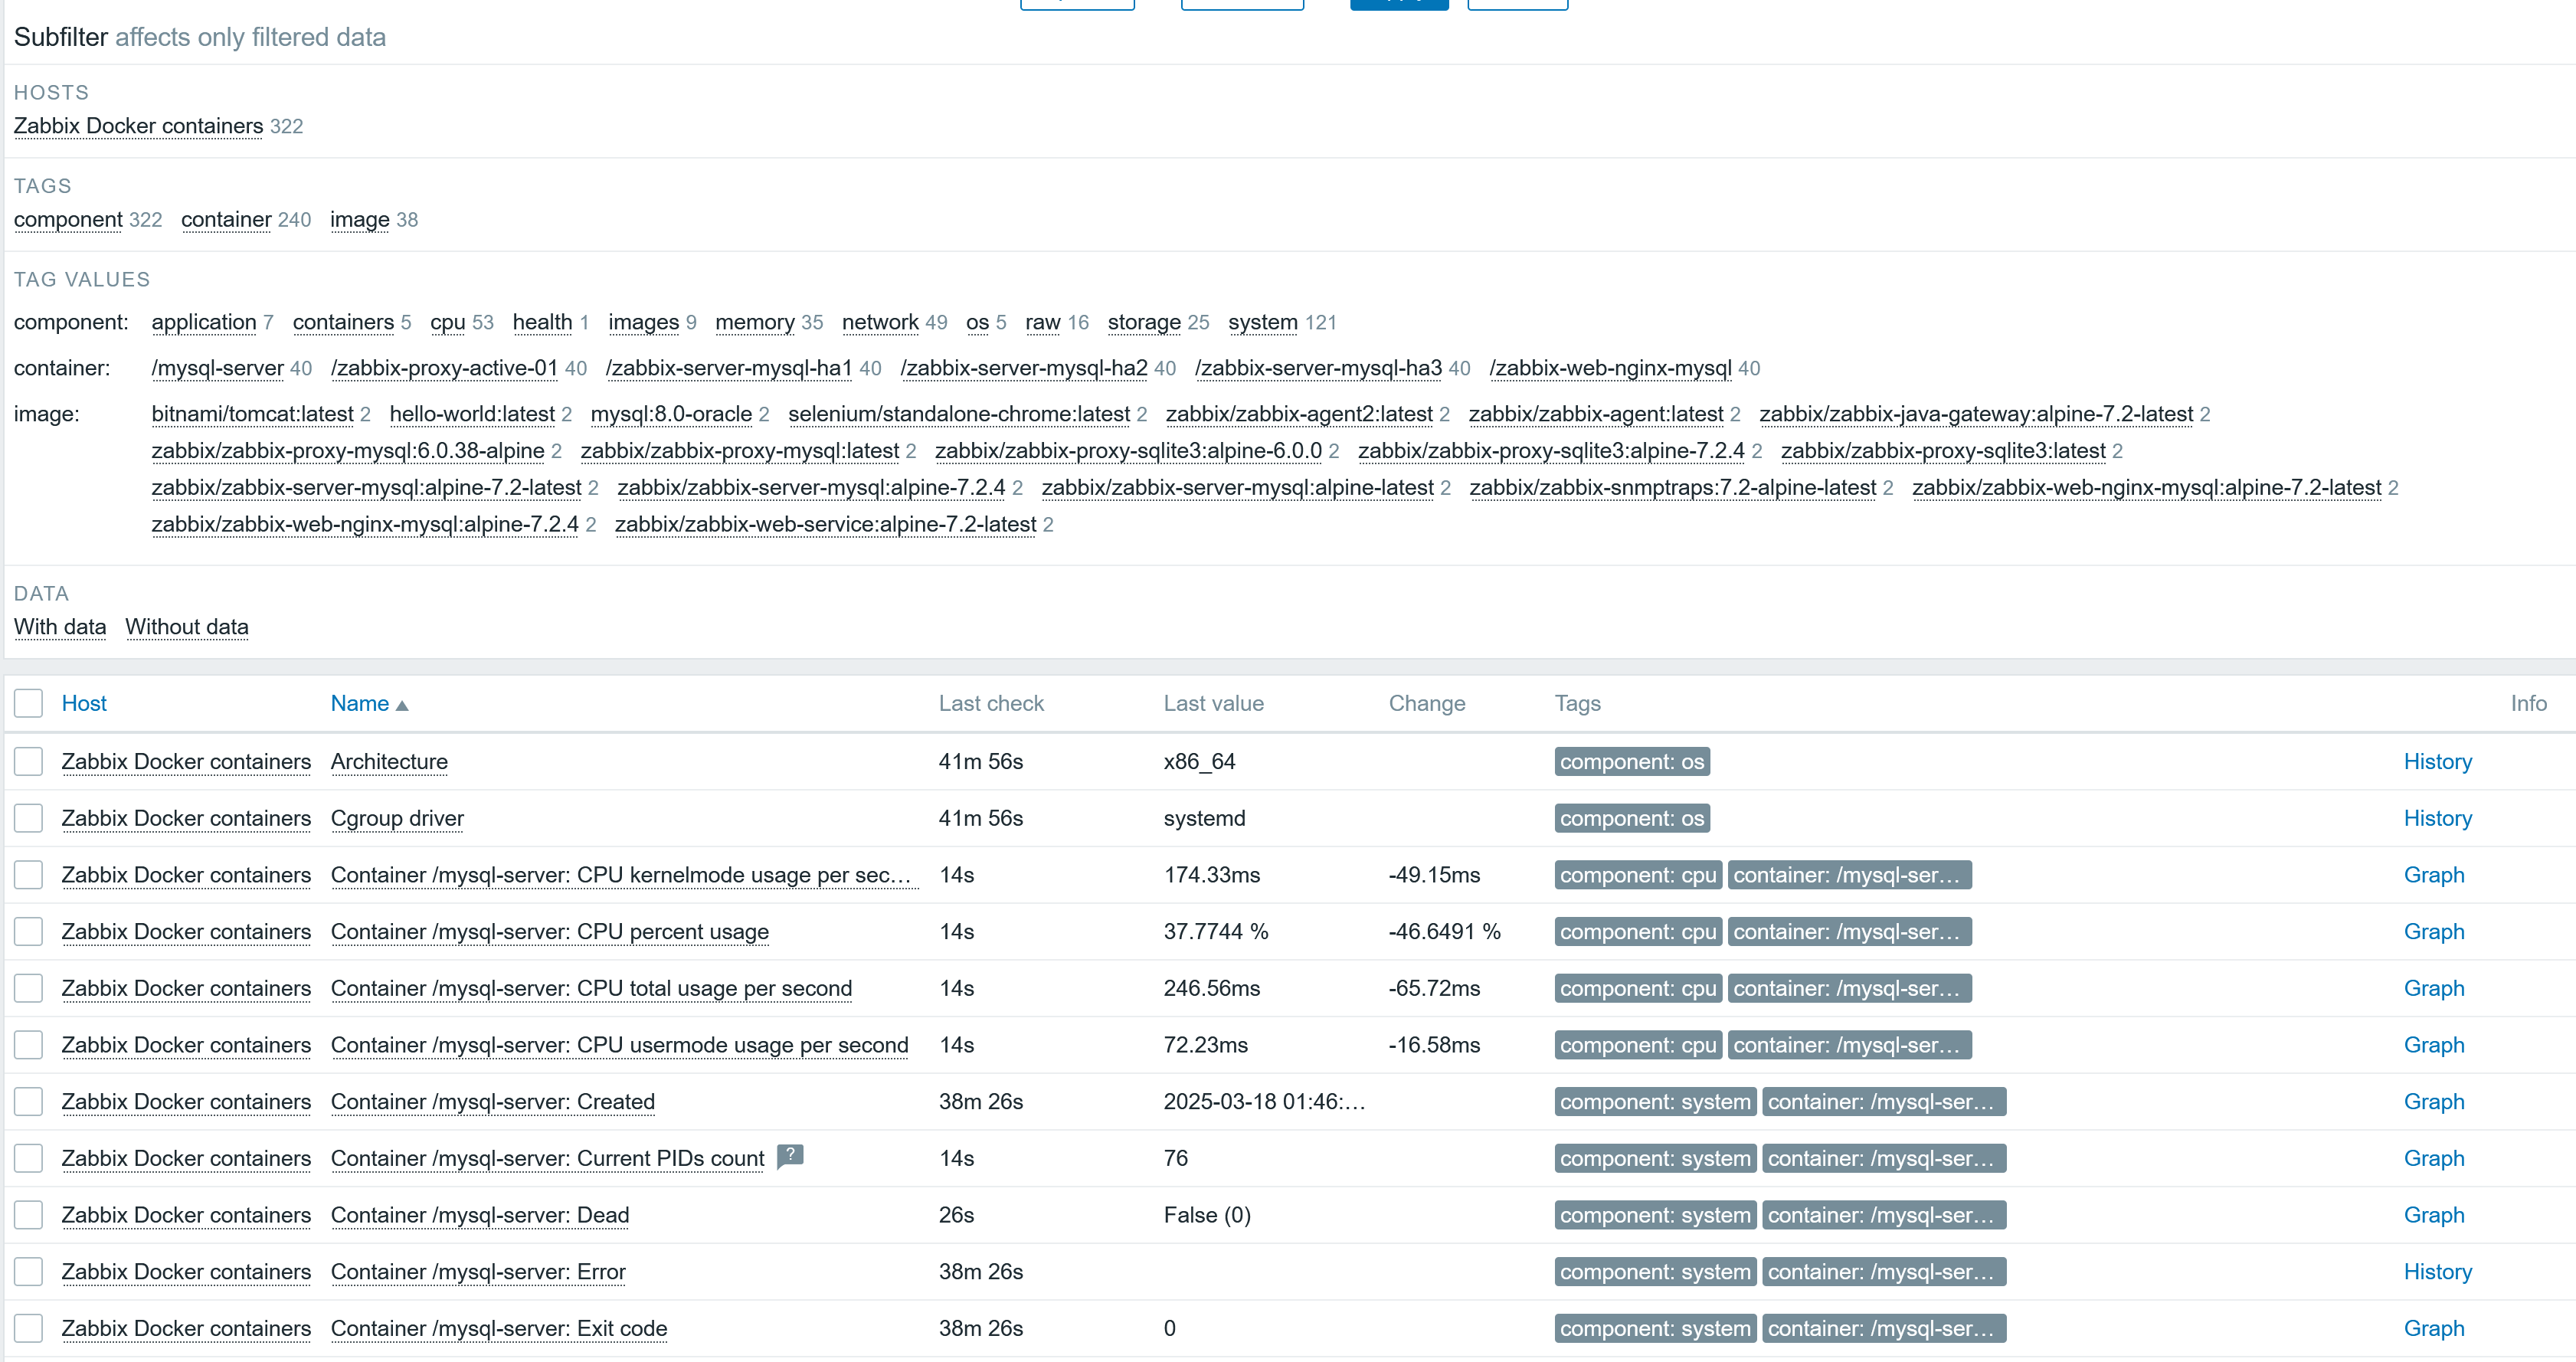
Now, if some issue happens to other containers, Zabbix will monitor them. But to be notified of an issue, don’t forget to enable and configure the media, user media, media templates, and trigger actions, so that you receive alerts.

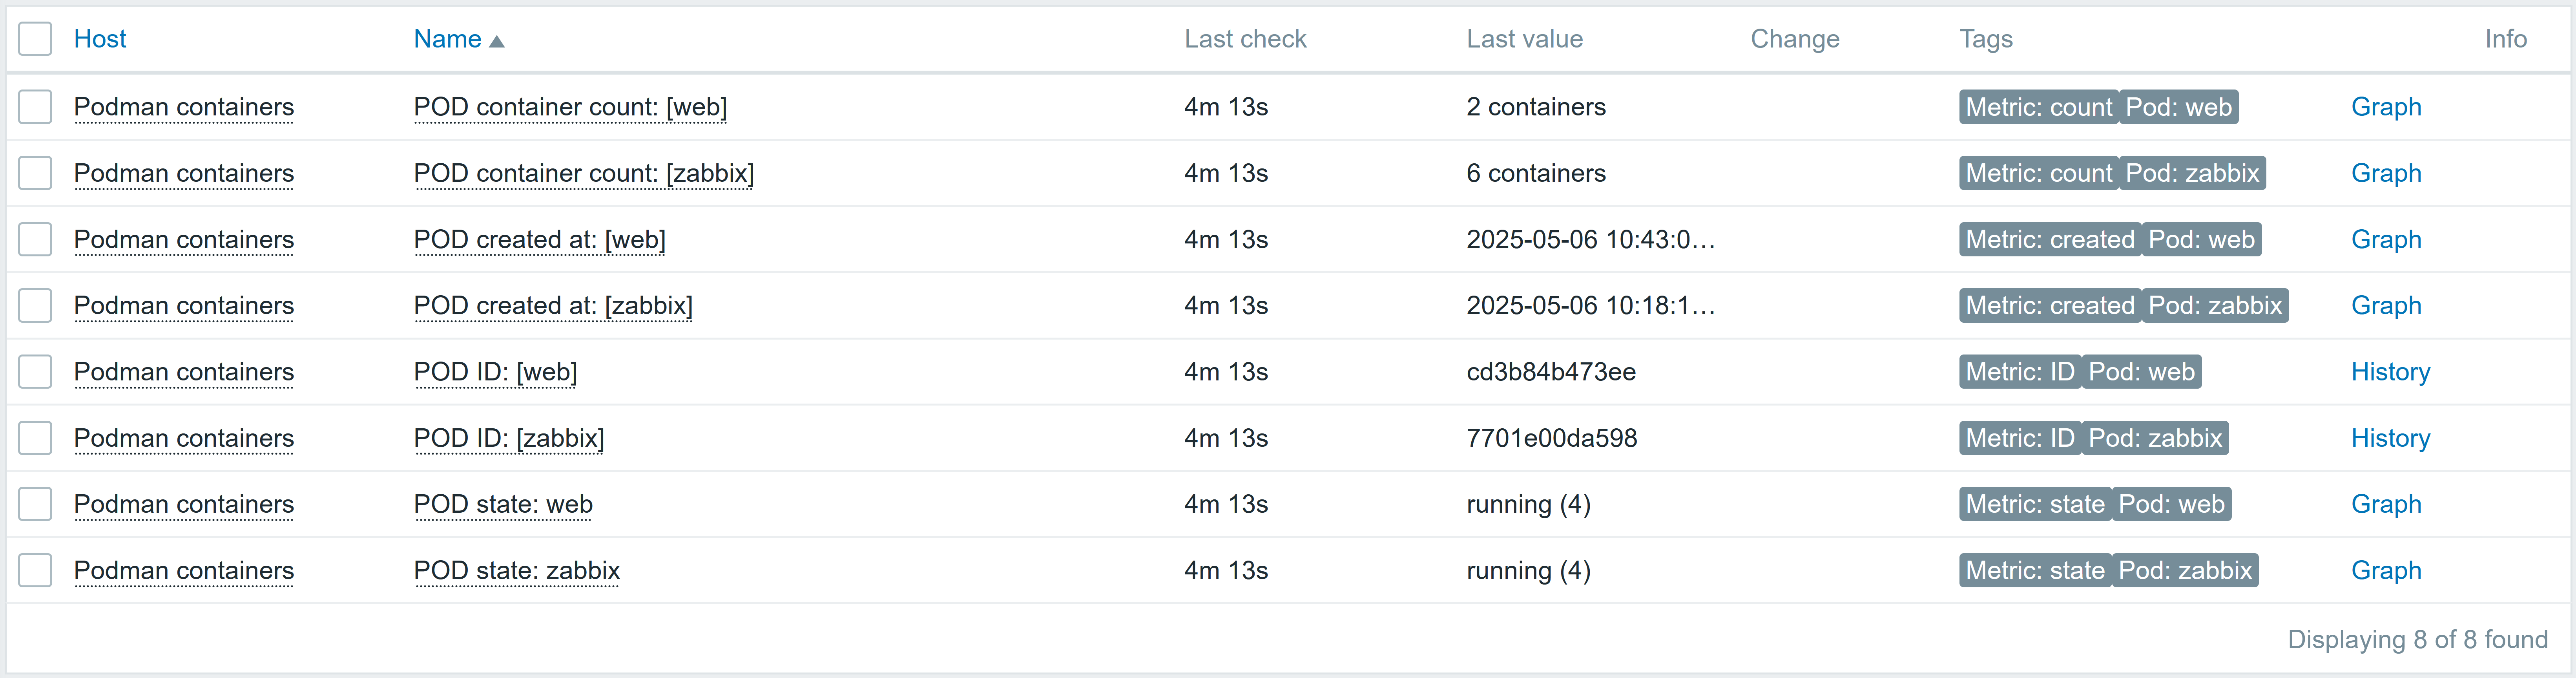
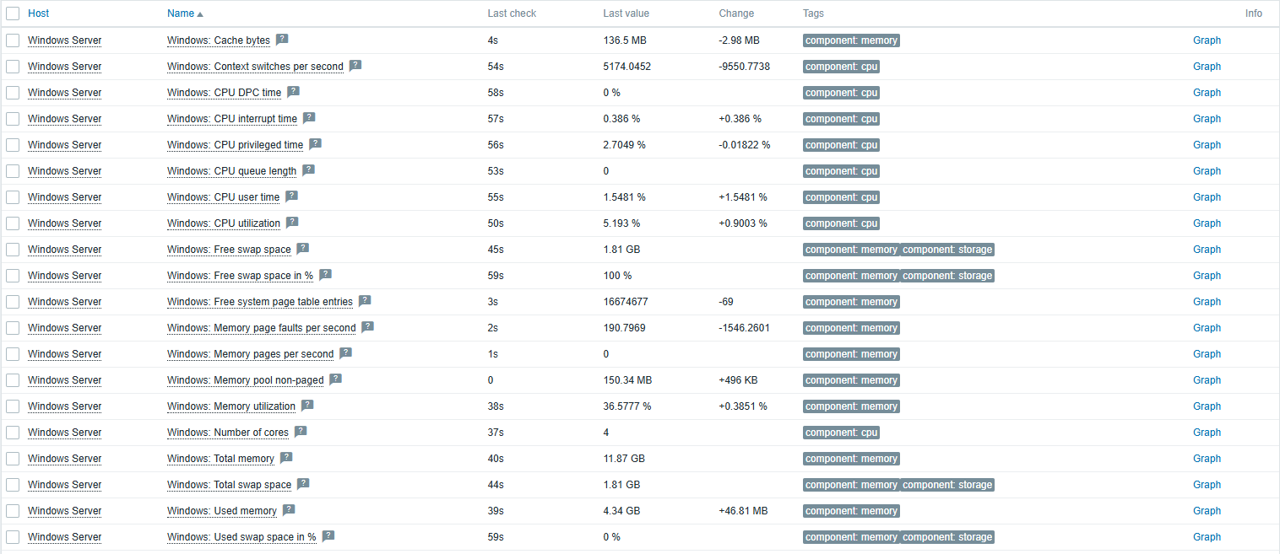
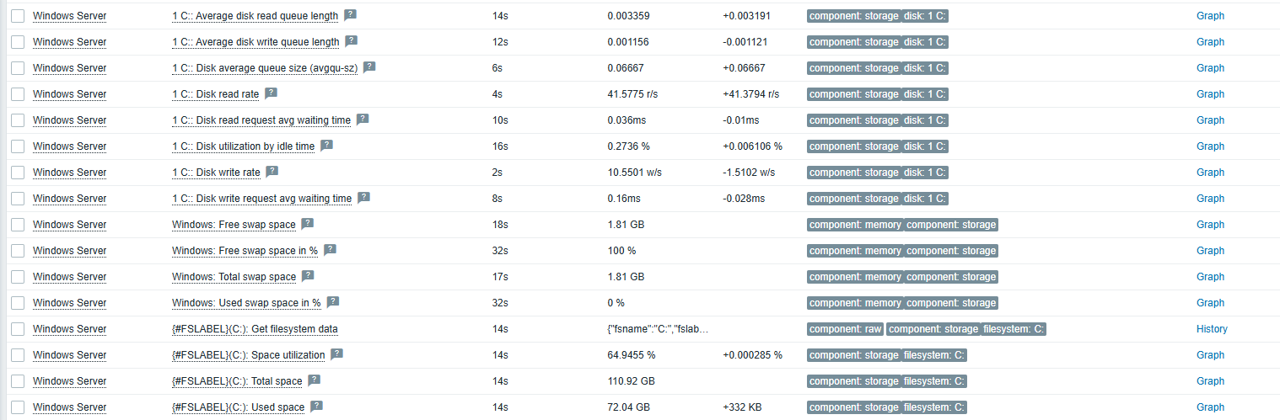
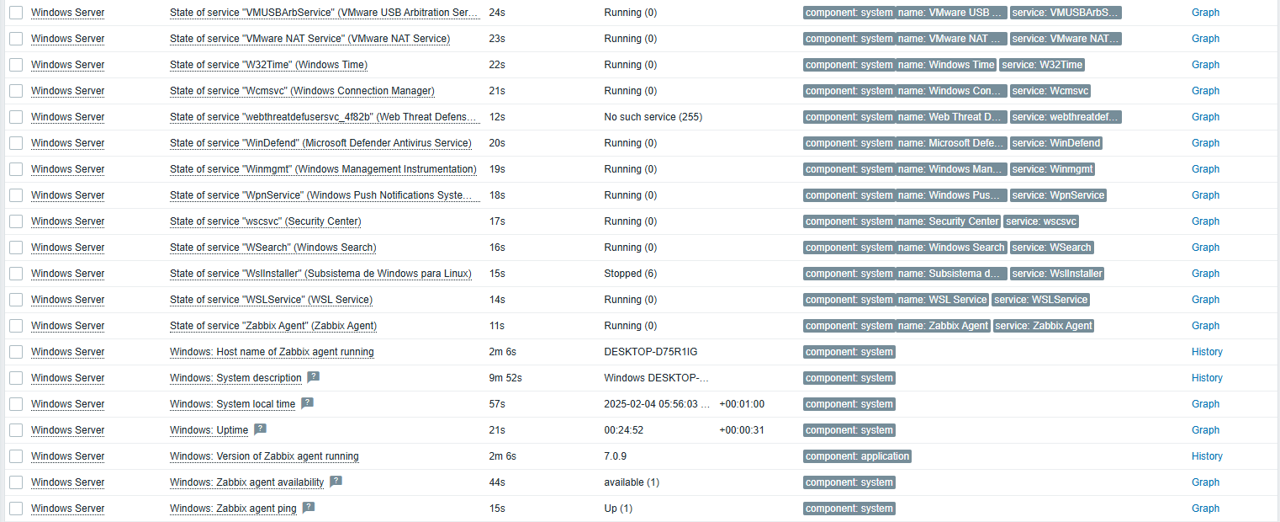
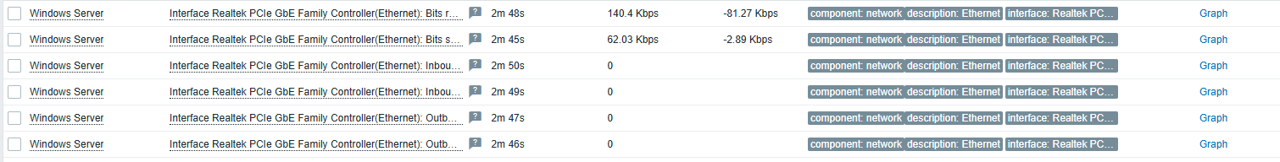
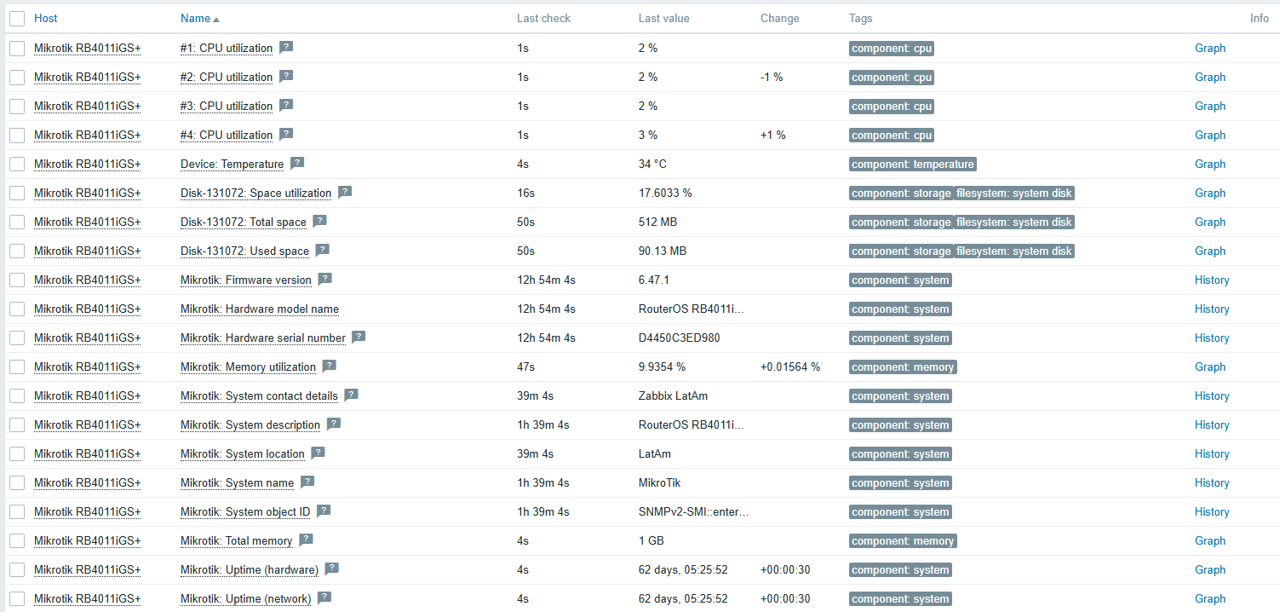
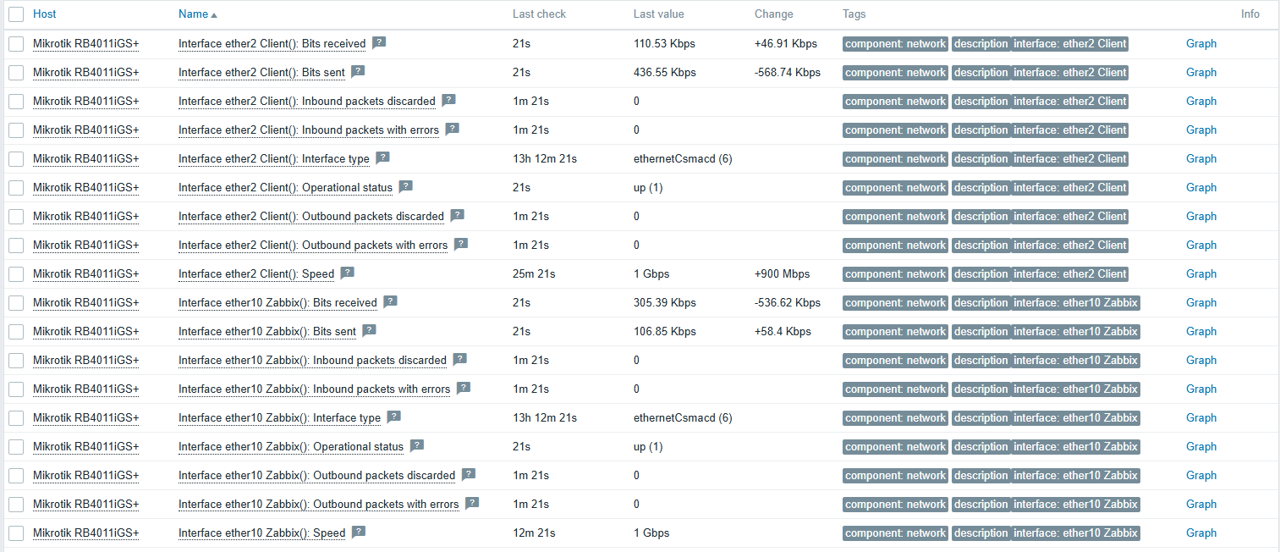
Fig. 32.Latest data for the docker host
Thank you for reading – I hope you’ve found this article helpful and informative!
The post Deploying Zabbix Components with Docker and Docker Compose appeared first on Zabbix Blog.


 Stella Hie is a Sr. Product Manager Technical for AWS Infrastructure as Code. She focuses on proactive control and governance space, working on delivering the best experience for customers to use AWS solutions safely. Outside of work, she enjoys hiking, playing piano, and watching live shows.