Zabbix is an open-source monitoring tool designed to oversee multiple IT infrastructure components, including networks, servers, virtual machines, and cloud services. It operates using both agent-based and agentless monitoring methods. Agents can be installed on monitored devices to collect performance data and report back to a centralized Zabbix server.
Zabbix provides comprehensive integration capabilities for monitoring VMware environments, including ESXi hypervisors, vCenter servers, and virtual machines (VMs). This integration allows administrators to effectively track performance metrics and resource usage across their VMware infrastructure.
In this post, I will show you how to set up Zabbix monitoring with a VMware vSphere infrastructure.
Table of Contents
Requirements:
Zabbix server
Access to the VMware vCenter Server
Step one: Create a Zabbix service user in the vCenter
First things first, let’s create a service user on the vCenter that will be used by the Zabbix server to collect data. To make life easier, in my lab setup the user [email protected] will have full Administrator privileges. Read-only permissions should be enough, however.
1. In the vSphere Client, choose Menu -> Administration -> Users and Groups. From the Users tab, select Domain vsphere.local, and click the ADD button to add a new user.
2. Type a username and password. Click ADD to create a new user.
3. Change the tab to Groups and select the Administrators group.
4. Find a new user zabbix, click on it and save. The user is added to the Administrators group.
5. From the Host and Clusters view, choose vCenter name and go to the Permissions tab. Click the Add button.
6. Choose a proper domain (vsphere.local), find the user zabbix, set the role to Administrator, and check Propagate to children. Click OK to give those permissions.
Step two: Make changes on the Zabbix server
Next, we need to edit zabbix_server.conf. In this file we need to enable the vmware collector process. It’s necessary to start VMware monitoring. FYI, I have installed Zabbix server in version 7.0.4.
1. Edit a configuration file zabbix_server.conf
vim /etc/zabbix/zabbix_server.conf
2. Find the StartVMwareCollectors parameter, delete “#” before it and change the value from 0 to at least 2. Save the file and exit.
Except for StartVMwareCollectors which is mandatory, it’s possible to enable and modify additional VMware parameters. You can find more details about them HERE. VMwareCacheSize VMwareFrequency VMwarePerfFrequency VMwareTimeout
3. Restart the zabbix-server service.
systemctl restart zabbix-server
Step three: Configure the VMware template on Zabbix
1.Log in to the Zabbix server via GUI – http://zabbix_server/zabbix. Go to the Hosts section under the Monitoring tab.
2. Create a new “Host.” Click Create Host in the right upper corner.
3. In the Host tab provide the following details:
Host name – type the name of the system that we want to monitor – here it is VMware Infrastructure. Templates – type/find template name “VMware”, more info about VMware template you can find HERE. Host groups – find/type “VMware(new)” host group.
At this point, go to the Macros tab.
4. In the Macros tab you need to provide 3 values/macros. These macros describes data that is needed to connect Zabbix to the VMware vCenter:
{$VMWARE.URL} – VMware service (vCenter or ESXi hypervisor) SDK URL (https://servername/sdk) that we want to connect. {$VMWARE.USERNAME} – VMware service username created in the 1 section. {$VMWARE.PASSWORD} – VMware service user password created in the 1 section.
Click the Add button.
5. A new Host was created and data collection is in progress.
6. Depending on the size of the infrastructure, data collection takes different amounts of time. Once configured, Zabbix will automatically discover VMs and begin collecting performance data. You can find an overview of the latest data in the Dashboard screen.
7. More specific and detailed data can be found in Latest data under the Monitoring tab.
In Host groups or Hosts choose the name of the item you are looking for (you can also click the “Select” button). Select the name of the ESXi host, the virtual machine, the vCenter name, the datastore, or all VMware information.
Zabbix can collect multiple metrics from VMware using its built-in templates. These metrics include:
– CPU usage
– Memory consumption
– Disk I/O statistics
– Network traffic
– Datastore capacity
In conclusion
Integrating Zabbix with VMware provides a robust solution for monitoring virtualized environments and enhancing visibility into system performance and resource utilization, while enabling timely alerts and responses to operational issues.
In this article, we will explore a practical example of using the zabbix_utils library to solve a non-trivial task – obtaining a list of alert recipients for triggers associated with a specific Zabbix host. You will learn how to easily automate the process of collecting this information, and see examples of real code that can be adapted to your needs.
Table of Contents
Over the last year, the zabbix_utils library has become one of the most popular tools for working with the Zabbix API. It is a convenient tool that simplifies interacting with the Zabbix server, proxy, or agent, especially for those who automate monitoring and management tasks.
Due to its ease of use and extensive functionality, zabbix_utils has found a following among system administrators, monitoring, and DevOps engineers. According to data from PyPI, the library has already been downloaded over 140,000 times since its release, confirming its demand within the community. It’s all thanks to you and your attention to zabbix_utils!
Task Description
Administrators often need to check which Zabbix users receive alerts for specific triggers in the Zabbix monitoring system. This can be useful for auditing, configuring new notifications, or simply for a quick diagnosis of issues. The task becomes especially relevant when you have plenty of hosts containing numerous triggers, and manually checking the recipients for each trigger through the Zabbix interface becomes very time-consuming.
In such cases, it is advisable to use a custom solution based on the Zabbix API. You can directly access all the required data using the API, and then use additional logic to determine the final alert recipients. The zabbix_utils library makes working with the Zabbix API more convenient and allows you to automate this process. In this project, we use the zabbix_utils library to write a Python script that collects a list of alert recipients for the triggers of the selected Zabbix host. This will allow you to obtain the necessary information faster and with minimal effort.
Environment Setup and Installation
To get started with zabbix_utils, you need to install the library and configure the connection to the Zabbix API. This article provides more details and examples on getting started with the library. However, it would be better if I describe the basic steps to prepare the environment here.
The library supports several installation methods described in the official README, making it convenient for use in different environments.
1. Installation via pip
The simplest and most common installation method is using the pip package manager. To do this, execute the command:
~$ pip install zabbix_utils
To install all necessary dependencies for asynchronous work, you can use the command:
~$ pip install zabbix_utils[async]
This method is suitable for most users, as pip automatically installs all required dependencies.
2. Installation from Zabbix Repository
Since writing the previous articles, we have added one more installation method – from the official Zabbix repository. First and foremost, you need to add the repository to your system if it has not been installed yet. Official Zabbix packages for Red Hat Enterprise Linux and Debian-based distributions are available on the Zabbix website.
For Red Hat Enterprise Linux and derivatives:
~# dnf install python3-zabbix-utils
For Debian / Ubuntu and derivatives:
~# apt install python3-zabbix-utils
3. Installation from Source Code
If you require the latest version of the library that has not yet been published on PyPI, or you want to customize the code, you can install the library directly from GitHub:
After installing zabbix_utils, it is a good idea to check the connection to your Zabbix server via the API. To do this, use the URL to the Zabbix server, the token, or the username and password of the user who has permission to access the Zabbix API.
Now that the environment is set up, let’s look at the main steps for solving the task of retrieving the list of alert recipients for triggers associated with a specific Zabbix host in Zabbix.
In zabbix_utils, asynchronous API interaction support is built in through the AsyncZabbixAPI class. This allows multiple requests to be sent simultaneously and their results to be handled as they become ready, significantly reducing latencies when making multiple API calls. Therefore, we will use the AsyncZabbixAPI class and the asynchronous approach in this project.
Below are the main steps for solving the task, and code examples for each step. Please note that the code in this project is for demonstration purposes, may not be optimal, or could contain errors. Use it as an example or a base for your project, but not as a complete tool.
Step 1. Obtain Host ID
The first step is to identify the host for which we will retrieve information about triggers and alerts. We need to find the hostid using its name/host to do this. The Zabbix API provides a method to obtain this information, and using zabbix_utils makes this process much simpler.
This method returns a unique identifier for the host, which can be used further. However, for our test project, we will use a manually specified host identifier.
Step 2. Retrieve Host Triggers
With the hostid in hand, the next step is to retrieve all triggers associated with this host. Triggers contain the conditions that trigger the alerts. We need to collect information about all triggers so that we can then use it to select actions that match all the conditions.
This request returns complete information about the triggers for the host. We get not only the triggers but also their tags, associated host and host groups, and discovery rule information. All this information will be necessary to check the conditions of the actions.
Step 3. Initialize Trigger Metadata
At this stage, objects for each trigger are created to store their metadata. This is done using the Trigger class, which includes information about the trigger such as its name, ID, associated host groups, hosts, tags, templates, and operations.
Here’s the code defining the Trigger class:
classTrigger:def__init__(self, trigger):self.name=trigger["description"]self.triggerid=trigger["triggerid"]self.hostgroups= [g["groupid"] forgintrigger["hostgroups"]]self.hosts= [h["hostid"] forhintrigger["hosts"]]self.tags= {t["tag"]: t["value"] fortintrigger["tags"]}self.tmpl_triggerid=self.triggeridself.lld_rule=trigger["discoveryRule"] or {}iftrigger["templateid"] !="0":self.tmpl_triggerid=trigger["templateid"]self.templates= []self.messages= []self._conditions= {"0": self.hostgroups,"1": self.hosts,"2": [self.triggerid],"3": trigger["event_name"] ortrigger["description"],"4": trigger["priority"],"13": self.templates,"25": self.tags.keys(),"26": self.tags, }defeval_condition(self, operator, value, trigger_data):# equals or does not equalifoperatorin ["0", "1"]:equals=operator=="0"ifisinstance(value, dict) andisinstance(trigger_data, dict):ifvalue["tag"] intrigger_data:ifvalue["value"] ==trigger_data[value["tag"]]:returnequalselifvalueintrigger_dataandisinstance(trigger_data, list):returnequalselifvalue==trigger_data:returnequalsreturnnotequals# contains or does not containifoperatorin ["2", "3"]:contains=operator=="2"ifisinstance(value, dict) andisinstance(trigger_data, dict):ifvalue["tag"] intrigger_data:ifvalue["value"] intrigger_data[value["tag"]]:returncontainselifvalueintrigger_data:returncontainsreturnnotcontains# is greater/less than or equalsifoperatorin ["5", "6"]:greater=operator!="5"try:ifint(value) <int(trigger_data):returnnotgreaterifint(value) ==int(trigger_data):returnTrueifint(value) >int(trigger_data):returngreaterexcept:raiseValueError("Values must be numbers to compare them" )defselect_templates(self, templates):fortemplateintemplates:ifself.tmpl_triggeridin [t["triggerid"] fortintemplate["triggers"]]:self.templates.append(template["templateid"])ifself.lld_rule.get("templateid") in [d["itemid"] fordintemplate["discoveries"] ]:self.templates.append(template["templateid"])defselect_actions(self, actions):selected_actions= []foractioninactions:conditions= []if"filter"inaction:conditions=action["filter"]["conditions"]eval_formula=action["filter"]["eval_formula"]# Add actions without conditions directlyifnotconditions:selected_actions.append(action)continuecondition_check= {}forconditioninconditions:if (condition["conditiontype"] !="6"andcondition["conditiontype"] !="16" ):if (condition["conditiontype"] =="26"andisinstance(condition["value"], str) ):condition["value"] = {"tag": condition["value2"],"value": condition["value"], }ifcondition["conditiontype"] inself._conditions:condition_check[condition["formulaid"] ] =self.eval_condition(condition["operator"],condition["value"],self._conditions[condition["conditiontype"] ], )else:condition_check[condition["formulaid"] ] =Trueforformulaid, bool_resultincondition_check.items():eval_formula=eval_formula.replace(formulaid, str(bool_result))
# Evaluate the final condition formulaifeval(eval_formula):selected_actions.append(action)returnselected_actionsdefselect_operations(self, actions, mediatypes):messages_metadata= []foractioninself.select_actions(actions):messages_metadata+=self.check_operations("operations", action, mediatypes )messages_metadata+=self.check_operations("update_operations", action, mediatypes )messages_metadata+=self.check_operations("recovery_operations", action, mediatypes )returnmessages_metadata
defcheck_operations(self, optype, action, mediatypes):messages_metadata= []optype_mapping= {"operations": "0", # Problem event"recovery_operations": "1", # Recovery event"update_operations": "2", # Update event }operations=copy.deepcopy(action[optype])# Processing "notify all involved" scenariosforidx, _inenumerate(operations):ifoperations[idx]["operationtype"] notin ["11", "12"]:continue# Copy operation as a template for reuseop_template=copy.deepcopy(operations[idx])deloperations[idx]# Checking for message sending operationsforkeyin [kforkin ["operations", "update_operations"] ifk!=optype ]:ifnotaction[key]:continue# Checking for message sending type operationsforopin [oforoinaction[key] ifo["operationtype"] =="0" ]:# Copy template for the current operationoperation=copy.deepcopy(op_template)operation.update( {"operationtype": "0","opmessage_usr": op["opmessage_usr"],"opmessage_grp": op["opmessage_grp"], } )operation["opmessage"]["mediatypeid"] =op["opmessage" ]["mediatypeid"]operations.append(operation)foroperationinoperations:ifoperation["operationtype"] !="0":continue# Processing "all mediatypes" scenarioifoperation["opmessage"]["mediatypeid"] =="0":formediatypeinmediatypes:operation["opmessage"]["mediatypeid"] =mediatype["mediatypeid" ]messages_metadata.append(self.create_messages(optype_mapping[optype], action, operation, [mediatype ] ) )else:messages_metadata.append(self.create_messages(optype_mapping[optype],action,operation,mediatypes ) )returnmessages_metadatadefcreate_messages(self, optype, action, operation, mediatypes):message=Message(optype, action, operation)message.select_mediatypes(mediatypes)self.messages.append(message)returnmessage
The code for creating Trigger class objects for each of the retrieved triggers:
This loop iterates through all triggers and saves them in a dictionary called triggers_metadata, where the key is the triggerid and the value is the trigger object.
Step 4. Retrieve Template Information
The next step is to obtain data about the templates associated with all the triggers:
This request returns information about all templates linked to the host’s triggers being examined. Executing a single query for all triggers is a more optimal solution than making individual requests for each trigger. This information will be needed for evaluating the “Template” condition in actions.
Step 5. Get Actions and Media Types
Next, we obtain the list of actions and media types configured in the system:
Here we retrieve actions that define how and to whom alerts are sent, and mediatypes through which users can receive notifications (for example, email or SMS).
Step 6. Match Triggers with Templates and Actions
At this stage, each trigger is associated with the corresponding templates and actions:
Here, for each trigger, we update information about its templates and configured actions for sending notifications. The list of associated actions is determined by checking the conditions specified in them against the accumulated data for each trigger.
For each operation of the corresponding trigger action, a Message class object is created:
classMessage:def__init__(self, optype, action, operation):self.optype=optypeself.mediatypename=""self.actionid=action["actionid"]self.actionname=action["name"]self.operationid=operation["operationid"]self.mediatypeid=operation["opmessage"]["mediatypeid"]self.subject=operation["opmessage"]["subject"]self.message=operation["opmessage"]["message"]self.default_msg=operation["opmessage"]["default_msg"]self.users= [u["userid"] foruinoperation["opmessage_usr"]]self.groups= [g["usrgrpid"] forginoperation["opmessage_grp"]]self.recipients= []# Escalation period set to action's period if not specifiedself.esc_period=operation.get("esc_period", "0")ifself.esc_period=="0":self.esc_period=action["esc_period"]# Use action's escalation period if unsetself.esc_step_from=self.multiply_time(self.esc_period, int(operation.get("esc_step_from", "1")) -1 )ifoperation.get("esc_step_to", "0") !="0":self.repeat_count=str(int(operation["esc_step_to"]) -int(operation["esc_step_from"]) +1 )# If not a problem event, set repeat count to 1elifself.optype!="0":self.repeat_count="1"# Infinite repeat count if esc_step_to is 0else:self.repeat_count=“∞”defmultiply_time(self, time_str, multiplier):# Multiply numbers within the time stringresult=re.sub(r"(\d+)",lambdam: str(int(m.group(1)) *multiplier),time_str )ifresult[0] =="0":return"0"returnresultdefselect_mediatypes(self, mediatypes):formediatypeinmediatypes:ifmediatype["mediatypeid"] ==self.mediatypeid:self.mediatypename=mediatype["name"]# Select message templates related to operation typemsg_template= [mforminmediatype["message_templates"]if (m["recovery"] ==self.optypeandm["eventsource"] =="0" ) ]# Use default message if applicableifmsg_templateandself.default_msg=="1":self.subject=msg_template[0]["subject"]self.message=msg_template[0]["message"]defselect_recipients(self, user_groups, recipients):forgroupidinself.groups:ifgroupidinuser_groups:self.users+=user_groups[groupid]foruseridinself.users:ifuseridinrecipients:recipient=copy.deepcopy(recipients[userid])ifself.mediatypeidinrecipient.sendto:recipient.mediatype =Trueself.recipients.append(recipient)
Each such object represents a separate message sent to users (recipients) and will contain all message information – its subject, text, recipients, and escalation parameters.
Step 7. Collect User and Group Identifiers
After matching the triggers with actions, the process of collecting unique identifiers for users and groups starts:
This code snippet collects the IDs of all users and groups involved in the operations for each trigger. This is necessary to perform only one request to the Zabbix API for all involved users and their groups, rather than making separate requests for each trigger.
Step 8. Obtain User and Group Information
The next step is to collect detailed information about users and user groups:
Here we gather data about users, including their role and media types through which they receive notifications, as well as data about user groups, including access rights to host groups and the list of users in each group. All this information will be needed to check access to the host with the triggers we are working with.
Step 9. Match Users and Groups with Triggers
After obtaining user information, we match users and groups with their respective rights to receive notifications. Here we also link users with groups, updating the information regarding rights and groups for each user.
foruseridin userids:ifuseridin users:user= users[userid] recipients[userid] =Recipient(user)forgroupinuser["usrgrps"]:ifgroup["usrgrpid"] in usergroups: recipients[userid].permissions.update([h["id"]forhin usergroups[group["usrgrpid"]]["hostgroup_rights"]ifint(h["permission"]) >1 ])forgroupidin groupids:ifgroupidin usergroups:group= usergroups[groupid] user_groups[group["usrgrpid"]] = []foruseringroup["users"]: user_groups[group["usrgrpid"]].append(user["userid"])ifuser["userid"] in recipients: recipients[user["userid"]].groups.update(group["usrgrpid"])elifuser["userid"] in users: recipients[user["userid"]] =Recipient(users[user["userid"]]) recipients[user["userid"]].permissions.update([h["id"]forhingroup["hostgroup_rights"]ifint(h["permission"]) >1 ])
This code fragment connects each user with their groups and vice versa, creating a complete list of users with their access rights to the host, and thus their eligibility to receive notifications about events for this host.
For each recipient, a Recipient class object is created containing data about the recipient, such as the notification address, access rights to hosts, configured mediatypes, etc.
Here’s the code that describes the Recipient class:
classRecipient:def__init__(self, user):self.userid=user["userid"]self.username=user["username"]self.fullname="{name}{surname}".format(**user).strip()self.type=user["role"]["type"]self.groups=set([g["usrgrpid"] forginuser["usrgrps"]])self.has_right=Falseself.permissions=set()self.sendto= {m["mediatypeid"]: m["sendto"] forminuser["medias"] ifm["active"] =="0" }# Check if the user is a super admin (type 3)ifself.type=="3":self.has_right=True
Step 10. Match Messages with Recipients
Finally, we match recipients with specific messages from Step 6:
This step completes the main process – each message is assigned to the relevant recipients.
Step 11. Check Recipient Access Rights and Output the Result
Before the actual output of the result with the list of recipients, we can perform a check of the recipients’ message rights and filter only those who have the corresponding rights to receive notifications for the events related to the trigger, or those who have all configured media types specified and active. After these actions, the information can be output in any convenient way – whether it be exporting to a file or displaying it on the screen:
All the examples and code snippets described above have been compiled to create a solution demonstrating the algorithm for obtaining notification recipients for triggers associated with the selected host. We have implemented this algorithm as a simple web interface to make the result more illustrative and convenient for familiarization.
This interface allows users to enter the host’s ID. The script then processes the data and provides a list of notification recipients associated with the triggers on that host. The web interface uses asynchronous requests to the Zabbix API and the zabbix_utils library to ensure fast data processing and ease of use with many triggers and users.
This lets you familiarize yourself with the theoretical steps and code examples and also try to put this solution into action.
Please note once again that the code in this project is for demonstration purposes, may not be optimal, or could contain errors. Use it as an example or a base for your project, but not as a complete tool.
The web interface’s complete source code and installation instructions can be found on GitHub.
Conclusion
In this article, we explored a practical example of using the zabbix_utils library to solve the task of obtaining alert recipients for triggers associated with a selected Zabbix host using the Zabbix API. We detailed the key steps, from setting up the environment and initializing trigger metadata to working with notification recipients and optimizing performance with asynchronous requests.
Using zabbix_utils allowed us to optimize and accelerate interaction with the Zabbix API, expanding the capabilities of the Zabbix web interface and increasing efficiency when working with large volumes of data. Thanks to support for asynchronous processing and selective API requests, it is possible to significantly reduce the load on the server and improve system performance when working with Zabbix, which is especially important in large infrastructures.
We hope this example will assist you in implementing your own solutions based on the Zabbix API and zabbix_utils, and demonstrate the possibilities for optimizing your interaction with the Zabbix API.
Inviting the members of our global community to share their Zabbix dashboards with us prompted a flood of fascinating responses, and we’re highlighting a few of the most interesting submissions here on our blog. This week’s entry comes to us from Nyein Chan Zaw, who is based in Bangkok, Thailand and works as an Infrastructure Specialist for Green Will Solution. Read on to see how he uses his Zabbix dashboard to monitor a highly intricate infrastructure in real time.
I appreciate the chance to share my dashboard, and I would also like to share a use case that demonstrates the practical implementation of Zabbix for real-time infrastructure monitoring.
This Zabbix dashboard provides a comprehensive view of the network’s real-time health, server availability, traffic patterns, and key performance metrics of essential infrastructure components. It is designed for monitoring production, office, and virtual server zones, including network devices, physical servers, and virtual machines. The current view is the first page of a two-page dashboard, which focuses on general network monitoring:
The second page is dedicated solely to monitoring infrastructure nodes:
Key features monitored
Traffic Monitoring: The dashboard tracks real-time traffic from critical network uplinks, including AIS and TRUE, offering visibility into bandwidth usage (e.g., 64.50 Kbps and 13.05 Kbps). It also monitors internal traffic and key devices like the FortiGate firewall, helping ensure optimal network performance and security.
Host Health Monitoring: CPU and memory utilization for top hosts (e.g., GW-WINDOW11, GW-AD-DOMAIN) are displayed, enabling efficient resource management. Alerts are triggered for high resource usage, allowing for a proactive response to performance issues.
Disk Usage: Disk space on key hosts, such as the Zabbix virtual machine and other core servers, is monitored to avoid file system over-utilization, which can lead to potential service interruptions.
Availability Overview: The dashboard provides a summary of host availability, including how many are available, unavailable, or have unknown statuses. Monitoring methods like active agent and SNMP are also shown, giving an overall view of network health.
Visual Topology Map: A detailed network map shows the production, office, virtual, and test zones, along with devices and connections. This visualization aids in quickly identifying problem areas and understanding how systems are interlinked.
Severity and Problem Monitoring: The dashboard classifies issues by severity, from critical problems to warnings. Real-time issues (such as VM downtime or system failures) are highlighted, enabling the team to resolve issues quickly.
Performance Metrics: Graphs display performance metrics, such as bandwidth usage and CPU load, offering insights into system bottlenecks or overuse, particularly in critical devices like firewalls.
Impact
This Zabbix dashboard enables an infrastructure team to efficiently monitor network performance, manage resource usage, and ensure device availability. The clear visual interface helps quickly identify issues, reducing downtime and ensuring higher reliability of critical services.
Conclusion
The first page of the dashboard demonstrates Zabbix’s capabilities for centralized monitoring across large infrastructures. By integrating data from network devices, servers, and virtual machines, it empowers IT teams to make informed decisions and address issues before they escalate. The second page provides a detailed focus on the infrastructure nodes, ensuring that all critical systems are effectively monitored for optimal operation across the IT environment.
This post is cowritten with Ruben Simon and Khalid Al Khalili from BMW.
BMW’s ambition is to continuously accelerate innovation and improve decision-making across their global operations. To achieve this, they aimed to break down data silos and centralize data from various business units and countries into the BMW Cloud Data Hub (CDH). The CDH is used to create, discover, and consume data products through a central metadata catalog, while enforcing permission policies and tightly integrating data engineering, analytics, and machine learning services to streamline the user journey from data to insight. By building the CDH, BMW realized improved efficiency, performance and sustainability throughout the automotive lifecycle, from design to after-sales services.
With over 10 PB of data across 1,500 data assets, 1,000 data use cases, and more than 9000 users, the BMW CDH has become a resounding success since BMW decided to build it in a strategic collaboration with Amazon Web Services (AWS) in 2020. However, the initial version of CDH supported only coarse-grained access control to entire data assets, and hence it was not possible to scope access to data asset subsets. This led to inefficiencies in data governance and access control.
AWS Lake Formation is a service that streamlines and centralizes the data lake creation and management process. One of its key features is fine-grained access control, which allows customers to granularly control access to their data lake resources at the table, column, and row levels. This level of control is essential for organizations that need to comply with data governance and security regulations, or those that deal with sensitive data.
With fine-grained access control, customers can define and enforce data access policies based on various criteria, such as user roles, data classifications, or data sensitivity levels. This makes sure that only authorized users or applications can access specific data sets or portions of data, but also reduces the risk of unauthorized access or data breaches. Additionally, Lake Formation integrates with AWS Identity and Access Management (IAM) and other AWS services so customers can use existing security and access management practices within their data lake environment.
This post explores how BMW implemented AWS Lake Formation‘s fine-grained access control (FGAC) in the CDH and how this saves them up to 25% on compute and storage costs.
The Solution: How BMW CDH solved data duplication
The CDH is a company-wide data lake built on Amazon Simple Storage Service (Amazon S3). The CDH serves as a centralized repository for petabytes of data from engineering, manufacturing, sales, and vehicle performance and provides BMW employees with a unified view of the organization and acts as a starting point for new development initiatives. It streamlines access to various AWS services, including Amazon QuickSight, for building business intelligence (BI) dashboards and Amazon Athena for exploring data. Many of these services are embedded into the CDH data portal, which offers a web-based user interface for accessing and interacting with the platform. It allows users to discover datasets, manage data assets, and consume data for their use cases. The architecture is shown in the following figure.
The BMW CDH follows a decentralized, multi-account architecture to foster agility, scalability, and accountability. It comprises distinct AWS account types, each serving a specific purpose. The following account types are relevant for implementation:
Resource accounts: Accounts are used for centralized storage repositories, hosting the datasets and their associated metadata across different stages (such as development, integration, and production) and AWS Regions.
Consumer accounts: Used by data consumers to implement use cases insights and build applications tailored to their business needs.
CDH control plane account: This account contains the APIs for creating filter packages and controlling access. A filter package provides a restricted view of a data asset by defining column and row filters on the tables.
The following are the three key roles within the CDH’s decentralized architecture:
Data providers, who provision data assets in resource accounts
Data stewards, who govern data assets
Use cases (data consumers), which use data assets to derive insights and build applications inside of consumer accounts to support decision-making processes.
For example, a global sales dataset is created by a team of data engineers with the data provider role. A data analyst in a local market who wants to derive insights from the global sales data can create a use case with a dedicated AWS consumer account and request access to the dataset from a data steward.
This multi-account strategy promotes a clear separation of concerns, empowering data producers and consumers to operate independently while using the centralized governance and services provided by the solution. The following figure illustrates how Lake Formation is used across the resource and consumer accounts in the CDH to provide FGAC to use cases.
The CDH uses the AWS Glue in resource accounts as a technical metadata catalog and data assets are stored in Amazon S3. Both the data catalog and the locations in Amazon S3 are registered with Lake Formation so that it can govern data access. Data catalogs and tables are shared with consumer accounts and use cases through AWS Resource Access Manager (AWS RAM). With Lake Formation, BMW can control access to data assets at different granularities, such as permissions at the table, column, or row level. Users can then use a Lake Formation integrated engine such as Amazon Athena to access only the data they need, removing the need to duplicate data. For example, to restrict access to a global sales data asset, BMW can now specify row filters in Lake Formation using the PartiQL language, filtering rows based on the country column of the data asset.
Data stewardship: Managing fine-grained access control
At the core of the CDH FGAC implementation lies the concept of filter packages. A filter package provides a selective view of a data asset by defining column and row filters on the tables. Multiple filter packages can be defined for a data asset to create suitable views for different use cases. In our example of the global sales dataset, a data steward creates a filter package for each local market that restricts access to the relevant rows and columns. Data stewards create and manage these packages through the CDH interface. These filter packages are implemented using Lake Formation row-level and column-level access control mechanisms. The following figure illustrates these concepts.
When creating a filter package, data stewards can specify the desired access level for individual tables within their data asset: Full access grants permissions to all columns and rows, None denies access to an entire table, while Filtered allows for granular row-level and column-level access controls.
For filtered access, data stewards use PartiQL queries to define row-level filters on tables, selecting only the rows that meet specific criteria. Additionally, they can specify column-level filters by selecting the accessible columns.
After filter packages have been created and published, they can be requested. Data stewards can review incoming requests and grant or deny access through the CDH interface, making sure that only authorized environments can access sensitive data.
Using fine-grained access control in use cases
Use case owners can browse and search for relevant data assets in the CDH, and then request full or scoped access. The CDH provides a clear overview of the available filter packages, allowing them to select the appropriate level of access based on their use case.
After access is granted to a filter package by the data steward, the filters are enforced for the use case using Lake Formation. Use case owners can further control access at the row and column level for individual users or roles within their use case account using Lake Formation. For example, they can create another column filter to hide a particular column for a particular group of users and provide unfiltered access to another group of users.
Gradual deployment with Lake Formation hybrid access mode
One of the challenges in implementing changes in access control within an existing data lake such as the CDH is the need to coordinate migration between data providers and consumers. To address this, Lake Formation offers a hybrid access mode to facilitate a gradual transition to FGAC without disrupting existing data access patterns.
In hybrid access mode, data providers can activate Lake Formation for new dataset consumers while existing consumers continue to access the data using the legacy permission model. This approach makes sure that consumers can migrate to FGAC at their own pace, minimizing the impact on their existing workloads and processes. A use case account is only switched to Lake Formation permissions for a dataset when it requests access to a filter package. This hybrid approach allows providers and consumers to migrate at their own pace, maintaining a smooth transition to the new access control model.
How BMW saves money by using Lake Formation
As the CDH grew, it became apparent that data was often duplicated for access control purposes. This issue was particularly evident with data assets containing sales data of all markets where BMW operates. Local markets were only eligible to see their own data, and to achieve this, subsets of global data assets had to be duplicated to create isolated local variants. While this approach succeeded in fulfilling access control requirements, it led to increased storage costs, higher compute expenses for data processing and drift detection, and project delays because of time-consuming provisioning processes and governance overhead. At one point, 25% of all data assets in the CDH were duplicates, a natural consequence of these measures.
With Lake Formation, creating these duplicates is no longer necessary. Data stewards can restrict access to global datasets on column and row level to comply with governance requirements. Not only does this reduce the cost for data processing, storage, development and maintenance, it also minimizes the opportunity cost of delayed data access.
Conclusion
By using AWS Lake Formation fine-grained access control capabilities, BMW has transparently implemented finer data access management within the Cloud Data Hub. The integration of Lake Formation has enabled data stewards to scope and grant granular access to specific subsets of data, reducing costly data duplication. This approach enables BMW to save up to 25% on compute and storage costs while reducing governance overhead costs. The hybrid access mode implementation further facilitates a smooth transition to the new access control model, allowing data providers and consumers to migrate at their own pace without disrupting existing workloads and processes. To dive deeper into how to replicate BMWs data success story, check out the AWS blog post on building a data mesh with Amazon Lake Formation and AWS Glue.
About the authors
Ruben Simon is a Head of Product for BMW’s Cloud Data Hub, the company’s largest data platform. He is passionate about driving digital transformation in aata, analytics, and AI, and thrives on collaborating with international teams. Outside the office, Ruben cherishes family time and has a keen interest in continual learning.
Khalid Al Khalili is a Data Architect at BMW Group, leading the architecture of the Cloud Data Hub, BMW’s central platform for data innovation. He is a strong advocate for creating seamless data experiences, transforming complex requirements into efficient, user-friendly solutions. When he’s not building new features, Khalid enjoys collaborating with his peers and cross-functional teams to advance and shape BMW’s data strategy, ensuring it stays ahead in a rapidly evolving landscape.
Florian Seidel is a Global Solutions Architect specializing in the automotive sector at AWS. He guides strategic customers in harnessing the full potential of cloud technologies to drive innovation in the automotive industry. With a passion for analytics, machine learning, AI, and resilient distributed systems, Florian helps transform cutting-edge concepts into practical solutions. When not architecting cloud strategies, he enjoys cooking for family and friends and experimenting with electronic music production.
Aishwarya Lakshmi Krishnan is a Senior Customer Solutions Manager with AWS Automotive. She is passionate about solving business problems using generative AI and cloud based technologies.
Durga Mishra is a Principal solutions architect at AWS. Outside of work, Durga enjoys spending time building new things and spend time with family and loves to hike on Appalachian trails and spend time in nature.
We will be highlighting Projen’s powerful features that cater to various aspects of project management and development. We’ll examine how Projen enhances polyglot programming within Amazon Web Services (AWS) Cloud Development Kit constructs. We’ll also touch on its built-in support for common development tools and practices.
In our previous blog, we introduced you to the basics of getting started with Projen. Projen is a powerful project generator that simplifies the management of complex software configurations. In our prior blog, we discussed developing a new AWS cloud development kit (CDK) construct library project. For consistency, we will continue using this construct library project as our example while exploring linting, dependency management, and test coverage. It’s important to note that these practices are equally applicable to CDK applications and other project types.
AWS CDK Polyglot Construct Library
The AWS Cloud Development Kit (AWS CDK) is an open-source software development framework that allows developers to define cloud infrastructure using familiar programming languages. In a CDK application, constructs serve as the foundational elements, allowing developers to represent either a single AWS resource or a complex combination of resources. These constructs are not only reusable but can be incorporated into other AWS CDK projects, promoting efficient and scalable development practices.
Projen and Polyglot Programming
Projen leverages the power of the JSII library, enabling developers to write constructs once and generate equivalent constructs across multiple programming languages. This feature streamlines the development process, especially when working with teams that have expertise in different languages.
Automated Publishing with Projen
With its publisher module, Projen automates the distribution of c ructs to various package managers. This process can be integrated into a GitHub workflow, such as a build job, which triggers the publication of the library to the designated package managers.
Starting with Projen
Initiating an AWS CDK construct library project is straightforward through the Projen command npx projen new <project_type>. By executing the command npx projen new awscdk-construct, you initialize a new project complete with a projenrc file. This file contains the essential configuration for a CDK construct library, setting the stage for further customization and development.
import { awscdk } from 'projen';
const project = new awscdk.AwsCdkConstructLibrary({
  author: 'github username',
  authorAddress: 'github email',
  cdkVersion: '2.1.0',
  defaultReleaseBranch: 'main',
  jsiiVersion: '~5.0.0',
  name: 'cdkconstruct',
  projenrcTs: true,
  repositoryUrl: 'https://github.com/*****/cdkconstruct.git',

  // deps: [],                /* Runtime dependencies of this module. */
  // description: undefined,  /* The description is just a string that helps people understand the purpose of the package. */
  // devDeps: [],             /* Build dependencies for this module. */
  // packageName: undefined,  /* The "name" in package.json. */
});
project.synth();
A release.yml file is generated by projen under the github>workflow directory. This file has the details of the public registry where the construct needs to be published. By default, it will add the details for npm.
release_npm:
    name: Publish to npm
The construct can be developed in typescript under src/main.ts, our previous blog shows how to create one. If the construct needs to be published to other public registries (such as Maven for java, Pypi for python), then a projenrc file can be updated to synthesize a new release.yml file.
For example, to publish a construct developed in typescript to Maven (so that it can be used in a java application) add publishToMaven API to the projenrc file.
This way the construct is built once and published to multiple registries with different programming languages.
Figure 1: High-level Architecture showing publication to multiple public registries
Linting, Dependency Management & Test Coverage
Projen streamlines the setup process by generating a comprehensive package.json file. This file includes pre-configured dependencies for ESLint and Jest, enabling developers to maintain coding standards and ensure robust test coverage right from the start. ESLint, a widely adopted static code analysis utility, empowers developers to enforce consistent coding practices by analyzing the source code and identifying potential errors, bugs, and stylistic issues. Additionally, Jest equips developers with a comprehensive suite of tools for writing and executing unit tests, facilitating comprehensive test coverage for their codebase. While Projen provides Jest as the default testing framework, it offers developers the flexibility to incorporate alternative testing frameworks based on their project requirements.
Following with the awscdk-construct from the previous section, under test>main.test.ts a default test file is created, which can be updated for writing test cases. A default package.json is generated in the root directory.
Projen can be extensively configured. For example, if you need to configure webpack as a module bundler, then you need to add a webpack.config.js file and update the projenrc file project.
The other dependencies can be updated in package.json by adding deps in the projenrc.ts file.
Run npx projen build to synthesize a package.json.
Continuous Integration and Continuous Delivery (CI/CD)
When you create a project using Projen, it comes equipped with an automated build process that triggers upon the submission of a pull request. This is one of the key, “out-of-the-box” features that streamlines development workflows.
Projen orchestrates this process through GitHub Actions, utilizing a sequence of tasks predefined in the project’s base ‘Project’ class.
When a build is initiated, it systematically carries out several sub-tasks:
Synthesis: It starts by synthesizing all the project files, ensuring they are up-to-date and correctly configured.
Bundling: Next, it bundles the necessary assets for the project.
Compilation: The project’s code is then compiled.
Testing: Following compilation, Projen runs the suite of tests defined for the project.
Packaging: Finally, it packages everything together, preparing it for deployment or distribution.
Projen manages these steps by auto-generating a build.yml file, which it places within the workflow directory of your project’s structure. This YAML file contains all the instructions for the GitHub Actions to execute the build process.
For instance, when you run the command npx projen new awscdk-app-ts, Projen sets up a TypeScript application for AWS CDK. It automatically creates a ‘build.yml’ file through the default projenrc file, which can be found in the github/workflow folder of your project repository. This automated process is designed to save time and reduce manual errors, making it an essential feature for efficient project management.
 .github
   workflow
    build.yml
A Projen build is self-mutating because files generated by Projen are part of the source directory. To ensure that a pull request branch always represents the final state of the repository, you can enable the mutableBuild option in your project configuration (currently only supported for projects derived from NodeProject).
The build process can be customized by adding any task in the project class, which can execute a shell command.
const buildproject = project.addTask('build');
buildproject.exec('npm run build');
The Task also supports the condition option that determines if the condition is true before running the task.
const hello = project.addTask('hello', {
  condition: '[ -n "$CI" ]', // only execute if the CI environment variable is defined
  exec: 'echo running in a CI environment'
});
Releases and Versioning
Projen uses Conventional Commits to generate semantic versioning of the releases automatically. This means that based on the commit message format, it can create the release version automatically.
Initially, the project is released under version 0.0.0. Anything may change at any time and public APIs should not be considered stable. Commits marked as a breaking change will increase the minor version. All other commits will increase the patch version.
You need to manually promote the major version to 1 once your project is considered stable. For major versions 1 and above, if a release includes fix commits only, it will increase the patch version. If a release includes any feat commits, then the new version will be a minor version.
One of the nice, out-of-the-box features that comes with Projen for AWS CDK constructs is the creation of API documentation for your constructs. By leveraging jsii-docgen, Projen’s build step will generate API documentation (API.md) from the comments in your code.
This feature is powerful for several reasons. Firstly, it ensures that documentation is kept up-to-date with the codebase, as the API documentation is generated directly from the source code comments. This reduces the risk of discrepancies between the code and its documentation, which can lead to misunderstandings and errors in usage.
Secondly, it streamlines the development process by automating a task that is often tedious and time-consuming. Developers can focus more on writing code and less on updating documentation manually.
Thirdly, it promotes better coding practices, as developers are encouraged to write clear and detailed comments in their code. This not only benefits the generation of documentation, but also helps any new developers who may work on the codebase in the future to understand the code more quickly and thoroughly.
Moreover, having readily available and accurate documentation can significantly enhance the developer experience. It makes it more straightforward for users of the CDK constructs to understand the functionality, parameters, return types, and the structure of the code they are working with.
In the context of team collaboration and open-source projects, this feature is especially beneficial. It ensures that anyone who contributes to the codebase is able to generate and view the latest documentation without any additional setup or configuration, facilitating smoother collaboration and integration processes.
Let’s recap all of the features that Projen can introduce into your project right out of the box:
Projen’s automation for linting and testing to maintain high code quality from the beginning.
Automated API documentation feature to keep your project’s documentation synchronized with the latest code changes.
Polyglot capabilities to cater to a diverse development team, ensuring flexibility in language preference.
The publisher module to streamline the release process across multiple package managers, saving time and reducing the scope for human error.
As we wrap up our deep dive into some of the advanced features of Projen within AWS CDK, it’s clear that Projen helps alleviate a lot of the pain points of a new greenfield project. By leveraging Projen, developers can navigate the complexities of polyglot programming, automate the mundane tasks of publishing and documentation, and ensure consistent code quality through linting and testing. Projen elevates the development workflow to a level where efficiency and scalability are the norms, not the exception.
What’s more compelling is Projen’s commitment to developer empowerment. Through its automated systems, it encourages developers to adhere to best practices without the overhead of manual enforcement. Its ability to seamlessly integrate with various package managers and generate detailed API documentation from inline comments signifies a leap in developer tooling.
Contact an AWS Representative to know how we can help accelerate your business.
Monitoring backup solutions can be an arduous task – especially since many backup tools don’t provide APIs and simply are not easy to work with. One such solution – NetBackup – provides its own set of challenges, but fortunately we have Zabbix, with its low-level discovery (LLD) features and the possibility to leverage user parameters to extend Zabbix agent.
Table of Contents
How does LLD work ?
For those not familiar with LLD, Zabbix is able to create items, triggers, graphs, and other entities based on LLD rules. JSON is used to detect those entities by Zabbix.
If we create a script that returns this information to Zabbix, then we can automatically create items based on the received low-level discovery macros and their values. In this example from the Zabbix website, Zabbix will map {#FSNAME} to one of the detected logical volumes.
Zabbix can automatically create items with this information. If we then create another script where we sent the values for each of the volumes, then we can return for example the free space for the “/” volume as a value and do this for all other volumes as well.
With this knowledge, we can create a solution to monitor our backups. We will further optimize this approach because we don’t want to rely on multiple scripts, such as a script that sends us a list of failed backups, another script that returns the status codes, etc. We will use the dependent item feature, which allows us to simply create one master item to collect all the values and then process them further in Zabbix.
Monitoring with Python and user parameters
To format our data in JSON, we need to extract it first from the API. For this, we can create a script with the user parameters in our Zabbix agent. The Python script we will use for this can be copied to “/etc/zabbix” or another place that is accessible by the Zabbix user on our system.
Don’t forget to adapt the script and update settings like user name, password, URL, and page limit!
# NetBackup API configuration
BASE_URL = "https://<netbackup-url>:1556/netbackup"
USERNAME = ""
PASSWORD = ""
PAGELIMIT = "100" # adapt to your needs

The page limit will limit the search to the last 100 lines

If you want you can also adapt how many days we have to look back in history standard is 7 days

# Set the time range for job retrieval (last 7 days)
end_time = datetime.utcnow()
start_time = end_time - timedelta(hours=168)
The script will collect errors in backups and the resulting output will display a list of failed backups over the last 100 jobs:
This data is perfect for our LLD rules in Zabbix. Once we have copied our script to the server, we have to define our Zabbix user parameter. You can download an example here:
Copy this file to your Zabbix agent in the config folder, usually somewhere in:
“/etc/zabbix/zabbix_agent2.d/” or “/etc/zabbix/zabbix_agentd.d/” depending if you use Zabbix agent or Zabbix agent 2.
Don’t forgot to modify the file permissions so that only the agent can read it, and restart Zabbix agent. Also, make sure that the user parameter points are at the correct location of the Python script. The last thing we have to do now is create or import our Zabbix template:
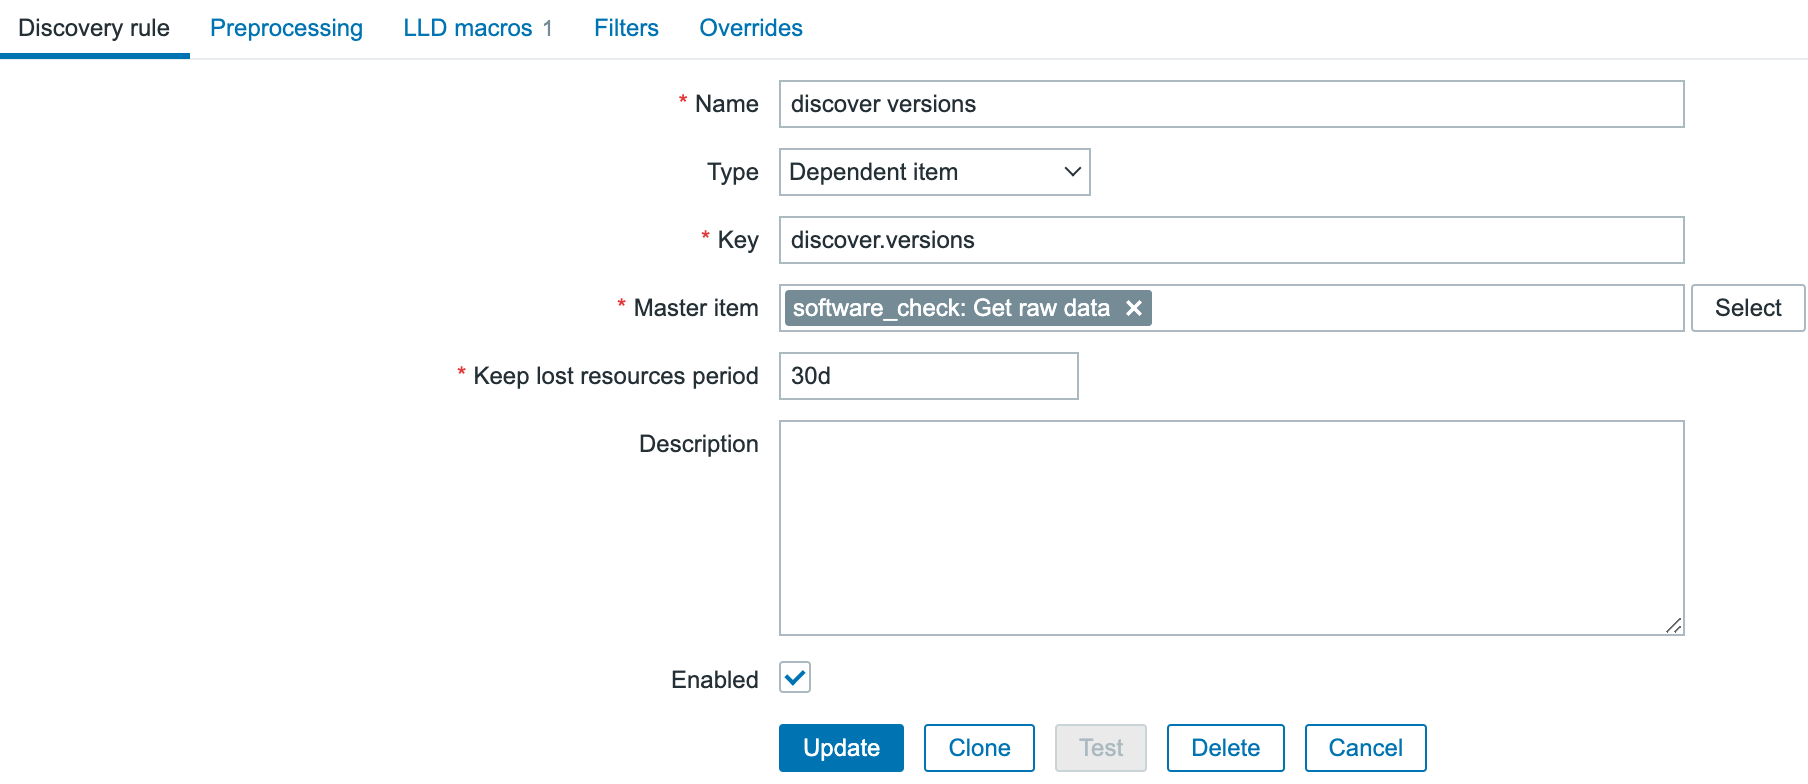
The first thing we have to do is create a master item that collects the data from our script.
Since the error check is executed every 15 minutes, we can use throttling pre-processing to discard duplicate data, since most of the time there will be no errors in our backups.
Also, if our script fails to connect to the API, our data collection will fail. Therefore, we can use custom on fail pre-processing and set a custom, more human-readable error message.
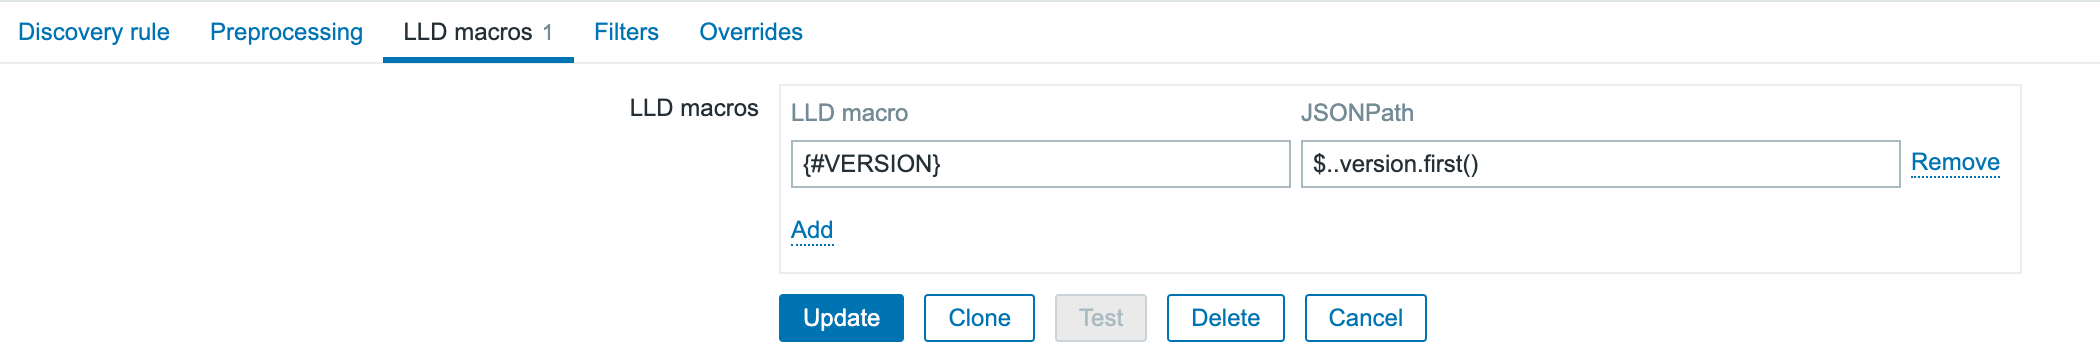
Now we have to create a discovery rule in Zabbix based on this data. In this discovery rule we will extract the required data and map it to custom LLD macros.
Those macros can be used later in our items. As you can see, we use .first() at the end of our JSONPATH expression – otherwise, we would get all our matching data between the [ ], as our data comes in a list. By making use of .first() we filter out all other data we don’t need.
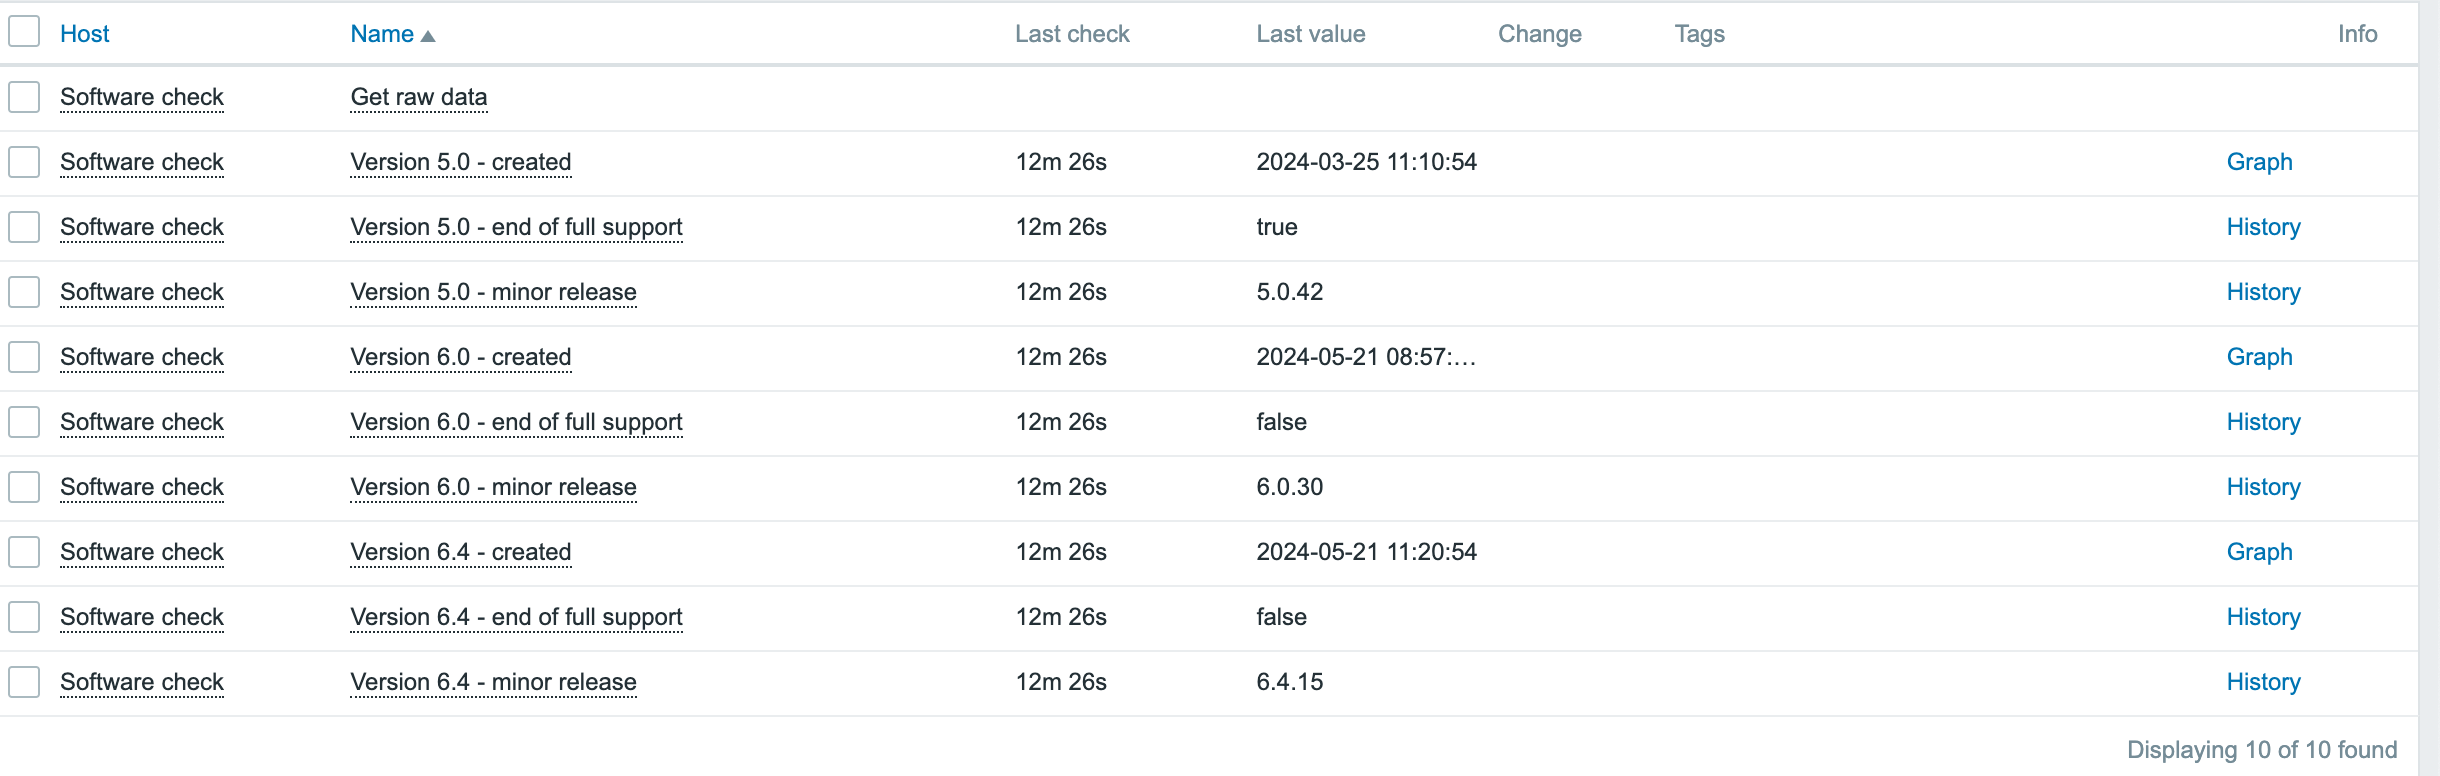
To create our LLD items, we need to create an item prototype so that items can be generated when they are detected. Our item will be a dependent item, so it will get its data from the master item.
In our item prototype we can make use of the Zabbix LLD macros we created before. To extract the data we need, we have to add a preprocessing rule first to extract the data we want from our master item.
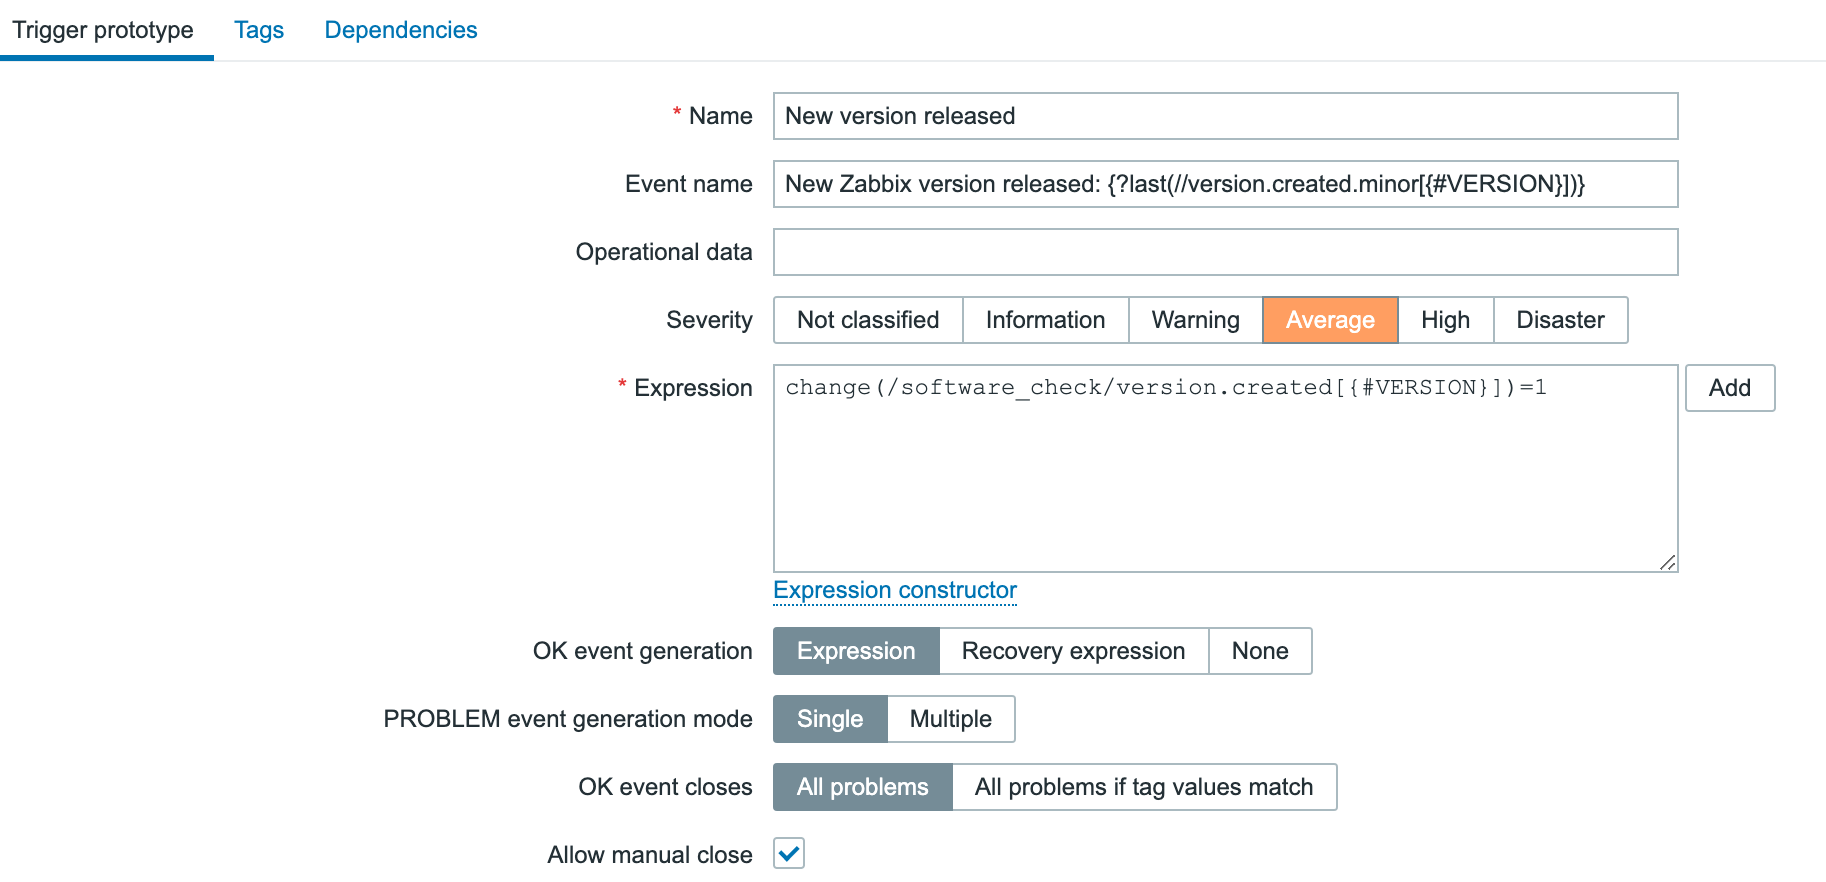
First line will look for the “JOBID” and will use the LLD macro we created before. Remember we used .last() ? If we had not done this our ID here would have been a list [ ] instead of just the ID number. We also have to remove the [ ] – this we can do with trim. Since our data is returned as text we also add some JS to convert our data to an Integer. This allows us to create triggers based on the error code we have received.
Monitoring with an http item
There is another way to do the same thing in Zabbix without writing those complex python scripts. Since Zabbix 4.0 we have “HTTP agent” item type. This allows us to connect to the API and retrieve the required data from the API. Combined with LLD and dependent items this becomes a very powerful way to collect metrics.
First thing we have to do is create a master item to retrieve the data from the API. This item is of the type “HTTP agent” and we have to fill in the URL of the API endpoint. To authenticate we have to pass information like the authentication token in the headers. For this you need to create a token first in NetBackup. As you can see I used a macro {$BEARER.TOKEN} – this is so we can make it secret.
So next step is to add our secret token. Let’s create our macro in the template under the Macros section. Here we can choose to keep it hidden for everyone. An even more secure way to store sensitive information like authentication tokens would be using a secret vault.
The data we get back from our API is a bit different from what we have seen in the output of the Python script we defined previously, but not by much.
With this knowledge and what we know from our first try with Python, we can now make a dependent discovery rule.
The same logic applies again – we need to map our data to LLD macros so that we can use them later in our LLD items and triggers.
These LLD macros can later be used in our item prototypes and triggers. We only need JOBID and STATE, but you can create some extra mappings in case you like to use the extra information later. With our JSON path we will once again extract the data from our master item.
The next step is to create the LLD item prototype. Here we can use the macros we extracted earlier.
The item is dependent on our master item, so without any pre-processing the data will be exactly the same as in our master item. Therefore, we can add some rules to get the data we need.
Here, we use the JSON path to extract the data. With our LLD macros we can extract the data dynamically for every item we have discovered. With Trim, we remove the [ ] that comes around our data.
If there are backup errors, the end result will look something like this:
The steps can look a bit abstract, so the best thing to do is to try and perform everything step-by-step and use the Test button in Zabbix to test every step before you continue.
That’s it! If you’ve set up everything correctly, you should now get a list of failed jobs collected from NetBackup. Once the failed jobs are gone, Zabbix will disable the related entities and clean them up after some time.
If you need help optimizing your Zabbix environment, or you need a support contract, some consultancy, or training, feel free to contact [email protected] or visit us at https://www.open-future.be.
As organizations increasingly adopt Amazon Q Developer, understanding how developers use it is essential. Diving into specific telemetry events and user-level data clarifies how users interact with Amazon Q Developer, offering insights into feature usage and developer behaviors. This granular view, accessible through logs, is vital for identifying trends, optimizing performance, and enhancing the overall developer experience. This blog is intended to give visibility to key telemetry events logged by Amazon Q Developer and how to explore this data to gain insights.
To help you get started, the following sections will walk through several practical examples that showcase how to extract meaningful insights from AWS CloudTrail. By reviewing the logs, organizations can track usage patterns, identify top users, and empower them to train and mentor other developers, ultimately fostering broader adoption and engagement across teams.
Although the examples here focus on Amazon Athena for querying logs, the methods can be adapted to integrate with other tools like Splunk or Datadog for further analysis. Through this exploration, readers will learn how to query the log data to understand better how Amazon Q Developer is used within your organization.
Solution Overview
This solution leverages Amazon Q Developer’s logs from the Integrated Development Environment (IDE) and terminal, captured in AWS CloudTrail. The logs will be queried directly using Amazon Athena from Amazon Simple Storage Service (Amazon S3) to analyze feature usage, such as in-line code suggestions, chat interactions, and security scanning events.
Analyzing Telemetry Events in Amazon Q Developer
Amazon Athena is used to query the CloudTrail logs directly to analyze this data. By utilizing Athena, queries can be run on existing CloudTrail records, making it simple to extract insights from the data in its current format.
Ensuring CloudTrail is set up to log the data events.
Navigate to the AWS CloudTrail Console.
Edit an Existing Trail:
If you have a trail, verify it is configured to log data events for Amazon CodeWhisperer.
Note: As of 4/30/24, CodeWhisperer has been renamed to Amazon Q Developer. All the functionality previously provided by CodeWhisperer is now part of Amazon Q Developer. However, for consistency, the original API names have been retained.
Click on your existing trail in CloudTrail. Find the Data Events section and click edit.
For CodeWhisperer:
Data event type: CodeWhisperer
Log selector template: Log all events
Save your changes.
Note your “Trail log location.” This S3 bucket will be used in our Athena setup.
If you don’t have an existing trail, follow the instructions in the AWS CloudTrail User Guide to set up a new trail.
Below is a screenshot of the data events addition:
Steps to Create an Athena Table from CloudTrail Logs: This step aims to turn CloudTrail events into a queryable Athena table.
1. Navigate to the AWS Management Console > Athena > Editor.
2. Click on the plus to create a query tab.
3. Run the following query to create a database and table. Note to update the location to your S3 bucket.
-- Step 1: Create a new database (if it doesn't exist)
CREATE DATABASE IF NOT EXISTS amazon_q_metrics;

-- Step 2: Create the external table explicitly within the new database
CREATE EXTERNAL TABLE amazon_q_metrics.cloudtrail_logs (

    userIdentity STRUCT<
        accountId: STRING,
        onBehalfOf: STRUCT<
            userId: STRING,
            identityStoreArn: STRING
        >
    >,
    eventTime STRING,
    eventSource STRING,
    eventName STRING,
    requestParameters STRING,
    requestId STRING,
    eventId STRING,
    resources ARRAY<STRUCT<
        arn: STRING,
        accountId: STRING,
        type: STRING
    >>,
    recipientAccountId STRING

)
ROW FORMAT SERDE 'org.apache.hive.hcatalog.data.JsonSerDe'
STORED AS INPUTFORMAT 'com.amazon.emr.cloudtrail.CloudTrailInputFormat'
OUTPUTFORMAT 'org.apache.hadoop.hive.ql.io.HiveIgnoreKeyTextOutputFormat'
LOCATION 's3://{Insert Bucket Name from CloudTrail}/'
TBLPROPERTIES ('classification'='cloudtrail');
4. Click Run
5. Run a quick query to view the data.
SELECT
    eventTime,
    userIdentity.onBehalfOf.userId AS user_id,
    eventName,
    requestParameters
FROM
    amazon_q_metrics.cloudtrail_logs AS logs
WHERE
    eventName = 'SendTelemetryEvent'
LIMIT 10;
In this section, the significance of the telemetry events captured in the requestParameters field will be explained. The query begins by displaying key fields and their data, offering insights into how users interact with various features of Amazon Q Developer.
Query Breakdown:
eventTime: This field captures the time the event was recorded, providing insights into when specific user interactions took place.
userIdentity.onBehalfOf.userId: This extracts the userId of the user. This is critical for attributing interactions to the correct user, which will be covered in more detail later in the blog.
eventName: The query is filtered on SendTelemetryEvent. Telemetry events are triggered when the user interacts with particular features or when a developer uses the service.
requestParameters: The requestParameters field is crucial because it holds the details of the telemetry events. This field contains a rich set of information depending on the type of interaction and feature the developer uses, which programming languages are used, completion types, or code modifications.
In the context of the SendTelemetryEvent, various telemetry events are captured in the requestParameters field of CloudTrail logs. These events provide insights into user interactions, overall usage, and the effectiveness of Amazon Q Developer’s suggestions. Here are the key telemetry events along with their descriptions:
UserTriggerDecisionEvent
Description: This event is triggered when a user interacts with a suggestion made by Amazon Q Developer. It captures whether the suggestion was accepted or rejected, along with relevant metadata.
Key Fields:
completionType: Whether the completion was a block or a line.
suggestionState: Whether the user accepted, rejected, or discarded the suggestion.
programmingLanguage: The programming language associated with the suggestion.
generatedLine: The number of lines generated by the suggestion.
CodeScanEvent
Description: This event is logged when a code scan is performed. It helps track the scope and result of the scan, providing insights into security and code quality checks.
Key Fields:
codeAnalysisScope: Whether the scan was performed at the file level or the project level.
programmingLanguage: The language being scanned.
CodeScanRemediationsEvent
Description: This event captures user interactions with Amazon Q Developer’s remediation suggestions, such as applying fixes or viewing issue details.
Key Fields:
CodeScanRemediationsEventType: The type of remediation action taken (e.g., viewing details or applying a fix).
includesFix: A boolean indicating whether the user applied a fix.
ChatAddMessageEvent
Description: This event is triggered when a new message is added to an ongoing chat conversation. It captures the user’s intent which refers to the purpose or goal the user is trying to achieve with the chat message. The intent can include various actions, such as suggesting alternate implementations of the code, applying common best practices, improving the quality or performance of the code.
Key Fields:
conversationId: The unique identifier for the conversation.
messageId: The unique identifier for the chat message.
userIntent: The user’s intent, such as improving code or explaining code.
programmingLanguage: The language related to the chat message.
ChatInteractWithMessageEvent
Description: This event captures when users interact with chat messages, such as copying code snippets, clicking links, or hovering over references.
Key Fields:
interactionType: The type of interaction (e.g., copy, hover, click).
interactionTarget: The target of the interaction (e.g., a code snippet or a link).
acceptedCharacterCount: The number of characters from the message that were accepted.
acceptedSnippetHasReference: A boolean indicating if the accepted snippet included a reference.
TerminalUserInteractionEvent
Description: This event logs user interactions with terminal commands or completions in the terminal environment.
Key Fields:
terminalUserInteractionEventType: The type of interaction (e.g., terminal translation or code completion).
isCompletionAccepted: A boolean indicating whether the completion was accepted by the user.
terminal: The terminal environment in which the interaction occurred.
shell: The shell used for the interaction (e.g., Bash, Zsh).
Telemetry events are key to understanding how users engage with Amazon Q Developer. They track interactions such as code completion, security scans, and chat-based suggestions. Analyzing the data in the requestParameters field helps reveal usage patterns and behaviors that offer valuable insights.
By exploring events such as UserTriggerDecisionEvent, ChatAddMessageEvent, TerminalUserInteractionEvent, and others in the schema, organizations can assess the effectiveness of Amazon Q Developer and identify areas for improvement.
Example Queries for Analyzing Developer Engagement
To gain deeper insights into how developers interact with Amazon Q Developer, the following queries can help analyze key telemetry data from CloudTrail logs. These queries track in-line code suggestions, chat interactions, and code-scanning activities. By running these queries, you can uncover valuable metrics such as the frequency of accepted suggestions, the types of chat interactions, and the programming languages most frequently scanned. This analysis helps paint a clear picture of developer engagement and usage patterns, guiding efforts to enhance productivity.
These four examples only cover a sample set of the available telemetry events, but they serve as a starting point for further exploration of Amazon Q Developer’s capabilities.
SELECT
    eventTime,
    userIdentity.onBehalfOf.userId AS user_id,
    eventName,
    json_extract_scalar(requestParameters, '$.telemetryEvent.userTriggerDecisionEvent.suggestionState') AS suggestionState,
    json_extract_scalar(requestParameters, '$.telemetryEvent.userTriggerDecisionEvent.completionType') AS completionType
FROM
    amazon_q_metrics.cloudtrail_logs
WHERE
    eventName = 'SendTelemetryEvent'
    AND json_extract(requestParameters, '$.telemetryEvent.userTriggerDecisionEvent') IS NOT NULL
    AND json_extract_scalar(requestParameters, '$.telemetryEvent.userTriggerDecisionEvent.suggestionState') = 'ACCEPT';
Use Case:This use case focuses on how developers interact with in-line code suggestions by analyzing accepted snippets. It helps identify which users are accepting suggestions, the type of snippets being accepted (blocks or lines), and the programming languages involved. Understanding these patterns can reveal how well Amazon Q Developer aligns with the developers’ expectations.
Query Explanation: The query retrieves the event time, user ID, event name, suggestion state (filtered to show only ACCEPT), and completion type. TotalGeneratedLinesBlockAccept and totalGeneratedLinesLineAccept or discarded suggestions are not included, but this gives an idea of the developers using the service for in-line code suggestions and the lines or blocks they have accepted. Additionally, the programming language field can be extracted to see which languages are used during these interactions.
Query 2: Analyzing Chat Interactions
SELECT
    userIdentity.onBehalfOf.userId AS userId,
    json_extract_scalar(requestParameters, '$.telemetryEvent.chatInteractWithMessageEvent.interactionType') AS interactionType,
    COUNT(*) AS eventCount
FROM
    amazon_q_metrics.cloudtrail_logs
WHERE
    eventName = 'SendTelemetryEvent'
    AND json_extract(requestParameters, '$.telemetryEvent.chatInteractWithMessageEvent') IS NOT NULL
GROUP BY
    userIdentity.onBehalfOf.userId,
    json_extract_scalar(requestParameters, '$.telemetryEvent.chatInteractWithMessageEvent.interactionType')
ORDER BY
    eventCount DESC;
Use Case: This use case looks at how developers use chat options like upvoting, downvoting, and copying code snippets. Understanding the chat usage patterns shows which interactions are most used and how developers engage with Amazon Q Developer chat. As an organization, this insight can help support other developers in successfully leveraging this feature.
Query Explanation: The query provides insights into chat interactions within Amazon Q Developer by retrieving user IDs, interaction types, and event counts. This query aggregates data based on the interactionType field within chatInteractWithMessageEvent, showcasing various user actions such as UPVOTE, DOWNVOTE, INSERT_AT_CURSOR, COPY_SNIPPET, COPY, CLICK_LINK, CLICK_BODY_LINK, CLICK_FOLLOW_UP, and HOVER_REFERENCE.
This analysis highlights how users engage with the chat feature and the interactions, offering a view of interaction patterns. By focusing on the interactionType field, you can better understand how developers interact with the chat feature of Amazon Q Developer.
Query 3: Analyzing Code Scanning Jobs Across Programming Languages
SELECT
    userIdentity.onBehalfOf.userId AS userId,
    json_extract_scalar(requestParameters, '$.telemetryEvent.codeScanEvent.programmingLanguage.languageName') AS programmingLanguage,
    COUNT(json_extract_scalar(requestParameters, '$.telemetryEvent.codeScanEvent.codeScanJobId')) AS jobCount
FROM
    amazon_q_metrics.cloudtrail_logs
WHERE
    eventName = 'SendTelemetryEvent'
    AND json_extract(requestParameters, '$.telemetryEvent.codeScanEvent') IS NOT NULL
GROUP BY
    userIdentity.onBehalfOf.userId,
    json_extract_scalar(requestParameters, '$.telemetryEvent.codeScanEvent.programmingLanguage.languageName')
ORDER BY
    jobCount DESC;
Use Case: Amazon Q Developer includes security scanning, and this section helps determine how the security scanning feature is being used across different users and programming languages within the organization. Understanding these trends provides valuable insights into which users actively perform security scans and the specific languages targeted for these scans.
Query Explanation: The query provides insights into the distribution of code scanning jobs across different programming languages in Amazon Q Developer. It retrieves user IDs and the count of code-scanning jobs by programming language. This analysis focuses on the CodeScanEvent, aggregating data to show the total number of jobs executed per language.
By summing up the number of code scanning jobs per programming language, this query helps to understand which languages are most frequently analyzed. It provides a view of how users are leveraging the code-scanning feature. This can be useful for identifying trends in language usage and optimizing code-scanning practices.
Query 4: Analyzing User Activity across features.
SELECT
    userIdentity.onBehalfOf.userId AS user_id,
    COUNT(DISTINCT CASE
        WHEN json_extract(requestParameters, '$.telemetryEvent.userTriggerDecisionEvent') IS NOT NULL
        THEN eventId END) AS inline_suggestions_count,
    COUNT(DISTINCT CASE
        WHEN json_extract(requestParameters, '$.telemetryEvent.chatInteractWithMessageEvent') IS NOT NULL
        THEN eventId END) AS chat_interactions_count,
    COUNT(DISTINCT CASE
        WHEN json_extract(requestParameters, '$.telemetryEvent.codeScanEvent') IS NOT NULL
        THEN eventId END) AS security_scans_count,
    COUNT(DISTINCT CASE
        WHEN json_extract(requestParameters, '$.telemetryEvent.terminalUserInteractionEvent') IS NOT NULL
        THEN eventId END) AS terminal_interactions_count
FROM
    amazon_q_metrics.cloudtrail_logs
WHERE
    eventName = 'SendTelemetryEvent'
GROUP BY
    userIdentity.onBehalfOf.userId
Use Case:This use case looks at how developers use Amazon Q Developer across different features: in-line code suggestions, chat interactions, security scans, and terminal interactions. By tracking usage, organizations can see overall engagement and identify areas where developers may need more support or training. This helps optimize the use of Amazon Q Developer and helps teams get the most out of the tool.
Query Explanation: Let’s take the other events from the prior queries and additional events to get more detail overall and tie it all together. This expanded query provides a comprehensive view of user activity within Amazon Q Developer by tracking the number of in-line code suggestions, chat interactions, security scans, and terminal interactions performed by each user. By analyzing these events, organizations can gain a better understanding of how developers are using these key features.
By summing up the interactions for each feature, this query helps identify which users are most active in each category, offering insights into usage patterns and areas where additional training or support may be needed.
Enhancing Metrics with Display Names and Usernames
The previous queries had userid as a field; however, many customers would prefer to see a user alias (such as username or display name). The following section illustrates enhancing these metrics by augmenting user IDs with display names and usernames from the AWS IAM Identity Center. This will provide more human-readable user names.
In this example, the export is run locally to enhance user metrics with IAM Identity Center for simplicity. This method works well for demonstrating how to access and work with the data, but it provides a static snapshot of the users at the time of export. In a production environment, an automated solution would be preferable to capture newly added users continuously. For the purposes of this blog, this straightforward approach is used to focus on data access.
To proceed, install Python 3.8+ and Boto3, and configure AWS credentials via the CLI. Then, run the following Python script locally to export the data:
import boto3, csv
# replace this with the region of your IDC instance
RegionName='us-east-1'
# client creation
idstoreclient = boto3.client('identitystore', RegionName)
ssoadminclient = boto3.client('sso-admin', RegionName)

Instances= (ssoadminclient.list_instances()).get('Instances')
InstanceARN=Instances[0].get('InstanceArn')
IdentityStoreId=Instances[0].get('IdentityStoreId')

# query
UserDigestList = []
ListUserResponse = idstoreclient.list_users(IdentityStoreId=IdentityStoreId)
UserDigestList.extend([[user['DisplayName'], user['UserName'], user['UserId']] for user in ListUserResponse['Users']])
NextToken = None
if 'NextToken' in ListUserResponse.keys(): NextToken = ListUserResponse['NextToken']
while NextToken is not None:
    ListUserResponse = idstoreclient.list_users(IdentityStoreId=IdentityStoreId, NextToken=NextToken)
    UserDigestList.extend([[user['DisplayName'], user['UserName'], user['UserId']] for user in ListUserResponse['Users']])
    if 'NextToken' in ListUserResponse.keys(): NextToken = ListUserResponse['NextToken']
    else: NextToken = None

# write the query results to IDCUserInfo.csv
with open('IDCUserInfo.csv', 'w') as CSVFile:
    CSVWriter = csv.writer(CSVFile, quoting=csv.QUOTE_ALL)
    HeaderRow = ['DisplayName', 'UserName', 'UserId']
    CSVWriter.writerow(HeaderRow)
    for UserRow in UserDigestList:
        CSVWriter.writerow(UserRow)
This script will query the IAM Identity Center for all users and write the results to a CSV file, including DisplayName, UserName, and UserId. After generating the CSV file, upload it to an S3 bucket. Please make note of this S3 location.
Steps to Create an Athena Table from the above CSV output: Create a table in Athena to join the existing table with the user details.
1. Navigate to the AWS Management Console > Athena > Editor.
2. Click on the plus to create a query tab.
3. Run the following query to create our table. Note to update the location to your S3 bucket.
CREATE EXTERNAL TABLE amazon_q_metrics.user_data (
    DisplayName STRING,
    UserName STRING,
    UserId STRING
)
ROW FORMAT SERDE 'org.apache.hadoop.hive.serde2.OpenCSVSerde'
WITH SERDEPROPERTIES (
   'separatorChar' = ',',
   'quoteChar'     = '"'
)
STORED AS TEXTFILE
LOCATION 's3://{Update to your S3 object location}/'  -- Path containing CSV file
TBLPROPERTIES ('skip.header.line.count'='1');
4. Click Run
5. Now, let’s run a quick query to verify the data in the new table.
SELECT * FROM amazon_q_metrics.user_data limit 10;
The first query creates an external table in Athena from user data stored in a CSV file in S3. The user_data table has three fields: DisplayName, UserName, and UserId. To specify the correct parsing of the CSV, separatorChar is specified as a comma and quoteChar as a double quote. Additionally, the TBLPROPERTIES (‘skip.header.line.count’=’1’) flag skips the header row in the CSV file, ensuring that column names aren’t treated as data.
The user_data table holds key details: DisplayName (full name), UserName (username), and UserId (unique identifier). This table will be joined with the cloudtrail_q_metrics table using the userId field from the onBehalfOf struct, enriching the interaction logs with human-readable user names and display names instead of user IDs.
In the previous analysis of in-line code suggestions, the focus was on retrieving key metrics related to user interactions with Amazon Q Developer. The query below follows a similar structure but now includes a join with the user_data table to enrich insights with additional user details such as DisplayName and Username.
To include a join with the user_data table in the query, it is necessary to define a shared key between the cloudtrail_logs_amazon_q and user_data tables. For this example, user_id will be used.
SELECT
    logs.eventTime,
    user_data.displayname,  -- Additional field from user_data table
    user_data.username,     -- Additional field from user_data table
    json_extract_scalar(logs.requestParameters, '$.telemetryEvent.userTriggerDecisionEvent.suggestionState') AS suggestionState,
    json_extract_scalar(logs.requestParameters, '$.telemetryEvent.userTriggerDecisionEvent.completionType') AS completionType
FROM
    amazon_q_metrics.cloudtrail_logs AS logs  -- Specified database for cloudtrail_logs
JOIN
    amazon_q_metrics.user_data  -- Specified database for user_data
ON
    logs.userIdentity.onBehalfOf.userId = user_data.userid
WHERE
    logs.eventName = 'SendTelemetryEvent'
    AND json_extract_scalar(logs.requestParameters, '$.telemetryEvent.userTriggerDecisionEvent.suggestionState') = 'ACCEPT';
This approach allows for a deeper analysis by integrating user-specific information with the telemetry data, helping you better understand how different user roles interact with the in-line suggestions and other features of Amazon Q Developer.
Cleanup
If you have been following along with this workflow, it is important to clean up the resources to avoid unnecessary charges. You can perform the cleanup by running the following query in the Amazon Athena console:
-- Step 1: Drop the tables
DROP TABLE IF EXISTS amazon_q_metrics.cloudtrail_logs;
DROP TABLE IF EXISTS amazon_q_metrics.user_data;

-- Step 2: Drop the database after the tables are removed
DROP DATABASE IF EXISTS amazon_q_metrics CASCADE;
This query removes both the cloudtrail_logs and user_data tables, followed by the amazon_q_metrics database.
Remove the S3 objects used to store the CloudTrail logs and user data by navigating to the S3 console, selecting the relevant buckets or objects, and choosing “Delete.”
If a new CloudTrail trail was created, consider deleting it to stop further logging. For instructions, see Deleting a Trail. If an existing trail was used, remove the CodeWhisperer data events to prevent continued logging of those events.
Conclusion
By tapping into Amazon Q Developer’s logging capabilities, organizations can unlock detailed insights that drive better decision-making and boost developer productivity. The ability to analyze user-level interactions provides a deeper understanding of how the service is used.
Now that you have these insights, the next step is leveraging them to drive improvements. For example, organizations can use this data to identify opportunities for Proof of Concepts (PoCs) and pilot programs that further demonstrate the value of Amazon Q Developer. By focusing on areas where engagement is high, you can support the most engaged developers as champions to advocate for the tool across the organization, driving broader adoption.
The true potential of these insights lies in the “art of the possible.” With the data provided, it is up to you to explore how to query or visualize it further. Whether you’re examining metrics for in-line code suggestions, interactions, or security scanning, this foundational analysis is just the beginning.
As Amazon Q Developer continues to evolve, staying updated with emerging telemetry events is crucial for maintaining visibility into the available metrics. You can do this by regularly visiting the official Amazon Q Developer documentation and the Amazon Q Developer’s Changelog to stay up-to-date latest information and insights.
We’ve all been in a situation in which Zabbix was somehow unavailable. It can happen for a variety of reasons, and our goal is always to help you get everything back up and running as quickly as possible. In this blog post, we’ll show you what to do in the event of a Zabbix failure, and we’ll also go into detail about how to work with the Zabbix technical support team to resolve more complex issues.
Step by step: Understanding why Zabbix is unavailable
When Zabbix becomes unavailable, it’s important to follow a few key steps to try to resolve the problem as quickly as possible.
Check the service status. First, verify if your Zabbix service is truly inactive. You can do this by accessing the machine where Zabbix is installed and checking the service status using a command like systemctl status zabbix-serveron Linux.
Analyze the Zabbix logs. Check the Zabbix logs for any error messages or clues about what may have caused the failure.
Restart the service. If the Zabbix service has stopped, try restarting it using the appropriate command for your operating system. For example, on Linux, you can use sudo systemctl restart zabbix-server.
Check the database connectivity. Zabbix uses a database to store data and Zabbix server configurations. Make sure that the database is accessible and functioning properly. You can test database connectivity using tools like ping or telnet.
Check your available disk space. Verify that there is available disk space on the machine where Zabbix is installed. A lack of disk space is a common cause of system failures.
Evaluate dependencies. Make sure all Zabbix dependencies are installed and working correctly. This includes libraries, services, and any other software required for Zabbix to function.
If the problem persists after carrying out these steps, it may be necessary to refer to the official Zabbix documentation, seek help from the official Zabbix forum, or contact the Zabbix technical support team, depending on the severity and urgency of the situation.
Making the most of a Zabbix technical support contract
If you or your company have a Zabbix technical support contract, access to our global team of technical experts is guaranteed. This is an ideal option for resolving more complex or urgent issues. Here are a few steps you can follow when contacting the Zabbix technical support team:
Gather all important information. Before contacting the Zabbix technical support team, gather all relevant information about the issue you’re facing. This can include error messages, logs, screenshots, and any steps you’ve already taken to try to resolve the issue.
Open a ticket with the Zabbix technical support team. Contact Zabbix technical support by opening a ticket on the Zabbix Support System. Provide all the information gathered in the previous step to help the technicians understand the problem and find a solution as quickly as possible.
Explain exactly how Zabbix crashed. When describing the problem, be as precise and detailed as possible. Include information such as the Zabbix version you are using, your operating system, your network configuration, and any other relevant details that might help our team diagnose the issue.
Be available to follow up on the ticket. Once you’ve opened a ticket, be available to provide additional information or clarify any questions the support technicians may have. This will help speed up the problem resolution process.
Follow the Zabbix technical support team’s recommendations. After receiving recommendations, follow them carefully and test to see whether they resolve the issue. If the problem persists or if new issues arise, inform the Zabbix technical support team immediately so they can continue assisting you.
A Zabbix technical support subscription gives you access to a team of Zabbix experts who can help you configure and troubleshoot your Zabbix environment. Check out the benefits of each type of subscription on the Zabbix website and make sure you have all the support you need to keep your monitoring fully operational.
Zabbix plays a crucial role in monitoring all kinds of “things” – IoT devices,domains, cloud infrastructures and more. It can also be integrated with third-party solutions – for example, with Oxidized for configuration backup monitoring. Given the nature of Zabbix, it usually contains a lot of confidential information as well as (more importantly) some kind of elevated access to network elements while being used by operators, engineers, and customers. This requires that Zabbix as a product should be as secure as possible.
Zabbix has upped their security game and is actively working with HackerOne to take full advantage of the reach of their global community by providing a bug bounty program. And though it doesn’t happen too often, from time to time a security issue arises in Zabbix or one of its dependencies, warranting the release of a Security Advisory.
Table of Contents
The issue
Zabbix typically releases a Security Advisory and might even assign a CVE to the issue. Cool, that is what we expect from reputable software developers. They even inform their customers with support contracts before publishing the advisory, in order to allow them to patch installations beforehand.
Unfortunately, if you don’t have a support contract you’re expected to find out about these security advisories on your own, either by monitoring the Security Advisory page or by monitoring the published CVEs for Zabbix. NIST has a public API that can be used and that works well, but the issue with CVE’s is that they are often incomplete and thus useless. For example, CVE-2024-22119 contains far less information than the advisory.
Currently, Zabbix does not publish an API for their Security Advisories. There is the public tracker which contains all entries and can be queried via API, but because it is unstructured text, it is really hard to parse.
The solution
We want to automatically be notified of new security advisories, and the only data source that contains all data in a structured way is the Zabbix Security Advisory page. However, structured doesn’t mean easily parseable – in fact, it is just raw HTML. We could try to solve this issue in Zabbix, but the easier solution in this case is to scrape the page and generate a JSON file which then can be parsed by Zabbix to achieve our goal, which is automated notifications of new advisories.
Webscraping
We’ve chosen to scrape the Zabbix site using Rust, utilizing the Scraper crate to parse the HTML and flesh out the relevant parts we want. Without going into too much detail, the interesting information is stored in 2 tables, one with the table-simple class applied and one with the table-vertical class applied. Using CSS selectors (which is what the Scraper crate requires), we can retrieve the information we want.
This information is then stored in a struct, which gets added to a hashmap. The result is stored in a vector, which is added to a struct, which eventually is used to generate the JSON we require. Phew.
The ‘reports’ array contains one entry per advisory, and each entry has the following layout. Unsurprisingly, this closely matches the information that is available on the Zabbix Security Advisory page:
Now, we could provide you with the code of the scraping tool and wish you good luck with making sure the tool runs every X hours and somehow, somewhere stores the resulting JSON for Zabbix to parse. That would be the easy way out, right?
Instead, we’ve chosen to host the Rust program as an AWS Lambda function, triggered every 2 hours by the AWS EventBridge Scheduler and with some code added to the Rust program (function?) to upload the resulting JSON to an AWS S3 bucket. This chain of AWS products not only makes sure that our cloud bill increases, but also guarantees we don’t have to host (and maintain!) anything ourselves.
Now that the data is available in JSON, it’s fairly easy to parse it using Zabbix. Using the HTTP Agent data collection, we download the JSON from AWS. The URI is stored in the {$ZBX_ADVISORY_URI} macro, which allows for easy modification. By default, it points to the JSON file hosted on AWS S3. This retrieval is done by the Retrieve the Zabbix Security Advisories item, which acts as the source for every other operation. It retrieves the JSON every hour, and with the JSON being generated every 2 hours, the maximum delay between Zabbix publishing a new advisory and you getting it into Zabbix is 3 hours.
The retrieve the Zabbix Security Advisories item acts as a master item for the Last Updated item. This item uses a JSONPath preprocessing step to flesh out the information we want: $.last_updated.secs. The resulting data is stored as unixtime so that we mere mortals can easily read when the last update of the JSON file was performed.
A trigger is configured for this item to ensure that the JSON file isn’t too old. The trigger JSON Feed is out of date has the following expression: last(/Zabbix Security Advisories/zbx_sec.last_updated)>{$ZBX_ADVISORY_UPDATE_INTERVAL}*{$ZBX_ADVISORY_UPDATE_THRESHOLD}
By default, {$ZBX_ADVISORY_UPDATE_INTERVAL} is set to 2 hours (which is the interval the file gets updated by our tool) and {$ZBX_ADVISORY_UPDATE_THRESHOLD} is set to 3. So, when the JSON file hasn’t been updated within the last 6 hours, this trigger will trigger.
The item Number of advisories uses the same principle, where a JSONPath preprocessing step is used to flesh out the information we want: $.reports. However, as $.reports is an array, we can use functions on it. In this case .length(), which returns an integer. This number is used in the associated trigger A new Zabbix Security Advisory has been published, which simply triggers when the value changes.
This is all very cool, but the JSON has a lot more information, including details about each report. In order to get these details into Zabbix, we use a discovery rule to ‘loop’ through the JSON and create items based on what we’ve discovered: Discover Advisories. This rule uses (again) a JSONPath preprocessing step to get the details we want: $.reports[*][*]. Based on the resulting data (which is a single report in this case), 2 LLD Macros are assigned: {#ZBXREF} – based on the JSONpath $.zbxref and {{#CVEREF} – based on the JSONpath $.cveref.
For each discovered report, 8 items are created. They all work using the same principle, so I will only describe one: Advisory {#ZBXREF} / {#CVEREF} – Acknowledgement. This item uses the master item Zabbix Security Advisories, just like all other items described so far. JSONPath is once again used to get the information we want. The expression $.reports[*][“{#ZBXREF}”].acknowledgement.first() provides exactly what we need, where we combine a LLD macro ({#ZBXREF}) and a JSONpath function (.first()) to first ‘select’ the correct advisory in the JSON and then retrieve the value.
All other 7 items work like this, and there is only one exception: Advisory {#ZBXREF} / {#CVEREF} – Components. The ‘components’ value in the JSON file is actually an array with 1 or more items, describing which components might be affected. But we cannot store arrays in Zabbix, so we use another preprocessing step to convert the array into a string. A few lines of Javascript is all we need:
First, we parse the JSON input (‘value’) into an array, only to apply the javascript .toString() function on it. The toString method of arrays calls join() internally, which joins the array and returns one string containing each array element separated by commas, which is exactly what we want: a string, separated by commas.
To make working with these advisories easier, each item has the componenttag applied, with the value zabbix_security. If the item belongs to an advisory, the advisory tag is added with the value of {#ZBXREF} (which is the advisory number/name). That way, we can easily filter on all Zabbix Security items, filter on all items for a single advisory, and (to make things even better) the type tag is also applied, with the actual type being ‘workaround’ or ‘description.’ This allows for filtering on all Zabbix Security items, of the type ‘score’ (et cetera) to easily gain insight into the different advisories and their score, synopsis, description, components, et cetera.
Dashboard
The tags on the items allow for filtering, but with Zabbix 7.0 we can use all great new nifty features, such as the Item Navigator widget combined with the Item Value widget. Let’s take a look at what configuring such a dashboard might look like if you set up the Item Navigator widget as follows:
And then ‘link’ the Item Value widget to it:
You should get a somewhat decent dashboard. It isn’t perfect (given that the Item Value widget only seems to be able to display a single line of text) but it’s something.
Disclaimer
Though we use this functionality ourselves, this all comes without any guarantee. The technology used to retrieve data (screen scraping) is mediocre at best and could break at any moment if and when Zabbix changes the layout of their page.
For a few years, I’ve been monitoring 3 Digital Ocean servers with Datadog and using Datadog DogStatsD to submit custom metrics to Datadog. I am a big fan of Datadog and will continue recommending them. However, it became a bit too expensive for my needs, so I started looking for alternative options.
I decided to go down the self-hosted route as that was the least expensive option. I decided to go with Zabbix.
If you don’t know, Zabbix is a completely free, open source, and enterprise-ready monitoring service with a vast range of integrations for all of your monitoring needs. You can choose to install it on-premises or in the cloud.
I went with a $24 Basic Droplet in Digital Ocean with Regular SSD, which is actually below the minimum requirements that Zabbix specifies. It has been working fine and resource usage is minimal (around 40% RAM and 4% CPU use).
When you create a host to monitor, you assign templates. The templates are integrations you want to monitor, such as Apache, MySQL, and general Zabbix agent metrics like server performance (CPU, RAM, IO, etc.).
There were some things I had to create manually (including process monitoring) as I couldn’t find a built-in way of doing it. Datadog, had live process monitoring, so you could create a monitor which looks for a particular process, and then alert if that process wasn’t running.
Zabbix didn’t seem to have anything like this (that I could find) so I created custom templates and a custom shell script to look for the process name using the ps command (on Linux).
Another important function I needed was custom metric submission. This was originally done via the Datadog DogStatsD libraries available in pretty much any language, either as official libraries or via community versions. This would submit UDP data to the agent running locally on the server, and the agent would submit it to your Datadog account.
I didn’t want to rewrite all my apps to be able to send data to Zabbix, so I built a conversion tool. Its a small app I built in C# that listens on the same UDP socket as the Datadog agent (obviously, you’ll need to have the Datadog agent turned off). It receives the data from the Datadog DogStatsD libraries as normal, and the C# app converts the Datadog UDP data and submits an HTTP request to the Zabbix server via its API.
After everything was installed, I then re-created the various dashboards that I had from Datadog in Zabbix. A couple of examples are below:
In terms of access and configuration, all of the metrics are sent over the private interfaces of each droplet. Nothing is available via the public interface.
Logging into the Zabbix web portal is done via a Cloudflare Tunnel that allows me to connect to the web portal over the private interface via the Cloudflare tunnels running on each of the servers for fault tolerance. This provides multiple levels of authentication, as you have to authenticate to Cloudflare and authenticate with Zabbix.
This post was designed as an overview to show that it is possible to migrate from Datadog to Zabbix fairly easily, with a small amount of development involved to convert Datadog custom metrics to Zabbix via the C# app.
The C# app isn’t publicly available, but if there is some demand for it I can look at open sourcing it. If you want a full rundown of how I migrated and set up the Zabbix server and the servers being monitored, please let me know and I can do a more in-depth blog post!
Did you know that Amazon Q Developer, a new type of Generative AI-powered (GenAI) assistant, can help developers and DevOps engineers accelerate Infrastructure as Code (IaC) development using the AWS Cloud Development Kit (CDK)?
IaC is a practice where infrastructure components such as servers, networks, and cloud resources are defined and managed using code. Instead of manually configuring and deploying infrastructure, with IaC, the desired state of the infrastructure is specified in a machine-readable format, like YAML, JSON, or modern programming languages. This allows for consistent, repeatable, and scalable infrastructure management, as changes can be easily tracked, tested, and deployed across different environments. IaC reduces the risk of human errors, increases infrastructure transparency, and enables the application of DevOps principles, such as version control, testing, and automated deployment, to the infrastructure itself.
There are different IaC tools available to manage infrastructure on AWS. To manage infrastructure as code, one needs to understand the DSL (domain-specific language) of each IaC tool and/or construct interface and spend time defining infrastructure components using IaC tools. With the use of Amazon Q Developer, developers can minimize time spent on this undifferentiated task and focus on business problems. In this post, we will go over how Amazon Q Developer can help deploy a fully functional three-tier web application infrastructure on AWS using CDK. AWS CDK is an open-source software development framework to define cloud infrastructure in modern programming languages and provision it through AWS CloudFormation.
Amazon Q Developer is a generative artificial intelligence (AI)-powered conversational assistant that can help you understand, build, extend, and operate AWS applications. You can ask questions about AWS architecture, your AWS resources, best practices, documentation, support, and more. Amazon Q Developer is constantly updating its capabilities so your questions get the most contextually relevant and actionable answers.
In the following sections, we will take a real-world three-tier web application that uses serverless architecture and showcase how you can accelerate AWS CDK code development using Amazon Q Developer as an AI coding companion and thus improve developer productivity.
Prerequisites
To begin using Amazon Q Developer, the following are required:
You are a DevOps engineer at a software company and have been tasked with building and launching a new customer-facing web application using a serverless architecture. It will have three tiers, as shown below, consisting of the presentation layer, application layer, and data layer. You have decided to utilize Amazon Q Developer to deploy the application components using AWS CDK.
Figure 1 – Serverless Application Architecture
Accelerating application deployment using Amazon Q Developer as an AI coding companion
Let’s dive into how Amazon Q Developer can be used as an expert companion to accelerate the deployment of the above serverless application resources using AWS CDK.
1. Deploy Presentation Layer Resources
Creating a secured Amazon S3 bucket to host static assets and front it using Amazon CloudFront
When building modern serverless web applications that host large static content, a key architecture consideration is how to efficiently and securely serve static assets such as images, CSS, and JavaScript files. Simply serving these from your application servers can lead to scaling and performance bottlenecks with increased resource utilization (e.g., CPU, I/O, network) on servers. This is where leveraging AWS services like Amazon Simple Storage Service (Amazon S3) and Amazon CloudFront can be a game-changer. By hosting your static content in a secured S3 bucket, you unlock several powerful benefits. First and foremost, you get robust security controls through S3 bucket policies and CloudFront Origin Access Control (OAC) to ensure only authorized access. This is critical for protecting your assets. Secondly, you take load off your application servers by having CloudFront directly serve static assets from its globally distributed edge locations. This improves application performance and reduces operational costs. AWS CDK helps to simplify the infrastructure provisioning by allowing developers to define S3 bucket and CloudFront resource configurations in a modern programming language using CDK constructs that enhance security and include best practices recommendations.
In this application architecture, we will use Amazon Q Developer to develop AWS CDK code to provision presentation layer resources, which include a secured S3 bucket with public access disabled and an Origin Access Control (OAC) that is used to grant CloudFront access to the S3 bucket to securely serve the static assets of the application.
Prompt: Create a cdk stack with python that creates an s3 bucket for cloudfront/s3 static asset, ensure it is secured by using Origin Access Control (OAC)
Using Amazon Q to Generate python CDK code for the presentation layer resources
Developers can customize these configurations using Amazon Q Developer based on your specific security requirements, such as implementing access controls through IAM policies or enabling bucket logging for audit trails. This approach ensures that the S3 bucket is configured securely, aligning with best practices for data protection and access management.
Lets look at an example of adding CloudTrail logging to the S3 bucket:
Prompt: Update the code to include cloudtrail logging to the S3 bucket created
Using Amazon Q Developer to add CloudTrail logging to the S3 bucket
2. Deploy Application Layer Resources
Provision AWS Lambda and Amazon API Gateway to serve end-user requests
Amazon Q Developer makes it easy to provision serverless application backend infrastructure such as AWS Lambda and Amazon API Gateway using AWS CDK. In the above architecture, you can deploy the Lambda function hosting application code, with just a few lines of CDK code along with Lambda configuration such as function name, runtime, handler, timeouts, and environment variables. This Lambda function is fronted using Amazon API Gateway to serve user requests. Anything from a simple micro-service to a complex serverless application can be defined through code in CDK using Amazon Q assistance and deployed repeatedly through CI/CD pipelines. This enables infrastructure automation and consistent governance for applications on AWS.
Prompt: Create a CDK stack that creates a AWS Lambda function that is invoked by Amazon API Gateway
Using Amazon Q Developer to generate CDK code to create an AWS Lambda function that is invoked by Amazon API Gateway
3. Deploy Data Layer Resources
Provision Amazon DynamoDB tables to host application data
By leveraging Amazon Q Developer, we can generate CDK code to provision DynamoDB tables using CDK constructs that offer AWS default best practice recommendations. With Amazon Q Developer, using the CDK construct library, we can define DynamoDB table names, attributes, secondary indexes, encryption, and auto-scaling in just a few lines of CDK code in our programming language of choice. With CDK, this table definition is synthesized into an AWS CloudFormation template that is deployed as a stack to provision the DynamoDB table with all the desired settings. Any data layer resources can be defined this way as Infrastructure as Code (IAC) using Amazon Q Developer. Overall, Amazon Q Developer drastically simplifies deploying managed data backends on AWS through CDK while enforcing best practices around data security, access control, and scalability leveraging CDK constructs.
Prompt: Create a CDK stack of a DynamoDB table with 100 read capacity units and 100 write capacity units.
Using Amazon Q Developer to generate CDK code to create a DynamoDB with 100 read capacity units and 100 write capacity units
4. Monitoring the Application Components
Monitoring using Amazon CloudWatch
Once the application infrastructure stack has been provisioned, it’s important to setup observability to monitor key metrics, detect any issues proactively, and alert operational teams to troubleshoot and fix issues to minimize application downtime. To get started with observability, developers can leverage Amazon CloudWatch, a fully managed monitoring service. With the use of AWS CDK, it is easy to codify CloudWatch components such as dashboards, metrics, log groups, and alarms alongside the application infrastructure and deploy them in an automated and repeatable way leveraging the AWS CDK construct library. Developers can customize these metrics and alarms to meet their workload requirements. All the monitoring configuration gets deployed as part of the infrastructure stack.
Developers can use Amazon Q Developer to assist with setting up application monitoring in AWS using CloudWatch and CDK. With Q, you can describe the resources you want to monitor, such as EC2 instances, Lambda functions, and RDS databases. Q will then generate the necessary CDK code to provision the appropriate CloudWatch alarms, metrics, and dashboards to monitor the resources. By describing what you want to monitor in natural language, Q handles the underlying complexity of generating code.
Prompt: Create a CDK stack of a Cloudwatch event rule to stop web instance EC2 instance every day at 15:00 UTC
Using Amazon Q Developer to generate CDK code to create a CloudWatch event rule to stop an EC2 instance at 15:00 UTC
5. Automate CI/CD of the application
Build a CDK Pipeline for Continuous Integration(CI) and Continuous Deployment(CD) of the Infrastructure
As you iterate on your serverless application, you’ll want a smooth, automated way to reliably deploy infrastructure changes using a CI/CD pipeline. This is where implementing a CDK pipeline, an automated deployment pipeline, becomes useful. As we’ve seen, AWS Cloud Development Kit (CDK) allows you to define your entire multi-tier infrastructure as a reusable, version-controlled code construct. From S3 buckets to CloudFront, API Gateway, Lambda functions, databases and more, all of these can be deployed with IaC. This CI/CD pipeline streamlines the process of deploying both infrastructure and application code, integrating seamlessly with CI/CD best practices.
Here’s how you can leverage Amazon Q Developer to streamline the process of creating a CDK pipeline.
Prompt: Using python, create a CDK pipeline that deploys a three tier serverless application.
Using Amazon Q Developer to generate CDK pipeline using Python
By leveraging Amazon Q Developer in your IDE for CDK pipeline creation, you can speed up adoption of CI/CD best practices, and receive real-time guidance on CDK deployment patterns, making the development process smoother. This CI/CD integration accelerates your CDK development experience, and allows you to focus on building robust and scalable AWS applications.
Conclusion
In this post, you have learned how developers can leverage Amazon Q Developer, a generative-AI powered assistant, as a true expert AI companion in assisting with accelerating Infrastructure As Code (IaC) Development using AWS CDK and seen how to deploy and manage AWS resources of a three-tier serverless application using AWS CDK. In addition to Infrastructure As Code, Amazon Q Developer can be leveraged to accelerate software development, minimize time spent on undifferentiated coding tasks, and help with troubleshooting, so that developers can focus on creative business problems to delight end-users. See the Amazon Q Developer documentation to get started.
This post demonstrates how Amazon Q Developer, a generative AI-powered assistant for software development, helps create Terraform templates. Terraform is an infrastructure as code (IaC) tool that provisions and manages infrastructure on AWS safely and predictably. When used in an integrated development environment (IDE), Amazon Q Developer assists with software development, including code generation, explanation, and improvements. This blog highlights the 5 most used cases to show how Amazon Q Developer can generate Terraform code snippets:
Secure Networking Deployment: Generate Terraform code snippet to create an Amazon Virtual Private Cloud (VPC) with subnets, route tables, and security groups.
Multi-Account CI/CD Pipelines with AWS CodePipeline: Generate Terraform code snippet for setting up continuous integration and continuous delivery (CI/CD) pipelines using AWS CodePipeline across multiple AWS accounts.
Event-Driven Architecture: Generate Terraform code snippet to set up an event-driven architecture using Amazon EventBridge, AWS Lambda, Amazon API Gateway, and other serverless services.
Machine Learning Workflows: Generate Terraform module for deploying machine learning workflows using AWS SageMaker.
Terraform Project Structure
First, you want to understand the best practices and requirements for setting up a multi-environment Terraform Infrastructure as Code (IaC) project. Following industry practices from the start is crucial to manage your multi-environment infrastructure and this is where Amazon Q will recommend a standard folder and file structure for organising Terraform templates and managing infrastructure deployments.
Amazon Q Developer recommended organising Terraform templates in separate folders for each environment, with sub-folders to group resources into modules. It provided best practices like version control, remote backend, and tagging for reusability and scalability. We can ask Amazon Q Developer to generate a sample example for better understanding.
You can see that the recommended folder structure includes a root project folder and sub-folders for environments and modules. The sub-folders manage multiple environments (like development, testing, production), reusable modules (like Virtual Private Cloud (VPC), Elastic Compute Cloud (EC2)) for various components and it demonstrates references to manage Terraform templates for individual environments and components. Let’s explore the top 5 most common use cases one by one.
Now, we can ask Amazon Q Developer to generate a Terraform template for building components like Virtual Private Cloud (VPC) and subnets. The Terraform code generated by Amazon Q Developer for a VPC, private subnet, and public subnet. It also added tags to each resource, following best practices. To leverage the suggested code snippet in your template, open the vpc.tf file and either insert it at the cursor or copy it into the file. Additionally, Amazon Q Developer created an Internet Gateway, Route Tables, and associated them with the VPC.
2. Multi-Account CI/CD Pipelines with AWS CodePipeline
Let’s discuss the second use case: a CI/CD (Continuous Integration/Continuous Deployment) pipeline using AWS CodePipeline to deploy Terraform code across multiple AWS accounts. Assume this is your first time working on this use case. Use Amazon Q Developer to understand the pipeline’s design stages and requirements for creating your pipeline across AWS accounts. I asked Amazon Q Developer about the pipeline stages and requirements to deploy across AWS accounts.
Amazon Q Developer provided all the main stages for the CI/CD (Continuous Integration/Continuous Deployment) pipeline:
Source stage pulls the Terraform code from the source code repository.
Plan stage includes linting, validation, or running terraform plan to view the Terraform plan before deploying the code.
Build stage performs additional testing for the infrastructure to ensure all components will be created successfully.
Deploy stage runs terraform apply.
Amazon Q Developer also provided all the requirements needed before creating the CI/CD pipeline. These requirements include terraform is installed in the pipeline environment, IAM roles that will be assumed by the pipeline stages to deploy the terraform code across different accounts, an Amazon S3 bucket to store the state of the terraform code, source code repository to store our terraform files, use parameters to store sensitive data like AWS accounts IDs and AWS CodePipeline to create our CI/CD pipeline.
You will use Amazon Q Developer now to generate the terraform code for the CI/CD pipeline based on stages design proposed by the services in the previous question.
We would like to highlight three things here:
1. Amazon Q Developer suggested all the stages for our Continuous Integration/Continuous Deployment (CI/CD) design:
Source Stage: this stage pulls the code from the source code repository.
Build Stage: this stage will validates the infrastructure code, run a Terraform plan stage, and can automate any review.
Deploy Stage: this stage deploys the terraform code to the target AWS account.
2. Amazon Q Developer generated the build stage before the plan and this is expected in any CI/CD pipeline. First, we start with building the artifacts, running any tests or validation steps. If this stage is passed successfully, it will then proceed to terraform plan. 3. Amazon’s Q Developer suggests deploying to separate stages for each target account, aligning with the best practice of using different AWS accounts for development, testing, and production environments. This reduces the blast radius and allows configuring a separate stage for each environment/account.
3. Event-Driven Architecture
For the next use case, we will start by asking Amazon Q Developer to explain Event-driven architecture. As shown below, Amazon Q Developer highlights the important aspects that we need to consider when designing event-driven architecture like:
An event that represents an actual change in the application state like S3 object upload.
The event source that produces the actual event like Amazon S3.
An event route that routes the event between source and target.
An event target that consumes the event like AWS Lambda function.
Assume you want to build a sample Event-driven architecture using Amazon SNS as a simple pub/sub. In order to build such architecture, we will need:
An Amazon SNS topic to publish events to an Amazon SQS queue subscriber.
An Amazon SQS queue which subscribe to SNS topic.
Asking Amazon Q Developer to create a terraform code for the above use case, it generated a code that can get us started in seconds. The code includes:
Create an SNS Topic and SQS queue
Subscribe SQS queue to SNS topic
AWS IAM policy to allow SNS to write to SQS
4. Container Orchestration (Amazon ECS Fargate)
Now to our next use case, we want to build an Amazon ECS cluster with Fargate. Before we start, we will ask Amazon Q Developer about Amazon ECS and the difference between using Amazon EC2 or Fargate option.
Amazon Q Developer not only provides details about Amazon ECS capabilities and well-defined description about the difference between Amazon EC2 and Fargate as compute options, and also a guide when to use what to help in decision making process.
Now, we will ask Amazon Q Developer to suggest a terraform code to create an Amazon ECS cluster with Fargate as the compute option.
Amazon Q Developer suggested the key resources in the Terraform code for the ECS cluster, the resources are:
An Amazon ECS Cluster.
A sample task definition for an Nginx container with all the required configuration for the container to run.
ECS service with Fargate as launch type for the container to run.
5. Secure Machine Learning Workflows
Now let us explore final use case on setting up Machine Learning workflow. Assuming I am new to ML on AWS, I will first try to understand the best practices and requirements for ML workflows. We can ask Amazon Q Developer to get the recommendations for the resources, security policies etc.
Amazon Q Developer provided recommendations to provision SageMaker resources in private VPC, implement authentication and authorization using AWS IAM, encrypt data at rest and in transit using AWS KMS and setup secure CI/CD. Once I get the recommendations, I can identify the resources which I need to build MLOps workflow.
Amazon Q Developer suggested resources such as a SageMaker Studio instance, model registry, endpoints, version control, CI/CD Pipeline, CloudWatch etc. for ML model building, training and deployment using SageMaker. Now I can start building Terraform templates to deploy these resources. To get the code recommendations, I can ask Amazon Q Developer to give a Terraform snippet for all these resources.
Conclusion
In this blog post, we showed you how to use Amazon Q Developer, a generative AI–powered assistant from AWS, in your IDE to quickly improve your development experience when using an infrastructure-as-code tool like Terraform to create your AWS infrastructure. However, we would like to highlight some important points:
Code Validation and Testing: Always thoroughly validate and test the Terraform code generated by Amazon Q Developer in a safe environment before deploying it to production. Automated code generation tools can sometimes produce code that may need adjustments based on your specific requirements and configurations.
Security Considerations: Ensure that all security practices are followed, such as least privilege principles for IAM roles, proper encryption methods for sensitive data, and continuous monitoring for security compliance.
Limitations of Amazon Q Developer: While Amazon Q Developer provides valuable assistance, it may not cover all edge cases or specific customizations needed for your infrastructure. Always review the generated code and modify it as necessary to fit your unique use cases.
Updates and Maintenance: Infrastructure and services on AWS are continuously evolving. Make sure to keep your Terraform code and the use of Amazon Q Developer updated with the latest best practices and AWS service changes.
Real-Time Assistance: Use Amazon Q Developer in your IDE to enhance generated code as it provides real-time recommendations based on your existing code and comments. The suggestions are based on your existing code and comments, which are in this case generated by Amazon Q Developer.
To get started with Amazon Q Developer for debugging today navigate to Amazon Q Developer in IDE and simply start asking questions about debugging. Additionally, explore Amazon Q Developer workshop for additional hands-on use cases.
For any inquiries or assistance with Amazon Q Developer, please reach out to your AWS account team.
In this post, we guide you through five common components of efficient code debugging. We also show you how Amazon Q Developer can significantly reduce the time and effort required to manually identify and fix errors across numerous lines of code. With Amazon Q Developer on your side, you can focus on other aspects of software development, such as design and innovation. This leads to faster development cycles and more frequent releases, as you as a software developer can allocate less time to debugging and more time to building new features and functionality.
Debugging is a crucial part of the software development process. It involves identifying and fixing errors or bugs in the code to ensure that it runs smoothly and efficiently in the production environment. Traditionally, debugging has been a time-consuming and labor-intensive process, requiring developers to manually search through lines of code to investigate and subsequently fix errors. With Amazon Q Developer, a generative AI–powered assistant that helps you learn, plan, create, deploy, and securely manage applications faster, the debugging process becomes more efficient and streamlined. This enables you to easily understand the code, detect anomalies, fix issues and even automatically generate the test cases for your application code.
Let’s consider the following code example, which utilizes Amazon Bedrock, Amazon Polly, and Amazon Simple Storage Service (Amazon S3) to generate a speech explanation of a given prompt. A prompt is the message sent to a model in order to generate a response. It constructs a JSON payload with the prompt (for example – “explain black holes to 8th graders”) and configuration for the Claude model, and invokes the model via the Bedrock Runtime API. Amazon Polly converts the Large Language Model (LLM) response into an audio output format which is then uploaded to an Amazon S3 bucket location:
The first step in debugging your code is to understand what the code is doing. Very often you have to build upon code from others. Amazon Q Developer comes with an inbuilt feature that allows it to quickly explain the selected code and identify the main components and functions. This feature utilizes natural language processing (NLP) and summarization capability of LLMs, making your code easy to understand, and helping you identify potential issues. To gain deeper insights into your codebase, simply select your code, right-click and select ‘Send to Amazon Q’ option from menu. Finally, click on “Explain” option.
Amazon Q Developer generates an explanation of the code, highlighting the key components and functions. You can then use this summary to quickly identify potential issues and minimize your debugging efforts. It demonstrates how Amazon Q Developer accepts your code as input and the summarizes it for you. It explains the code in a natural language, which can help developers understand and debug the code.
If you have any follow-up question regarding the given explanation, you can also ask Amazon Q Developer for more in-depth review of a specific task. With respect to the code context, Amazon Q Developer automatically understands the existing code functionality and provides more insights. We ask Amazon Q Developer to explain how the Amazon Polly service is being used for synthesizing in the sample code snippet. It provides detailed step-by-step clarification from the retrieval to the upload process. Using this approach, you can ask any clarifying questions similar to asking a colleague to help you better understand a topic.
2. Amplify debugging with Logs
The sample code is deficient in terms of support for debugging including proper exception handling mechanisms. This makes it difficult to identify and handle issues during the execution or runtime of the application, further causing delays in the overall development process. You can instruct Amazon Q Developer to add a new code block for debugging your application against potential failures. Amazon Q Developer analyzes the existing code and then recommends to add a new code snippet to include printing and logging of debug messages and exception handling. It embeds ‘try-except’ blocks to catch potential exceptions that may occur. You use the recommended code after reviewing and modifying it. For example, you need to update the variable REPLACE_WITH_YOUR_BUCKET_NAME with your actual Amazon S3 bucket name.
With Amazon Q, you seamlessly enhance your codebase by selecting specific code segments and providing them as prompts. This enables you to explore suggestions for incorporating the required exception handling mechanisms or strategic logging statements.
Logs are an essential tool for debugging your application code. They allow you to track the execution of your code and identify where errors are occurring. With Amazon Q Developer, you can view and analyze log data from your application, and identify issues and errors that may not be immediately apparent from the code. It demonstrates that the given code does not have the logging statements embedded.
You can provide a prompt to Amazon Q Developer in the chat window asking it to write a code to enable logging and add log statements. This will automatically add logging statements wherever needed. It is useful to log inputs, outputs, and errors when making API calls or invoking models. You may copy the entire recommended code to the clipboard, review it, and then modify as needed. For example, you can decide which logging level you want to use, INFO or DEBUG.
3. Anomaly Detection
Another powerful use case for Amazon Q Developer is anomaly detection in your application code. Amazon Q Developer uses machine learning algorithms to identify unusual patterns in your code and highlight potential issues. It can detect issues that may be difficult to detect, such as an array out of bounds, infinite loops, or concurrency issues. For demonstration purposes, we intentionally introduce a simple anomaly in the code. We ask Amazon Q Developer to detect the anomaly in the code when attempting to generate text from the response. A simple prompt about detecting anomalies in the given code generates a useful output. It is able to detect the anomaly in the ‘response_body’ dictionary. Additionally, Amazon Q Developer recommends best practices to check the status code and handle the errors with a code snippet.
With code anomaly detection at your fingertips, you can promptly identify issues that may be impacting the application’s performance or user experience.
4. Automated Bug Fixing
After conducting all the necessary analysis, you can use Amazon Q Developer to fix bugs and issues in the code. Amazon Q Developer’s automated bug-fixing feature saves you hours you would otherwise spend on debugging and testing the code without its help. Starting with the code example which has an anomaly, you can identify and fix the code issue by simply selecting the code and sending it to Amazon Q Developer to apply fixes.
Amazon Q Developer identifies and suggests various ways to fix common issues in your code, such as syntax errors, logical errors, and performance issues. It can also recommend optimizations and improvements to your code, helping you to deliver a better user experience and improve your application’s performance.
5. Automated Test Case Generation
Testing is an integral part of code development and debugging. Running high quality test cases improve the quality of the code. With Amazon Q Developer, you can automatically generate the test cases quickly and easily. Amazon Q Developer uses its Large Language Model core to generate test cases based on your code, identifying potential issues and ensuring that your code is comprehensive and reliable.
With automated test case generation, you save time and effort while testing your code, ensuring that it is robust and reliable. A natural language prompt is sent to Amazon Q Developer to suggest test cases for given application code. You can notice that Amazon Q Developer provides a list of possible test cases that can aid in debugging and generating further test cases.
After receiving suggestions for test cases, you can also ask Amazon Q Developer to generate code snippet for some or all of the identified test cases.
Conclusion:
Amazon Q Developer revolutionizes the debugging process for developers by leveraging advanced and natural language understanding and generative AI capabilities. From explaining and summarizing code to detecting anomalies, implementing automatic bug fixes, and generating test cases, Amazon Q Developer streamlines common aspects of debugging. Developers can now spend less time manually hunting for errors and more time innovating and building features. By harnessing the power of Amazon Q, organizations can accelerate development cycles, improve code quality, and deliver superior software experiences to their customers.
To get started with Amazon Q Developer for debugging today navigate to Amazon Q Developer in IDE and simply start asking questions about debugging. Additionally, explore Amazon Q Developer workshop for additional hands-on use cases.
For any inquiries or assistance with Amazon Q Developer, please reach out to your AWS account team.
Today, Amazon Web Services (AWS) announced the release of workspace context awareness in Amazon Q Developer chat. By including @workspace in your prompt, Amazon Q Developer will automatically ingest and index all code files, configurations, and project structure, giving the chat comprehensive context across your entire application within the integrated development environment (IDE).
Throughout the software development lifecycle, developers, and IT professionals face challenges in understanding, creating, troubleshooting, and modernizing complex applications. Amazon Q Developer’s workspace context enhances its ability to address these issues by providing a comprehensive understanding of the entire codebase. During the planning phase, it enables gaining insights into the overall architecture, dependencies, and coding patterns, facilitating more complete and accurate responses and descriptions. When writing code, workspace awareness allows Amazon Q Developer to suggest code and solutions that require context from different areas without constant file switching. For troubleshooting, deeper contextual understanding aids in comprehending how various components interact, accelerating root cause analysis. By learning about the collection of files and folders in your workspace, Amazon Q Developer delivers accurate and relevant responses, tailored to the specific codebase, streamlining development efforts across the entire software lifecycle.
In this post, we’ll explore:
How @workspace works
How to use @workspace to:
Understand your projects and code
Navigate your project using natural language descriptions
Generate code and solutions that demonstrate workspace awareness
How to get started
Our goal is for you to gain a comprehensive understanding of how the @workspace context will increase developer productivity and accuracy of Amazon Q Developer responses.
How @workspace works
Amazon Q Developer chat now utilizes advanced machine learning in the client to provide a comprehensive understanding of your codebase within the integrated development environment (IDE).
The key processes are:
Local Workspace Indexing: When enabled, Amazon Q Developer will index programming files or configuration files in your project upon triggering with @workspace for the first time. Non-essential files like binaries and those specified in .gitignore are intelligently filtered out during this process, focusing only on relevant code assets. This indexing takes approximately 5–20 minutes for workspace sizes up to 200 MB.
Persisted and Auto-Refreshed Index: The created index is persisted to disk, allowing fast loading on subsequent openings of the same workspace. If the index is over 24 hours old, it is automatically refreshed by re-indexing all files.
Memory-Aware Indexing: To prevent resource overhead, indexing stops at either a hard limit on size or when available system memory reaches a minimum threshold.
Continuous Updates: After initial indexing, the index is incrementally updated whenever you finish editing files in the IDE by closing the file or moving to another tab.
By creating and maintaining a comprehensive index of your codebase, Amazon Q Developer is empowered with workspace context awareness, enabling rich, project-wide assistance tailored to your development needs. When responding to chat requests, instructions, and questions, Amazon Q Developer can now use its knowledge of the rest of the workspace to augment the context of the currently open files.
Let’s see how @workspace can help!
Customer Use-Cases
Onboarding and Knowledge Sharing
You can quickly get up to speed on implementation details by asking questions like What are the key classes with application logic in this @workspace?
You can ask other discovery questions about how code works: Does this application authenticate players prior to starting a game? @workspace
You can then follow up with documentation requests: Can you document, using markdown, the workflow in this @workspace to start a game?
Project-Wide Code Discovery and Understanding
You can understand how a function or class is used across the workspace by asking: How does this application validate the guessed word’s correctness? @workspace
You can then ask about how this is communicated to the player: @workspace How are the results of this validation rendered to the web page?
Code Generation with Multi-File Context
You can also generate tests, new features, or extend functionality while leveraging context from other project files with prompts like @workspace Find the class that generates the random words and create a unit test for it.
Project-Wide Analysis and Remediation
Create data flow diagrams that require application workflow knowledge with @workspace Can you provide a UML diagram of the data flow between the front-end and the back-end? Using your built-in UML Previewer you can view the resulting diagram.
With @workspace, Amazon Q Developer chat becomes deeply aware of workspace’s unique code, enabling efficient development, maintenance, and knowledge sharing.
Getting Started
Enabling the powerful workspace context capability in Amazon Q Developer chat is straightforward. Here’s how to get started:
Open Your Project in the IDE: Launch your integrated development environment (IDE) and open the workspace or project you want the Amazon Q to understand.
Start a New Chat Session: Start a new chat session within the Amazon Q Developer chat panel if not already open.
“Enable” Workspace Context :To activate the project-wide context, simply include @workspace in the prompt. For example: How does the authentication flow work in this @workspace? When enabled, the first time Amazon Q Developer sees the @workspace keyword for the current workspace, Amazon Q Developer will ingest and analyze the code, configuration, and structure of the project.
If not already enabled, Amazon Q Developer will instruct you to do so.
Select the check the box for Amazon Q: Local Workspace Index
Try Different Query Types: With @workspace context, you can ask a wide range of questions and provide instructions that leverage the full project context:
Where is the business logic to handle users in this @workspace?
@workspace Explain the data flow between the frontend and backend.
Add new API tests using the existing test utilities found in the @workspace.
Iterate and Refine: Try rephrasing your query or explicitly including more context by selecting code or mentioning specific files when the response doesn’t meet your expectations. The more relevant information you provide, the better Amazon Q Developer can understand your intent. For optimal results using workspace context, it’s recommended to use specific terminology present in your codebase, avoid overly broad queries, and leverage available examples, references, and code snippets to steer Amazon Q Developer effectively.
Conclusion
In this post we introduced Amazon Q Developer’s workspace awareness in chat via the @workspace keyword, highlighting the benefits of using workspace when understanding code, responding to questions, and generating new code. By allowing Amazon Q Developer to analyze and understand your project structure, workspace context unlocks new possibilities for development productivity gains.
If you are new to Amazon Q Developer, I highly recommend you check out Amazon Q Developer documentation and the Q-Words workshop.
Customers with data engineers and data scientists are using Amazon Managed Workflows for Apache Airflow (Amazon MWAA) as a central orchestration platform for running data pipelines and machine learning (ML) workloads. To support these pipelines, they often require additional Python packages, such as Apache Airflow Providers. For example, a pipeline may require the Snowflake provider package for interacting with a Snowflake warehouse, or the Kubernetes provider package for provisioning Kubernetes workloads. As a result, they need to manage these Python dependencies efficiently and reliably, providing compatibility with each other and the base Apache Airflow installation.
Python includes the tool pip to handle package installations. To install a package, you add the name to a special file named requirements.txt. The pip install command instructs pip to read the contents of your requirements file, determine dependencies, and install the packages. Amazon MWAA runs the pip install command using this requirements.txt file during initial environment startup and subsequent updates. For more information, see How it works.
Creating a reproducible and stable requirements file is key for reducing pip installation and DAG errors. Additionally, this defined set of requirements provides consistency across nodes in an Amazon MWAA environment. This is most important during worker auto scaling, where additional worker nodes are provisioned and having different dependencies could lead to inconsistencies and task failures. Additionally, this strategy promotes consistency across different Amazon MWAA environments, such as dev, qa, and prod.
This post describes best practices for managing your requirements file in your Amazon MWAA environment. It defines the steps needed to determine your required packages and package versions, create and verify your requirements.txt file with package versions, and package your dependencies.
Best practices
The following sections describe the best practices for managing Python dependencies.
Specify package versions in the requirements.txt file
When creating a Python requirements.txt file, you can specify just the package name, or the package name and a specific version. Adding a package without version information instructs the pip installer to download and install the latest available version, subject to compatibility with other installed packages and any constraints. The package versions selected during environment creation may be different than the version selected during an auto scaling event later on. This version change can create package conflicts leading to pip install errors. Even if the updated package installs properly, code changes in the package can affect task behavior, leading to inconsistencies in output. To avoid these risks, it’s best practice to add the version number to each package in your requirements.txt file.
Use the constraints file for your Apache Airflow version
A constraints file contains the packages, with versions, verified to be compatible with your Apache Airflow version. This file adds an additional validation layer to prevent package conflicts. Because the constraints file plays such an important role in preventing conflicts, beginning with Apache Airflow v2.7.2 on Amazon MWAA, your requirements file must include a --constraint statement. If a --constraint statement is not supplied, Amazon MWAA will specify a compatible constraints file for you.
Constraint files are available for each Airflow version and Python version combination. The URLs have the following form:
The official Apache Airflow constraints are guidelines, and if your workflows require newer versions of a provider package, you may need to modify your constraints file and include it in your DAG folder. When doing so, the best practices outlined in this post become even more important to guard against package conflicts.
Create a .zip archive of all dependencies
Creating a .zip file containing the packages in your requirements file and specifying this as the package repository source makes sure the exact same wheel files are used during your initial environment setup and subsequent node configurations. The pip installer will use these local files for installation rather than connecting to the external PyPI repository.
Test the requirements.txt file and dependency .zip file
Testing your requirements file before release to production is key to avoiding installation and DAG errors. Testing both locally, with the MWAA local runner, and in a dev or staging Amazon MWAA environment, are best practices before deploying to production. You can use continuous integration and delivery (CI/CD) deployment strategies to perform the requirements and package installation testing, as described in Automating a DAG deployment with Amazon Managed Workflows for Apache Airflow.
Solution overview
This solution uses the MWAA local runner, an open source utility that replicates an Amazon MWAA environment locally. You use the local runner to build and validate your requirements file, and package the dependencies. In this example, you install the snowflake and dbt-cloud provider packages. You then use the MWAA local runner and a constraints file to determine the exact version of each package compatible with Apache Airflow. With this information, you then update the requirements file, pinning each package to a version, and retest the installation. When you have a successful installation, you package your dependencies and test in a non-production Amazon MWAA environment.
We use MWAA local runner v2.8.1 for this walkthrough and walk through the following steps:
Download and build the MWAA local runner.
Create and test a requirements file with package versions.
Package dependencies.
Deploy the requirements file and dependencies to a non-production Amazon MWAA environment.
Prerequisites
For this walkthrough, you should have the following prerequisites:
An AWS account in an AWS Region where Amazon MWAA is supported
With Docker running, build the container with the following command:
cd aws-mwaa-local-runner
 ./mwaa-local-env build-image
Create and test a requirements file with package versions
Building a versioned requirements file makes sure all Amazon MWAA components have the same package versions installed. To determine the compatible versions for each package, you start with a constraints file and an un-versioned requirements file, allowing pip to resolve the dependencies. Then you create your versioned requirements file from pip’s installation output.
The following diagram illustrates this workflow.
To build an initial requirements file, complete the following steps:
In your MWAA local runner directory, open requirements/requirements.txt in your preferred editor.
The default requirements file will look similar to the following:
In a terminal, run the following command to generate the pip install output:
./mwaa-local-env test-requirements
test-requirements runs pip install, which handles resolving the compatible package versions. Using a constraints file makes sure the selected packages are compatible with your Airflow version. The output will look similar to the following:
The message beginning with Successfully installed is the output of interest. This shows which dependencies, and their specific version, pip installed. You use this list to create your final versioned requirements file.
Your output will also contain Requirement already satisfied messages for packages already available in the base Amazon MWAA environment. You do not add these packages to your requirements.txt file.
Update the requirements file with the list of versioned packages from the test-requirements command. The updated file will look similar to the following code:
Next, you test the updated requirements file to confirm no conflicts exist.
Rerun the requirements-test function:
./mwaa-local-env test-requirements
A successful test will not produce any errors. If you encounter dependency conflicts, return to the previous step and update the requirements file with additional packages, or package versions, based on pip’s output.
Package dependencies
If your Amazon MWAA environment has a private webserver, you must package your dependencies into a .zip file, upload the file to your S3 bucket, and specify the package location in your Amazon MWAA instance configuration. Because a private webserver can’t access the PyPI repository through the internet, pip will install the dependencies from the .zip file.
If you’re using a public webserver configuration, you also benefit from a static .zip file, which makes sure the package information remains unchanged until it is explicitly rebuilt.
This process uses the versioned requirements file created in the previous section and the package-requirements feature in the MWAA local runner.
To package your dependencies, complete the following steps:
In a terminal, navigate to the directory where you installed the local runner.
Download the constraints file for your Python version and your version of Apache Airflow and place it in the plugins directory. For this post, we use Python 3.11 and Apache Airflow v2.8.1:
In your requirements file, update the constraints URL to the local downloaded file.
The –-constraint statement instructs pip to compare the package versions in your requirements.txt file to the allowed version in the constraints file. Downloading a specific constraints file to your plugins directory enables you to control the constraint file location and contents.
The updated requirements file will look like the following code:
Run the following command to create the .zip file:
./mwaa-local-env package-requirements
package-requirements creates an updated requirements file named packaged_requirements.txt and zips all dependencies into plugins.zip. The updated requirements file looks like the following code:
Note the reference to the local constraints file and the plugins directory. The –-find-links statement instructs pip to install packages from /usr/local/airflow/plugins rather than the public PyPI repository.
Deploy the requirements file
After you achieve an error-free requirements installation and package your dependencies, you’re ready to deploy the assets to a non-production Amazon MWAA environment. Even when verifying and testing requirements with the MWAA local runner, it’s best practice to deploy and test the changes in a non-prod Amazon MWAA environment before deploying to production. For more information about creating a CI/CD pipeline to test changes, refer to Deploying to Amazon Managed Workflows for Apache Airflow.
To deploy your changes, complete the following steps:
Upload your requirements.txt file and plugins.zip file to your Amazon MWAA environment’s S3 bucket.
From the Apache Airflow menu bar, choose Admin, then Providers.
The list of providers, and their versions, is shown in a table. In this example, the page reflects the installation of apache-airflow-providers-db-cloud version 3.5.1 and apache-airflow-providers-snowflake version 5.2.1. This list only contains the provider packages installed, not all supporting Python packages. Provider packages that are part of the base Apache Airflow installation will also appear in the list. The following image is an example of the package list; note the apache-airflow-providers-db-cloud and apache-airflow-providers-snowflake packages and their versions.
To verify all package installations, view the results in Amazon CloudWatch Logs. Amazon MWAA creates a log stream for the requirements installation and the stream contains the pip install output. For instructions, refer to Viewing logs for your requirements.txt.
A successful installation results in the following message:
If you encounter any installation errors, you should determine the package conflict, update the requirements file, run the local runner test, re-package the plugins, and deploy the updated files.
Clean up
If you created an Amazon MWAA environment specifically for this post, delete the environment and S3 objects to avoid incurring additional charges.
Conclusion
In this post, we discussed several best practices for managing Python dependencies in Amazon MWAA and how to use the MWAA local runner to implement these practices. These best practices reduce DAG and pip installation errors in your Amazon MWAA environment. For additional details and code examples on Amazon MWAA, visit the Amazon MWAA User Guide and the Amazon MWAA examples GitHub repo.
Apache, Apache Airflow, and Airflow are either registered trademarks or trademarks of the Apache Software Foundation in the United States and/or other countries.
About the Author
Mike Ellis is a Technical Account Manager at AWS and an Amazon MWAA specialist. In addition to assisting customers with Amazon MWAA, he contributes to the Apache Airflow open source project.
As a Zabbix partner, we help customers worldwide with all their Zabbix needs, ranging from building a simple template all the way to (massive) turn-key implementations, trainings, and support contracts. Quite often during projects, we get the question, “How about making configuration backups of our network equipment? We need this, as another tool was also capable of doing this!”
The answer is always the same – yes, but no. Yes, technically it is possible to get your configuration backups in Zabbix. It’s not even that hard to set up initially. However, you really should not want configuration backups. Zabbix is not made for them, and you will run into limitations within minutes. As you can imagine, the customer is never happy with this limitation, and some actively start to question where we think the limitation is to see if it is a limitation for them as well. So we simply set up an SSH agent item and get that config out:
Voila! Once per hour Zabbix will log in to that device, execute the command ‘show full-configuration,’ and get back the result. Frankly, it just works. You check the Monitoring -> Latest data section of the host and see that there is data for this item. Problem solved, right?
No. As a matter of fact, this is where the problems start. Zabbix allows us to store up to 64KB of data in a item value. The above screenshot is of a (small) fortigate firewall and the config if stored in a text file is just over 1.1MB. So, Zabbix truncates the data, which renders the backup useless – restore will never work. At the same time, Zabbix is not sanitizing the output, so all secrets are left in it.
To make it even worse, it’s challenging to make a diff of different config versions/revisions – that feature is just not there. Most of the time, the customer is at this point convinced that Zabbix is not the right tool and the next question pops up – “Now what? How can we fix this?” This is where our added value is presented, as we do have a solution here which is rather affordable (free) as well.
The solution is Oxidized, which is basically Rancid on steroids. This project started years ago and is released under the Apache 2.0 license. We found it by accident, started playing around with it, and never left it. The project is available on Github (https://github.com/ytti/oxidized) and written in Ruby. Incidentally, if you (or your company) have Ruby devs and want to give something back to the community, the Oxidized project is looking for extra maintainers!
At this point, we show our customers the GUI of Oxidized, which in our case involves just making backups of a few firewalls:
So we have the name, the model, and (in this case) just one group. The status shows whether the backup was successful or not, the last update and when the last change was detected. At the same time, under actions, we can get the full config file, look at previous revisions(and diff them) combined with a ‘execute now’ option.
Looking at the versions, it’s simply showing this:
This is already giving us a nice idea of what is going on. We see the versions and dates at a glance, but the moment we check the diff option, we can easily see what was actually changed:
The perfect solution, except that it is not integrated with Zabbix. That means double administration and a lot of extra work, combined with the inevitable errors – devices not added, credential mismatches, connection errors, etc. Luckily, we can easily change the format of the above information from GUI to json by just adding ‘.json’ at the end of the url:
As you might know, Zabbix is perfectly capable of parsing json formats and creating items and triggers out of them. A master item, dependent lld (https://blog.zabbix.com/low-level-discovery-with-dependent-items/13634/), and within minutes you’ve got Oxidized making configuration backups while Zabbix is monitoring and alerting on the status:
At this point we’re getting close to a nice integration, but we haven’t overcome the double configuration management yet.
Oxidized can read its configuration from multiple sources, including a CSV file, SQL, SQLite, MySQL or HTTP. The easiest is a CSV file – just make sure you’ve got all information in the correct column and it works. An example:
Great, now we have to configure 2 places (Zabbix and Oxidized) and get a username/password cleartext in a CSV file. What about SQL as a source, and letting it connect to Zabbix? From there we should be able to get information regarding the hostname, but somehow we need the credentials as well. That’s not a default piece of information in Zabbix, but UserMacros can save us here.
So on our host we add 2 extra macros:
At the same time, we need to tell Oxidized what kind of device it is. There are multiple ways of doing this, obviously. A tag, a usermacro, hostgroups, you name it. In order to do this, we place a tag on the host:
Now we make sure that Oxidized is only taking hosts with the tag ‘oxidized’ and extract from them the host name, IP address, model, username, and password:
This way, we simply add our host in Zabbix, add the SSH credentials, and Oxidized will pick it up the next time a backup is scheduled. Zabbix will immediately start monitoring the status of those jobs and alert you if something fails.
This blog post is not meant as a complete integration write down, but rather as a way to give some insight into how we as a partner operate in the field, taking advantage of the flexibility of the products we work with. This post should give you enough information to build it yourself, but of course we’re always available to help you or just build it as part of our consultancy offering.
Native integration between two leading open-source tools – Zabbix for network monitoring and rConfig for configuration management, delivers substantial benefits to organizations. On one side, Zabbix offers a platform that maintains a Single Source of Truth for network device inventories. It provides real-time monitoring, problem detection, alerting, and other critical features that are essential for day-to-day operations, ensuring smooth and reliable network connectivity crucial for business continuity.
On the other side, there’s rConfig, renowned for its robust and reliable network automation, configuration backup, and compliance management. Integrating rConfig with Zabbix enhances its capabilities, allowing for seamless Device Inventory synchronization. This union not only simplifies the management of network configurations but also introduces more advanced Network Automation Platform features. Together, they form a powerhouse toolset that streamlines network management tasks, reduces operational overhead, and boosts overall network performance, making it easier for businesses to focus on growth and innovation without being hindered by network reliability concerns.
Table of Contents
Optimizing Network Management with Unified Inventory
At rConfig, we are deeply embedded with our customers, and our main mission is to work with them to solve their real-world problems. One significant challenge that consistently surfaces – both from client feedback and our own experiences – is managing and accurately locating a trusted and reliable central network inventory. This challenge brings to the forefront a classic dilemma in Enterprise Architecture circles: In our scenario of network inventory, which system ought to act as the System of Record, and which should function as the System of Engagement to optimize interactions with records for various purposes, such as Network Management Systems (NMS) and Network Configuration Management (NCM)?
Enterprise Architecture circles illustrating systems of record, insight and engagement. Credit: Sharon Moore – https://samoore.me/
At rConfig, from a product perspective we’ve chosen to focus on what we do best and love most: Network Configuration Management. Therefore, integrating with an upstream Network Management System (NMS) that can act as the System of Record for network device inventory was a logical step for us. Given that many of our customers also use Zabbix network operations, it was a natural choice to begin our integration journey with them. Our platforms are highly complementary, which streamlines the integration process and enhances our ability to serve our customers better. This strategic decision allows us to offer a seamless and efficient management solution that not only meets the current needs but also scales to address future challenges in network management.
Enhanced Integration Through ETL
You might be wondering how this integration works and whether it’s straightforward or challenging to set up. Setting up the integration between rConfig and Zabbix is relatively straightforward, but, as with any complex data driven systems, it requires careful planning and diligence to ensure that the data flow between the systems is fully optimized and automated. This is where ETL – or Extract, Transform, Load – plays a crucial role. ETL is a process that involves extracting data from the Zabbix API in its raw form, transforming it into a format that rConfig can readily process and validate, and then loading it into the rConfig production database. This process also efficiently handles any data conflicts and updates.
The advantages of using ETL are significant, enhancing data quality and making the data more accessible, thereby enabling rConfig to analyze information more effectively and make well-informed, data-driven decisions. At rConfig, our user interface is designed to aid in the development and troubleshooting of features, though we’re also fond of using the CLI for those who prefer it. Below is a screenshot from our lab showing the end-to-end ETL process with Zabbix in action. It illustrates the steps rConfig takes to connect to Zabbix, extract, validate, transform and map the data, load it to staging, and finally, move it to the production environment for a small set of devices.
While the screenshot below displays just a few devices as a sample integration in our lab, the most extensive integration we’ve achieved in a production environment with this new rConfig feature involved syncing a single Zabbix instance with over 5,000 host/device records. This highlights its efficiency and reliability in a real-world environment.
Screenshot of rConfig Zabbix Integration on the Command Line
Going Deeper: Understanding the Integration Process
To grasp the integration process more clearly, let’s dive into the details that will help you understand how to set everything up before we automate the task. Our documentation website, docs.rconfig.com, provides comprehensive details, and our YouTube channel features a great demonstration video of the entire process.
Initial Setup: The first step involves configuring rConfig to connect and authenticate with the Zabbix API. This setup is managed through the Configuration page in the rConfig user interface. During this phase, you can also apply filters to select specific Zabbix tags or host groups, refining exactly which host records you want to synchronize.
Screenshot of Zabbix Configuration page in rConfig V7 professional
Data Extraction and Validation: Once the connection is established, rConfig extracts host records in raw JSON format. This stage involves validating the data to ensure that the correct tags and data mappings are in place.
Screenshot of Zabbix Raw Host Extract page in rConfig V7 Professional
Staging for Review: After validation, the data is loaded into a staging table. This allows for a thorough review to confirm that the mapped rConfig data fields are correct, ensuring that the newly imported devices are associated with the appropriate connection templates, categories, and tags.
Screenshot of Zabbix host staging table in rConfig V7 Professional
Final Loading: The final step involves transferring the staged devices to the main production devices table. After this transfer, the staging table is cleared. The devices then appear in the main device table, marked with a special icon indicating that they are synced through integration.
Screenshot of Zabbix host fully loaded to production devices table in rConfig V7 Professional
Seamless Operational Integration: Once the devices are loaded into the production table, they are automatically incorporated into standard rConfig scheduled tasks, automations, or any other rConfig feature that utilizes the device data (like categories and tags). This integration facilitates a seamless operational workflow between the platforms. Users can even access these devices directly in Zabbix from within the rConfig UI, streamlining operations management.
After all the above steps are completed, and the initial setup is done future loads are completed on a scheduled and automation basis using the rConfig Task manager.
Screenshot of rConfig Device detail view for a Zabbix integrated host
This detailed setup and validation process ensures that the integration between rConfig and Zabbix is not only effective but also enhances the functionality and efficiency of managing network devices across platforms.
Case Study: Enhancing Network Management for a Las Vegas Entertainment Organization
Challenge: A prominent Las Vegas entertainment organization faced significant difficulties in managing the diverse and complex network that supports their extensive operations, including gaming, security, and hospitality services. The primary issues were outdated network inventories and inefficient management of network configurations across numerous devices, leading to operational disruptions and security vulnerabilities.
Solution: To address these challenges, the organization implemented the integration of rConfig with Zabbix, focusing on automating and centralizing the network management process. This solution aimed to synchronize network device inventories across the organization’s extensive operations, ensuring accurate and real-time data availability.
Implementation: The integration process began with setting up Zabbix to continuously monitor and gather data from network devices across different venues and services. This data was then extracted, standardized, and loaded into rConfig, where it could be used for automated configuration management and backup. The setup also included sophisticated mapping and validation to ensure all data transferred between Zabbix and rConfig was accurate and relevant.
Benefits:
Improved Network Reliability: The automated synchronization of network inventories reduced the frequency of network failures and minimized downtime, which is crucial in the high-stakes environment of Las Vegas entertainment.
Enhanced Security: With more accurate and timely network data, the organization could better identify and respond to security threats, protecting sensitive information and ensuring the safety of both guests and operations.
Operational Efficiency: The IT team was able to shift their focus from routine network maintenance to strategic initiatives that enhanced overall business operations, including integrating new technologies and improving guest experiences.
Scalability: The integration provided a scalable solution that could accommodate future expansion, whether adding new devices or incorporating new technologies or venues into the network.
Outcome: The implementation of the rConfig and Zabbix integration dramatically transformed the organization’s network management capabilities. The IT department noted a substantial reduction in the manpower and time required for routine maintenance, while operational uptime improved significantly. The organization now enjoys a robust, streamlined network management system that supports its dynamic environment, ensuring that both guests and staff benefit from reliable and secure network services.
This case study highlights the power of effective network management solutions in supporting complex operations and enhancing business efficiency and security within the entertainment industry.
Conclusion: Forging Ahead with Innovative Partnerships
In conclusion, the Zabbix platform stands out as a cornerstone in network monitoring, renowned for its extensive capabilities in real-time monitoring, problem detection, and alerting. Its robust architecture not only supports a broad range of network environments but also offers the flexibility and scalability necessary for today’s diverse technological landscapes. The platform’s ability to provide detailed and accurate network insights is crucial for organizations aiming to maintain optimal operational continuity and security.
The integration of Zabbix with rConfig, a globally reliable and robust network configuration management (NCM) solution, enhances these benefits significantly, creating a synergistic relationship that leverages the strengths of both platforms. For customers and partners, this integration means not only smoother and more efficient network management but also the assurance that they are supported by two of the leading solutions in the industry. Together, Zabbix and rConfig deliver a comprehensive network management experience that drives efficiency, reduces costs, and ensures a higher level of network reliability and security, positioning them as indispensable tools in the toolkit of any organization serious about its network infrastructure.
About rConfig
rConfig is an industry leader in network configuration management and automation. Founded in 2010 and based in Ireland, rConfig has been at the forefront of delivering innovative solutions that simplify the complexities of network management. Our software is designed to be both powerful and user-friendly, making it an ideal choice for IT professionals across a variety of sectors, including education, government, manufacturing, and large global enterprises.
With the capability to manage up to 10s of 1000s of devices, rConfig offers robust functionalities such as automated config backups, compliance management, and network automation. Our platform is vendor-agnostic, which allows seamless integration with a diverse range of network devices and systems, from traditional IT to IoT and OT environments. This flexibility ensures that our clients can manage all aspects of their network configurations, regardless of the underlying technology.
rConfig is committed to continuous innovation and customer-centric solutions, with industry first solutions such as API backups and our Script Integration Engine. Our native integration with platforms like Zabbix exemplifies our dedication to enhancing network management through strategic partnerships. This collaboration not only streamlines operations but also amplifies the benefits provided, ensuring that our customers have access to the most advanced tools in the industry.
One of the new features in Zabbix 7.0 LTS is proxy load balancing. As the documentation says:
Proxy load balancing allows monitoring hosts by a proxy group with automated distribution of hosts between proxies and high proxy availability.
If one proxy from the proxy group goes offline, its hosts will be immediately distributed among other proxies having the least assigned hosts in the group.
Table of Contents
Proxy group is the new construct that enables Zabbix server to make dynamic decisions about the monitoring responsibilities within the group(s) of proxies. As you can see in the documentation, the proxy group has only a minimal set of configurable settings.
One important background information to understand is that Zabbix server always knows (within reasonable timeframe) which proxies in the proxy groups are online and which are not. That’s because all active proxies connect to the Zabbix server every 1 second by default (DataSenderFrequency setting in the proxy), and Zabbix server connects to the passive proxies also every 1 second by default (ProxyDataFrequency setting in the server), so if those connections are not happening anymore, then something is wrong with using the proxy.
Initially Zabbix server will balance the hosts between the proxies in the proxy group. It can also rebalance the hosts later if needed, the algorithm is described in the documentation. That’s something we don’t need to configure (that’s the “automated distribution of hosts” mentioned above). The idea is that, at any given time, any host configured to be monitored by the proxy group is monitored by one proxy only.
Now let’s see how the actual connections work with active and passive Zabbix agents. The active/passive modes of the proxies (with the Zabbix server connectivity) don’t matter in this context, but I’m using active proxies in my tests for simplicity.
Disclaimer: These are my own observations from my own Zabbix setup using 7.0.0, and they are not necessarily based on any official Zabbix documentation. I’m open for any comments or corrections in any case.
At the very end of this post I have included samples of captured agent traffic for each of the cases mentioned below.
Passive agents monitored by a proxy group
For passive agents the proxy load balancing really is this simple: Whenever a proxy goes down in a proxy group, all the hosts that were previously monitored by that proxy will then be monitored by the other available proxies in the same proxy group.
There is nothing new to configure in the passive agents, only the usual Server directive to allow specific proxies (IP addresses, DNS names, subnets) to communicate with the agent.
As a reminder, a passive agent means that it listens to incoming requests from Zabbix proxies (or the Zabbix server), and then collects and returns the requested data. All relevant firewalls also need to be configured to allow the connections from the Zabbix proxies to the agent TCP port 10050.
As yet another reminder, each agent (or monitored host) can have both passive and active items configured, which means that it will both listen to incoming Zabbix requests but also actively request any active tasks from Zabbix proxies or servers. But again, this is long-existing functionality, nothing new in Zabbix 7.0.
Active agents monitored by a proxy group
For active agents the proxy load balancing needs a bit new tweaking in the agent side.
By definition, an active agent is the party that initiates the connection to the Zabbix proxy (or server), to TCP port 10051 by default. The configuration happens with the ServerActive directive in the agent configuration. According to the official documentation, providing multiple comma-separated addresses in the ServerActive directive has been possible for ages, but it is for the purpose of providing data to multiple independent Zabbix installations at the same time. (Think about a Zabbix agent on a monitored host, being monitored by both a service provider and the inhouse IT department.)
Using semicolon-separated server addresses in ServerActive directive has been possible since Zabbix 6.0 when Zabbix servers are configured in high-availability cluster. That requires specific Zabbix server database implementation so that all the cluster nodes use the same database, and some other shared configurations.
Now in Zabbix 7.0 this same configuration style can be used for the agent to connect to all proxies in the proxy group, by entering all the proxy addresses in the ServerActive configuration, semicolon-separated. However, to be exact, this is not described in the ServerActive documentation as of this writing. Rather, it specifically says “More than one Zabbix proxy should not be specified from each Zabbix server/cluster.” But it works, let’s see how.
Using multiple semicolon-separated proxy addresses works because of the new redirection functionality in the proxy-agent communication: Whenever an active agent sends a message to a proxy, the proxy tells the agent to connect to another proxy, if the agent is currently assigned to some other proxy. The agent then ceases connecting to that previous proxy, and starts using the proxy address provided in the redirection instead. Thus the agent converges to using only that one designated proxy address.
In this simple example the Zabbix server determined that the agent should be monitored by Proxy 1, so when the agent initially contacted Proxy 1 (because its IP address is first in the ServerActive list), the proxy responded normally and agent was happy with that.
In case the Zabbix server had for any reason determined that the agent should be monitored by Proxy 2, then Proxy 1 would have responded with a redirection, and agent would have followed that. (There will be examples of redirections in the capture files below.)
To be clear, this agent redirection from the proxy group works only with Zabbix 7.0 agents as of this writing.
Note: In the initial version of this post I used comma-separated proxy addresses in ServerActive (instead of semicolon-separated), and that caused duplicate connections from the agent to the designated proxy (because the agent is not equipped to recognize that it connects to the same proxy twice), eventually causing data duplication in Zabbix database. Using comma-separated proxy addresses is thus not a working solution for proxy load balancing usage.
If the host-proxy assignments are changed by the Zabbix server for balancing the load between the proxies, the previously designated proxy will redirect the agent to the correct proxy address, and the situation is optimized again.
Side note: When configuring the proxies in Zabbix UI, there is a new Address for active agents field. That is the address value that is used by the proxies when responding with redirection messages to agents.
Proxy group failure scenarios with active agents
Proxy goes down
If the designated proxy of an active agent goes offline so that it doesn’t respond to the agent anymore, agent realizes the situation, discards the redirection information it had, and reverts to using the proxy addresses from ServerActive directive again.
Now, this is an interesting case because of some timing dependencies. In the proxy group configuration there is the Failover period configuration that controls the Zabbix server’s sensitivity to proxy availability in regards to agent rebalancing within the proxy group. Thus, if the agent reverts to using the other proxies faster than Zabbix server recognizes the situation and notifies the other proxies in the proxy group, the agent will get redirection responses from the other proxies, telling it to use the currently offline proxy. And the same happens again: agent fails to connect to the redirected proxy, and reverts to using the other locally configured proxies, and so on.
In my tests this looping was not very intense, only two rounds every second, so it was not very significant network-wise, and the situation will converge automatically when the Zabbix server has notified the proxies about the host rebalancing.
So this temporary looping is not a big deal. The takeaway is that the whole system converges automatically from a failed proxy.
After the failed proxy has recovered to online mode, the agents stay with their designated proxies in the proxy group.
As mentioned in the beginning, Zabbix server will automatically rebalance the hosts again after some time if needed.
Proxy is online but unreachable from the active agent
Another interesting case is one where the proxy itself is running and communicating with Zabbix server, thus being in online mode in the proxy group, but the active agent is not able to reach it, while still being able to connect to the other proxies in the group. This can happen due to various Internet-related routing issues for example, if the proxies are geographically distributed and far away from the agent.
Let’s start with the situation where the agent is currently monitored by Proxy 2 (as per the last picture above). When the failure starts and agent realizes that the connections to Proxy 2 are not succeeding anymore, the agent reverts to using the configured proxies in ServerActive, connecting to Proxy 1.
But, Proxy 1 knows (by the information given by Zabbix server) that Proxy 2 is still online and that the agent should be monitored by Proxy 2, so Proxy 1 responds to the agent with a redirection.
Obviously that won’t work for the agent as it doesn’t have connectivity to Proxy 2 anymore.
This is a non-recoverable situation (at least with the current Zabbix 7.0.0) while the reachability issue persists: The agent keeps on contacting Proxy 1, keeps receiving the redirection, and the same repeats over and over again.
Note that it does not matter if the agent is now locally reconfigured to only use Proxy 1 in this situation, because the load balancing of the hosts in the proxy group is not controlled by any of the agent-local configuration. The proxy group (led by Zabbix server) has the only authority to assign the hosts to the proxies.
One way to escape from this situation is to stop the unreachable Proxy 2. That way the Zabbix server will eventually notice that Proxy 2 is offline, and the hosts will be automatically rebalanced to other proxies in the group, thus removing the agent-side redirection to the unreachable proxy.
Keep this potential scenario in mind when planning proxy groups with proxy location diversity.
This is also something to think about if your Zabbix proxies have multiple network interfaces, where Zabbix server connectivity is using different interface from the agent connectivity. In that case the same problem can occur due to your own configurations.
Closing words
All in all, proxy load balancing looks very promising feature as it does not require any network-level tricks to achieve load balancing and high availability. In Zabbix 7.0 this is a new feature, so we can expect some further development for the details and behavior in the upcoming releases.
Appendix: Sample capture files
Ideally these capture files should be viewed with Wireshark version 4.3.0rc1 or newer because only the latest Wireshark builds include support for latest Zabbix protocol features. Wireshark 4.2.x should also show most of the Zabbix packet fields. Use display filter “zabbix” to see only the Zabbix protocol packets, but when examining cases more carefully you should also check the plain TCP packets (without any display filter) to get more understanding about the cases.
These samples are taken with Zabbix components version 7.0.0, using default timers in the Zabbix process configurations, and 20 seconds as the proxy group failover period.
Agent connected to Proxy 2, but Proxy 2 keeps sending redirects
Proxy 2 was assigned the agent before frame #1074, so it took over the monitoring and accepted the agent connections
Proxy 1 was later restarted (but agent didn’t try to connect to it yet)
The agent was manually restarted before frame #1498 and it connected to Proxy 1 again, was given a redirection to Proxy 2, and continued with Proxy 2 again
Amazon CodeCatalyst is a modern software development service that empowers teams to deliver software on AWS easily and quickly. Amazon CodeCatalyst provides one place where you can plan, code, and build, test, and deploy your container applications with continuous integration/continuous delivery (CI/CD) tools.
CodeCatalyst recently announced the teams feature, which simplifies management of space and project access. Enterprises can now use this feature to organize CodeCatalyst space members into teams using single sign-on (SSO) with IAM Identity Center. You can also assign SSO groups to a team, to centralize your CodeCatalyst user management. CodeCatalyst space admins can create teams made up any members of the space and assign them to unique roles per project, such as read-only or contributor.
Introduction:
In this post, we will demonstrate how enterprises can enable access to CodeCatalyst with their workforce identities configured in AWS IAM Identity Center, and also easily manage which team members have access to CodeCatalyst spaces and projects. With AWS IAM Identity Center, you can connect a self-managed directory in Active Directory (AD) or a directory in AWS Managed Microsoft AD by using AWS Directory Service. You can also connect other external identity providers (IdPs) like Okta or OneLogin to authenticate identities from the IdPs through the Security Assertion Markup Language (SAML) 2.0 standard. This enables your users to sign in to the AWS access portal with their corporate credentials.
Pre-requisites:
To get started with CodeCatalyst, you need the following prerequisites. Please review them and ensure you have completed all steps before proceeding:
1. Set up an CodeCatalyst space. To join a space, you will need to either:
Create an Amazon CodeCatalyst space that supports identity federation. If you are creating the space, you will need to specify an AWS account ID for billing and provisioning of resources. If you have not created an AWS account, follow the AWS documentation to create one
2. Create an AWS Identity and Access Management (IAM) role. Amazon CodeCatalyst will need an IAM role to have permissions to deploy the infrastructure to your AWS account. Follow the documentation for steps how to create an IAM role via the Amazon CodeCatalyst console.
3. Once the above steps are completed, you can go ahead and create projects in the space using the available blueprints or custom blueprints.
Walkthrough:
The emphasis of this post, will be on how to manage IAM identity center (SSO) groups with CodeCatalyst teams. At the end of the post, our workflow will look like the one below:
Figure 2: Architectural Diagram
For the purpose of this walkthrough, I have used an external identity provider Okta to federate with AWS IAM Identity Center to manage access to CodeCatalyst.
Figure 3: Okta Groups from Admin Console
You can also see the same Groups are synced with the IAM Identity Center instance from the figure below. Please note Groups and member management must be done only via external identity providers.
Figure 4: IAM Identity Center Groups created via SCIM synch
Now, if you go to your Okta apps and click on ‘AWS IAM Identity Center’, the AWS account ID and CodeCatalyst space that you created as part of prerequisites should be automatically configured for you via single sign-on. Developers and Administrators of the space can easily login using this integration.
Figure 5: CodeCatalyst Space via SSO
Once you are in the CodeCatalyst space, you can organize CodeCatalyst space members into teams, and configure the default roles for them. You can choose one of the three roles from the list of space roles available in CodeCatalyst that you want to assign to the team. The role will be inherited by all members of the team:
Space administrator – The Space administrator role is the most powerful role in Amazon CodeCatalyst. Only assign the Space administrator role to users who need to administer every aspect of a space, because this role has all permissions in CodeCatalyst. For details, see Space administrator role.
Power user – The Power user role is the second-most powerful role in Amazon CodeCatalyst spaces, but it has no access to projects in a space. It is designed for users who need to be able to create projects in a space and help manage the users and resources for the space. For details, see Power user role.
Limited access – It is the role automatically assigned to users when they accept an invitation to a project in a space. It provides the limited permissions they need to work within the space that contains that project. For details, see Limited access role.
In this example here, if I go into the ‘space-admin’ team, I can view the SSO group associated with it through IAM Identity Center.
Figure 7: SSO Group association with Teams
You can now use these teams from the CodeCatalyst space to help manage users and permissions for the projects in that space. There are four project roles available in CodeCatalyst:
Project administrator — The Project administrator role is the most powerful role in an Amazon CodeCatalyst project. Only assign this role to users who need to administer every aspect of a project, including editing project settings, managing project permissions, and deleting projects. For details, see Project administrator role.
Contributor — The Contributor role is intended for the majority of members in an Amazon CodeCatalyst project. Assign this role to users who need to be able to work with code, workflows, issues, and actions in a project. For details, see Contributor role.
Reviewer — The Reviewer role is intended for users who need to be able to interact with resources in a project, such as pull requests and issues, but not create and merge code, create workflows, or start or stop workflow runs in an Amazon CodeCatalyst project. For details, see Reviewer role.
Read only — The Read only role is intended for users who need to view the resources and status of resources but not interact with them or contribute directly to the project. Users with this role cannot create resources in CodeCatalyst, but they can view them and copy them, such as cloning repositories and downloading attachments to issues to a local computer. For details, see Read only role.
For the purpose of this demonstration, I have created projects from the default blueprints (I chose the modern three-tier web application blueprint) and assigned Teams to it with specific roles. You can also create a project using a default blueprint in CodeCatalyst space if you don’t already have an existing project.
Figure 8: Teams in Project Settings
You can also view the roles assigned to each of the teams in the CodeCatalyst Space settings.
Figure 9: Project roles in Space settings
Clean up your Environment:
If you have been following along with this workflow, you should delete the resources you deployed so you do not continue to incur charges. First, delete the two stacks that CDK deployed using the AWS CloudFormation console in the AWS account you associated when you launched the blueprint. If you had launched the Modern three-tier web application just like I did, these stacks will have names like mysfitsXXXXXWebStack and mysfitsXXXXXAppStack. Second, delete the project from CodeCatalyst by navigating to Project settings and choosing Delete project.
Conclusion:
In this post, you learned how to add Teams to a CodeCatalyst space and projects using SSO Groups. I used Okta for my external identity provider to connect with IAM Identity Center, but you can use your Organizations idP or any other IDP that supports SAML. You also learned how easy it is to maintain SSO group members in the CodeCatalyst space by assigning the necessary roles and restricting access when not necessary.
In this blog post, I’ll guide you through building your own template to monitor the latest Zabbix releases directly from the Zabbix UI. Follow the simple walkthrough to know how.
Introduction
With the release of Zabbix 7.0, it is possible to see which Zabbix version you are running and what the latest version is:
A great improvement obviously but (at least in 7.0.0rc1) I am missing the triggers to notify me and perhaps also really interesting, there is nothing available about older versions.
And as you may know, Zabbix is quite good at parsing JSON formatted data. So, I built a quick template to get this going and be notified once a new version is released.
In the examples below I used my 6.4 instance, but this also works on 6.0 and of course 7.0.
Template building
Before we jump into the building part, it’s important to think of the best approach for this template. I think there are 2:
Create 1 HTTP item and a few dependent items for the various versions
Create 1 HTTP item, a LLD rule and a few item prototypes.
I prefer the LLD route, as that is making the template as dynamic as possible (less time to maintain it) but also more fun to build!
Let’s go.
First, you go to Data Collection -> Templates and create a new template there:
Of course, you can change the name of the template and the group. It’s completely up to you.
Once the template is created, it’s still an empty shell and we need to populate it. We will start with a normal item of type HTTP agent:
(note: screenshot is truncated)
We need to add 3 query fields:
‘type’ with value ‘software_update_check’
‘version’ with value ‘1.0’
‘software_update_check_hash’ with a 64 characters: you can do funny things here for the example i just used ‘here_are_exact_64_characters_needed_as_a_custom_hash_for_zabbix_’
As we go for the LLD route, I already set the “History Storage period” to “Do not keep history”. If you are building the template, it’s advised to keep the history and make sure you’ve got data to work with for the rest of the template. Once everything works, go back to this item and make sure to change the History storage period.
In the above screenshot, you can see I applied 2 preprocessing steps already.
The first is to replace the text ‘versions’ with ‘data’. This is done because Zabbix expects an array ‘data’ for its LLD logic. That ‘data’ is not available, so I just replaced the text ‘versions’. Quick and dirty.
The second preprocessing step is a “discard unchanged with heartbeat”. As long as there is no new release, I do not care about the data that came in, yet I want to store it once per day to make sure the item is still working. With this approach, we monitor the URL every 30 minutes so we get ‘quick’ updates but still do not use a lot of disk space.
The result of the preprocessing configuration:
Now it’s time to hit the “test all steps” button and see if everything works. The result you’ll get is:
This is almost identical to the information directly from the URL, except that ‘versions’ is replaced by ‘data’. Great. So as soon as you save this item we will monitor the releases now (don’t forget to link the template to a host otherwise nothing will happen)!
At the same time, this information is absolutely not useful at all, as it’s just a text portion. We need to parse it, and LLD is the way to go.
In the template, we go to “Discovery rules” and click on “Create discovery rule” in the upper right corner.
Now we create a new LLD rule, which is not going to query the website itself, but will get its information from the HTTP agent we’ve just created.
In the above screenshot, you see how it’s configured. a name, type ‘Dependent item’ some key just because Zabbix requires a key, and the Master item is the HTTP agent item we just created.
Now all data from the http agent item is pushed into the LLD rule as soon as it’s received, and we need to create LLD macros out of it. So in the Discovery rule, you jump to the 3rd tab ‘LLD macros’ and add a new macro there:
{#VERSION} with JSONPATH$..version.first()
Once this is done save the LLD rule and let’s create some item prototypes.
The first item prototype is the most complicated, the rest are “copy/paste”, more or less.
We create a new item prototype that looks like this:
As the type is dependent and it is getting all its information from the HTTP agent master item, there is preprocessing needed to filter out only that specific piece of information that is needed. You go to the preprocessing tab and add a JSONpath step there:
For copy/paste purposes: $.data.[?(@.version=='{#VERSION}’)].latest_release.created.first()
There is quite some magic happening in that step. We tell it to use a JSONpath to find the correct value, but there is also a lookup:
[?(@.version=='{#VERSION}')]
What we are doing here is telling it to go into the data array, look for an array ‘version’ with the value {#VERSION}. Of course that {#VERSION} LLD macro is going to be replaced dynamically by the discovery rule with the correct version. Once it found the version object, go in and find the object ‘latest_release’ and from that object we want the value of ‘created’. Now we will get back the epoch time of that release, and in the item we parse that with Unit unixtime.
Save the item, and immediately clone it to create the 2nd item prototype to get the support state:
Here we change the type of information and of course the preprocessing should be slightly different as we are looking for a different object:
At this point you should have 1 master item, 1 LLD rule and 3 Item prototypes.
Now, create a new host, and link this template to it. Fairly quick you should see data coming in and everything should be nicely parsed:
The only thing that is missing now is a trigger to get alerted once a new version has been released, so let’s go back into the template, discovery rule and find the trigger prototypes. Create a new one that looks like this:
Since we populated the even name as well, our problem name will reflect the most recent version already:
To provide the best experiences, we use technologies like cookies to store and/or access device information. Consenting to these technologies will allow us to process data such as browsing behavior or unique IDs on this site. Not consenting or withdrawing consent, may adversely affect certain features and functions.
Functional
Always active
The technical storage or access is strictly necessary for the legitimate purpose of enabling the use of a specific service explicitly requested by the subscriber or user, or for the sole purpose of carrying out the transmission of a communication over an electronic communications network.
Preferences
The technical storage or access is necessary for the legitimate purpose of storing preferences that are not requested by the subscriber or user.
Statistics
The technical storage or access that is used exclusively for statistical purposes.The technical storage or access that is used exclusively for anonymous statistical purposes. Without a subpoena, voluntary compliance on the part of your Internet Service Provider, or additional records from a third party, information stored or retrieved for this purpose alone cannot usually be used to identify you.
Marketing
The technical storage or access is required to create user profiles to send advertising, or to track the user on a website or across several websites for similar marketing purposes.

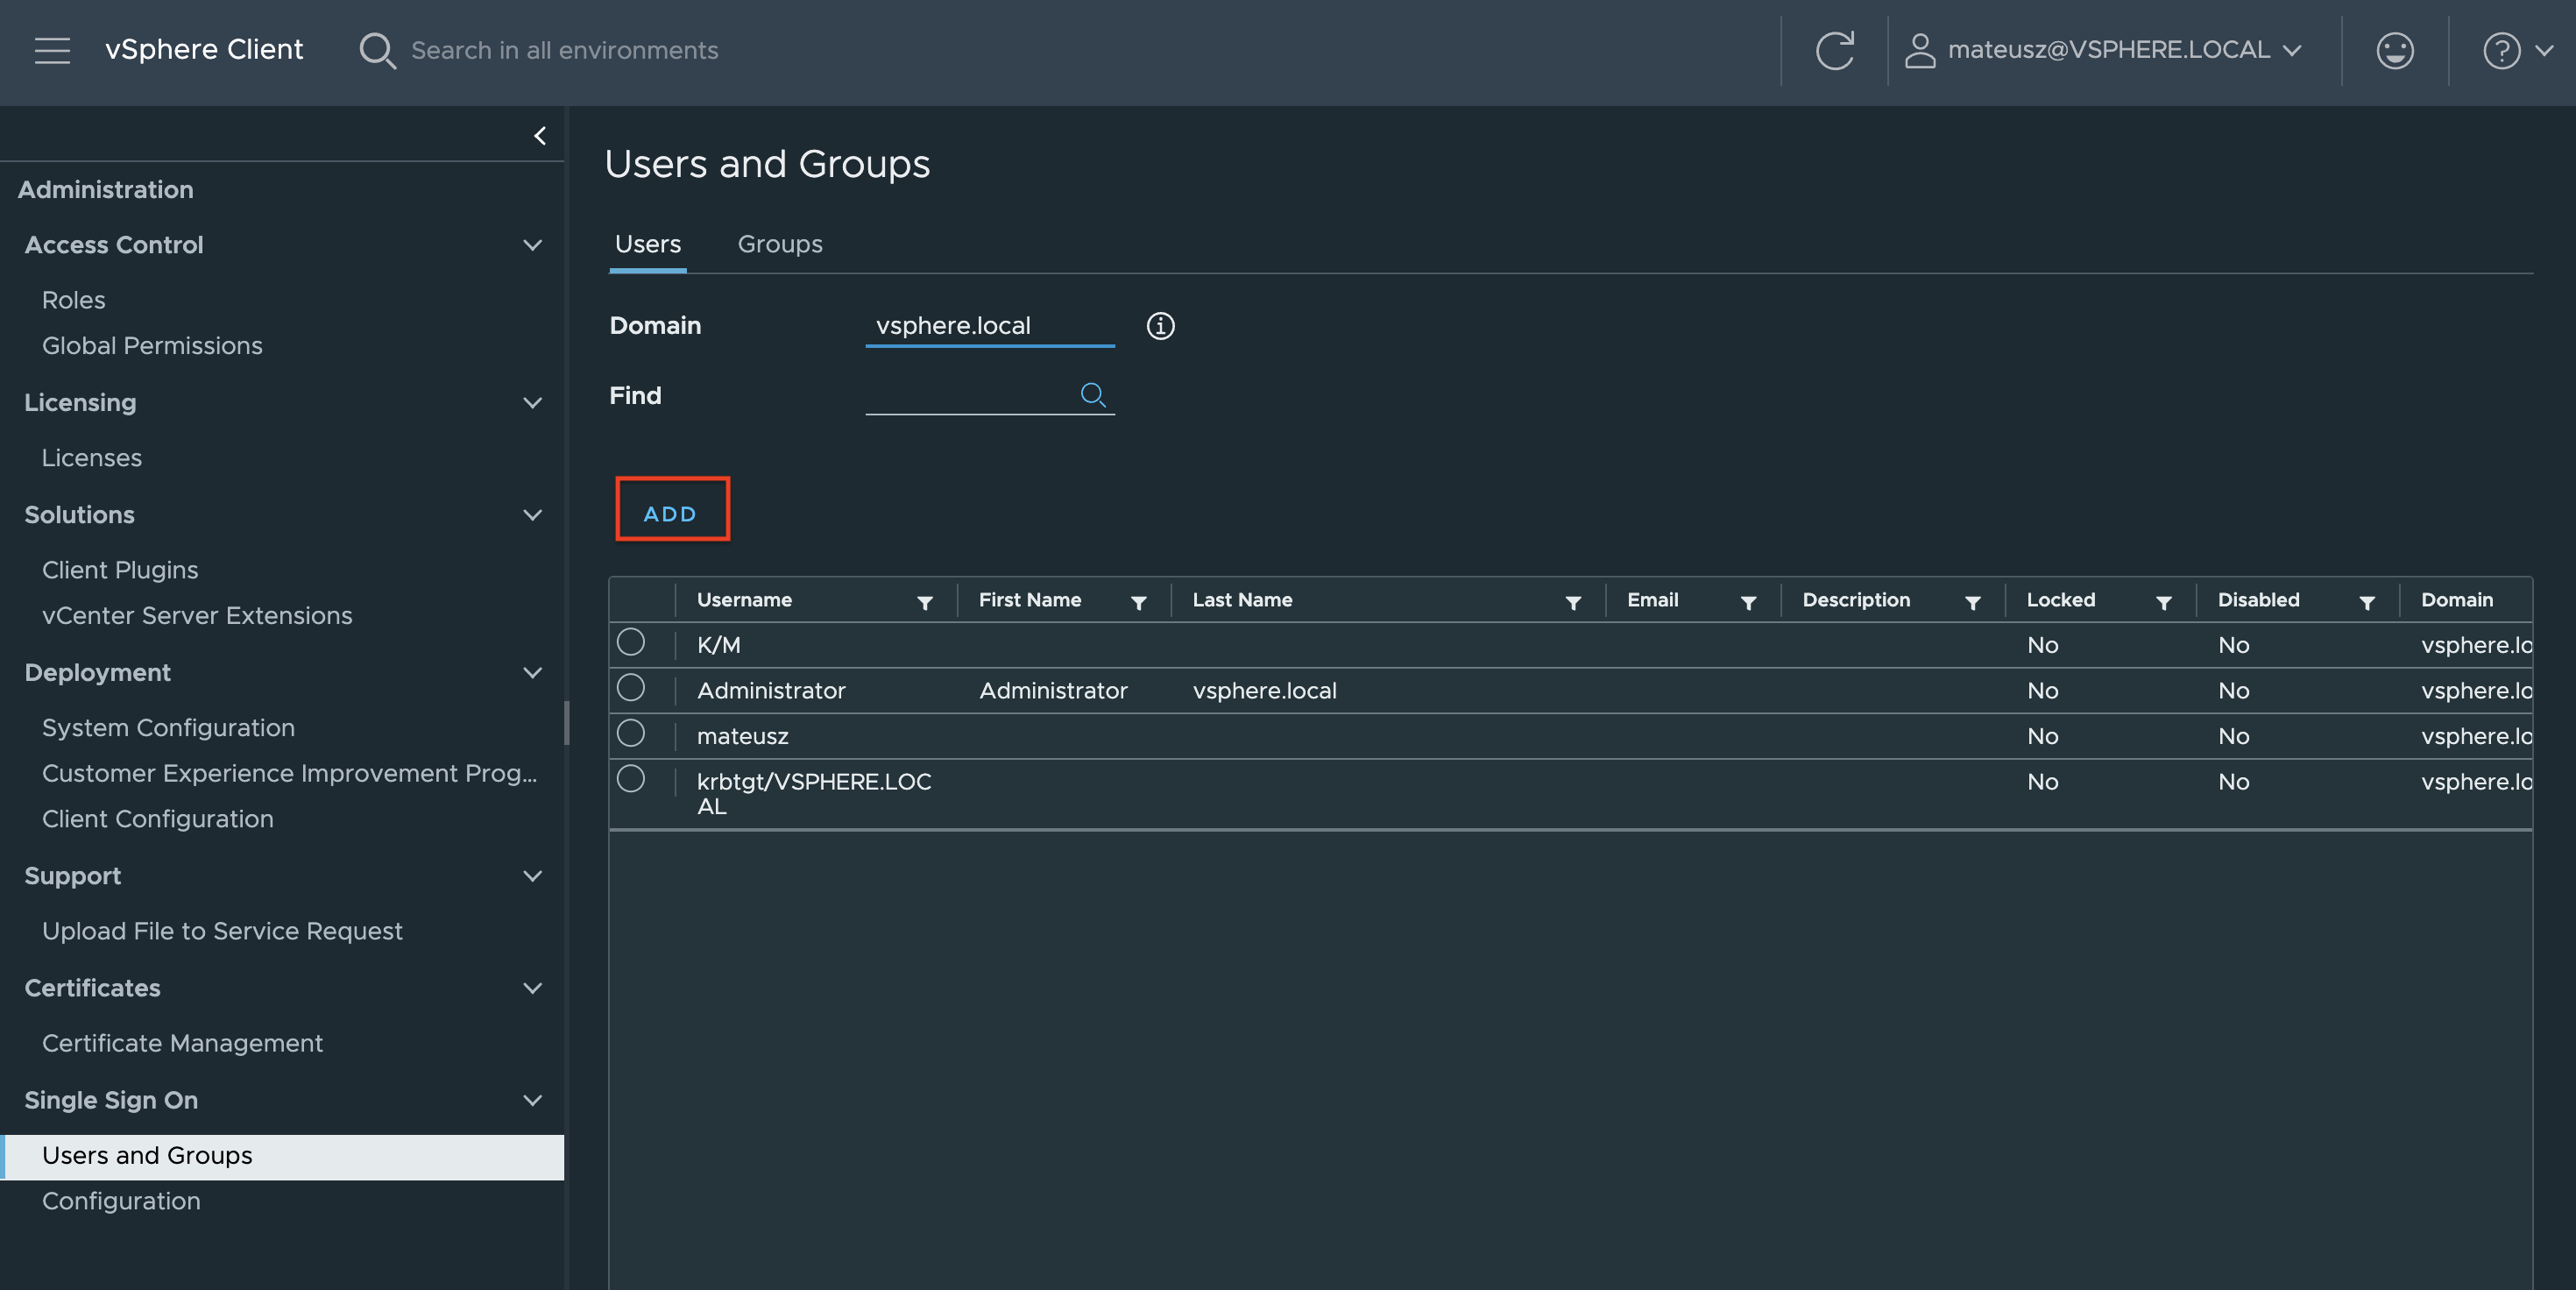
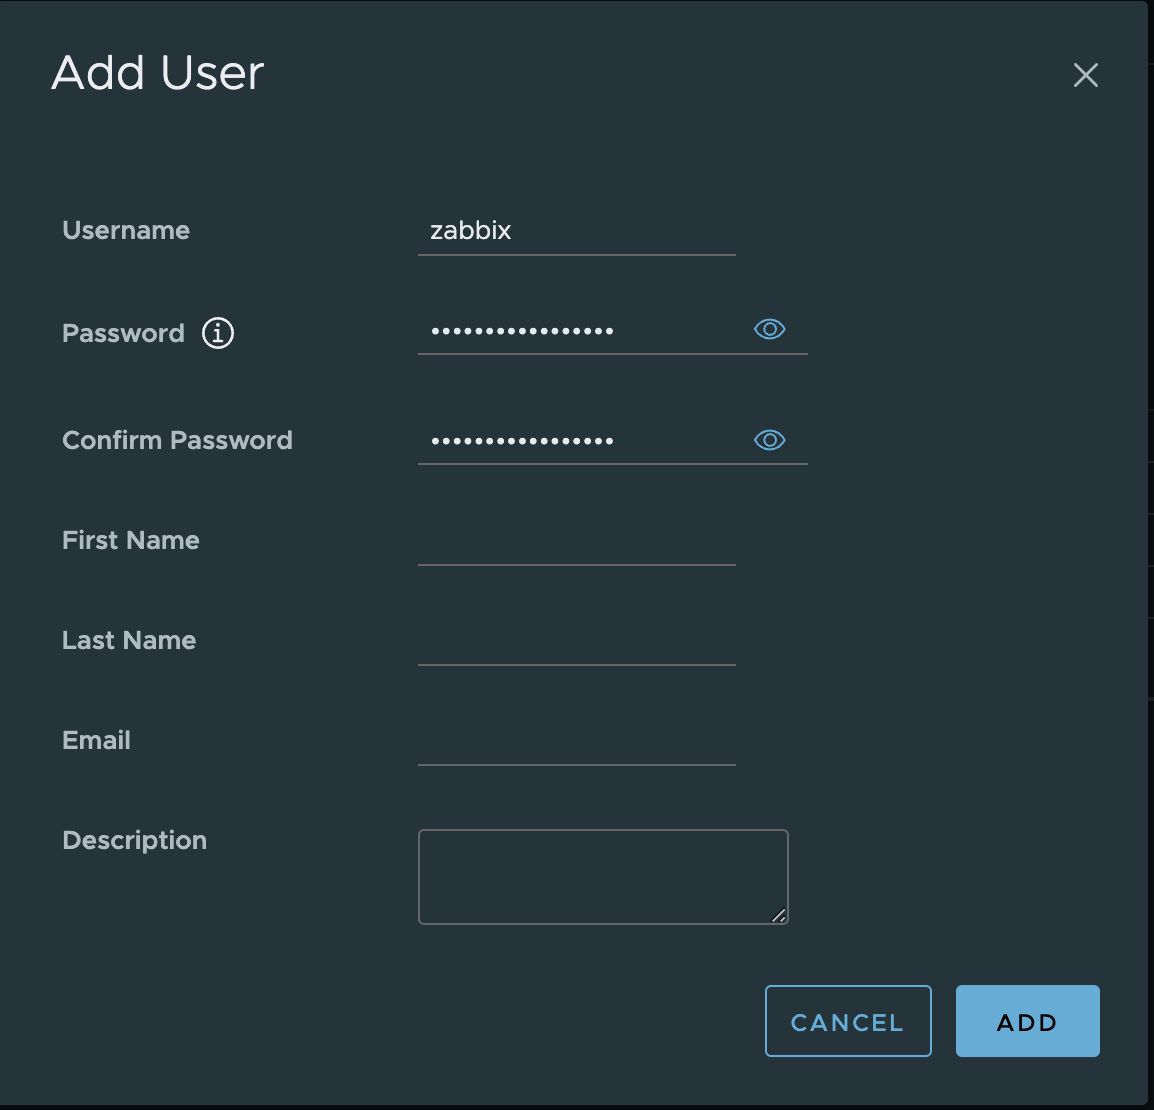
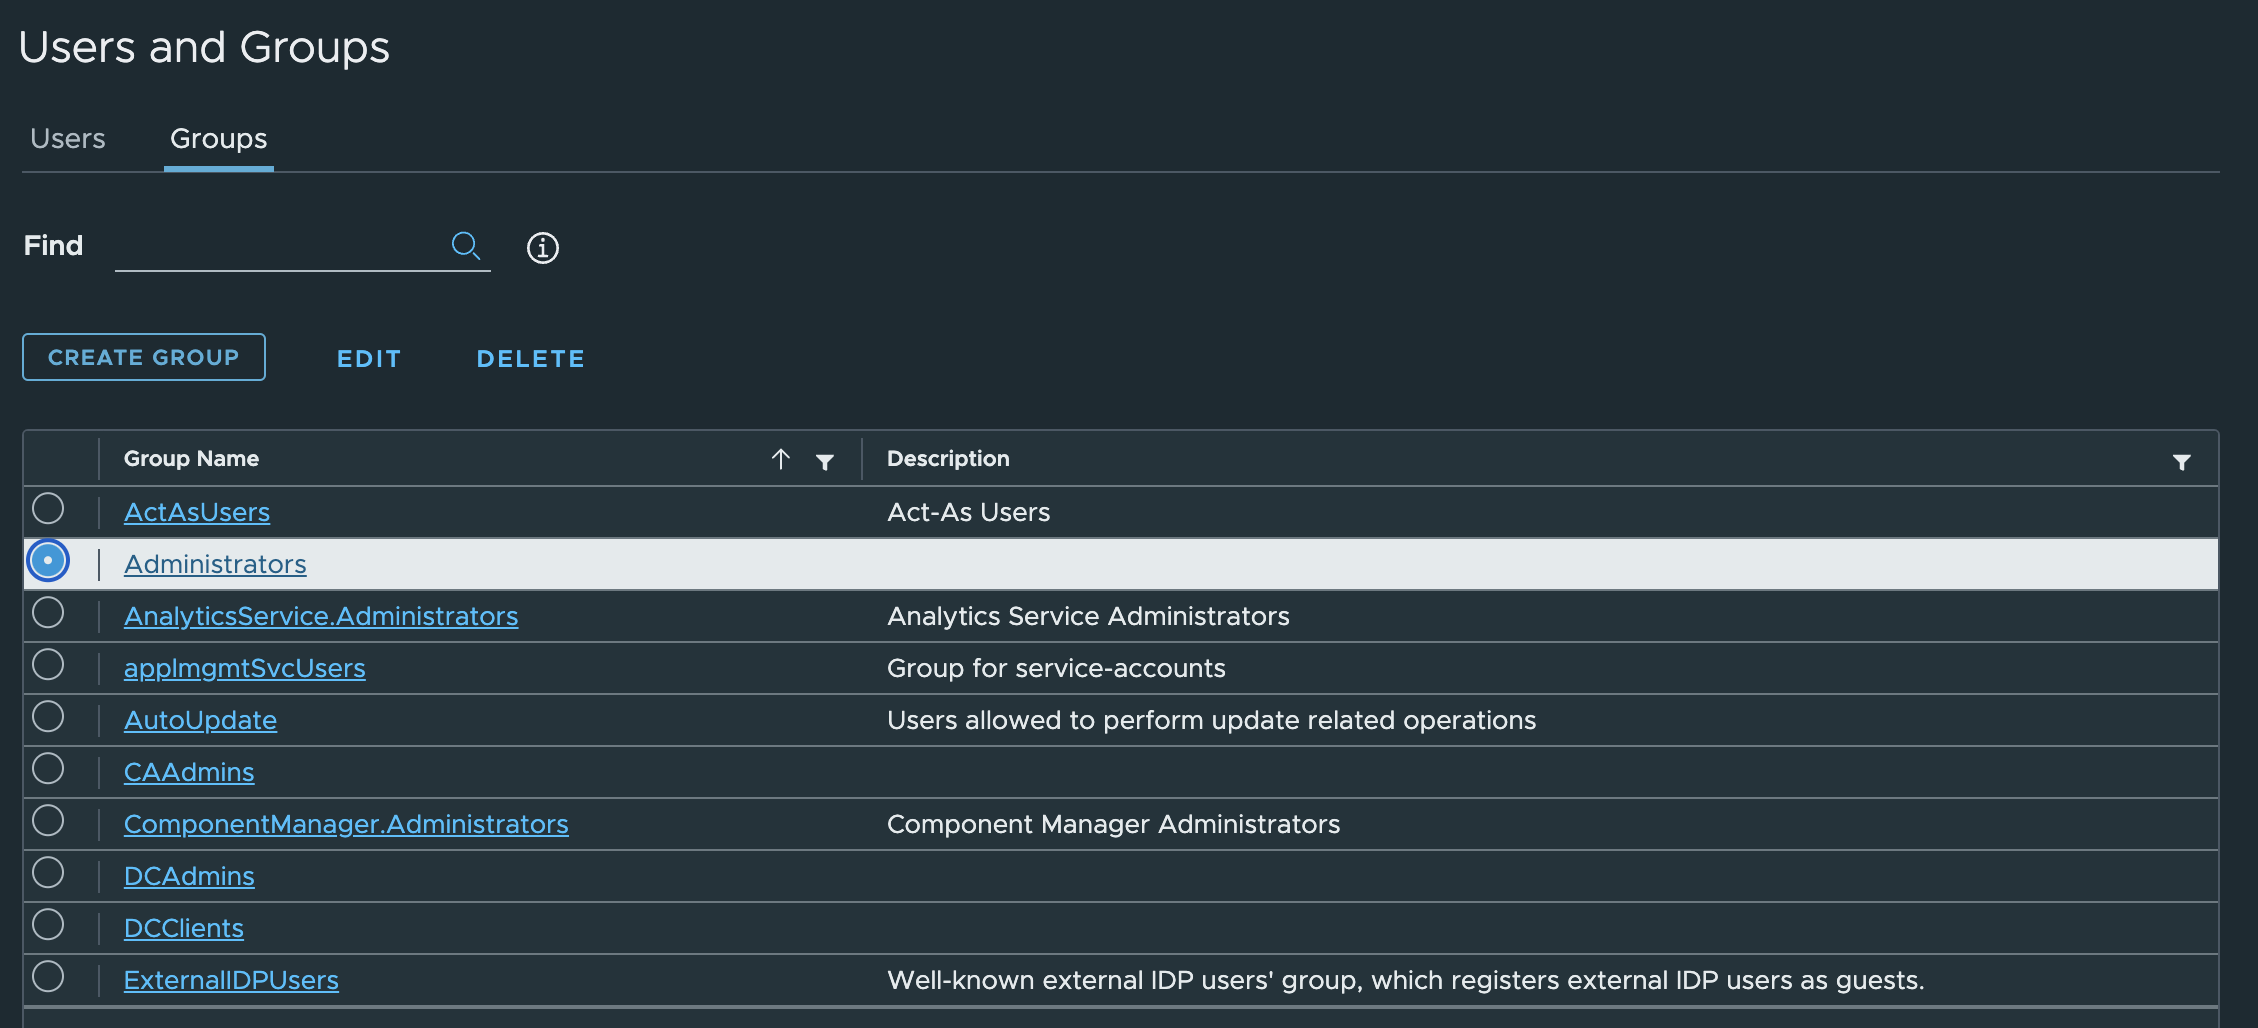
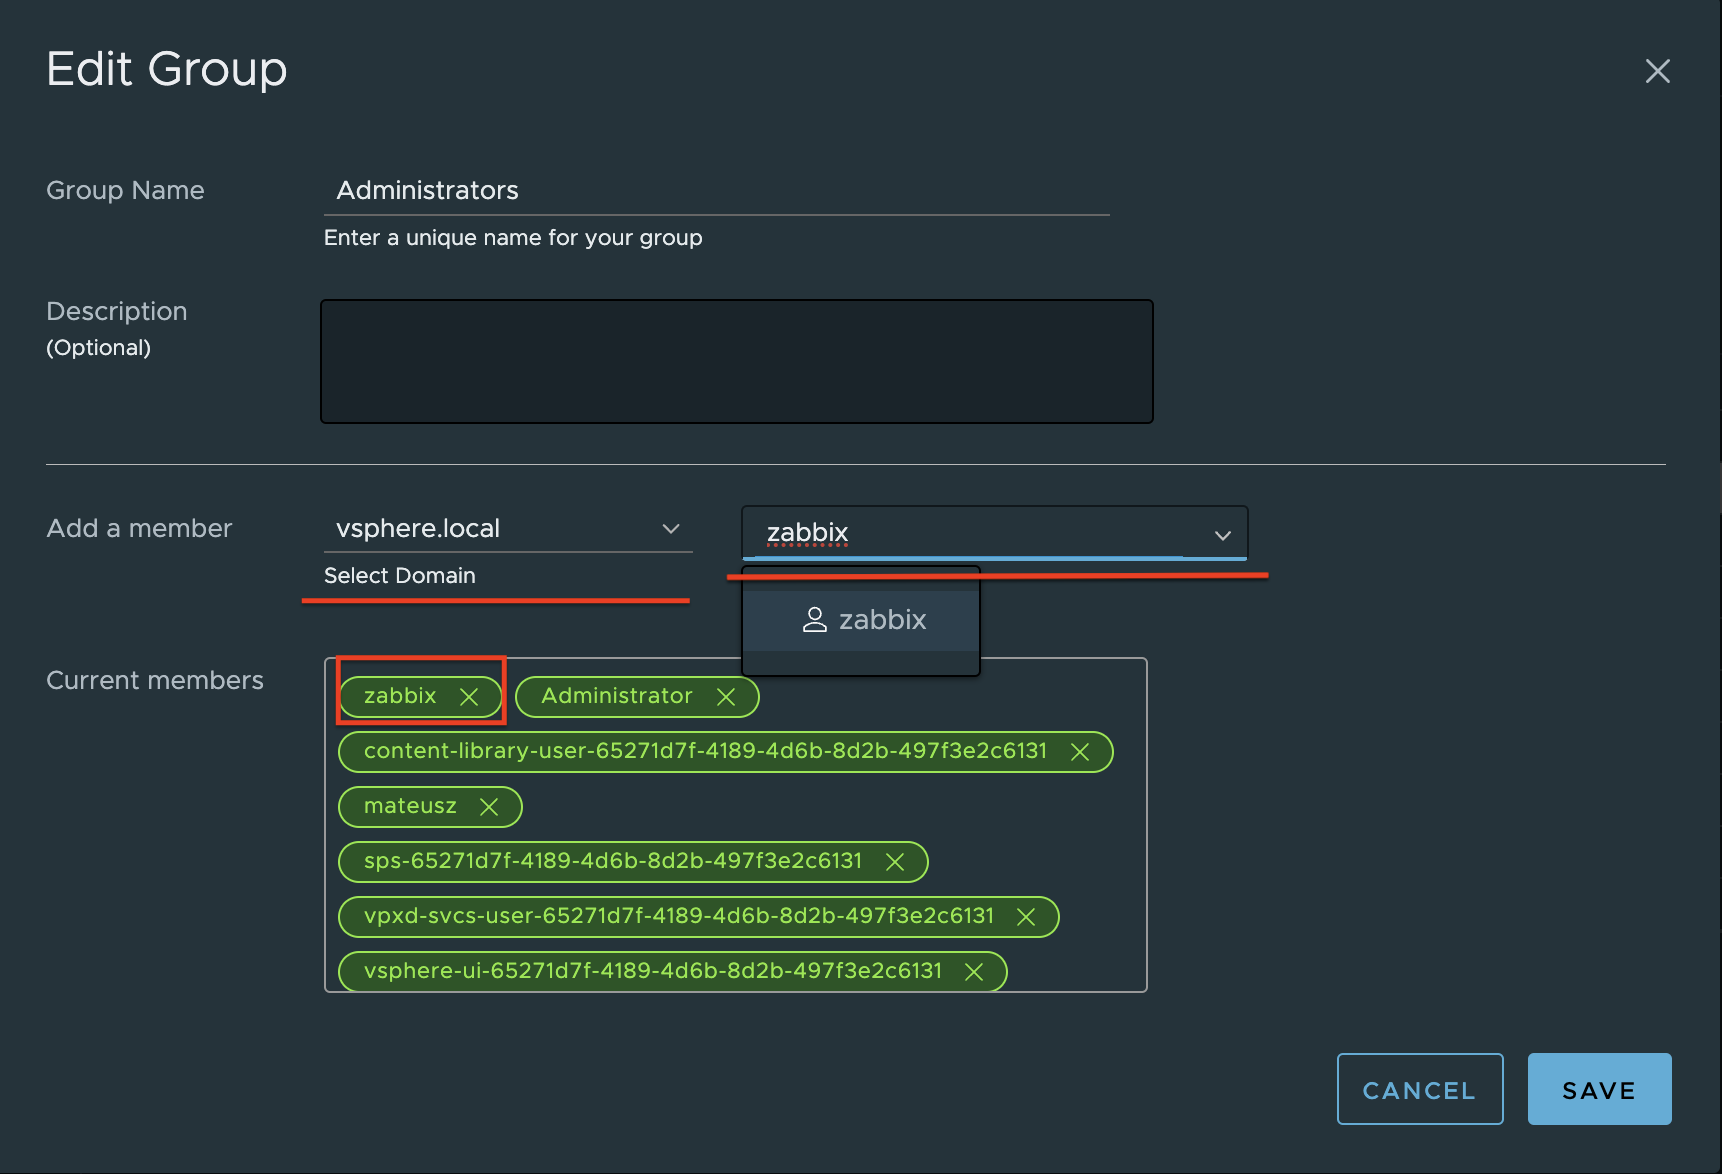

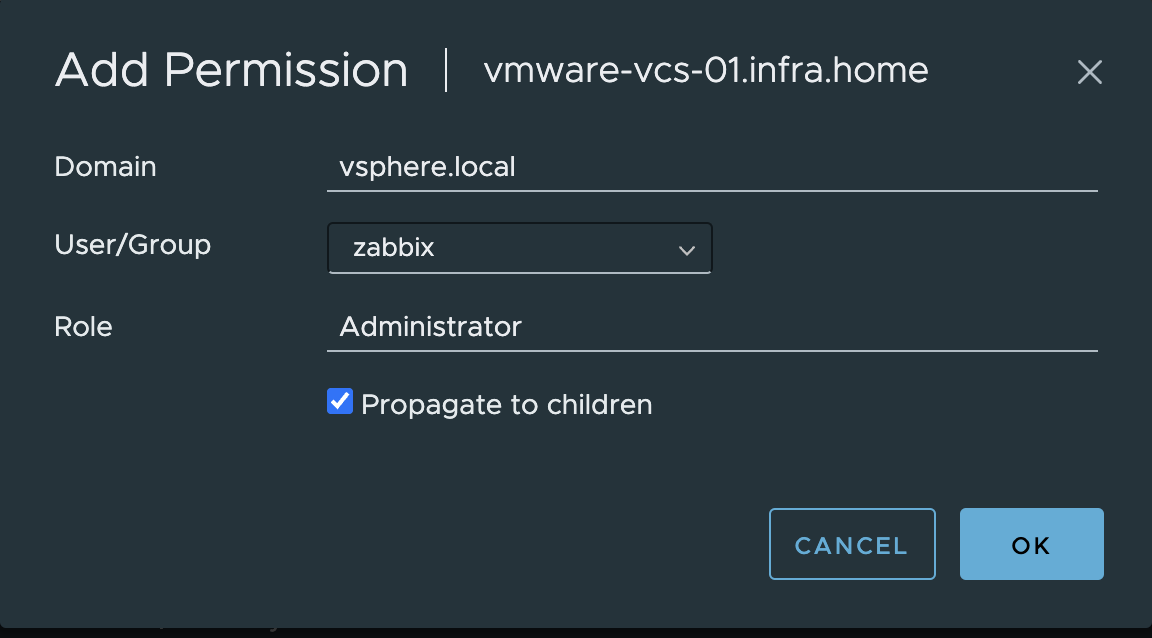
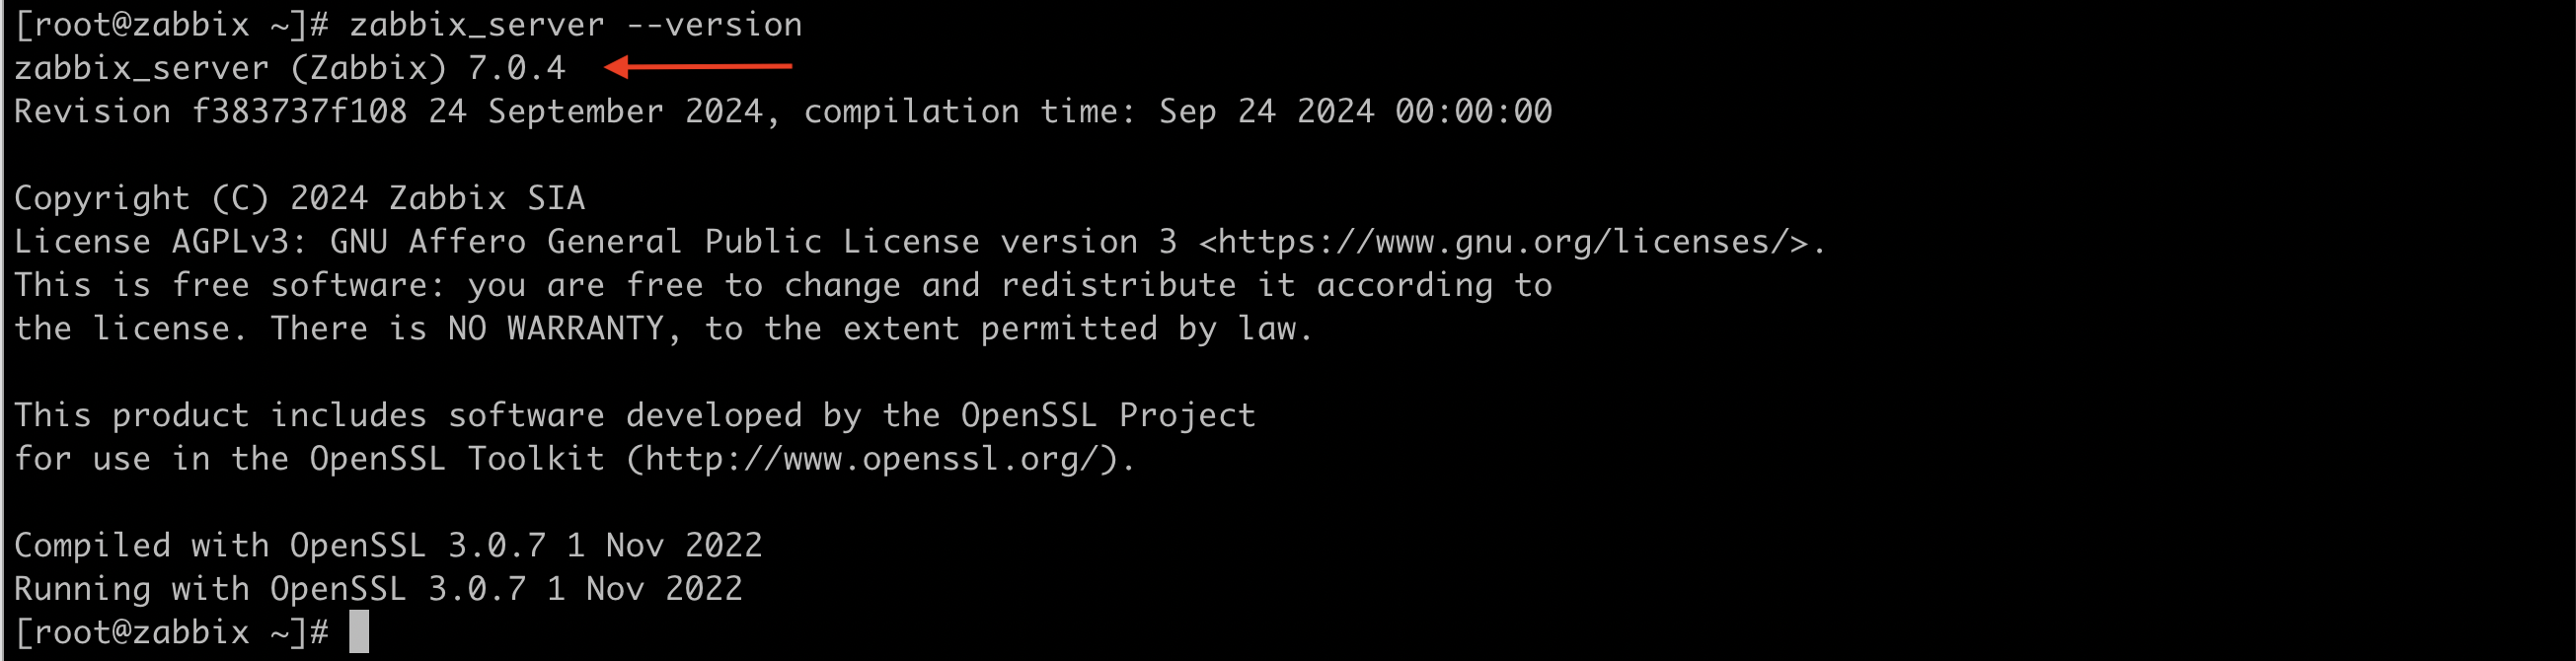

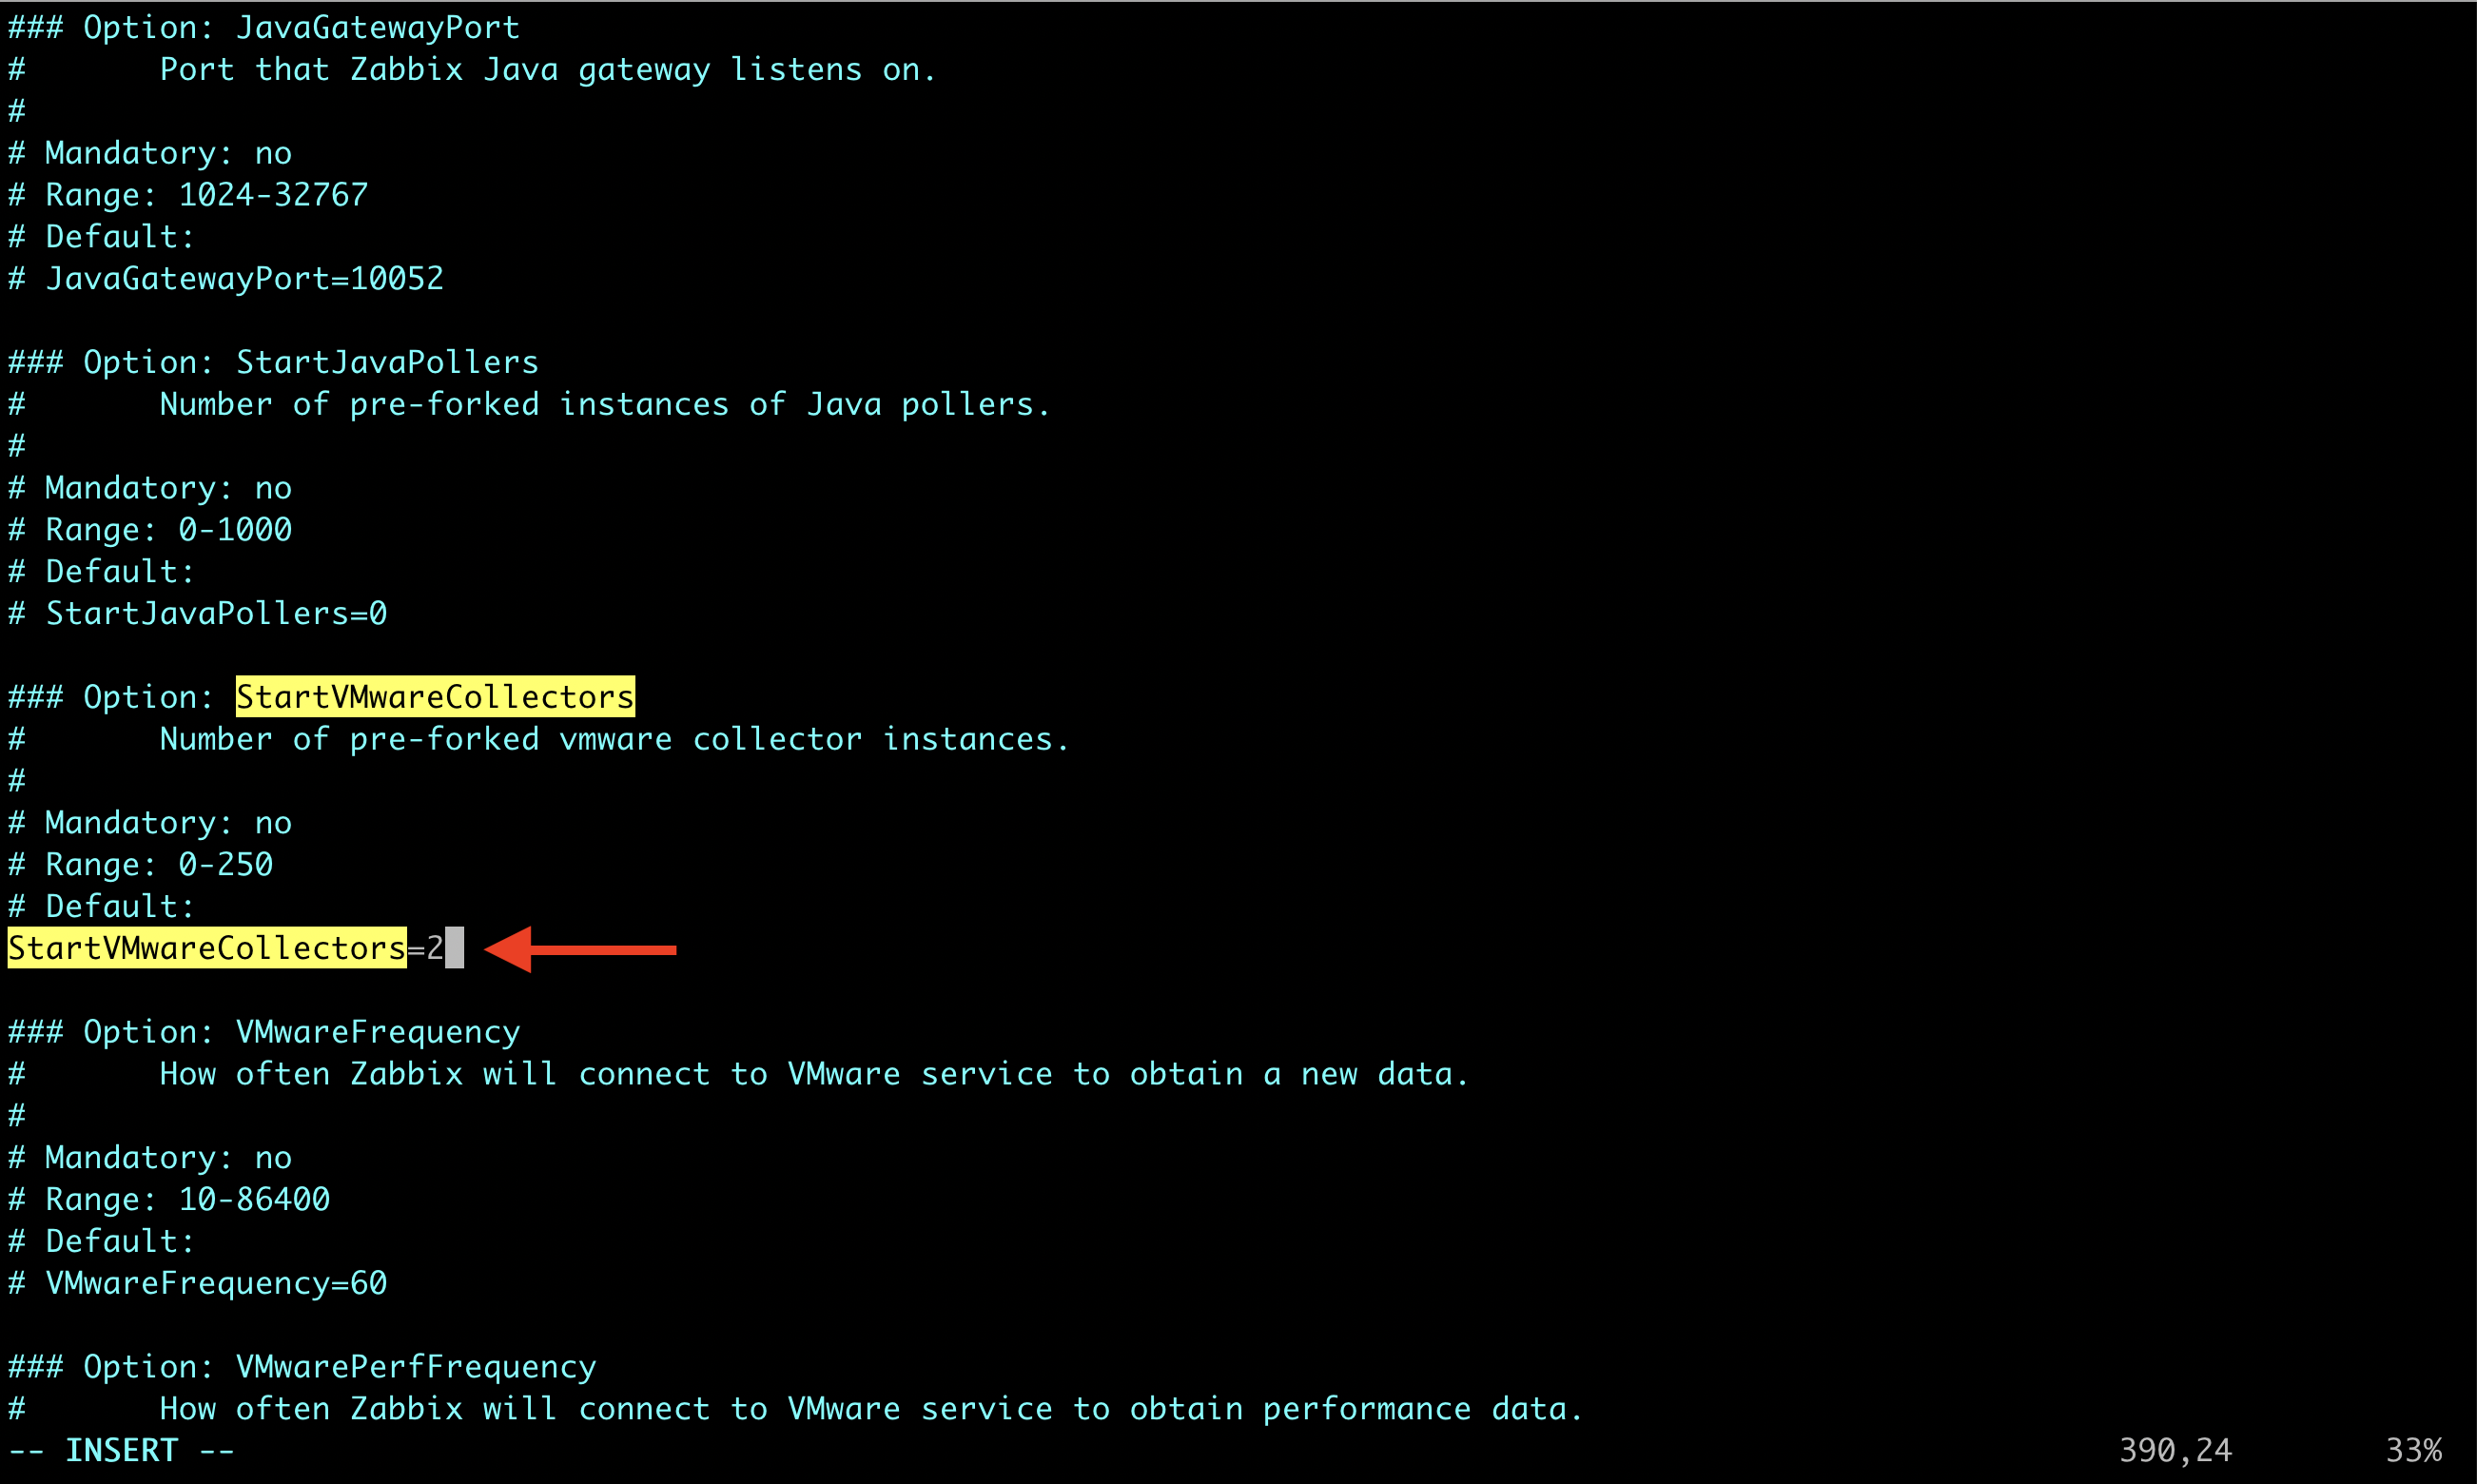

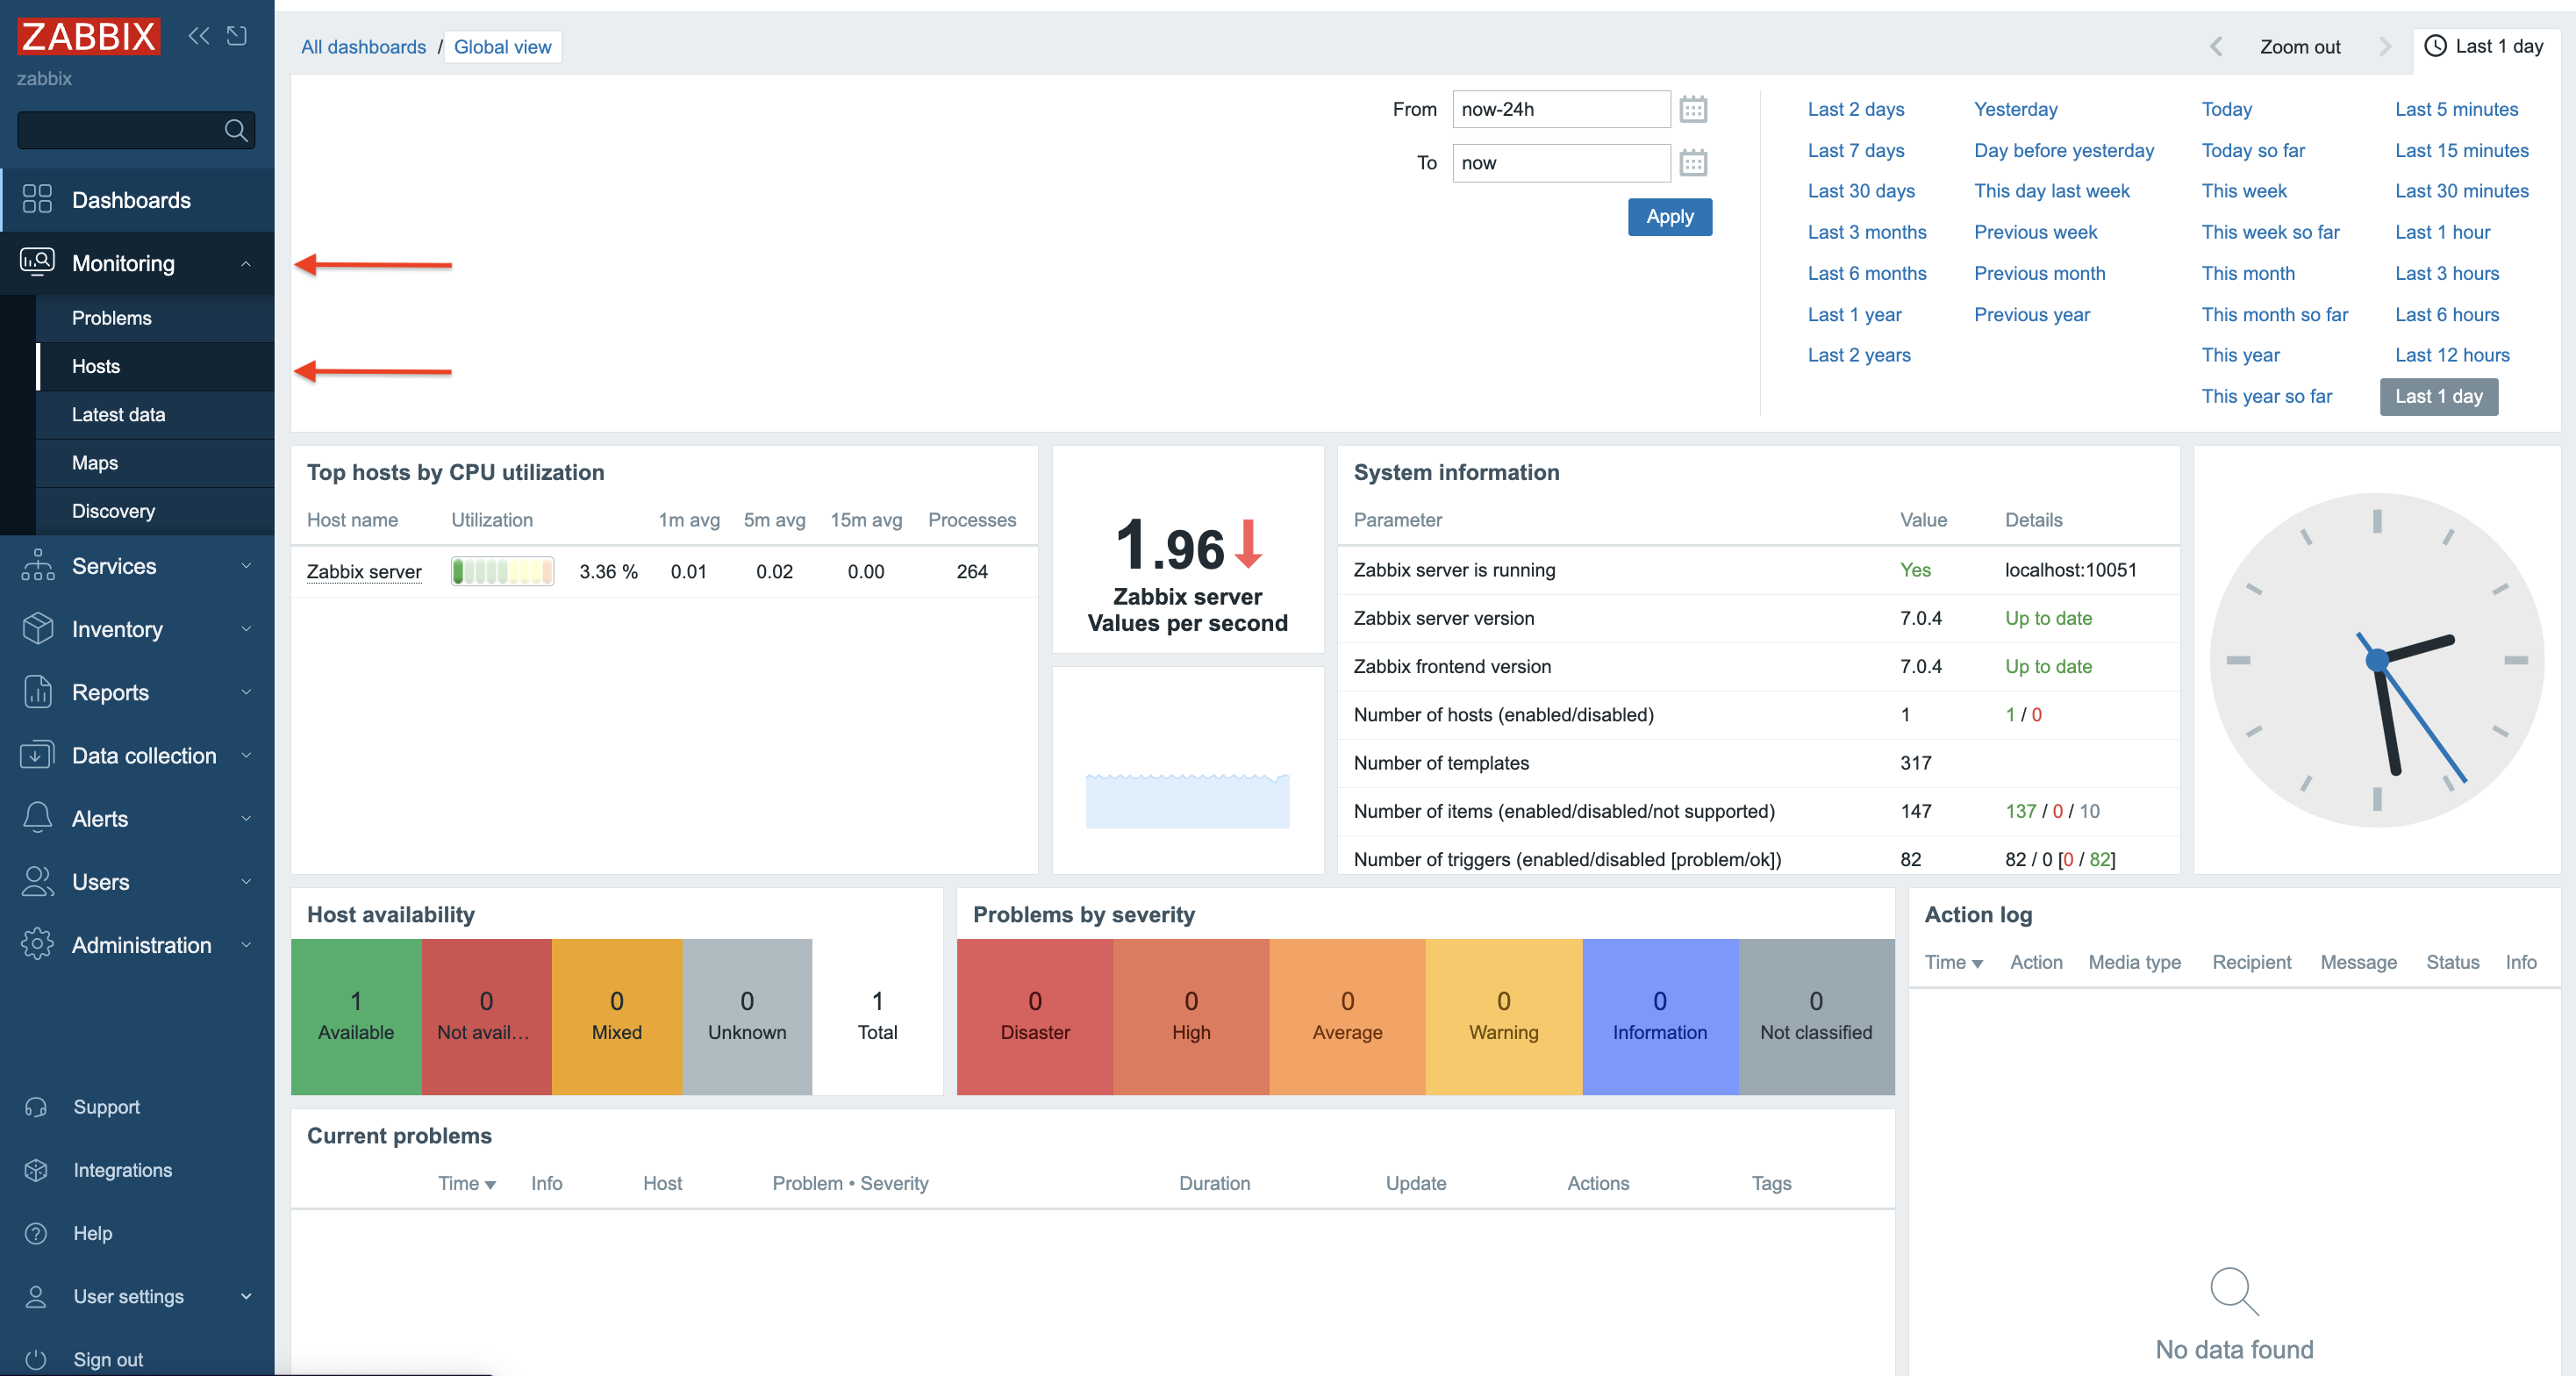
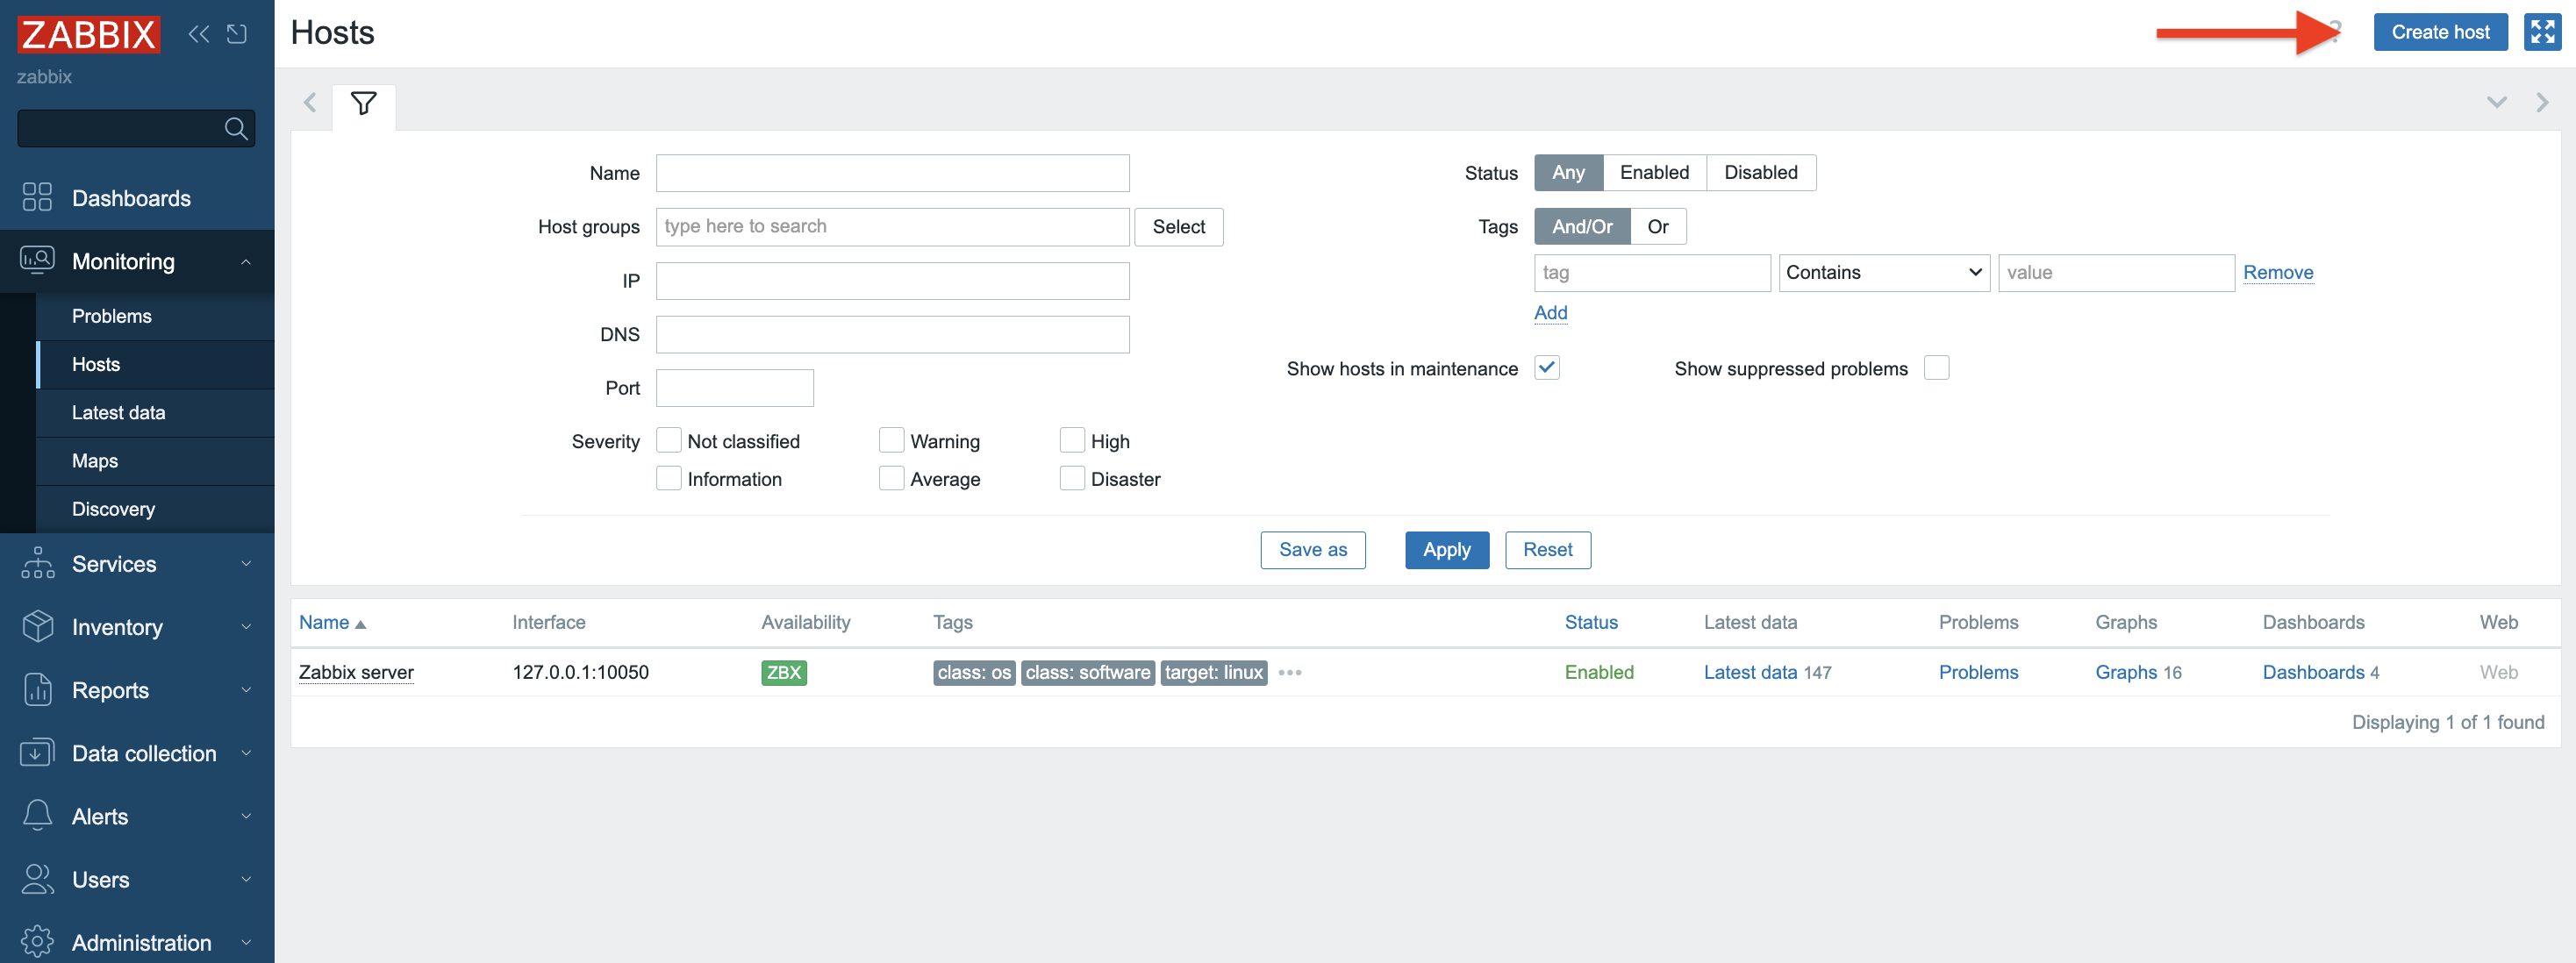
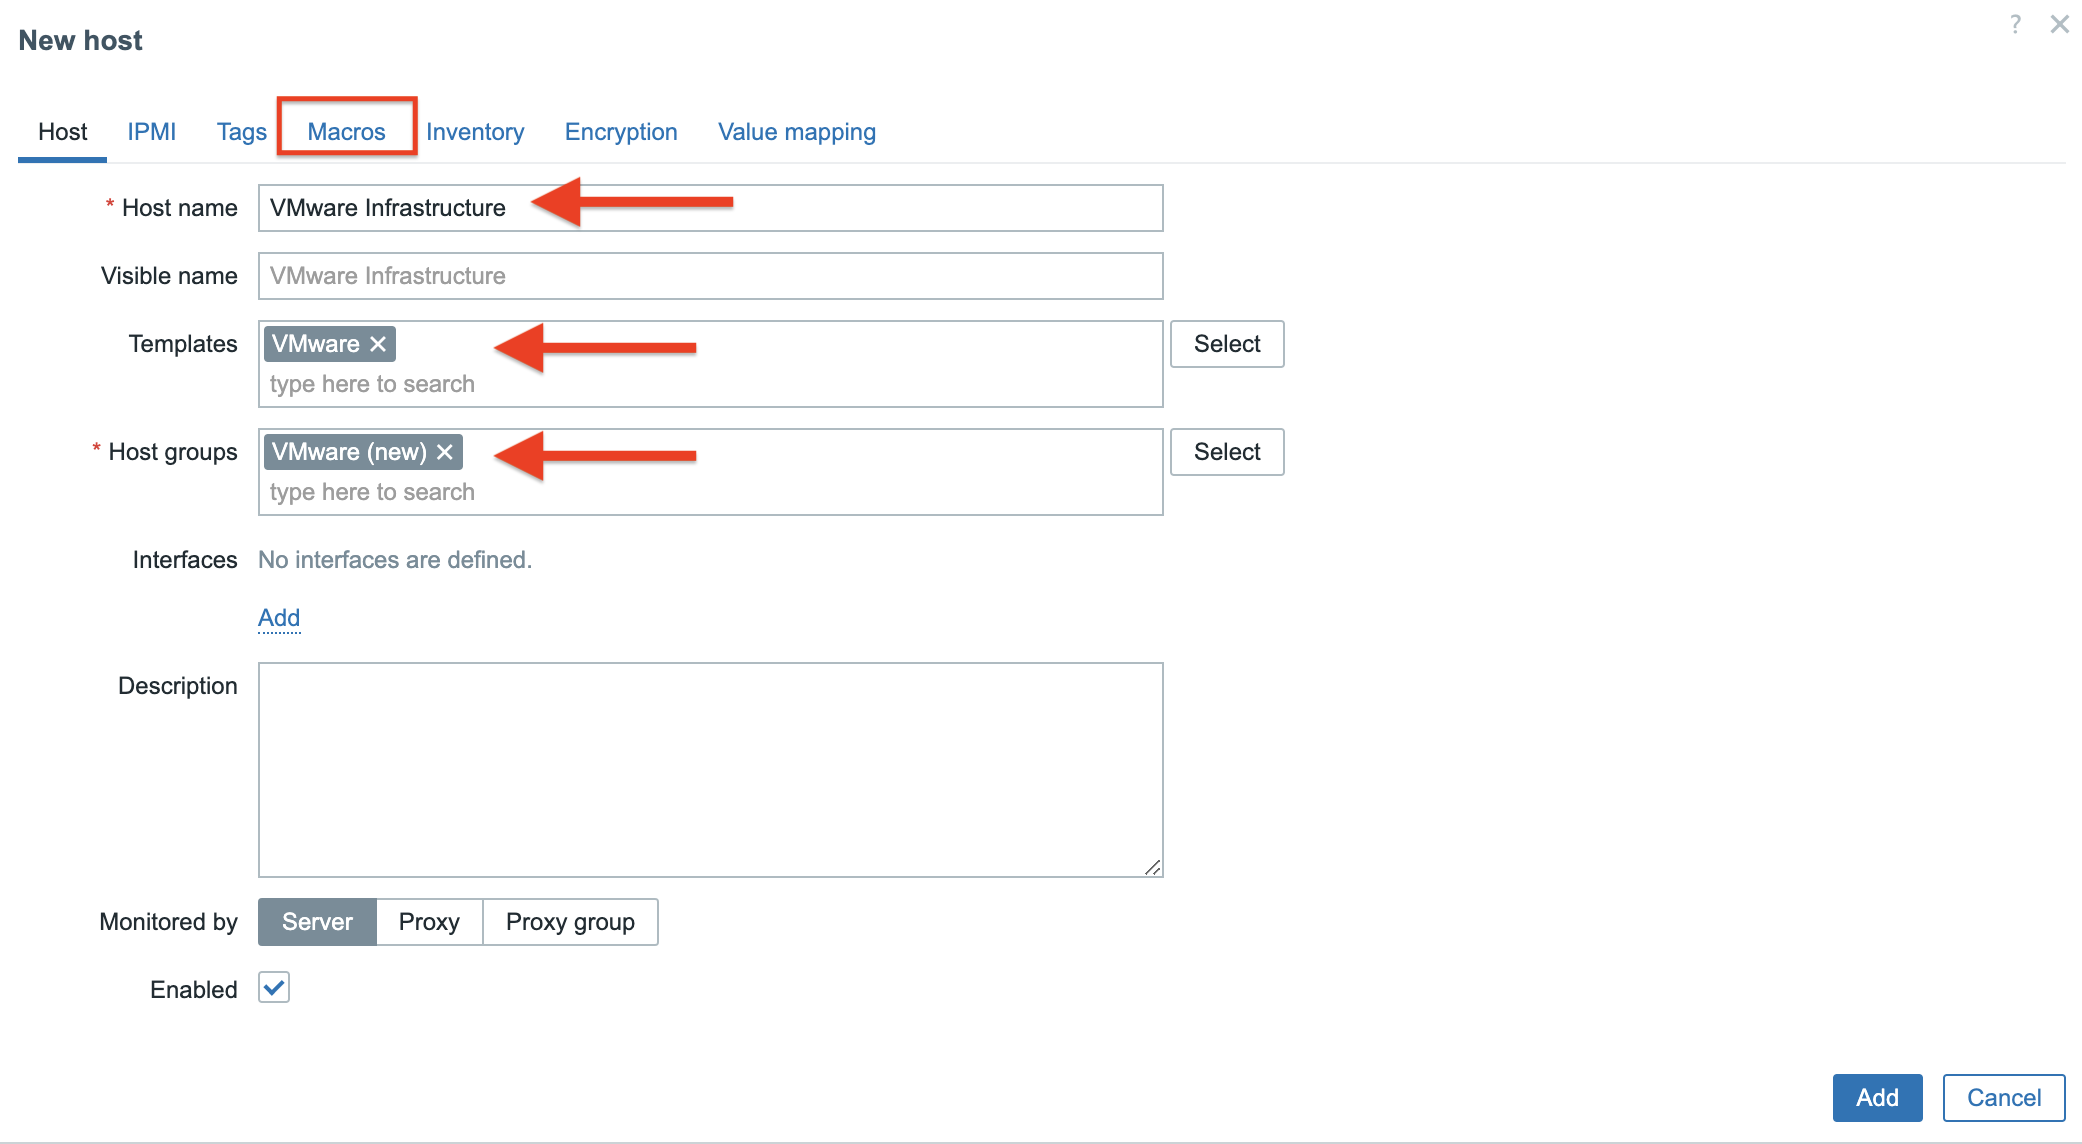
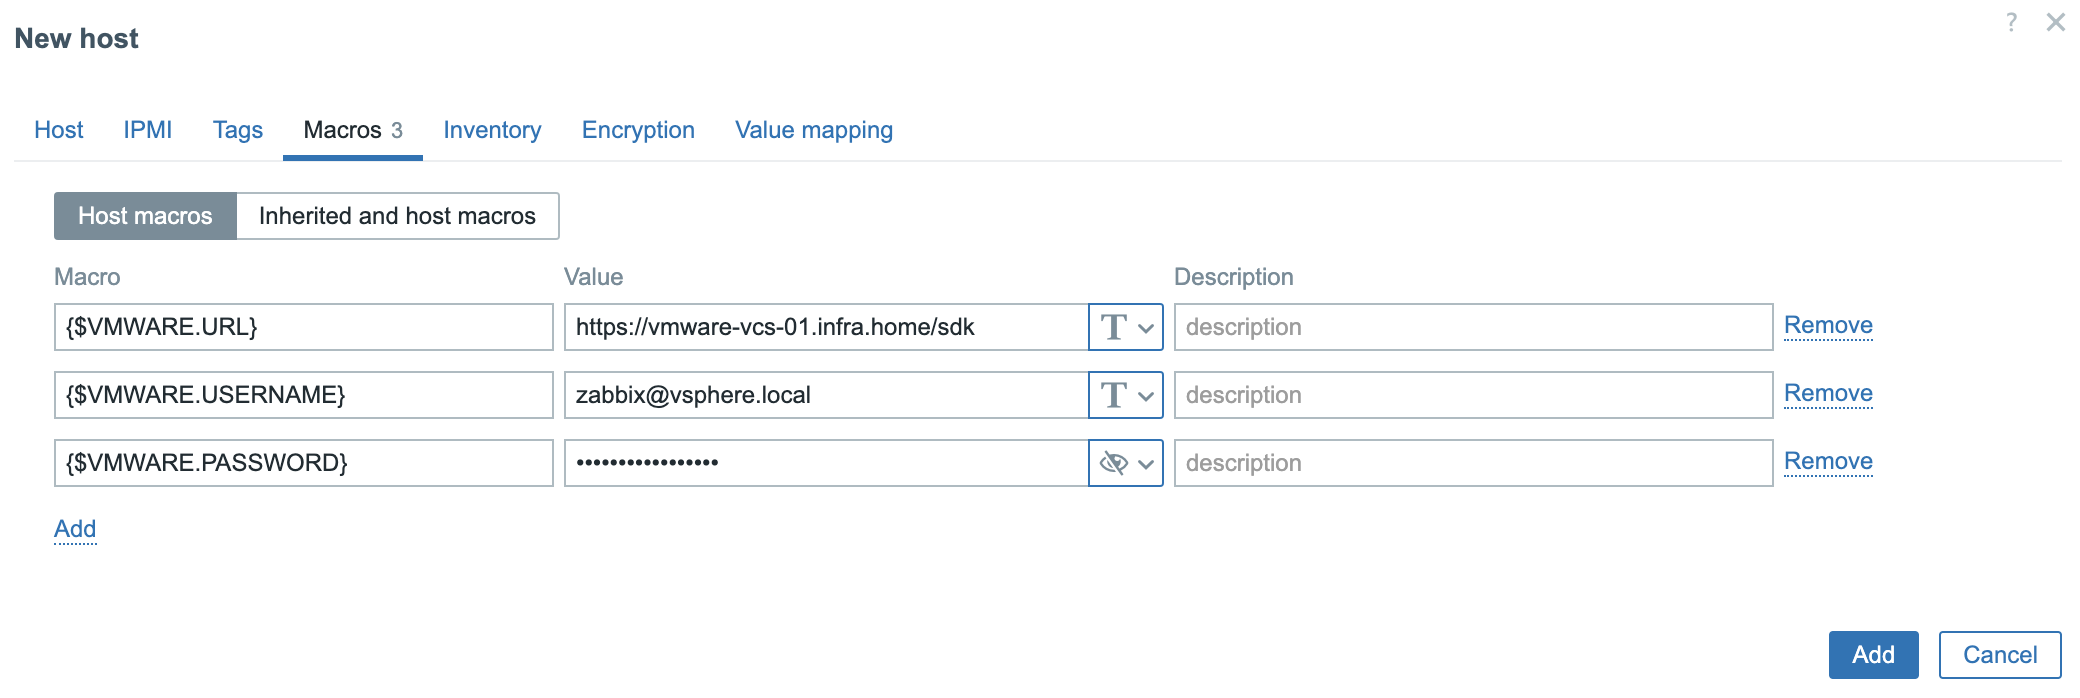
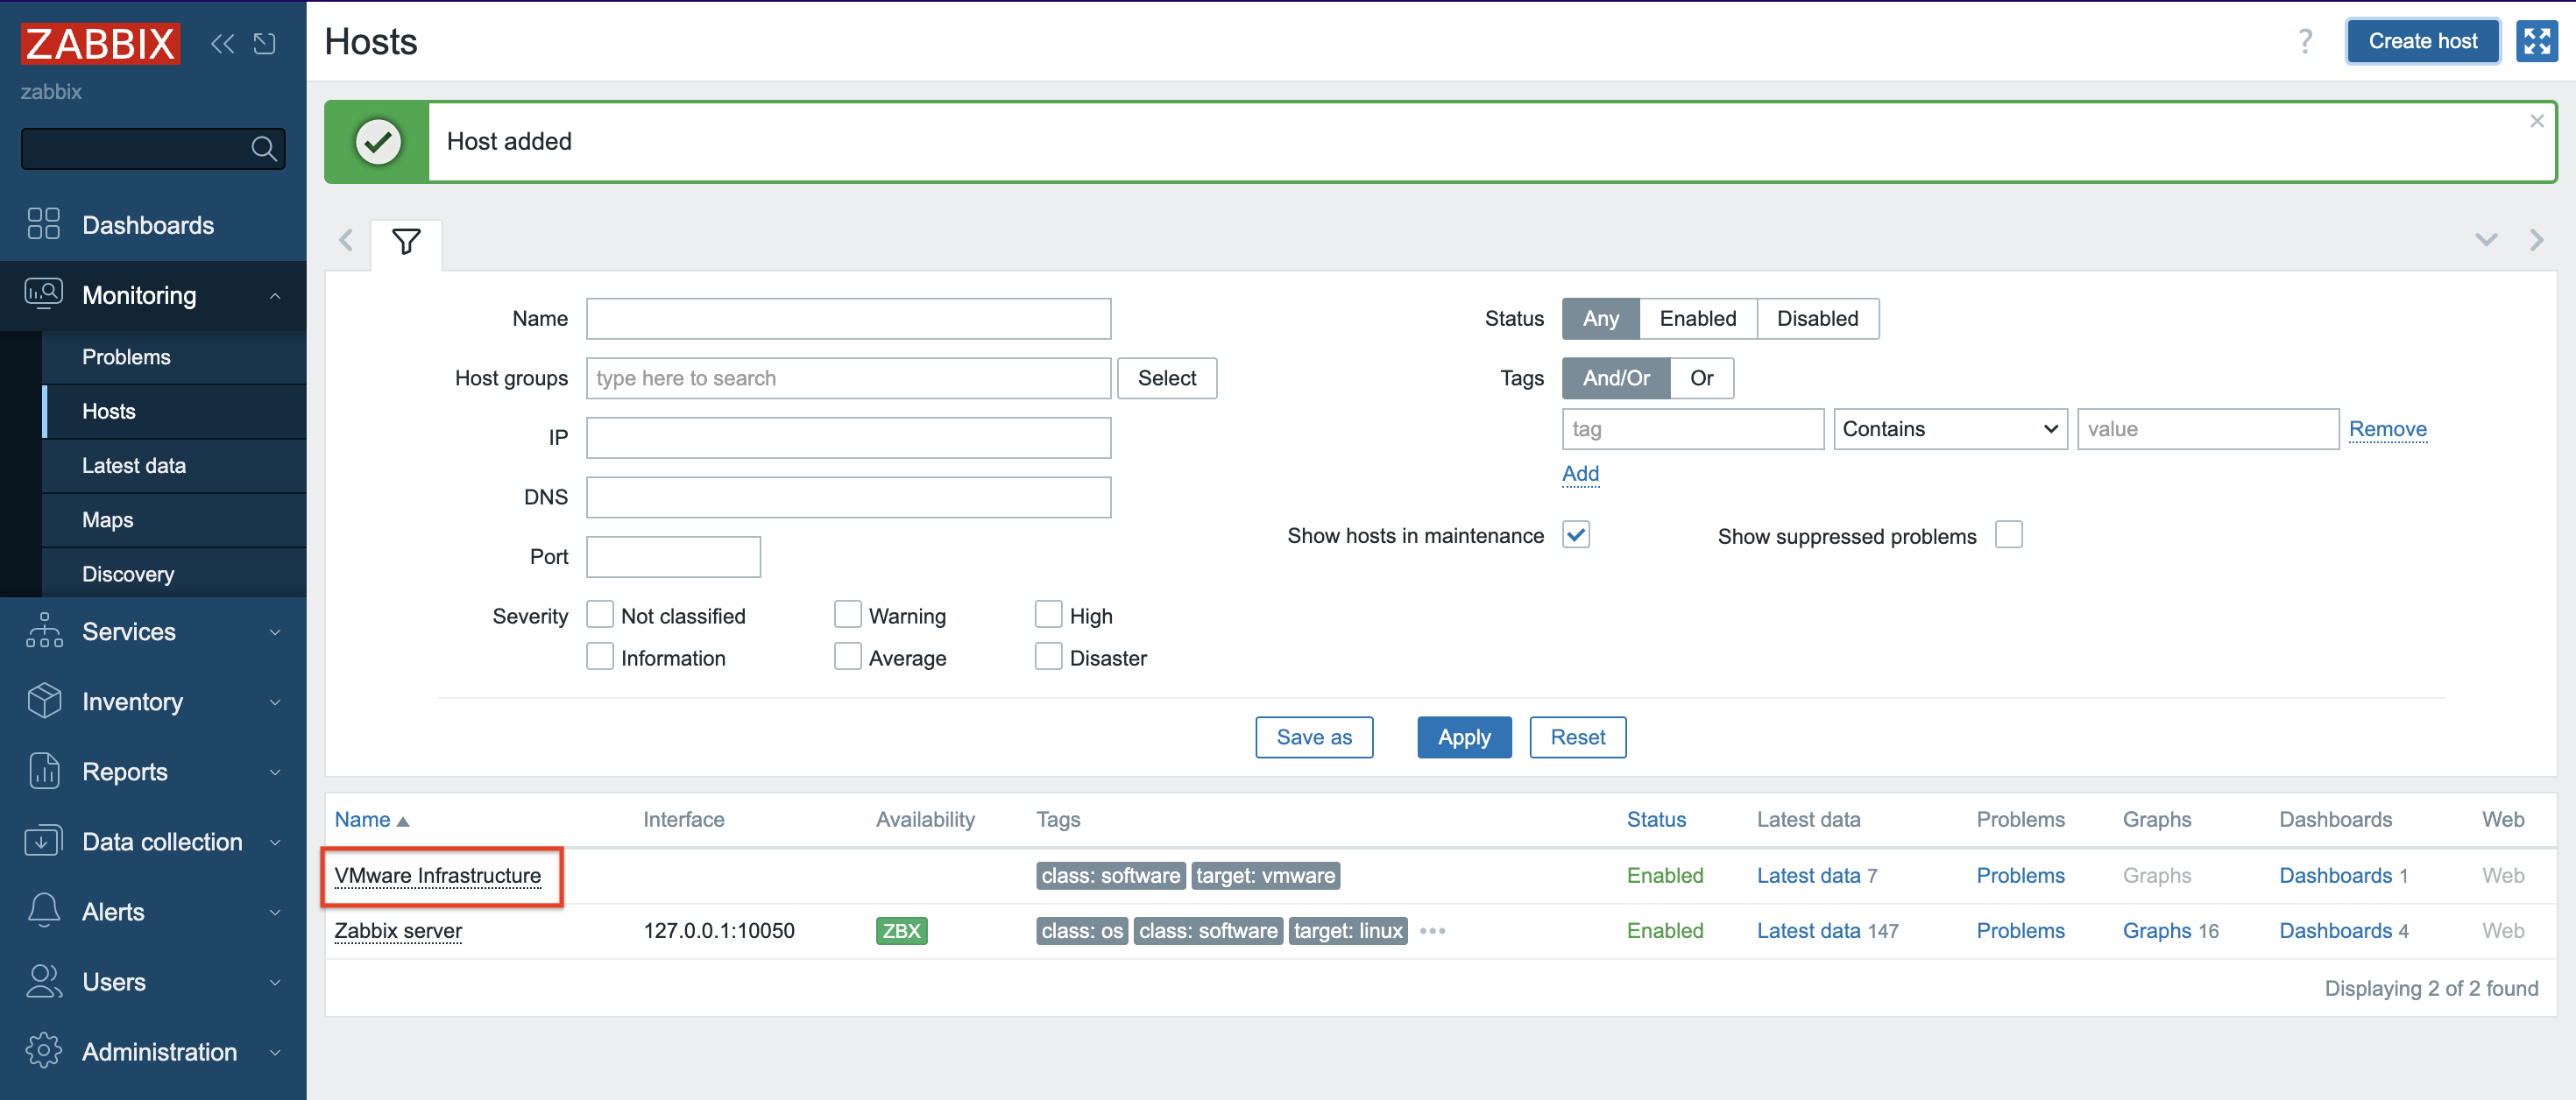
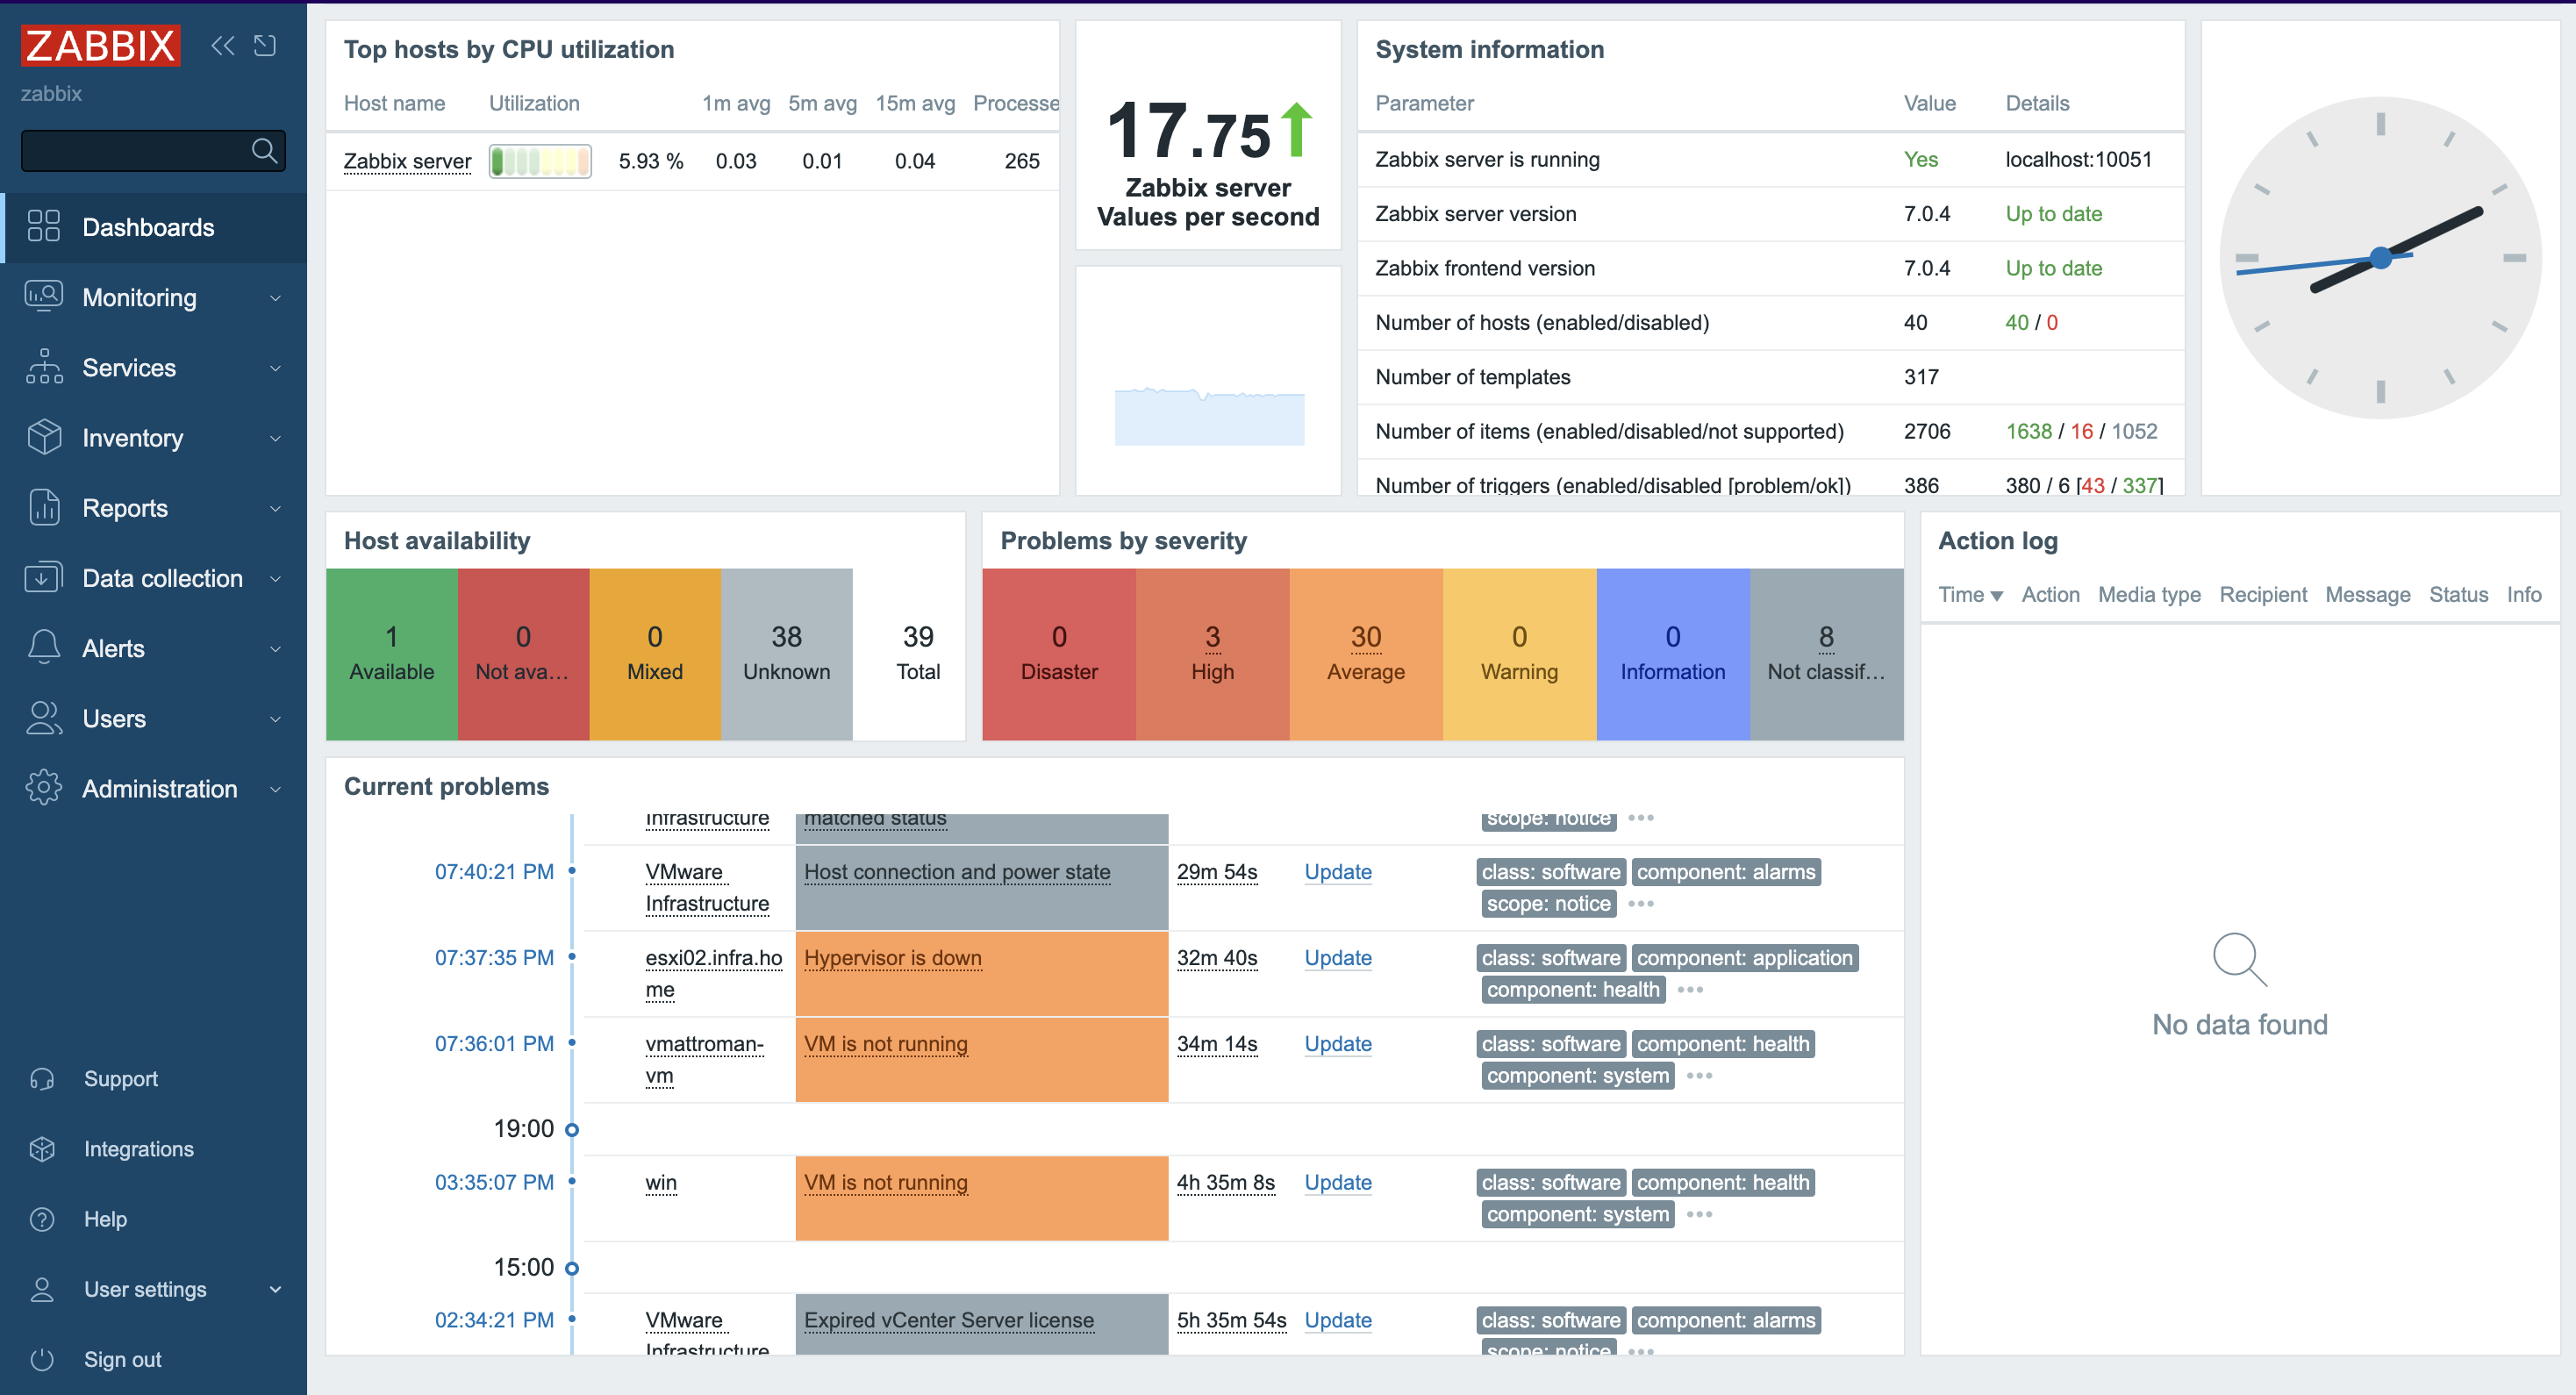
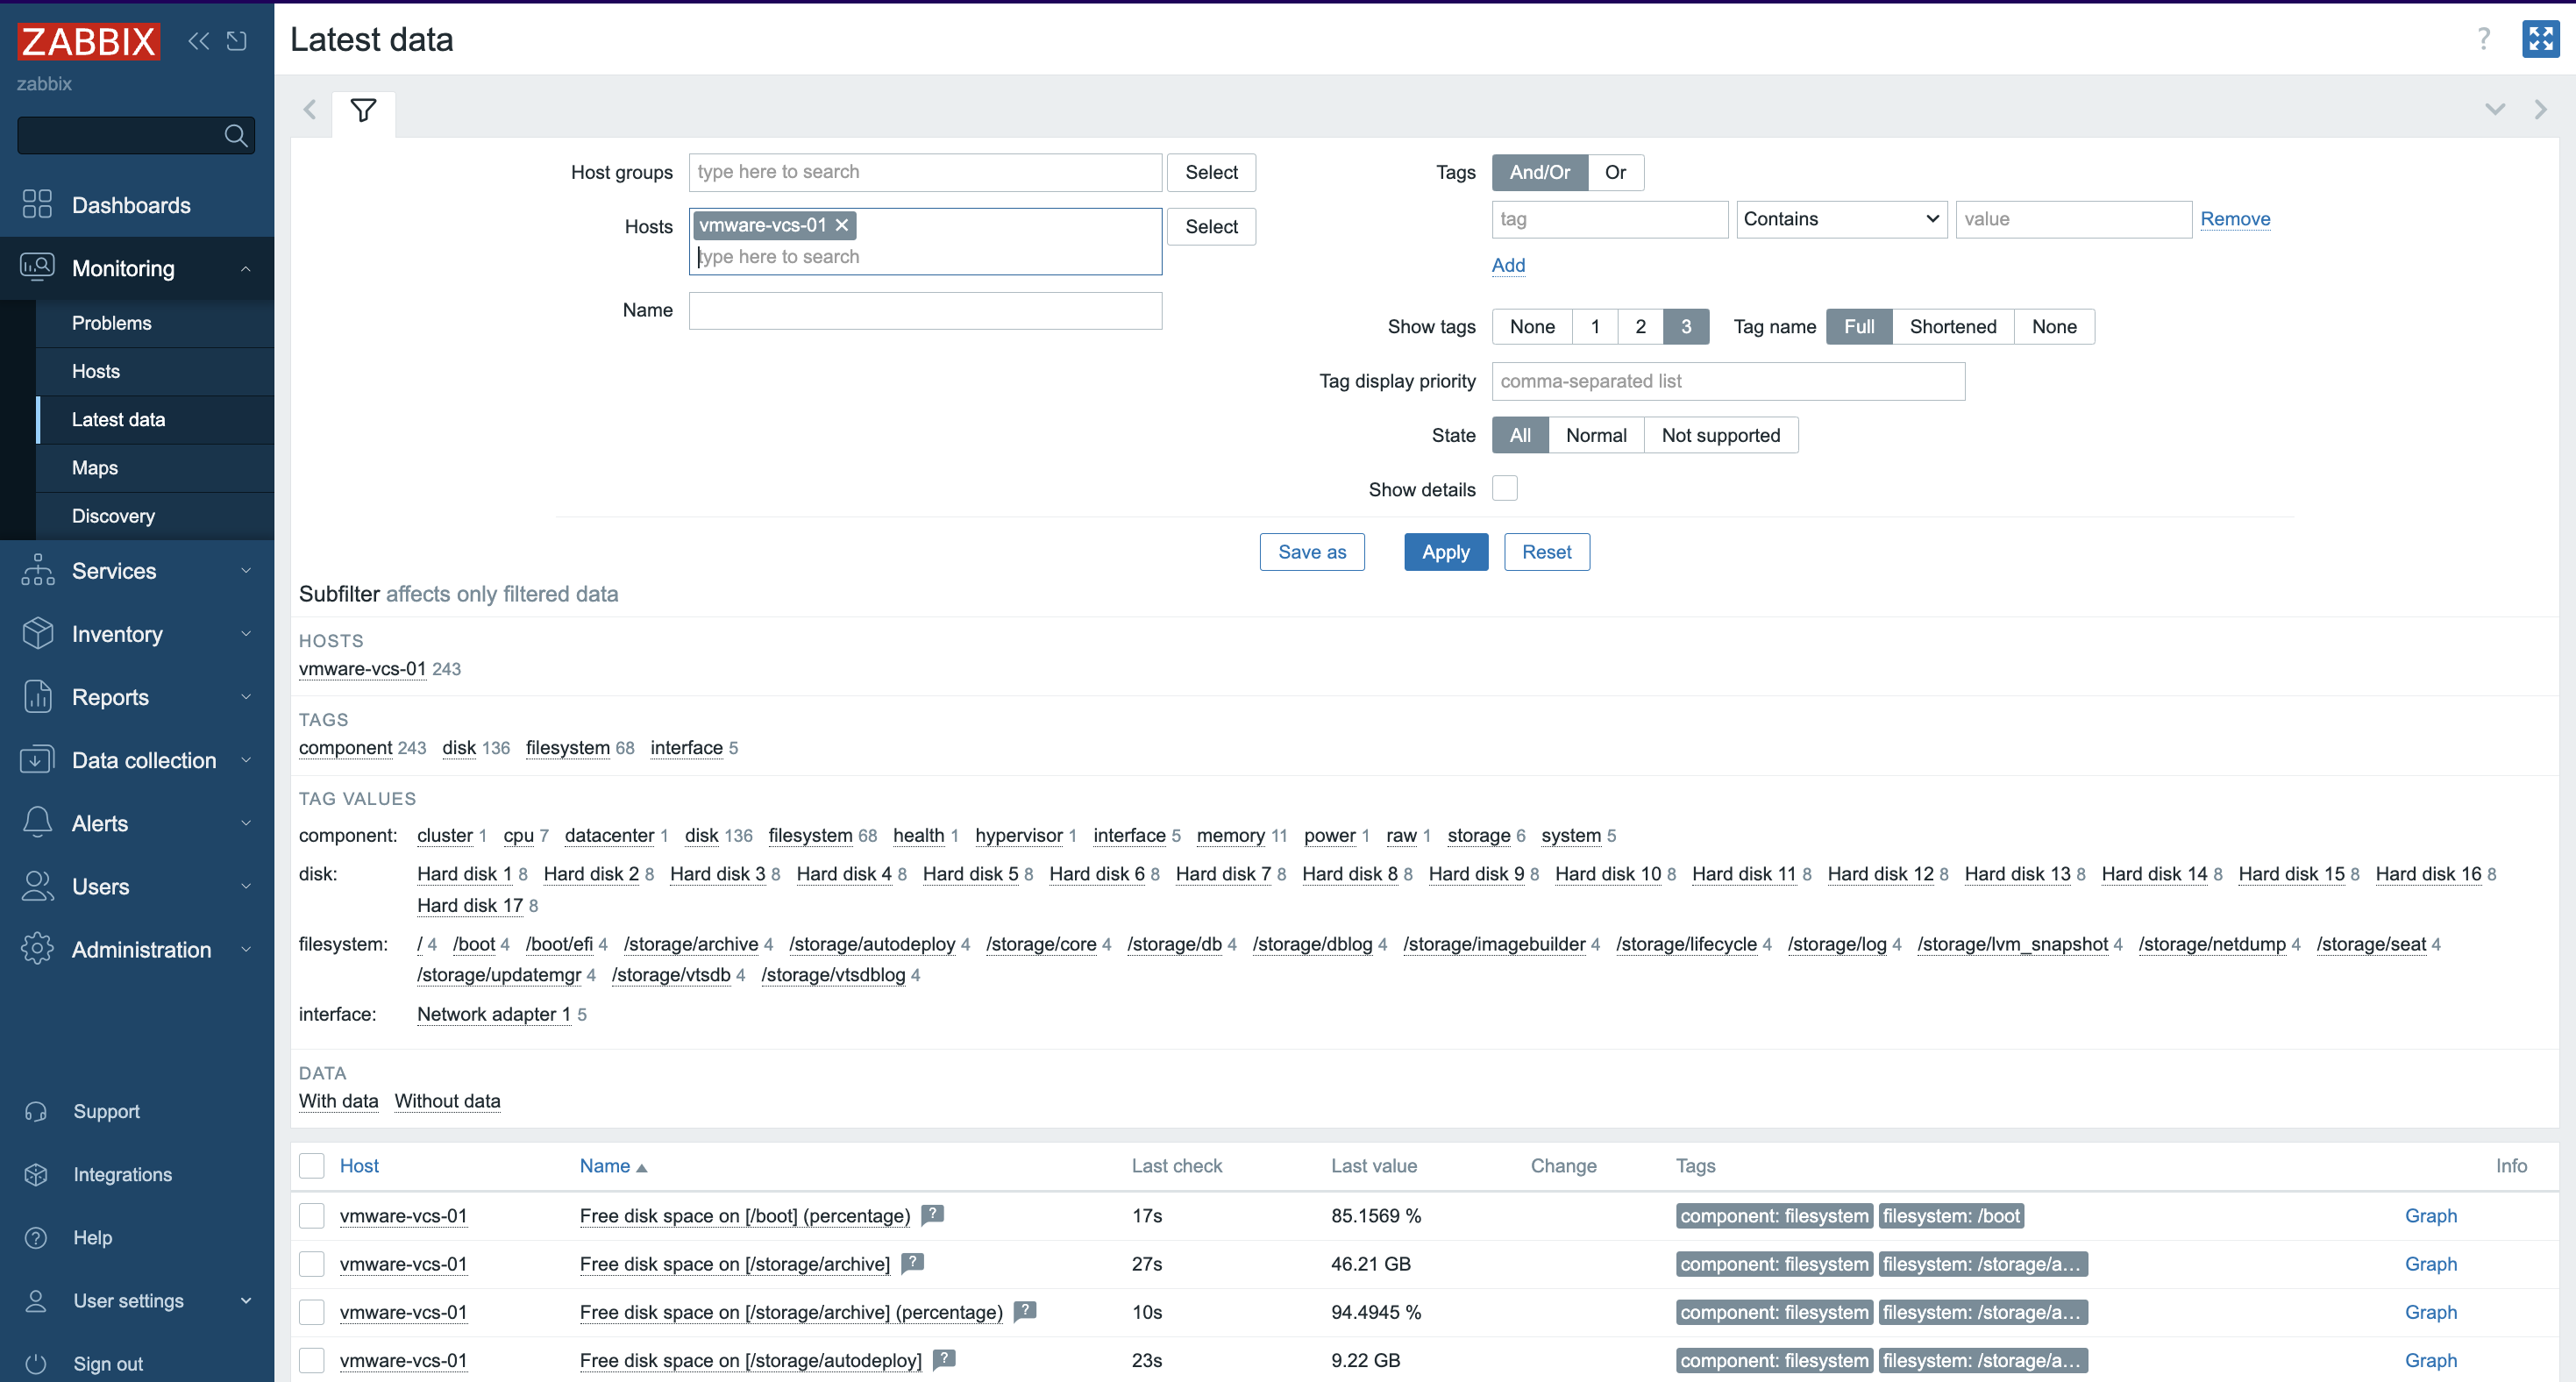
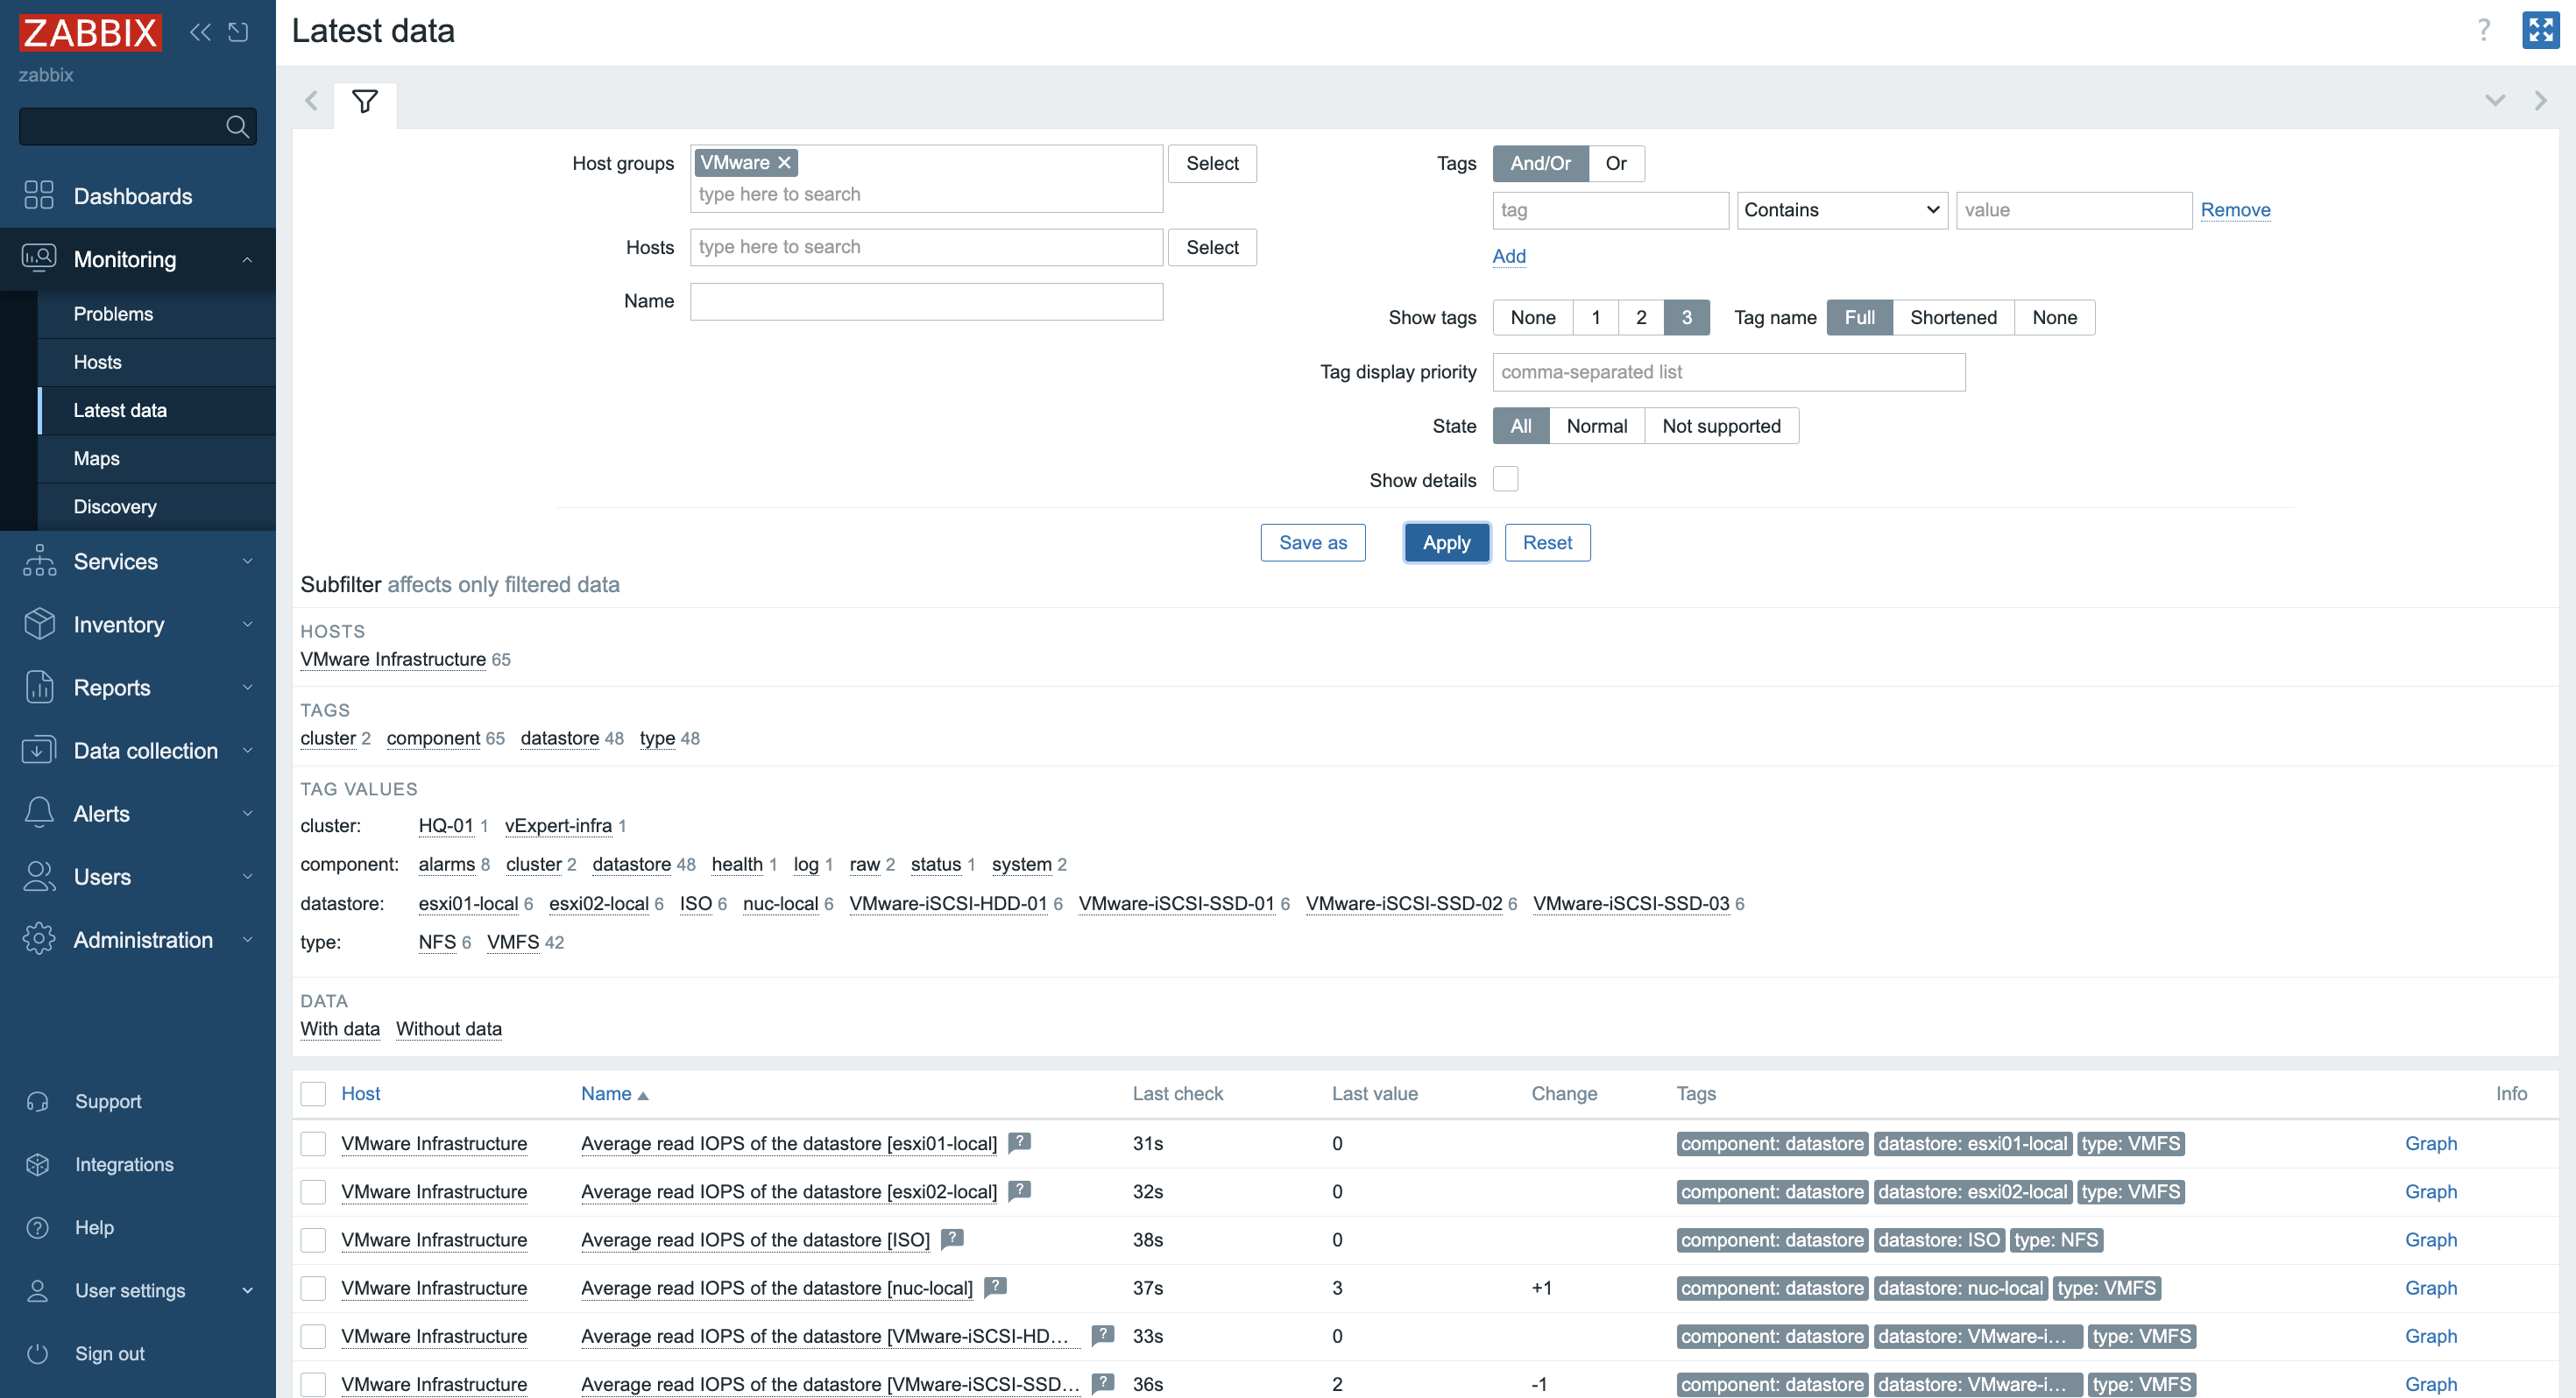
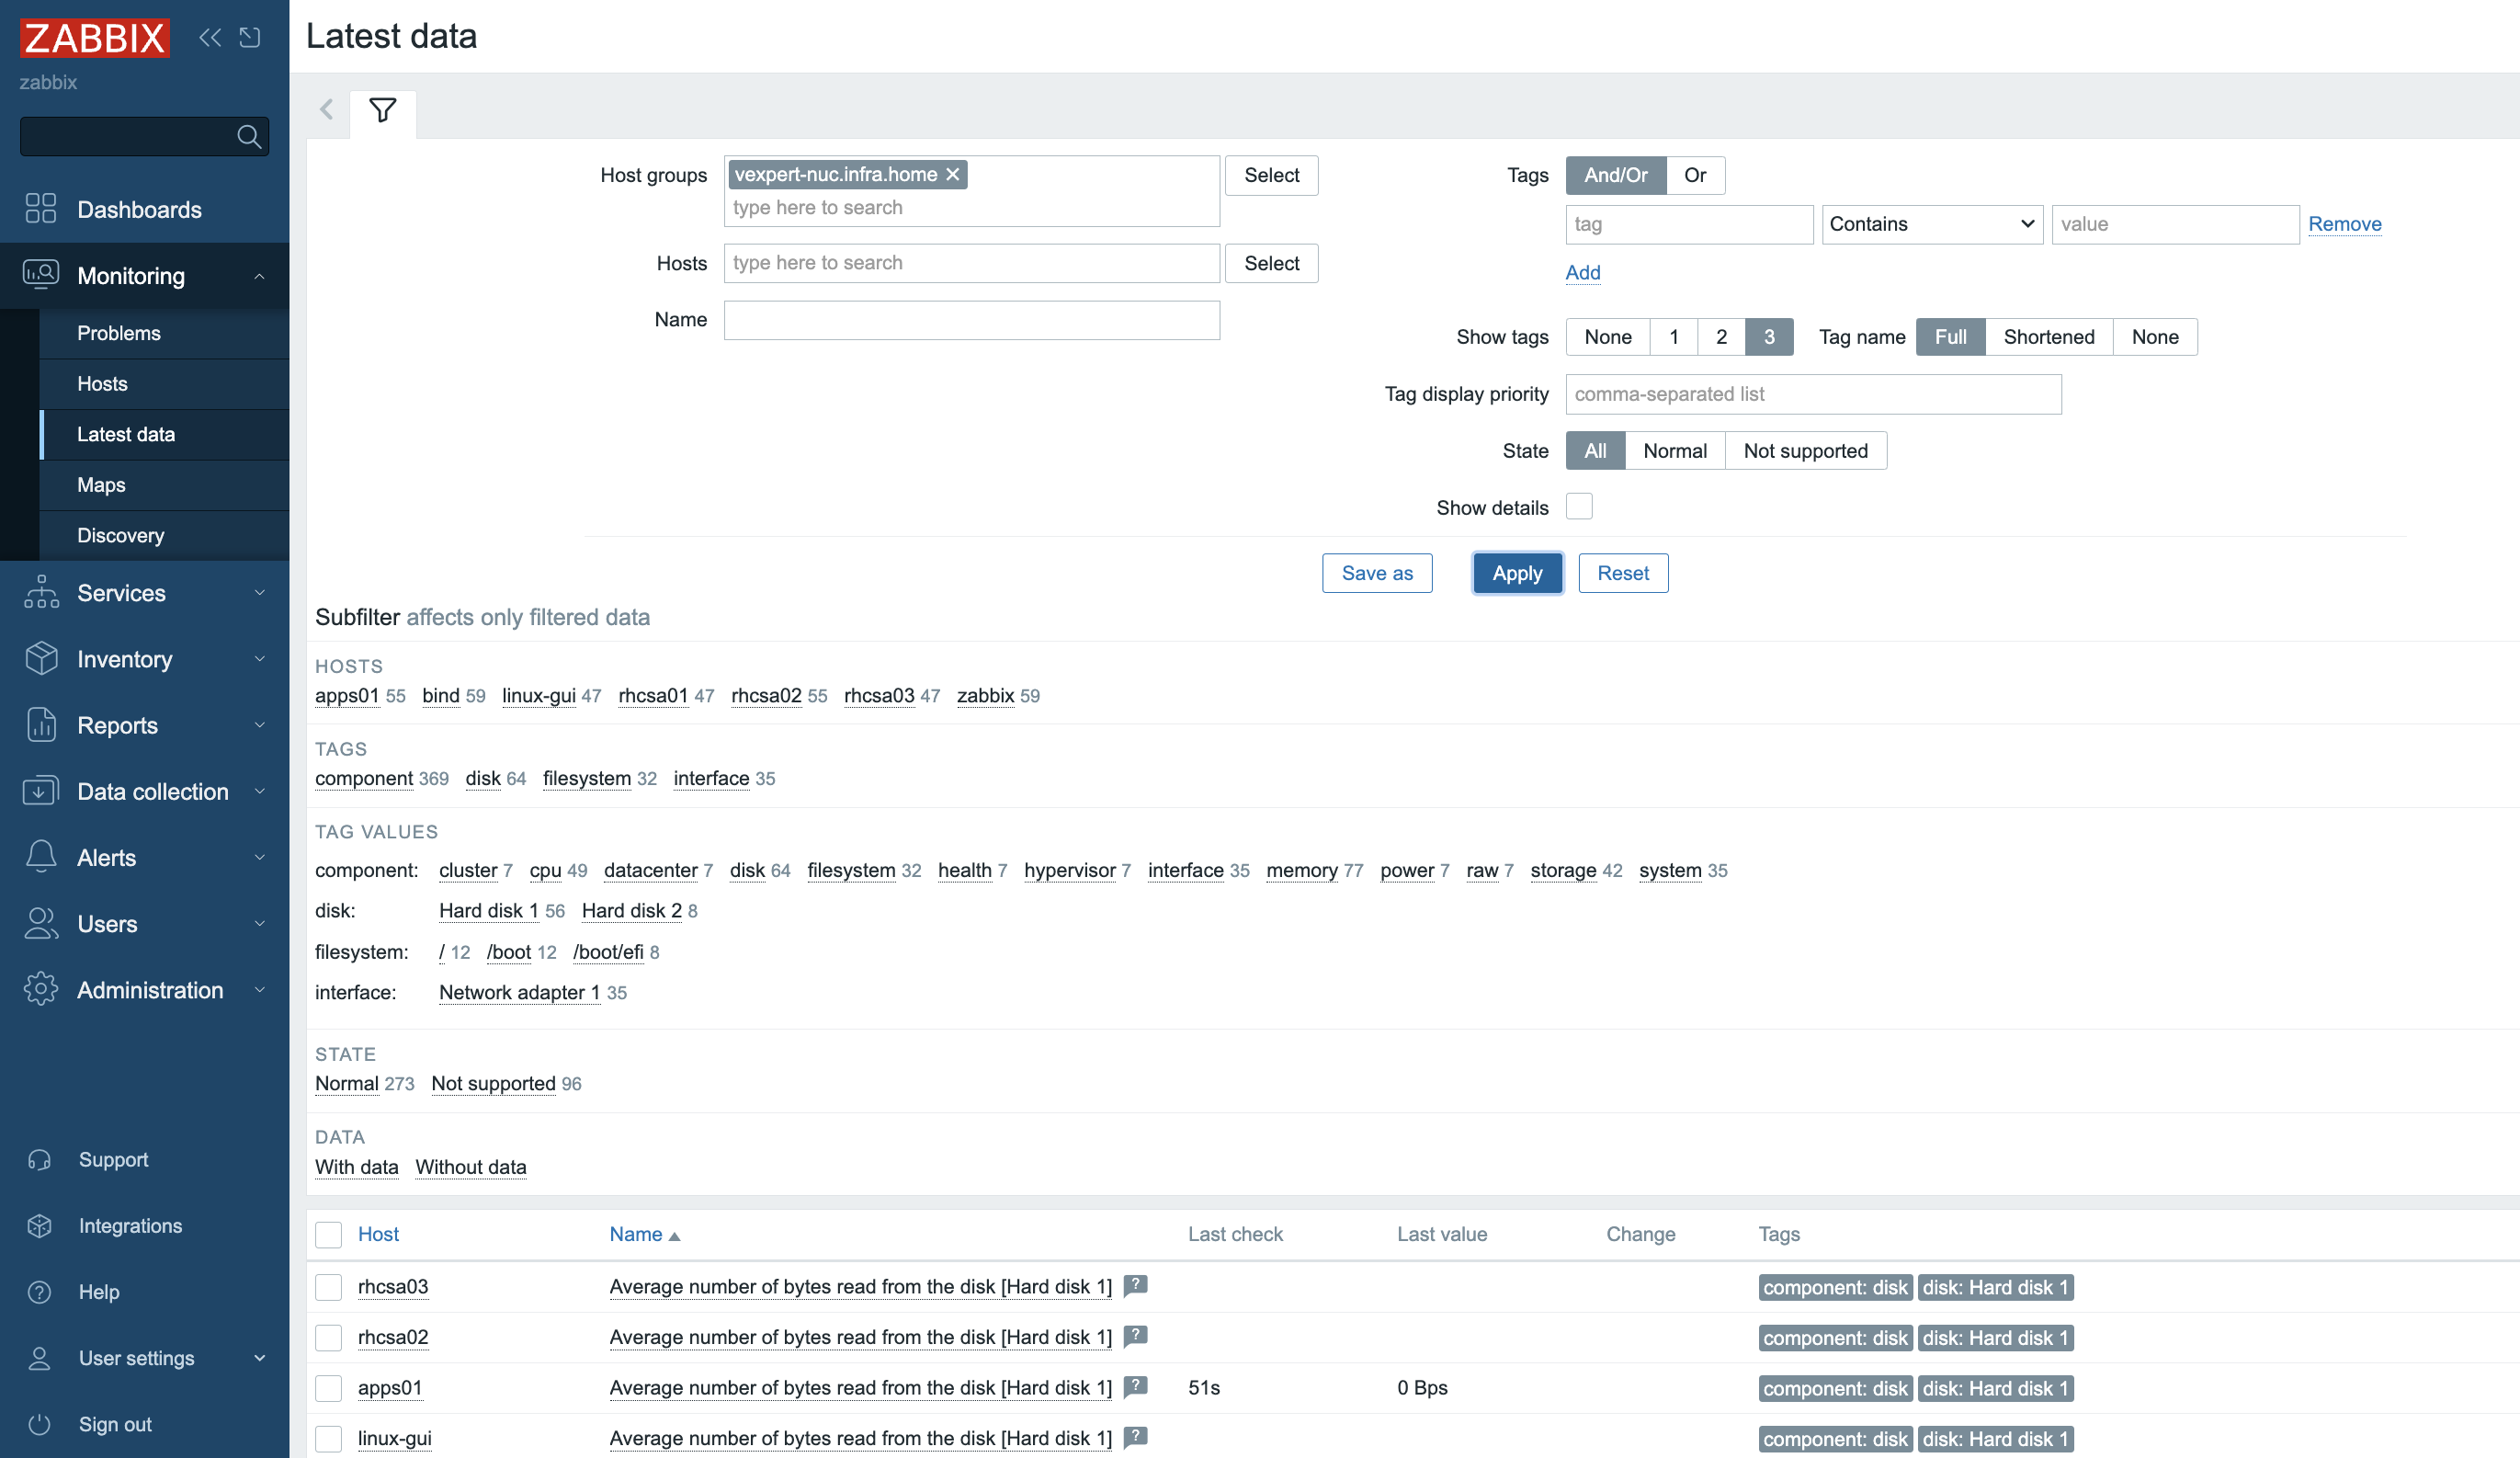
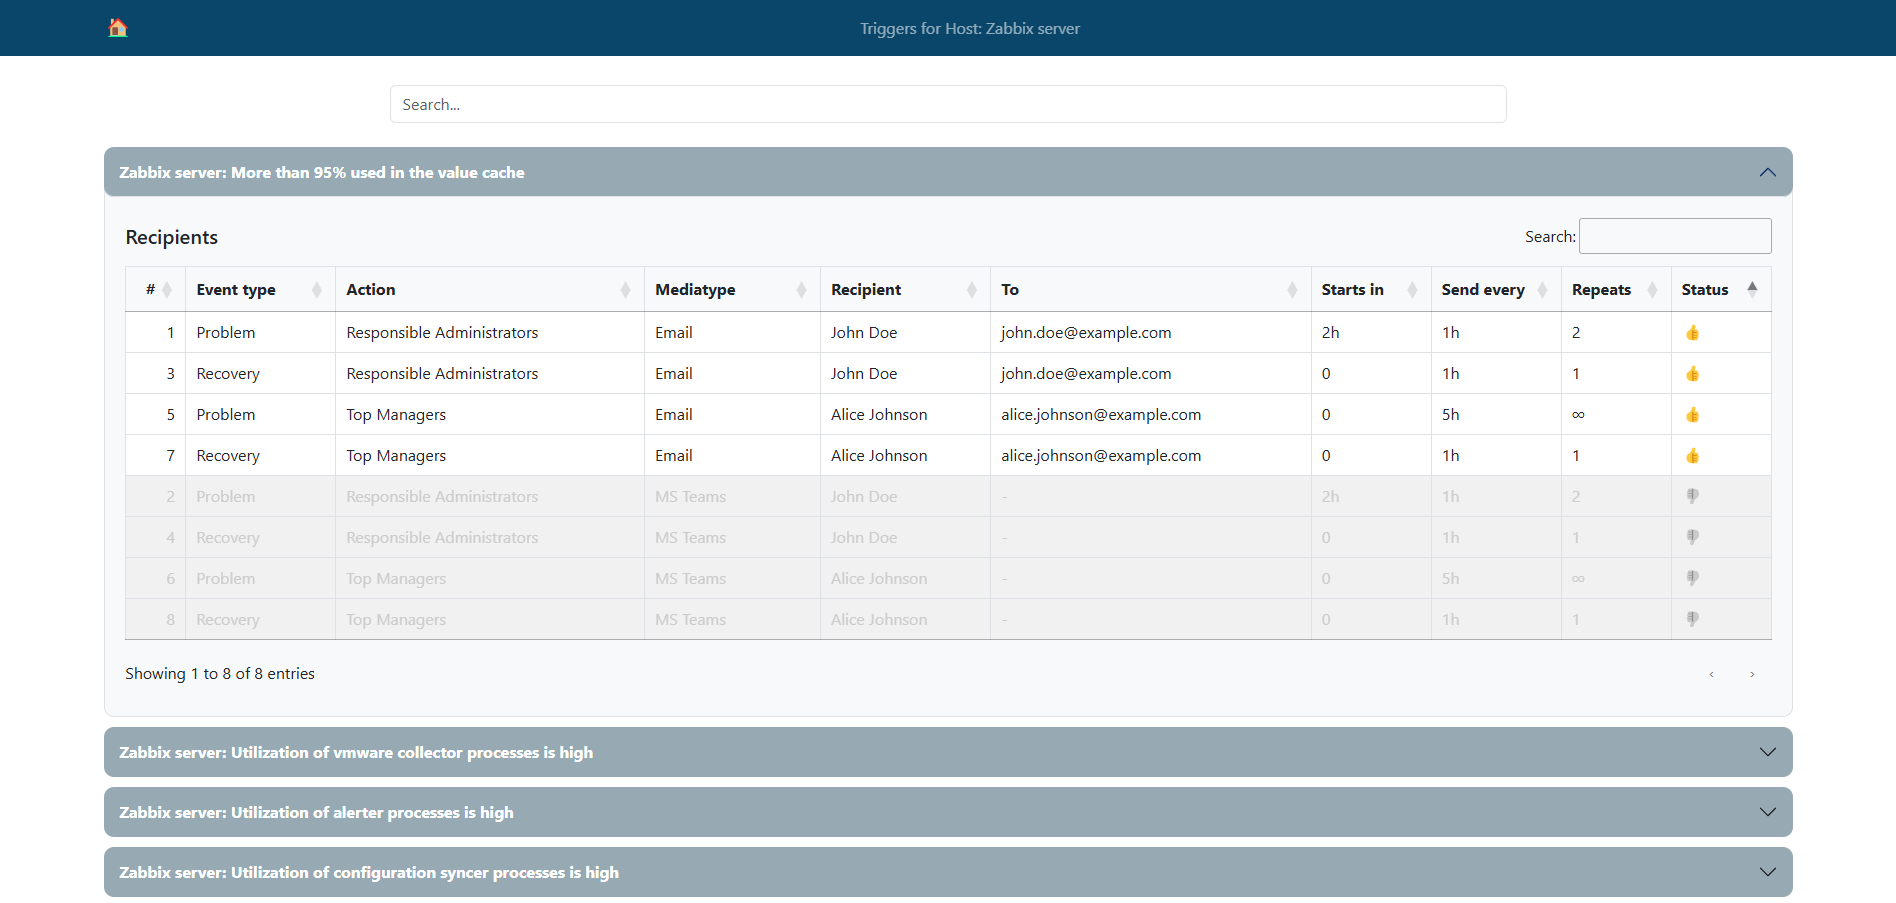
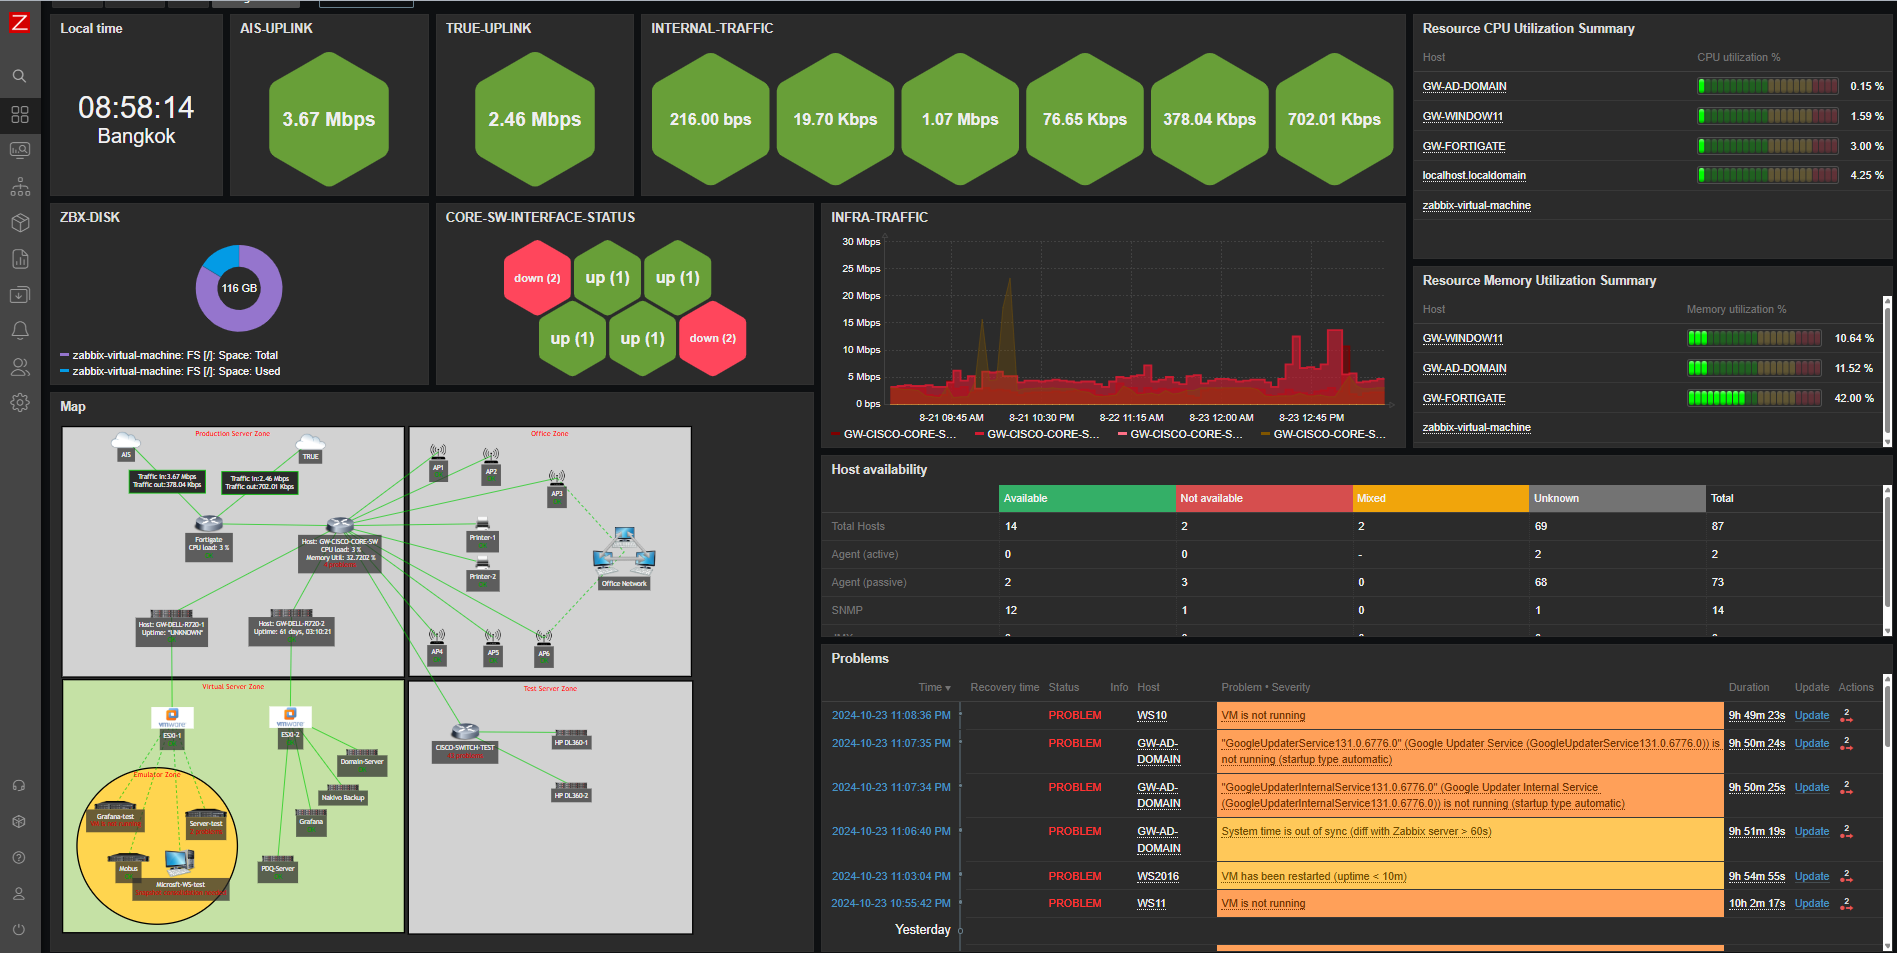
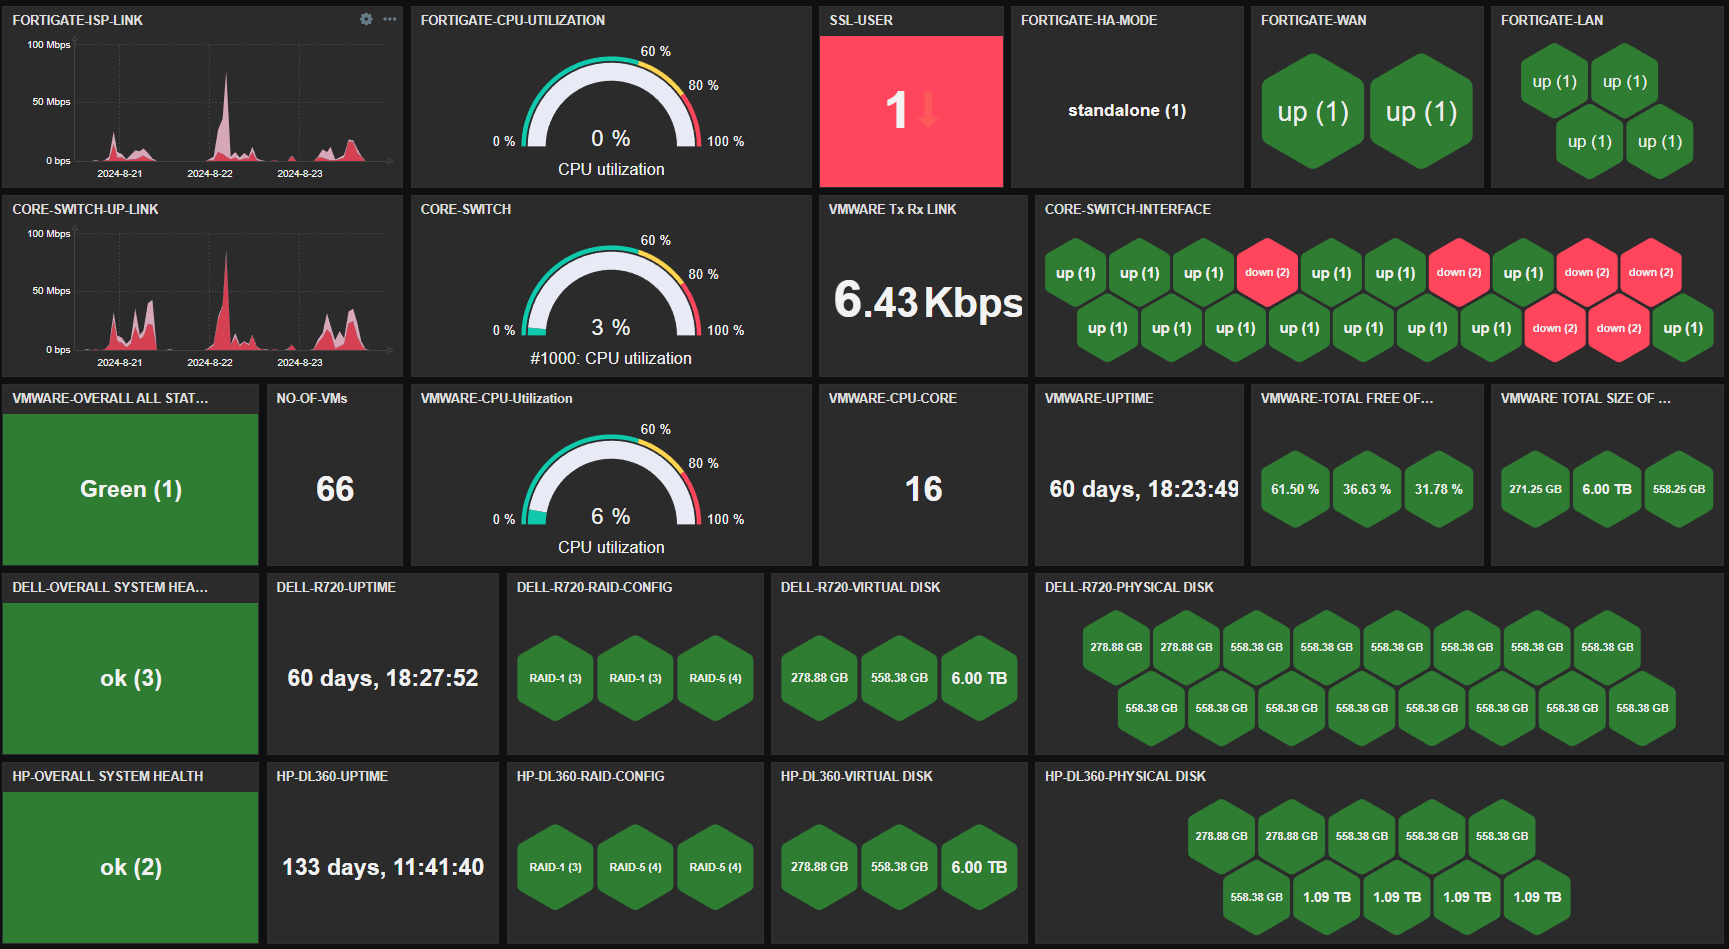


 Ruben Simon is a Head of Product for BMW’s Cloud Data Hub, the company’s largest data platform. He is passionate about driving digital transformation in aata, analytics, and AI, and thrives on collaborating with international teams. Outside the office, Ruben cherishes family time and has a keen interest in continual learning.
 Khalid Al Khalili is a Data Architect at BMW Group, leading the architecture of the Cloud Data Hub, BMW’s central platform for data innovation. He is a strong advocate for creating seamless data experiences, transforming complex requirements into efficient, user-friendly solutions. When he’s not building new features, Khalid enjoys collaborating with his peers and cross-functional teams to advance and shape BMW’s data strategy, ensuring it stays ahead in a rapidly evolving landscape.
 Florian Seidel is a Global Solutions Architect specializing in the automotive sector at AWS. He guides strategic customers in harnessing the full potential of cloud technologies to drive innovation in the automotive industry. With a passion for analytics, machine learning, AI, and resilient distributed systems, Florian helps transform cutting-edge concepts into practical solutions. When not architecting cloud strategies, he enjoys cooking for family and friends and experimenting with electronic music production.
 Aishwarya Lakshmi Krishnan is a Senior Customer Solutions Manager with AWS Automotive. She is passionate about solving business problems using generative AI and cloud based technologies.
 Durga Mishra is a Principal solutions architect at AWS. Outside of work, Durga enjoys spending time building new things and spend time with family and loves to hike on Appalachian trails and spend time in nature.
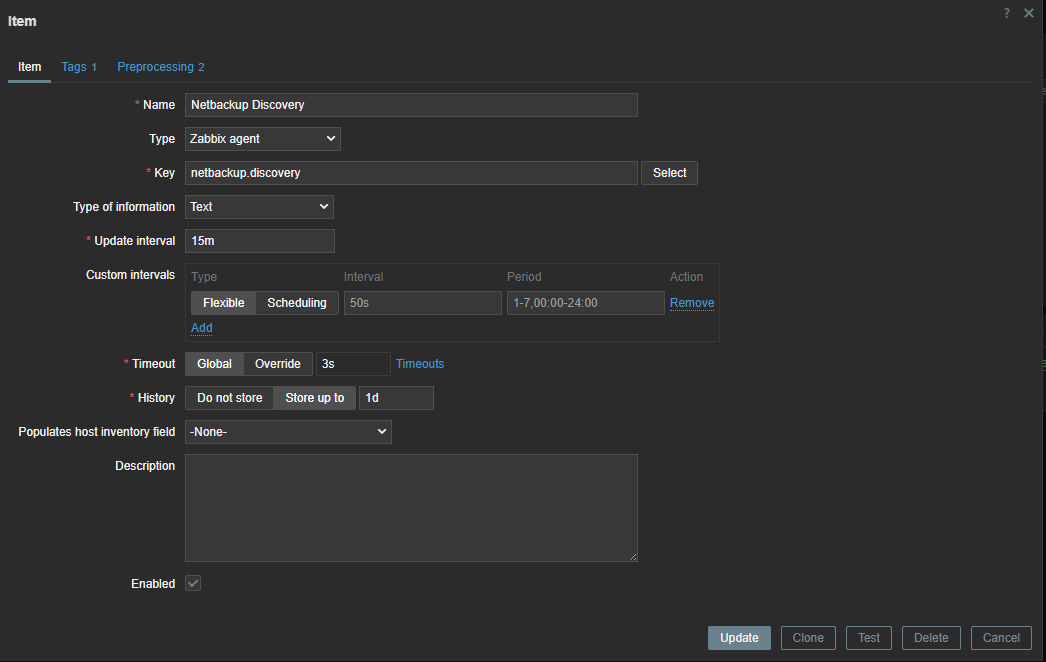
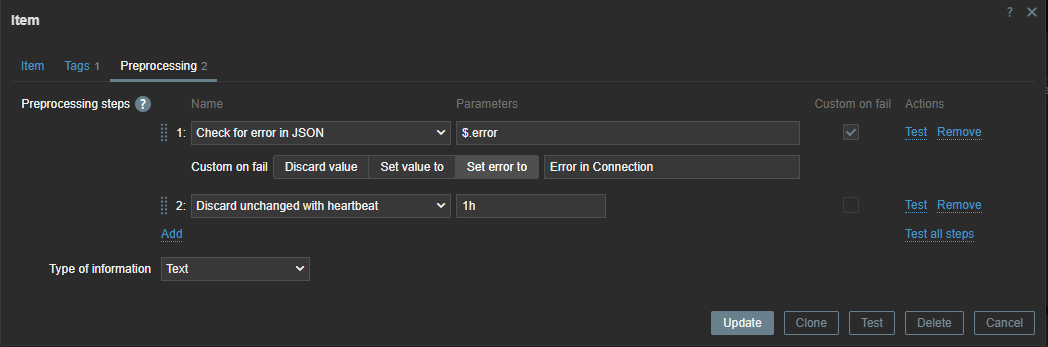
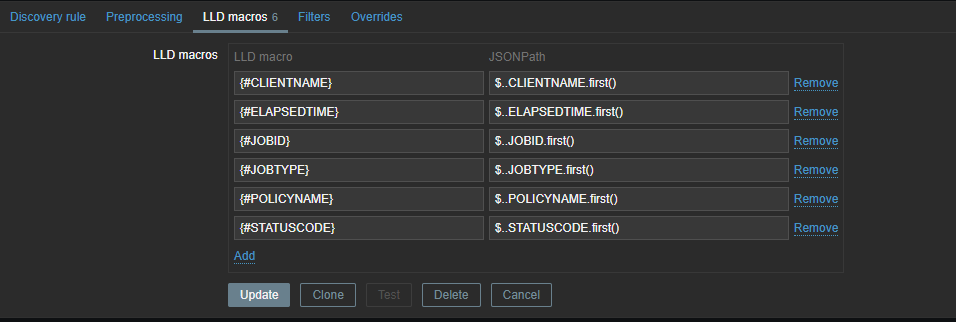
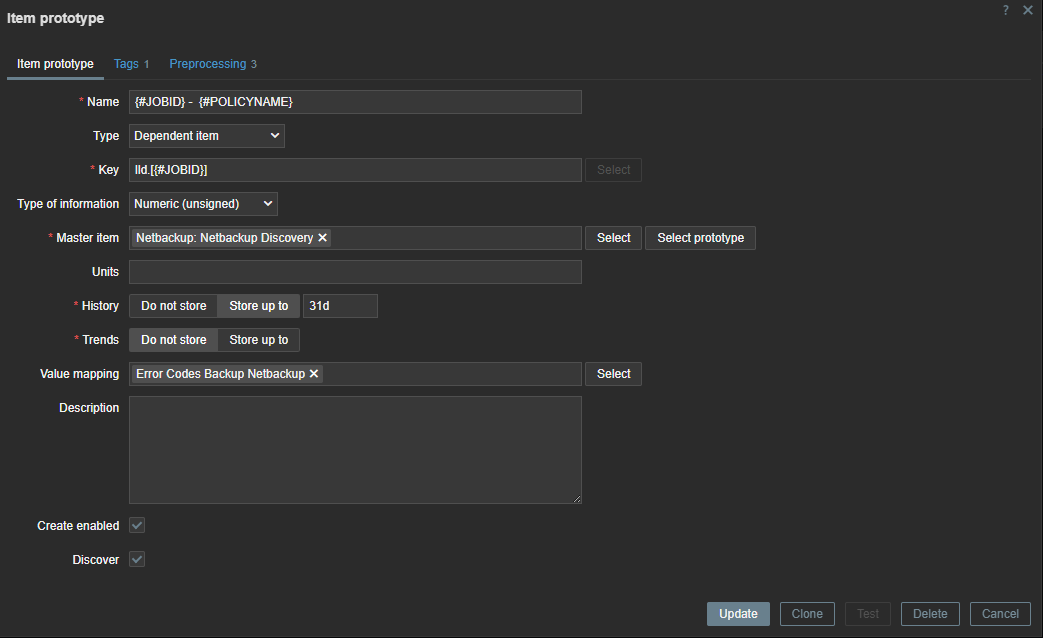
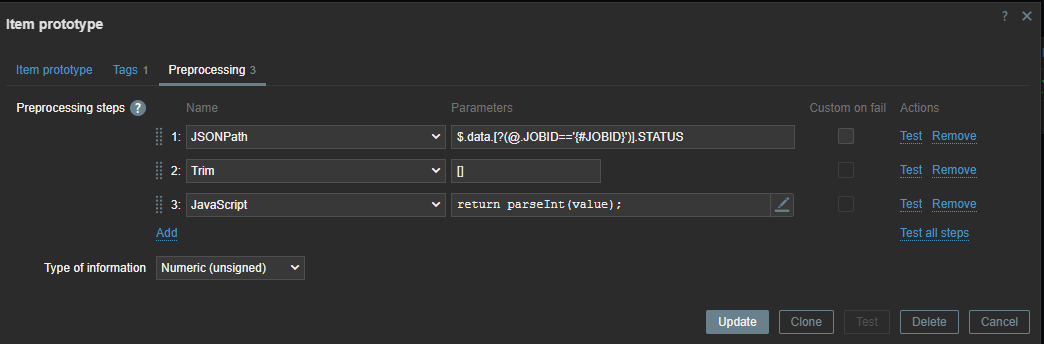
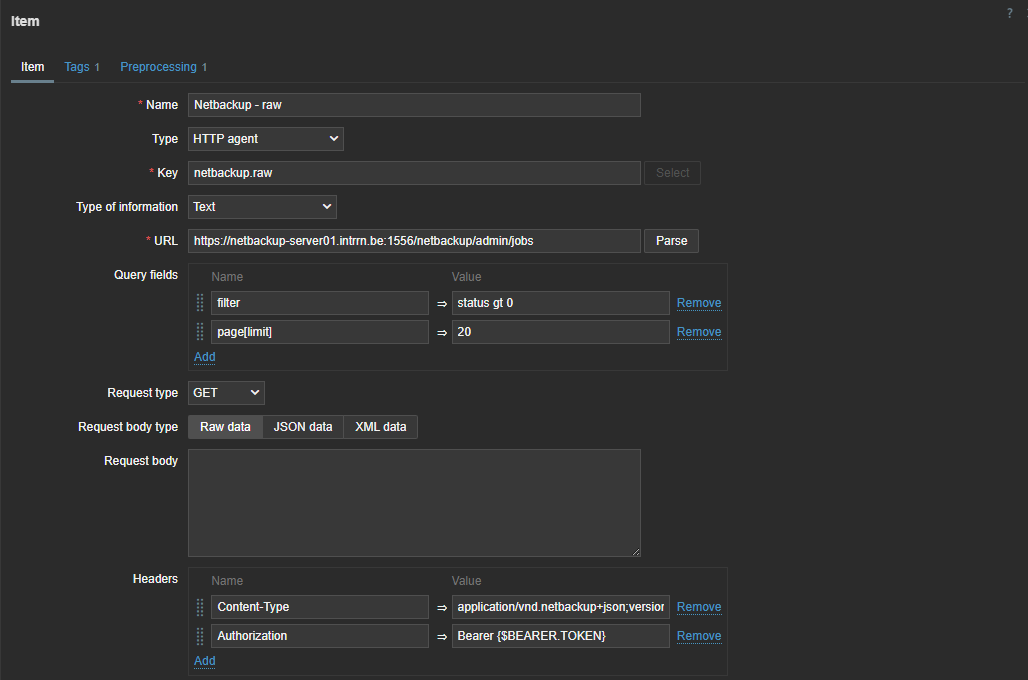

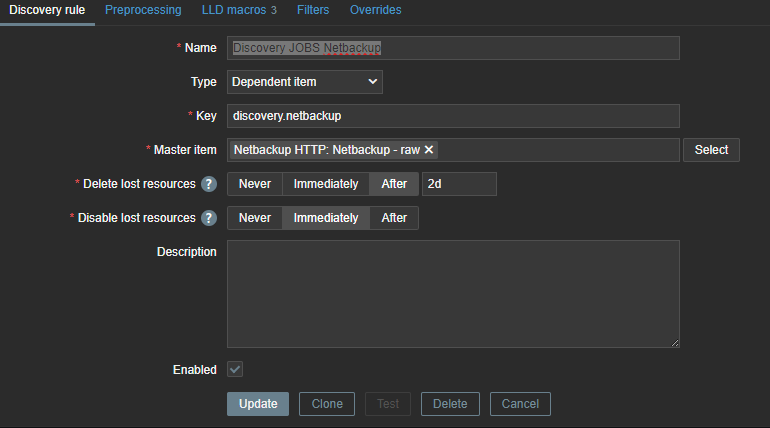
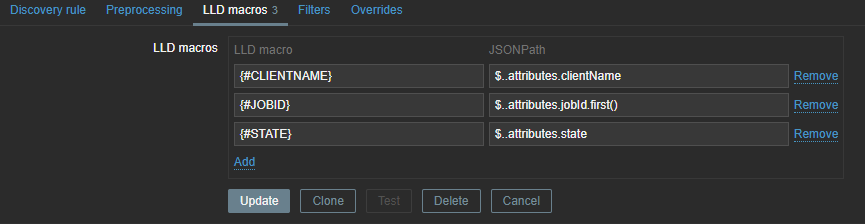

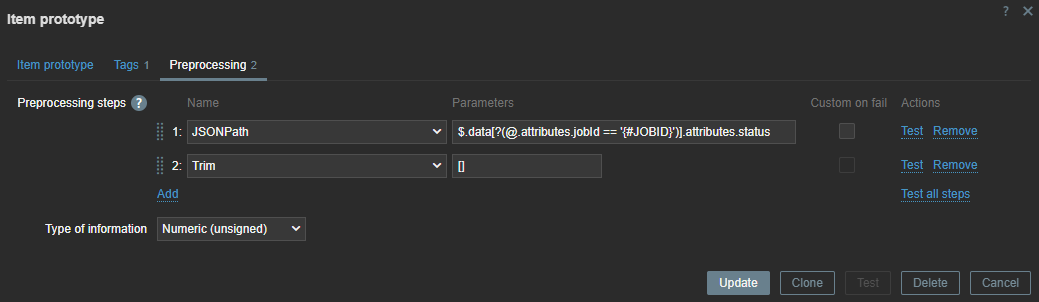
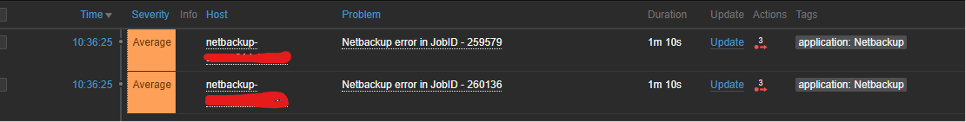
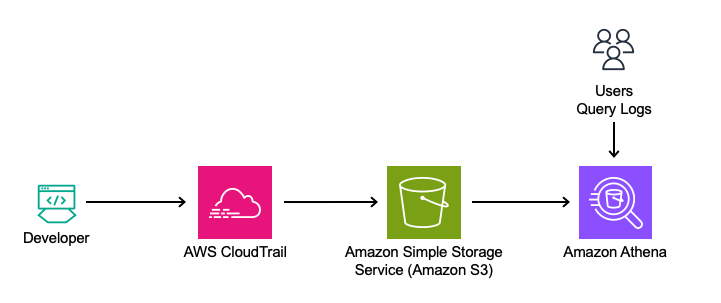
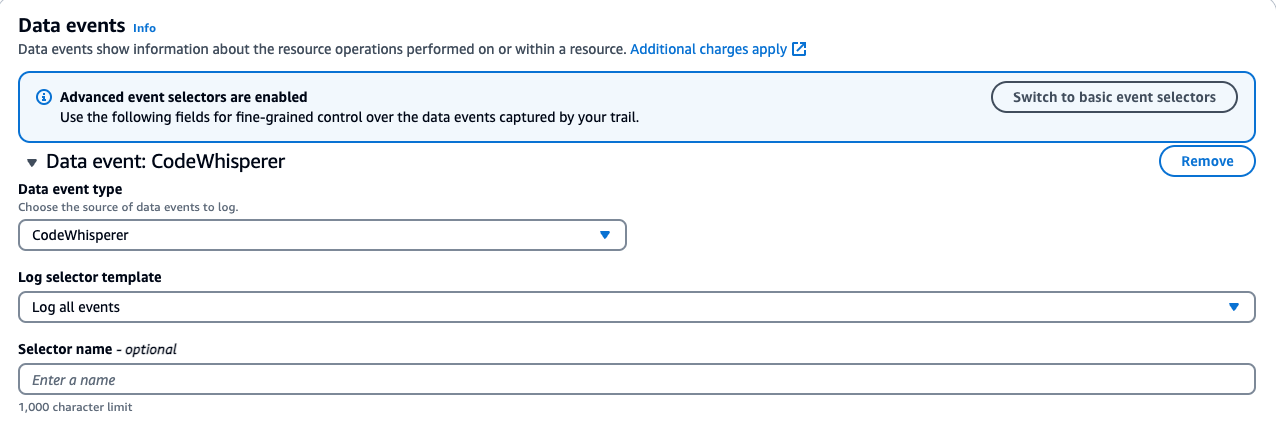
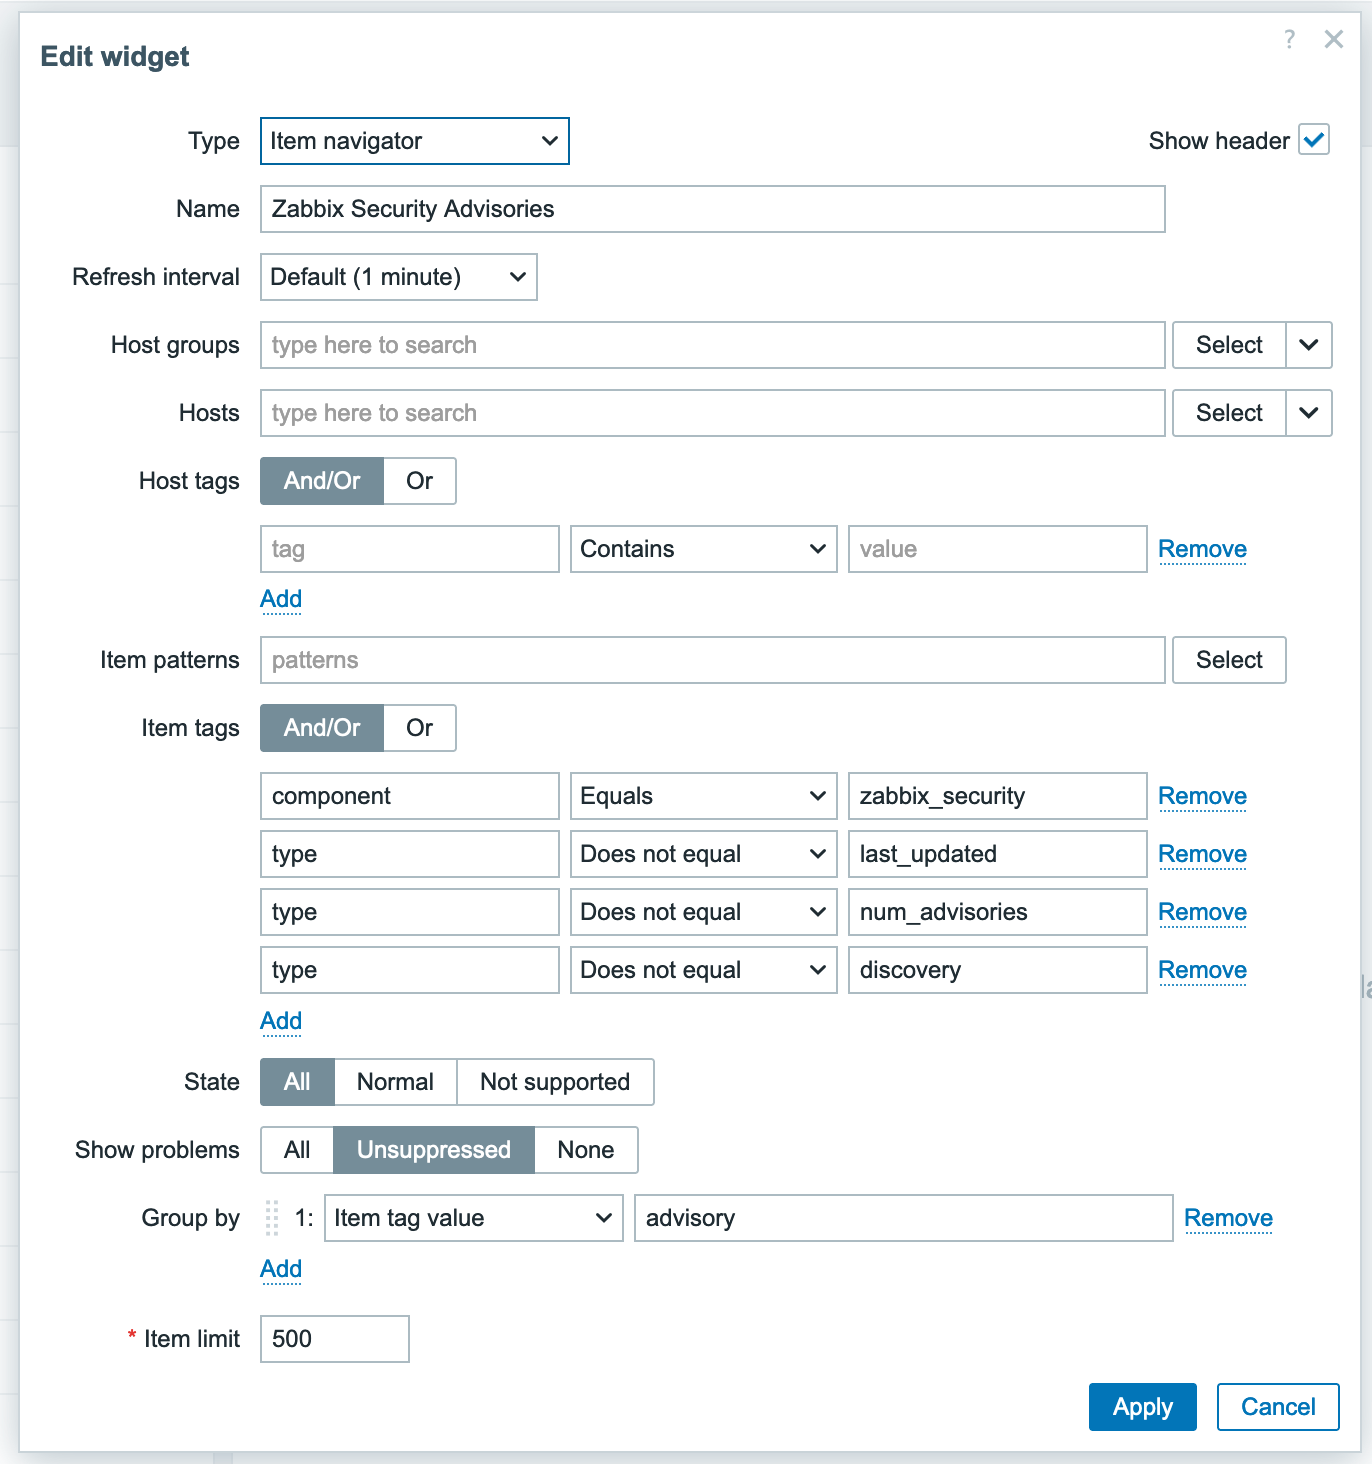
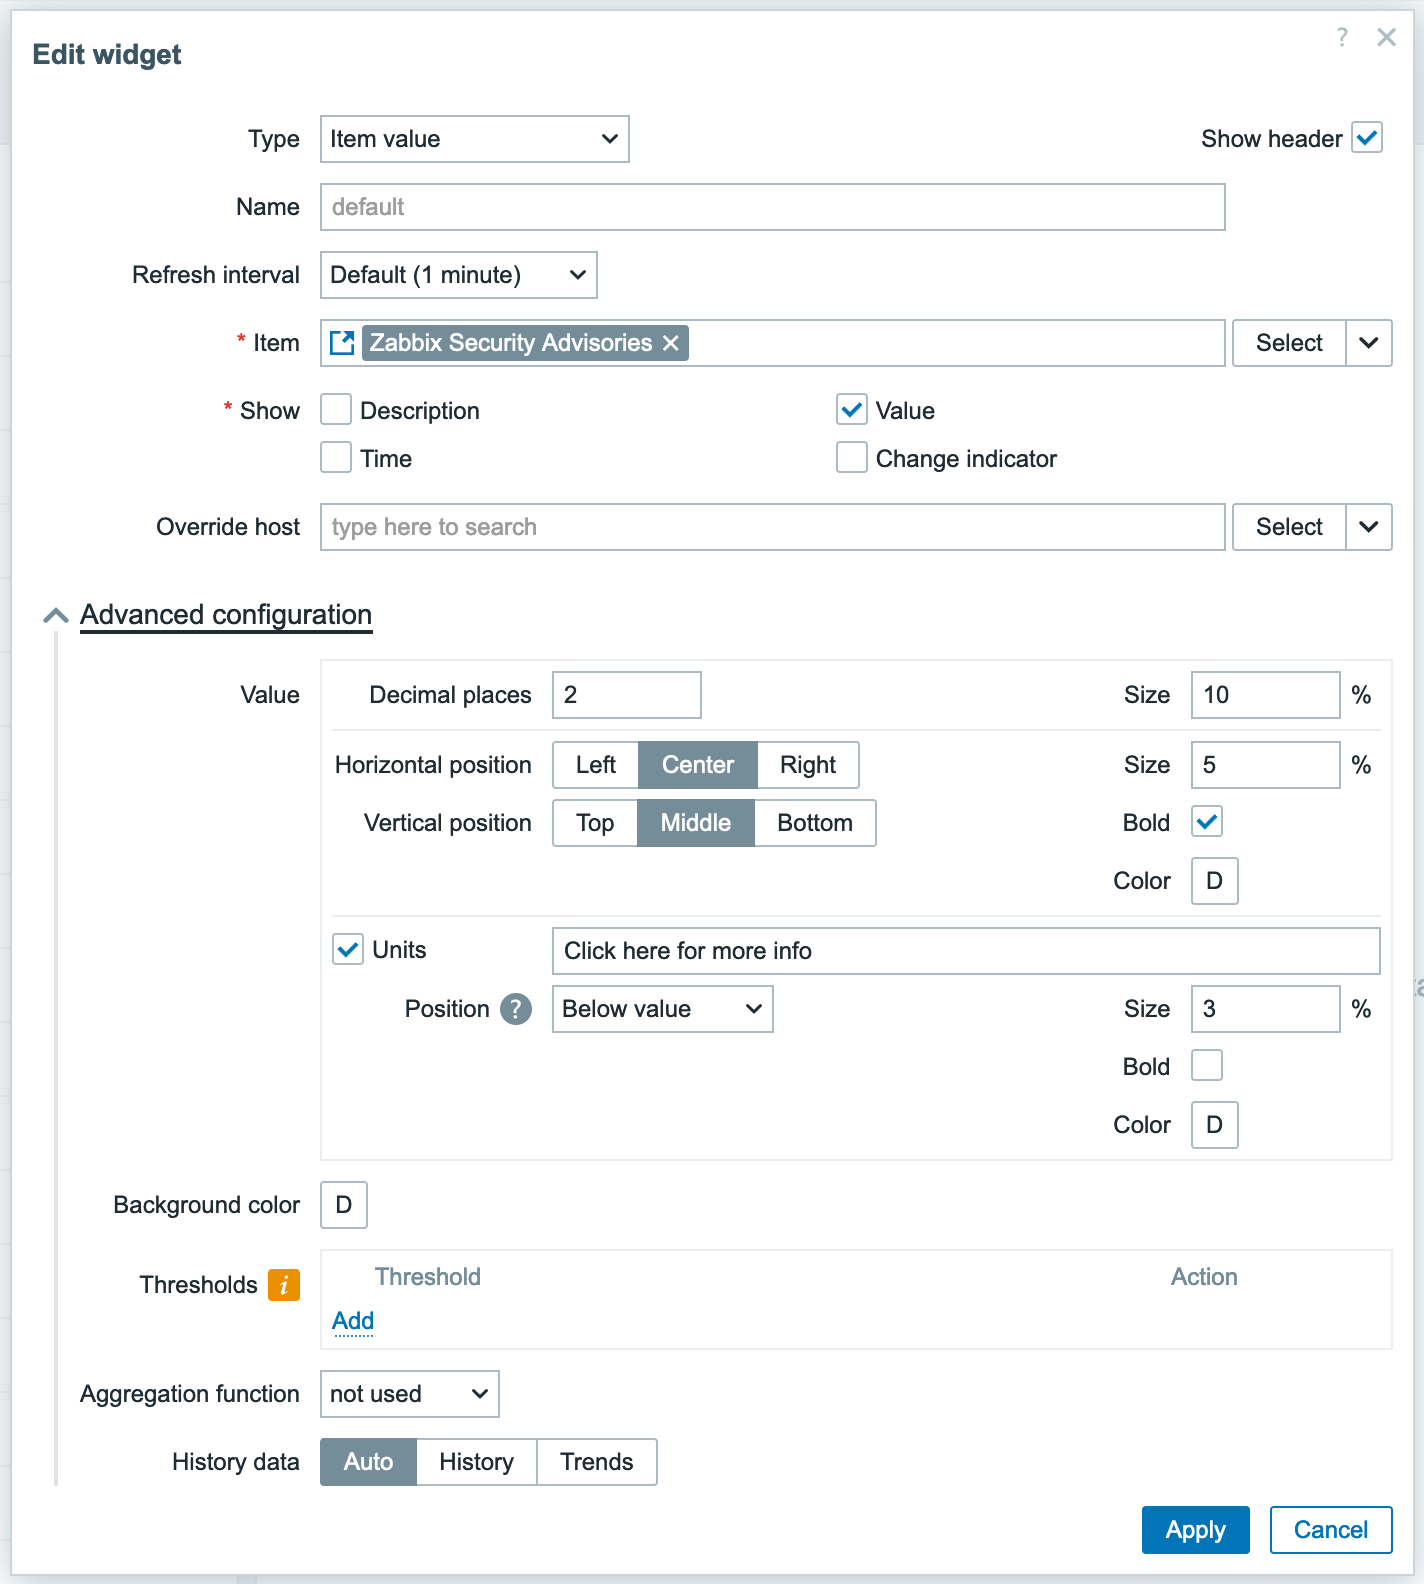
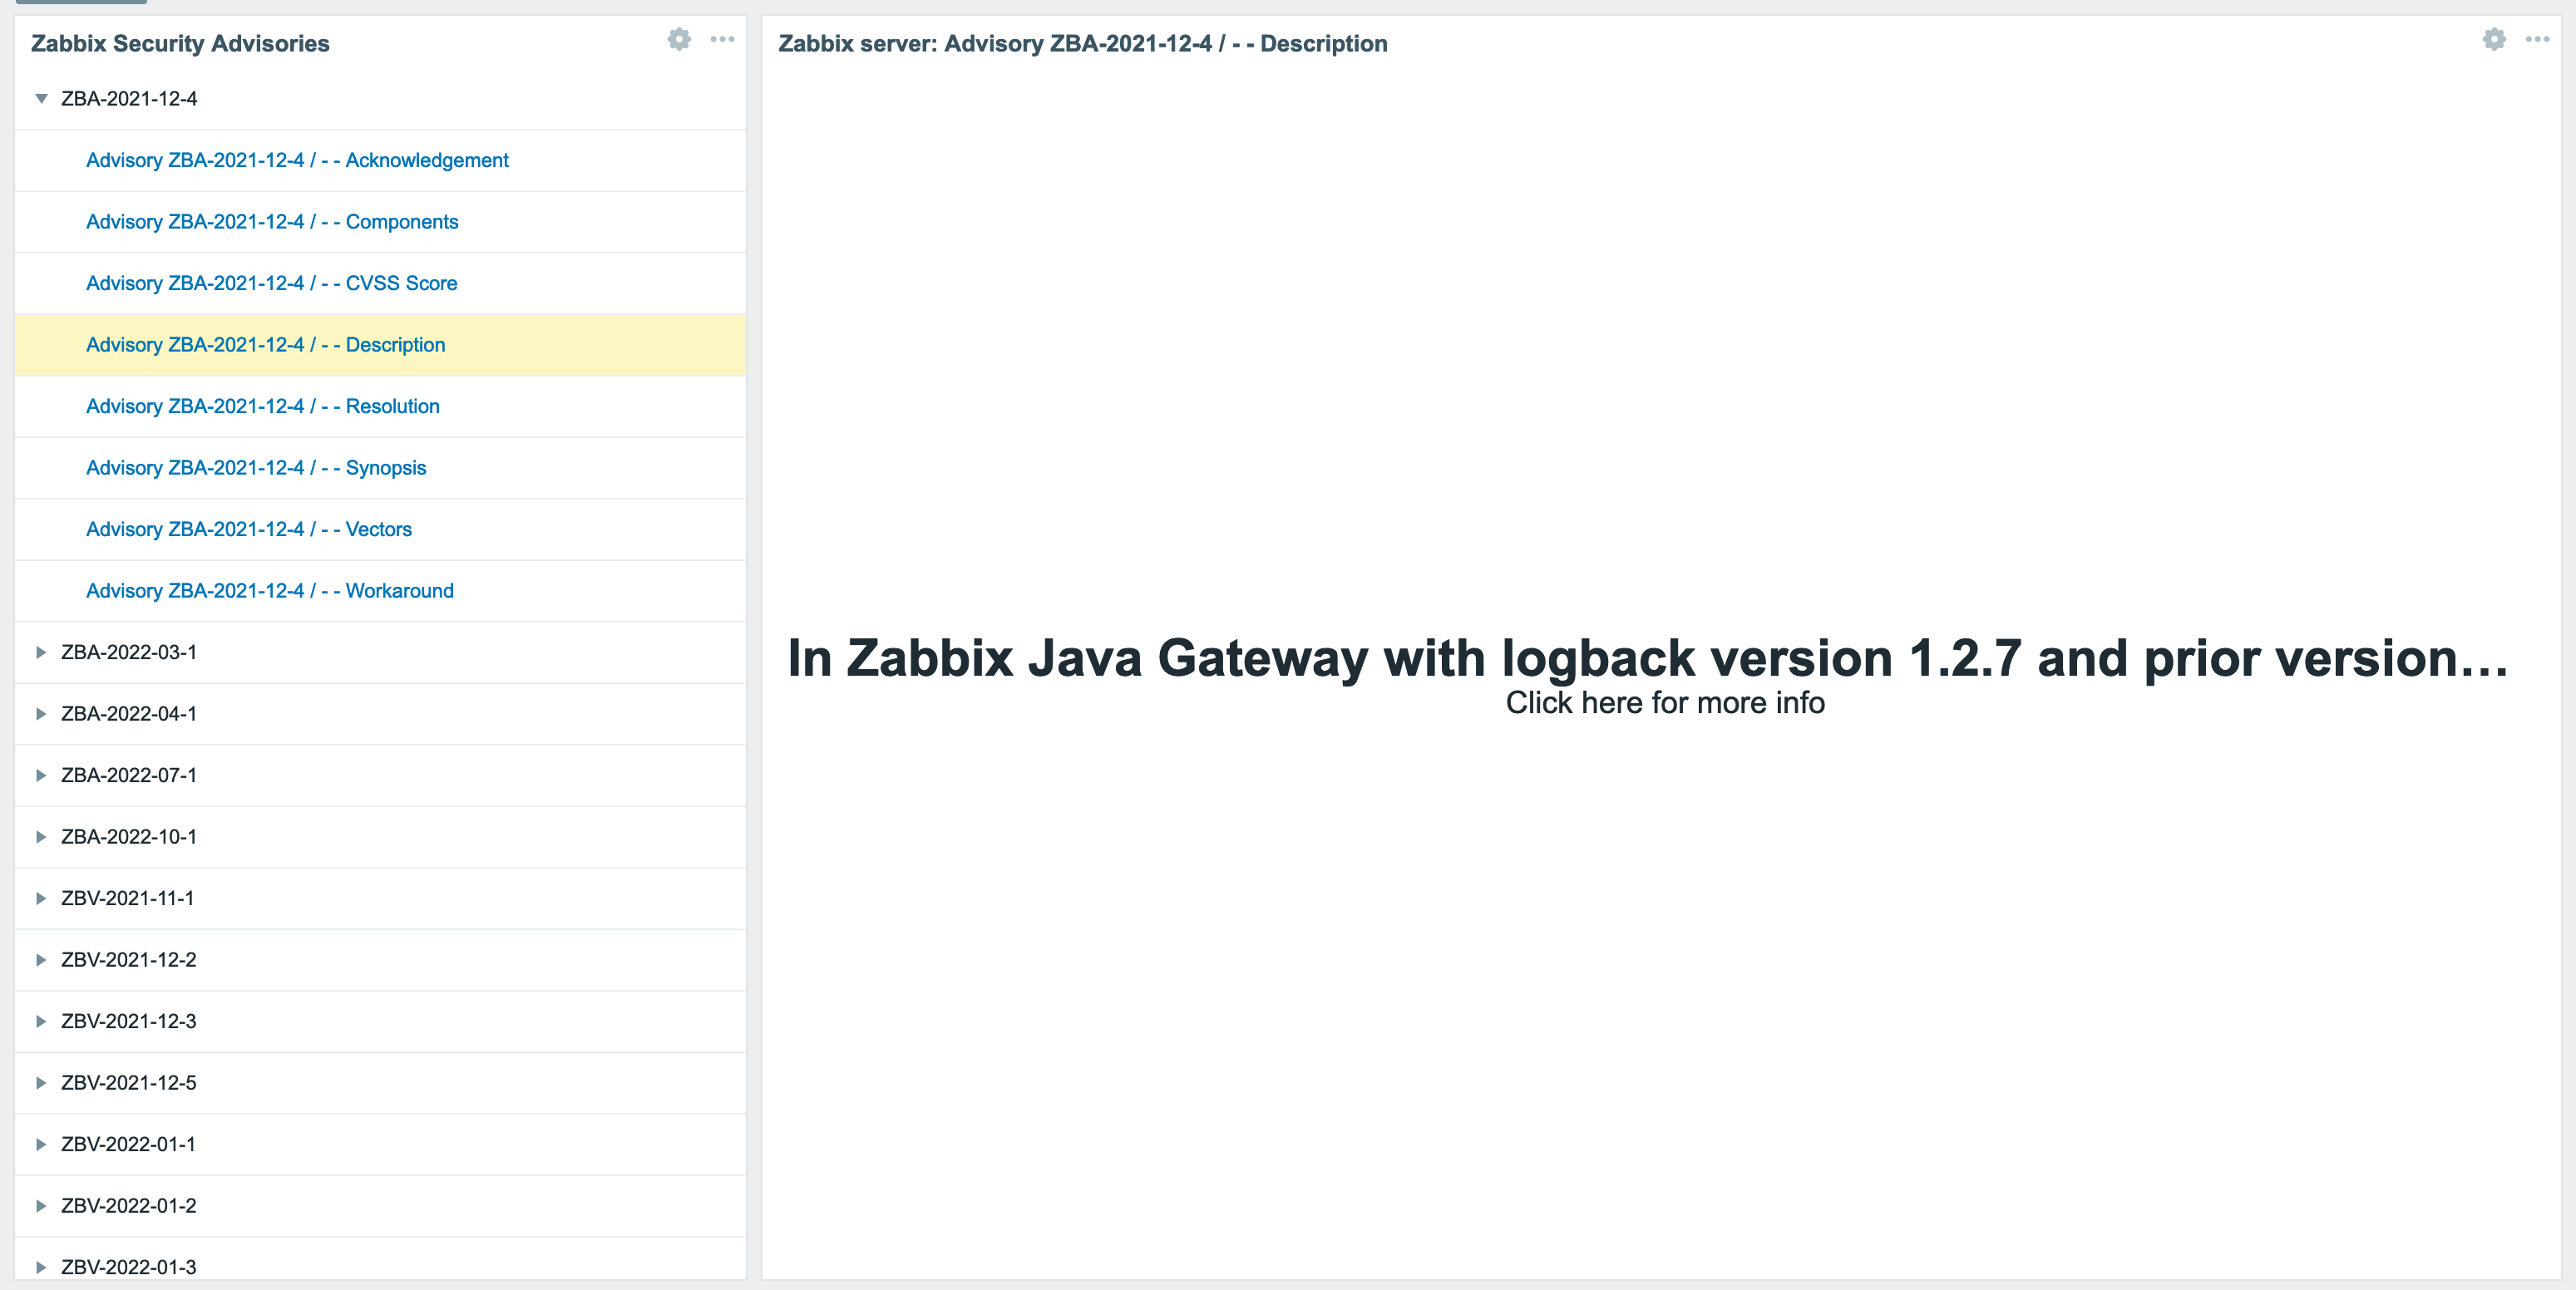
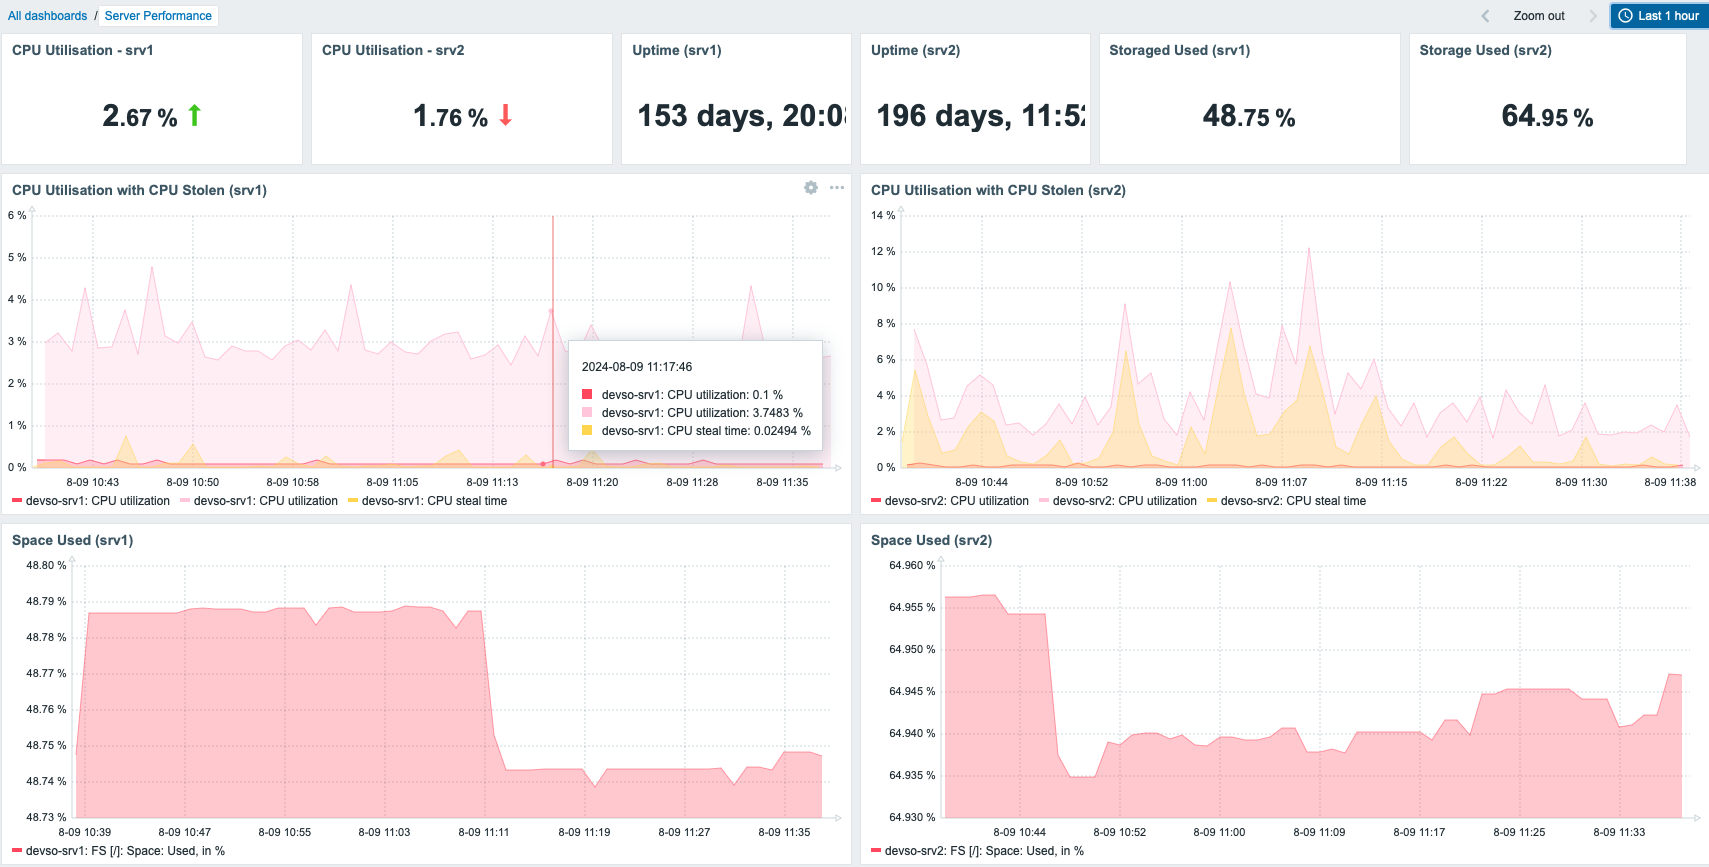
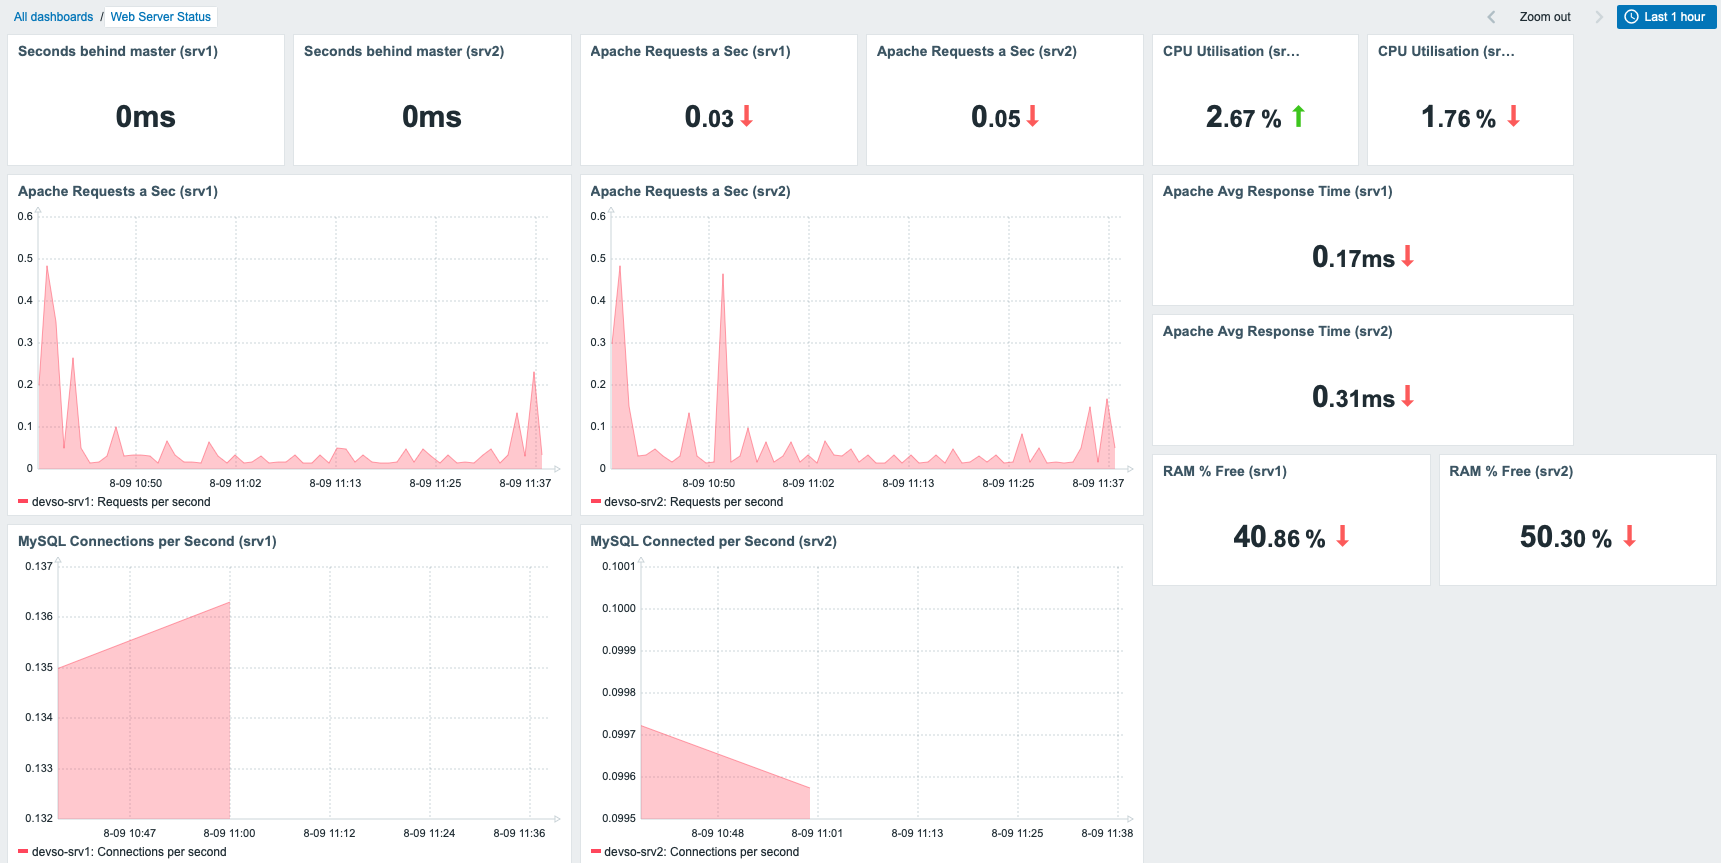


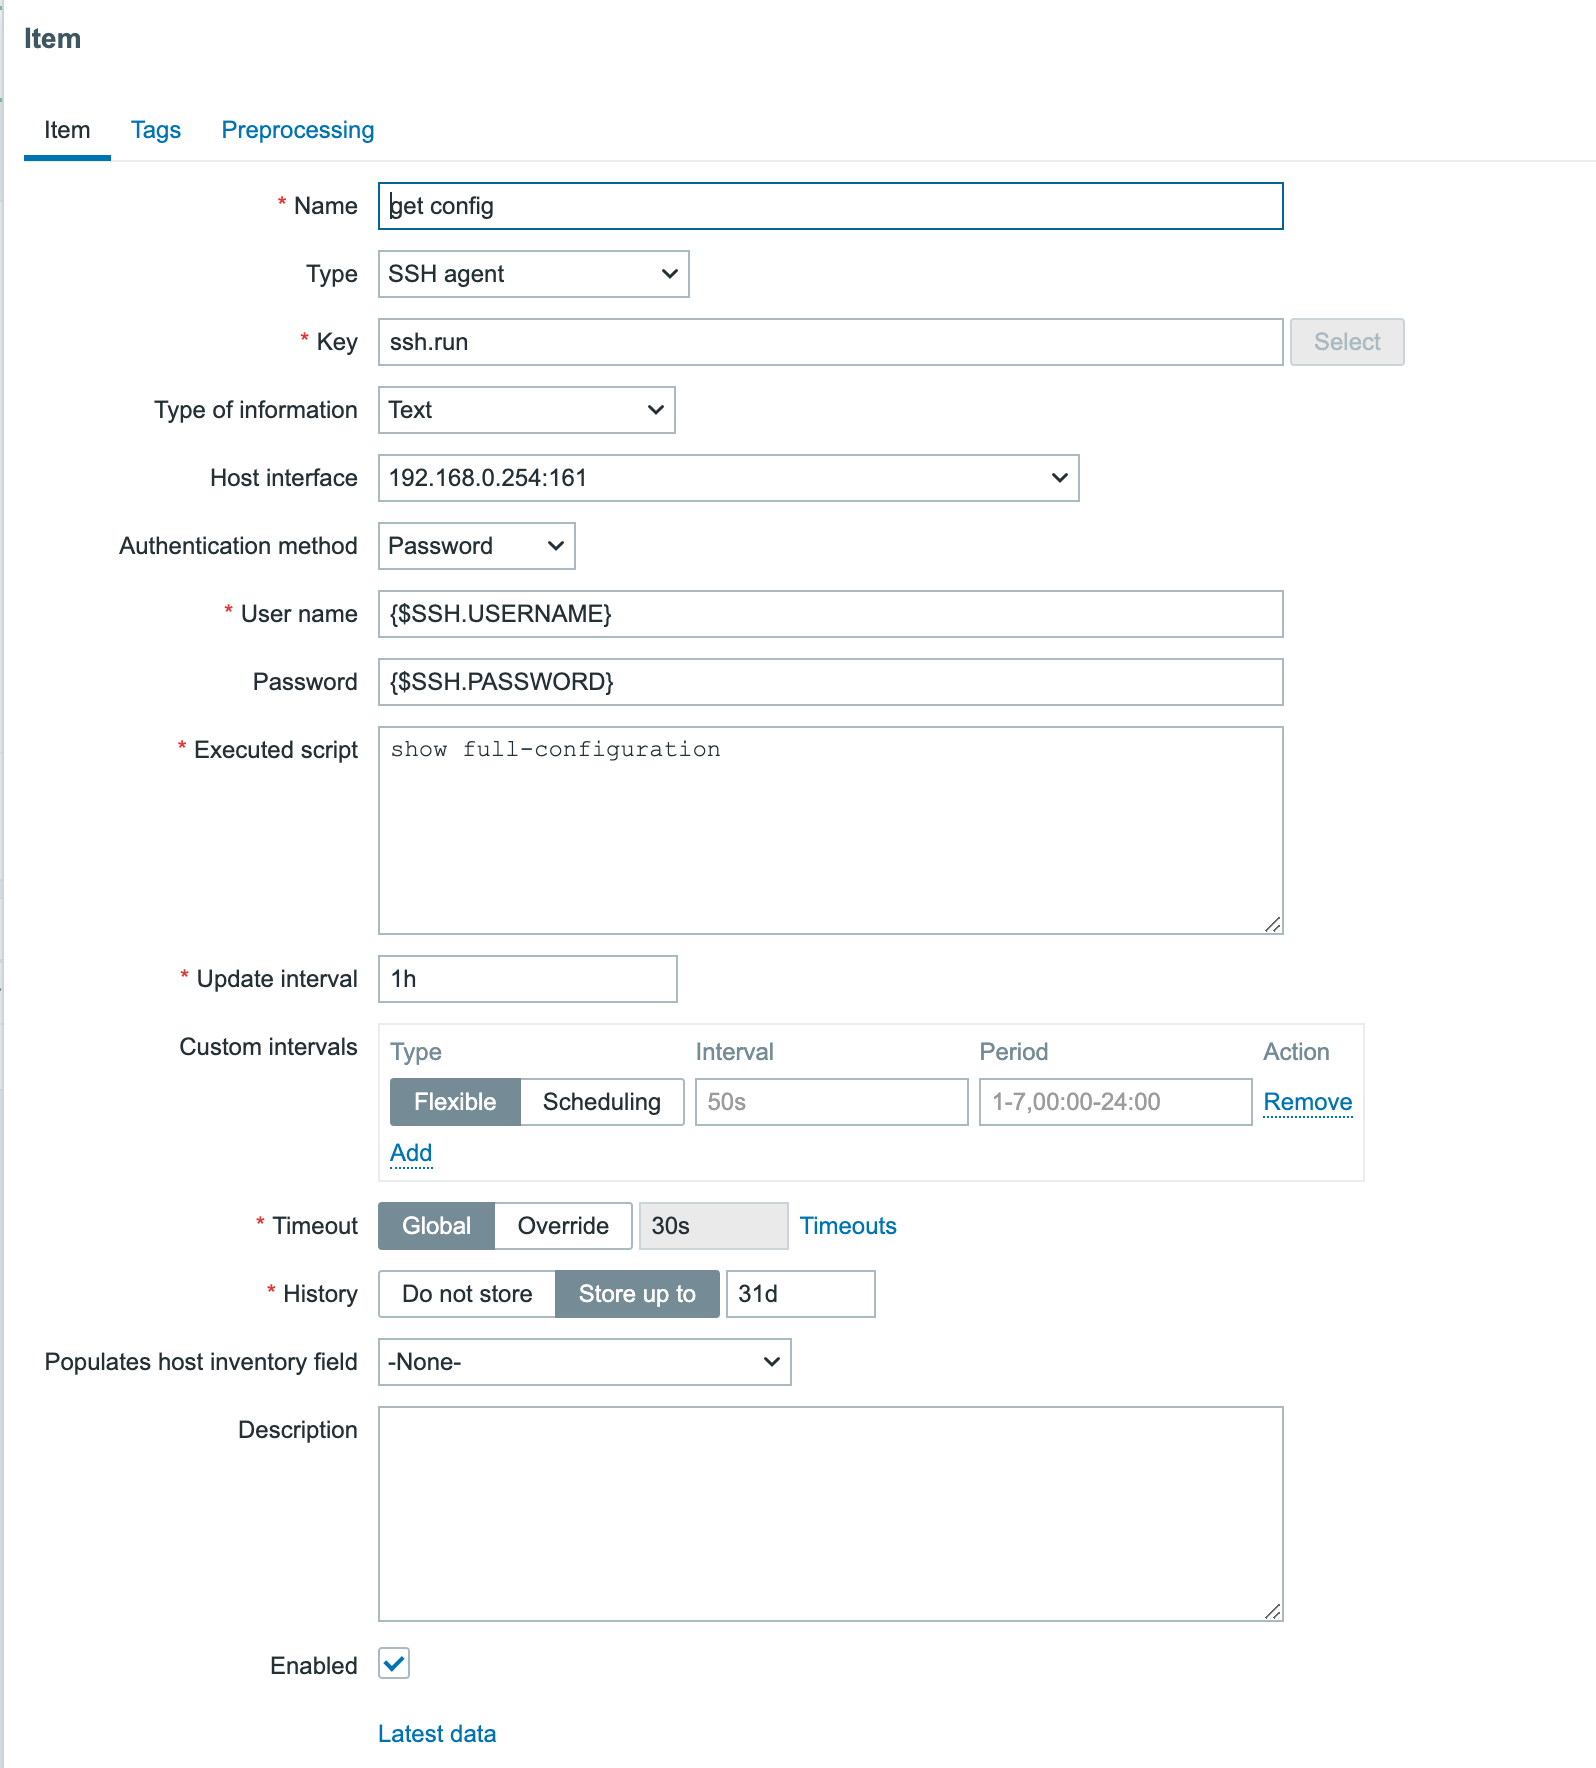
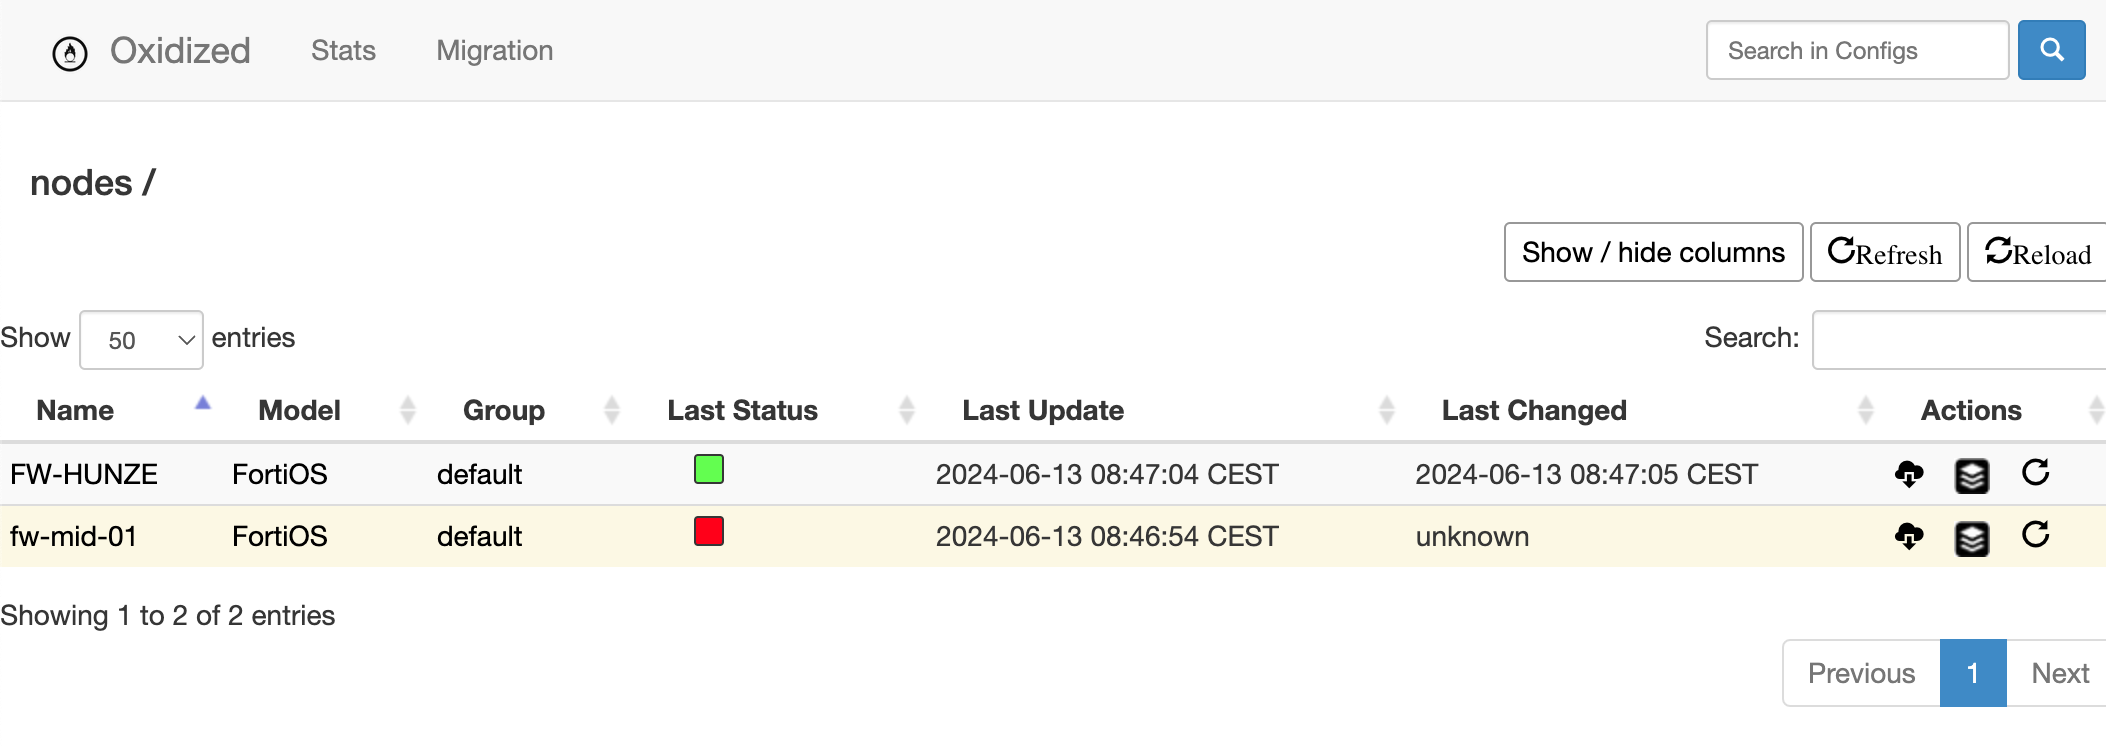
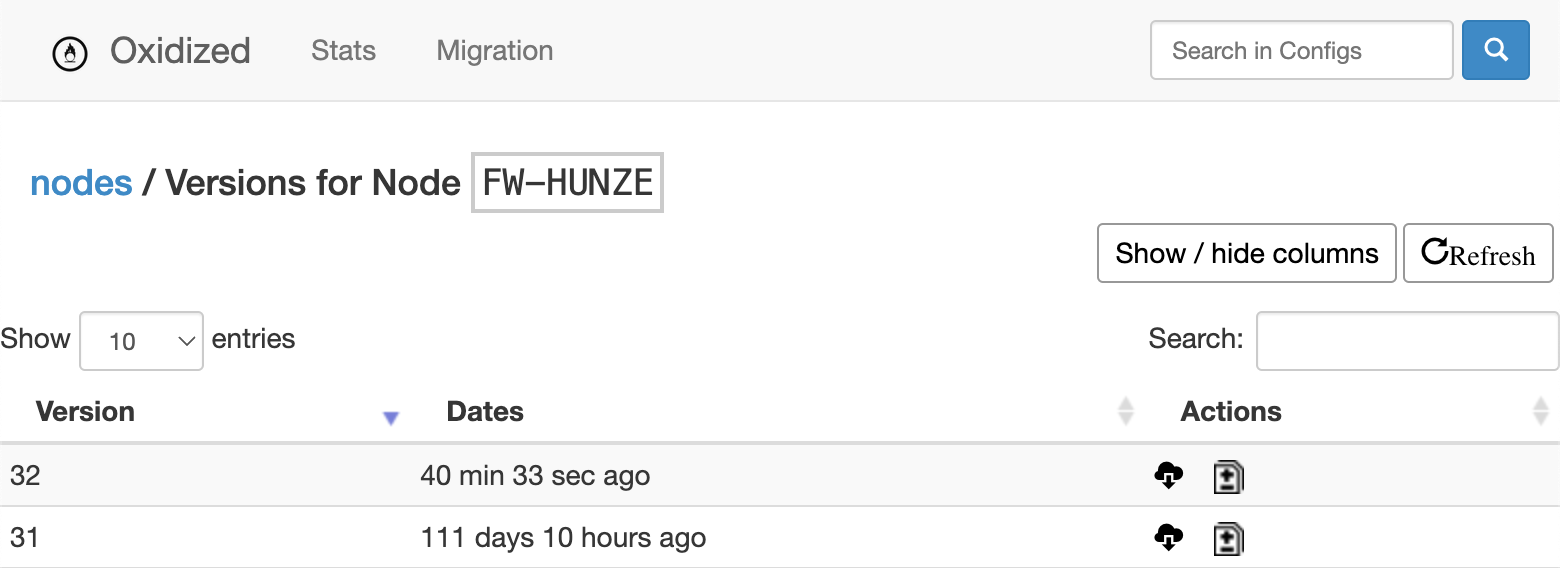
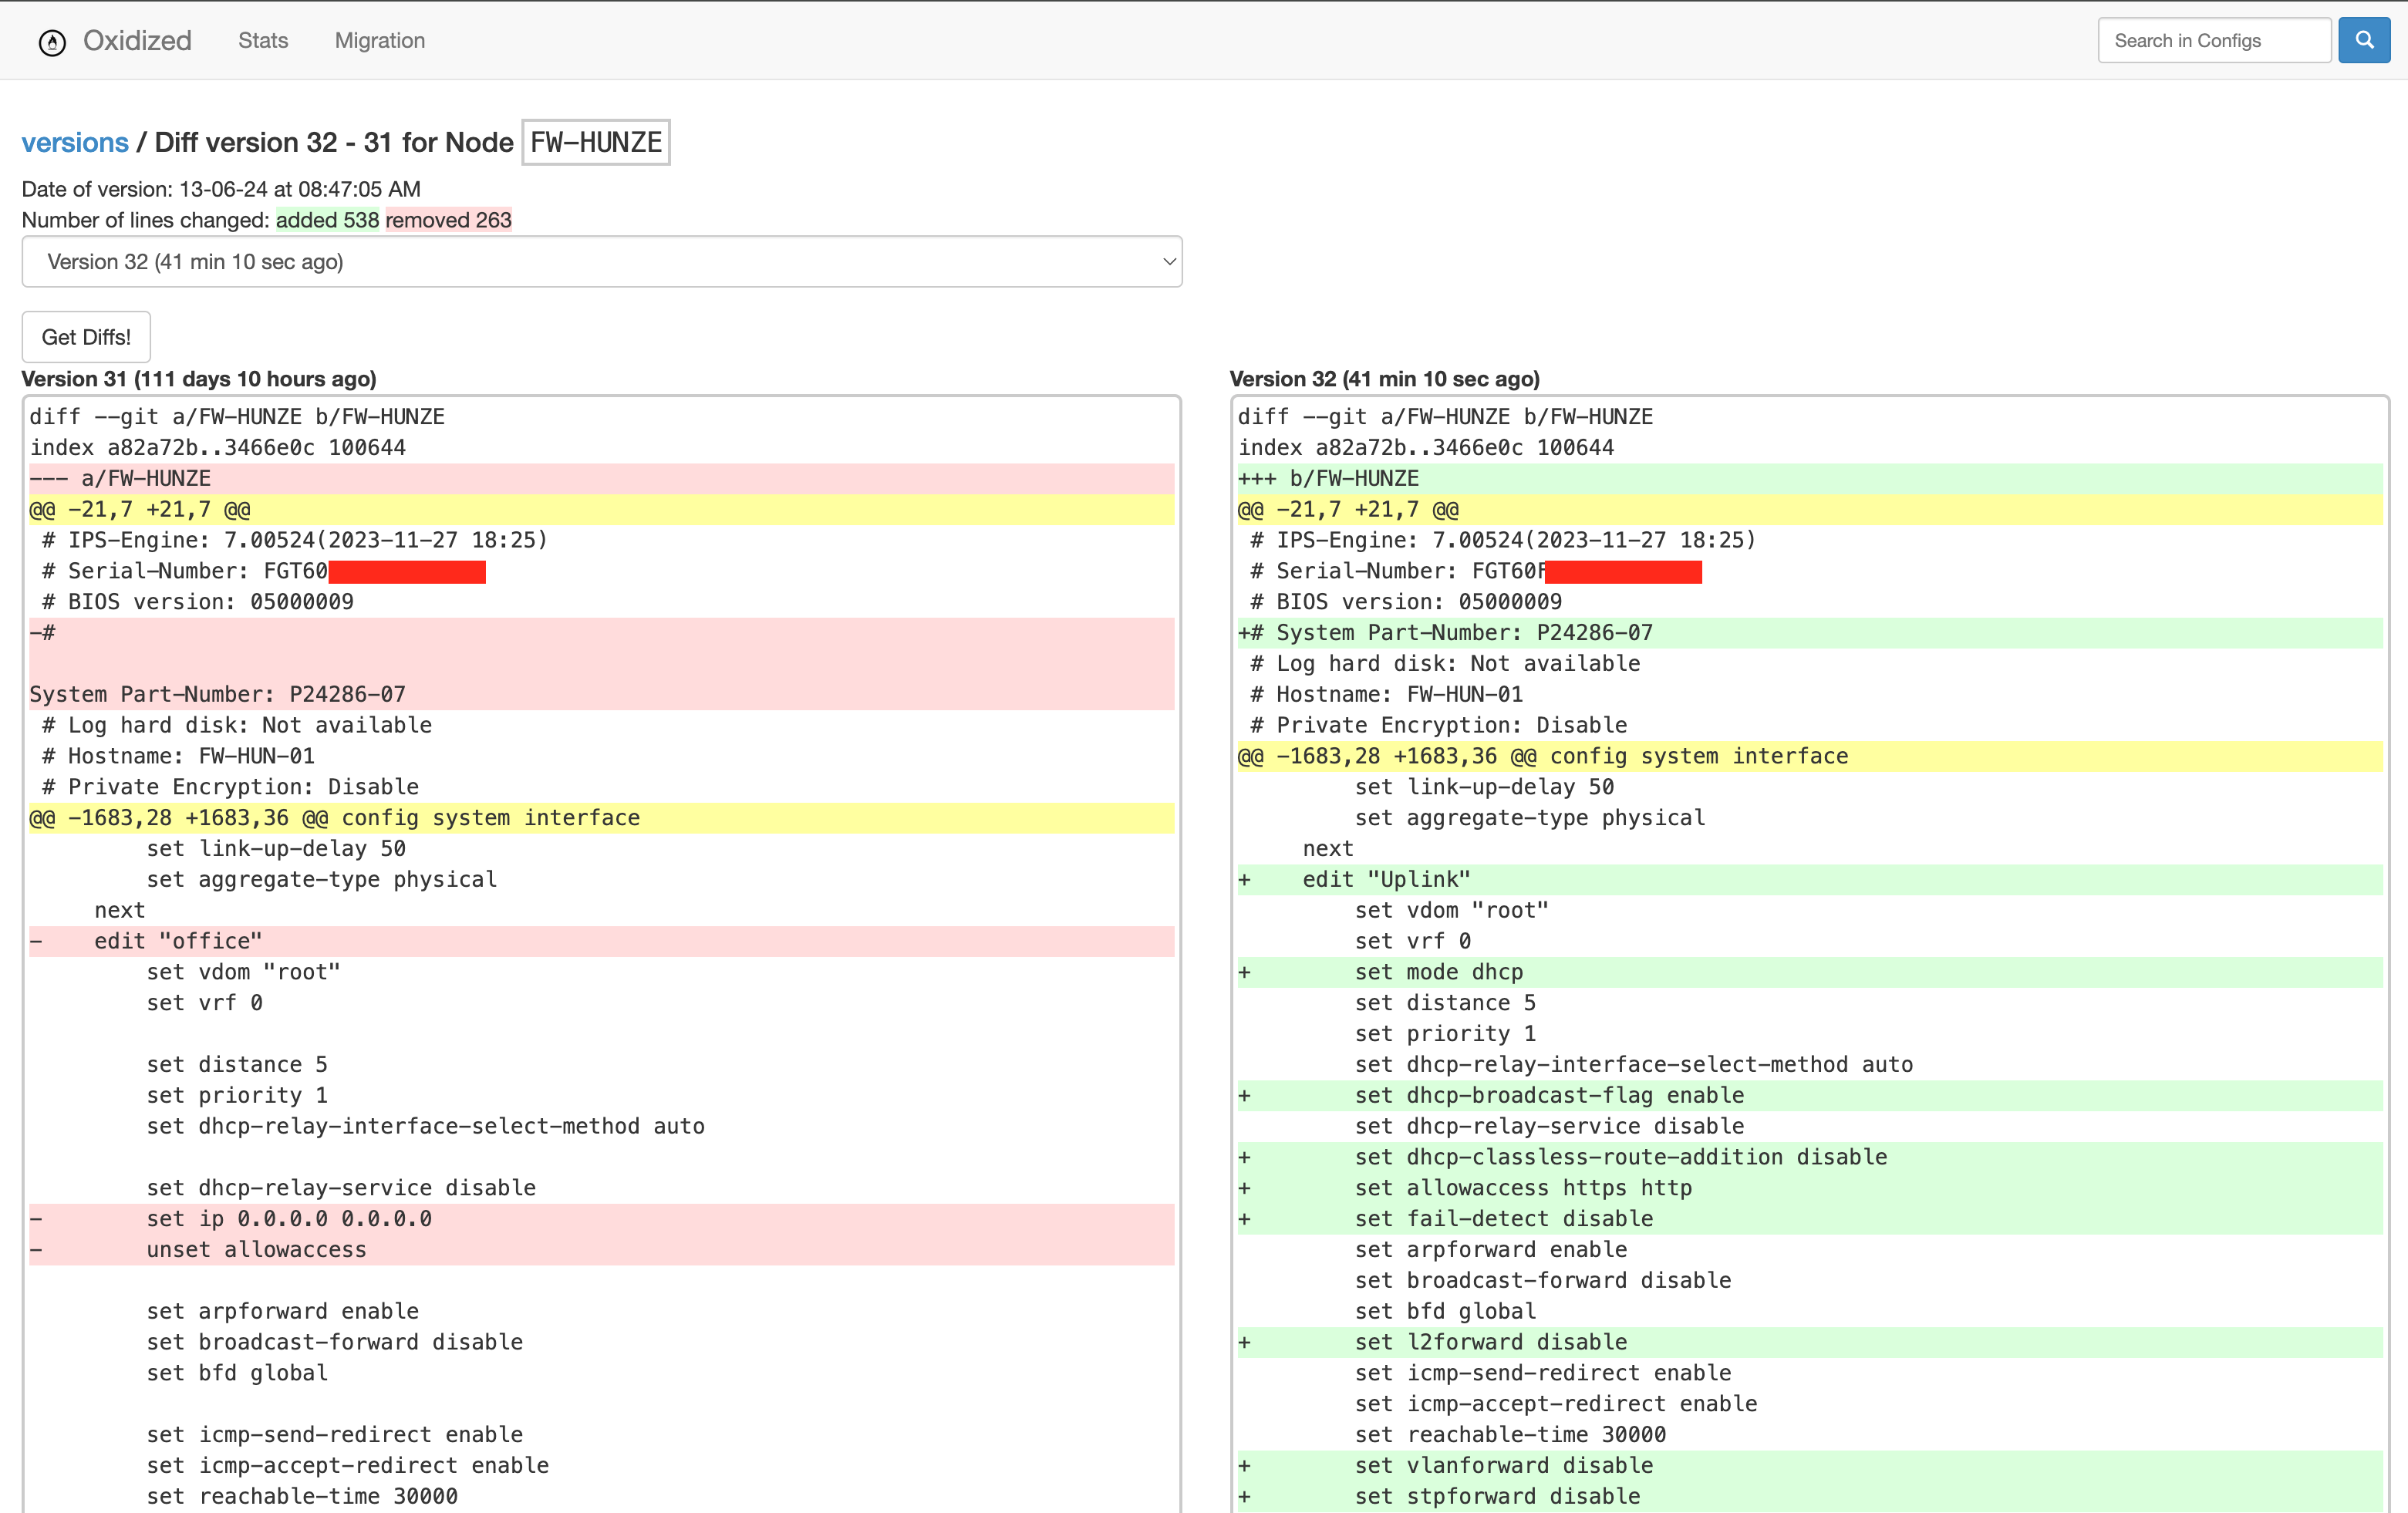
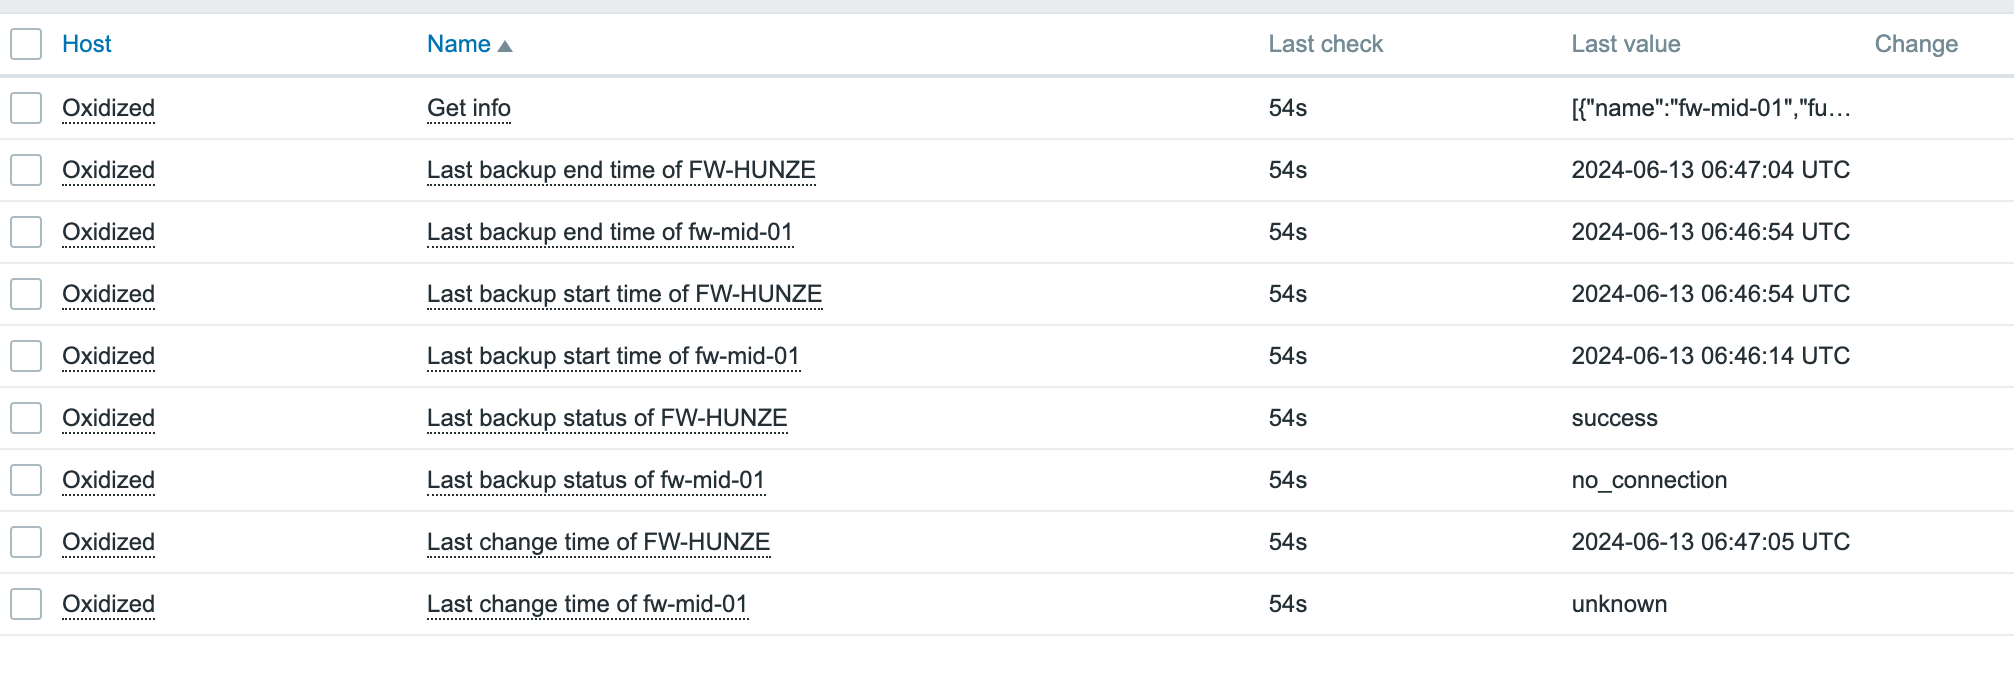
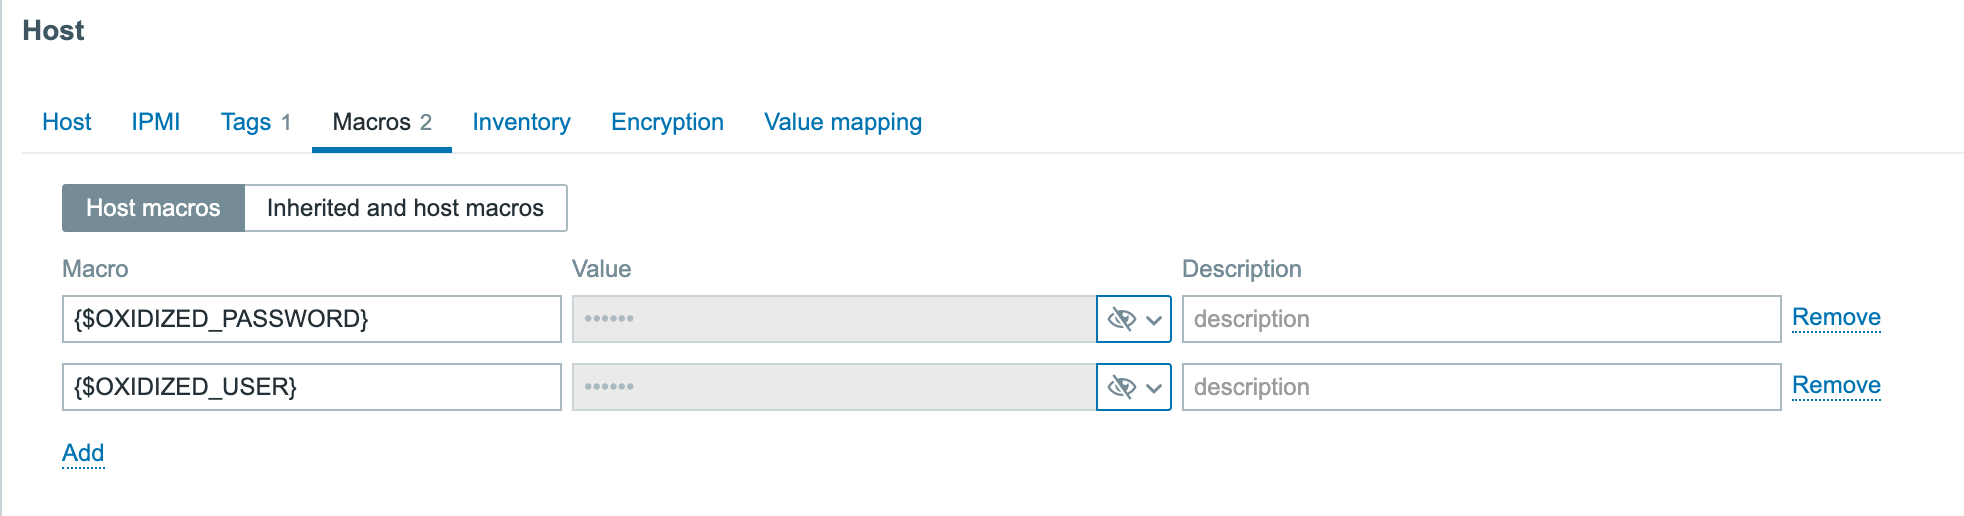
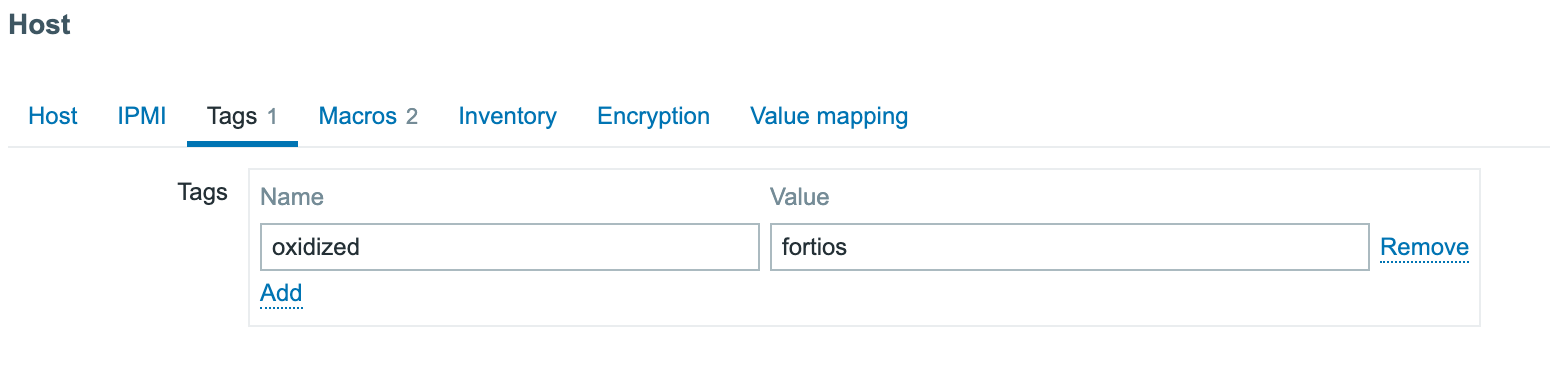


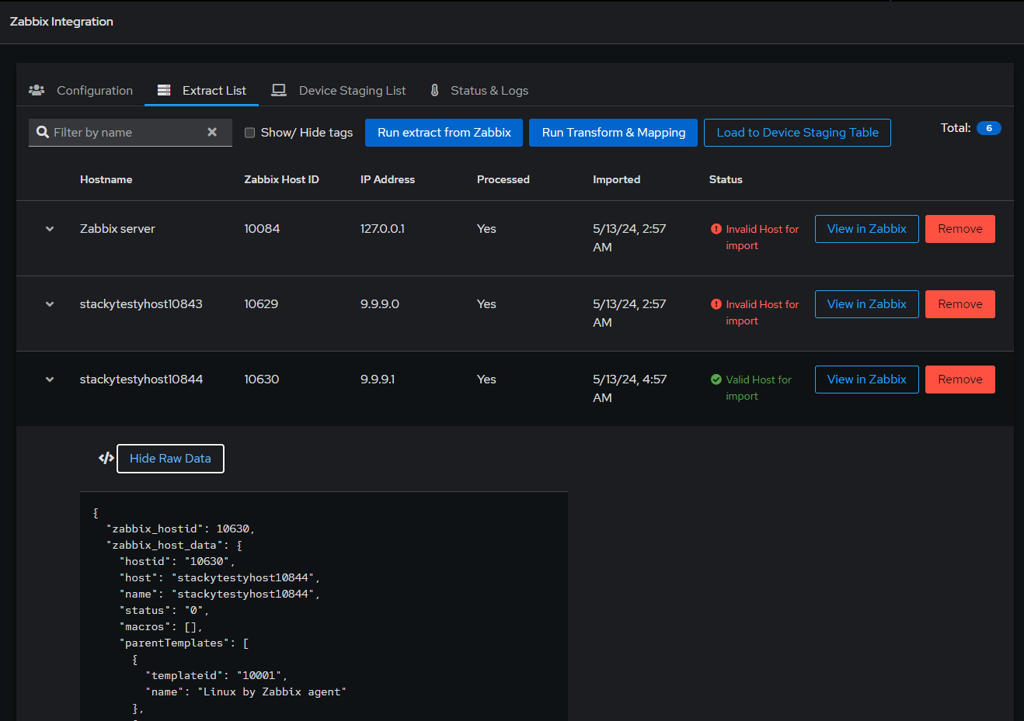
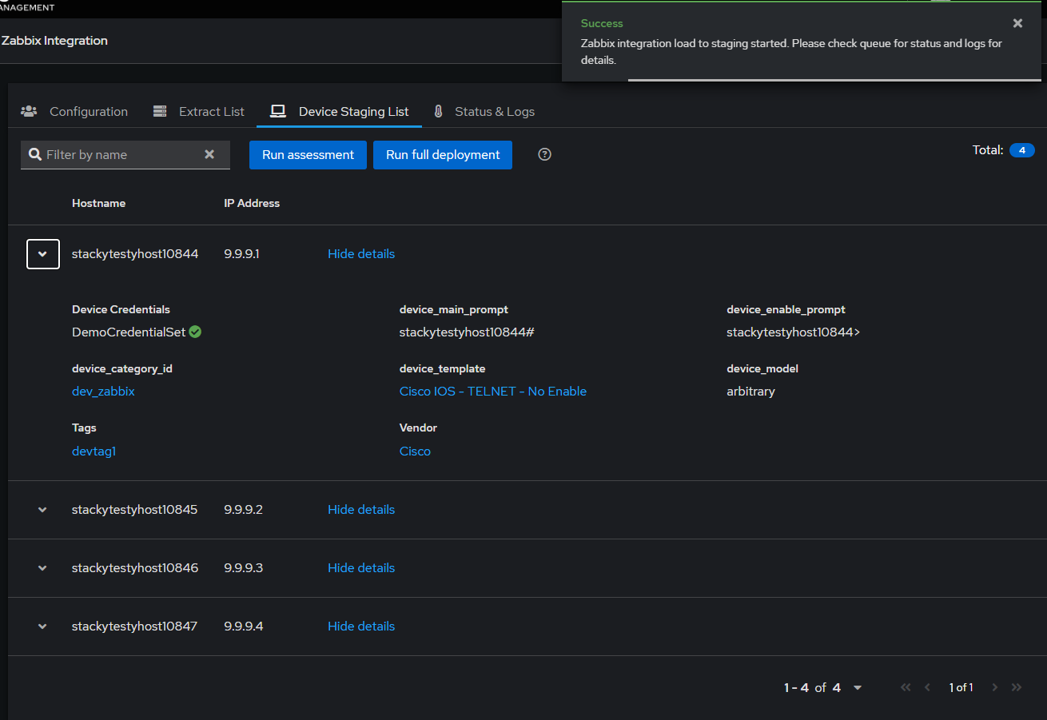
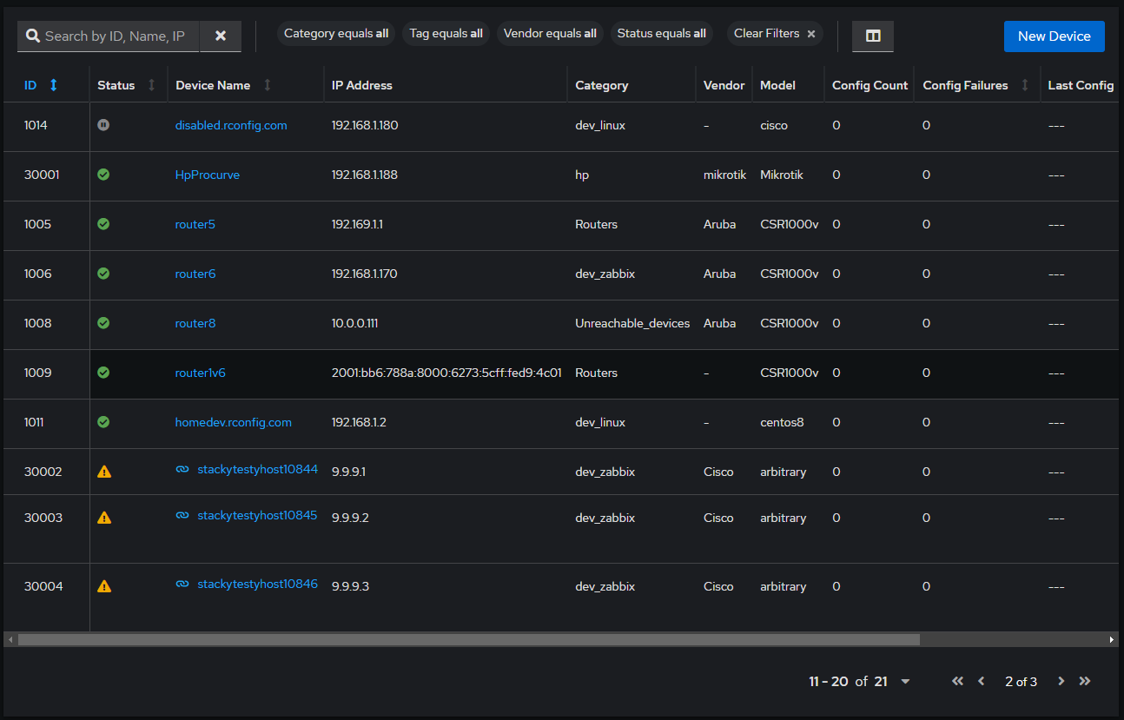
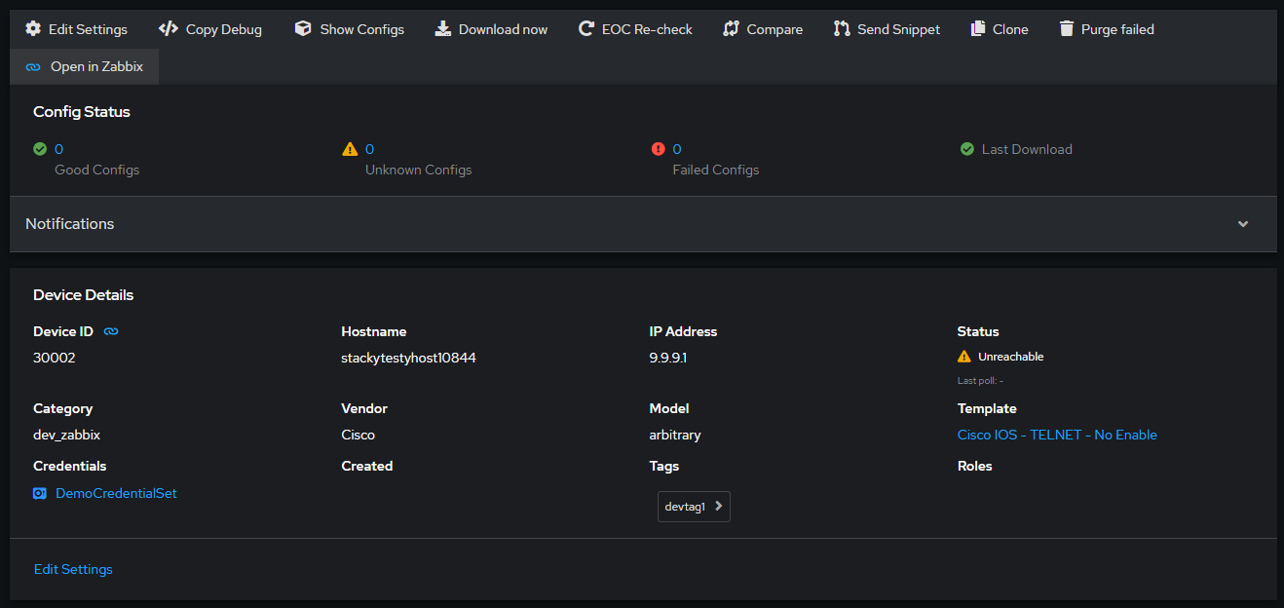

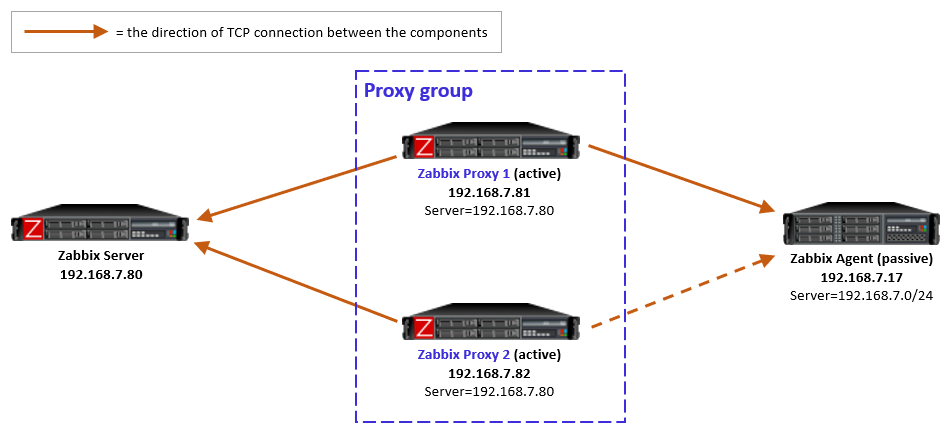
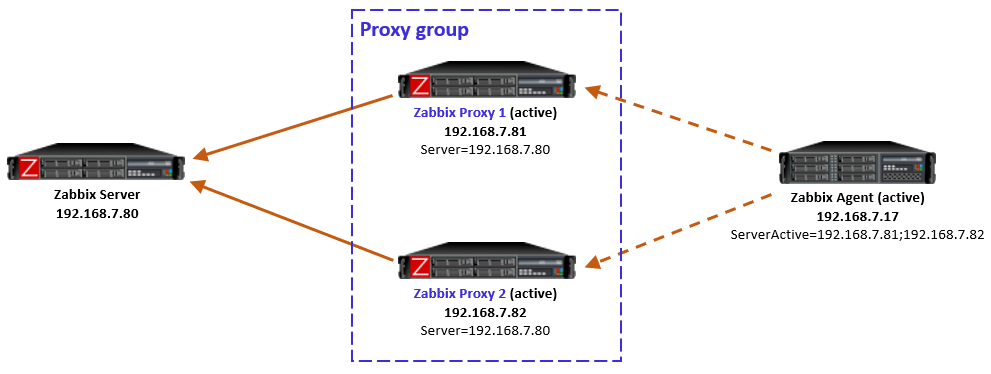
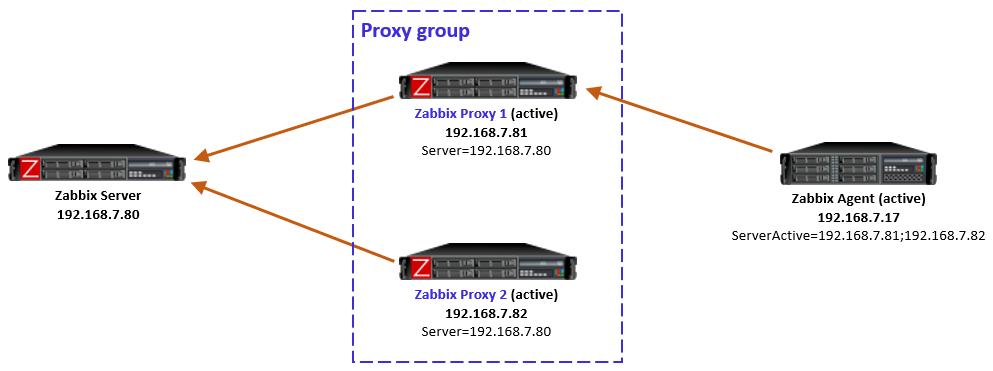
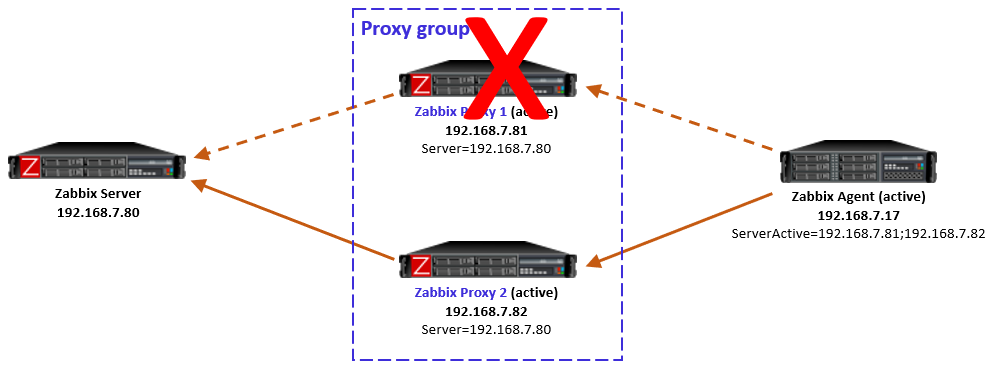

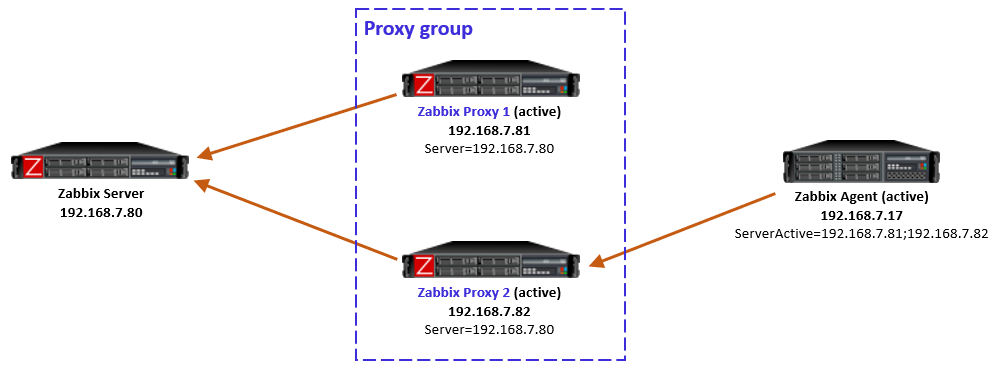
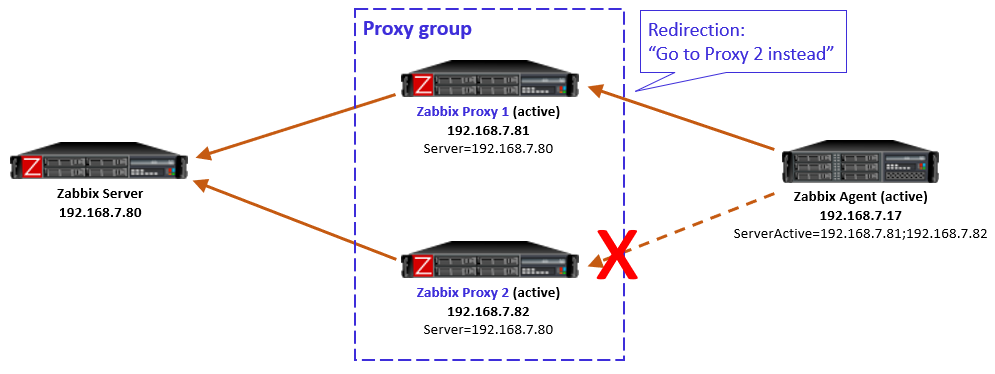

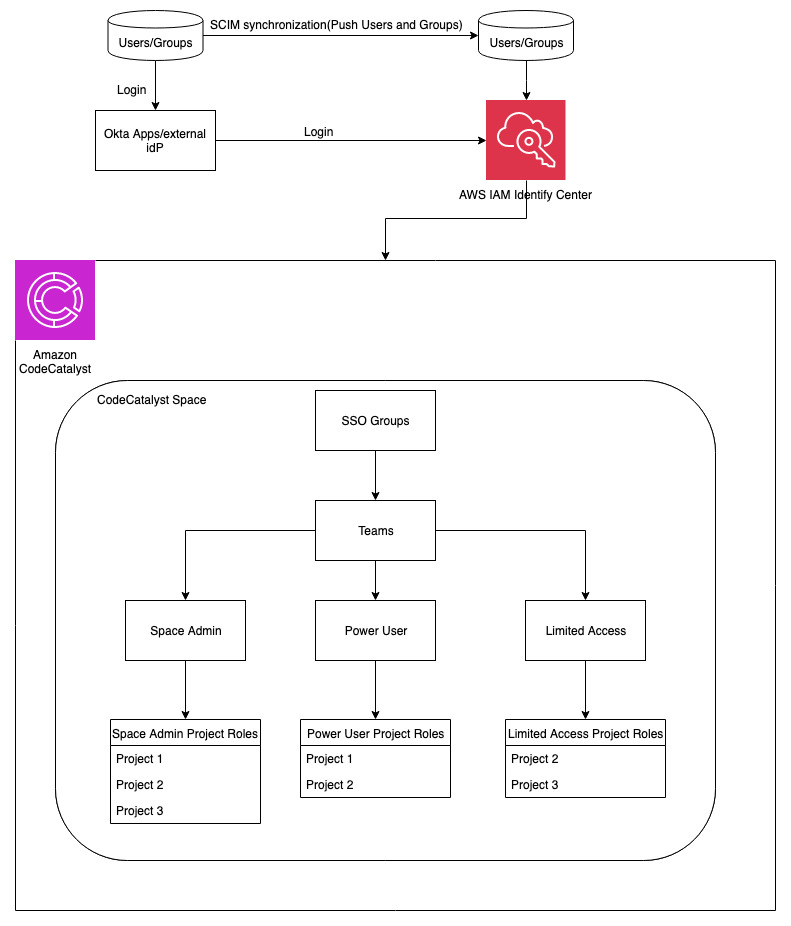
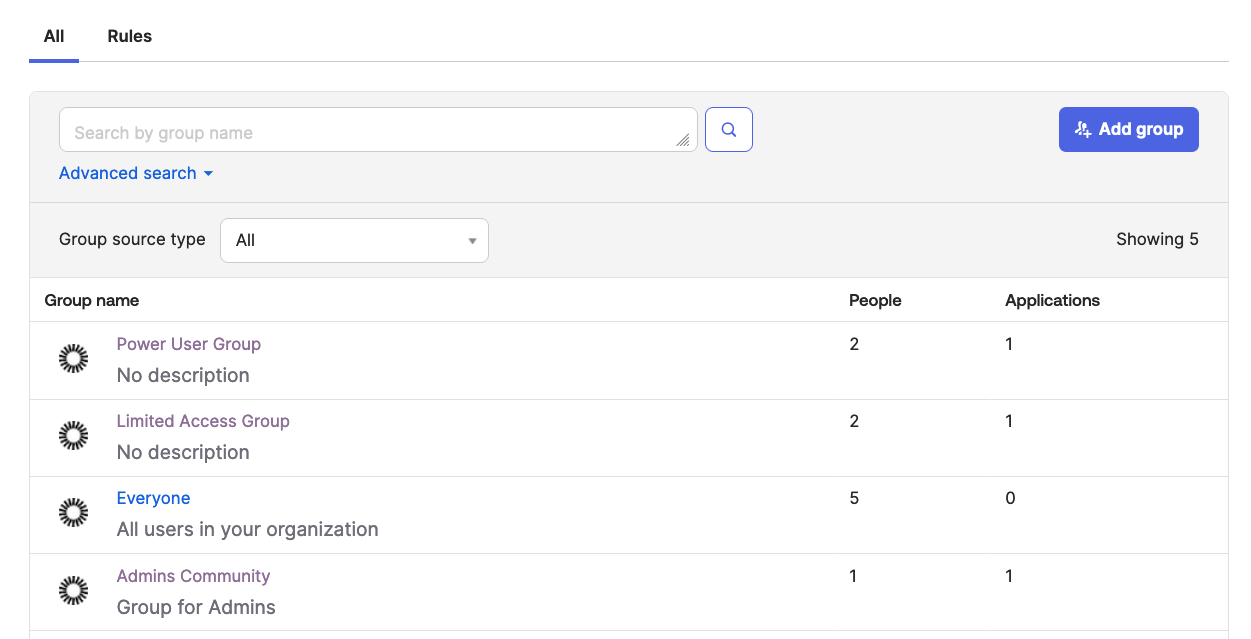
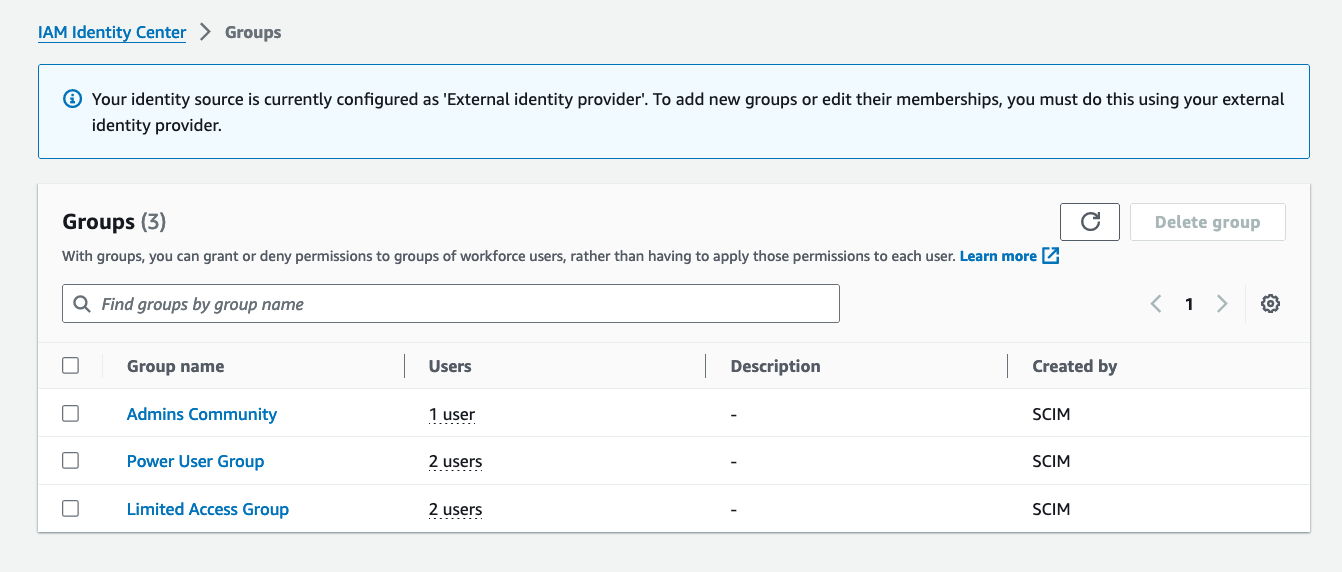
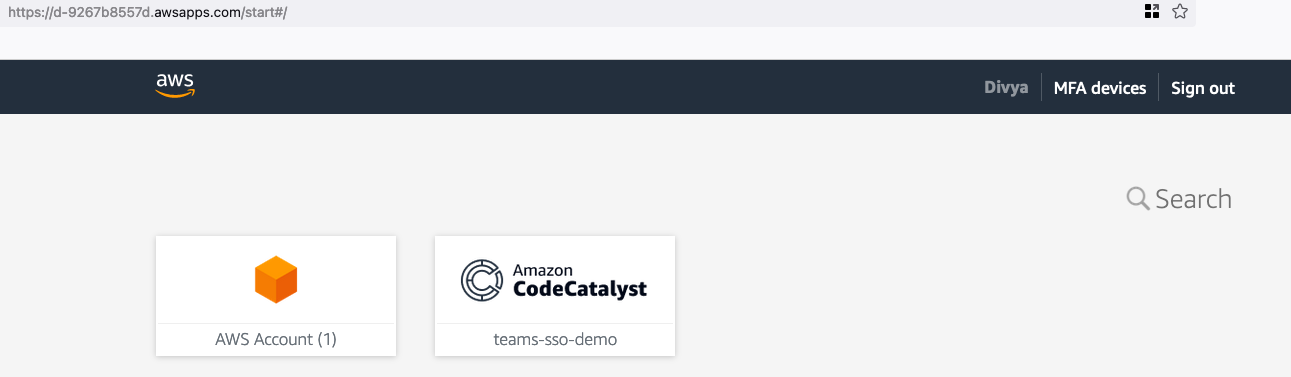
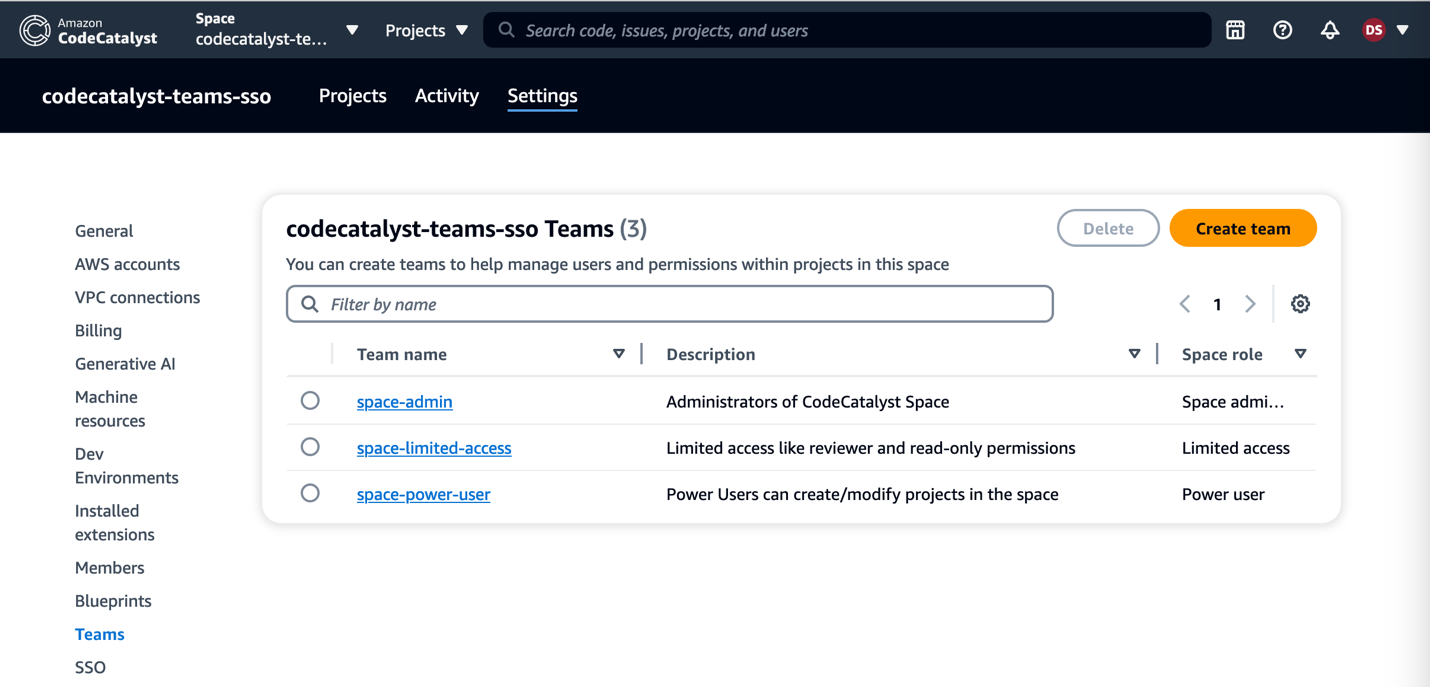
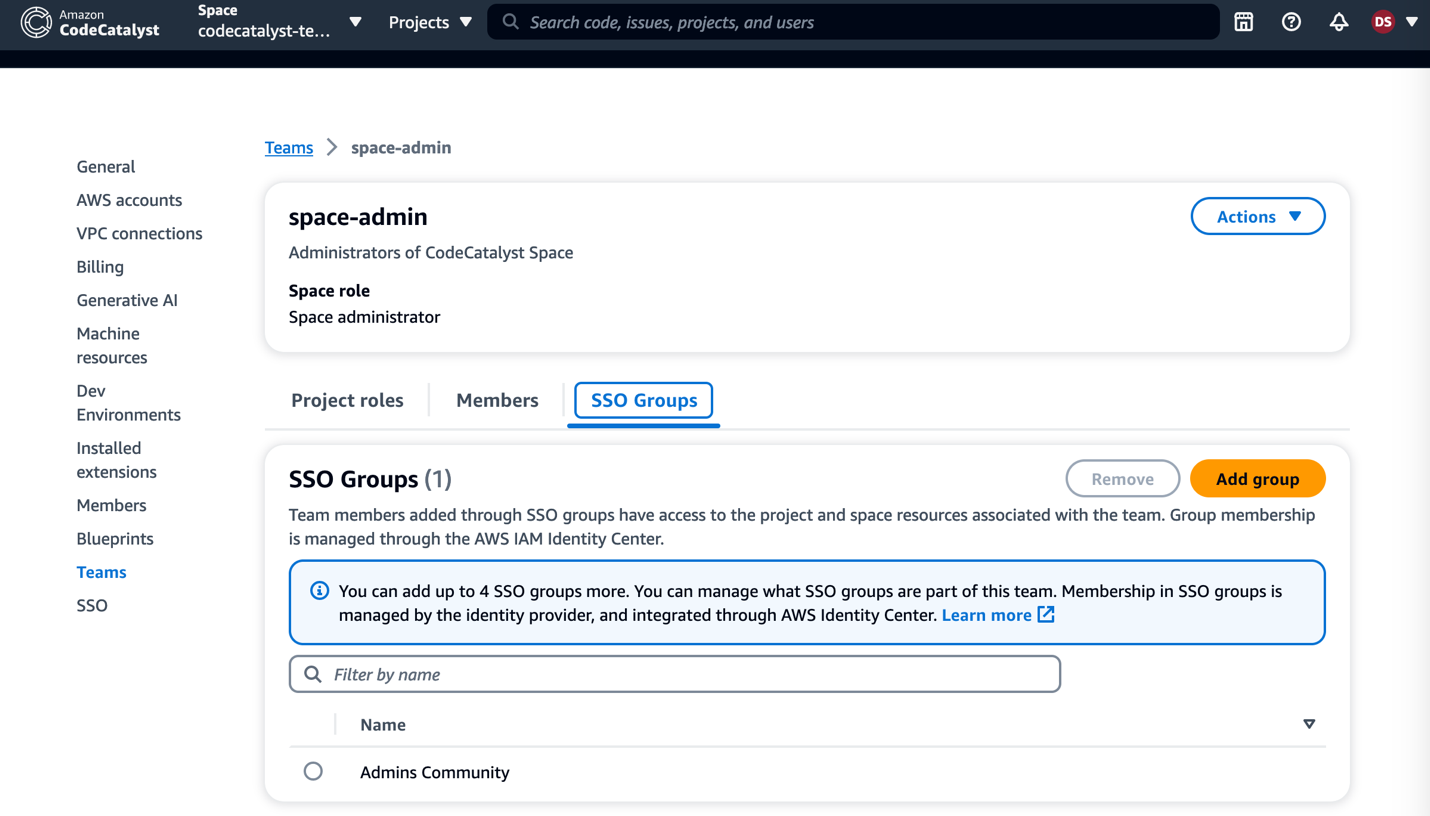
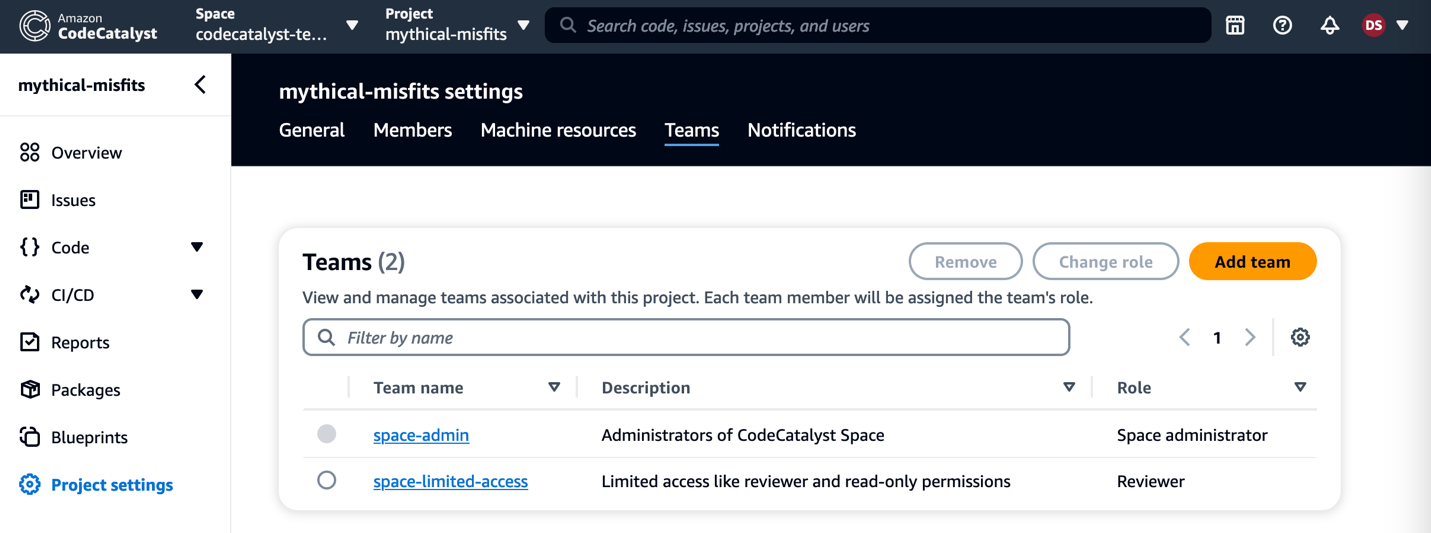
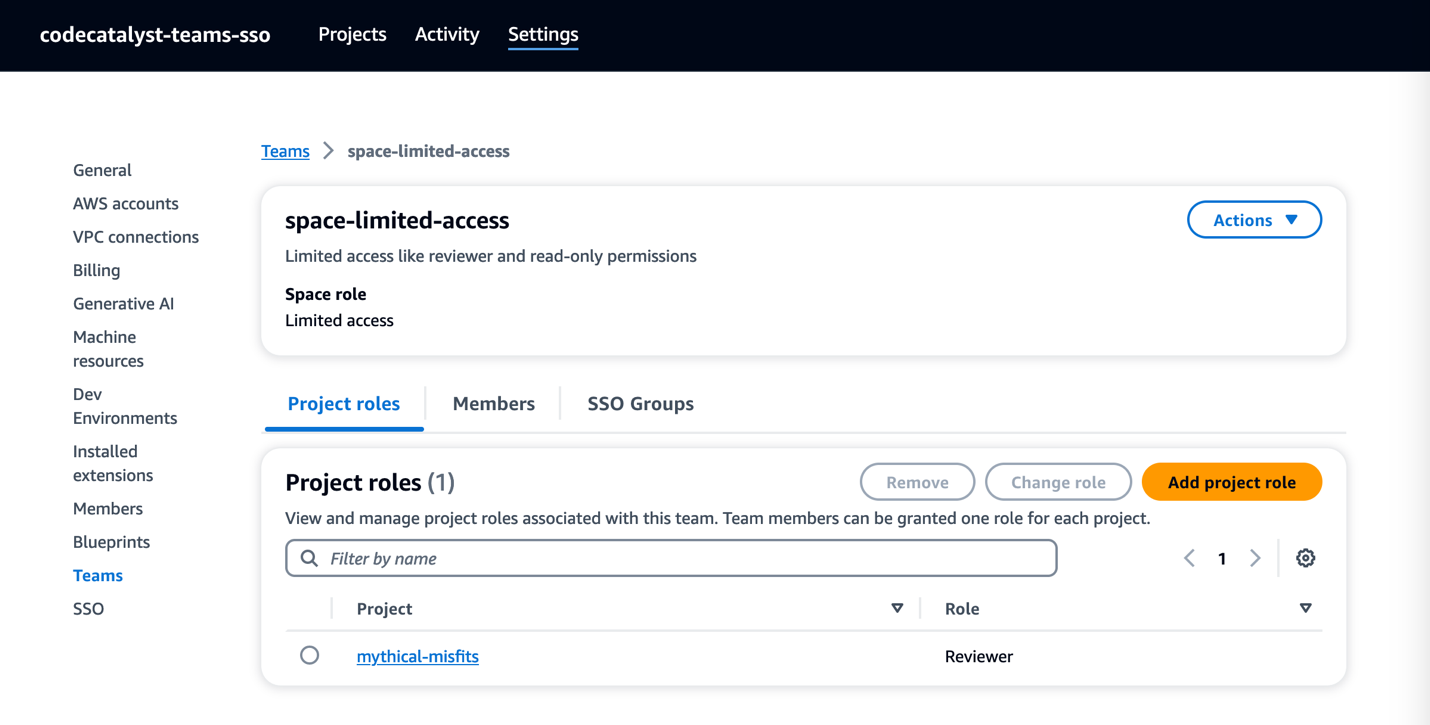

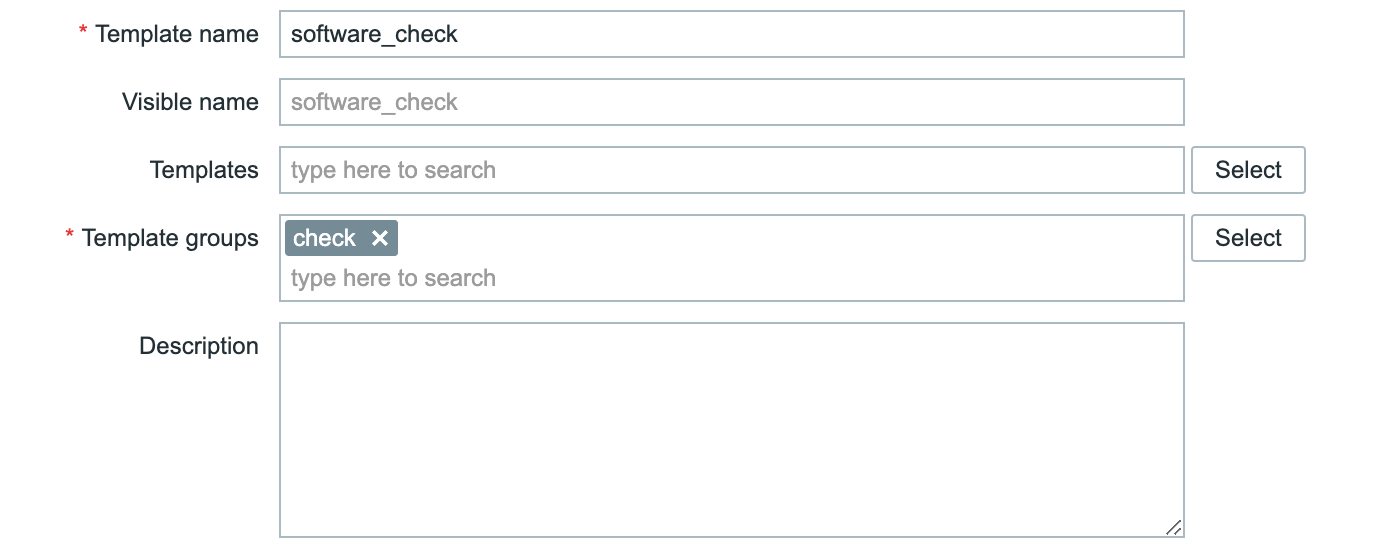
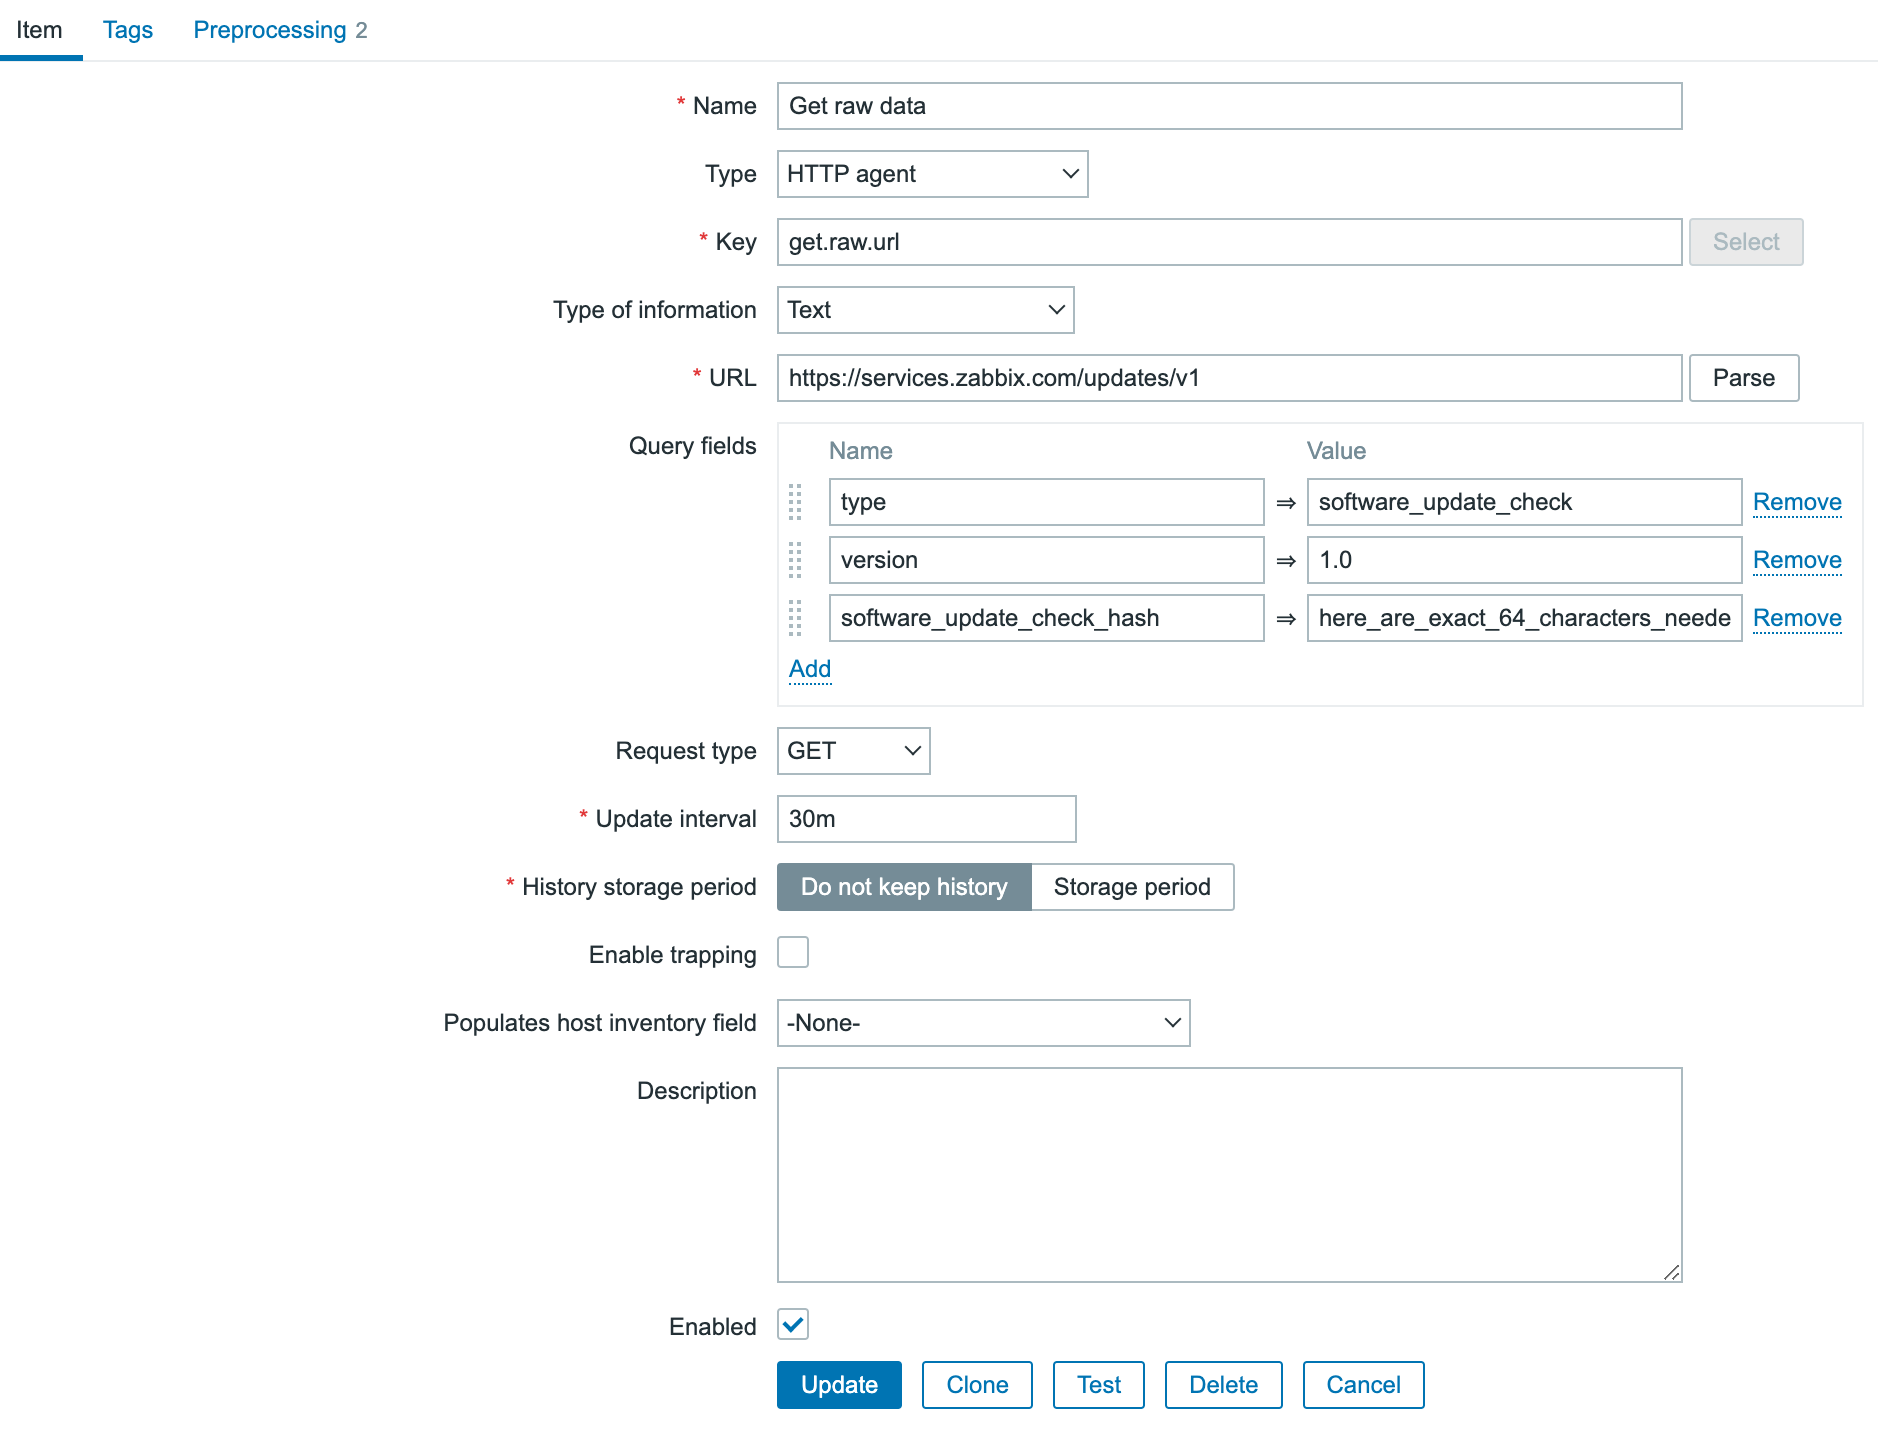
 for the example i just used ‘here_are_exact_64_characters_needed_as_a_custom_hash_for_zabbix_’