Tag Archives: serverless

Exploring serverless patterns for Amazon DynamoDB

Post Syndicated from Talia Nassi original https://aws.amazon.com/blogs/compute/exploring-serverless-patterns-for-amazon-dynamodb/

Amazon DynamoDB is a fully managed, serverless NoSQL database. In this post, you learn about the different DynamoDB patterns used in serverless applications, and use the recently launched Serverless Patterns Collection to configure DynamoDB as an event source for AWS Lambda.

Benefits of using DynamoDB as a serverless developer

DynamoDB is a serverless service that automatically scales up and down to adjust for capacity and maintain performance. It also has built-in high availability and fault tolerance. DynamoDB provides both provisioned and on-demand capacity modes so that you can optimize costs by specifying capacity per table, or paying for only the resources you consume. You are not provisioning, patching, or maintaining any servers.

Serverless patterns with DynamoDB

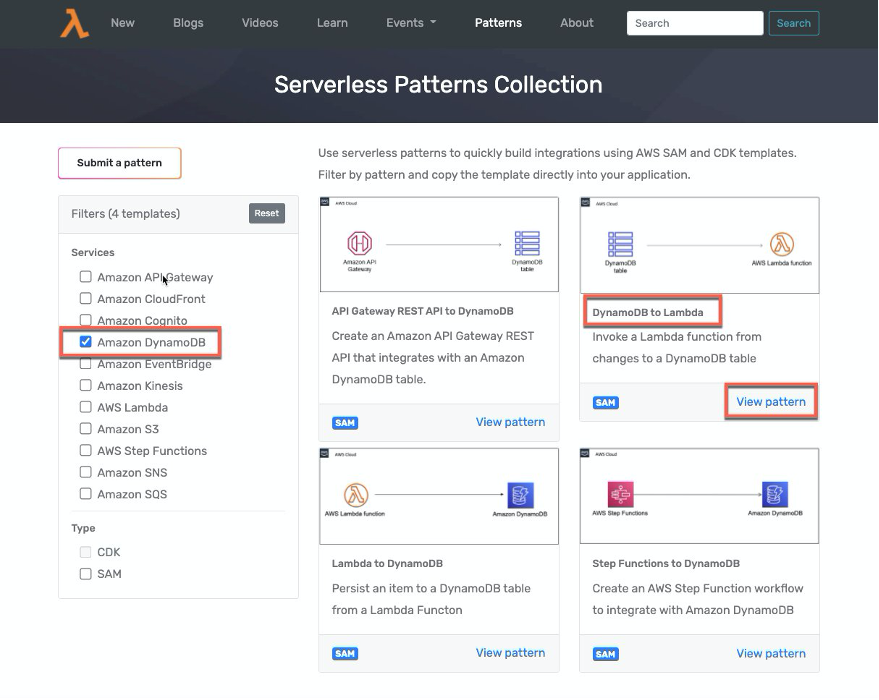
The recently launched Serverless Patterns Collection is a repository of serverless architecture examples that demonstrate integrating two or more AWS services. Each pattern uses either the AWS Serverless Application Model (AWS SAM) or AWS Cloud Development Kit (AWS CDK). These simplify the creation and configuration of the services referenced.

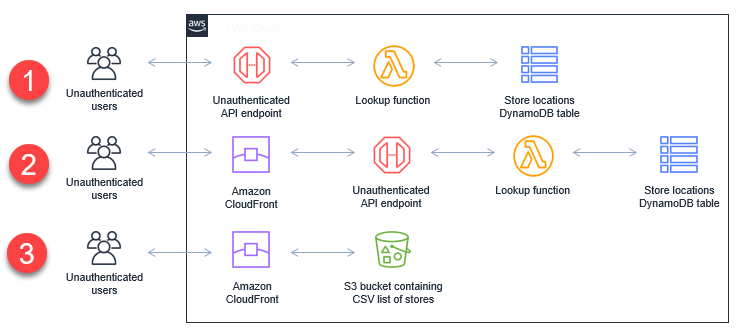
There are currently four patterns that use DynamoDB:

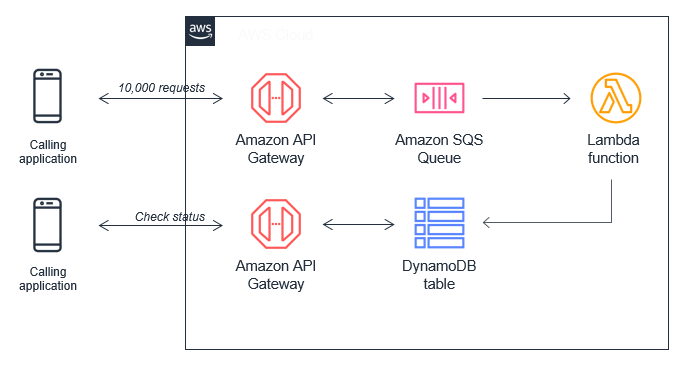
Amazon API Gateway REST API to Amazon DynamoDB

This pattern creates an Amazon API Gateway REST API that integrates with an Amazon DynamoDB table named “Music”. The API includes an API key and usage plan. The DynamoDB table includes a global secondary index named “Artist-Index”. The API integrates directly with the DynamoDB API and supports PutItem and Query actions. The REST API uses an AWS Identity and Access Management (IAM) role to provide full access to the specific DynamoDB table and index created by the AWS CloudFormation template. Use this pattern to store items in a DynamoDB table that come from the specified API.

AWS Lambda to Amazon DynamoDB

This pattern deploys a Lambda function, a DynamoDB table, and the minimum IAM permissions required to run the application. A Lambda function uses the AWS SDK to persist an item to a DynamoDB table.

AWS Step Functions to Amazon DynamoDB

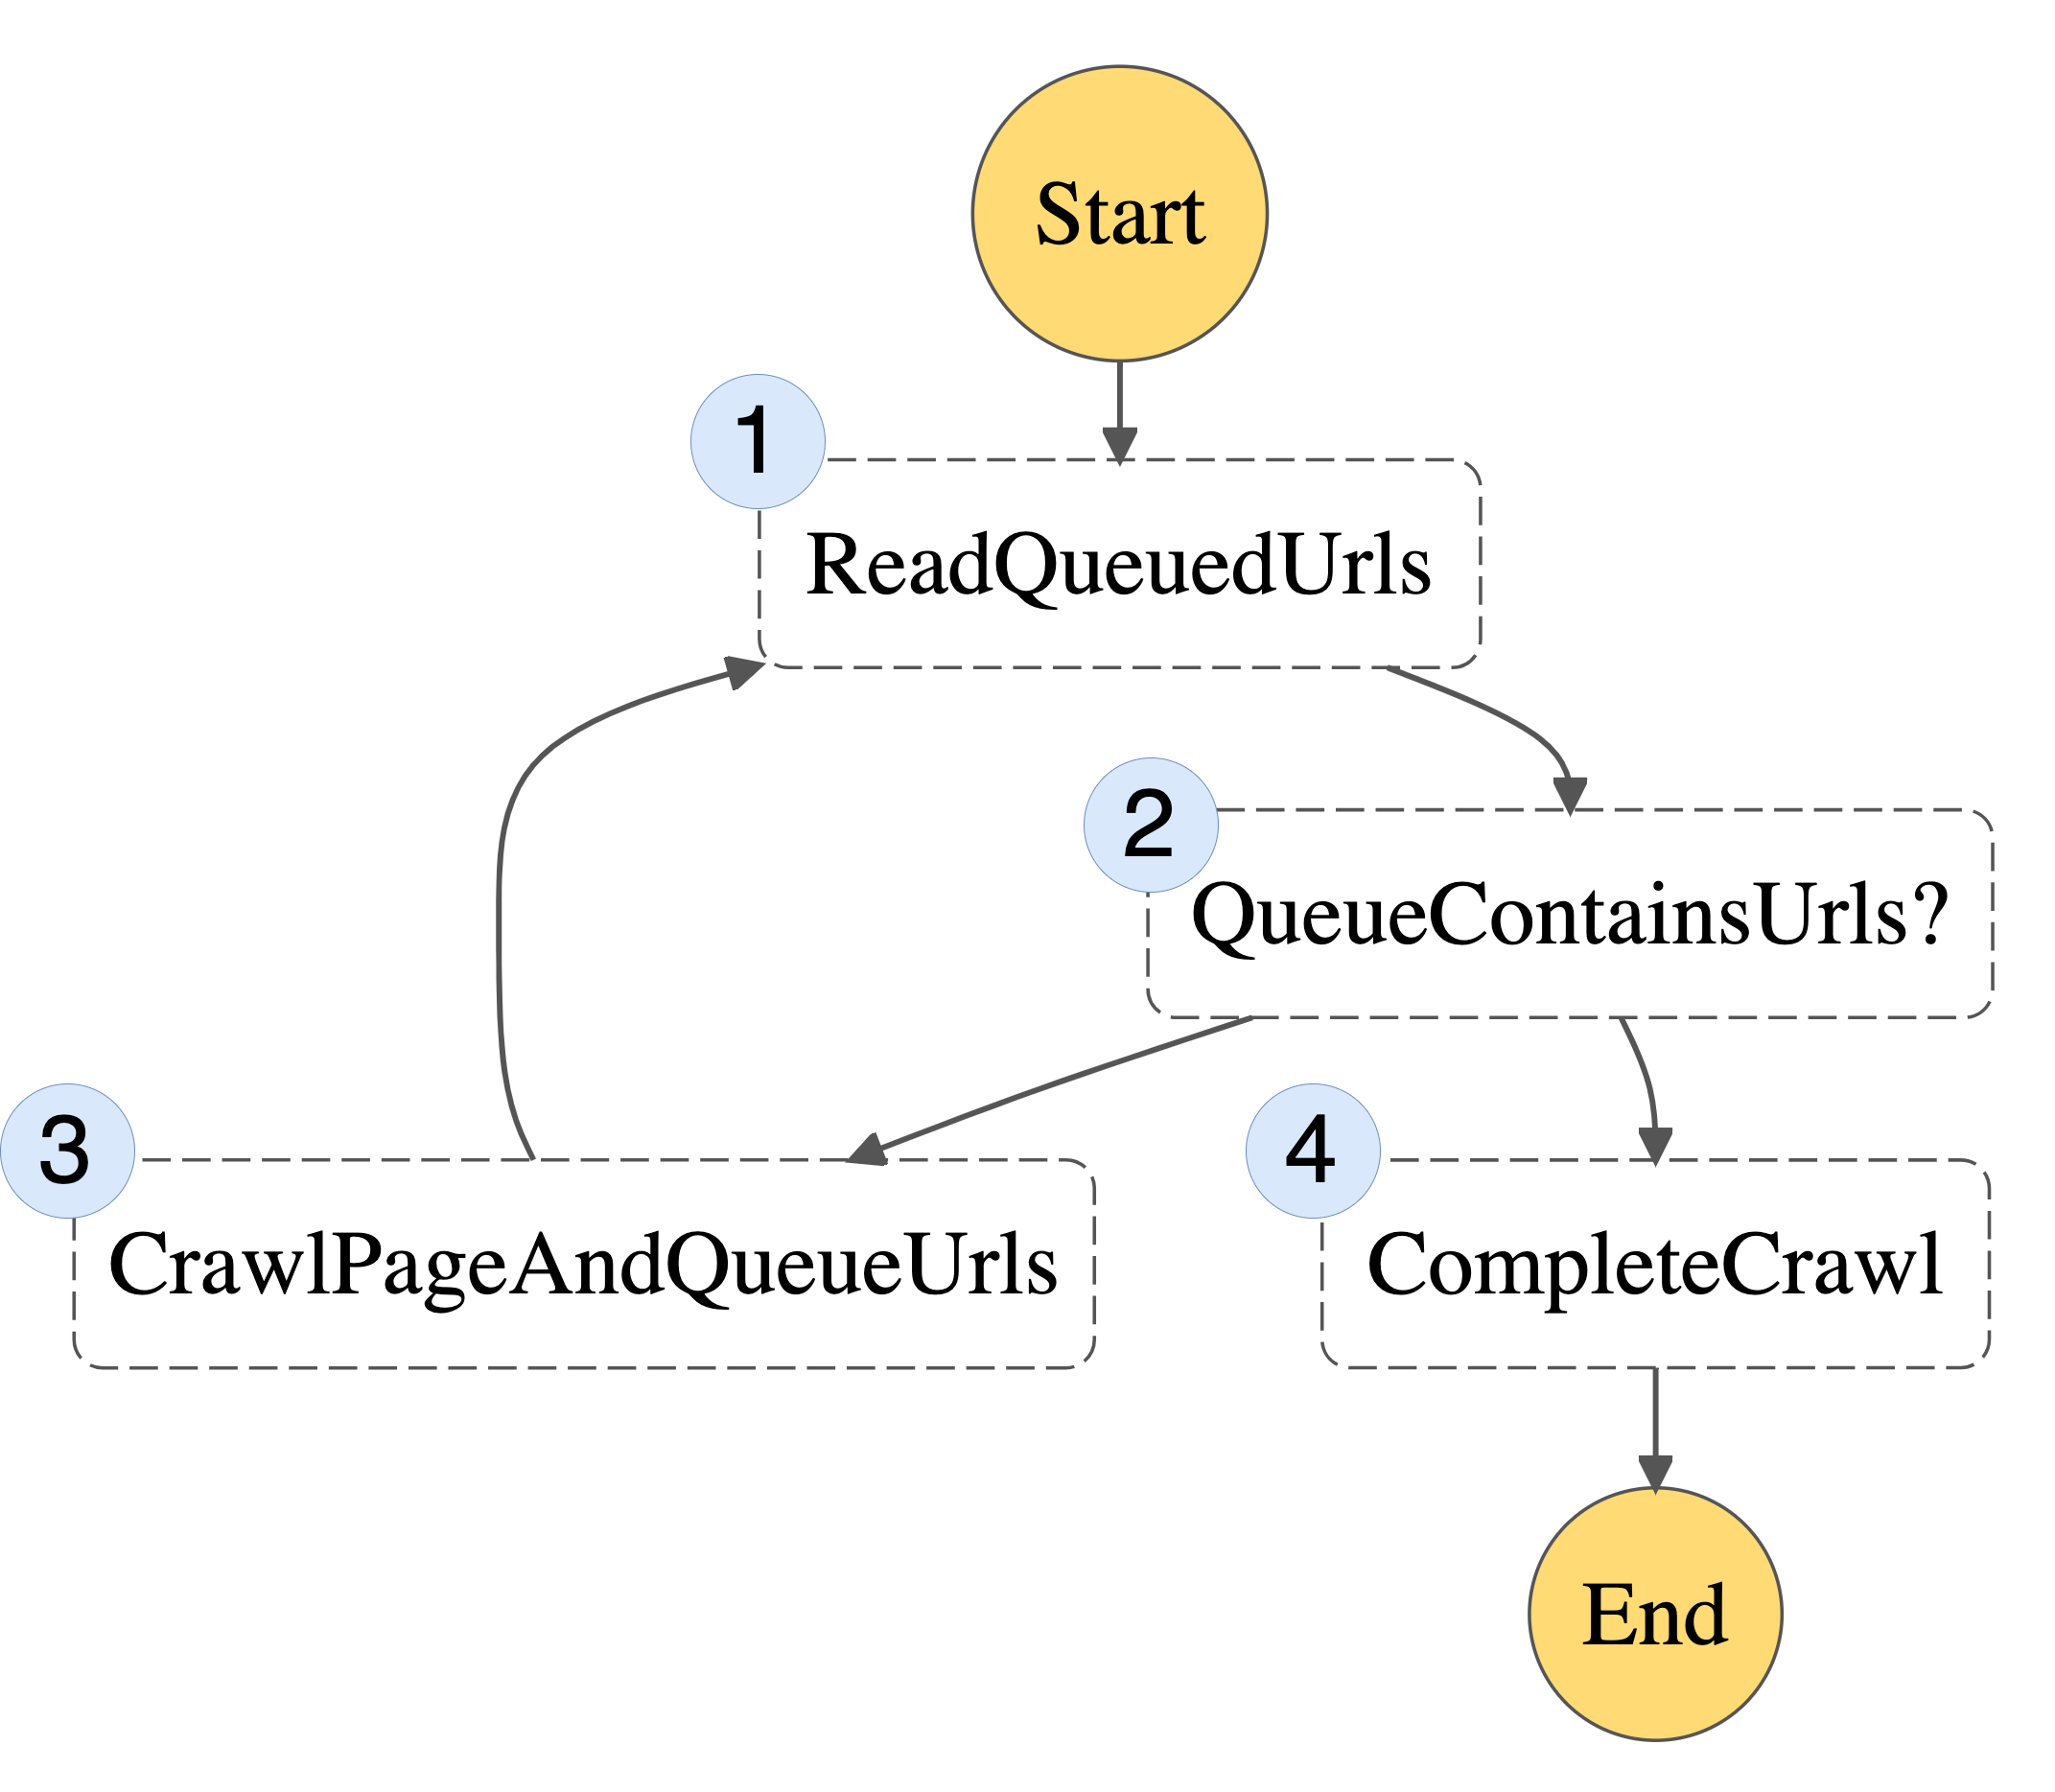
This pattern deploys a Step Functions workflow that accepts a payload and puts the item in a DynamoDB table. Additionally, this workflow also shows how to read an item directly from the DynamoDB table, and contains the minimum IAM permissions required to run the application.

Amazon DynamoDB to AWS Lambda

This pattern deploys the following Lambda function, DynamoDB table, and the minimum IAM permissions required to run the application. The Lambda function is invoked whenever items are written or updated in the DynamoDB table. The changes are then sent to a stream. The Lambda function polls the DynamoDB stream. The function is invoked with a payload containing the contents of the table item that changed. We use this pattern in the following steps.

AWSTemplateFormatVersion: '2010-09-09'
Transform: 'AWS::Serverless-2016-10-31'
Description: An Amazon DynamoDB trigger that logs the updates made to a table.
Resources:
  DynamoDBProcessStreamFunction:
    Type: 'AWS::Serverless::Function'
    Properties:
      Handler: app.handler
      Runtime: nodejs14.x
      CodeUri: src/
      Description: An Amazon DynamoDB trigger that logs the updates made to a table.
      MemorySize: 128
      Timeout: 3
      Events:
        MyDynamoDBtable:
          Type: DynamoDB
          Properties:
            Stream: !GetAtt MyDynamoDBtable.StreamArn
            StartingPosition: TRIM_HORIZON
            BatchSize: 100
  MyDynamoDBtable:
    Type: 'AWS::DynamoDB::Table'
    Properties:
      AttributeDefinitions:
        - AttributeName: id
          AttributeType: S
      KeySchema:
        - AttributeName: id
          KeyType: HASH
      ProvisionedThroughput:
        ReadCapacityUnits: 5
        WriteCapacityUnits: 5
      StreamSpecification:
        StreamViewType: NEW_IMAGE

Setting up the Amazon DynamoDB to AWS Lambda Pattern

Prerequisites

For this tutorial, you need:

Downloading and testing the pattern

  1. From the Serverless Patterns home page, choose Amazon DynamoDB from the Filters menu. Then choose the DynamoDB to Lambda pattern.
    DynamoDB to Lambda Pattern
  2. Clone the repository and change directories into the pattern’s directory.git clone https://github.com/aws-samples/serverless-patterns/
    cd serverless-patterns/dynamodb-lambda

    Download instructions

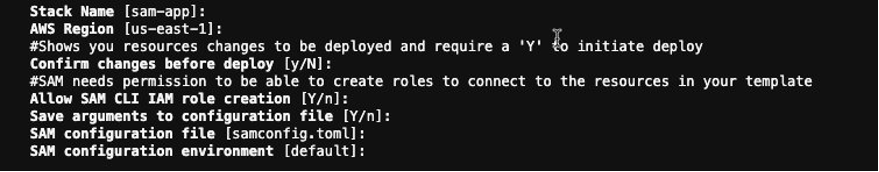
  3. Run sam deploy –guided. This deploys your application. Keeping the responses blank chooses the default options displayed in the brackets.
    sam deploy instructions
  4. You see the following confirmation message once your stack is created.
    sam confirmation message
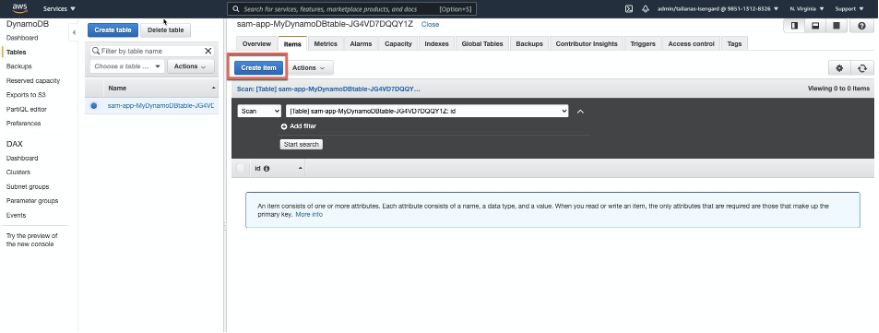
  5. Navigate to the DynamoDB Console and choose Tables. Select the newly created table. Newly created DynamoDB table
  6. Choose the Items tab and choose Create Item.
    Create Item
  7. Add an item and choose Save.
    Add item to table
  8. You see that item now in the DynamoDB table.
    DynamoDB table
  9. Navigate to the Lambda console and choose your function.
  10. From the Monitor tab choose View logs in CloudWatch.
    cloudwatch logs
  11. You see the new image inserted into the DynamoDB table.
    Cloudwatch Logs

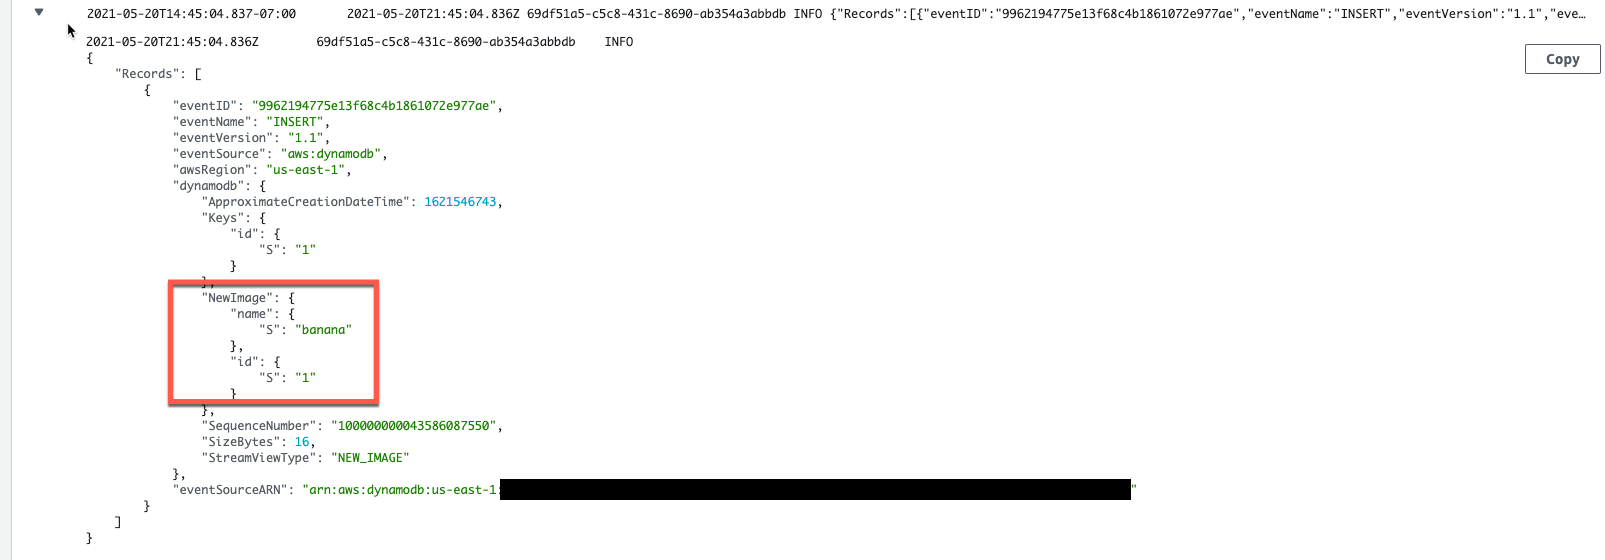
Anytime a new item is added to the DynamoDB table, the invoked Lambda function logs the event in Amazon Cloudwatch Logs.

Configuring the event source mapping for the DynamoDB table

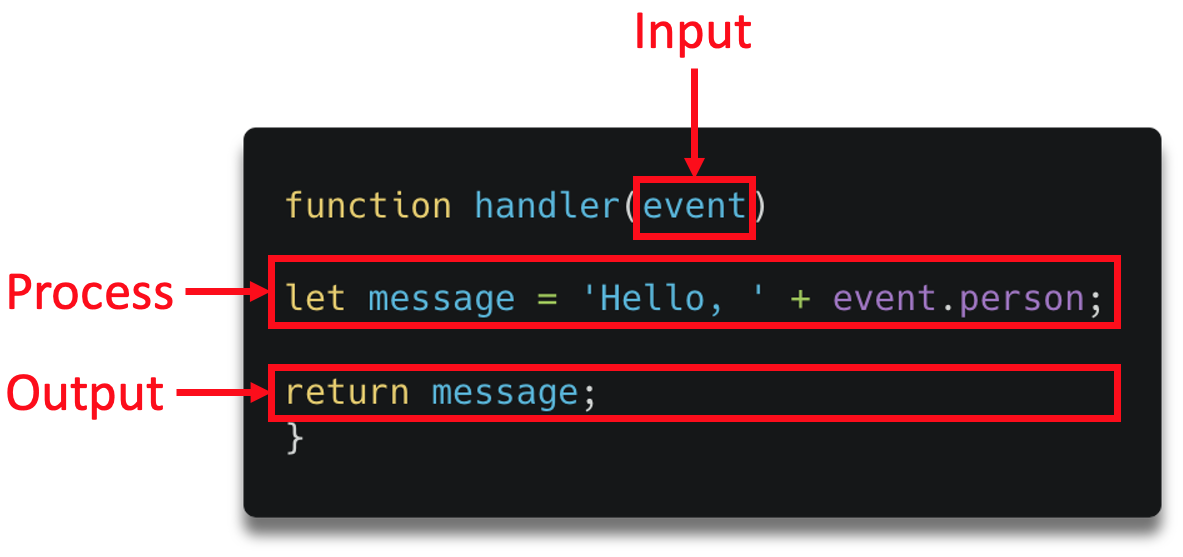
An event source mapping defines how a particular service invokes a Lambda function. It defines how that service is going to invoke the function. In this post, you use DynamoDB as the event source for Lambda. There are a few specific attributes of a DynamoDB trigger.

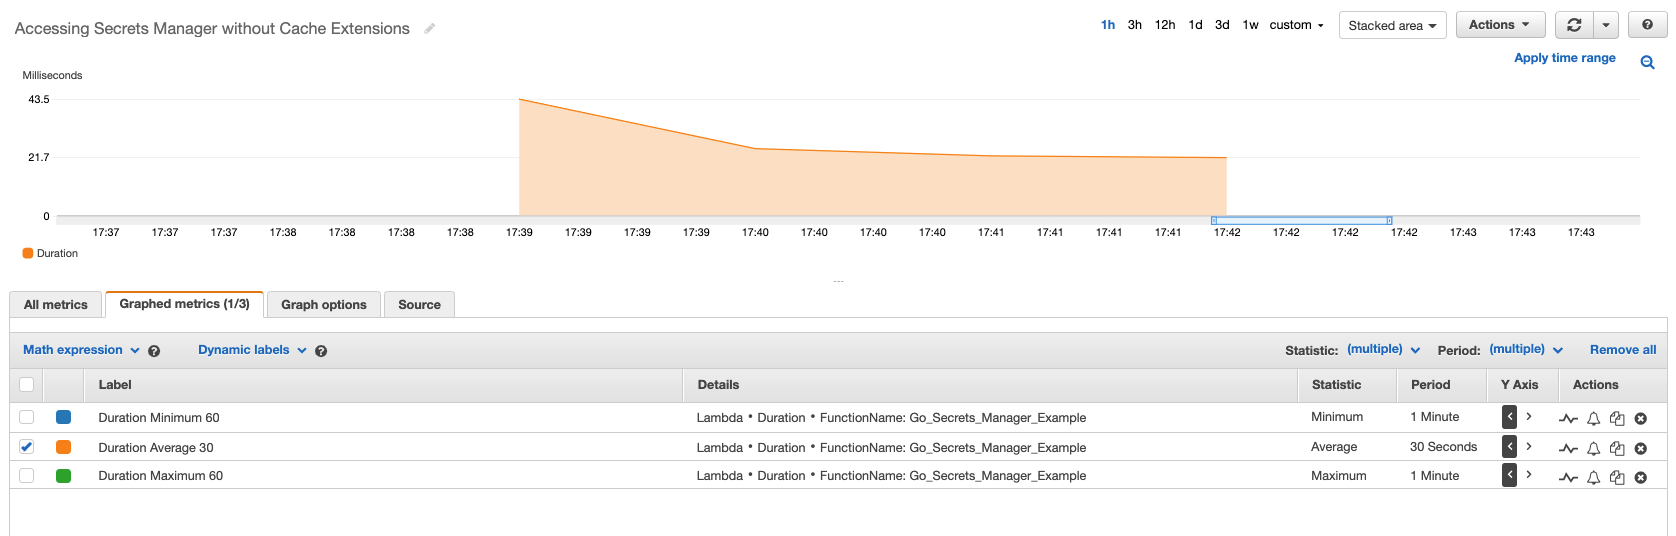
The batch size controls how many items can be sent for each Lambda invocation. This template sets the batch size to 100, as shown in the following deployed resource. The batch window indicates how long to wait until it invokes the Lambda function.

These configurations are beneficial because they increase your capabilities of what the DynamoDB table can do. In a traditional trigger for a database, the trigger gets invoked once per row per trigger action. With this batching capability, you can control the size of each payload and how frequently the function is invoked.

Trigger screenshot

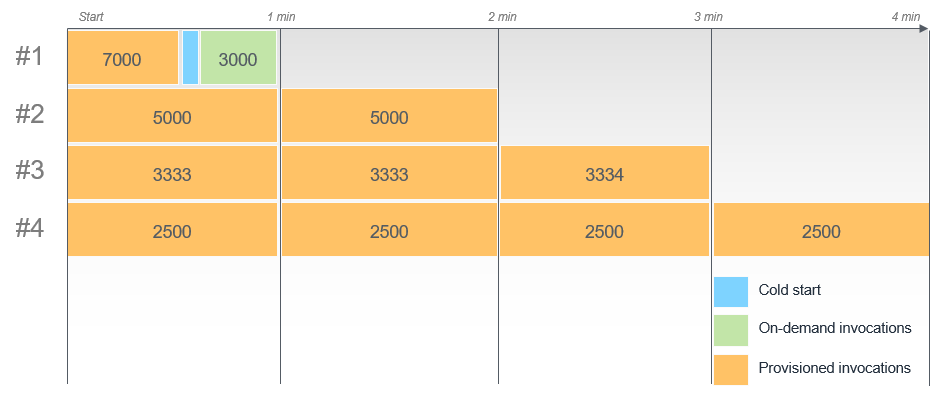
Using DynamoDB capacity modes

DynamoDB has two read/write capacity modes for processing reads and writes on your tables: provisioned and on-demand. The read/write capacity mode controls how you pay for read and write throughput and how you manage capacity.

With provisioned mode, you specify the number of reads and writes per second that you require for your application. You can use automatic scaling to adjust the table’s provisioned capacity automatically in response to traffic changes. This helps to govern your DynamoDB use to stay at or below a defined request rate to obtain cost predictability.

Provisioned mode is a good option if you have predictable application traffic, or you run applications whose traffic is consistent or ramps gradually. To use provisioned mode in a DynamoDB table, enter ProvisionedThroughput as a property, and then define the read and write capacity:

 MyDynamoDBtable:
    Type: 'AWS::DynamoDB::Table'
    Properties:
      AttributeDefinitions:
        - AttributeName: id
          AttributeType: S
      KeySchema:
        - AttributeName: id
          KeyType: HASH
      ProvisionedThroughput:
        ReadCapacityUnits: 5
        WriteCapacityUnits: 5
      StreamSpecification:
        StreamViewType: NEW_IMAGE

With on-demand mode, DynamoDB accommodates workloads as they ramp up or down. If a workload’s traffic level reaches a new peak, DynamoDB adapts rapidly to accommodate the workload.

On-demand mode is a good option if you create new tables with unknown workload, or you have unpredictable application traffic. Additionally, it can be a good option if you prefer paying for only what you use. To use on-demand mode for a DynamoDB table, in the properties section of the template.yaml file, enter BillingMode: PAY_PER_REQUEST.

ApplicationTable:
    Type: AWS::DynamoDB::Table
    Properties:
      TableName: !Ref ApplicationTableName
      BillingMode: PAY_PER_REQUEST    
      StreamSpecification:
        StreamViewType: NEW_AND_OLD_IMAGES  

Stream specification

When DynamoDB sends the payload to Lambda, you can decide the view type of the stream. There are three options: new images, old images, and new and old images. To view only the new updated changes to the table, choose NEW_IMAGES as the StreamViewType. To view only the old change to the table, choose OLD_IMAGES as the StreamViewType. To view both the old image and new image, choose NEW_AND_OLD_IMAGES as the StreamViewType.

ApplicationTable:
    Type: AWS::DynamoDB::Table
    Properties:
      TableName: !Ref ApplicationTableName
      BillingMode: PAY_PER_REQUEST    
      StreamSpecification:
        StreamViewType: NEW_AND_OLD_IMAGES  

Cleanup

Once you have completed this tutorial, be sure to remove the stack from CloudFormation with the commands shown below.

cleanup

Submit a pattern to the Serverless Land Patterns Collection

While there are many patterns available to use from the Serverless Land website, there is also the option to create your own pattern and submit it. From the Serverless Patterns Collection main page, choose Submit a Pattern.

There you see guidance on how to submit. We have added many patterns from the community and we are excited to see what you build!

Conclusion

In this post, I explain the benefits of using DynamoDB patterns, and the different configuration settings, including batch size and batch window, that you can use in your pattern. I explain the difference between the two capacity modes, and I also show you how to configure a DynamoDB stream as an event source for Lambda by using the existing serverless pattern.

For more serverless learning resources, visit Serverless Land.

Building serverless applications with streaming data: Part 3

Post Syndicated from James Beswick original https://aws.amazon.com/blogs/compute/building-serverless-applications-with-streaming-data-part-3/

This series is about building serverless solutions in streaming data workloads. These are traditionally challenging to build, since data can be streamed from thousands or even millions of devices continuously. The application example used in this series is Alleycat, which allows bike racers to compete with each other virtually on home exercise bikes.

Part 1 explains the application’s functionality, how to deploy to your AWS account, and provides an architectural review. Part 2 compares different ways to ingest streaming data into Amazon Kinesis Data Streams and shows how to optimize shard capacity.

In this post, I explain how the all-time rankings functionality is implemented. This uses Amazon Kinesis Data Firehose to deliver hundreds of thousands of data points for processing by AWS Lambda functions.

To set up the example, visit the GitHub repo and follow the instructions in the README.md file. Note that this walkthrough uses services that are not covered by the AWS Free Tier and incur cost.

Overview of real time rankings in Alleycat

In the example scenario, there are 40,000 users and up to 1,000 competitors may race at any given time. While a competitor is racing, there is a real time rankings display that shows their performance in the selected class:

Alleycat front end

The racer can select Here now to compare against racers in the current virtual race. Alternatively, selecting All time compares their performance against the best performance of all races who have ever competed in the race. The rankings board is dynamic and shows the rankings for the current second on the display for the local racer:

Leaderboard changes over time

In Alleycat, races occur every five minutes continuously, and the all-time data is gathered from races that are completed. For this to work, the application must do the following:

  • Continuously aggregate race data from each of the six exercise classes and deliver to an Amazon S3 bucket.
  • Compare the incoming race data with the personal best records for every competitor in the same class.
  • If the current performance is a record, update the all-time best records dataset.
  • Compress the dataset, since there are thousands of racers, each with 5 minutes of personal racing history.

The resulting dataset contains second-by-second personal records for every racer in a selected race. This is saved in the application’s history bucket in S3 and loaded by the Alleycat front end before the beginning of each race:

        // From Home.vue's loadRealtimeHistory method

        // Load gz from S3 history bucket, unzip and parse to JSON
        const URL = `https://${this.$appConfig.historyBucket}.s3.${this.$appConfig.region}.amazonaws.com/class-${this.selectedClassId}.gz`
        const response = await axios.get(URL, { responseType: 'arraybuffer' })
        const buffer = Buffer.from(response.data, 'base64')
        const dezipped = await gunzip(buffer)
        const history = JSON.parse(dezipped.toString())

Architecture overview

The backend microservice handling this feature is located in the 2-streaming-kdf directory in the GitHub repo. It uses the following architecture:

Solution architecture

  1. Amazon Kinesis Data Firehose is a consumer of Kinesis Data Streams. Records are delivered from the application’s main stream as they arrive.
  2. Kinesis Data Firehose invokes a data transformation Lambda function. This calculates the output for each racer’s data points and returns the modified records to Kinesis.
  3. Kinesis Data Firehose delivers batches of records to an S3 bucket.
  4. When objects are written to the S3 bucket, this event triggers the S3 processor Lambda function. This compares incoming racer performance with historical records.
  5. The Lambda function saves the new all-time records in a compressed format to the application’s history bucket in S3.

The process happens continuously providing that new records are delivered to the application’s main Kinesis stream.

Using Kinesis Data Firehose

Kinesis Data Firehose can consume records from Kinesis Data Streams, or directly from the AWS SDK, AWS IoT Core, and other data producers. In Alleycat, there are multiple consumers that process incoming data, so Kinesis Data Firehose is configured as a consumer on the main stream.

The process of updating historical records is not a real-time process in Alleycat. Processing individual racer messages and comparing against all-time records is possible but would be computationally more complex. In practice, only a few incoming data points are all-time records. As a result, Alleycat asynchronously processes batches of records to find and update all-time records. The process is eventually consistent and the tradeoff is latency. There may be up to 1 minute between recording a personal record and updating the historical dataset in S3.

Kinesis Data Firehose provides several key functions for this process. First, it batches groups of messages based upon the batching hints provided in the AWS Serverless Application Model (AWS SAM) template. This application buffers records for up to 60 seconds or until 1 MB of records are available, whichever is reached first. You can adjust these settings and batch for up to 900 seconds or 128 MB of data. Note that these settings are hints and not absolute – the service can dynamically adjust these if data delivery falls behind data writing in the stream. As a result, hints should be treated as guidance and the actual settings may change.

Kinesis Data Firehose also enables data compression before delivery in various common formats. Since the S3 delivery bucket is an intermediary storage location in this application, using data compression reduces the storage cost. Kinesis can also encrypt data before delivery but this feature is not used in Alleycat. Finally, Kinesis Data Firehose can transform the incoming records by invoking a Lambda function. This enables the application to calculate the racer’s output before delivering the records.

The configuration for Kinesis Data Firehose, the S3 buckets, and the Lambda function is located in the template.yaml file in the GitHub repo. This AWS SAM template shows how to define the complete integration:

  DeliveryStream:
    Type: AWS::KinesisFirehose::DeliveryStream
    DependsOn:
      - DeliveryStreamPolicy    
    Properties:
      DeliveryStreamName: "alleycat-data-firehose"
      DeliveryStreamType: "KinesisStreamAsSource"
      KinesisStreamSourceConfiguration: 
        KinesisStreamARN: !Sub "arn:aws:kinesis:${AWS::Region}:${AWS::AccountId}:stream/${KinesisStreamName}"
        RoleARN: !GetAtt DeliveryStreamRole.Arn
      ExtendedS3DestinationConfiguration: 
        BucketARN: !GetAtt DeliveryBucket.Arn
        BufferingHints: 
          SizeInMBs: 1
          IntervalInSeconds: 60
        CloudWatchLoggingOptions: 
          Enabled: true
          LogGroupName: "/aws/kinesisfirehose/alleycat-firehose"
          LogStreamName: "S3Delivery"
        CompressionFormat: "GZIP"
        EncryptionConfiguration: 
          NoEncryptionConfig: "NoEncryption"
        Prefix: ""
        RoleARN: !GetAtt DeliveryStreamRole.Arn
        ProcessingConfiguration: 
          Enabled: true
          Processors: 
            - Type: "Lambda"
              Parameters: 
                - ParameterName: "LambdaArn"
                  ParameterValue: !GetAtt FirehoseProcessFunction.Arn

Once Kinesis Data Firehose is set up, there is no ongoing administration. The service scales automatically to adjust to the amount of the data available in the application’s Kinesis data stream.

How the Lambda data transformer works

Kinesis Data Firehose buffers up to 3 MB before invoking the data transformation function (you can configure this setting with the ProcessingConfiguration API). The service delivers records as a JSON array:

{
    "invocationId": "d8ce3cc6-abcd-407a-abcd-d9bc2ce58e72",
    "sourceKinesisStreamArn": "arn:aws:kinesis:us-east-2:012345678912:stream/alleycat",
    "deliveryStreamArn": "arn:aws:firehose:us-east-2:012345678912:deliverystream/alleycat-firehose",
    "region": "us-east-2",
    "records": [
        {
            "recordId": "49617596128959546022271021234567...",
            "approximateArrivalTimestamp": 1619185789847,
            "data": "eyJ1dWlkIjoiYjM0MGQzMGYtjI1Yi00YWM4LThjY2QtM2ZhNThiMWZmZjNlIiwiZXZlbnQiOiJ1cGRhdGUiLCJkZXZpY2VUaW1lc3RhbXiOjE2MTkxODU3ODk3NUsInNlY29uZCI6MwicmFjZUlkIjoxNjE5MTg1NjIwMj1LCJuYW1lIjoiSHViZXJ0IiwicmFjZXJJZCI6MSwiY2xhc3NJZCI6MSwiY2FkZW5jZSI6ODAsInJlc2lzdGFuY2UiOjc4fQ==",
            "kinesisRecordMetadata": {
                "sequenceNumber": "49617596128959546022271020452",
                "subsequenceNumber": 0,
                "partitionKey": "1619185789798",
                "shardId": "shardId-000000000000",
                "approximateArrivalTimestamp": 1619185789847
            }
        }, 
   ...

The payload contains metadata about the invocation and data source and each record contains a recordId and a base64 encoded data attribute. The Lambda function can then decode and modify the data attribute for each record as needed. The Lambda function must finally return a JSON array of the same length as the incoming event.records array, with the following attributes:

  • recordId: this must match the incoming recordId, so Kinesis can map the modified data payload back to the original record.
  • result: this must be “Ok”, “Dropped”, or “ProcessingFailed”. “Dropped” means that the function has intentionally removed a payload from processing. Any records with “ProcessingFailed” are delivered to the S3 bucket in a folder called processing-failed. This includes metadata indicating the number of delivery attempts, the timestamp of the last attempt, and the Lambda function’s ARN.
  • data: the returned data payload must be base64 encoded and the modified record must be within the 1 MB limit per record.

The transformer function in Alleycat shows how to implement this process in Node.js:

exports.handler = (event) => {
  const output = event.records.map((record) => {
    // Extract JSON record from base64 data
    const buffer = Buffer.from(record.data, "base64").toString()
    const jsonRecord = JSON.parse(buffer)

    // Add calculated field
    jsonRecord.output = ((jsonRecord.cadence + 35) * (jsonRecord.resistance + 65)) / 100

    // Convert back to base64 + add a newline
    const dataBuffer = Buffer.from(JSON.stringify(jsonRecord) + "\n", "utf8").toString("base64")

    return {
      recordId: record.recordId,
      result: "Ok",
      data: dataBuffer,
    }
  })

  console.log(`{ recordsTotal: ${output.length} }`)
  return { records: output }
}

If you are processing the data in downstream services in JSON format, adding a newline at the end of the data buffer for each record can simplify the import process.

The data transformation Lambda function can run for up to 5 minutes and can use other AWS services for data processing. The Kinesis Data Firehose service scales up the Lambda function automatically if traffic increases, up to 5 outstanding invocations per shard (or 10 if the destination is Splunk).

Processing the Kinesis Data Firehose output

Kinesis Data Firehose puts a series of objects in the intermediary S3 bucket. Each put event invokes the S3 processor Lambda function. This function compares each data point to historical best performance, per racer ID, per class ID, at the same second of the race.

Data points that do not beat existing records are discarded. Otherwise, the function merges new historical records into the dataset and saves the result into the final S3 history bucket. This object is compressed in gzip format and contains the history for a single class ID.

When the frontend downloads this dataset from the S3 bucket, it decompresses the object. The resulting JSON structure shows personal output records per racer ID for each second of the race. The frontend uses this data to update the leaderboard on the local device during each second of the active race.

JSON output

Conclusion

In this post, I explain the all-time leaderboard logic in the Alleycat application. This is an asynchronous, eventually consistent process that checks batches of incoming records for new personal records. This uses Kinesis Data Firehose to provide a zero-administration way to deliver and process large batches of records continuously.

This post shows the architecture in Alleycat and how this is defined in AWS SAM. Finally, I walk through how to build a data transformation Lambda function that correctly decodes a payload and returns records back to Kinesis.

Part 4 show how to combine Kinesis with Amazon DynamoDB to support queries for streaming data. Alleycat uses this architecture to provide real-time rankings for competitors in the same virtual race.

For more serverless learning resources, visit Serverless Land.

Getting started with serverless for developers part 5: Sandbox developer account

Post Syndicated from Benjamin Smith original https://aws.amazon.com/blogs/compute/getting-started-with-serverless-for-developers-part-5-sandbox-developer-account/

This is part 5 of the Getting started with serverless series. In part 4, you learn how the developer workflow for building serverless applications differs to a traditional developer workflow. You see how to test business logic locally before deploying to an AWS account.

In this post, you learn how to secure and manage access to your AWS Lambda functions. I show how to invoke Lambda functions in a sandbox developer account directly from an integrated developer environment (IDE) and view output logs in near-real-time. Finally, I show how this helps to test for infrastructure and security configurations before committing changes to the main branch.

A sandbox developer account

Serverless services like Lambda and Amazon API Gateway are pay-per-use, this means developers no longer need to share multiple environments (for example, dev, staging, and production). Instead, every developer can have their own sandboxed AWS developer account. This allows developers to not have to replicate everything to their local environment but rather test with real resources in the cloud.

You can still run code locally during the development of a feature. In post 4, I show how I run Lambda function code locally, using a test harness. This allows me to maintain a fast inner loop, iteratively updating and locally testing code. If my Lambda function interacts with other AWS infrastructure, I deploy them to a sandboxed AWS developer account. This allows me to test my Lambda function code locally while still being able to access managed services in the cloud.

However, it is useful to deploy your function code to a Lambda function in a sandboxed developer account. A sandbox developer account is an AWS account allocated to a developer on a 1:1 basis. It should give developers as much freedom as possible while still protecting resources and budget.

This allows you to test for security configurations and ensure that your Lambda function code behaves as expected when run in the Lambda execution environment:

Creating a sandboxed developer account

The following best practices can help to minimize costs and prevent unauthorized usage.

After creating a sandbox account, it can be useful to associate a named profile with it. A named profile is a collection of credentials that you can apply to an AWS Command Line Interface (AWS CLI) command. When you specify a profile to run a command, the settings and credentials are used to run that command. The AWS CLI supports multiple named profiles that are stored in the config and credentials files.

Configure profiles by adding entries to the config and credentials files. To learn more about named profiles refer to the AWS CLI documentation.

In the following example I configure my credentials file with two named profiles.

The profile named prod is my production account, and the profile named default is my sandbox developer account. The CLI automatically uses the profile named default, if no --profile option is specified in a CLI command.

[default]
aws_access_key_id=AKIAIOSFODNN7EXAMPLE
aws_secret_access_key=wJalrXUtnFEMI/K7MDENG/bPxRfiCYEXAMPLEKEY

[dev]
aws_access_key_id=AKIAIOSFODNN7EXAMPLE
aws_secret_access_key=wJalBBUtnFEMI/&7MDENG/bPxRfiCYEXAMPLEKEY

[prod]
aws_access_key_id=AKIAI44QH8DHBEXAMPLE
aws_secret_access_key=je7MtGbClwBF/2Zp9Utk/h3yCo8nvbEXAMPLEKEY

AWS Lambda security permissions

AWS Identity and Access Management (IAM) is the service used to manage access to AWS services. Lambda is fully integrated with IAM, allowing you to control precisely what each Lambda function can do within the AWS Cloud. There are two important things that define the scope of permissions in Lambda functions:

The resource policy: Defines which events are authorized to invoke the function.

The execution role policy: Limits what the Lambda function is authorized to do.

Using IAM roles to describe a Lambda function’s permissions, decouples it’s security configuration from the code. This helps reduce the complexity of a lambda function, making it easier to maintain.

A Lambda function’s resource and execution policy should be granted the minimum required permissions for the function to perform it’s task effectively. This is sometimes referred to as the rule of least privilege. As you develop a Lambda function, you expand the scope of this policy to allow access to other resources as required.

When building Lambda-based applications with frameworks such as AWS SAM, you describe both policies in the application’s template.

The following steps show how I deploy and test a Lambda function in a sandbox developer account from within my IDE.

Before you start

All the code relating to this example application can be found in this GitHub repository. To deploy this stage of the application, follow the steps from post 1 to clone the sample application.

  1. Run the following command from the root directory of the cloned repository:
    cd ./part_5
  2. After creating a sandbox developer account, deploy the example application into it by specifying the corresponding profile name in the AWS SAM CLI command. You can omit this if you named the profile default:
    sam deploy --config-file ../samconfig.toml  –guided  --profile default

    This produces the following output:

    Make a note of the StarWebhookLambdaFunctionName, you will use this in the following steps.

Logging with serverless applications

After deploying your serverless application to the sandboxed developer account, you need to verify that it’s operating properly. Lambda automatically monitors functions on your behalf, reporting metrics through Amazon CloudWatch. It collects data in the form of logs, metrics, and events and provides a unified view of AWS resources, applications, and services.

To help simplify troubleshooting, the AWS Serverless Application Model CLI (AWS SAM CLI) has a command called sam logs. This command lets you fetch CloudWatch Logs generated by your Lambda function from the command line.

Run the following command in a terminal window to view a live tail of logs generated by the StarWebhookHandler Lambda function. Replace StarWebhookLambdaFunctionName with the Lambda function name generated by your deployment:

sam logs -n StarWebhookLambdaFunctionName --tail

Checking Lambda function permissions in a sandbox developer account

I open a new terminal window and invoke the StarWebhookHandler Lambda function directly from my IDE by running the following AWS SAM CLI command. To invoke the function I pass an example payload located in events/testEvent.json.

aws lambda invoke --function-name <<replace-with-function-name>> \
--payload fileb://events/testEvent.json  \
out.txt

The following screenshot shows my two terminal windows side by side.

The response returned by the CLI command is on the right. The left window shows the tail of logs generated by the Lambda function. I observe that the CLI invocation shows a status 200 response, but the Lambda function logs report an ‘AccessDenied’ error. The function does not have the required permissions to write to Amazon S3.

I edit the Lambda function policy definition, adding permission for my Lambda function to write to an S3 bucket. I run sam build and sam deploy to re-deploy the application to the sandbox developer account. I invoke the Lambda function again. The logs show the following:

  1. The Lambda function responds with “StatusCode 200″.
  2. The Lambda function billed duration, memory size and running duration.
  3. The Lambda function has successfully copied the file to S3

IAM permission errors such as these may not be detected when running the function code locally. This is one of the advantages of deploying and running Lambda functions in a sandboxed developer account while developing an application.

Conclusion

This post explains the advantages of using a sandbox developer account. It shows how to deploy your business logic to a Lambda function in a sandboxed developer account. You are introduced to IAM policies, which control precisely what each Lambda function can do within the AWS Cloud. You learn that CloudWatch provides a unified view of logs for all AWS resources.

Finally, I show how to use the AWS SAM CLI and AWS CLI to invoke a Lambda function in the cloud and view its log output directly from the IDE. This helps to test for security configurations and to ensure that your business logic behaves as expected when run in the Lambda service. Invoking functions and observing their log output directly from your IDE helps to reduce context switching as you build.

Announcing migration of the Java 8 runtime in AWS Lambda to Amazon Corretto

Post Syndicated from James Beswick original https://aws.amazon.com/blogs/compute/announcing-migration-of-the-java-8-runtime-in-aws-lambda-to-amazon-corretto/

This post is written by Jonathan Tuliani, Principal Product Manager, AWS Lambda.

What is happening?

Beginning July 19, 2021, the Java 8 managed runtime in AWS Lambda will migrate from the current Open Java Development Kit (OpenJDK) implementation to the latest Amazon Corretto implementation.

To reflect this change, the AWS Management Console will change how Java 8 runtimes are displayed. The display name for runtimes using the ‘java8’ identifier will change from ‘Java 8’ to ‘Java 8 on Amazon Linux 1’. The display name for runtimes using the ‘java8.al2’ identifier will change from ‘Java 8 (Corretto)’ to ‘Java 8 on Amazon Linux 2’. The ‘java8’ and ‘java8.al2’ identifiers themselves, as used by tools such as the AWS CLI, CloudFormation, and AWS SAM, will not change.

Why are you making this change?

This change enables customers to benefit from the latest innovations and extended support of the Amazon Corretto JDK distribution. Amazon Corretto is a no-cost, multiplatform, production-ready distribution of the OpenJDK. Corretto is certified as compatible with the Java SE standard and used internally at Amazon for many production services.

Amazon is committed to Corretto, and provides regular updates that include security fixes and performance enhancements. With this change, these benefits are available to all Lambda customers. For more information on improvements provided by Amazon Corretto 8, see Amazon Corretto 8 change logs.

How does this affect existing Java 8 functions?

Amazon Corretto 8 is designed as a drop-in replacement for OpenJDK 8. Most functions benefit seamlessly from the enhancements in this update without any action from you.

In rare cases, switching to Amazon Corretto 8 introduces compatibility issues. See below for known issues and guidance on how to verify compatibility in advance of this change.

When will this happen?

This migration to Amazon Corretto takes place in several stages:

  • June 15, 2021: Availability of Lambda layers for testing the compatibility of functions with the Amazon Corretto runtime. Start of AWS Management Console changes to java8 and java8.al2 display names.
  • July 19, 2021: Any new functions using the java8 runtime will use Amazon Corretto. If you update an existing function, it will transition to Amazon Corretto automatically. The public.ecr.aws/lambda/java:8 container base image is updated to use Amazon Corretto.
  • August 16, 2021: For functions that have not been updated since June 28, AWS will begin an automatic transition to the new Corretto runtime.
  • September 10, 2021: Migration completed.

These changes are only applied to functions not using the arn:aws:lambda:::awslayer:Java8Corretto or arn:aws:lambda:::awslayer:Java8OpenJDK layers described below.

Which of my Lambda functions are affected?

Lambda supports two versions of the Java 8 managed runtime: the java8 runtime, which runs on Amazon Linux 1, and the java8.al2 runtime, which runs on Amazon Linux 2. This change only affects functions using the java8 runtime. Functions the java8.al2 runtime are already using the Amazon Corretto implementation of Java 8 and are not affected.

The following command shows how to use the AWS CLI to list all functions in a specific Region using the java8 runtime. To find all such functions in your account, repeat this command for each Region:

aws lambda list-functions --function-version ALL --region us-east-1 --output text --query "Functions[?Runtime=='java8'].FunctionArn"

What do I need to do?

If you are using the java8 runtime, your functions will be updated automatically. For production workloads, we recommend that you test functions in advance for compatibility with Amazon Corretto 8.

For Lambda functions using container images, the existing public.ecr.aws/lambda/java:8 container base image will be updated to use the Amazon Corretto Java implementation. You must manually update your functions to use the updated container base image.

How can I test for compatibility with Amazon Corretto 8?

If you are using the java8 managed runtime, you can test functions with the new version of the runtime by adding the layer reference arn:aws:lambda:::awslayer:Java8Corretto to the function configuration. This layer instructs the Lambda service to use the Amazon Corretto implementation of Java 8. It does not contain any data or code.

If you are using container images, update the JVM in your image to Amazon Corretto for testing. Here is an example Dockerfile:

FROM public.ecr.aws/lambda/java:8

# Update the JVM to the latest Corretto version
## Import the Corretto public key
rpm --import https://yum.corretto.aws/corretto.key

## Add the Corretto yum repository to the system list
curl -L -o /etc/yum.repos.d/corretto.repo https://yum.corretto.aws/corretto.repo

## Install the latest version of Corretto 8
yum install -y java-1.8.0-amazon-corretto-devel

# Copy function code and runtime dependencies from Gradle layout
COPY build/classes/java/main ${LAMBDA_TASK_ROOT}
COPY build/dependency/* ${LAMBDA_TASK_ROOT}/lib/

# Set the CMD to your handler
CMD [ "com.example.LambdaHandler::handleRequest" ]

Can I continue to use the OpenJDK version of Java 8?

You can continue to use the OpenJDK version of Java 8 by adding the layer reference arn:aws:lambda:::awslayer:Java8OpenJDK to the function configuration. This layer tells the Lambda service to use the OpenJDK implementation of Java 8. It does not contain any data or code.

This option gives you more time to address any code incompatibilities with Amazon Corretto 8. We do not recommend that you use this option to continue to use Lambda’s OpenJDK Java implementation in the long term. Following this migration, it will no longer receive bug fix and security updates. After addressing any compatibility issues, remove this layer reference so that the function uses the Lambda-Amazon Corretto managed implementation of Java 8.

What are the known differences between OpenJDK 8 and Amazon Corretto 8 in Lambda?

Amazon Corretto caches TCP sessions for longer than OpenJDK 8. Functions that create new connections (for example, new AWS SDK clients) on each invoke without closing them may experience an increase in memory usage. In the worst case, this could cause the function to consume all the available memory, which results in an invoke error and a subsequent cold start.

We recommend that you do not create AWS SDK clients in your function handler on every function invocation. Instead, create SDK clients outside the function handler as static objects that can be used by multiple invocations. For more information, see static initialization in the Lambda Operator Guide.

If you must use a new client on every invocation, make sure it is shut down at the end of every invocation. This avoids TCP session caches using unnecessary resources.

What if I need additional help?

Contact AWS Support, the AWS Lambda discussion forums, or your AWS account team if you have any questions or concerns.

For more serverless learning resources, visit Serverless Land.

Building serverless applications with streaming data: Part 2

Post Syndicated from James Beswick original https://aws.amazon.com/blogs/compute/building-serverless-applications-with-streaming-data-part-2/

Part 1 introduces the Alleycat application that allows bike racers to compete with each other virtually on home exercise bikes. I explain the application’s functionality, how to deploy to your AWS account, and provide an architectural review.

This series is about building serverless solutions in streaming data workloads. These are traditionally challenging to build, since data can be streamed from thousands or even millions of devices continuously.

In the example scenario, there are 40,000 users and up to 1,000 competitors may race at any given time. The workload must continuously ingest and buffer this data, then process and analyze the information to provide analytics and leaderboard content for the frontend application.

In this post, I focus on data ingestion. I compare the two different methods used in Alleycat, and discuss other approaches available. This post refers to Amazon Kinesis Data Streams, the AWS SDK, and AWS IoT Core in the solutions.

To set up the example, visit the GitHub repo and follow the instructions in the README.md file. Note that this walkthrough uses services that are not covered by the AWS Free Tier and incur cost.

Using AWS IoT Core to ingest streaming data

AWS IoT Core enables publish-subscribe capabilities for large numbers of client applications. Clients can send data to the backend using the AWS IoT Device SDK, which uses the MQTT standard for IoT messaging. After processing, the backend can publish aggregation and status messages back to the frontend via AWS IoT Core. This service fans out the messages to clients using topics.

When using this approach, note the Quality of Service (QoS) options available. By default, the SDK uses QoS level 0, which means the device does not confirm the message is received. This is intended for workloads that can lose messages occasionally without impacting performance. In Alleycat, if performance metrics are sometimes lost, this does not likely impact the overall end user experience.

For workloads requiring higher reliability, use QoS level 1, which causes the SDK to resend the message until an acknowledgement is received. While there is no additional charge for using QoS level 1, it generally increases the number of messages, which increases the overall cost. You are not charged for the PUBACK acknowledgement message – for more details, read more about AWS IoT Core pricing.

Frontend

In this scenario, the Alleycat frontend application is running on a physical exercise bike. The user selects a racer ID and exercise class and chooses Start Race to join the current virtual race for that class.

Start race UI

Every second, the frontend sends a message containing the cadence and resistance metrics and the current second in the race for the local racer. This message is created as a JSON object in the Home.vue component and sent to the ‘alleycat-publish’ topic:

      const message = {
        uuid: uuidv4(),
        event: this.event,
        deviceTimestamp: Date.now(),
        second: this.currentSecond,
        raceId: RACE_ID,
        name: this.racer.name,
        racerId: this.racer.id,
        classId: this.selectedClassId,
        cadence: this.racer.getCurrentCadence(),
        resistance: this.racer.getCurrentResistance
      }

The IoT.vue component contains the logic for this integration and uses the AWS IoT Device SDK to send and receive messages. On startup, the frontend connects to AWS IoT Core and publishes the messages using an MQTT client:

    bus.$on('publish', (data) => {
      console.log('Publish: ', data)
      mqttClient.publish(topics.publish, JSON.stringify(data))
    })

The SDK automatically attempts to retry in the event of a network disconnection and exposes an error handler to allow custom logic if other errors occur.

Backend

The resources used in the backend are defined using the AWS Serverless Application Model (AWS SAM) and configured in the core setup templates:

Reference architecture

Messages are published to topics in AWS IoT Core, which act as channels of interest. The message broker uses topic names and topic filters to route messages between publishers and subscribers. Incoming messages are routed using rules. Alleycat’s IoT rule routes all incoming messages to a Kinesis stream:

  IotTopicRule:
    Type: AWS::IoT::TopicRule
    Properties:
      RuleName: 'alleycatIngest'
      TopicRulePayload:
        RuleDisabled: 'false'
        Sql: "SELECT * FROM 'alleycat-publish'"
        Actions:
        - Kinesis:
            StreamName: 'alleycat'
            PartitionKey: "${timestamp()}"
            RoleArn: !GetAtt IoTKinesisRole.Arn

  IoTKinesisRole:
    Type: AWS::IAM::Role
    Properties:
      AssumeRolePolicyDocument:
        Version: "2012-10-17"
        Statement:
          - Effect: Allow
            Principal:
              Service:
                - iot.amazonaws.com
            Action:
              - 'sts:AssumeRole'
      Path: /
      Policies:
        - PolicyName: IoTKinesisPutPolicy
          PolicyDocument:
            Version: "2012-10-17"
            Statement:
              - Effect: Allow
                Action: 'kinesis:PutRecord'
                Resource: !GetAtt KinesisStream.Arn

Using the AWS::IoT::TopicRule resource, you can optionally define an error action. This allows you to store messages in a durable location, such as an Amazon S3 bucket, if an error occurs. Errors can occur if a rule does not have permission to access a destination or throttling occurs in a target.

Rules can route matching messages to up to 10 targets. For debugging purposes, you can also enable Amazon CloudWatch Logs, which can help in troubleshoot failed message deliveries. The AWS IoT Core Message Broker allows up to 20,000 publish requests per second – if you need a higher limit for your workload, submit a request to AWS Support.

Using the AWS SDK to ingest streaming data

The Alleycat frontend creates traffic for a single user but there is also a simulator application that can generate messages for up to 1,000 riders. Instead of routing messages using an MQTT client, the simulator uses the AWS SDK to put messages directly into the Kinesis data stream.

The SDK provides a service interface object for Kinesis and two API methods for putting messages into streams: putRecord and putRecords. The first option accepts only a single message but the second enables batching of up to 500 messages per request. This is the preferred option for adding multiple messages, compared with calling putRecord multiple times.

The putRecords API takes parameters as a JSON array of messages:

const params = {
   StreamName: 'alley-cat',
   [{
      "Data":"{\"event\":\"update\",\"deviceTimestamp\":1620824038331,\"second\":3,\"raceId\":5402746,\"name\":\"Hayden\",\"racerId\":0,\"classId\":1,\"cadence\":79.8,\"resistance\":79}",
      "PartitionKey":"1620824038331"
   },
   {
      "Data":"{\"event\":\"update\",\"deviceTimestamp\":1620824038331,\"second\":3,\"raceId\":5402746,\"name\":\"Hubert\",\"racerId\":1,\"classId\":1,\"cadence\":60.4,\"resistance\":60.6}",
      "PartitionKey":"1620824038331"
   }
]}

The SDK automatically base64 encodes the Data attribute, which in this case is the JSON string output from JSON.stringify. In the JavaScript SDK, the putRecords API can return a promise, allowing the code to await the operation:

const result = await kinesis.putRecords(params).promise()

Shards and partition keys

Kinesis data streams consist of one or more shards, which are sequences of data records with a fixed capacity. Each shard can support up to 1,000 records per second for writes, up to maximum total data write rate of 1MB per second. The total capacity of a stream is the total of its shards.

When you send messages to a stream, the partitionKey attribute determines which shard it is routed to. The example application configures a Kinesis data stream with a single shard so the partitionKey attribute has no effect – all messages are routed to the same shard. However, many production applications have more than one shard and use the partitionKey to assign messages to shards.

The partitionKey is hashed by the Kinesis service to route to a shard. This diagram shows how partitionKey values from data producers are hashed by an MD5 function and mapped to individual shards:

MD5 hash process

While you cannot designate a specific shard ID in a message, you can influence the assignment depending on your choice of partitionKey:

  • Random: Using a randomized value results in random hash so messages are randomly sent to different shards. This effectively load balances messages across all available shards.
  • Time-based: A timestamp value may cause groups of messages sent to a single shard, if the messages arrive at the same time. The identical timestamp results in an identical hash.
  • Application-specific: if Alleycat used the classID as a partitionKey, racers in each class would always be routed to the same shard. This could be useful for downstream aggregation logic but would limit the capacity of messages per classID.

Optimizing capacity in a shard

Each shard can ingest data at a rate of 1 MB per second or 1,000 records per second, whichever limit is reached first. Since the payload maximum is 1MB, this could equate to one 1MB message per second. If the payload is larger, you must divide it into smaller pieces to avoid an error. For 1,000 messages, each payload must be under 1 KB on average to fit within the allowed capacity.

The combination of the two payload limits can result in different capacity profiles for a shard:

Capacity profiles in a shard

  1. The data payloads are evenly sized and use the 1 MB per second capacity.
  2. Data payload sizes vary, so the number of messages that can be packed into 1 MB varies per second.
  3. There are a large number of very messages, consuming all 1,000 messages per second. However, the total data capacity used is significantly less than 1 MB.

In the Alleycat application, the average payload size is around 170 bytes. When producing 1,000 messages a second, the workload is only using about 20% of the 1 MB per second limit. Since PUT payload size is a factor in Kinesis pricing, messages that are much smaller than 25 KB are less cost-efficient. Compare these two messaging patterns for the Alleycat application:

Producer message patterns

  1. In this default mode, a smaller message is published once per second. This reduces overall latency but results in higher overall messaging cost.
  2. The client application batches outgoing messages and sends to Kinesis every 5 seconds. This results in lower cost and better packing of messages, but introduces additional latency.

There is a tradeoff between cost and latency when optimizing a shard’s capacity and the decision depends upon the needs of your workload. If the client buffers messages, this adds latency on the client side. This is acceptable in many workloads that collect metrics for archival or asynchronous reporting purchases. However, for low-latency applications like Alleycat, it provides a better experience for the application user to send messages as soon as they are available.

Conclusion

This post focuses on ingesting data into Kinesis Data Streams. I explain the two approaches used by the Alleycat frontend and the simulator application and highlight other approaches that you can use. I show how messages are routed to shards using partition keys. Finally, I explore additional factors to consider when ingesting data, to improve efficiency and reduce cost.

Part 3 covers using Amazon Kinesis Data Firehose for transforming, aggregating, and loading streaming data into data stores. This is used to provide the historical, second-by-second leaderboard for the frontend application.

For more serverless learning resources, visit Serverless Land.

Getting Started with serverless for developers: Part 4 – Local developer workflow

Post Syndicated from Benjamin Smith original https://aws.amazon.com/blogs/compute/getting-started-with-serverless-for-developers-part-4-local-developer-workflow/

This blog is part 4 of the “Getting started with serverless for developers” series, helping developers start building serverless applications from their IDE.

Many “getting started” guides demonstrate how to build serverless applications from within the AWS Management Console. However, most developers spend the majority of their time building from within their local integrated development environment (IDE).

The next two blog posts in this series focus on the serverless developer workflow. They describe how to check logs, test, and iterate on business logic while building locally, and how this differs from traditional applications.

This blog post explains how the developer workflow for building serverless applications differs from a traditional developer workflow. It shows the methods that I use to test business logic locally before deploying to a sandbox AWS developer account, and how to test against cloud services as you build. This eliminates the need to deploy to the AWS Cloud each time you want to test a code change.

Traditional developer workflow

Developers typically use the following workflow cycle before committing code to the main branch:

  1. Write code.
  2. Save code.
  3. Run code.
  4. Check results.

This is sometimes referred to as the inner loop, shown as follows:

With traditional (non-serverless) applications, developers commonly create a development environment on their local machine. This local development environment keeps parity with the staging and production environments. It allows developers to test their application locally end-to-end before committing code to the main branch.

Serverless developer workflow

Part 2: the business logic, explains how serverless applications use managed services that abstract away the need for developers to patch and scale their application infrastructure. This means that the code base in a serverless application is focused purely on business logic, allowing managed services to handle other important layers such as:

  • Authorization
  • Presentation
  • Database
  • Application integration
  • Notification

A good serverless developer workflow enables developers to test and iterate on business logic quickly. It allows them to check that the business logic runs correctly with the managed services that compose an application.

To achieve this, the best approach is not to try and emulate managed services on your local development machine. Instead, your local code should interact directly with real cloud services in a sandboxed AWS account.

This approach lets you rapidly test and iterate on business logic locally, deploying to the development environment to test for infrastructure, security, and environment configuration changes. Once the business logic is ready in the development environment, it can be deployed to other environments (test, staging, production) via CI/CD automation or manually triggered commands.

The following sections explain how I test business logic locally using a custom-written test harness. Each time I create a Lambda function I create a directory to hold:

  1. The function code.
  2. A relative package.json.
  3. A file called testharness.js.

The test harness file is used to run the Lambda function code on my local development machine. It is configured to mock environment variables loaded from a file named `env.json` and loads a JSON test event payload located in the events directory.

Testing Lambda function code locally with a test harness

Part 2: the business logic, explains the anatomy of a Lambda function and its handler:

A small Lambda function

Note that the function handler receives an input payload called an event object. To test the local function code effectively, use a test event object that represents the production event object.

The serverless application introduced in getting started with serverless part 1, shows that Amazon API Gateway invokes the Lambda function.

This invocation contains an event object with a JSON representation of the HTTP request. The event object has a defined structure. Follow the steps in this GitHub repository to see how to create a test event object.

Before you start

To deploy this stage of the application, follow the steps from post 1 to clone and deploy the sample application.

  1. Run the following commands from the root directory of the cloned repository:
    cd ./part_4/src_starred
    npm install

The following steps show how I configure my testharness.js file to run my function code:

// Mock event
const event = require('../events/testEvent.json')
// Mock environment variables
const environmentVars = require('../env.json')
process.env.AWS_REGION = environmentVars.AWS_REGION
process.env.localTest = true
process.env.slackEndpoint= environmentVars.slackEndpoint
process.env.bucket = environmentVars.bucket
// Lambda handler
const { handler } = require('./app')
const main = async () => {
  console.time('localTest')
  console.dir(await handler(event))
  console.timeEnd('localTest')
}
main().catch(error => console.error(error))
  1. A test event object is loaded into a variable called event.
  2. The environment variables required by the Lambda function are defined in env.json and loaded.
  3. The Lambda function code is loaded into a variable called handler
  4. The Lambda function code is run synchronously
  5. The console shows output from the Lambda function code, along with any errors that occur.

I run my test harness file by entering the following command in a terminal window:

$ node testharness.js

This produces the following output:

The output indicates that the function code ran without error, it returned a 200 status code and completed in 30.999 ms.

To generate an error in the function code,  I change the app.js file by commenting out the following line:

//const axios = require('axios');

I save the file and run the test harness again. I see the following response in the terminal window:

f

This indicates an error in my function code that I must resolve before deploying to my AWS account.

By iteratively updating and locally testing my code, I maintain a fast inner loop. This eliminates the need to deploy to the AWS Cloud each time I want to test a code change.

Testing against cloud resources

In many instances, a Lambda function interacts with other cloud resources. This could be via an SDK or some other native integration. In this case, you should deploy those resources to a sandboxed AWS developer account.

In the following example, I update a Lambda function to log each inbound HTTP request to a bucket in Amazon S3, a highly scalable object storage service running in the AWS cloud. To do this, I use the JavaScript SDK:

s3.putObject(params, function(err, data)

I update the AWS Serverless Application Model (AWS SAM) template to define a new S3 bucket:

SrcBucket:
Type: AWS::S3::Bucket

I change into the part_4 directory then build and deploy the application with the following commands:

cd ../part_4
sam build
sam deploy --guided --config-file ../samconfig.toml

After deploying, the output shows:

I copy the new bucket value to the environment variable defined in in /part_4/env.json .

"slackEndpoint": "Insert_Slack_Endpoint",
"bucket" : "Insert_S3_Bucket_Name"
}

Now I am ready to test the local Lambda function code against cloud resources in my sandbox AWS development account. I run a new local test with the following command:

node testHarness.js

The terminal returns:

This indicates that the Lambda function code completed without error. I can verify this by checking the contents of the S3 bucket using the AWS Command Line Interface (AWS CLI):

aws s3 ls s3://githubtoslackapp-srcbucket-ge4wkt9dljwa

This returns the following, confirming that the request object has been saved to S3 and the application code is running correctly:

Conclusion

Using managed services to build serverless applications helps developers focus on business logic. It also changes the developer workflow compared with building traditional (non-serverless) applications.

A good serverless developer workflow enables developers to test and iterate on business logic quickly while still being able to interact with cloud services. This blog post shows how I achieve this by using a test harness to run function code locally and deploying application resources to a sandboxed developer account.

In the next blog post, I show how to invoke Lambda functions deployed to sandboxed developer account, without leaving your IDE. This lets you test for infrastructure, security, and environment configuration changes while building.

Forwarding emails automatically based on content with Amazon Simple Email Service

Post Syndicated from Murat Balkan original https://aws.amazon.com/blogs/messaging-and-targeting/forwarding-emails-automatically-based-on-content-with-amazon-simple-email-service/

Introduction

Email is one of the most popular channels consumers use to interact with support organizations. In its most basic form, consumers will send their email to a catch-all email address where it is further dispatched to the correct support group. Often, this requires a person to inspect content manually. Some IT organizations even have a dedicated support group that handles triaging the incoming emails before assigning them to specialized support teams. Triaging each email can be challenging, and delays in email routing and support processes can reduce customer satisfaction. By utilizing Amazon Simple Email Service’s deep integration with Amazon S3, AWS Lambda, and other AWS services, the task of categorizing and routing emails is automated. This automation results in increased operational efficiencies and reduced costs.

This blog post shows you how a serverless application will receive emails with Amazon SES and deliver them to an Amazon S3 bucket. The application uses Amazon Comprehend to identify the dominant language from the message body.  It then looks it up in an Amazon DynamoDB table to find the support group’s email address specializing in the email subject. As the last step, it forwards the email via Amazon SES to its destination. Archiving incoming emails to Amazon S3 also enables further processing or auditing.

Architecture

By completing the steps in this post, you will create a system that uses the architecture illustrated in the following image:

Architecture showing how to forward emails by content using Amazon SES

The flow of events starts when a customer sends an email to the generic support email address like [email protected]. This email is listened to by Amazon SES via a recipient rule. As per the rule, incoming messages are written to a specified Amazon S3 bucket with a given prefix.

This bucket and prefix are configured with S3 Events to trigger a Lambda function on object creation events. The Lambda function reads the email object, parses the contents, and sends them to Amazon Comprehend for language detection.

Amazon DynamoDB looks up the detected language code from an Amazon DynamoDB table, which includes the mappings between language codes and support group email addresses for these languages. One support group could answer English emails, while another support group answers French emails. The Lambda function determines the destination address and re-sends the same email address by performing an email forward operation. Suppose the lookup does not return any destination address, or the language was not be detected. In that case, the email is forwarded to a catch-all email address specified during the application deployment.

In this example, Amazon SES hosts the destination email addresses used for forwarding, but this is not a requirement. External email servers will also receive the forwarded emails.

Prerequisites

To use Amazon SES for receiving email messages, you need to verify a domain that you own. Refer to the documentation to verify your domain with Amazon SES console. If you do not have a domain name, you will register one from Amazon Route 53.

Deploying the Sample Application

Clone this GitHub repository to your local machine and install and configure AWS SAM with a test AWS Identity and Access Management (IAM) user.

You will use AWS SAM to deploy the remaining parts of this serverless architecture.

The AWS SAM template creates the following resources:

  • An Amazon DynamoDB mapping table (language-lookup) contains information about language codes and associates them with destination email addresses.
  • An AWS Lambda function (BlogEmailForwarder) that reads the email content parses it, detects the language, looks up the forwarding destination email address, and sends it.
  • An Amazon S3 bucket, which will store the incoming emails.
  • IAM roles and policies.

To start the AWS SAM deployment, navigate to the root directory of the repository you downloaded and where the template.yaml AWS SAM template resides. AWS SAM also requires you to specify an Amazon Simple Storage Service (Amazon S3) bucket to hold the deployment artifacts. If you haven’t already created a bucket for this purpose, create one now. You will refer to the documentation to learn how to create an Amazon S3 bucket. The bucket should have read and write access by an AWS Identity and Access Management (IAM) user.

At the command line, enter the following command to package the application:

sam package --template template.yaml --output-template-file output_template.yaml --s3-bucket BUCKET_NAME_HERE

In the preceding command, replace BUCKET_NAME_HERE with the name of the Amazon S3 bucket that should hold the deployment artifacts.

AWS SAM packages the application and copies it into this Amazon S3 bucket.

When the AWS SAM package command finishes running, enter the following command to deploy the package:

sam deploy --template-file output_template.yaml --stack-name blogstack --capabilities CAPABILITY_IAM --parameter-overrides FromEmailAddress=info@ YOUR_DOMAIN_NAME_HERE CatchAllEmailAddress=catchall@ YOUR_DOMAIN_NAME_HERE

In the preceding command, change the YOUR_DOMAIN_NAME_HERE with the domain name you validated with Amazon SES. This domain also applies to other commands and configurations that will be introduced later.

This example uses “blogstack” as the stack name, you will change this to any other name you want. When you run this command, AWS SAM shows the progress of the deployment.

Configure the Sample Application

Now that you have deployed the application, you will configure it.

Configuring Receipt Rules

To deliver incoming messages to Amazon S3 bucket, you need to create a Rule Set and a Receipt rule under it.

Note: This blog uses Amazon SES console to create the rule sets. To create the rule sets with AWS CloudFormation, refer to the documentation.

  1. Navigate to the Amazon SES console. From the left navigation choose Rule Sets.
  2. Choose Create a Receipt Rule button at the right pane.
  3. Add info@YOUR_DOMAIN_NAME_HERE as the first recipient addresses by entering it into the text box and choosing Add Recipient.


Choose the Next Step button to move on to the next step.

  1. On the Actions page, select S3 from the Add action drop-down to reveal S3 action’s details. Select the S3 bucket that was created by the AWS SAM template. It is in the format of your_stack_name-inboxbucket-randomstring. You will find the exact name in the outputs section of the AWS SAM deployment under the key name InboxBucket or by visiting the AWS CloudFormation console. Set the Object key prefix to info/. This tells Amazon SES to add this prefix to all messages destined to this recipient address. This way, you will re-use the same bucket for different recipients.

Choose the Next Step button to move on to the next step.

In the Rule Details page, give this rule a name at the Rule name field. This example uses the name info-recipient-rule. Leave the rest of the fields with their default values.

Choose the Next Step button to move on to the next step.

  1. Review your settings on the Review page and finalize rule creation by choosing Create Rule

  1. In this example, you will be hosting the destination email addresses in Amazon SES rather than forwarding the messages to an external email server. This way, you will be able to see the forwarded messages in your Amazon S3 bucket under different prefixes. To host the destination email addresses, you need to create different rules under the default rule set. Create three additional rules for catchall@YOUR_DOMAIN_NAME_HERE , english@ YOUR_DOMAIN_NAME_HERE and french@YOUR_DOMAIN_NAME_HERE email addresses by repeating the steps 2 to 5. For Amazon S3 prefixes, use catchall/, english/, and french/ respectively.


Configuring Amazon DynamoDB Table

To configure the Amazon DynamoDB table that is used by the sample application

  1. Navigate to Amazon DynamoDB console and reach the tables view. Inspect the table created by the AWS SAM application.

language-lookup table is the table where languages and their support group mappings are kept. You need to create an item for each language, and an item that will hold the default destination email address that will be used in case no language match is found. Amazon Comprehend supports more than 60 different languages. You will visit the documentation for the supported languages and add their language codes to this lookup table to enhance this application.

  1. To start inserting items, choose the language-lookup table to open table overview page.
  2. Select the Items tab and choose the Create item From the dropdown, select Text. Add the following JSON content and choose Save to create your first mapping object. While adding the following object, replace Destination attribute’s value with an email address you own. The email messages will be forwarded to that address.

{

  “language”: “en”,

  “destination”: “english@YOUR_DOMAIN_NAME_HERE”

}

Lastly, create an item for French language support.

{

  “language”: “fr”,

  “destination”: “french@YOUR_DOMAIN_NAME_HERE”

}

Testing

Now that the application is deployed and configured, you will test it.

  1. Use your favorite email client to send the following email to the domain name info@ email address.

Subject: I need help

Body:

Hello, I’d like to return the shoes I bought from your online store. How can I do this?

After the email is sent, navigate to the Amazon S3 console to inspect the contents of the Amazon S3 bucket that is backing the Amazon SES Rule Sets. You will also see the AWS Lambda logs from the Amazon CloudWatch console to confirm that the Lambda function is triggered and run successfully. You should receive an email with the same content at the address you defined for the English language.

  1. Next, send another email with the same content, this time in French language.

Subject: j’ai besoin d’aide

Body:

Bonjour, je souhaite retourner les chaussures que j’ai achetées dans votre boutique en ligne. Comment puis-je faire ceci?


Suppose a message is not matched to a language in the lookup table. In that case, the Lambda function will forward it to the catchall email address that you provided during the AWS SAM deployment.

You will inspect the new email objects under english/, french/ and catchall/ prefixes to observe the forwarding behavior.

Continue experimenting with the sample application by sending different email contents to info@ YOUR_DOMAIN_NAME_HERE address or adding other language codes and email address combinations into the mapping table. You will find the available languages and their codes in the documentation. When adding a new language support, don’t forget to associate a new email address and Amazon S3 bucket prefix by defining a new rule.

Cleanup

To clean up the resources you used in your account,

  1. Navigate to the Amazon S3 console and delete the inbox bucket’s contents. You will find the name of this bucket in the outputs section of the AWS SAM deployment under the key name InboxBucket or by visiting the AWS CloudFormation console.
  2. Navigate to AWS CloudFormation console and delete the stack named “blogstack”.
  3. After the stack is deleted, remove the domain from Amazon SES. To do this, navigate to the Amazon SES Console and choose Domains from the left navigation. Select the domain you want to remove and choose Remove button to remove it from Amazon SES.
  4. From the Amazon SES Console, navigate to the Rule Sets from the left navigation. On the Active Rule Set section, choose View Active Rule Set button and delete all the rules you have created, by selecting the rule and choosing Action, Delete.
  5. On the Rule Sets page choose Disable Active Rule Set button to disable listening for incoming email messages.
  6. On the Rule Sets page, Inactive Rule Sets section, delete the only rule set, by selecting the rule set and choosing Action, Delete.
  7. Navigate to CloudWatch console and from the left navigation choose Logs, Log groups. Find the log group that belongs to the BlogEmailForwarderFunction resource and delete it by selecting it and choosing Actions, Delete log group(s).
  8. You will also delete the Amazon S3 bucket you used for packaging and deploying the AWS SAM application.


Conclusion

This solution shows how to use Amazon SES to classify email messages by the dominant content language and forward them to respective support groups. You will use the same techniques to implement similar scenarios. You will forward emails based on custom key entities, like product codes, or you will remove PII information from emails before forwarding with Amazon Comprehend.

With its native integrations with AWS services, Amazon SES allows you to enhance your email applications with different AWS Cloud capabilities easily.

To learn more about email forwarding with Amazon SES, you will visit documentation and AWS blogs.

Using API destinations with Amazon EventBridge

Post Syndicated from James Beswick original https://aws.amazon.com/blogs/compute/using-api-destinations-with-amazon-eventbridge/

Amazon EventBridge enables developers to route events between AWS services, integrated software as a service (SaaS) applications, and your own applications. It can help decouple applications and produce more extensible, maintainable architectures. With the new API destinations feature, EventBridge can now integrate with services outside of AWS using REST API calls.

API destinations architecture

This feature enables developers to route events to existing SaaS providers that integrate with EventBridge, like Zendesk, PagerDuty, TriggerMesh, or MongoDB. Additionally, you can use other SaaS endpoints for applications like Slack or Contentful, or any other type of API or webhook. It can also provide an easier way to ingest data from serverless workloads into Splunk without needing to modify application code or install agents.

This blog post explains how to use API destinations and walks through integration examples you can use in your workloads.

How it works

API destinations are third-party targets outside of AWS that you can invoke with an HTTP request. EventBridge invokes the HTTP endpoint and delivers the event as a payload within the request. You can use any preferred HTTP method, such as GET or POST. You can use input transformers to change the payload format to match your target.

An API destination uses a Connection to manage the authentication credentials for a target. This defines the authorization type used, which can be an API key, OAuth client credentials grant, or a basic user name and password.

Connection details

The service manages the secret in AWS Secrets Manager and the cost of storing the secret is included in the pricing for API destinations.

You create a connection to each different external API endpoint and share the connection with multiple endpoints. The API destinations console shows all configured connections, together with their authorization status. Any connections that cannot be established are shown here:

Connections list

To create an API destination, you provide a name, the HTTP endpoint and method, and the connection:

Create API destination

When you configure the destination, you must also set an invocation rate limit between 1 and 300 events per second. This helps protect the downstream endpoint from surges in traffic. If the number of arriving events exceeds the limit, the EventBridge service queues up events. It delivers to the endpoint as quickly as possible within the rate limit.

It continues to do this for 24 hours. To make sure you retain any events that cannot be delivered, set up a dead-letter queue on the event bus. This ensures that if the event is not delivered within this timeframe, it is stored durably in an Amazon SQS queue for further processing. This can also be useful if the downstream API experiences an outage for extended periods of time.

Throttling and retries

Once you have configured the API destination, it becomes available in the list of targets for rules. Matching events are sent to the HTTP endpoint with the event serialized as part of the payload.

Select targets

As with API Gateway targets in EventBridge, the maximum timeout for API destination is 5 seconds. If an API call exceeds this timeout, it is retried.

Debugging the payload from API destinations

You can send an event via API Destinations to debugging tools like Webhook.site to view the headers and payload of the API call:

  1. Create a connection with the credential, such as an API key.Connection details
  2. Create an API destination with the webhook URL endpoint and then create a rule to match and route events.Target configuration
  3. The Webhook.site testing service shows the headers and payload once the webhook is triggered. This can help you test rules if you are adding headers or manipulating the payload using an input transformer.Webhook.site testing service

Customizing the payload

Third-party APIs often require custom headers or payload formats when accepting data. EventBridge rules allow you to customize header parameters, query strings, and payload formats without the need for custom code. Header parameters and query strings can be configured with static values or attributes from the event:

Header parameters

To customize the payload, configure an input transformer, which consists of an Input Path and Input template. You use an Input Path to define variables and use JSONPath query syntax to identify the variable source in the event. For example, to extract two attributes from an Amazon S3 PutObject event, the Input Path is:

{
  "key" : "$.[0].s3.object.key", 
  "bucket" : " $.[0].s3.bucket.name "
}

Next, the Input template defines the structure of the data passed to the target, which references the variables. With this release you can now use variables inside quotes in the input transformer. As a result, you can pass these values as a string or JSON, for example:

{
  "filename" : "<key>", 
  "container" : "mycontainer-<bucket>"
}

Sending AWS events to DataDog

Using API destinations, you can send any AWS-sourced event to third-party services like DataDog. This approach uses the DataDog API to put data into the service. To do this, you must sign up for an account and create an API key. In this example, I send S3 events via CloudTrail to DataDog for further analysis.

  1. Navigate to the EventBridge console, select API destinations from the menu.
  2. Select the Connections tab and choose Create connection:Connections UI
  3. Enter a connection name, then select API Key for Authorization Type. Enter the API key name DD-API-KEY and paste your secret API key as the value. Choose Create.Create new connection UI
  4. In the API destinations tab, choose Create API destination.Create API destination UI
  5. Enter a name, set the API destination endpoint to https://http-intake.logs.datadoghq.com/v1/input, and the HTTP method to POST. Enter 300 for Invocation rate limit and select the DataDog connection from the dropdown. Choose Create.API destination detail UI
  6. From the EventBridge console, select Rules and choose Create rule. Enter a name, select the default bus, and enter this event pattern:
    {
      "source": ["aws.s3"]
    }
  7. In Select targets, choose API destination and select DataDog for the API destination. Expand, Configure Input.
  8. In the Input transformer section, enter {"detail":"$.detail"} in the Input Path field and enter {"message": <detail>} in the Input Template.Select targets UI
  9. You can optionally add a dead letter queue. To do this, open the Retry policy and dead-letter queue section. Under Dead-letter queue, select an existing SQS queue.
    Retry policy and DLQ
  10. Choose Create.
  11. Open AWS CloudShell and upload an object to an S3 bucket in your account to trigger an event:
    echo "test" > testfile.txt
    aws s3 cp testfile.txt s3://YOUR_BUCKET_NAME

    CloudShell output

  12. The logs appear in the DataDog Logs console, where you can process the raw data for further analysis:Datadog Logs console

Sending AWS events to Zendesk

Zendesk is a SaaS provider that provides customer support solutions. It can already send events to EventBridge using a partner integration. This post shows how you can consume ticket events from Zendesk and run a sentiment analysis using Amazon Comprehend.

With API destinations, you can now use events to call the Zendesk API to create and modify tickets and interact with chats and customer profiles.

To create an API destination for Zendesk:

  1. Log in with an existing Zendesk account or register for a trial account.
  2. Navigate to the EventBridge console, select API destinations from the menu and choose Create API destination.
  3. On the Create API destination, page:
    1. Enter a name for the destination (e.g. “SendToZendesk”).
    2. For API destination endpoint, enter https://<<your-subdomain>>.zendesk.com/api/v2/tickets.json.
    3. For HTTP method, select POST.
    4. For Invocation rate, enter 10.
  4. In the connection section:
    1. Select the Create a new connection radio button.
    2. For Connection name, enter ZendeskConnection.
    3. For Authorization type, select Basic (Username/Password).
    4. Enter your Zendesk username and password.
  5. Choose Create.
    Connection configuration with basic auth

When you create a rule to route to this API destination, use the Input transformer to build the defined JSON payload, as shown in the previous DataDog example. When an event matches the rule, EventBridge calls the Zendesk Create Ticket API. The new ticket appears in the Zendesk dashboard:

Zendesk dashboard

For more information on the Zendesk API, visit the Zendesk Developer Portal.

Building an integration with AWS CloudFormation and AWS SAM

To support this new feature, there are two new AWS CloudFormation resources available. These can also be used in AWS Serverless Application Model (AWS SAM) templates:

The connection resource defines the connection credential and optional invocation HTTP parameters:

Resources:
  TestConnection:
    Type: AWS::Events::Connection
    Properties:
      AuthorizationType: API_KEY
      Description: 'My connection with an API key'
      AuthParameters:
        ApiKeyAuthParameters:
          ApiKeyName: VHS
          ApiKeyValue: Testing
        InvocationHttpParameters:
          BodyParameters:
          - Key: 'my-integration-key'
            Value: 'ABCDEFGH0123456'

Outputs:
  TestConnectionName:
    Value: !Ref TestConnection
  TestConnectionArn:
    Value: !GetAtt TestConnection.Arn

The API destination resource provides the connection, endpoint, HTTP method, and invocation limit:

Resources:
  TestApiDestination:
    Type: AWS::Events::ApiDestination
    Properties:
      Name: 'datadog-target'
      ConnectionArn: arn:aws:events:us-east-1:123456789012:connection/datadogConnection/2
      InvocationEndpoint: 'https://http-intake.logs.datadoghq.com/v1/input'
      HttpMethod: POST
      InvocationRateLimitPerSecond: 300

Outputs:
  TestApiDestinationName:
    Value: !Ref TestApiDestination
  TestApiDestinationArn:
    Value: !GetAtt TestApiDestination.Arn
  TestApiDestinationSecretArn:
    Value: !GetAtt TestApiDestination.SecretArn

You can use the existing AWS::Events::Rule resource to configure an input transformer for API destination targets:

ApiDestinationDeliveryRule:
  Type: AWS::Events::Rule
  Properties:
    EventPattern:
      source:
        - "EventsForMyAPIdestination"
    State: "ENABLED"
    Targets:
      -
        Arn: !Ref TestApiDestinationArn
        InputTransformer:
          InputPathsMap:
            detail: $.detail
          InputTemplate: >
            {
                    "message": <detail>
            }

Conclusion

The API destinations feature of EventBridge enables developers to integrate workloads with third-party applications using REST API calls. This provides an easier way to build decoupled, extensible applications that work with applications outside of the AWS Cloud.

To use this feature, you configure a connection and an API destination. You can use API destinations in the same way as existing targets for rules, and also customize headers, query strings, and payloads in the API call.

Learn more about using API destinations with the following SaaS providers: DatadogFreshworks, MongoDB, TriggerMesh, and Zendesk.

For more serverless learning resources, visit Serverless Land.

Analyzing Freshdesk data using Amazon EventBridge and Amazon Athena

Post Syndicated from Benjamin Smith original https://aws.amazon.com/blogs/compute/analyzing-freshdesk-data-using-amazon-eventbridge-and-amazon-athena/

This post is written by Shashi Shankar, Application Architect, Shared Delivery Teams

Freshdesk is an omnichannel customer service platform by Freshworks. It provides automation services to help speed up customer support processes.

The Freshworks connector to Amazon EventBridge allows real time streaming of Freshdesk events with minimal configuration and setup. This integration provides real-time insights into customer support operations without the operational overhead of provisioning and maintaining any servers.

In this blog post, I walk through a serverless approach to ingest and analyze Freshdesk data. This solution uses EventBridge, Amazon Kinesis Data Firehose, Amazon S3, and Amazon Athena. I also look at examples of customer service questions that can be answered using this approach.

The following diagram shows a high-level architecture of the proposed solution:

  1. When a Freshdesk ticket is updated or created, the Freshworks connector pushes event data to the Amazon EventBridge partner event bus.
  2. A rule on the partner event bus pushes the event data to Kinesis Data Firehose.
  3. Kinesis Data Firehose batches data before sending to S3. An AWS Lambda function transforms the data by adding a new line to each record before sending.
  4. Kinesis Data Firehose delivers the batch of records to S3.
  5. Athena is used to query relevant data from S3 using standard SQL.

The walkthrough shows you how to:

  1. Add the EventBridge app to Freshdesk account.
  2. Configure a Freshworks partner event bus in EventBridge.
  3. Deploy a Kinesis Data Firehose stream, a Lambda function, and an S3 bucket.
  4. Set up a custom rule on the event bus to push data to Kinesis Data Firehose.
  5. Generate sample Freshdesk data to validate the ingestion process.
  6. Set up a table in Athena to query the S3 bucket.
  7. Query and analyze data

Pre-requisites

  • A Freshdesk account (which can be created here).
  • An AWS account.
  • AWS Serverless Application Model (AWS SAM CLI), installed and configured.

Adding the Amazon EventBridge app to a Freshdesk account

  1. Log in to your Freshdesk account and navigate to Admin Helpdesk Productivity Apps. Search for EventBridge:
  2. Choose the Amazon EventBridge icon and choose Install.
  • Enter your AWS account number in the AWS Account ID field.
  • Enter “OnTicketCreate”, “OnTicketUpdate” in the Events field.
  • Enter the AWS Region to send the Freshdesk events in the Region field. This walkthrough uses the us-east-1 Region.

Configuring a Freshworks partner event bus in EventBridge

Once previous step is completed, a partner event source is automatically created in the EventBridge console. Copy the partner event source name to a clipboard.

  1. Clone the GitHub repo and deploy the AWS SAM template:
    git clone https://github.com/aws-samples/amazon-eventbridge-freshdesk-example.git
    cd ./amazon-eventbridge-freshdesk-example
    sam deploy --guided
  2. PartnerEventSource – Enter partner event source name copied from the previous step.
  3. S3BucketName – Enter an S3 bucket name to store Freshdesk ticket event data.

The AWS SAM template creates an association between the partner event source and event bus:

    Type: AWS::Events::EventBus
    Properties:
      EventSourceName: !Ref PartnerEventSource
      Name: !Ref PartnerEventSource

The template creates a Kinesis Data Firehose delivery stream, Lambda function, and S3 bucket to process and store the events from Freshdesk tickets. It also adds a rule to the custom event bus with the Kinesis Data Firehose stream as the target:

  PushToFirehoseRule:
    Type: "AWS::Events::Rule"
    Properties:
      Description: Test Freshdesk Events Rule
      EventBusName: !Ref PartnerEventSource
      EventPattern:
        account: [!Ref AWS::AccountId]
      Name: freshdeskeventrule
      State: ENABLED
      Targets:
        - Arn:
            Fn::GetAtt:
              - "FirehoseDeliveryStream"
              - "Arn"
          Id: "idfreshdeskeventrule"
          RoleArn: !GetAtt EventRuleTargetIamRole.Arn

  EventRuleTargetIamRole:
    Type: AWS::IAM::Role
    Properties:
      AssumeRolePolicyDocument:
        Version: "2012-10-17"
        Statement:
          - Sid: ""
            Effect: "Allow"
            Principal:
              Service:
                - "events.amazonaws.com"
            Action:
              - "sts:AssumeRole"
      Path: "/"
      Policies:
        - PolicyName: Invoke_Firehose
          PolicyDocument:
            Version: "2012-10-17"
            Statement:
              - Effect: "Allow"
                Action:
                  - "firehose:PutRecord"
                  - "firehose:PutRecordBatch"
                Resource:
                  - !GetAtt FirehoseDeliveryStream.Arn

Generating sample Freshdesk data to validate the ingestion process:

To generate sample Freshdesk data, login to the Freshdesk account and browse to the “Tickets” screen as shown:

Follow the steps to simulate two customer service operations:

  1. To create a ticket of type “Refund”. Choose the New button and enter the details:
  2. Update an existing ticket and change the priority to “Urgent”.
  3. Within a few minutes of updating the ticket, the data is pushed via the Freshworks connector to the S3 bucket created using the AWS SAM template. To verify this, browse to the S3 bucket and see that a new object with the ticket data is created:

You can also use the S3 Select option under object actions to view the raw JSON data that is sent from the partner system. You are now ready to analyze the data using Athena.

Setting up a table in Athena to query the S3 bucket

If you are familiar with Apache Hive, you may find creating tables on Athena helpful. You can create tables by writing the DDL statement in the query editor or by using the wizard or JDBC driver. To create a table in Athena:

  1. Copy and paste the following DDL statement in the Athena query editor to create a Freshdesk’s events table. For this example, the table is created in the default database.
  2. Replace S3_Bucket_Name in the following query with the name of the S3 bucket created by deploying the previous AWS SAM template:
CREATE EXTERNAL TABLE ` freshdeskevents`(
  `id` string COMMENT 'from deserializer', 
  `detail-type` string COMMENT 'from deserializer', 
  `source` string COMMENT 'from deserializer', 
  `account` string COMMENT 'from deserializer', 
  `time` string COMMENT 'from deserializer', 
  `region` string COMMENT 'from deserializer', 
  `detail` struct<ticket:struct<subject:string,description:string,is_description_truncated:boolean,description_text:string,is_description_text_truncated:boolean,due_by:string,fr_due_by:string,fr_escalated:boolean,is_escalated:boolean,fwd_emails:array<string>,reply_cc_emails:array<string>,email_config_id:string,id:int,group_id:bigint,product_id:string,company_id:string,requester_id:bigint,responder_id:bigint,status:int,priority:int,type:string,tags:array<string>,spam:boolean,source:int,tweet_id:string,cc_emails:array<string>,to_emails:string,created_at:string,updated_at:string,attachments:array<string>,custom_fields:string,changes:struct<responder_id:array<bigint>,ticket_type:array<string>,status:array<int>,status_details:array<struct<id:int,name:string>>,group_id:array<bigint>>>,requester:struct<id:bigint,name:string,email:string,mobile:string,phone:string,language:string,created_at:string>> COMMENT 'from deserializer')
ROW FORMAT SERDE 
  'org.openx.data.jsonserde.JsonSerDe' 
WITH SERDEPROPERTIES ( 
  'paths'='account,detail,detail-type,id,region,resources,source,time,version') 
STORED AS INPUTFORMAT 
  'org.apache.hadoop.mapred.TextInputFormat' 
OUTPUTFORMAT 
  'org.apache.hadoop.hive.ql.io.HiveIgnoreKeyTextOutputFormat'
LOCATION  's3://S3_Bucket_Name/'

The table is created on the data stored in S3 and is ready to be queried. Note that table freshdeskevents points at the bucket s3://S3_Bucket_Name/. As more data is added to the bucket, the table automatically grows, providing a near-real-time data analysis experience.

Querying and analyzing data

You can use the following examples to get started with querying the Athena table.

  1. To get all the events data, run:
SELECT * FROM default.freshdeskevents  limit 10

The preceding output has a detail column containing the details related to the ticket. Tickets can be filtered on nested notations to build more insightful queries. Also, the detail-type column provides classification of tickets as new (onTicketCreate) vs updated (onTicketUpdate).

  1. To show new tickets created today with the type “Refund”:
SELECT detail.ticket.subject,detail.ticket.description_text, detail.ticket.type  FROM default.freshdeskevents
where detail.ticket.type = 'Refund' and "detail-type" = 'onTicketCreate' and date(from_iso8601_timestamp(time)) = date(current_date)
  1. All tickets with an “Urgent” priority but not assigned to an agent:
SELECT "detail-type", detail.ticket.responder_id,detail.ticket.priority, detail.ticket.subject, detail.ticket.type  FROM default.freshdeskevents
where detail.ticket.responder_id is null and detail.ticket.priority = 4

Conclusion

In this blog post, you learn how to configure Freshworks partner event source from the Freshdesk console. Once a partner event source is configured, an AWS SAM template is deployed that creates a custom event bus by attaching the partner event source. A Kinesis Data Firehose, Lambda function, and S3 bucket is used to ingest Freshdesk’s ticket events data for analysis. An EventBridge rule is configured to route the event data to the S3 bucket.

Once event data starts flowing into the S3 bucket, an Amazon Athena table is created to run queries and analyze the ticket events data. Alternative customer service data analysis use cases can be built on the architecture shown in this blog.

To learn more about other partner integrations and the native capabilities of EventBridge, visit the AWS Compute Blog.

Using AWS X-Ray tracing with Amazon EventBridge

Post Syndicated from James Beswick original https://aws.amazon.com/blogs/compute/using-aws-x-ray-tracing-with-amazon-eventbridge/

AWS X-Ray allows developers to debug and analyze distributed applications. It can be useful for tracing transactions through microservices architectures, such as those typically used in serverless applications. Amazon EventBridge allows you to route events between AWS services, integrated software as a service (SaaS) applications, and your own applications. EventBridge can help decouple applications and produce more extensible, maintainable architectures.

EventBridge now supports trace context propagation for X-Ray, which makes it easier to trace transactions through event-based architectures. This means you can potentially trace a single request from an event producer through to final processing by an event consumer. These may be decoupled application stacks where the consumer has no knowledge of how the event is produced.

This blog post explores how to use X-Ray with EventBridge and shows how to implement tracing using the example application in this GitHub repo.

How it works

X-Ray works by adding a trace header to requests, which acts as a unique identifier. In the case of a serverless application using multiple AWS services, this allows X-Ray to group service interactions together as a single trace. X-Ray can then produce a service map of the transaction flow or provide the raw data for a trace:

X-Ray service map

When you send events to EventBridge, the service uses rules to determine how the events are routed from the event bus to targets. Any event that is put on an event bus with the PutEvents API can now support trace context propagation.

The trace header is provided as internal metadata to support X-Ray tracing. The header itself is not available in the event when it’s delivered to a target. For developers using the EventBridge archive feature, this means that a trace ID is not available for replay. Similarly, it’s not available on events sent to a dead-letter queue (DLQ).

Enabling tracing with EventBridge

To enable tracing, you don’t need to change the event structure to add the trace header. Instead, you wrap the AWS SDK client in a call to AWSXRay.captureAWSClient and grant IAM permissions to allow tracing. This enables X-Ray to instrument the call automatically with the X-Amzn-Trace-Id header.

For code using the AWS SDK for JavaScript, this requires changes to the way that the EventBridge client is instantiated. Without tracing, you declare the AWS SDK and EventBridge client with:

const AWS = require('aws-sdk')
const eventBridge = new AWS.EventBridge()

To use tracing, this becomes:

const AWSXRay = require('aws-xray-sdk')
const AWS = AWSXRay.captureAWS(require('aws-sdk'))
const eventBridge = new AWS.EventBridge()

The interaction with the EventBridge client remains the same but the calls are now instrumented by X-Ray. Events are put on the event bus programmatically using a PutEvents API call. In a Node.js Lambda function, the following code processes an event to send to an event bus, with tracing enabled:

const AWSXRay = require('aws-xray-sdk')
const AWS = AWSXRay.captureAWS(require('aws-sdk'))
const eventBridge = new AWS.EventBridge()

exports.handler = async (event) => {

  let myDetail = { "name": "Alice" }

  const myEvent = { 
    Entries: [{
      Detail: JSON.stringify({ myDetail }),
      DetailType: 'myDetailType',
      Source: 'myApplication',
      Time: new Date
    }]
  }

  // Send to EventBridge
  const result = await eventBridge.putEvents(myEvent).promise()

  // Log the result
  console.log('Result: ', JSON.stringify(result, null, 2))
}

You can also define a custom tracing header using the new TraceHeader attribute on the PutEventsRequestEntry API model. The unique value you provide overrides any trace header on the HTTP header. The value is also validated by X-Ray and discarded if it does not pass validation. See the X-Ray Developer Guide to learn about generating valid trace headers.

Deploying the example application

The example application consists of a webhook microservice that publishes events and target microservices that consume events. The generated event contains a target attribute to determine which target receives the event:

Example application architecture

To deploy these microservices, you must have the AWS SAM CLI and Node.js 12.x installed. to To complete the deployment, follow the instructions in the GitHub repo.

EventBridge can route events to a broad range of target services in AWS. Targets that support active tracing for X-Ray can create comprehensive traces from the event source. The services offering active tracing are AWS Lambda, AWS Step Functions, and Amazon API Gateway. In each case, you can trace a request from the producer to the consumer of the event.

The GitHub repo contains examples showing how to use active tracing with EventBridge targets. The webhook application uses a query string parameter called target to determine which events are routed to these targets.

For X-Ray to detect each service in the webhook, tracing must be enabled on both the API Gateway stage and the Lambda function. In the AWS SAM template, the Tracing: Active property turns on active tracing for the Lambda function. If an IAM role is not specified, the AWS SAM CLI automatically adds the arn:aws:iam::aws:policy/AWSXrayWriteOnlyAccess policy to the Lambda function’s execution role. For the API definition, adding TracingEnabled: True enables tracing for this API stage.

When you invoke the webhook’s API endpoint, X-Ray generates a trace map of the request, showing each of the services from the REST API call to putting the event on the bus:

X-Ray trace map with EventBridge

The CloudWatch Logs from the webhook’s Lambda function shows the event that has been put on the event bus:

CloudWatch Logs from a webhook

Tracing with a Lambda target

In the targets-lambda example application, the Lambda function uses the X-Ray SDK and has active tracing enabled in the AWS SAM template:

Resources:
  ConsumerFunction:
    Type: AWS::Serverless::Function
    Properties:
      CodeUri: src/
      Handler: app.handler
      MemorySize: 128
      Timeout: 3
      Runtime: nodejs12.x
      Tracing: Active

With these two changes, the target Lambda function propagates the tracing header from the original webhook request. When the webhook API is invoked, the X-Ray trace map shows the entire request through to the Lambda target. X-Ray shows two nodes for Lambda – one is the Lambda service and the other is the Lambda function invocation:

Downstream service node in service map

Tracing with an API Gateway target

Currently, active tracing is only supported by REST APIs but not HTTP APIs. You can enable X-Ray tracing from the AWS CLI or from the Stages menu in the API Gateway console, in the Logs/Tracing tab:

Enable X-Ray tracing in API Gateway

You cannot currently create an API Gateway target for EventBridge using AWS SAM. To invoke an API endpoint from the EventBridge console, create a rule and select the API as a target. The console automatically creates the necessary IAM permissions for EventBridge to invoke the endpoint.

Setting API Gateway as an EventBridge target

If the API invokes downstream services with active tracing available, these services also appear as nodes in the X-Ray service graph. Using the webhook application to invoke the API Gateway target, the trace shows the entire request from the initial API call through to the second API target:

API Gateway node in X-Ray service map

Tracing with a Step Functions target

To enable tracing for a Step Functions target, the state machine must have tracing enabled and have permissions to write to X-Ray. The AWS SAM template can enable tracing, define the EventBridge rule and the AWSXRayDaemonWriteAccess policy in one resource:

  WorkFlowStepFunctions:
    Type: AWS::Serverless::StateMachine
    Properties:
      DefinitionUri: definition.asl.json
      DefinitionSubstitutions:
        LoggerFunctionArn: !GetAtt LoggerFunction.Arn
      Tracing:
        Enabled: True
      Events:
        UploadComplete:
          Type: EventBridgeRule
          Properties:
            Pattern:
              account: 
                - !Sub '${AWS::AccountId}'
              source:
                - !Ref EventSource
              detail:
                apiEvent:
                  target:
                    - 'sfn'

      Policies: 
        - AWSXRayDaemonWriteAccess
        - LambdaInvokePolicy:
            FunctionName: !Ref LoggerFunction

If the state machine uses services that support active tracing, these also appear in the trace map for individual requests. Using the webhook to invoke this target, X-Ray now shows the request trace to the state machine and the Lambda function it contains:

Step Functions in X-Ray service map

Adding X-Ray tracing to existing Lambda targets

To wrap the SDK client, you must enable active tracing and include the AWS X-Ray SDK in the Lambda function’s deployment package. Unlike the AWS SDK, the X-Ray SDK is not included in the Lambda execution environment.

Another option is to include the X-Ray SDK as a Lambda layer. You can build this layer by following the instructions in the GitHub repo. Once deployed, you can attach the X-Ray layer to any Lambda function either via the console or the CLI:

Adding X-Ray tracing a Lambda function

To learn more about using Lambda layers, read “Using Lambda layers to simplify your development process”.

Conclusion

X-Ray is a powerful tool for providing observability in serverless applications. With the launch of X-Ray trace context propagation in EventBridge, this allows you to trace requests across distributed applications more easily.

In this blog post, I walk through an example webhook application with three targets that support active tracing. In each case, I show how to enable tracing either via the console or using AWS SAM and show the resulting X-Ray trace map.

To learn more about how to use tracing with events, read the X-Ray Developer Guide or see the Amazon EventBridge documentation for this feature.

For more serverless learning resources, visit Serverless Land.

Caching data and configuration settings with AWS Lambda extensions

Post Syndicated from Julian Wood original https://aws.amazon.com/blogs/compute/caching-data-and-configuration-settings-with-aws-lambda-extensions/

This post is written by Hari Ohm Prasath Rajagopal, Senior Modernization Architect and Vamsi Vikash Ankam, Technical Account Manager

In this post, I show how to build a flexible in-memory AWS Lambda caching layer using Lambda extensions. Lambda functions use REST API calls to access the data and configuration from the cache. This can reduce latency and cost when consuming data from AWS services such as Amazon DynamoDB, AWS Systems Manager Parameter Store, and AWS Secrets Manager.

Applications making frequent API calls to retrieve static data can benefit from a caching layer. This can reduce the function’s latency, particularly for synchronous requests, as the data is retrieved from the cache instead of an external service. The cache can also reduce costs by reducing the number of calls to downstream services.

There are two types of cache to consider in this situation:

Lambda extensions are a new way for tools to integrate more easily into the Lambda execution environment and control and participate in Lambda’s lifecycle. They use the Extensions API, a new HTTP interface, to register for lifecycle events during function initialization, invocation, and shutdown.

They can also use environment variables to add options and tools to the runtime, or use wrapper scripts to customize the runtime startup behavior. The Lambda cache uses Lambda extensions to run as a separate process.

To learn more about how to use extensions with your functions, read “Introducing AWS Lambda extensions”.

Creating a cache using Lambda extensions

To set up the example, visit the GitHub repo, and follow the instructions in the README.md file.

The demo uses AWS Serverless Application Model (AWS SAM) to deploy the infrastructure. The walkthrough requires AWS SAM CLI (minimum version 0.48) and an AWS account.

To install the example:

  1. Create an AWS account if you do not already have one and login.
  2. Clone the repo to your local development machine:
  3. git clone https://github.com/aws-samples/aws-lambda-extensions
    cd aws-lambda-extensions/cache-extension-demo/
  4. If you are not running in a Linux environment, ensure that your build architecture matches the Lambda execution environment by compiling with GOOS=linux and GOARCH=amd64.
  5. GOOS=linux GOARCH=amd64
  6. Build the Go binary extension with the following command:
  7. go build -o bin/extensions/cache-extension-demo main.go
  8. Ensure that the extensions files are executable:
  9. chmod +x bin/extensions/cache-extension-demo
  10. Update the parameters region value in ../example-function/config.yaml with the Region where you are deploying the function.
  11. parameters:
      - region: us-west-2
  12. Build the function dependencies.
  13. cd SAM
    sam build
    AWS SAM build

    AWS SAM build

  14. Deploy the AWS resources specified in the template.yml file:
  15. sam deploy --guided
  16. During the prompts:
  17. Enter a stack name cache-extension-demo.
  18. Enter the same AWS Region specified previously.
  19. Accept the default DatabaseName. You can specify a custom database name, and also update the ../example-function/config.yaml and index.js files with the new database name.
  20. Enter MySecret as the Secrets Manager secret.
  21. Accept the defaults for the remaining questions.
  22. AWS SAM Deploy

    AWS SAM Deploy

    AWS SAM deploys:

    • A DynamoDB table.
    • The Lambda function ExtensionsCache-DatabaseEntry, which puts a sample item into the DynamoDB table.
    • An AWS Systems Manager Parameter Store parameter called CacheExtensions_Parameter1 with a value of MyParameter.
    • An AWS Secrets Manager secret called secret_info with a value of MySecret.
    • A Lambda layer called Cache_Extension_Layer.
    • A Lambda function using Nodejs.12 called ExtensionsCache-SampleFunction. This reads the cached values via the extension from either the DynamoDB table, Parameter Store, or Secrets Manager.
    • IAM permissions

    The cache extension is delivered as a Lambda layer and added to ExtensionsCache-SampleFunction.

    It is written as a self-contained binary in Golang, which makes the extension compatible with all of the supported runtimes. The extension caches the data from DynamoDB, Parameter Store, and Secrets Manager, and then runs a local HTTP endpoint to service the data. The Lambda function retrieves the configuration data from the cache using a local HTTP REST API call.

    Here is the architecture diagram.

    Extensions cache architecture diagram

    Extensions cache architecture diagram

    Once deployed, the extension performs the following steps:

    1. On start-up, the extension reads the config.yaml file, which determines which resources to cache. The file is deployed as part of the Lambda function.
    2. The boolean CACHE_EXTENSION_INIT_STARTUP Lambda environment variable specifies whether to load into cache the items specified in config.yaml. If false, the extension initializes an empty map with the names.
    3. The extension retrieves the required data based on the resources in the config.yaml file. This includes the data from DynamoDB, the configuration from Parameter Store, and the secret from Secrets Manager. The data is stored in memory.
    4. The extension starts a local HTTP server using TCP port 4000, which serves the cache items to the function. The Lambda function accesses the local in-memory cache by invoking the following endpoint: http://localhost:4000/<cachetype>?name=<name>.
    5. If the data is not available in the cache, or has expired, the extension accesses the corresponding AWS service to retrieve the data. It is cached first and then returned to the Lambda function. The CACHE_EXTENSION_TTL Lambda environment variable defines the refresh interval (defined based on Go time format, for example: 30s, 3m, etc.)

    This sequence diagram explains the data flow:

    Extensions cache sequence diagram

    Extensions cache sequence diagram

    Testing the example application

    Once the AWS SAM template is deployed, navigate to the AWS Lambda console.

    1. Select the function starting with the name ExtensionsCache-SampleFunction. Within the function code, the options array specifies which data to return from the cache. This is initially set to path: '/dynamodb?name=DynamoDbTable-pKey1-sKey1'
    2. Choose Configure test events to configure a test event.
    3. Enter a name for the Event name, accept the default payload, and select Create.
    4. Select Test to invoke the function. This returns the cached data from DynamoDB and logs the output.
    5. Successfully retrieve DynamoDB data from cache

      Successfully retrieve DynamoDB data from cache

    6. In the index.js file, amend the path statement to retrieve the Parameter Store configuration:
    7. const options = {
        "hostname": "localhost",
        "port": 4000,
        "path": "/parameters?name=CacheExtensions_Parameter1",
        "method": "GET"
      }
    8. Select Deploy to save the function configuration and select Test. The function returns the Parameter Store configuration item:
    9. Successfully retrieve Parameter Store data from cache

      Successfully retrieve Parameter Store data from cache

    10. In the function code, amend the path statement to retrieve the Secrets Manager secret:
    11. const options = {
        "hostname": "localhost",
        "port": 4000,
        "path": "/parameters?name=/aws/reference/secretsmanager/secret_info",
        "method": "GET"
      }
    12. Select Deploy to save the function configuration and select Test. The function returns the secret:
    Successfully retrieve Secrets Manager data from cache

    Successfully retrieve Secrets Manager data from cache

    The benefits of using Lambda extensions

    There are a number of benefits to using a Lambda extension for this solution:

    1. Improved Lambda function performance as data is cached in memory by the extension during initialization.
    2. Fewer AWS API calls to external services, this can reduce costs and helps avoid throttling limits if services are accessed frequently.
    3. Cache data is stored in memory and not in a file within the Lambda execution environment. This means that no additional process is required to manage the lifecycle of the file. In-memory is also more secure, as data is not persisted to disk for subsequent function invocations.
    4. The function requires less code, as it only needs to communicate with the extension via HTTP to retrieve the data. The function does not have to have additional libraries installed to communicate with DynamoDB, Parameter Store, Secrets Manager, or the local file system.
    5. The cache extension is a Golang compiled binary and the executable can be shared with functions running other runtimes like Node.js, Python, Java, etc.
    6. Using a YAML template to store the details of what to cache makes it easier to configure and add additional services.

    Comparing the performance benefit

    To test the performance of the cache extension, I compare two tests:

    1. A Golang Lambda function that accesses a secret from AWS Secrets Manager for every invocation.
    2. The ExtensionsCache-SampleFunction, previously deployed using AWS SAM. This uses the cache extension to access the secrets from Secrets Manager, the function reads the value from the cache.

    Both functions are configured with 512 MB of memory and the function timeout is set to 30 seconds.

    I use Artillery to load test both Lambda functions. The load runs for 100 invocations over 2 minutes. I use Amazon CloudWatch metrics to view the function average durations.

    Test 1 shows a duration of 43 ms for the first invocation as a cold start. Subsequent invocations average 22 ms.

    Test 1 performance results

    Test 1 performance results

    Test 2 shows a duration of 16 ms for the first invocation as a cold start. Subsequent invocations average 3 ms.

    Test 2 performance results

    Test 2 performance results

    Using the Lambda extensions caching layer shows a significant performance improvement. Cold start invocation duration is reduced by 62% and subsequent invocations by 80%.

    In this example, the CACHE_EXTENSION_INIT_STARTUP environment variable flag is not configured. With the flag enabled for the extension, data is pre-fetched during extension initialization and the cold start time is further reduced.

    Conclusion

    Using Lambda extensions is an effective way to cache static data from external services in Lambda functions. This reduces function latency and costs. This post shows how to build both a data and configuration cache using DynamoDB, Parameter Store, and Secrets Manager.

    To set up the walkthrough demo in this post, visit the GitHub repo, and follow the instructions in the README.md file.

    The extension uses a local configuration file to determine which values to cache, and retrieves the items from the external services. A Lambda function retrieves the values from the local cache using an HTTP request, without having to communicate with the external services directly. In this example, this results in an 80% reduction in function invocation time.

    For more serverless learning resources, visit https://serverlessland.com.

Operating Lambda: Building a solid security foundation – Part 2

Post Syndicated from James Beswick original https://aws.amazon.com/blogs/compute/operating-lambda-building-a-solid-security-foundation-part-2/

In the Operating Lambda series, I cover important topics for developers, architects, and systems administrators who are managing AWS Lambda-based applications. This two-part series discusses core security concepts for Lambda-based applications.

Part 1 explains the Lambda execution environment and how to apply the principles of least privilege to your workload. This post covers securing workloads with public endpoints, encrypting data, and using AWS CloudTrail for governance, compliance, and operational auditing.

Securing workloads with public endpoints

For workloads that are accessible publicly, AWS provides a number of features and services that can help mitigate certain risks. This section covers authentication and authorization of application users and protecting API endpoints.

Authentication and authorization

Authentication relates to identity and authorization refers to actions. Use authentication to control who can invoke a Lambda function, and then use authorization to control what they can do. For many applications, AWS Identity & Access Management (IAM) is sufficient for managing both control mechanisms.

For applications with external users, such as web or mobile applications, it is common to use JSON Web Tokens (JWTs) to manage authentication and authorization. Unlike traditional, server-based password management, JWTs are passed from the client on every request. They are a cryptographically secure way to verify identity and claims using data passed from the client. For Lambda-based applications, this allows you to secure APIs for each microservice independently, without relying on a central server for authentication.

You can implement JWTs with Amazon Cognito, which is a user directory service that can handle registration, authentication, account recovery, and other common account management operations. For frontend development, Amplify Framework provides libraries to simplify integrating Cognito into your frontend application. You can also use third-party partner services like Auth0.

Given the critical security role of an identity provider service, it’s important to use professional tooling to safeguard your application. It’s not recommended that you write your own services to handle authentication or authorization. Any vulnerabilities in custom libraries may have significant implications for the security of your workload and its data.

Protecting API endpoints

For serverless applications, the preferred way to serve a backend application publicly is to use Amazon API Gateway. This can help you protect an API from malicious users or spikes in traffic.

For authenticated API routes, API Gateway offers both REST APIs and HTTP APIs for serverless developers. Both types support authorization using AWS Lambda, IAM or Amazon Cognito. When using IAM or Amazon Cognito, incoming requests are evaluated and if they are missing a required token or contain invalid authentication, the request is rejected. You are not charged for these requests and they do not count towards any throttling quotas.

Unauthenticated API routes may be accessed by anyone on the public internet so it’s recommended that you limit their use. If you must use unauthenticated APIs, it’s important to protect these against common risks, such as denial-of-service (DoS) attacks. Applying AWS WAF to these APIs can help protect your application from SQL injection and cross-site scripting (XSS) attacks. API Gateway also implements throttling at the AWS account-level and per-client level when API keys are used.

In some cases, the functionality provided by an unauthenticated API can be achieved with an alternative approach. For example, a web application may provide a list of customer retail stores from an Amazon DynamoDB table to users who are not logged in. This request may originate from a frontend web application or from any other source that calls the URL endpoint. This diagram compares three solutions:

Solutions for an unauthenticated API

  1. The unauthenticated API can be called by anyone on the internet. In a denial of service attack, it’s possible to exhaust API throttling limits, Lambda concurrency, or DynamoDB provisioned read capacity on an underlying table.
  2. An Amazon CloudFront distribution in front of the API endpoint with an appropriate time-to-live (TTL) configuration may help absorb traffic in a DoS attack, without changing the underlying solution for fetching the data.
  3. Alternatively, for static data that rarely changes, the CloudFront distribution could serve the data from an S3 bucket.

The AWS Well-Architected Tool provides a Serverless Lens that analyzes the security posture of serverless workloads.

Encrypting data in Lambda-based applications

Managing secrets

For applications handling sensitive data, AWS services provide a range of encryption options for data in transit and at rest. It’s important to identity and classify sensitive data in your workload, and minimize the storage of sensitive data to only what is necessary.

When protecting data at rest, use AWS services for key management and encryption of stored data, secrets and environment variables. Both the AWS Key Management Service and AWS Secrets Manager provide a robust approach to storing and managing secrets used in Lambda functions.

Do not store plaintext secrets or API keys in Lambda environment variables. Instead, use KMS to encrypt environment variables. Also ensure you do not embed secrets directly in function code, or commit these secrets to code repositories.

Using HTTPS securely

HTTPS is encrypted HTTP, using TLS (SSL) to encrypt the request and response, including headers and query parameters. While query parameters are encrypted, URLs may be logged by different services in plaintext, so you should not use these to store sensitive data such as credit card numbers.

AWS services make it easier to use HTTPS throughout your application and it is provided by default in services like API Gateway. Where you need an SSL/TLS certificate in your application, to support features like custom domain names, it’s recommended that you use AWS Certificate Manager (ACM). This provides free public certificates for ACM-integrated services and managed certificate renewal.

Governance controls with AWS CloudTrail

For compliance and operational auditing of application usage, AWS CloudTrail logs activity related to your AWS account usage. It tracks resource changes and usage, and provides analysis and troubleshooting tools. Enabling CloudTrail does not have any negative performance implications for your Lambda-based application, since the logging occurs asynchronously.

Separate from application logging (see chapter 4), CloudTrail captures two types of events:

  • Control plane: These events apply to management operations performed on any AWS resources. Individual trails can be configured to capture read or write events, or both.
  • Data plane: Events performed on the resources, such as when a Lambda function is invoked or an S3 object is downloaded.

For Lambda, you can log who creates and invokes functions, together with any changes to IAM roles. You can configure CloudTrail to log every single activity by user, role, service, and API within an AWS account. The service is critical for understanding the history of changes made to your account and also detecting any unintended changes or suspicious activity.

To research which AWS user interacted with a Lambda function, CloudTrail provides an audit log to find this information. For example, when a new permission is added to a Lambda function, it creates an AddPermission record. You can interpret the meaning of individual attributes in the JSON message by referring to the CloudTrail Record Contents documentation.

CloudTrail Record Contents documentation

CloudTrail data is considered sensitive so it’s recommended that you protect it with KMS encryption. For any service processing encrypted CloudTrail data, it must use an IAM policy with kms:Decrypt permission.

By integrating CloudTrail with Amazon EventBridge, you can create alerts in response to certain activities and respond accordingly. With these two services, you can quickly implement an automated detection and response pattern, enabling you to develop mechanisms to mitigate security risks. With EventBridge, you can analyze data in real-time, using event rules to filter events and forward to targets like Lambda functions or Amazon Kinesis streams.

CloudTrail can deliver data to Amazon CloudWatch Logs, which allows you to process multi-Region data in real time from one location. You can also deliver CloudTrail to Amazon S3 buckets, where you can create event source mappings to start data processing pipelines, run queries with Amazon Athena, or analyze activity with Amazon Macie.

If you use multiple AWS accounts, you can use AWS Organizations to manage and govern individual member accounts centrally. You can set an existing trail as an organization-level trail in a primary account that can collect events from all other member accounts. This can simplify applying consistent auditing rules across a large set of existing accounts, or automatically apply rules to new accounts. To learn more about this feature, see Creating a Trail for an Organization.

Conclusion

In this blog post, I explain how to secure workloads with public endpoints and the different authentication and authorization options available. I also show different approaches to exposing APIs publicly.

CloudTrail can provide compliance and operational auditing for Lambda usage. It provides logs for both the control plane and data plane. You can integrate CloudTrail with EventBridge to create alerts in response to certain activities. Customers with multiple AWS accounts can use AWS Organizations to manage trails centrally.

For more serverless learning resources, visit Serverless Land.

Gaining operational insights with AIOps using Amazon DevOps Guru

Post Syndicated from Nikunj Vaidya original https://aws.amazon.com/blogs/devops/gaining-operational-insights-with-aiops-using-amazon-devops-guru/

Amazon DevOps Guru offers a fully managed AIOps platform service that enables developers and operators to improve application availability and resolve operational issues faster. It minimizes manual effort by leveraging machine learning (ML) powered recommendations. Its ML models take advantage of AWS’s expertise in operating highly available applications for the world’s largest e-commerce business for over 20 years. DevOps Guru automatically detects operational issues, predicts impending resource exhaustion, details likely causes, and recommends remediation actions.

This post walks you through how to enable DevOps Guru for your account in a typical serverless environment and observe the insights and recommendations generated for various activities. These insights are generated for operational events that could pose a risk to your application availability. DevOps Guru uses AWS CloudFormation stacks as the application boundary to detect resource relationships and co-relate with deployment events.

Solution overview

The goal of this post is to demonstrate the insights generated for anomalies detected by DevOps Guru from DevOps operations. If you don’t have a test environment and want to build out infrastructure to test the generation of insights, then you can follow along through this post. However, if you have a test or production environment (preferably spawned from CloudFormation stacks), you can skip the first section and jump directly to section, Enabling DevOps Guru and injecting traffic.

The solution includes the following steps:

1. Deploy a serverless infrastructure.

2. Enable DevOps Guru and inject traffic.

3. Review the generated DevOps Guru insights.

4. Inject another failure to generate a new insight.

As depicted in the following diagram, we use a CloudFormation stack to create a serverless infrastructure, comprising of Amazon API Gateway, AWS Lambda, and Amazon DynamoDB, and inject HTTP requests at a high rate towards the API published to list records.

Serverless infrastructure monitored by DevOps Guru

When DevOps Guru is enabled to monitor your resources within the account, it uses a combination of vended Amazon CloudWatch metrics and specific patterns from its ML models to detect anomalies. When an anomaly is detected, it generates an insight with the recommendations.

The generation of insights is dependent upon several factors. Although this post provides a canned environment to reproduce insights, the results may vary depending upon traffic pattern, timings of traffic injection, and so on.

Prerequisites

To complete this tutorial, you should have access to an AWS Cloud9 environment and the AWS Command Line Interface (AWS CLI).

Deploying a serverless infrastructure

To deploy your serverless infrastructure, you complete the following high-level steps:

1.   Create your IDE environment.

2.   Launch the CloudFormation template to deploy the serverless infrastructure.

3.   Populate the DynamoDB table.


1. Creating your IDE environment

We recommend using AWS Cloud9 to create an environment to get access to the AWS CLI from a bash terminal. AWS Cloud9 is a browser-based IDE that provides a development environment in the cloud. While creating the new environment, ensure you choose Linux2 as the operating system. Alternatively, you can use your bash terminal in your favorite IDE and configure your AWS credentials in your terminal.

When access is available, run the following command to confirm that you can see the Amazon Simple Storage Service (Amazon S3) buckets in your account:

aws s3 ls

Install the following prerequisite packages and ensure you have Python3 installed:

sudo yum install jq -y

export AWS_REGION=$(curl -s \
169.254.169.254/latest/dynamic/instance-identity/document | jq -r '.region')

sudo pip3 install requests

Clone the git repository to download the required CloudFormation templates:

git clone https://github.com/aws-samples/amazon-devopsguru-samples
cd amazon-devopsguru-samples/generate-devopsguru-insights/

2. Launching the CloudFormation template to deploy your serverless infrastructure

To deploy your infrastructure, complete the following steps:

  • Run the CloudFormation template using the following command:
aws cloudformation create-stack --stack-name myServerless-Stack \
--template-body file:///$PWD/cfn-shops-monitoroper-code.yaml \
--capabilities CAPABILITY_IAM CAPABILITY_NAMED_IAM

The AWS CloudFormation deployment creates an API Gateway, a DynamoDB table, and a Lambda function with sample code.

  • When it’s complete, go to the Outputs tab of the stack on the AWS CloudFormation console.
  • Record the links for the two APIs: one of them to list the table contents and other one to populate the contents.

3. Populating the DynamoDB table

Run the following commands (simply copy-paste) to populate the DynamoDB table. The below three commands will identify the name of the DynamoDB table from the CloudFormation stack and populate the name in the populate-shops-dynamodb-table.json file.

dynamoDBTableName=$(aws cloudformation list-stack-resources \
--stack-name myServerless-Stack | \
jq '.StackResourceSummaries[]|select(.ResourceType == "AWS::DynamoDB::Table").PhysicalResourceId' | tr -d '"')
sudo sed -i s/"<YOUR-DYNAMODB-TABLE-NAME>"/$dynamoDBTableName/g \
populate-shops-dynamodb-table.json
aws dynamodb batch-write-item \
--request-items file://populate-shops-dynamodb-table.json

The command gives the following output:

{
"UnprocessedItems": {}
}

This populates the DynamoDB table with a few sample records, which you can verify by accessing the ListRestApiEndpointMonitorOper API URL published on the Outputs tab of the CloudFormation stack. The following screenshot shows the output.

Screenshot showing the API output

Enabling DevOps Guru and injecting traffic

In this section, you complete the following high-level steps:

1.   Enable DevOps Guru for the CloudFormation stack.

2.   Wait for the serverless stack to complete.

3.   Update the stack.

4.   Inject HTTP requests into your API.


1. Enabling DevOps Guru for the CloudFormation stack

To enable DevOps Guru for CloudFormation, complete the following steps:

  • Run the CloudFormation template to enable DevOps Guru for this CloudFormation stack:
aws cloudformation create-stack \
--stack-name EnableDevOpsGuruForServerlessCfnStack \
--template-body file:///$PWD/EnableDevOpsGuruForServerlessCfnStack.yaml \
--parameters ParameterKey=CfnStackNames,ParameterValue=myServerless-Stack \
--region ${AWS_REGION}
  • When the stack is created, navigate to the Amazon DevOps Guru console.
  • Choose Settings.
  • Under CloudFormation stacks, locate myServerless-Stack.

If you don’t see it, your CloudFormation stack has not been successfully deployed. You may remove and redeploy the EnableDevOpsGuruForServerlessCfnStack stack.

Optionally, you can configure Amazon Simple Notification Service (Amazon SNS) topics or enable AWS Systems Manager integration to create OpsItem entries for every insight created by DevOps Guru. If you need to deploy as a stack set across multiple accounts and Regions, see Easily configure Amazon DevOps Guru across multiple accounts and Regions using AWS CloudFormation StackSets.

2. Waiting for baselining of resources

This is a necessary step to allow DevOps Guru to complete baselining the resources and benchmark the normal behavior. For our serverless stack with 3 resources, we recommend waiting for 2 hours before carrying out next steps. When enabled in a production environment, depending upon the number of resources selected to monitor, it can take up to 24 hours for it to complete baselining.

Note: Unlike many monitoring tools, DevOps Guru does not expect the dashboard to be continuously monitored and thus under normal system health, the dashboard would simply show zero’ed counters for the ongoing insights. It is only when an anomaly is detected, it will raise an alert and display an insight on the dashboard.

3. Updating the CloudFormation stack

When enough time has elapsed, we will make a configuration change to simulate a typical operational event. As shown below, update the CloudFormation template to change the read capacity for the DynamoDB table from 5 to 1.

CloudFormation showing read capacity settings to modify

Run the following command to deploy the updated CloudFormation template:

aws cloudformation update-stack --stack-name myServerless-Stack \
--template-body file:///$PWD/cfn-shops-monitoroper-code.yaml \
--capabilities CAPABILITY_IAM CAPABILITY_NAMED_IAM

4. Injecting HTTP requests into your API

We now inject ingress traffic in the form of HTTP requests towards the ListRestApiEndpointMonitorOper API, either manually or using the Python script provided in the current directory (sendAPIRequest.py). Due to reduced read capacity, the traffic will oversubscribe the dynamodb tables, thus inducing an anomaly. However, before triggering the script, populate the url parameter with the correct API link for the  ListRestApiEndpointMonitorOper API, listed in the CloudFormation stack’s output tab.

After the script is saved, trigger the script using the following command:

python sendAPIRequest.py

Make sure you’re getting an output of status 200 with the records that we fed into the DynamoDB table (see the following screenshot). You may have to launch multiple tabs (preferably 4) of the terminal to run the script to inject a high rate of traffic.

Terminal showing script executing and injecting traffic to API

After approximately 10 minutes of the script running in a loop, an operational insight is generated in DevOps Guru.


Reviewing DevOps Guru insights

While these operations are being run, DevOps Guru monitors for anomalies, logs insights that provide details about the metrics indicating an anomaly, and prints actionable recommendations to mitigate the anomaly. In this section, we review some of these insights.

Under normal conditions, DevOps Guru dashboard will show the ongoing insights counter to be zero. It monitors a high number of metrics behind the scenes and offloads the operator from manually monitoring any counters or graphs. It raises an alert in the form of an insight, only when anomaly occurs.

The following screenshot shows an ongoing reactive insight for the specific CloudFormation stack. When you choose the insight, you see further details. The number under the Total resources analyzed last hour may vary, so for this post, you can ignore this number.

DevOps Guru dashboard showing an ongoing reactive insight

The insight is divided into four sections: Insight overview, Aggregated metrics, Relevant events, and Recommendations. Let’s take a closer look into these sections.

The following screenshot shows the Aggregated metrics section, where it shows metrics for all the resources that it detected anomalies in (DynamoDB, Lambda, and API Gateway). Note that depending upon your traffic pattern, lambda settings, baseline traffic, the list of metrics may vary. In the example below, the timeline shows that an anomaly for DynamoDB started first and was followed by API Gateway and Lambda. This helps us understand the cause and symptoms, and prioritize the right anomaly investigation.

The listing of metrics inside an Insight

Initially, you may see only two metrics listed, however, over time, it populates more metrics that showed anomalies. You can see the anomaly for DynamoDB started earlier than the anomalies for API Gateway and Lambda, thus indicating them as after effects. In addition to the information in the preceding screenshot, you may see Duration p90 and IntegrationLatency p90 (for Lambda and API Gateway respectively, due to increased backend latency) metrics also listed.

Now we check the Relevant events section, which lists potential triggers for the issue. The events listed here depend on the set of operations carried out on this CloudFormation stack’s resources in this Region. This makes it easy for the operator to be reminded of a change that may have caused this issue. The dots (representing events) that are near the Insight start portion of timeline are of particular interest.

Related Events shown inside the Insight

If you need to delve into any of these events, just click of any of these points, and it provides more details as shown below screenshot.

Delving into details of the related event listed in Insight

You can choose the link for an event to view specific details about the operational event (configuration change via CloudFormation update stack operation).

Now we move to the Recommendations section, which provides prescribed guidance for mitigating this anomaly. As seen in the following screenshot, it recommends to roll back the configuration change related to the read capacity for the DynamoDB table. It also lists specific metrics and the event as part of the recommendation for reference.

Recommendations provided inside the Insight

Going back to the metric section of the insight, when we select Graphed anomalies, it shows you the graphs of all related resources. Below screenshot shows a snippet showing anomaly for DynamoDB ReadThrottleEvents metrics. As seen in the below screenshot of the graph pattern, the read operations on the table are exceeding the provisioned throughput of read capacity. This clearly indicates an anomaly.

Graphed anomalies in DevOps Guru

Let’s navigate to the DynamoDB table and check our table configuration. Checking the table properties, we notice that our read capacity is reduced to 1. This is our root cause that led to this anomaly.

Checking the DynamoDB table capacity settings

If we change it to 5, we fix this anomaly. Alternatively, if the traffic is stopped, the anomaly moves to a Resolved state.

The ongoing reactive insight takes a few minutes after resolution to move to a Closed state.

Note: When the insight is active, you may see more metrics get populated over time as we detect further anomalies. When carrying out the preceding tests, if you don’t see all the metrics as listed in the screenshots, you may have to wait longer.


Injecting another failure to generate a new DevOps Guru insight

Let’s create a new failure and generate an insight for that.

1.   After you close the insight from the previous section, trigger the HTTP traffic generation loop from the AWS Cloud9 terminal.

We modify the Lambda functions’s resource-based policy by removing the permissions for API Gateway to access this function.

2.   On the Lambda console, open the function ScanFunctionMonitorOper.

3.   On the Permissions tab, access the policy.

Accessing the permissions tab for the Lambda


4.   Save a copy of the policy offline as a backup before making any changes.

5.   Note down the “Sid” values for the “AWS:SourceArn” that ends with prod/*/ and prod/*/*.

Checking the Resource-based policy for the Lambda

6.   Run the following command to remove the “Sid” JSON statements in your Cloud9 terminal:

aws lambda remove-permission --function-name ScanFunctionMonitorOper \
--statement-id <Sid-value-ending-with-prod/*/>

7.   Run the same command for the second Sid value:

aws lambda remove-permission --function-name ScanFunctionMonitorOper \
--statement-id <Sid-value-ending-with-prod/*/*>

You should see several 5XX errors, as in the following screenshot.

Terminal output now showing 500 errors for the script output

After less than 8 minutes, you should see a new ongoing reactive insight on the DevOps Guru dashboard.

Let’s take a closer look at the insight. The following screenshot shows the anomalous metric 5XXError Average of API Gateway and its duration. (This insight shows as closed because I had already restored permissions.)

Insight showing 5XX errors for API-Gateway and link to OpsItem

If you have configured to enable creating OpsItem in Systems Manager, you would see the link to OpsItem ID created in the insight, as shown above. This is an optional configuration, which will enable you to track the insights in the form of open tickets (OpsItems) in Systems Manager OpsCenter.

The recommendations provide guidance based upon the related events and anomalous metrics.

After the insight has been generated, reviewed, and verified, restore the permissions by running the following command:

aws lambda add-permission --function-name ScanFunctionMonitorOper  \
--statement-id APIGatewayProdPerm --action lambda:InvokeFunction \
--principal apigateway.amazonaws.com

If needed, you can insert the condition to point to the API Gateway ARN to allow only specific API Gateways to access the Lambda function.


Cleaning up

After you walk through this post, you should clean up and un-provision the resources to avoid incurring any further charges.

1.   To un-provision the CloudFormation stacks, on the AWS CloudFormation console, choose Stacks.

2.   Select each stack (EnableDevOpsGuruForServerlessCfnStack and myServerless-Stack) and choose Delete.

3.   Check to confirm that the DynamoDB table created with the stacks is cleaned up. If not, delete the table manually.

4.   Un-provision the AWS Cloud9 environment.


Conclusion

This post reviewed how DevOps Guru can continuously monitor the resources in your AWS account in a typical production environment. When it detects an anomaly, it generates an insight, which includes the vended CloudWatch metrics that breached the threshold, the CloudFormation stack in which the resource existed, relevant events that could be potential triggers, and actionable recommendations to mitigate the condition.

DevOps Guru generates insights that are relevant to you based upon the pre-trained machine-learning models, removing the undifferentiated heavy lifting of manually monitoring several events, metrics, and trends.

I hope this post was useful to you and that you would consider DevOps Guru for your production needs.


Building a serverless multi-player game that scales

Post Syndicated from James Beswick original https://aws.amazon.com/blogs/compute/building-a-serverless-multiplayer-game-that-scales/

This post is written by Tim Bruce, Sr. Solutions Architect, Developer Acceleration.

Game development is a highly iterative process with rapidly changing requirements. Many game developers want to maximize the time spent building features and less time configuring servers, managing infrastructure, and mastering scale.

AWS Serverless provides four key benefits for customers. First, it can help move from idea to market faster, by reducing operational overhead. Second, customers may realize lower costs with serverless by not over-provisioning hardware and software to operate. Third, serverless scales with user activity. Finally, serverless services provide built-in integration, allowing you to focus on your game instead of connecting pieces together.

For AWS Gaming customers, these benefits allow your teams to spend more time focusing on gameplay and content, instead of undifferentiated tasks such as setting up and maintaining servers and software. This can result in better gameplay and content, and a faster time-to-market.

This blog post introduces a game with a serverless-first architecture. Simple Trivia Service is a web-based game showing architectural patterns that you can apply in your own games.

Introducing the Simple Trivia Service

The Simple Trivia Service offers single- and multi-player trivia games with content created by players. There are many features in Simple Trivia Service found in games, such as user registration, chat, content creation, leaderboards, game play, and a marketplace.

Simple Trivia Service UI

Authenticated players can chat with other players, create and manage quizzes, and update their profile. They can play single- and multi-player quizzes, host quizzes, and buy and sell quizzes on the marketplace. The single- and multi-player game modes show how games with different connectivity and technical requirements can be delivered with serverless first architectures. The game modes and architecture solutions are covered in the Simple Trivia Service backend architecture section.

Simple Trivia Service front end

The Simple Trivia Service front end is a Vue.js single page application (SPA) that accesses backend services. The SPA app, accessed via a web browser, allows users to make requests to the game endpoints using HTTPS, secure WebSockets, and WebSockets over MQTT. These requests use integrations to access the serverless backend services.

Vue.js helps make this reference architecture more accessible. The front end uses AWS Amplify to build, deploy, and host the SPA without the need to provision and manage any resources.

Simple Trivia Service backend architecture

The backend architecture for Simple Trivia Service is defined in a set of AWS Serverless Application Model (AWS SAM) templates for portions of the game. A deployment guide is included in the README.md file in the GitHub repository. Here is a visual depiction of the backend architecture.

Reference architecture

Services used

Simple Trivia Service is built using AWS Lambda, Amazon API Gateway, AWS IoT, Amazon DynamoDB, Amazon Simple Notification Service (SNS), AWS Step Functions, Amazon Kinesis, Amazon S3, Amazon Athena, and Amazon Cognito:

  • Lambda enables serverless microservice features in Simple Trivia Service.
  • API Gateway provides serverless endpoints for HTTP/RESTful and WebSocket communication while IoT delivers a serverless endpoint for WebSockets over MQTT communication.
  • DynamoDB enables data storage and retrieval for internet-scale applications.
  • SNS provides microservice communications via publish/subscribe functionality.
  • Step Functions coordinates complex tasks to ensure appropriate outcomes.
  • Analytics for Simple Trivia Service are delivered via Kinesis and S3 with Athena providing a query/visualization capability.
  • Amazon Cognito provides secure, standards-based login and a user directory.

Two managed services that are not serverless, Amazon VPC NAT Gateway and Amazon ElastiCache for Redis, are also used. VPC NAT Gateway is required by VPC-enabled Lambda functions to reach services outside of the VPC, such as DynamoDB. ElastiCache provides an in-memory database suited for applications with submillisecond latency requirements.

User security and enabling communications to backend services

Players are required to register and log in before playing. Registration and login credentials are sent to Amazon Cognito using the Secure Remote Password protocol. Upon successfully logging in, Amazon Cognito returns a JSON Web Token (JWT) and an Amazon Cognito user session.

The JWT is included within requests to API Gateway, which validates the token before allowing the request to be forwarded to Lambda.

IoT requires additional security for users by using an AWS Identity and Access Management (IAM) policy. A policy attached to the Amazon Cognito user allows the player to connect, subscribe, and send messages to the IoT endpoint.

Game types and supporting architectures

Simple Trivia Service’s three game modes define how players interact with the backend services. These modes align to different architectures used within the game.

“Single Player” quiz architecture

“Single Player” quiz architecture

Single player quizzes have simple rules, short play sessions, and appeal to wide audiences. Single player game communication is player-to-endpoint only. This is accomplished with API Gateway via an HTTP API.

Four Lambda functions (ActiveGamesList, GamePlay, GameAnswer, and LeaderboardGet) enable single player games. These functions are integrated with API Gateway and respond to specific requests from the client. API Gateway forwards the request, including URI, body, and query string, to the appropriate Lambda function.

When a player chooses “Play”, a request is sent to API Gateway, which invokes the ActiveGamesList function. This function queries the ActiveGames DynamoDB table and returns the list of active games to the user.

The player selects a game, resulting in another request triggering the GamePlay function. GamePlay retrieves the game’s questions from the GamesDetail DynamoDB table. The front end maintains the state for the user during the game.

When all questions are answered, the SPA sends the player’s responses to API Gateway, invoking the GameAnswer function. This function scores the player’s responses against the GameDetails table. The score and answers are sent to the user.

Additionally, this function sends the player score for the leaderboard and player experience to two SNS topics (LeaderboardTopic and PlayerProgressTopic). The ScorePut and PlayerProgressPut functions subscribe to these topics. These two functions write the details to the Leaderboard and Player Progress DynamoDB tables.

This architecture processes these two actions asynchronously, resulting in the player receiving their score and answers without having to wait. This also allows for increased security for player progress, as only the PlayerProgressPut function is allowed to write to this table.

Finally, the player can view the game’s leaderboard, which is returned to the player as the response to the GetLeaderboard function. The function retrieves the top 10 scores and the current player’s score from the Leaderboard table.

“Multi-player – Casual and Competitive” architecture

“Multiplayer – Casual and Competitive” architecture

These game types require player-to-player and service-to-player communication. This is typically performed using TCP/UDP sockets or the WebSocket protocol. API Gateway WebSockets provides WebSocket communication and enables Lambda functions to send messages to and receive messages from game hosts and players.

Game hosts start games via the “Host” button, messaging the LiveAdmin function via API Gateway. The function adds the game to the LiveGames table, which allows players to find and join the game. A list of questions for the game is sent to the game host from the LiveAdmin function at this time. Additionally, the game host is added to the GameConnections table, which keeps track of which connections are related to a game. Players, via the LivePlayer function, are also added to this table when they join a game.

The game host client manages the state of the game for all players and controls the flow of the game, sending questions, correct answers, and leaderboards to players via API Gateway and the LiveAdmin function. The function only sends game messages to the players in the GameConnections table. Player answers are sent to the host via the LivePlayer function.

To end the game, the game host sends a message with the final leaderboard to all players via the LiveAdmin function. This function also stores the leaderboard in the Leaderboard table, removes the game from the ActiveGames table, and sends player progression messages to the Player Progress topic.

“Multi-player – Live Scoreboard” architecture

“Multiplayer – Live Scoreboard” architecture

This is an extension of other multi-player game types requiring similar communications. This uses IoT with WebSockets over MQTT as the transport. It enables the client to subscribe to a topic and act on messages it receives. IoT manages routing messages to clients based on their subscriptions.

This architecture moves the state management from the game host client to a data store on the backend. This change requires a database that can respond quickly to user actions. Simple Trivia Service uses ElastiCache for Redis for this database. Game questions, player responses, and the leaderboard are all stored and updated in Redis during the quiz. The ElastiCache instance is blocked from internet traffic by placing it in a VPC. A security group configures access for the Lambda functions in the same VPC.

Game hosts for this type of game start the game by hosting it, which sends a message to IoT, triggering the CacheGame function. This function adds the game to the ActiveGames table and caches the quiz details from DynamoDB into Redis. Players join the game by sending a message, which is delivered to the JoinGame function. This adds the user record to Redis and alerts the game host that a player has joined.

Game hosts can send questions to the players via a message that invokes the AskQuestion function. This function updates the current question number in Redis and sends the question to subscribed players via the AskQuestion function. The ReceiveAnswer function processes player responses. It validates the response, stores it in Redis, updates the scoreboard, and replies to all players with the updated scoreboard after the first correct answer. The game scoreboard is updated for players in real time.

When the game is over, the game host sends a message to the EndGame function via IoT. This function writes the game leaderboard to the Leaderboard table, sends player progress to the Player Progress SNS topic, deletes the game from cache, and removes the game from the ActiveGames table.

Conclusion

This post introduces the Simple Trivia Service, a single- and multi-player game built using a serverless-first architecture on AWS. I cover different solutions that you can use to enable connectivity from your game client to a serverless-first backend for both single- and multi-player games. I also include a walkthrough of the architecture for each of these solutions.

You can deploy the code for this solution to your own AWS account via instructions in the Simple Trivia Service GitHub repository.

For more serverless learning resources, visit Serverless Land.

How to set up a recurring Security Hub summary email

Post Syndicated from Justin Criswell original https://aws.amazon.com/blogs/security/how-to-set-up-a-recurring-security-hub-summary-email/

AWS Security Hub provides a comprehensive view of your security posture in Amazon Web Services (AWS) and helps you check your environment against security standards and best practices. In this post, we’ll show you how to set up weekly email notifications using Security Hub to provide account owners with a summary of the existing security findings to prioritize, new findings, and links to the Security Hub console for more information.

When you enable Security Hub, it collects and consolidates findings from AWS security services that you’re using, such as intrusion detection findings from Amazon GuardDuty, vulnerability scans from Amazon Inspector, Amazon Simple Storage Service (Amazon S3) bucket policy findings from Amazon Macie, publicly accessible and cross-account resources from IAM Access Analyzer, and resources lacking AWS WAF coverage from AWS Firewall Manager. Security Hub also consolidates findings from integrated AWS Partner Network (APN) security solutions.

Cloud security processes can differ from traditional on-premises security in that security is often decentralized in the cloud. With traditional on-premises security operations, security alerts are typically routed to centralized security teams operating out of security operations centers (SOCs). With cloud security operations, it’s often the application builders or DevOps engineers who are best situated to triage, investigate, and remediate the security alerts. This integration of security into DevOps processes is referred to as DevSecOps, and as part of this approach, centralized security teams look for additional ways to proactively engage application account owners in improving the security posture of AWS accounts.

This solution uses Security Hub custom insights, AWS Lambda, and the Security Hub API. A custom insight is a collection of findings that are aggregated by a grouping attribute, such as severity or status. Insights help you identify common security issues that might require remediation action. Security Hub includes several managed insights, or you can create your own custom insights. Amazon SNS topic subscribers will receive an email, similar to the one shown in Figure 1, that summarizes the results of the Security Hub custom insights.

Figure 1: Example email with a summary of security findings for an account

Figure 1: Example email with a summary of security findings for an account

Solution overview

This solution assumes that Security Hub is enabled in your AWS account. If it isn’t enabled, set up the service so that you can start seeing a comprehensive view of security findings across your AWS accounts.

A recurring Security Hub summary email provides recipients with a proactive communication that summarizes the security posture and any recent improvements within their AWS accounts. The email message contains the following sections:

Here’s how the solution works:

  1. Seven Security Hub custom insights are created when you first deploy the solution.
  2. An Amazon CloudWatch time-based event invokes a Lambda function for processing.
  3. The Lambda function gets the results of the custom insights from Security Hub, formats the results for email, and sends a message to Amazon SNS.
  4. Amazon SNS sends the email notification to the address you provided during deployment.
  5. The email includes the summary and links to the Security Hub UI so that the recipient can follow the remediation workflow.

Figure 2 shows the solution workflow.

Figure 2: Solution overview, deployed through AWS CloudFormation

Figure 2: Solution overview, deployed through AWS CloudFormation

Security Hub custom insight

The finding results presented in the email are summarized by Security Hub custom insights. A Security Hub insight is a collection of related findings. Each insight is defined by a group by statement and optional filters. The group by statement indicates how to group the matching findings, and identifies the type of item that the insight applies to. For example, if an insight is grouped by resource identifier, then the insight produces a list of resource identifiers. The optional filters narrow down the matching findings for the insight. For example, you might want to see only the findings from specific providers or findings associated with specific types of resources. Figure 3 shows the seven custom insights that are created as part of deploying this solution.

Figure 3: Custom insights created by the solution

Figure 3: Custom insights created by the solution

Sample custom insight

Security Hub offers several built-in managed (default) insights. You can’t modify or delete managed insights. You can view the custom insights created as part of this solution in the Security Hub console under Insights, by selecting the Custom Insights filter. From the email, follow the link for “Summary Email – 02 – Failed AWS Foundational Security Best Practices” to see the summarized finding counts, as well as graphs with related data, as shown in Figure 4.

Figure 4: Detail view of the email titled “Summary Email – 02 – Failed AWS Foundational Security Best Practices”

Figure 4: Detail view of the email titled “Summary Email – 02 – Failed AWS Foundational Security Best Practices”

Let’s evaluate the filters that create this custom insight:

Filter setting Filter results
Type is “Software and Configuration Checks/Industry and Regulatory Standards/AWS-Foundational-Security-Best-Practices” Captures all current and future findings created by the security standard AWS Foundational Security Best Practices.
Status is FAILED Captures findings where the compliance status of the resource doesn’t pass the assessment.
Workflow Status is not SUPPRESSED Captures findings where Security Hub users haven’t updated the finding to the SUPPRESSED status.
Record State is ACTIVE Captures findings that represent the latest assessment of the resource. Security Hub automatically archives control-based findings if the associated resource is deleted, the resource does not exist, or the control is disabled.
Group by SeverityLabel Creates the insight and populates the counts.

Solution artifacts

The solution provided with this blog post consists of two files:

  1. An AWS CloudFormation template named security-hub-email-summary-cf-template.json.
  2. A zip file named sec-hub-email.zip for the Lambda function that generates the Security Hub summary email.

In addition to the Security Hub custom insights as discussed in the previous section, the solution also deploys the following artifacts:

  1. An Amazon Simple Notification Service (Amazon SNS) topic named SecurityHubRecurringSummary and an email subscription to the topic.
    Figure 5: SNS topic created by the solution

    Figure 5: SNS topic created by the solution

    The email address that subscribes to the topic is captured through a CloudFormation template input parameter. The subscriber is notified by email to confirm the subscription, and after confirmation, the subscription to the SNS topic is created.

    Figure 6: SNS email subscription

    Figure 6: SNS email subscription

  2. Two Lambda functions:
    1. A Lambda function named *-CustomInsightsFunction-* is used only by the CloudFormation template to create the custom Insights.
    2. A Lambda function named SendSecurityHubSummaryEmail queries the custom insights from the Security Hub API and uses the insights’ data to create the summary email message. The function then sends the email message to the SNS topic.

      Figure 7: Example of Lambda functions created by the solution

      Figure 7: Example of Lambda functions created by the solution

  3. Two IAM roles for the Lambda functions provide the following rights, respectively:
    1. The minimum rights required to create insights and to create CloudWatch log groups and logs.
      {
          "Version": "2012-10-17",
          "Statement": [
              {
                  "Action": [
                      "logs:CreateLogGroup",
                      "logs:CreateLogStream",
                      "logs:PutLogEvents"
                  ],
                  "Resource": "arn:aws:logs:*:*:*",
                  "Effect": "Allow"
              },
              {
                  "Action": [
                      "securityhub:CreateInsight"
                  ],
                  "Resource": "*",
                  "Effect": "Allow"
              }
          ]
      }
      

    2. The minimum rights required to query Security Hub insights and to send email messages to the SNS topic named SecurityHubRecurringSummary.
      {
          "Version": "2012-10-17",
          "Statement": [
              {
                  "Action": "sns:Publish",
                  "Resource": "arn:aws:sns:[REGION]:[ACCOUNT-ID]:SecurityHubRecurringSummary",
                  "Effect": "Allow"
              }
          ]
      } ,
      {
          "Version": "2012-10-17",
          "Statement": [
              {
                  "Effect": "Allow",
                  "Action": [
                      "securityhub:Get*",
                      "securityhub:List*",
                      "securityhub:Describe*"
                  ],
                  "Resource": "*"
              }
          ]
      }             
      

  4. A CloudWatch scheduled event named SecurityHubSummaryEmailSchedule for invoking the Lambda function that generates the summary email. The default schedule is every Monday at 8:00 AM GMT. This schedule can be overwritten by using a CloudFormation input parameter. Learn more about creating Cron expressions.

    Figure 8: Example of CloudWatch schedule created by the solution

    Figure 8: Example of CloudWatch schedule created by the solution

Deploy the solution

The following steps demonstrate the deployment of this solution in a single AWS account and Region. Repeat these steps in each of the AWS accounts that are active with Security Hub, so that the respective application owners can receive the relevant data from their accounts.

To deploy the solution

  1. Download the CloudFormation template security-hub-email-summary-cf-template.json and the .zip file sec-hub-email.zip from https://github.com/aws-samples/aws-security-hub-summary-email.
  2. Copy security-hub-email-summary-cf-template.json and sec-hub-email.zip to an S3 bucket within your target AWS account and Region. Copy the object URL for the CloudFormation template .json file.
  3. On the AWS Management Console, open the service CloudFormation. Choose Create Stack with new resources.

    Figure 9: Create stack with new resources

    Figure 9: Create stack with new resources

  4. Under Specify template, in the Amazon S3 URL textbox, enter the S3 object URL for the file security-hub-email-summary-cf-template.json that you uploaded in step 1.

    Figure 10: Specify S3 URL for CloudFormation template

    Figure 10: Specify S3 URL for CloudFormation template

  5. Choose Next. On the next page, under Stack name, enter a name for the stack.

    Figure 11: Enter stack name

    Figure 11: Enter stack name

  6. On the same page, enter values for the input parameters. These are the input parameters that are required for this CloudFormation template:
    1. S3 Bucket Name: The S3 bucket where the .zip file for the Lambda function (sec-hub-email.zip) is stored.
    2. S3 key name (with prefixes): The S3 key name (with prefixes) for the .zip file for the Lambda function.
    3. Email address: The email address of the subscriber to the Security Hub summary email.
    4. CloudWatch Cron Expression: The Cron expression for scheduling the Security Hub summary email. The default is every Monday 8:00 AM GMT. Learn more about creating Cron expressions.
    5. Additional Footer Text: Text that will appear at the bottom of the email message. This can be useful to guide the recipient on next steps or provide internal resource links. This is an optional parameter; leave it blank for no text.
    Figure 12: Enter CloudFormation parameters

    Figure 12: Enter CloudFormation parameters

  7. Choose Next.
  8. Keep all defaults in the screens that follow, and choose Next.
  9. Select the check box I acknowledge that AWS CloudFormation might create IAM resources, and then choose Create stack.

Test the solution

You can send a test email after the deployment is complete. To do this, navigate to the Lambda console and locate the Lambda function named SendSecurityHubSummaryEmail. Perform a manual invocation with any event payload to receive an email within a few minutes. You can repeat this procedure as many times as you wish.

Conclusion

We’ve outlined an approach for rapidly building a solution for sending a weekly summary of the security posture of your AWS account as evaluated by Security Hub. This solution makes it easier for you to be diligent in reviewing any outstanding findings and to remediate findings in a timely way based on their severity. You can extend the solution in many ways, including:

  1. Add links in the footer text to the remediation workflows, such as creating a ticket for ServiceNow or any Security Information and Event Management (SIEM) that you use.
  2. Add links to internal wikis for workflows like organizational exceptions to vulnerabilities or other internal processes.
  3. Extend the solution by modifying the custom insights content, email content, and delivery frequency.

To learn more about how to set up and customize Security Hub, see these additional blog posts.

If you have feedback about this post, submit comments in the Comments section below. If you have any questions about this post, start a thread on the AWS Security Hub forum.

Want more AWS Security how-to content, news, and feature announcements? Follow us on Twitter.

Author

Justin Criswell

Justin is a Senior Security Specialist Solutions Architect at AWS. His background is in cloud security and customer success. Today, he is focused on helping enterprise AWS customers adopt and operationalize AWS Security Services to increase visibility and reduce risk.

Author

Kavita Mahajan

Kavita is a Senior Partner Solutions Architect at AWS. She has a background in building software systems for the financial sector, specifically insurance and banking. Currently, she is focused on helping AWS partners develop capabilities, grow their practices, and innovate on the AWS platform to deliver the best possible customer experience.

Operating Lambda: Building a solid security foundation – Part 1

Post Syndicated from James Beswick original https://aws.amazon.com/blogs/compute/operating-lambda-building-a-solid-security-foundation-part-1/

In the Operating Lambda series, I cover important topics for developers, architects, and systems administrators who are managing AWS Lambda-based applications. This two-part series discusses core security concepts for Lambda-based applications.

In the AWS Cloud, the most important foundational security principle is the shared responsibility model. This broadly shares security responsibilities between AWS and our customers. AWS is responsible for “security of the cloud”, such as the underlying physical infrastructure and facilities providing the services. Customers are responsible for “security in the cloud”, which includes applying security best practices, controlling access, and taking measures to protect data.

One of the main reasons for the popularity of Lambda-based applications is that AWS manages even more of the security operations compared with traditional cloud-based compute. For example, Lambda customers using zip file deployments do not need to patch underlying operating systems or apply security patches – these tasks are managed automatically by the Lambda service.

This post explains the Lambda execution environment and mechanisms used by the service to protect customer data. It also covers applying the principles of least privilege to your application and what this means in terms of permissions and Lambda function scope.

Understanding the Lambda execution environment

When your functions are invoked, the Lambda service runs your code inside an execution environment. Lambda scrubs the memory before it is assigned to an execution environment. Execution environments are run on hardware virtualized virtual machines (MicroVMs) which are dedicated to a single AWS account. Execution environments are never shared across functions and MicroVMs are never shared across AWS accounts. This is the isolation model for the Lambda service:

Isolation model for the Lambda service

A single execution environment may be reused by subsequent function invocations. This helps improve performance since it reduces the time taken to prepare and environment. Within your code, you can take advantage of this behavior to improve performance further, by caching locally within the function or reusing long-lived connections. All of these invocations are handled by a single process, so any process-wide state (such as static state in Java) is available across all invocations within the same execution environment.

There is also a local file system available at /tmp for all Lambda functions. This is local to each function but shared across invocations within the same execution environment. If your function must access large libraries or files, these can be downloaded here first and then used by all subsequent invocations. This mechanism provides a way to amortize the cost and time of downloading this data across multiple invocations.

While data is never shared across AWS customers, it is possible for data from one Lambda function to be shared with another invocation of the same function instance. This can be useful for caching common values or sharing libraries. However, if you have information only intended for a single invocation, you should:

  • Ensure that data is only used in a local variable scope.
  • Delete any /tmp files before exiting, and use a UUID name to prevent different instances from accessing the same temporary files.
  • Ensure that any callbacks are complete before exiting.

For applications requiring the highest levels of security, you may also implement your own memory encryption and wiping process before a function exits. At the function level, the Lambda service does not inspect or scan your code. Many of the best practices in security for software development continue to apply in serverless software development.

The security posture of an application is determined by the use-case but developers should always take precautions against common risks such as misconfiguration, injection flaws, and handling user input. Developers should be familiar with common security concepts and security risks, such as those listed in the OWASP Top 10 Web Application Security Risks and the OWASP Serverless Top 10. The use of static code analysis tools, unit tests, and regression tests are still valid in a serverless compute environment.

To learn more, read “Amazon Web Services: Overview of Security Processes”, “Compliance validation for AWS Lambda”, and “Security Overview of AWS Lambda”.

Applying the principles of least privilege

AWS Identity and Access Management (IAM) is the service used to manage access to AWS services. Before using IAM, it’s important to review security best practices that apply across AWS, to ensure that your user accounts are secured appropriately.

Lambda is fully integrated with IAM, allowing you to control precisely what each Lambda function can do within the AWS Cloud. There are two important policies that define the scope of permissions in Lambda functions. The event source uses a resource policy that grants permission to invoke the Lambda function, whereas the Lambda service uses an execution role to constrain what the function is allowed to do. In many cases, the console configures both of these policies with default settings.

As you start to build Lambda-based applications with frameworks such as AWS SAM, you describe both policies in the application’s template.

Resource and execution role policy

By default, when you create a new Lambda function, a specific IAM role is created for only that function.

IAM role for a Lambda function

This role has permissions to create an Amazon CloudWatch log group in the current Region and AWS account, and create log streams and put events to those streams. The policy follows the principle of least privilege by scoping precise permissions to specific resources, AWS services, and accounts.

Developing least privilege IAM roles

As you develop a Lambda function, you expand the scope of this policy to enable access to other resources. For example, for a function that processes objects put into an Amazon S3 bucket, it requires read access to objects stored in that bucket. Do not grant the function broader permissions to write or delete data, or operate in other buckets.

Determining the exact permissions can be challenging, since IAM permissions are granular and they control access to both the data plane and control plane. The following references are useful for developing IAM policies:

One of the fastest ways to scope permissions appropriately is to use AWS SAM policy templates. You can reference these templates directly in the AWS SAM template for your application, providing custom parameters as required:

SAM policy templates

In this example, the S3CrudPolicy template provides full create, read, update, and delete permissions to one bucket, and the S3ReadPolicy template provides only read access to another bucket. AWS SAM named templates expand into more verbose AWS CloudFormation policy definitions that show how the principle of least privilege is applied. The S3ReadPolicy is defined as:

        "Statement": [
          {
            "Effect": "Allow",
            "Action": [
              "s3:GetObject",
              "s3:ListBucket",
              "s3:GetBucketLocation",
              "s3:GetObjectVersion",
              "s3:GetLifecycleConfiguration"
            ],
            "Resource": [
              {
                "Fn::Sub": [
                  "arn:${AWS::Partition}:s3:::${bucketName}",
                  {
                    "bucketName": {
                      "Ref": "BucketName"
                    }
                  }
                ]
              },
              {
                "Fn::Sub": [
                  "arn:${AWS::Partition}:s3:::${bucketName}/*",
                  {
                    "bucketName": {
                      "Ref": "BucketName"
                    }
                  }
                ]
              }
            ]
          }
        ]

It includes the necessary, minimal permissions to retrieve the S3 object, including getting the bucket location, object version, and lifecycle configuration.

Access to CloudWatch Logs

To log output, Lambda roles must provide access to CloudWatch Logs. If you are building a policy manually, ensure that it includes:

{
    "Version": "2012-10-17",
    "Statement": [
        {
            "Effect": "Allow",
            "Action": "logs:CreateLogGroup",
            "Resource": "arn:aws:logs:region:accountID:*"
        },
        {
            "Effect": "Allow",
            "Action": [
                "logs:CreateLogStream",
                "logs:PutLogEvents"
            ],
            "Resource": [
                "arn:aws:logs:region:accountID:log-group:/aws/lambda/functionname:*"
            ]
        }
    ]
}

If the role is missing these permissions, the function still runs but it is unable to log any output to the CloudWatch service.

Avoiding wildcard permissions in IAM policies

The granularity of IAM permissions means that developers may choose to use overly broad permissions when they are testing or developing code.

IAM supports the “*” wildcard in both the resources and actions attributes, making it easier to select multiple matching items automatically. These may be useful when developing and testing functions in specific development AWS accounts with no access to production data. However, you should ensure that “star permissions” are never used in production environments.

Wildcard permissions grant broad permissions, often for many permissions or resources. Many AWS managed policies, such as AdministratorAccess, provide broad access intended only for user roles. Do not apply these policies to Lambda functions, since they do not specify individual resources.

In Application design and Service Quotas – Part 1, the section Using multiple AWS accounts for managing quotas shows a multiple account example. This approach provisions a separate AWS account for each developer in a team, and separates accounts for beta and production. This can help prevent developers from unintentionally transferring overly broad permissions to beta or production accounts.

For developers using the Serverless Framework, the Safeguards plugin is a policy-as-code framework to check deployed templates for compliance with security.

Specialized Lambda functions compared with all-purpose functions

In the post on Lambda design principles, I discuss architectural decisions in choosing between specialized functions and all-purpose functions. From a security perspective, it can be more difficult to apply the principles of least privilege to all-purpose functions. This is partly because of the broad capabilities of these functions and also because developers may grant overly broad permissions to these functions.

When building smaller, specialized functions with single tasks, it’s often easier to identify the specific resources and access requirements, and grant only those permissions. Additionally, since new features are usually implemented by new functions in this architectural design, you can specifically grant permissions in new IAM roles for these functions.

Avoid sharing IAM roles with multiple Lambda functions. As permissions are added to the role, these are shared across all functions using this role. By using one dedicated IAM role per function, you can control permissions more intentionally. Every Lambda function should have a 1:1 relationship with an IAM role. Even if some functions have the same policy initially, always separate the IAM roles to ensure least privilege policies.

To learn more, the series of posts for “Building well-architected serverless applications: Controlling serverless API access” – part 1, part 2, and part 3.

Conclusion

This post explains the Lambda execution environment and how the service protects customer data. It covers important steps you should take to prevent data leakage between invocations and provides additional security resources to review.

The principles of least privilege also apply to Lambda-based applications. I show how you can develop IAM policies and practices to ensure that IAM roles are scoped appropriately, and why you should avoid wildcard permissions. Finally, I explain why using smaller, specialized Lambda functions can help maintain least privilege.

Part 2 will discuss security workloads with public endpoints and how to use AWS CloudTrail for governance, compliance, and operational auditing of Lambda usage.

For more serverless learning resources, visit Serverless Land.

Scaling up a Serverless Web Crawler and Search Engine

Post Syndicated from Jack Stevenson original https://aws.amazon.com/blogs/architecture/scaling-up-a-serverless-web-crawler-and-search-engine/

Introduction

Building a search engine can be a daunting undertaking. You must continually scrape the web and index its content so it can be retrieved quickly in response to a user’s query. The goal is to implement this in a way that avoids infrastructure complexity while remaining elastic. However, the architecture that achieves this is not necessarily obvious. In this blog post, we will describe a serverless search engine that can scale to crawl and index large web pages.

A simple search engine is composed of two main components:

  • A web crawler (or web scraper) to extract and store content from the web
  • An index to answer search queries

Web Crawler

You may have already read “Serverless Architecture for a Web Scraping Solution.” In this post, Dzidas reviews two different serverless architectures for a web scraper on AWS. Using AWS Lambda provides a simple and cost-effective option for crawling a website. However, it comes with a caveat: the Lambda timeout capped crawling time at 15 minutes. You can tackle this limitation and build a serverless web crawler that can scale to crawl larger portions of the web.

A typical web crawler algorithm uses a queue of URLs to visit. It performs the following:

  • It takes a URL off the queue
  • It visits the page at that URL
  • It scrapes any URLs it can find on the page
  • It pushes the ones that it hasn’t visited yet onto the queue
  • It repeats the preceding steps until the URL queue is empty

Even if we parallelize visiting URLs, we may still exceed the 15-minute limit for larger websites.

Breaking Down the Web Crawler Algorithm

AWS Step Functions is a serverless function orchestrator. It enables you to sequence one or more AWS Lambda functions to create a longer running workflow. It’s possible to break down this web crawler algorithm into steps that can be run in individual Lambda functions. The individual steps can then be composed into a state machine, orchestrated by AWS Step Functions.

Here is a possible state machine you can use to implement this web crawler algorithm:

Figure 1: Basic State Machine

Figure 1: Basic State Machine

1. ReadQueuedUrls – reads any non-visited URLs from our queue
2. QueueContainsUrls? – checks whether there are non-visited URLs remaining
3. CrawlPageAndQueueUrls – takes one URL off the queue, visits it, and writes any newly discovered URLs to the queue
4. CompleteCrawl – when there are no URLs in the queue, we’re done!

Each part of the algorithm can now be implemented as a separate Lambda function. Instead of the entire process being bound by the 15-minute timeout, this limit will now only apply to each individual step.

Where you might have previously used an in-memory queue, you now need a URL queue that will persist between steps. One option is to pass the queue around as an input and output of each step. However, you may be bound by the maximum I/O sizes for Step Functions. Instead, you can represent the queue as an Amazon DynamoDB table, which each Lambda function may read from or write to. The queue is only required for the duration of the crawl. So you can create the DynamoDB table at the start of the execution, and delete it once the crawler has finished.

Scaling up

Crawling one page at a time is going to be a bit slow. You can use the Step Functions “Map state” to run the CrawlPageAndQueueUrls to scrape multiple URLs at once. You should be careful not to bombard a website with thousands of parallel requests. Instead, you can take a fixed-size batch of URLs from the queue in the ReadQueuedUrls step.

An important limit to consider when working with Step Functions is the maximum execution history size. You can protect against hitting this limit by following the recommended approach of splitting work across multiple workflow executions. You can do this by checking the total number of URLs visited on each iteration. If this exceeds a threshold, you can spawn a new Step Functions execution to continue crawling.

Step Functions has native support for error handling and retries. You can take advantage of this to make the web crawler more robust to failures.

With these scaling improvements, here’s our final state machine:

Figure 2: Final State Machine

Figure 2: Final State Machine

This includes the same steps as before (1-4), but also two additional steps (5 and 6) responsible for breaking the workflow into multiple state machine executions.

Search Index

Deploying a scalable, efficient, and full-text search engine that provides relevant results can be complex and involve operational overheads. Amazon Kendra is a fully managed service, so there are no servers to provision. This makes it an ideal choice for our use case. Amazon Kendra supports HTML documents. This means you can store the raw HTML from the crawled web pages in Amazon Simple Storage Service (S3). Amazon Kendra will provide a machine learning powered search capability on top, which gives users fast and relevant results for their search queries.

Amazon Kendra does have limits on the number of documents stored and daily queries. However, additional capacity can be added to meet demand through query or document storage bundles.

The CrawlPageAndQueueUrls step writes the content of the web page it visits to S3. It also writes some metadata to help Amazon Kendra rank or present results. After crawling is complete, it can then trigger a data source sync job to ensure that the index stays up to date.

One aspect to be mindful of while employing Amazon Kendra in your solution is its cost model. It is priced per index/hour, which is more favorable for large-scale enterprise usage, than for smaller personal projects. We recommend you take note of the free tier of Amazon Kendra’s Developer Edition before getting started.

Overall Architecture

You can add in one more DynamoDB table to monitor your web crawl history. Here is the architecture for our solution:

Figure 3: Overall Architecture

Figure 3: Overall Architecture

A sample Node.js implementation of this architecture can be found on GitHub.

In this sample, a Lambda layer provides a Chromium binary (via chrome-aws-lambda). It uses Puppeteer to extract content and URLs from visited web pages. Infrastructure is defined using the AWS Cloud Development Kit (CDK), which automates the provisioning of cloud applications through AWS CloudFormation.

The Amazon Kendra component of the example is optional. You can deploy just the serverless web crawler if preferred.

Conclusion

If you use fully managed AWS services, then building a serverless web crawler and search engine isn’t as daunting as it might first seem. We’ve explored ways to run crawler jobs in parallel and scale a web crawler using AWS Step Functions. We’ve utilized Amazon Kendra to return meaningful results for queries of our unstructured crawled content. We achieve all this without the operational overheads of building a search index from scratch. Review the sample code for a deeper dive into how to implement this architecture.

Operating Lambda: Application design – Part 3

Post Syndicated from James Beswick original https://aws.amazon.com/blogs/compute/operating-lambda-application-design-part-3/

In the Operating Lambda series, I cover important topics for developers, architects, and systems administrators who are managing AWS Lambda-based applications. This three-part series discusses application design for Lambda-based applications.

Part 1 shows how to work with Service Quotas, when to request increases, and architecting with quotas in mind. Part 2 covers scaling and concurrency and the different behaviors of on-demand and Provisioned Concurrency. This post discusses choosing and managing runtimes, networking and VPC configurations, and different invocation modes.

Choosing and managing runtimes in Lambda functions

Lambda natively supports a variety of common runtimes, including Python, Node.js, Java, .NET, and others. If you prefer to use any other runtime, such as PHP or Perl, you can use a custom runtime. There are lists of community-maintained runtimes for a wide range of programming languages or you can build your own. As a result, Lambda customers can run Erlang, COBOL, Haskell, and almost any other runtime needed to support their workloads.

Regardless of compute platform, developers must take action if their preferred runtime version is no longer supported by the maintaining organization. Lambda has a documented runtime support policy for languages and frameworks that explains the process for runtime deprecation. Deprecation dates are driven by each runtime’s maintaining organization. Generally, AWS allows you to continue running functions on runtime versions for a period of time after the official runtime deprecation. You will receive emails from AWS if you have functions affected by an upcoming deprecation.

Runtimes and performance

Your choice of runtime is likely determined by a variety of factors. These include the skills available in your development team and the runtimes used in existing projects, especially in migrations. This choice may also be influenced by IT policy in your organization and other external factors. Lambda is agnostic to the choice of runtime, so you are free to choose without sacrificing capabilities within the service.

Different runtimes have different performance profiles in on-demand compute services like Lambda. For example, both Python and Node.js are fast to initialize and offer reasonable overall performance. Java is much slower to initialize but can be fast once running. The programming language Go can be extremely performant for both start-up and runtime. If performance is critical to your application, then profiling and comparing runtime performance is an important step before coding applications.

Multiple runtimes in single applications

Serverless applications usually consist of multiple Lambda functions. Each Lambda function can use only one runtime but you can use multiple runtimes across multiple functions. This enables you to choose the most appropriate runtime for the task performed by the function. Unlike traditional applications that tend to use a single language runtime, serverless applications allow you to mix-and-match runtimes as needed.

For example, in a Lambda function that transforms JSON between services, you could choose Node.js for your business logic. In another function handling data processing, you may choose Python. Both can co-exist in a single serverless application.

Managing AWS SDKs in Lambda functions

The Lambda service also provides AWS SDKs for your chosen runtime. These enable you to interact with AWS services using familiar code constructs. SDK versions change frequently as AWS adds new features and services, and the Lambda service periodically updates the bundled SDKs. Consequently, if you are using the bundled SDK version, you will notice the version changes in your function even if your function code has not changed.

The bundled SDK is provided as a convenience for developers building simpler functions or using the Lambda console for development. In these cases, SDK version changes typically do not impact the functionality or performance. To lock an SDK version and make it immutable, it’s recommended that you create a Lambda layer with a specific version of an SDK and include this in your deployment package.

To learn more, see the “Creating a layer containing the AWS SDK” section at https://aws.amazon.com/blogs/compute/using-lambda-layers-to-simplify-your-development-process.

Networking and VPC configurations

Lambda functions always run inside VPCs owned by the Lambda service. As with customer-owned VPCs, this allows the service to apply network access and security rules to everything within the VPC. These VPCs are not visible to customers, the configurations are maintained automatically, and monitoring is managed by the service.

When you use some AWS services, they create resources that are only accessible from within your customer VPC. To access these resources with Lambda, your Lambda function must also be configured for access to the same VPC. Importantly, unless you are accessing services with resources in a customer VPC, there is no additional benefit to add a VPC configuration.

By default, Lambda functions have access to the public internet. This is not the case after they have been configured with access to one of your VPCs. If you continue to need access to resources on the internet, set up a NAT instance or Amazon NAT Gateway. Alternatively, you can also use VPC endpoints to enable private communications between your VPC and supported AWS services.

The high availability of the Lambda service depends upon access to multiple Availability Zones within the Region where your code runs. When you create a Lambda function without a VPC configuration, it’s automatically available in all Availability Zones within the Region. When you set up VPC access, you choose which Availability Zones the Lambda function can use. As a result, to provide continued high availability, ensure that the function has access to at least two Availability Zones.

The Lambda service uses a Network Function Virtualization platform to provide NAT capabilities from the Lambda VPC to customer VPCs. This configures the required elastic network interfaces (ENIs) at the point where Lambda functions are created or updated. It also enables ENIs from your account to be shared across multiple execution environments, which allows Lambda to make more efficient use of a limited network resource when functions scale.

Since ENIs are an exhaustible resource and there is a soft limit of 350 ENIs per Region, you should monitor elastic network interface usage if you are configuring Lambda functions for VPC access. Generally, if you increase concurrency limits in Lambda, you should evaluate if you need an elastic network interface increase. If the limit is reached, this causes invocations of VPC-enabled Lambda functions to be throttled.

Most serverless services can be used without further VPC configuration, while most instance-based services require VPC configuration:

AWS services accessible by default AWS services requiring VPC configuration
Amazon API Gateway
Amazon CloudFront
Amazon CloudWatch
Amazon Comprehend
Amazon DynamoDB
Amazon EventBridge
Amazon Kinesis
Amazon Lex
Amazon Polly
Amazon Rekognition
Amazon S3
Amazon SNS
Amazon SQS
AWS Step Functions
Amazon Textract
Amazon Transcribe
Amazon Translate
Amazon ECS
Amazon EFS
Amazon ElastiCache
Amazon Elasticsearch Service
Amazon MSK
Amazon MQ
Amazon RDS
Amazon Redshift

To learn more, read about how VPC networking works with Lambda functions.

Comparing Lambda invocation modes

Lambda functions can be invoked either synchronously or asynchronously, depending upon the trigger. In synchronous invocations, the caller waits for the function to complete execution and the function can return a value. In asynchronous operation, the caller places the event on an internal queue, which is then processed by the Lambda function.

Synchronous invocation Asynchronous invocation Polling invocation
AWS CLI
Elastic Load Balancing (Application Load Balancer)
Amazon Cognito
Amazon Lex
Amazon Alexa
Amazon API Gateway
Amazon CloudFront via Lambda@Edge
Amazon Kinesis Data Firehose
Amazon S3 Batch
Amazon S3
Amazon SNS
Amazon Simple Email Service
AWS CloudFormation
Amazon CloudWatch Logs
Amazon CloudWatch Events
AWS CodeCommit
AWS Config
AWS IoT
AWS IoT Events
AWS CodePipeline
Amazon DynamoDB
Amazon Kinesis
Amazon Managed Streaming for Apache Kafka (Amazon MSK)
Amazon SQS

Synchronous invocations are well suited for short-lived Lambda functions. Although Lambda functions can run for up to 15 minutes, synchronous callers may have shorter timeouts. For example, API Gateway has a 29-second integration timeout, so a Lambda function running for more than 29 seconds will not return a value successfully. In synchronous invocations, if the Lambda function fails, retries are the responsibility of the trigger.

In asynchronous invocations, the caller continues with other work and cannot receive a return value from the Lambda function. The function can send the result to a destination, configurable based on success or failure. The internal queue between the caller and the function ensures that messages are stored durably. The Lambda service scales up the concurrency of the processing function as this internal queue grows. If an error occurs in the Lambda function, the retry behavior is determined by the Lambda service.

AWS service Invocation type Retry behavior
Amazon API Gateway Synchronous None – returns error to the client
Amazon S3 Asynchronous Retries with exponential backoff
Amazon SNS Asynchronous Retries with exponential backoff
Amazon DynamoDB Streams Synchronous from poller Retries until data expiration (24 hours)
Amazon Kinesis Synchronous from poller Retries until data expiration (24 hours to 7 days)
AWS CLI Synchronous/Asynchronous Configured by CLI call
AWS SDK Synchronous/Asynchronous Application-specific
Amazon SQS Synchronous from poller Retries until Message Retention Period expires or is sent to a dead-letter queue

To learn more, read “Invoking AWS Lambda functions” and “Introducing AWS Lambda Destinations”.

Conclusion

This post discusses choosing and managing runtimes, the effect on performance, and how you can use multiple runtimes within a single serverless application. It explains the networking model and whether a Lambda function must have access to a customer VPC or can run with the default VPC configuration. It also compares the different invocation modes for Lambda functions.

For more serverless learning resources, visit Serverless Land.

Extending SaaS products with serverless functions

Post Syndicated from James Beswick original https://aws.amazon.com/blogs/compute/extending-saas-products-with-serverless-functions/

This post was written by Santiago Cardenas, Sr Partner SA. and Nir Mashkowski, Principal Product Manager.

Increasingly, customers turn to software as a service (SaaS) solutions for the potential of lowering the total cost of ownership (TCO). This enables customers to focus their teams on business priorities instead of managing and maintaining software and infrastructure. Startups are building SaaS products for a wide variety of common application types to take advantage of these market needs.

As SaaS accelerates adoption, enterprise customers expect the same capabilities that are available with traditional, on-premises software. They want the ability to customize system behavior and use rich integrations that can help build solutions rapidly.

For customization and extensibility, many independent software vendors (ISVs) are building application programming interfaces (APIs) and integration hooks. To extend these capabilities, many SaaS builders expose a common set of APIs:

  • Event APIs emit events when SaaS entities change. Synchronous event APIs block the SaaS action until the API completes a request. Asynchronous are non-blocking and use mechanisms like pub/sub and webhooks to inform the caller of updates. Event APIs are used for many purposes, such as enriching incoming data or triggering workflows.
  • CRUD APIs allow developers to interact with entities within the SaaS product. They can be used by mobile or web clients to add, update, and remove records, for example.
  • Schema APIs allow developers to create data entities in the SaaS product, such as tables, key-value stores, or document repositories.
  • User experience (UX) components. Many SaaS products include an SDK that helps provide a consistent look-and-feel and built-in support for common functions, such as authentication. Components are sometimes delivered as code libraries or as an online API that renders the UI.

Business systems expose different subsets of the APIs based on the application domain. Extensibility models are built on top of those APIs and can take various different forms. ISVs use these APIs to build features such as “no code” workflow engines, UX, and report generators. In those cases, the SaaS product runs a domain-specific language (DSL) where it controls compute, storage, and memory consumption.

Figure 1: Example of various APIs providing extensibility within a SaaS app

This level of customization is acceptable for many business users. However, for more sophisticated customization, this requires the ability to write custom code. When coding is needed, some business systems choose to provide sandboxing for the user code within the service. Others choose to ask developers to host the extensibility model themselves.

The growth of vendor-hosted SaaS extensions

First-generation SaaS products essentially “lift and shift” on-premises enterprise software, where each customer has a copy of the entire stack. This single tenant model offers simplicity, a smaller blast radius, and faster time to market.

Newer, born-in-the-cloud SaaS products implement a multi-tenant approach, where all resources are shared across customers. This model may be easier to maintain but can present challenges for handling security, isolation, and resource allocation.

Multi-tenancy challenges are harder when customers can run custom code inside the SaaS infrastructure. To solve this, SaaS builders may start with a customer hosted approach, where customers implement their own extensions by consuming SaaS APIs. This means customers must learn and install an SDK, deploy, and maintain an app in their cloud. This often results in higher cost and slower time to market.

To simplify this model, SaaS builders are finding ways to allow developers to write code directly within the SaaS product. The event driven, pay-per-execution, and polyglot nature of serverless functions provides new capabilities for implementing SaaS extensibility. This model is called vendor hosted SaaS extensions.

SaaS builders are using AWS Lambda for serverless functions to provide flexible compute options to their customers. The goal is to abstract away and simplify the consumption model. AWS provides SaaS builders with features and controls to customize the execution environments as part of their own SaaS product. This allows SaaS owners more flexibility when deciding on isolation models, usability, and cost considerations.

Isolating tenant requests

Isolation of customer requests is important both at the product level and at the tenant level. Product-level isolation focuses on controlling and enforcing the access to data between tenants. It ensures that one tenant is separated from another tenant’s functions. Tenant-level isolation focuses on resources allocated to serve requests. These may include identity, network and internet access, file system access, and memory/CPU allocation.

Figure 2: Example of hierarchical levels of abstraction

Usability

SaaS product owners can allow customers to use familiar programming languages within the serverless functions. This allows customers to grow with the service and potentially host and scale independently, using their own infrastructure.

Usability considers the domain and industry of the product. For example, if the SaaS product enables data processing, it may enable invocation of serverless functions during these workflows. Additionally, these functions may provide the customer the context of the user, application, tenant, and the domain. A streamlined, opinionated deployment workflow that abstracts away initial configuration can also aid customer adoption.

Managing costs

Cost is an important factor in driving adoption. It’s an important differentiator to pay only for the resources used, while being able to scale in response to events. This can help reduce costs that are passed on to SaaS customers.

Examples of SaaS product extensibility

Multiple AWS Partners are extending their SaaS product using Lambda for on-demand scalable compute. This enables them to focus on enriching the customer experience that is associated with their business domain. Examples include:

  • Segment Functions, which seamlessly integrates as a source or destination. The service uses code snippets to allow customers to enrich data, enforce consistency, and connect to APIs and services that power their workflows.
  • Freshworks’ Neo platform provides extensibility using the concept of apps. These are powered by Lambda functions hosting the core business logic and backends. Apps are triggered by unplanned and scheduled Freshworks events (customer support tickets, IT service cases, contacts, and deal updates), in addition to app-specific and external events.
  • Netlify Functions enables customers to supercharge frontend code with functions in their development workflow. These can power automated triggers, connect to third-party APIs, or provide user authentication.

All of these SaaS partners abstract away the deployment, versioning, and configuration of custom code using Lambda.

Conclusion

As customers increasingly use SaaS solutions in their businesses, they want the same customization and extensibility available in on-premises solutions. SaaS partners have developed APIs and integration hooks to help address this need. For more sophisticated customization, products enable custom code to run within their SaaS workflows.

This presents SaaS partners with isolation, usability, and cost challenges and many of them are now using serverless functions to address these challenges. Lambda provides a pay-per-value compute service that scales automatically to meet customer demand. Segment Functions, Freshworks, and Netlify Functions have all used Lambda to provide extensibility to their customers.

Lambda continues to develop features and functionality to power the extensibility of SaaS products. We look forward to seeing the new ways you use Lambda to extend your SaaS product for your customers. Share your Lambda extensibility story with us at [email protected].

For more serverless learning resources, visit Serverless Land.

Operating Lambda: Application design – Scaling and concurrency: Part 2

Post Syndicated from James Beswick original https://aws.amazon.com/blogs/compute/operating-lambda-application-design-scaling-and-concurrency-part-2/

In the Operating Lambda series, I cover important topics for developers, architects, and systems administrators who are managing AWS Lambda-based applications. This three-part series discusses application design for Lambda-based applications.

Part 1 shows how to work with Service Quotas, when to request increases, and architecting with quotas in mind. This post covers scaling and concurrency and the different behaviors of on-demand and Provisioned Concurrency.

Scaling and concurrency in Lambda

Lambda is engineered to provide managed scaling in a way that does not rely upon threading or any custom engineering in your code. As traffic increases, Lambda increases the number of concurrent executions of your functions.

When a function is first invoked, the Lambda service creates an instance of the function and runs the handler method to process the event. After completion, the function remains available for a period of time to process subsequent events. If other events arrive while the function is busy, Lambda creates more instances of the function to handle these requests concurrently.

For an initial burst of traffic, your cumulative concurrency in a Region can reach between 500 and 3000 per minute, depending upon the Region. After this initial burst, functions can scale by an additional 500 instances per minute. If requests arrive faster than a function can scale, or if a function reaches maximum capacity, additional requests fail with a throttling error (status code 429).

All AWS accounts start with a default concurrent limit of 1000 per Region. This is a soft limit that you can increase by submitting a request in the AWS Support Center.

On-demand scaling example

In this example, a Lambda receives 10,000 synchronous requests from Amazon API Gateway. The concurrency limit for the account is 10,000. The following shows four scenarios:

On-demand scaling example

In each case, all of the requests arrive at the same time in the minute they are scheduled:

  1. All requests arrive immediately: 3000 requests are handled by new execution environments; 7000 are throttled.
  2. Requests arrive over 2 minutes: 3000 requests are handled by new execution environments in the first minute; the remaining 2000 are throttled. In minute 2, another 500 environments are created and the 3000 original environments are reused; 1500 are throttled.
  3. Requests arrive over 3 minutes: 3000 requests are handled by new execution environments in the first minute; the remaining 333 are throttled. In minute 2, another 500 environments are created and the 3000 original environments are reused; all requests are served. In minute 3, the remaining 3334 requests are served by warm environments.
  4. Requests arrive over 4 minutes: In minute 1, 2500 requests are handled by new execution environment; the same environments are reused in subsequent minutes to serve all requests.

Provisioned Concurrency scaling example

The majority of Lambda workloads are asynchronous so the default scaling behavior provides a reasonable trade-off between throughput and configuration management overhead. However, for synchronous invocations from interactive workloads, such as web or mobile applications, there are times when you need more control over how many concurrent function instances are ready to receive traffic.

Provisioned Concurrency is a Lambda feature that prepares concurrent execution environments in advance of invocations. Consequently, this can be used to address two issues. First, if expected traffic arrives more quickly than the default burst capacity, Provisioned Concurrency can ensure that your function is available to meet the demand. Second, if you have latency-sensitive workloads that require predictable double-digit millisecond latency, Provisioned Concurrency solves the typical cold start issues associated with default scaling.

Provisioned Concurrency is a configuration available for a specific published version or alias of a Lambda function. It does not rely on any custom code or changes to a function’s logic, and it’s compatible with features such as VPC configuration, Lambda layers. For more information on how Provisioned Concurrency optimizes performance for Lambda-based applications, watch this Tech Talk video.

Using the same scenarios with 10,000 requests, the function is configured with a Provisioned Concurrency of 7,000:

Provisioned Concurrency scaling example

  1. In case #1, 7,000 requests are handled by the provisioned environments with no cold start. The remaining 3,000 requests are handled by new, on-demand execution environments.
  2. In cases #2-4, all requests are handled by provisioned environments in the minute when they arrive.

Using service integrations and asynchronous processing

Synchronous requests from services like API Gateway require immediate responses. In many cases, these workloads can be rearchitected as asynchronous workloads. In this case, API Gateway uses a service integration to persist messages in an Amazon SQS queue durably. A Lambda function consumes these messages from the queue, and updates the status in an Amazon DynamoDB table. Another API endpoint provides the status of the request by querying the DynamoDB table:

Async with polling example

API Gateway has a default throttle limit of 10,000 requests per second, which can be raised upon request. SQS standard queues support a virtually unlimited throughput of API actions such as SendMessage.

The Lambda function consuming the messages from SQS can control the speed of processing through a combination of two factors. The first is BatchSize, which is the number of messages received by each invocation of the function, and the second is concurrency. Provided there is still concurrency available in your account, the Lambda function is not throttled while processing messages from an SQS queue.

In asynchronous workflows, it’s not possible to pass the result of the function back through the invocation path. The original API Gateway call receives an acknowledgment that the message has been stored in SQS, which is returned back to the caller. There are multiple mechanisms for returning the result back to the caller. One uses a DynamoDB table, as shown, to store a transaction ID and status, which is then polled by the caller via another API Gateway endpoint until the work is finished. Alternatively, you can use webhooks via Amazon SNS or WebSockets via AWS IoT Core to return the result.

Using this asynchronous approach can make it much easier to handle unpredictable traffic with significant volumes. While it is not suitable for every use case, it can simplify scalability operations.

Reserved concurrency

Lambda functions in a single AWS account in one Region share the concurrency limit. If one function exceeds the concurrent limit, this prevents other functions from being invoked by the Lambda service. You can set reserved capacity for Lambda functions to ensure that they can be invoked even if the overall capacity has been exhausted. Reserved capacity has two effects on a Lambda function:

  1. The reserved capacity is deducted from the overall capacity for the AWS account in a given Region. The Lambda function always has the reserved capacity available exclusively for its own invocations.
  2. The reserved capacity restricts the maximum number of concurrency invocations for that function. Synchronous requests arriving in excess of the reserved capacity limit fail with a throttling error.

You can also use reserved capacity to throttle the rate of requests processed by your workload. For Lambda functions that are invoked asynchronously or using an internal poller, such as for S3, SQS, or DynamoDB integrations, reserved capacity limits how many requests are processed simultaneously. In this case, events are stored durably in internal queues until the Lambda function is available. This can help create a smoothing effect for handling spiky levels of traffic.

For example, a Lambda function receives messages from an SQS queue and writes to a DynamoDB table. It has a reserved concurrency of 10 with a batch size of 10 items. The SQS queue rapidly receives 1,000 messages. The Lambda function scales up to 10 concurrent instances, each processing 10 messages from the queue. While it takes longer to process the entire queue, this results in a consistent rate of write capacity units (WCUs) consumed by the DynamoDB table.

Reserved concurrency for throttling example

To learn more, read “Managing AWS Lambda Function Concurrency” and “Managing concurrency for a Lambda function”.

Conclusion

This post explains scaling and concurrency in Lambda and the different behaviors of on-demand and Provisioned Concurrency. It also shows how to use service integrations and asynchronous patterns in Lambda-based applications. Finally, I discuss how reserved concurrency works and how to use it in your application design.

Part 3 will discuss choosing and managing runtimes, networking and VPC configurations, and different invocation modes.

For more serverless learning resources, visit Serverless Land.