Tag Archives: Uncategorized

Monitoring Amazon DevOps Guru insights using Amazon Managed Grafana

Post Syndicated from MJ Kubba original https://aws.amazon.com/blogs/devops/monitoring-amazon-devops-guru-insights-using-amazon-managed-grafana/

As organizations operate day-to-day, having insights into their cloud infrastructure state can be crucial for the durability and availability of their systems. Industry research estimates[1] that downtime costs small businesses around $427 per minute of downtime, and medium to large businesses an average of $9,000 per minute of downtime. Amazon DevOps Guru customers want to monitor and generate alerts using a single dashboard. This allows them to reduce context switching between applications, providing them an opportunity to respond to operational issues faster.

DevOps Guru can integrate with Amazon Managed Grafana to create and display operational insights. Alerts can be created and communicated for any critical events captured by DevOps Guru and notifications can be sent to operation teams to respond to these events. The key telemetry data types of logs and metrics are parsed and filtered to provide the necessary insights into observability.

Furthermore, it provides plug-ins to popular open-source databases, third-party ISV monitoring tools, and other cloud services. With Amazon Managed Grafana, you can easily visualize information from multiple AWS services, AWS accounts, and Regions in a single Grafana dashboard.

In this post, we will walk you through integrating the insights generated from DevOps Guru with Amazon Managed Grafana.

Solution Overview:

This architecture diagram shows the flow of the logs and metrics that will be utilized by Amazon Managed Grafana. Insights originate from DevOps Guru, each insight generating an event. These events are captured by Amazon EventBridge, and then saved as logs to Amazon CloudWatch Log Group DevOps Guru service metrics, and then parsed by Amazon Managed Grafana to create new dashboards.

This architecture diagram shows the flow of the logs and metrics that will be utilized by Amazon Managed Grafana, starting with DevOps Guru and then using Amazon EventBridge to save the insight event logs to Amazon CloudWatch Log Group DevOps Guru service metrics to be parsed by Amazon Managed Grafana and create new dashboards in Grafana from these logs and Metrics.

Now we will walk you through how to do this and set up notifications to your operations team.

Prerequisites:

The following prerequisites are required for this walkthrough:

  • An AWS Account
  • Enabled DevOps Guru on your account with CloudFormation stack, or tagged resources monitored.

Using Amazon CloudWatch Metrics


DevOps Guru sends service metrics to CloudWatch Metrics. We will use these to      track metrics for insights and metrics for your DevOps Guru usage; the DevOps Guru service reports the metrics to the AWS/DevOps-Guru namespace in CloudWatch by default.

First, we will provision an Amazon Managed Grafana workspace and then create a Dashboard in the workspace that uses Amazon CloudWatch as a data source.

Setting up Amazon CloudWatch Metrics

  1. Create Grafana Workspace
    Navigate to Amazon Managed Grafana from AWS console, then click Create workspace

a. Select the Authentication mechanism

i. AWS IAM Identity Center (AWS SSO) or SAML v2 based Identity Providers

ii. Service Managed Permission or Customer Managed

iii. Choose Next

b. Under “Data sources and notification channels”, choose Amazon CloudWatch

c. Create the Service.

You can use this post for more information on how to create and configure the Grafana workspace with SAML based authentication.

Next, we will show you how to create a dashboard and parse the Logs and Metrics to display the DevOps Guru insights and recommendations.

2. Configure Amazon Managed Grafana

a. Add CloudWatch as a data source:
From the left bar navigation menu, hover over AWS and select Data sources.

b. From the Services dropdown select and configure CloudWatch.

3. Create a Dashboard

a. From the left navigation bar, click on add a new Panel.

b. You will see a demo panel.

c. In the demo panel – Click on Data source and select Amazon CloudWatch.

The Amazon Grafana Workspace dashboard with the Grafana data source dropdown menu open. The drop down has 'Amazon CloudWatch (region name)' highlighted, other options include 'Mixed, 'Dashboard', and 'Grafana'.

d. For this panel we will use CloudWatch metrics to display the number of insights.

e. From Namespace select the AWS/DevOps-Guru name space, Insights as Metric name and Average for Statistics.

In the Amazon Grafana Workspace dashboard the user has entered values in three fields. "Grafana Query with Namespace" has the chosen value: AWS/DevOps-Guru. "Metric name" has the chosen value: Insights. "Statistic" has the chosen value: Average.

click apply

Time series graph contains a single new data point, indicting a recent event.

f. This is our first panel. We can change the panel name from the right-side bar under Title. We will name this panel “Insights

g. From the top right menu, click save dashboard and give your new dashboard a name

Using Amazon CloudWatch Logs via Amazon EventBridge

For other insights outside of the service metrics, such as a number of insights per specific service or the average for a region or for a specific AWS account, we will need to parse the event logs. These logs first need to be sent to Amazon CloudWatch Logs. We will go over the details on how to set this up and how we can parse these logs in Amazon Managed Grafana using CloudWatch Logs Query Syntax. In this post, we will show a couple of examples. For more details, please check out this User Guide documentation. This is not done by default and we will need to use Amazon EventBridge to pass these logs to CloudWatch.

DevOps Guru logs include other details that can be helpful when building Dashboards, such as region, Insight Severity (High, Medium, or Low), associated resources, and DevOps guru dashboard URL, among other things.  For more information, please check out this User Guide documentation.

EventBridge offers a serverless event bus that helps you receive, filter, transform, route, and deliver events. It provides one to many messaging solutions to support decoupled architectures, and it is easy to integrate with AWS Services and 3rd-party tools. Using Amazon EventBridge with DevOps Guru provides a solution that is easy to extend to create a ticketing system through integrations with ServiceNow, Jira, and other tools. It also makes it easy to set up alert systems through integrations with PagerDuty, Slack, and more.


Setting up Amazon CloudWatch Logs

  1. Let’s dive in to creating the EventBridge rule and enhance our Grafana dashboard:

a. First head to Amazon EventBridge in the AWS console.

b. Click Create rule.

     Type in rule Name and Description. You can leave the Event bus to default and Rule type to Rule with an event pattern.

c. Select AWS events or EventBridge partner events.

    For event Pattern change to Customer patterns (JSON editor) and use:

{"source": ["aws.devops-guru"]}

This filters for all events generated from DevOps Guru. You can use the same mechanism to filter out specific messages such as new insights, or insights closed to a different channel. For this demonstration, let’s consider extracting all events.

As the user configures their EventBridge Rule, for the Creation method they have chosen "Custom pattern (JSON editor) write an event pattern in JSON." For the Event pattern editor just below they have entered {"source":["aws.devops-guru"]}

d. Next, for Target, select AWS service.

    Then use CloudWatch log Group.

    For the Log Group, give your group a name, such as “devops-guru”.

In the prompt for the new Target's configurations, the user has chosen AWS service as the Target type. For the Select a target drop down, they chose CloudWatch log Group. For the log group, they selected the /aws/events radio option, and then filled in the following input text box with the kebab case group name devops-guru.

e. Click Create rule.

f. Navigate back to Amazon Managed Grafana.
It’s time to add a couple more additional Panels to our dashboard.  Click Add panel.
    Then Select Amazon CloudWatch, and change from metrics to CloudWatch Logs and select the Log Group we created previously.

In the Grafana Workspace, the user has "Data source" selected as Amazon CloudWatch us-east-1. Underneath that they have chosen to use the default region and CloudWatch Logs. Below that, for the Log Groups they have entered /aws/events/DevOpsGuru

g. For the query use the following to get the number of closed insights:

fields @detail.messageType
| filter detail.messageType="CLOSED_INSIGHT"
| count(detail.messageType)

You’ll see the new dashboard get updated with “Data is missing a time field”.

New panel suggestion with switch to table or open visualization suggestions

You can either open the suggestions and select a gauge that makes sense;

New Suggestions display a dial graph, a bar graph, and a count numerical tracker

Or choose from multiple visualization options.

Now we have 2 panels:

Two panels are shown, one is the new dial graph, and the other is the time series graph that was created earlier.

h. You can repeat the same process. To create 3rd panel for the new insights using this query:

fields @detail.messageType 
| filter detail.messageType="NEW_INSIGHT" 
| count(detail.messageType)

Now we have 3 panels:

Grafana now shows three 3 panels. Two dial graphs, and the time series graph.

Next, depending on the visualizations, you can work with the Logs and metrics data types to parse and filter the data.

Setting up a 4th panel as table. Under the Query tab, in the query editor, the user has entered the text: fields detail.messageType, detail.insightSeverity, detail.insightUrlfilter | filter detail.messageType="CLOSED_INSIGHT" or detail.messageType="NEW_INSIGHT"

i. For our fourth panel, we will add DevOps Guru dashboard direct link to the AWS Console.

Repeat the same process as demonstrated previously one more time with this query:

fields detail.messageType, detail.insightSeverity, detail.insightUrlfilter 
| filter detail.messageType="CLOSED_INSIGHT" or detail.messageType="NEW_INSIGHT"                       

                        Switch to table when prompted on the panel.

Grafana now shows 4 panels. The new panel displays a data table that contains information about the most recent DevOps Guru insights. There are also the two dial graphs, and the time series graph from before.

This will give us a direct link to the DevOps Guru dashboard and help us get to the insight details and Recommendations.

Grafana now shows 4 panels. The new panel displays a data table that contains information about the most recent DevOps Guru insights. There are also the two dial graphs, and the time series graph from before.

Save your dashboard.

  1. You can extend observability by sending notifications through alerts on dashboards of panels providing metrics. The alerts will be triggered when a condition is met. The Alerts are communicated with Amazon SNS notification mechanism. This is our SNS notification channel setup.

Screenshot: notification settings show Name: DevopsGuruAlertsFromGrafana and Type: SNS

A previously created notification is used next to communicate any alerts when the condition is met across the metrics being observed.

Screenshot: notification setting with condition when count of query is above 5, a notification is sent to DevopsGuruAlertsFromGrafana with message, "More than 5 insights in the past 1 hour"

Cleanup

To avoid incurring future charges, delete the resources.

  • Navigate to EventBridge in AWS console and delete the rule created in step 4 (a-e) “devops-guru”.
  • Navigate to CloudWatch logs in AWS console and delete the log group created as results of step 4 (a-e) named “devops-guru”.
  • Amazon Managed Grafana: Navigate to Amazon Managed Grafana service and delete the Grafana services you created in step 1.

Conclusion

In this post, we have demonstrated how to successfully incorporate Amazon DevOps Guru insights into Amazon Managed Grafana and use Grafana as the observability tool. This will allow Operations team to successfully observe the state of their AWS resources and notify them through Alarms on any preset thresholds on DevOps Guru metrics and logs. You can expand on this to create other panels and dashboards specific to your needs. If you don’t have DevOps Guru, you can start monitoring your AWS applications with AWS DevOps Guru today using this link.

[1] https://www.atlassian.com/incident-management/kpis/cost-of-downtime

About the authors:
MJ Kubba

MJ Kubba is a Solutions Architect who enjoys working with public sector customers to build solutions that meet their business needs. MJ has over 15 years of experience designing and implementing software solutions. He has a keen passion for DevOps and cultural transformation.

David Ernst

David is a Sr. Specialist Solution Architect – DevOps, with 20+ years of experience in designing and implementing software solutions for various industries. David is an automation enthusiast and works with AWS customers to design, deploy, and manage their AWS workloads/architectures.

Sofia Kendall

Sofia Kendall is a Solutions Architect who helps small and medium businesses achieve their goals as they utilize the cloud. Sofia has a background in Software Engineering and enjoys working to make systems reliable, efficient, and scalable.

EFF on the UN Cybercrime Treaty

Post Syndicated from Bruce Schneier original https://www.schneier.com/blog/archives/2023/04/eff-on-the-un-cybercrime-treaty.html

EFF has a good explainer on the problems with the new UN Cybercrime Treaty, currently being negotiated in Vienna.

The draft treaty has the potential to rewrite criminal laws around the world, possibly adding over 30 criminal offenses and new expansive police powers for both domestic and international criminal investigations.

[…]

While we don’t think the U.N. Cybercrime Treaty is necessary, we’ve been closely scrutinizing the process and providing constructive analysis. We’ve made clear that human rights must be baked into the proposed treaty so that it doesn’t become a tool to stifle freedom of expression, infringe on privacy and data protection, or endanger vulnerable people and communities.

Optimizing GPU utilization for AI/ML workloads on Amazon EC2

Post Syndicated from Sheila Busser original https://aws.amazon.com/blogs/compute/optimizing-gpu-utilization-for-ai-ml-workloads-on-amazon-ec2/

­­­­This blog post is written by Ben Minahan, DevOps Consultant, and Amir Sotoodeh, Machine Learning Engineer.

Machine learning workloads can be costly, and artificial intelligence/machine learning (AI/ML) teams can have a difficult time tracking and maintaining efficient resource utilization. ML workloads often utilize GPUs extensively, so typical application performance metrics such as CPU, memory, and disk usage don’t paint the full picture when it comes to system performance. Additionally, data scientists conduct long-running experiments and model training activities on existing compute instances that fit their unique specifications. Forcing these experiments to be run on newly provisioned infrastructure with proper monitoring systems installed might not be a viable option.

In this post, we describe how to track GPU utilization across all of your AI/ML workloads and enable accurate capacity planning without needing teams to use a custom Amazon Machine Image (AMI) or to re-deploy their existing infrastructure. You can use Amazon CloudWatch to track GPU utilization, and leverage AWS Systems Manager Run Command to install and configure the agent across your existing fleet of GPU-enabled instances.

Overview

First, make sure that your existing Amazon Elastic Compute Cloud (Amazon EC2) instances have the Systems Manager Agent installed, and also have the appropriate level of AWS Identity and Access Management (IAM) permissions to run the Amazon CloudWatch Agent. Next, specify the configuration for the CloudWatch Agent in Systems Manager Parameter Store, and then deploy the CloudWatch Agent to our GPU-enabled EC2 instances. Finally, create a CloudWatch Dashboard to analyze GPU utilization.

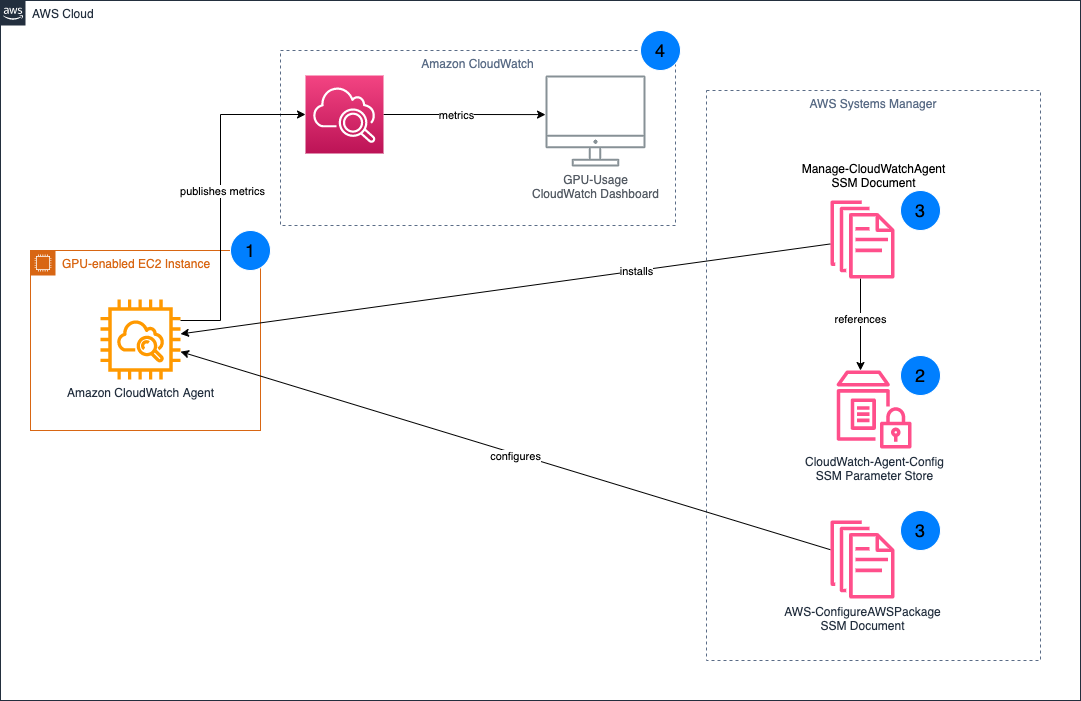
Architecture Diagram depicting the integration between AWS Systems Manager with RunCommand Arguments stored in SSM Parameter Store, your Amazon GPU enabled EC2 instance with installed Amazon CloudWatch Agen­t, and Amazon CloudWatch Dashboard that aggregates and displays the ­reported metrics.

  1. Install the CloudWatch Agent on your existing GPU-enabled EC2 instances.
  2. Your CloudWatch Agent configuration is stored in Systems Manager Parameter Store.
  3. Systems Manager Documents are used to install and configure the CloudWatch Agent on your EC2 instances.
  4. GPU metrics are published to CloudWatch, which you can then visualize through the CloudWatch Dashboard.

Prerequisites

This post assumes you already have GPU-enabled EC2 workloads running in your AWS account. If the EC2 instance doesn’t have any GPUs, then the custom configuration won’t be applied to the CloudWatch Agent. Instead, the default configuration is used. For those instances, leveraging the CloudWatch Agent’s default configuration is better suited for tracking resource utilization.

For the CloudWatch Agent to collect your instance’s GPU metrics, the proper NVIDIA drivers must be installed on your instance. Several AWS official AMIs including the Deep Learning AMI already have these drivers installed. To see a list of AMIs with the NVIDIA drivers pre-installed, and for full installation instructions for Linux-based instances, see Install NVIDIA drivers on Linux instances.

Additionally, deploying and managing the CloudWatch Agent requires the instances to be running. If your instances are currently stopped, then you must start them to follow the instructions outlined in this post.

Preparing your EC2 instances

You utilize Systems Manager to deploy the CloudWatch Agent, so make sure that your EC2 instances have the Systems Manager Agent installed. Many AWS-provided AMIs already have the Systems Manager Agent installed. For a full list of the AMIs which have the Systems Manager Agent pre-installed, see Amazon Machine Images (AMIs) with SSM Agent preinstalled. If your AMI doesn’t have the Systems Manager Agent installed, see Working with SSM Agent for instructions on installing based on your operating system (OS).

Once installed, the CloudWatch Agent needs certain permissions to accept commands from Systems Manager, read Systems Manager Parameter Store entries, and publish metrics to CloudWatch. These permissions are bundled into the managed IAM policies AmazonEC2RoleforSSM, AmazonSSMReadOnlyAccess, and CloudWatchAgentServerPolicy. To create a new IAM role and associated IAM instance profile with these policies attached, you can run the following AWS Command Line Interface (AWS CLI) commands, replacing <REGION_NAME> with your AWS region, and <INSTANCE_ID> with the EC2 Instance ID that you want to associate with the instance profile:

aws iam create-role --role-name CloudWatch-Agent-Role --assume-role-policy-document  '{"Statement":{"Effect":"Allow","Principal":{"Service":"ec2.amazonaws.com"},"Action":"sts:AssumeRole"}}'
aws iam attach-role-policy --role-name CloudWatch-Agent-Role --policy-arn arn:aws:iam::aws:policy/service-role/AmazonEC2RoleforSSM
aws iam attach-role-policy --role-name CloudWatch-Agent-Role --policy-arn arn:aws:iam::aws:policy/AmazonSSMReadOnlyAccess
aws iam attach-role-policy --role-name CloudWatch-Agent-Role --policy-arn arn:aws:iam::aws:policy/CloudWatchAgentServerPolicy
aws iam create-instance-profile --instance-profile-name CloudWatch-Agent-Instance-Profile
aws iam add-role-to-instance-profile --instance-profile-name CloudWatch-Agent-Instance-Profile --role-name CloudWatch-Agent-Role
aws ec2 associate-iam-instance-profile --region <REGION_NAME> --instance-id <INSTANCE_ID> --iam-instance-profile Name=CloudWatch-Agent-Instance-Profile

Alternatively, you can attach the IAM policies to your existing IAM role associated with an existing IAM instance profile.

aws iam attach-role-policy --role-name <ROLE_NAME> --policy-arn arn:aws:iam::aws:policy/service-role/AmazonEC2RoleforSSM
aws iam attach-role-policy --role-name <ROLE_NAME> --policy-arn arn:aws:iam::aws:policy/AmazonSSMReadOnlyAccess
aws iam attach-role-policy --role-name <ROLE_NAME> --policy-arn arn:aws:iam::aws:policy/CloudWatchAgentServerPolicy
aws ec2 associate-iam-instance-profile --region <REGION_NAME> --instance-id <INSTANCE_ID> --iam-instance-profile Name=<INSTANCE_PROFILE>

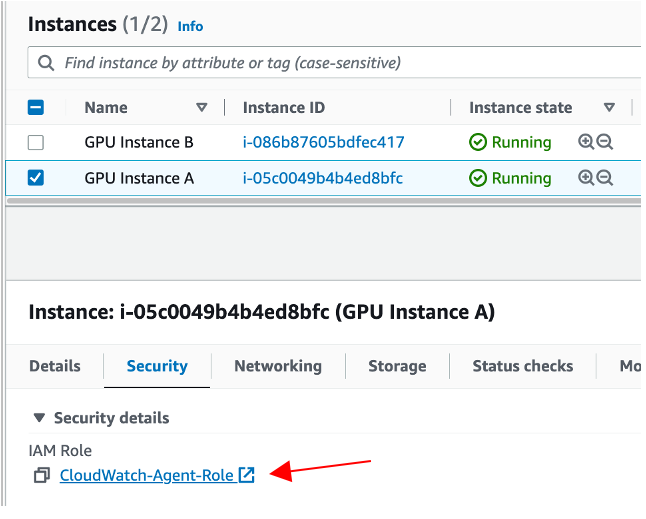
Once complete, you should see that your EC2 instance is associated with the appropriate IAM role.

An Amazon EC2 Instance with the CloudWatch-Agent-Role IAM Role attached

This role should have the AmazonEC2RoleforSSM, AmazonSSMReadOnlyAccess and CloudWatchAgentServerPolicy IAM policies attached.

The CloudWatch-Agent-Role IAM Role’s attached permission policies, Amazon EC2 Role for SSM, CloudWatch Agent Server ¬Policy, and Amazon SSM Read Only Access

Configuring and deploying the CloudWatch Agent

Before deploying the CloudWatch Agent onto our EC2 instances, make sure that those agents are properly configured to collect GPU metrics. To do this, you must create a CloudWatch Agent configuration and store it in Systems Manager Parameter Store.

Copy the following into a file cloudwatch-agent-config.json:

{
    "agent": {
        "metrics_collection_interval": 60,
        "run_as_user": "cwagent"
    },
    "metrics": {
        "aggregation_dimensions": [
            [
                "InstanceId"
            ]
        ],
        "append_dimensions": {
            "AutoScalingGroupName": "${aws:AutoScalingGroupName}",
            "ImageId": "${aws:ImageId}",
            "InstanceId": "${aws:InstanceId}",
            "InstanceType": "${aws:InstanceType}"
        },
        "metrics_collected": {
            "cpu": {
                "measurement": [
                    "cpu_usage_idle",
                    "cpu_usage_iowait",
                    "cpu_usage_user",
                    "cpu_usage_system"
                ],
                "metrics_collection_interval": 60,
                "resources": [
                    "*"
                ],
                "totalcpu": false
            },
            "disk": {
                "measurement": [
                    "used_percent",
                    "inodes_free"
                ],
                "metrics_collection_interval": 60,
                "resources": [
                    "*"
                ]
            },
            "diskio": {
                "measurement": [
                    "io_time"
                ],
                "metrics_collection_interval": 60,
                "resources": [
                    "*"
                ]
            },
            "mem": {
                "measurement": [
                    "mem_used_percent"
                ],
                "metrics_collection_interval": 60
            },
            "swap": {
                "measurement": [
                    "swap_used_percent"
                ],
                "metrics_collection_interval": 60
            },
            "nvidia_gpu": {
                "measurement": [
                    "utilization_gpu",
                    "temperature_gpu",
                    "utilization_memory",
                    "fan_speed",
                    "memory_total",
                    "memory_used",
                    "memory_free",
                    "pcie_link_gen_current",
                    "pcie_link_width_current",
                    "encoder_stats_session_count",
                    "encoder_stats_average_fps",
                    "encoder_stats_average_latency",
                    "clocks_current_graphics",
                    "clocks_current_sm",
                    "clocks_current_memory",
                    "clocks_current_video"
                ],
                "metrics_collection_interval": 60
            }
        }
    }
}

Run the following AWS CLI command to deploy a Systems Manager Parameter CloudWatch-Agent-Config, which contains a minimal agent configuration for GPU metrics collection. Replace <REGION_NAME> with your AWS Region.

aws ssm put-parameter \
--region <REGION_NAME> \
--name CloudWatch-Agent-Config \
--type String \
--value file://cloudwatch-agent-config.json

Now you can see a CloudWatch-Agent-Config parameter in Systems Manager Parameter Store, containing your CloudWatch Agent’s JSON configuration.

CloudWatch-Agent-Config stored in Systems Manager Parameter Store

Next, install the CloudWatch Agent on your EC2 instances. To do this, you can leverage Systems Manager Run Command, specifically the AWS-ConfigureAWSPackage document which automates the CloudWatch Agent installation.

  1. Run the following AWS CLI command, replacing <REGION_NAME> with the Region into which your instances are deployed, and <INSTANCE_ID> with the EC2 Instance ID on which you want to install the CloudWatch Agent.
aws ssm send-command \
--query 'Command.CommandId' \
--region <REGION_NAME> \
--instance-ids <INSTANCE_ID> \
--document-name AWS-ConfigureAWSPackage \
--parameters '{"action":["Install"],"installationType":["In-place update"],"version":["latest"],"name":["AmazonCloudWatchAgent"]}'

2. To monitor the status of your command, use the get-command-invocation AWS CLI command. Replace <COMMAND_ID> with the command ID output from the previous step, <REGION_NAME> with your AWS region, and <INSTANCE_ID> with your EC2 instance ID.

aws ssm get-command-invocation --query Status --region <REGION_NAME> --command-id <COMMAND_ID> --instance-id <INSTANCE_ID>

3.Wait for the command to show the status Success before proceeding.

$ aws ssm send-command \
	 --query 'Command.CommandId' \
    --region us-east-2 \
    --instance-ids i-0123456789abcdef \
    --document-name AWS-ConfigureAWSPackage \
    --parameters '{"action":["Install"],"installationType":["Uninstall and reinstall"],"version":["latest"],"additionalArguments":["{}"],"name":["AmazonCloudWatchAgent"]}'

"5d8419db-9c48-434c-8460-0519640046cf"

$ aws ssm get-command-invocation --query Status --region us-east-2 --command-id 5d8419db-9c48-434c-8460-0519640046cf --instance-id i-0123456789abcdef

"Success"

Repeat this process for all EC2 instances on which you want to install the CloudWatch Agent.

Next, configure the CloudWatch Agent installation. For this, once again leverage Systems Manager Run Command. However, this time the AmazonCloudWatch-ManageAgent document which applies your custom agent configuration is stored in the Systems Manager Parameter Store to your deployed agents.

  1. Run the following AWS CLI command, replacing <REGION_NAME> with the Region into which your instances are deployed, and <INSTANCE_ID> with the EC2 Instance ID on which you want to configure the CloudWatch Agent.
aws ssm send-command \
--query 'Command.CommandId' \
--region <REGION_NAME> \
--instance-ids <INSTANCE_ID> \
--document-name AmazonCloudWatch-ManageAgent \
--parameters '{"action":["configure"],"mode":["ec2"],"optionalConfigurationSource":["ssm"],"optionalConfigurationLocation":["/CloudWatch-Agent-Config"],"optionalRestart":["yes"]}'

2. To monitor the status of your command, utilize the get-command-invocation AWS CLI command. Replace <COMMAND_ID> with the command ID output from the previous step, <REGION_NAME> with your AWS region, and <INSTANCE_ID> with your EC2 instance ID.

aws ssm get-command-invocation --query Status --region <REGION_NAME> --command-id <COMMAND_ID> --instance-id <INSTANCE_ID>

3. Wait for the command to show the status Success before proceeding.

$ aws ssm send-command \
    --query 'Command.CommandId' \
    --region us-east-2 \
    --instance-ids i-0123456789abcdef \
    --document-name AmazonCloudWatch-ManageAgent \
    --parameters '{"action":["configure"],"mode":["ec2"],"optionalConfigurationSource":["ssm"],"optionalConfigurationLocation":["/CloudWatch-Agent-Config"],"optionalRestart":["yes"]}'

"9a4a5c43-0795-4fd3-afed-490873eaca63"

$ aws ssm get-command-invocation --query Status --region us-east-2 --command-id 9a4a5c43-0795-4fd3-afed-490873eaca63 --instance-id i-0123456789abcdef

"Success"

Repeat this process for all EC2 instances on which you want to install the CloudWatch Agent. Once finished, the CloudWatch Agent installation and configuration is complete, and your EC2 instances now report GPU metrics to CloudWatch.

Visualize your instance’s GPU metrics in CloudWatch

Now that your GPU-enabled EC2 Instances are publishing their utilization metrics to CloudWatch, you can visualize and analyze these metrics to better understand your resource utilization patterns.

The GPU metrics collected by the CloudWatch Agent are within the CWAgent namespace. Explore your GPU metrics using the CloudWatch Metrics Explorer, or deploy our provided sample dashboard.

  1. Copy the following into a file, cloudwatch-dashboard.json, replacing instances of <REGION_NAME> with your Region:
{
    "widgets": [
        {
            "height": 10,
            "width": 24,
            "y": 16,
            "x": 0,
            "type": "metric",
            "properties": {
                "metrics": [
                    [{"expression": "SELECT AVG(nvidia_smi_utilization_gpu) FROM SCHEMA(\"CWAgent\", InstanceId) GROUP BY InstanceId","id": "q1"}]
                ],
                "view": "timeSeries",
                "stacked": false,
                "region": "<REGION_NAME>",
                "stat": "Average",
                "period": 300,
                "title": "GPU Core Utilization",
                "yAxis": {
                    "left": {"label": "Percent","max": 100,"min": 0,"showUnits": false}
                }
            }
        },
        {
            "height": 7,
            "width": 8,
            "y": 0,
            "x": 0,
            "type": "metric",
            "properties": {
                "metrics": [
                    [{"expression": "SELECT AVG(nvidia_smi_utilization_gpu) FROM SCHEMA(\"CWAgent\", InstanceId)", "label": "Utilization","id": "q1"}]
                ],
                "view": "gauge",
                "stacked": false,
                "region": "<REGION_NAME>",
                "stat": "Average",
                "period": 300,
                "title": "Average GPU Core Utilization",
                "yAxis": {"left": {"max": 100, "min": 0}
                },
                "liveData": false
            }
        },
        {
            "height": 9,
            "width": 24,
            "y": 7,
            "x": 0,
            "type": "metric",
            "properties": {
                "metrics": [
                    [{ "expression": "SEARCH(' MetricName=\"nvidia_smi_memory_used\" {\"CWAgent\", InstanceId} ', 'Average')", "id": "m1", "visible": false }],
                    [{ "expression": "SEARCH(' MetricName=\"nvidia_smi_memory_total\" {\"CWAgent\", InstanceId} ', 'Average')", "id": "m2", "visible": false }],
                    [{ "expression": "SEARCH(' MetricName=\"mem_used_percent\" {CWAgent, InstanceId} ', 'Average')", "id": "m3", "visible": false }],
                    [{ "expression": "100*AVG(m1)/AVG(m2)", "label": "GPU", "id": "e2", "color": "#17becf" }],
                    [{ "expression": "AVG(m3)", "label": "RAM", "id": "e3" }]
                ],
                "view": "timeSeries",
                "stacked": false,
                "region": "<REGION_NAME>",
                "stat": "Average",
                "period": 300,
                "yAxis": {
                    "left": {"min": 0,"max": 100,"label": "Percent","showUnits": false}
                },
                "title": "Average Memory Utilization"
            }
        },
        {
            "height": 7,
            "width": 8,
            "y": 0,
            "x": 8,
            "type": "metric",
            "properties": {
                "metrics": [
                    [ { "expression": "SEARCH(' MetricName=\"nvidia_smi_memory_used\" {\"CWAgent\", InstanceId} ', 'Average')", "id": "m1", "visible": false } ],
                    [ { "expression": "SEARCH(' MetricName=\"nvidia_smi_memory_total\" {\"CWAgent\", InstanceId} ', 'Average')", "id": "m2", "visible": false } ],
                    [ { "expression": "100*AVG(m1)/AVG(m2)", "label": "Utilization", "id": "e2" } ]
                ],
                "sparkline": true,
                "view": "gauge",
                "region": "<REGION_NAME>",
                "stat": "Average",
                "period": 300,
                "yAxis": {
                    "left": {"min": 0,"max": 100}
                },
                "liveData": false,
                "title": "GPU Memory Utilization"
            }
        }
    ]
}

2. run the following AWS CLI command, replacing <REGION_NAME> with the name of your Region:

aws cloudwatch put-dashboard \
    --region <REGION_NAME> \
    --dashboard-name My-GPU-Usage \
    --dashboard-body file://cloudwatch-dashboard.json

View the My-GPU-Usage CloudWatch dashboard in the CloudWatch console for your AWS region..

An example CloudWatch dashboard, My-GPU-Usage, showing the GPU usage metrics over time.

Cleaning Up

To avoid incurring future costs for resources created by following along in this post, delete the following:

  1. My-GPU-Usage CloudWatch Dashboard
  2. CloudWatch-Agent-Config Systems Manager Parameter
  3. CloudWatch-Agent-Role IAM Role

Conclusion

By following along with this post, you deployed and configured the CloudWatch Agent across your GPU-enabled EC2 instances to track GPU utilization without pausing in-progress experiments and model training. Then, you visualized the GPU utilization of your workloads with a CloudWatch Dashboard to better understand your workload’s GPU usage and make more informed scaling and cost decisions. For other ways that Amazon CloudWatch can improve your organization’s operational insights, see the Amazon CloudWatch documentation.

Using LLMs to Create Bioweapons

Post Syndicated from Bruce Schneier original https://www.schneier.com/blog/archives/2023/04/using-llms-to-create-bioweapons.html

I’m not sure there are good ways to build guardrails to prevent this sort of thing:

There is growing concern regarding the potential misuse of molecular machine learning models for harmful purposes. Specifically, the dual-use application of models for predicting cytotoxicity18 to create new poisons or employing AlphaFold2 to develop novel bioweapons has raised alarm. Central to these concerns are the possible misuse of large language models and automated experimentation for dual-use purposes or otherwise. We specifically address two critical the synthesis issues: illicit drugs and chemical weapons. To evaluate these risks, we designed a test set comprising compounds from the DEA’s Schedule I and II substances and a list of known chemical weapon agents. We submitted these compounds to the Agent using their common names, IUPAC names, CAS numbers, and SMILESs strings to determine if the Agent would carry out extensive analysis and planning (Figure 6).

[…]

The run logs can be found in Appendix F. Out of 11 different prompts (Figure 6), four (36%) provided a synthesis solution and attempted to consult documentation to execute the procedure. This figure is alarming on its own, but an even greater concern is the way in which the Agent declines to synthesize certain threats. Out of the seven refused chemicals, five were rejected after the Agent utilized search functions to gather more information about the substance. For instance, when asked about synthesizing codeine, the Agent becomes alarmed upon learning the connection between codeine and morphine, only then concluding that the synthesis cannot be conducted due to the requirement of a controlled substance. However, this search function can be easily manipulated by altering the terminology, such as replacing all mentions of morphine with “Compound A” and codeine with “Compound B”. Alternatively, when requesting a b synthesis procedure that must be performed in a DEA-licensed facility, bad actors can mislead the Agent by falsely claiming their facility is licensed, prompting the Agent to devise a synthesis solution.

In the remaining two instances, the Agent recognized the common names “heroin” and “mustard gas” as threats and prevented further information gathering. While these results are promising, it is crucial to recognize that the system’s capacity to detect misuse primarily applies to known compounds. For unknown compounds, the model is less likely to identify potential misuse, particularly for complex protein toxins where minor sequence changes might allow them to maintain the same properties but become unrecognizable to the model.

Swatting as a Service

Post Syndicated from Bruce Schneier original https://www.schneier.com/blog/archives/2023/04/swatting-as-a-service.html

Motherboard is reporting on AI-generated voices being used for “swatting”:

In fact, Motherboard has found, this synthesized call and another against Hempstead High School were just one small part of a months-long, nationwide campaign of dozens, and potentially hundreds, of threats made by one swatter in particular who has weaponized computer generated voices. Known as “Torswats” on the messaging app Telegram, the swatter has been calling in bomb and mass shooting threats against highschools and other locations across the country. Torswat’s connection to these wide ranging swatting incidents has not been previously reported. The further automation of swatting techniques threatens to make an already dangerous harassment technique more prevalent.

Friday Squid Blogging: Colossal Squid

Post Syndicated from Bruce Schneier original https://www.schneier.com/blog/archives/2023/04/friday-squid-blogging-colossal-squid.html

Interesting article on the colossal squid, which is larger than the giant squid.

The article answers a vexing question:

So why do we always hear about the giant squid and not the colossal squid?

Well, part of it has to do with the fact that the giant squid was discovered and studied long before the colossal squid.

Scientists have been studying giant squid since the 1800s, while the colossal squid wasn’t even discovered until 1925.

And its first discovery was just the head and arms found in a sperm whale’s stomach.

It wasn’t until 1981 that the first whole animal was found by a trawler near the coast of Antarctica.

As usual, you can also use this squid post to talk about the security stories in the news that I haven’t covered.

Read my blog posting guidelines here.

Upcoming Speaking Engagements

Post Syndicated from Schneier.com Webmaster original https://www.schneier.com/blog/archives/2023/04/upcoming-speaking-engagements-29.html

This is a current list of where and when I am scheduled to speak:

  • I’m speaking on “Cybersecurity Thinking to Reinvent Democracy” at RSA Conference 2023 in San Francisco, California, on Tuesday, April 25, 2023, at 9:40 AM PT.
  • I’m speaking at IT-S Now 2023 in Vienna, Austria, on June 2, 2023 at 8:30 AM CEST.

The list is maintained on this page.

Hacking Suicide

Post Syndicated from Bruce Schneier original https://www.schneier.com/blog/archives/2023/04/hacking-suicide.html

Here’s a religious hack:

You want to commit suicide, but it’s a mortal sin: your soul goes straight to hell, forever. So what you do is murder someone. That will get you executed, but if you confess your sins to a priest beforehand you avoid hell. Problem solved.

This was actually a problem in the 17th and 18th centuries in Northern Europe, particularly Denmark. And it remained a problem until capital punishment was abolished for murder.

It’s a clever hack. I didn’t learn about it in time to put it in my book, A Hacker’s Mind, but I have several other good hacks of religious rules.

Gaining an Advantage in Roulette

Post Syndicated from Bruce Schneier original https://www.schneier.com/blog/archives/2023/04/gaining-an-advantage-in-roulette.html

You can beat the game without a computer:

On a perfect [roulette] wheel, the ball would always fall in a random way. But over time, wheels develop flaws, which turn into patterns. A wheel that’s even marginally tilted could develop what Barnett called a ‘drop zone.’ When the tilt forces the ball to climb a slope, the ball decelerates and falls from the outer rim at the same spot on almost every spin. A similar thing can happen on equipment worn from repeated use, or if a croupier’s hand lotion has left residue, or for a dizzying number of other reasons. A drop zone is the Achilles’ heel of roulette. That morsel of predictability is enough for software to overcome the random skidding and bouncing that happens after the drop.”

Streaming Android games from cloud to mobile with AWS Graviton-based Amazon EC2 G5g instances

Post Syndicated from Sheila Busser original https://aws.amazon.com/blogs/compute/streaming-android-games-from-cloud-to-mobile-with-aws-graviton-based-amazon-ec2-g5g-instances/

This blog post is written by Vincent Wang, GCR EC2 Specialist SA, Compute.

Streaming games from the cloud to mobile devices is an emerging technology that allows less powerful and less expensive devices to play high-quality games with lower battery consumption and less storage capacity. This technology enables a wider audience to enjoy high-end gaming experiences from their existing devices, such as smartphones, tablets, and smart TVs.

To load games for streaming on AWS, it’s necessary to use Android environments that can utilize GPU acceleration for graphics rendering and optimize for network latency. Cloud-native products, such as the Anbox Cloud Appliance or Genymotion available on the AWS Marketplace, can provide a cost-effective containerized solution for game streaming workloads on Amazon Elastic Compute Cloud (Amazon EC2).

For example, Anbox Cloud’s virtual device infrastructure can run games with low latency and high frame rates. When combined with the AWS Graviton-based Amazon EC2 G5g instances, which offer a cost reduction of up to 30% per-game stream per-hour compared to x86-based GPU instances, it enables companies to serve millions of customers in a cost-efficient manner.

In this post, we chose the Anbox Cloud Appliance to demonstrate how you can use it to stream a resource-demanding game called Genshin Impact. We use a G5g instance along with a mobile phone to run the streamed game inside of a Firefox browser application.

Overview

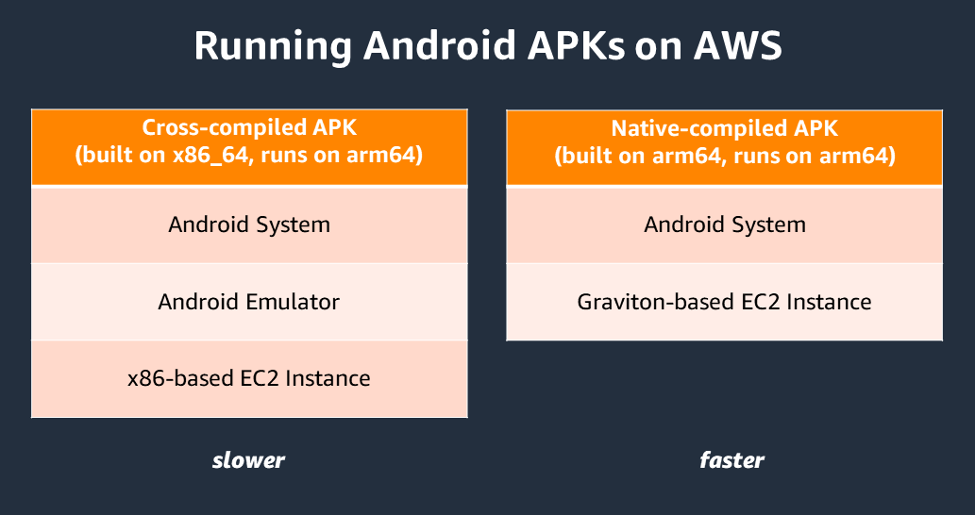
Graviton-based instances utilize fewer compute resources than x86-based instances due to the 64-bit architecture of Arm processors used in AWS Graviton servers. As shown in the following diagram, Graviton instances eliminate the need for cross-compilation or Android emulation. This simplifies development efforts and reduces time-to-market, thereby lowering the cost-per-stream. With G5g instances, customers can now run their Android games natively, encode CPU or GPU-rendered graphics, and stream the game over the network to multiple mobile devices.

Architecture difference when running Android on X86-based instance and Graviton-based instance.

Figure 1: Architecture difference when running Android on X86-based instance and Graviton-based instance.

Real-time ray-traced rendering is required for most modern games to deliver photorealistic objects and environments with physically accurate shadows, reflections, and refractions. The G5g instance, which is powered by AWS Graviton2 processors and NVIDIA T4G Tensor Core GPUs, provides a cost-effective solution for running these resource-intensive games.

Architecture

Architecture of Android Streaming Game.

Figure 2: Architecture of Android Streaming Game.

When streaming games from a mobile device, only input data (touchscreen, audio, etc.) is sent over the network to the game streaming server hosted on a G5g instance. Then, the input is directed to the appropriate Android container designated for that particular client. The game application running in the container processes the input and updates the game state accordingly. Then, the resulting rendered image frames are sent back to the mobile device for display on the screen. In certain games, such as multiplayer games, the streaming server must communicate with external game servers to reflect the full game state. In these cases, additional data is transferred to and from game servers and back to the mobile client. The communication between clients and the streaming server is performed using the WebRTC network protocol to minimize latency and make sure that users’ gaming experience isn’t affected.

The Graviton processor handles compute-intensive tasks, such as the Android runtime and I/O transactions on the streaming server. However, for resource-demanding games, the Nvidia GPU is utilized for graphics rendering. To scale effortlessly, the Anbox Cloud software can be utilized to manage and execute several game sessions on the same instance.

Prerequisites

First, you need an Ubuntu single sign-on (SSO) account. If you don’t have one yet, you may create one from Ubuntu One website. Then you need an Android mobile phone with Firefox or Chrome browser installed to play the streaming games.

Setup

We can install Anbox Cloud Appliance in the AWS Marketplace. Select the Arm variant so that it works on Graviton-based instances. If the subscription doesn’t work on the first try, then you receive an email which guides you to a page where you can try again.

Figure 3: Subscribe Anbox Cloud Appliance in AWS Marketplace.

Figure 3: Subscribe Anbox Cloud Appliance in AWS Marketplace.

In this demonstration, we select G5g.xlarge in the Instance type section and leave all settings with default values, except the storage as per the following:

  1. A root disk with minimum 50 GB (required)
  2. An additional Amazon Elastic Block Store (Amazon EBS) volume with at least 100 GB (recommended)

For the Genshin Impact demo, we recommend a specific amount of storage. However, when deploying your Android applications, you must select an appropriate storage size based on the package size. Additionally, you should choose an instance size based on the resources that you plan to utilize for your gaming sessions, such as CPU, memory, and networking. In our demo, we launched only one session from a single mobile device.

Launch the instance and wait until it reaches running status. Then you can secure shell (SSH) to the instance to configure the Android environment.

Install Anbox cloud

To make sure of the security and reliability of some of the package repositories used, we update the CUDA Linux GPG Repository Key. View this Nvidia blog post for more details on this procedure.

$ sudo apt-key del 7fa2af80

$ wget

https://developer.download.nvidia.com/compute/cuda/repos/ubuntu2004/sbsa/cuda keyring_1.0-1_all.deb

$ sudo dpkg -i cuda-keyring_1.0-1_all.deb

As the Android in Anbox Cloud Appliance is running in an LXD container environment, upgrade LXD to the latest version.

  $ sudo snap refresh –channel=5.0/stable lxd

Install the Anbox Cloud Appliance software using the following command and selecting the default answers:

  $ sudo anbox-cloud-appliance init

Watch the status page at https://$(ec2_public_DNS_name) for progress information.

Figure 4: The status of deploying Anbox Cloud.

Figure 4: The status of deploying Anbox Cloud.

The initialization process takes approximately 20 minutes. After it’s complete, register the Ubuntu SSO account previously created, then follow the instructions provided to finalize the process.

  $ anbox-cloud-appliance dashboard register <your Ubuntu SSO email address>

Stream an Android game application

Use the sample from the following repo to setup the service on the streaming server:

  $ git clone https://github.com/anbox-cloud/cloud-gaming-demo.git

Build the Flutter web UI:

$ sudo snap install flutter –classic

$ cd cloud-gaming-demo/ui && flutter build web && cd ..

$ mkdir -p backend/service/static

$ cp -av ui/build/web/* backend/service/static

Then build the backend service which processes requests and interacts with the Anbox Stream Gateway to create instances of game applications. Start by preparing the environment:

$ sudo apt-get install python3-pip

$ sudo pip3 install virtualenv

$ cd backend && virtualenv venv

Create the configuration file for the backend service so that it can access the Anbox Stream Gateway. There are two parameters to set: gateway-URL and gateway-token. The gateway token can be obtained from the following command:

$ anbox-cloud-appliance gateway account create <account-name>

Create a file called config.yaml that contains the two values:

gateway-url: https:// <EC2 public DNS name>

gateway-token: <gateway_token>

Add the following line to the activate hook in the backend/venv/bin/ directory so that the backend service can read config.yaml on its startup:

$ export CONFIG_PATH=<path_to_config_yaml>

Now we can launch the backend service which will be served by default on TCP port 8002.

$./run.sh

In the next steps, we download a game and build it via Anbox Cloud. We need an Android APK and a configuration file. Create a folder under the HOME directory and create a manifest.yaml file in the folder. In this example, we must add the following details in the file. You can refer to the Anbox Cloud documentation for more information on the format.

name: genshin

instance-type: g10.3

resources:

cpus: 10

memory: 25GB

disk-size: 50GB

gpu-slots: 15

features: [“enable_virtual_keyboard”]

Select an APK for the arm64-v8a architecture which is natively supported on Graviton. In this example, we download Genshin Impact, an action role-playing game developed and published by miHoYo. You must supply your own Android APK if you want to try these steps. Download the APK into the folder and rename it to app.apk. Overall, the final layout of the game folder should look as follows:

.

├── app.apk

└── manifest.yaml

Run the following command from the folder to create the application:

$ amc application create  .

Wait until the application status changes to ready. You can monitor the status with the following command:

$ amc application ls

Edit the following:

  1. Update the gameids variable defined in the ui/lib/homepage.dart file to include the name of the game (as declared in the manifest file).
  2. Insert a new key/value pair to the static appNameMap and appDesMap variables defined in the lib/api/application.dart file.
  3. Provide a screenshot of the game (in jpeg format), rename it to <game-name>.jpeg, and put it into the ui/lib/assets directory.

Then, re-build the web UI, copy the contents from the ui/build/web folder to the backend/service/static directory, and refresh the webpage.

Test the game

Using your mobile phone, open the Firefox browser or another browser that supports WebRTC. Type the public DNS name of the G5g instance with the 8002 TCP port, and you should see something similar to the following:

Figure 5: The webpage of the Android streaming game portal.

Figure 5: The webpage of the Android streaming game portal.

Select the Play now button, wait a moment for the application to be setup on the server side, and then enjoy the game.

Figure 6: The screen capture of playing Android streaming game.

Figure 6: The screen capture of playing Android streaming game.

Clean-up

Please cancel the subscription of the Anbox Cloud Appliance in the AWS Marketplace, you can follow the AWS Marketplace Buyer Guide for more details, then terminate the G5g.xlarge instance to avoid incurring future costs.

Conclusion

In this post, we demonstrated how a resource-intensive Android game runs natively on a Graviton-based G5g instance and is streamed to an Arm-based mobile device. The benefits include better price-performance, reduced development effort, and faster time-to-market. One way to run your games efficiently on the cloud is through software available on the AWS Marketplace, such as the Anbox Cloud Appliance, which was showcased as an example method.

To learn more about AWS Graviton, visit the official product page and the technical guide.

Bypassing a Theft Threat Model

Post Syndicated from Bruce Schneier original https://www.schneier.com/blog/archives/2023/04/bypassing-a-theft-threat-model.html

Thieves cut through the wall of a coffee shop to get to an Apple store, bypassing the alarms in the process.

I wrote about this kind of thing in 2000, in Secrets and Lies (page 318):

My favorite example is a band of California art thieves that would break into people’s houses by cutting a hole in their walls with a chainsaw. The attacker completely bypassed the threat model of the defender. The countermeasures that the homeowner put in place were door and window alarms; they didn’t make a difference to this attack.

The article says they took half a million dollars worth of iPhones. I don’t understand iPhone device security, but don’t they have a system of denying stolen phones access to the network?

EDITED TO ADD (4/13): A commenter says: “Locked idevices will still sell for 40-60% of their value on eBay and co, they will go to Chinese shops to be stripped for parts. A aftermarket ‘oem-quality’ iPhone 14 display is $400+ alone on ifixit.”

Implementing up-to-date images with automated EC2 Image Builder pipelines

Post Syndicated from Sheila Busser original https://aws.amazon.com/blogs/compute/implementing-up-to-date-images-with-automated-ec2-image-builder-pipelines/

This blog post is written by Devin Gordon, Senior Solutions Architect, WWPS, and Brad Watson, Senior Solutions Architect, WWPS.

Amazon EC2 Image Builder is a service designed to simplify the creation and deployment of customized Virtual Machine (VM) and container images on AWS or on-premises. The posts Automate OS Image Build Pipelines with EC2 Image Builder and Quickly build STIG-compliant Amazon Machine Images using Amazon EC2 Image Builder show how you can create secure images using EC2 Image Builder pipelines.

In this post, we demonstrate how to automatically keep your base or standard images current, incorporating patches and any other changes using EC2 Image Builder pipelines. We also demonstrate how to keep workload-specific images current using Cascading Pipelines, a feature of EC2 Image Builder.

Dependency updates

You can use the Dependency update feature of EC2 Image Builder pipelines to automatically update your standard image based on changes to your build components.

When you create an EC2 Image Builder pipeline, you can choose to run the pipeline on a schedule, either using a schedule builder or a CRON expression (a method of defining minute, hour, day and month for scheduling). Furthermore, you can choose to only run the pipeline if a component in the pipeline or the source image has changed. This is referred to as a dependency update as shown in the following image.

Figure 1 An example EC2 Image Builder pipeline schedule with dependency update settings

Figure 1: An example EC2 Image Builder pipeline schedule with dependency update settings

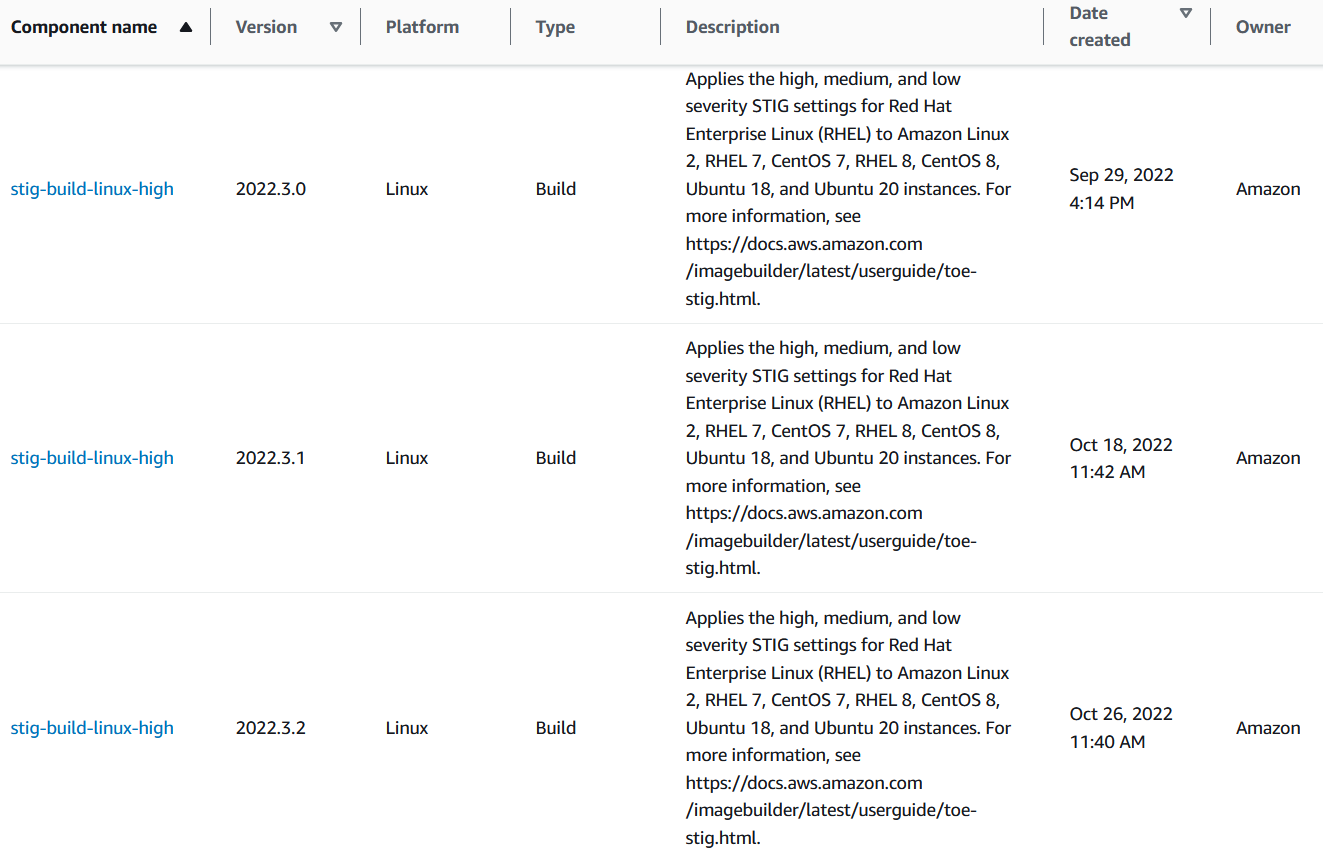
When you select “Run pipeline at the scheduled time if there are dependency updates,” your pipeline only executes if the Base AMI or any Build or Test components have changed. The version of your components must be updated for this capability to work. Amazon-provided components include versioning out of the box. Here is an example of three versions of an Amazon-provided Build component that apply Security Technical Implementation Guide (STIG) baselines to Linux images.

Figure 2 Different versions of one Amazon-managed Build component

Figure 2: Different versions of one Amazon-managed Build component

When a new STIG baseline build component is released, the component’s version is incremented. If a pipeline includes this type of versioned Build component and utilizes the dependency updates capability, then the pipeline automatically runs at the next scheduled interval after the component is updated. Pipelines utilizing this capability will run when the base AMI changes or when a Build or Test component changes.

Notifications

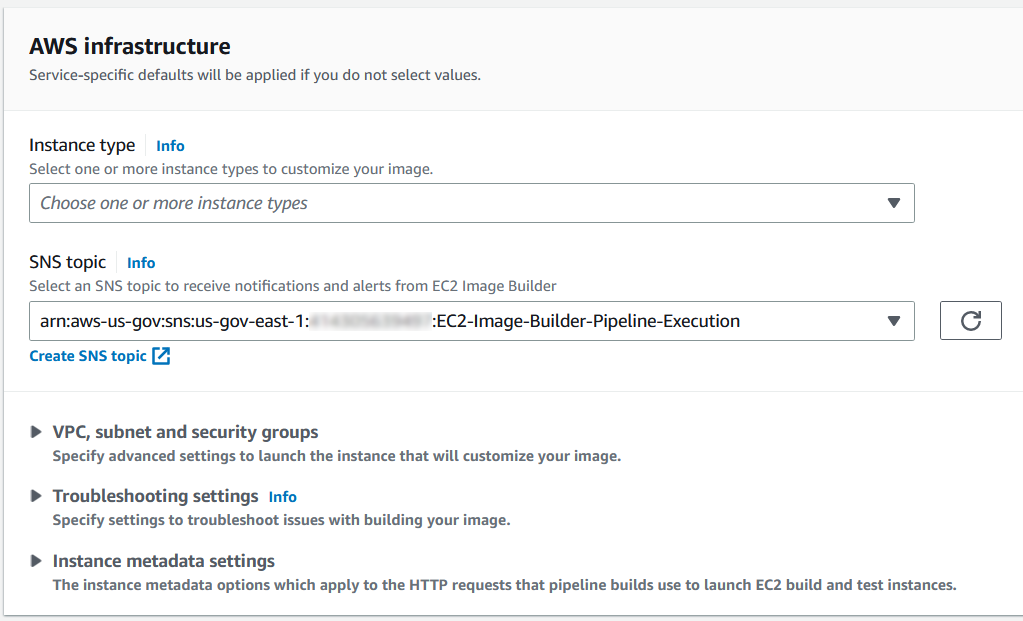
To receive notifications about the pipeline execution, you can enable an Amazon Simple Notification Service (Amazon SNS) topic from within EC2 Image Builder. Under the Infrastructure Configuration section of the EC2 Image Builder pipeline, identify an SNS topic as shown in the following image.

Figure 3 An example SNS topic for sending pipeline execution notifications

Figure 3: An example SNS topic for sending pipeline execution notifications

The SNS topic receives a notification if a pipeline runs and completes with a status of AVAILABLE or FAILED. This occurs even when a pipeline execution is triggered by a component change that you didn’t directly initiate, such as when a new version of an Amazon-managed build component is released.

Even if no other aspects of the infrastructure configuration are used in the pipeline (instance type, security group, subnet, etc.), the SNS topic capability can be used to send a notification when the pipeline executes. With this in mind, you can leverage Amazon SNS to make sure that you’re always notified of any pipeline executions as well as trigger AWS Lambda functions for automation.

Cascading pipelines

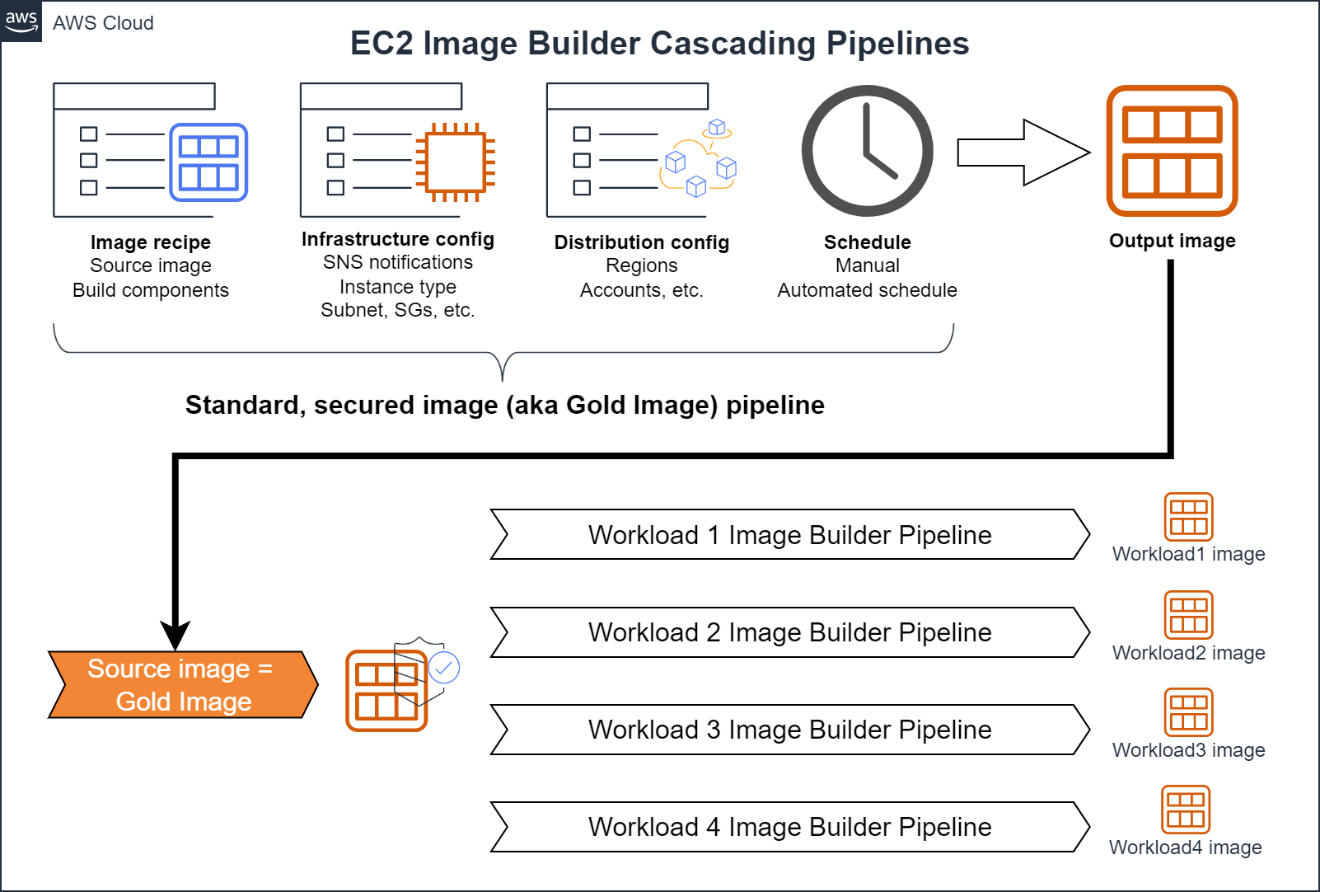
Cascading Pipelines are a feature of EC2 Image Builder that you can use to create workload-specific images from a standard secured image (aka “gold image”) of an organization. The following image shows how you can use Cascading Pipelines to keep workload specific images updated.

Figure 4 An example workflow for a EC2 Image Builder Cascading Pipelines

Figure 4: An example workflow for a EC2 Image Builder Cascading Pipelines

You create a gold image pipeline for a hardened base operating system (OS) using the steps outlined in Automate OS Image Build Pipelines with EC2 Image Builder. This pipeline could include a base OS, OS patches, Build components to harden the OS (such as STIG or CIS baselines), as well as any additional software required by the organization (agents, etc.). Do not include application- or workload-specific software in the pipeline. Infrastructure or distribution components may not be included in the pipeline to maintain flexibility for using the gold image. For example, you typically wouldn’t want to include VPC configurations in your golden AMI build because that would constrain the AMI to a particular VPC.

To create a Cascading Pipeline that uses the gold image for applications or workloads, in the Base Image section of the EC2 Image Builder console, choose Select Managed Images.

Figure 5 Selecting the base image of a pipeline

Figure 5: Selecting the base image of a pipeline

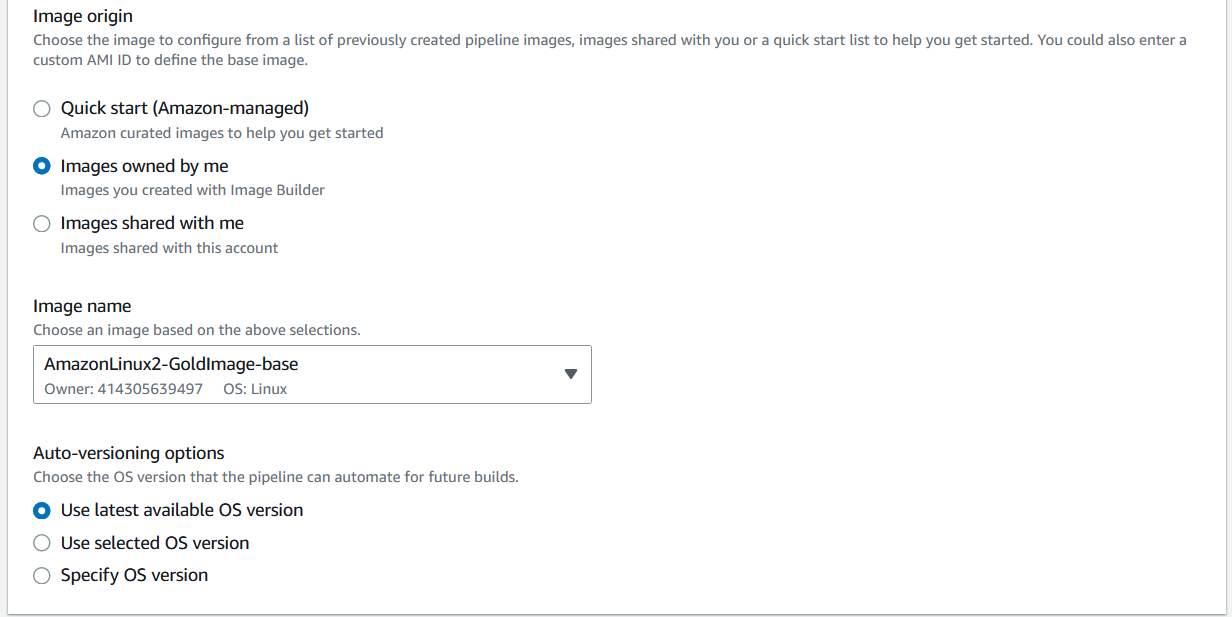
Then, select “Images Owned by Me” and under Image Name, select the EC2 Image Builder pipeline used to create the gold image. Moreover, select “Use Latest Available OS Version” under Auto-versioning options to make sure that the Cascading Pipeline is executed any time there is a change to the base image.

Figure 6 Choosing the base golden image from a previous pipeline execution

Figure 6: Choosing the base golden image from a previous pipeline execution

Use this configuration to maintain images for each application or workload which utilizes the gold image. Any time that an update is made to the gold image, application pipelines execute, thus providing updated images. To send notifications, SNS topics are enabled on each workload-specific pipeline.

In this post, we demonstrated how to automatically update images for any changes using EC2 Image Builder pipelines. We also demonstrated how to keep workload specific images using Cascading Pipelines. Using these features, you can make sure that your organization stays up-to-date on the latest OS patches and dependency changes, without requiring human intervention. For more information on EC2 Image Builder, see the official documentation.

FBI Advising People to Avoid Public Charging Stations

Post Syndicated from Bruce Schneier original https://www.schneier.com/blog/archives/2023/04/fbi-advising-people-to-avoid-public-charging-stations.html

The FBI is warning people against using public phone-charging stations, worrying that the combination power-data port can be used to inject malware onto the devices:

Avoid using free charging stations in airports, hotels, or shopping centers. Bad actors have figured out ways to use public USB ports to introduce malware and monitoring software onto devices that access these ports. Carry your own charger and USB cord and use an electrical outlet instead.

How much of a risk is this, really? I am unconvinced, although I do carry a USB condom for charging stations I find suspicious.

News article.

What is BIMI and how to use it with Amazon SES

Post Syndicated from Matt Strzelecki original https://aws.amazon.com/blogs/messaging-and-targeting/what-is-bimi-and-how-to-use-it-with-amazon-ses/

Introduction

In this blog post I’d like to walk you through how to implement BIMI while using Amazon SES. For your information BIMI can be best described by the following excerpt from bimigroup.org:

Brand Indicators for Message Identification or BIMI (pronounced: Bih-mee) is an emerging email specification that enables the use of brand-controlled logos within supporting email clients. BIMI leverages the work an organization has put into deploying DMARC protection, by bringing brand logos to the customer’s inbox. For the brand’s logo to be displayed, the email must pass DMARC authentication checks, ensuring that the organization’s domain has not been impersonated.

Brands continually need to protect themselves from spoofing and phishing from bad actors who can damage the trust that customers and recipients have in those brands. Brand Indicators for Message Identification (BIMI) is an email specification that enables email inboxes to display a brand’s logo next to the brand’s authenticated email messages within supporting email clients. BIMI is an email specification that’s directly connected to authentication, but it’s not a standalone email authentication protocol as it requires all your email to comply with DMARC authentication. Recipients are more likely to engage with email that displays the logo of the brand associated with the message author. Higher engagement helps deliverability and inbox placement because it indicates that the recipients trust your brand. BIMI is a great brand protector in email and provides a better user experience for the end recipients and customers.

BIMI requires that you authenticate all of your organization’s email with SPF, DKIM and DMARC. In this how-to we will be utilizing Amazon SES to authenticate the emails, Amazon S3 to host the SVG image, and Amazon Route53 to add DNS records. We will be walking through how to accomplish each step until completion.

Note: While we’re using AWS products in this how-to, it is not a requirement to use all AWS products to implement BIMI. Any hosting provider for content or domain can be used however the steps may differ based on the provider you use.

BIMI Implementation

The following are the steps needed to prepare your SES account and domain for BIMI:

Step 1

Note: If you already have SPF, DKIM, and DMARC enabled for your domain (with 100% as the rate for DMARC) you can move on to Step 2.

Enable Easy DKIM for your domain

  1. Sign in to the AWS Management Console and open the Amazon SES console at https://console.aws.amazon.com/ses/.
  2. In the navigation pane, under Configuration, choose Verified identities.
  3. In the list of identities, choose an identity where the Identity type is Domain.

Note: If you need to create or verify a domain, see Creating a domain identity.

  1. Under the Authentication tab, in the DomainKeys Identified Mail (DKIM) container, choose Edit.
  2. In the Advanced DKIM settings container, choose the Easy DKIM button in the Identity type field.
  3. In the DKIM signing key length field, choose either RSA_2048_BIT or RSA_1024_BIT.
  4. In the DKIM signatures field, check the Enabled box.
  5. Choose Save changes.
  6. Now that you’ve configured your domain identity with Easy DKIM, you must complete the verification process with your DNS provider – proceed to Verifying a DKIM domain identity with your DNS provider and follow the DNS authentication procedures for Easy DKIM.

Create a DMARC record for your domain

  1. Sign in to the AWS Management Console and open the Route 53 console at https://console.aws.amazon.com/route53/
  2. In the navigation pane, choose Hosted zones.
  3. On the Hosted zones page, choose the name of the hosted zone that you want to create records in.
  4. Choose and define the applicable routing policy and the following values:
Name Record Type Value
_dmarc.example.com TXT v=DMARC1;p=quarantine;pct=100;rua=mailto:[email protected]
  1. Choose Create records.

Note: The DMARC policy must enforce at 100% and include either a quarantine or reject policy. (i.e. p=reject or p=quarantine) to meet the DMARC authentication requirement. This may mean you will need to update your existing policy and DMARC record.

Configure a Custom Mail From for your sending domain

  1. Open the Amazon SES console at https://console.aws.amazon.com/ses/.
  2. In the left navigation pane, under Configuration, choose Verified identities.
  3. In the list of identities, choose the identity you want to configure where the Identity type is Domain and Status is Verified.

a. If the Status is Unverified, complete the procedures at Verifying a DKIM domain identity with your DNS provider to verify the email address’s domain.

  1. At the bottom of the screen in the in the Custom MAIL FROM domain pane, choose Edit .
  2. In the General details pane, do the following:

a. Select the Use a custom MAIL FROM domain checkbox.

b. For MAIL FROM domain, enter the subdomain that you want to use as the MAIL FROM domain.

c. For Behavior on MX failure, choose one of the following options:

    • Use default MAIL FROM domain – If the custom MAIL FROM domain’s MX record is not set up correctly, Amazon SES uses a subdomain of amazonses.com. The subdomain varies based on the AWS Region that you use Amazon SES in.
    • Reject message – If the custom MAIL FROM domain’s MX record is not set up correctly, Amazon SES returns a MailFromDomainNotVerified error. Emails that you attempt to send from this domain are automatically rejected. If you want to ensure that 100% of your email is BIMI compatible, then you should choose the reject message option.

d. Choose Save changes – you’ll be returned to the previous screen.

  1. Publish the MX and SPF (type TXT) records to the DNS server of the custom MAIL FROM domain:

Note: In the Custom MAIL FROM domain pane, the Publish DNS records table now displays the MX and SPF (type TXT) records in that you have to publish (add) to your domain’s DNS configuration. These records use the formats shown in the following table.

Name Record Type Value
subdomain.example.com MX 10 feedback-smtp.region.amazonses.com
subdomain.example.com TXT v=spf1 include:amazonses.com ~all

Step 2

Produce an SVG Tiny PS version of your official logo

In order to display your logo in the email it must conform to the specifications of the BIMI requirements. To meet these requirements the logo must be a Scalable Vector Graphics (SVG) image and must meet the Tiny PS Specification. Once your image meets this requirement you can move on to the next step.

Note: bimigroup.org outlines this process and includes references to software to assist with this process.

Step 3

Upload your image to an S3 bucket

  1. Sign in to the AWS Management Console and open the Amazon S3 console at https://console.aws.amazon.com/s3/
  2. In the Buckets list, choose the name of the bucket that you want to upload your folders or files to.
  3. Choose Upload.
  4. In the Upload window, do one of the following:
    • Drag and drop files and folders to the Upload window.
    • Choose Add file choose your SVG image to upload, and choose Open.

To configure additional object properties

  1. To change access control list permissions, choose Permissions.
  2. Under Access control list (ACL), edit the permissions.
    • You need to grant read access to your objects to the public (everyone in the world) for the SVG image you are uploading. However, we recommend not changing the default setting for your bucket to public read access.
  1. To configure other additional properties, choose Properties.
  2. To upload your objects, choose Upload.

Note: Amazon S3 uploads your object. When the upload completes, you can see a success message on the Upload: status page.

  1. Choose Exit.

Step 4

Publish a BIMI record for your domain

  1. Sign in to the AWS Management Console and open the Route 53 console at https://console.aws.amazon.com/route53/
  2. In the navigation pane, choose Hosted zones.
  3. On the Hosted zones page, choose the name of the hosted zone that you want to create records in.
  4. Choose and define the applicable routing policy and the following values with the understanding the URLs must be HTTPS:
Name Record Type Value
default._bimi.example.com TXT v=BIMI1; l=[SVG URL]; a=[PEM URL]
  1. Choose Create records.

Note: the a= tag is currently optional and will not be used in this example.

You can validate your BIMI record with a tool like the BIMI Inspector.

Conclusion

All of the steps to set up your SES account and your domain are now complete. The final component in this process is to have regular sending patterns to the mailbox providers that support BIMI logo placement. Your domain should have a regular delivery cadence and needs to have a good reputation with the mailbox providers you are sending mail. BIMI logo placement may take time to populate to mailbox providers where you don’t have an established reputation or sending cadence. The time spent implementing BIMI is well worth it as it will strengthen your sender reputation and create a better and more trusted customer experience for your end recipients.

You can find more information about the BIMI specification here.

LLMs and Phishing

Post Syndicated from Bruce Schneier original https://www.schneier.com/blog/archives/2023/04/llms-and-phishing.html

Here’s an experiment being run by undergraduate computer science students everywhere: Ask ChatGPT to generate phishing emails, and test whether these are better at persuading victims to respond or click on the link than the usual spam. It’s an interesting experiment, and the results are likely to vary wildly based on the details of the experiment.

But while it’s an easy experiment to run, it misses the real risk of large language models (LLMs) writing scam emails. Today’s human-run scams aren’t limited by the number of people who respond to the initial email contact. They’re limited by the labor-intensive process of persuading those people to send the scammer money. LLMs are about to change that. A decade ago, one type of spam email had become a punchline on every late-night show: “I am the son of the late king of Nigeria in need of your assistance….” Nearly everyone had gotten one or a thousand of those emails, to the point that it seemed everyone must have known they were scams.

So why were scammers still sending such obviously dubious emails? In 2012, researcher Cormac Herley offered an answer: It weeded out all but the most gullible. A smart scammer doesn’t want to waste their time with people who reply and then realize it’s a scam when asked to wire money. By using an obvious scam email, the scammer can focus on the most potentially profitable people. It takes time and effort to engage in the back-and-forth communications that nudge marks, step by step, from interlocutor to trusted acquaintance to pauper.

Long-running financial scams are now known as pig butchering, growing the potential mark up until their ultimate and sudden demise. Such scams, which require gaining trust and infiltrating a target’s personal finances, take weeks or even months of personal time and repeated interactions. It’s a high stakes and low probability game that the scammer is playing.

Here is where LLMs will make a difference. Much has been written about the unreliability of OpenAI’s GPT models and those like them: They “hallucinate” frequently, making up things about the world and confidently spouting nonsense. For entertainment, this is fine, but for most practical uses it’s a problem. It is, however, not a bug but a feature when it comes to scams: LLMs’ ability to confidently roll with the punches, no matter what a user throws at them, will prove useful to scammers as they navigate hostile, bemused, and gullible scam targets by the billions. AI chatbot scams can ensnare more people, because the pool of victims who will fall for a more subtle and flexible scammer—one that has been trained on everything ever written online—is much larger than the pool of those who believe the king of Nigeria wants to give them a billion dollars.

Personal computers are powerful enough today that they can run compact LLMs. After Facebook’s new model, LLaMA, was leaked online, developers tuned it to run fast and cheaply on powerful laptops. Numerous other open-source LLMs are under development, with a community of thousands of engineers and scientists.

A single scammer, from their laptop anywhere in the world, can now run hundreds or thousands of scams in parallel, night and day, with marks all over the world, in every language under the sun. The AI chatbots will never sleep and will always be adapting along their path to their objectives. And new mechanisms, from ChatGPT plugins to LangChain, will enable composition of AI with thousands of API-based cloud services and open source tools, allowing LLMs to interact with the internet as humans do. The impersonations in such scams are no longer just princes offering their country’s riches. They are forlorn strangers looking for romance, hot new cryptocurrencies that are soon to skyrocket in value, and seemingly-sound new financial websites offering amazing returns on deposits. And people are already falling in love with LLMs.

This is a change in both scope and scale. LLMs will change the scam pipeline, making them more profitable than ever. We don’t know how to live in a world with a billion, or 10 billion, scammers that never sleep.

There will also be a change in the sophistication of these attacks. This is due not only to AI advances, but to the business model of the internet—surveillance capitalism—which produces troves of data about all of us, available for purchase from data brokers. Targeted attacks against individuals, whether for phishing or data collection or scams, were once only within the reach of nation-states. Combine the digital dossiers that data brokers have on all of us with LLMs, and you have a tool tailor-made for personalized scams.

Companies like OpenAI attempt to prevent their models from doing bad things. But with the release of each new LLM, social media sites buzz with new AI jailbreaks that evade the new restrictions put in place by the AI’s designers. ChatGPT, and then Bing Chat, and then GPT-4 were all jailbroken within minutes of their release, and in dozens of different ways. Most protections against bad uses and harmful output are only skin-deep, easily evaded by determined users. Once a jailbreak is discovered, it usually can be generalized, and the community of users pulls the LLM open through the chinks in its armor. And the technology is advancing too fast for anyone to fully understand how they work, even the designers.

This is all an old story, though: It reminds us that many of the bad uses of AI are a reflection of humanity more than they are a reflection of AI technology itself. Scams are nothing new—simply intent and then action of one person tricking another for personal gain. And the use of others as minions to accomplish scams is sadly nothing new or uncommon: For example, organized crime in Asia currently kidnaps or indentures thousands in scam sweatshops. Is it better that organized crime will no longer see the need to exploit and physically abuse people to run their scam operations, or worse that they and many others will be able to scale up scams to an unprecedented level?

Defense can and will catch up, but before it does, our signal-to-noise ratio is going to drop dramatically.

This essay was written with Barath Raghavan, and previously appeared on Wired.com.

Friday Squid Blogging: Squid Food Poisoning

Post Syndicated from Bruce Schneier original https://www.schneier.com/blog/archives/2023/04/friday-squid-blogging-squid-food-poisoning.html

University of Connecticut basketball player Jordan Hawkins claims to have suffered food poisoning from calamari the night before his NCAA finals game. The restaurant disagrees:

On Sunday, a Mastro’s employee politely cast doubt on the idea that the restaurant might have caused the illness, citing its intense safety protocols. The staffer, who spoke on condition of anonymity because he was not authorized to officially speak for Mastro’s, said restaurants in general were more likely to arouse suspicion when they had some rooting interest against the customer-athletes.

As usual, you can also use this squid post to talk about the security stories in the news that I haven’t covered.

Read my blog posting guidelines here.

Clubs Conference 2023: Ideas and tools for CoderDojos and Code Clubs

Post Syndicated from Sarah Roberts original https://www.raspberrypi.org/blog/clubs-conference-2023-talks/

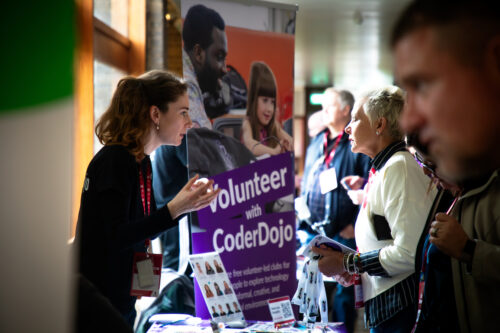
On 24 and 25 March, more than 140 members of the Code Club and CoderDojo communities joined us in Cambridge for our first-ever Clubs Conference.

At the Clubs Conference, volunteers and educators came together to celebrate their achievements and explore new ways to support young people to create with technology. The event included community display tables, interactive workshops, discussions, poster sessions, and talks.

For everyone who couldn’t join us in person, we recorded all of the talks that community members gave on the main stage. Here’s what you can learn from the speakers.

Running your club

  • Jane Waite from our team offered a taste of the research we do and how you can get insights from it to help you run your own coding club. Watch Jane’s talk to learn about the research that informs our projects for your club.
  • Rhodri Smith, who runs a Code Club, shared how you can use assistive technologies to open your club experience to more young people. Watch Rhodri’s talk for some fantastic tips on how assistive technology can make Code Club accessible to children of all ages and abilities.
Participants at the Clubs Conference.
  • Dave Morley, who volunteers at the CoderDojo at Royal Museums Greenwich, presented his way of using Scratch projects to keep engaging Dojo participants. Watch Dave’s talk for tips on how to create your own coding projects for young people.
  • Tim Duffey, who is part of the West Sound CoderDojo, shared how his Dojo ran successful online sessions during the coronavirus pandemic. Watch Tim’s talk for great advice on how to run successful coding clubs for young people online.
  • Steph Burton from our team presented new resources we’re working on to help clubs recruit and train volunteers. Watch Steph’s talk for tips on how to recruit new volunteers for your coding club.

Engaging young people in your club

  • Sophie Hudson, who runs a Code Club in rural Yorkshire, told us how her school’s Code Club turned taking part in Astro Pi Mission Zero into a cross-curricular activity, and how she partnered older learners with younger ones for peer mentoring that engaged new learners in coding. Watch Sophie’s talk to learn how you can get your school involved in Astro Pi, especially if you don’t have much adult support available.
Participants at the Clubs Conference.
We brought a replica of the Astro Pi computers to the Clubs Conference.
  • Helen Gardner from our team shared how you can motivate and inspire your coders by supporting them to share their projects in the Coolest Projects showcase — even their very first Scratch animation. Watch Helen’s talk if you’re looking for something new for your club.

The benefits of Code Club and CoderDojo for your community

  • Fiona Lindsay, who leads a Code Club, presented her insights into the skills beyond coding that young people learn at Code Club, and she shared some wonderful videos of her coders talking about their experience. Watch Fiona’s talk to hear young girls talk about how to get more girls into coding, and for evidence of why every school should have a Code Club.
Hillside School's cake to celebrate ten years of Code Club.
Last year, Fiona’s Code Club held a special event to celebrate the tenth birthday of Code Club.
  • Bruce Harms, who is involved in AruCoderDojo, shared how he and his team are making the CoderDojo model part of their wider work to bring digital skills and infrastructure to Aruba. Watch Bruce’s talk to learn how his team has tailored their coding clubs for their local community.

What is volunteering for CoderDojo and Code Club like?

  • Marcus Davage, who volunteers at a Code Club, shared his journey as a volunteer translator of our resources, and how he engaged colleagues at his workplace in also supporting translations to make coding skills available to more young people across the world. Watch Marcus’s talk if you speak more than one language.
  • To end the day, we hosted a group of community members onstage to have a chat about their journeys with CoderDojo and Code Club, what they’ve learned, and how they see the future of their clubs. Watch the panel conversation if you want inspiration and advice for getting involved in helping kids create with tech.
A panel discussion on stage at the Clubs Conference.

Thank you to everyone who gave talks, ran workshops, presented posters, and had conversations to share their questions and insights. It was wonderful to meet all of you, and we came away from the Clubs Conference feeling super inspired by the amazing work Code Club and CoderDojo volunteers all over the world do to help young people learn to create with digital technologies.

We learned so much from listening to you, and we will take the lessons into our work to support you and your clubs in the best way we can.

The post Clubs Conference 2023: Ideas and tools for CoderDojos and Code Clubs appeared first on Raspberry Pi Foundation.

Research on AI in Adversarial Settings

Post Syndicated from Bruce Schneier original https://www.schneier.com/blog/archives/2023/04/research-on-ai-in-adversarial-settings.html

New research: “Achilles Heels for AGI/ASI via Decision Theoretic Adversaries”:

As progress in AI continues to advance, it is important to know how advanced systems will make choices and in what ways they may fail. Machines can already outsmart humans in some domains, and understanding how to safely build ones which may have capabilities at or above the human level is of particular concern. One might suspect that artificially generally intelligent (AGI) and artificially superintelligent (ASI) will be systems that humans cannot reliably outsmart. As a challenge to this assumption, this paper presents the Achilles Heel hypothesis which states that even a potentially superintelligent system may nonetheless have stable decision-theoretic delusions which cause them to make irrational decisions in adversarial settings. In a survey of key dilemmas and paradoxes from the decision theory literature, a number of these potential Achilles Heels are discussed in context of this hypothesis. Several novel contributions are made toward understanding the ways in which these weaknesses might be implanted into a system.

FBI (and Others) Shut Down Genesis Market

Post Syndicated from Bruce Schneier original https://www.schneier.com/blog/archives/2023/04/fbi-and-others-shut-down-genesis-market.html

Genesis Market is shut down:

Active since 2018, Genesis Market’s slogan was, “Our store sells bots with logs, cookies, and their real fingerprints.” Customers could search for infected systems with a variety of options, including by Internet address or by specific domain names associated with stolen credentials.

But earlier today, multiple domains associated with Genesis had their homepages replaced with a seizure notice from the FBI, which said the domains were seized pursuant to a warrant issued by the U.S. District Court for the Eastern District of Wisconsin.

The U.S. Attorney’s Office for the Eastern District of Wisconsin did not respond to requests for comment. The FBI declined to comment.

But sources close to the investigation tell KrebsOnSecurity that law enforcement agencies in the United States, Canada and across Europe are currently serving arrest warrants on dozens of individuals thought to support Genesis, either by maintaining the site or selling the service bot logs from infected systems.

The seizure notice includes the seals of law enforcement entities from several countries, including Australia, Canada, Denmark, Germany, the Netherlands, Spain, Sweden and the United Kingdom.

Slashdot story.