A regular feature of the Embedded
Linux Conference (ELC) has been an update on the state of embedded Linux from
conference organizer Tim Bird. It has been quite a few years since I had
the opportunity to sit in on one, so I took one at the
2022 Open
Source Summit North America (OSSNA) in Austin, Texas. OSSNA is an
umbrella conference that contains ELC and a whole lot more these days.
Bird gave a look at recent kernel features from an embedded perspective,
talked a bit about some different technology areas and their impact on
embedded Linux, and
also tried to answer a question that Andrew Morton posed in a keynote at ELC in 2008.
AWS Identity and Access Management (IAM) has now made it easier for you to use IAM roles for your workloads that are running outside of AWS, with the release of IAM Roles Anywhere. This feature extends the capabilities of IAM roles to workloads outside of AWS. You can use IAM Roles Anywhere to provide a secure way for on-premises servers, containers, or applications to obtain temporary AWS credentials and remove the need for creating and managing long-term AWS credentials.
In this post, I will briefly discuss how IAM Roles Anywhere works. I’ll mention some of the common use cases for IAM Roles Anywhere. And finally, I’ll walk you through an example scenario to demonstrate how the implementation works.
Background
To enable your applications to access AWS services and resources, you need to provide the application with valid AWS credentials for making AWS API requests. For workloads running on AWS, you do this by associating an IAM role with Amazon Elastic Compute Cloud (Amazon EC2), Amazon Elastic Container Service (Amazon ECS), Amazon Elastic Kubernetes Service (Amazon EKS), or AWS Lambda resources, depending on the compute platform hosting your application. This is secure and convenient, because you don’t have to distribute and manage AWS credentials for applications running on AWS. Instead, the IAM role supplies temporary credentials that applications can use when they make AWS API calls.
IAM Roles Anywhere enables you to use IAM roles for your applications outside of AWS to access AWS APIs securely, the same way that you use IAM roles for workloads on AWS. With IAM Roles Anywhere, you can deliver short-term credentials to your on-premises servers, containers, or other compute platforms. When you use IAM Roles Anywhere to vend short-term credentials you can remove the need for long-term AWS access keys and secrets, which can help improve security, and remove the operational overhead of managing and rotating the long-term credentials. You can also use IAM Roles Anywhere to provide a consistent experience for managing credentials across hybrid workloads.
In this post, I assume that you have a foundational knowledge of IAM, so I won’t go into the details here about IAM roles. For more information on IAM roles, see the IAM documentation.
How does IAM Roles Anywhere work?
IAM Roles Anywhere relies on public key infrastructure (PKI) to establish trust between your AWS account and certificate authority (CA) that issues certificates to your on-premises workloads. Your workloads outside of AWS use IAM Roles Anywhere to exchange X.509 certificates for temporary AWS credentials. The certificates are issued by a CA that you register as a trust anchor (root of trust) in IAM Roles Anywhere. The CA can be part of your existing PKI system, or can be a CA that you created with AWS Certificate Manager Private Certificate Authority (ACM PCA).
Your application makes an authentication request to IAM Roles Anywhere, sending along its public key (encoded in a certificate) and a signature signed by the corresponding private key. Your application also specifies the role to assume in the request. When IAM Roles Anywhere receives the request, it first validates the signature with the public key, then it validates that the certificate was issued by a trust anchor previously configured in the account. For more details, see the signature validation documentation.
After both validations succeed, your application is now authenticated and IAM Roles Anywhere will create a new role session for the role specified in the request by calling AWS Security Token Service (AWS STS). The effective permissions for this role session are the intersection of the target role’s identity-based policies and the session policies, if specified, in the profile you create in IAM Roles Anywhere. Like any other IAM role session, it is also subject to other policy types that you might have in place, such as permissions boundaries and service control policies (SCPs).
There are typically three main tasks, performed by different personas, that are involved in setting up and using IAM Roles Anywhere:
Initial configuration of IAM Roles Anywhere – This task involves creating a trust anchor, configuring the trust policy of the role that IAM Roles Anywhere is going to assume, and defining the role profile. These activities are performed by the AWS account administrator and can be limited by IAM policies.
Provisioning of certificates to workloads outside AWS – This task involves ensuring that the X.509 certificate, signed by the CA, is installed and available on the server, container, or application outside of AWS that needs to authenticate. This is performed in your on-premises environment by an infrastructure admin or provisioning actor, typically by using existing automation and configuration management tools.
Using IAM Roles Anywhere – This task involves configuring the credential provider chain to use the IAM Roles Anywhere credential helper tool to exchange the certificate for session credentials. This is typically performed by the developer of the application that interacts with AWS APIs.
I’ll go into the details of each task when I walk through the example scenario later in this post.
Common use cases for IAM Roles Anywhere
You can use IAM Roles Anywhere for any workload running in your data center, or in other cloud providers, that requires credentials to access AWS APIs. Here are some of the use cases we think will be interesting to customers based on the conversations and patterns we have seen:
Send security findings from on-premises sources to AWS Security Hub
Enable hybrid workloads to access AWS services over the course of phased migrations
Example scenario and walkthrough
To demonstrate how IAM Roles Anywhere works in action, let’s walk through a simple scenario where you want to call S3 APIs to upload some data from a server in your data center.
Prerequisites
Before you set up IAM Roles Anywhere, you need to have the following requirements in place:
The certificate bundle of your own CA, or an active ACM PCA CA in the same AWS Region as IAM Roles Anywhere
An end-entity certificate and associated private key available on the on-premises server
Administrator permissions for IAM roles and IAM Roles Anywhere
Setup
Here I demonstrate how to perform the setup process by using the IAM Roles Anywhere console. Alternatively, you can use the AWS API or Command Line Interface (CLI) to perform these actions. There are three main activities here:
Create a trust anchor
Create and configure a role that trusts IAM Roles Anywhere
Under Trust anchors, choose Create a trust anchor.
On the Create a trust anchor page, enter a name for your trust anchor and select the existing AWS Certificate Manager Private CA from the list. Alternatively, if you want to use your own external CA, choose External certificate bundle and provide the certificate bundle.
Figure 1: Create a trust anchor in IAM Roles Anywhere
To create and configure a role that trusts IAM Roles Anywhere
Using the AWS Command Line Interface (AWS CLI), you are going to create an IAM role with appropriate permissions that you want your on-premises server to assume after authenticating to IAM Roles Anywhere. Save the following trust policy as rolesanywhere-trust-policy.json on your computer.
Save the following identity-based policy as onpremsrv-permissions-policy.json. This grants the role permissions to write objects into the specified S3 bucket.
You can optionally use condition statements based on the attributes extracted from the X.509 certificate to further restrict the trust policy to control the on-premises resources that can obtain credentials from IAM Roles Anywhere. IAM Roles Anywhere sets the SourceIdentity value to the CN of the subject (onpremsrv01 in my example). It also sets individual session tags (PrincipalTag/) with the derived attributes from the certificate. So, you can use the principal tags in the Condition clause in the trust policy as additional authorization constraints.
For example, the Subject for the certificate I use in this post is as follows.
Subject: … O = Example Corp., OU = SecOps, CN = onpremsrv01
So, I can add condition statements like the following into the trust policy (rolesanywhere-trust-policy.json):
On the Create a profile page, enter a name for the profile.
For Roles, select the role that you created in the previous step (ExampleS3WriteRole).
5. Optionally, you can define session policies to further scope down the sessions delivered by IAM Roles Anywhere. This is particularly useful when you configure the profile with multiple roles and want to restrict permissions across all the roles. You can add the desired session polices as managed policies or inline policy. Here, for demonstration purpose, I add an inline policy to only allow requests coming from my specified IP address.
Figure 2: Create a profile in IAM Roles Anywhere
At this point, IAM Roles Anywhere setup is complete and you can start using it.
Use IAM Roles Anywhere
IAM Roles Anywhere provides a credential helper tool that can be used with the process credentials functionality that all current AWS SDKs support. This simplifies the signing process for the applications. See the IAM Roles Anywhere documentation to learn how to get the credential helper tool.
To test the functionality first, run the credential helper tool (aws_signing_helper) manually from the on-premises server, as follows.
Figure 3: Running the credential helper tool manually
You should successfully receive session credentials from IAM Roles Anywhere, similar to the example in Figure 3. Once you’ve confirmed that the setup works, update or create the ~/.aws/config file and add the signing helper as a credential_process. This will enable unattended access for the on-premises server. To learn more about the AWS CLI configuration file, see Configuration and credential file settings.
To verify that the config works as expected, call the aws sts get-caller-identity AWS CLI command and confirm that the assumed role is what you configured in IAM Roles Anywhere. You should also see that the role session name contains the Serial Number of the certificate that was used to authenticate (cc:c3:…:85:37 in this example). Finally, you should be able to copy a file to the S3 bucket, as shown in Figure 4.
Figure 4: Verify the assumed role
Audit
As with other AWS services, AWS CloudTrail captures API calls for IAM Roles Anywhere. Let’s look at the corresponding CloudTrail log entries for the activities we performed earlier.
The first log entry I’m interested in is CreateSession, when the on-premises server called IAM Roles Anywhere through the credential helper tool and received session credentials back.
You can see that the cert, along with other parameters, is sent to IAM Roles Anywhere and a role session along with temporary credentials is sent back to the server.
The next log entry we want to look at is the one for the s3:PutObject call we made from our on-premises server.
In addition to the CloudTrail logs, there are several metrics and events available for you to use for monitoring purposes. To learn more, see Monitoring IAM Roles Anywhere.
Additional notes
You can disable the trust anchor in IAM Roles Anywhere to immediately stop new sessions being issued to your resources outside of AWS. Certificate revocation is supported through the use of imported certificate revocation lists (CRLs). You can upload a CRL that is generated from your CA, and certificates used for authentication will be checked for their revocation status. IAM Roles Anywhere does not support callbacks to CRL Distribution Points (CDPs) or Online Certificate Status Protocol (OCSP) endpoints.
Another consideration, not specific to IAM Roles Anywhere, is to ensure that you have securely stored the private keys on your server with appropriate file system permissions.
Conclusion
In this post, I discussed how the new IAM Roles Anywhere service helps you enable workloads outside of AWS to interact with AWS APIs securely and conveniently. When you extend the capabilities of IAM roles to your servers, containers, or applications running outside of AWS you can remove the need for long-term AWS credentials, which means no more distribution, storing, and rotation overheads.
I mentioned some of the common use cases for IAM Roles Anywhere. You also learned about the setup process and how to use IAM Roles Anywhere to obtain short-term credentials.
If you have any questions, you can start a new thread on AWS re:Post or reach out to AWS Support.
In this episode of Security Nation, Jen and Tod are joined again by Pete Cooper and Irene Pontisso of the UK Cabinet Office for a follow-up on the cybersecurity culture challenge they launched in 2021. Pete and Irene run us through the results, what kinds of interventions participants came up with, and what has them excited about building a more resilient government security culture in the years to come.
Stick around for our Rapid Rundown, where Tod and Jen talk about a recent write-up that takes a deep dive into a curious form of phishing: pig-butchering scams. Spoiler: They have nothing to do with actual pigs but everything to do with highly specific text messages from numbers you don’t recognize.
Pete Cooper
Pete is Deputy Director Cyber Defence within the Government Security Group in the UK Cabinet Office where he looks over the whole of the Government sector and is responsible for the Government Cyber Security Strategy, standards, and policies, as well as responding to serious or cross-government cyber incidents. With a diverse military, private sector, and government background, he has worked on everything ranging from cyber operations, global cybersecurity strategies, advising on the nature of state-versus-state cyber conflict to leading cybersecurity change across industry, public sector and the global hacker community, including founding and leading the Aerospace Village at DEF CON. A fast jet pilot turned cyber operations advisor, who on leaving the military in 2016 founded the UK’s first multi-disciplinary cyber strategy competition, he is passionate about tackling national and international cybersecurity challenges through better collaboration, diversity, and innovative partnerships. He has a Post Grad in Cyberspace Operations from Cranfield University. He is a Non-Resident Senior Fellow at the Cyber Statecraft Initiative of the Scowcroft Centre for Strategy and Security at the Atlantic Council and a Visiting Senior Research Fellow in the Dept of War Studies, King’s College London.
Irene Pontisso
Irene is Assistant Head of Engagement and Information within the Government Security Group in the UK Cabinet Office. Irene is responsible for the design and strategic oversight of cross-government security education, awareness, and culture-related initiatives. She is also responsible for leading cross-government engagement and press activities for Government Security and the Government Chief Security Officer. Irene started her career in policy and international relations through her roles at the United Nations Platform for Space-based Information for Disaster Management and Emergency Response (UN-SPIDER). Irene also has significant industry and third sector experience, and she partnered with the world’s leading law firms to provide free access to legal advice for NGOs on international development projects. She also has experience in leading large-scale exhibitions and policy research in corporate environments. She holds a MSc in International Relations from the University of Bristol and a BSc from the University of Turin.
Read the paper on the UK government’s cybersecurity strategy through 2030.
Rapid Rundown links
Check out the article on so-called pig-butchering scams.
Like the show? Want to keep Jen and Tod in the podcasting business? Feel free to rate and review with your favorite podcast purveyor, like Apple Podcasts.
Want More Inspiring Stories From the Security Community?
In Part 1 of this two-part series, we shared an overview of some of the most important 2021 Amazon Web Services (AWS) Security service and feature launches. In this follow-up, we’ll dive deep into additional launches that are important for security professionals to be aware of and understand across all AWS services. There have already been plenty in the first half of 2022, so we’ll highlight those soon, as well.
AWS Identity
You can use AWS Identity Services to build Zero Trust architectures, help secure your environments with a robust data perimeter, and work toward the security best practice of granting least privilege. In 2021, AWS expanded the identity source options, AWS Region availability, and support for AWS services. There is also added visibility and power in the permission management system. New features offer new integrations, additional policy checks, and secure resource sharing across AWS accounts.
AWS Single Sign-On
For identity management, AWS Single Sign-On (AWS SSO) is where you create, or connect, your workforce identities in AWS once and manage access centrally across your AWS accounts in AWS Organizations. In 2021, AWS SSO announced new integrations for JumpCloud and CyberArk users. This adds to the list of providers that you can use to connect your users and groups, which also includes Microsoft Active Directory Domain Services, Okta Universal Directory, Azure AD, OneLogin, and Ping Identity.
For access management, there have been a range of feature launches with AWS Identity and Access Management (IAM) that have added up to more power and visibility in the permissions management system. Here are some key examples.
IAM made it simpler to relate a user’s IAM role activity to their corporate identity. By setting the new source identity attribute, which persists through role assumption chains and gets logged in AWS CloudTrail, you can find out who is responsible for actions that IAM roles performed.
IAM added support for policy conditions, to help manage permissions for AWS services that access your resources. This important feature launch of service principal conditions helps you to distinguish between API calls being made on your behalf by a service principal, and those being made by a principal inside your account. You can choose to allow or deny the calls depending on your needs. As a security professional, you might find this especially useful in conjunction with the aws:CalledVia condition key, which allows you to scope permissions down to specify that this account principal can only call this API if they are calling it using a particular AWS service that’s acting on their behalf. For example, your account principal can’t generally access a particular Amazon Simple Storage Service (Amazon S3) bucket, but if they are accessing it by using Amazon Athena, they can do so. These conditions can also be used in service control policies (SCPs) to give account principals broader scope across an account, organizational unit, or organization; they need not be added to individual principal policies or resource policies.
Another very handy new IAM feature launch is additional information about the reason for an access denied error message. With this additional information, you can now see which of the relevant access control policies (for example, IAM, resource, SCP, or VPC endpoint) was the cause of the denial. As of now, this new IAM feature is supported by more than 50% of all AWS services in the AWS SDK and AWS Command Line Interface, and a fast-growing number in the AWS Management Console. We will continue to add support for this capability across services, as well as add more features that are designed to make the journey to least privilege simpler.
IAM Access Analyzer also launched the ability to generate fine-grained policies based on analyzing past AWS CloudTrail activity. This feature provides a great new capability for DevOps teams or central security teams to scope down policies to just the permissions needed, making it simpler to implement least privilege permissions. IAM Access Analyzer launched further enhancements to expand policy checks, and the ability to generate a sample least-privilege policy from past activity was expanded beyond the account level to include an analysis of principal behavior within the entire organization by analyzing log activity stored in AWS CloudTrail.
AWS Resource Access Manager
AWS Resource Access Manager (AWS RAM) helps you securely share your resources across unrelated AWS accounts within your organization or organizational units (OUs) in AWS Organizations. Now you can also share your resources with IAM roles and IAM users for supported resource types. This update enables more granular access using managed permissions that you can use to define access to shared resources. In addition to the default managed permission defined for each shareable resource type, you now have more flexibility to choose which permissions to grant to whom for resource types that support additional managed permissions. Additionally, AWS RAM added support for global resource types, enabling you to provision a global resource once, and share that resource across your accounts. A global resource is one that can be used in multiple AWS Regions; the first example of a global resource is found in AWS Cloud WAN, currently in preview as of this publication. AWS RAM helps you more securely share an AWS Cloud WAN core network, which is a managed network containing AWS and on-premises networks. With AWS RAM global resource sharing, you can use the Cloud WAN core network to centrally operate a unified global network across Regions and accounts.
AWS Directory Service
AWS Directory Service for Microsoft Active Directory, also known as AWS Managed Microsoft Active Directory (AD), was updated to automatically provide domain controller and directory utilization metrics in Amazon CloudWatch for new and existing directories. Analyzing these utilization metrics helps you quantify your average and peak load times to identify the need for additional domain controllers. With this, you can define the number of domain controllers to meet your performance, resilience, and cost requirements.
Amazon Cognito
Amazon Cognitoidentity pools (federated identities) was updated to enable you to use attributes from social and corporate identity providers to make access control decisions and simplify permissions management in AWS resources. In Amazon Cognito, you can choose predefined attribute-tag mappings, or you can create custom mappings using the attributes from social and corporate providers’ access and ID tokens, or SAML assertions. You can then reference the tags in an IAM permissions policy to implement attribute-based access control (ABAC) and manage access to your AWS resources. Amazon Cognito also launched a new console experience for user pools and now supports targeted sign out through refresh token revocation.
Governance, control, and logging services
There were a number of important releases in 2021 in the areas of governance, control, and logging services.
This approach provides a powerful new middle ground between the older security models of prevention (which provide developers only an access denied message, and often can’t distinguish between an acceptable and an unacceptable use of the same API) and a detect and react model (when undesired states have already gone live). The Cfn-Guard 2.0 model gives builders the freedom to build with IaC, while allowing central teams to have the ability to reject infrastructure configurations or changes that don’t conform to central policies—and to do so with completely custom error messages that invite dialog between the builder team and the central team, in case the rule is unnuanced and needs to be refined, or if a specific exception needs to be created.
For example, a builder team might be allowed to provision and attach an internet gateway to a VPC, but the team can do this only if the routes to the internet gateway are limited to a certain pre-defined set of CIDR ranges, such as the public addresses of the organization’s branch offices. It’s not possible to write an IAM policy that takes into account the CIDR values of a VPC route table update, but you can write a Cfn-Guard 2.0 rule that allows the creation and use of an internet gateway, but only with a defined and limited set of IP addresses.
AWS Systems Manager Incident Manager
An important launch that security professionals should know about is AWS Systems Manager Incident Manager. Incident Manager provides a number of powerful capabilities for managing incidents of any kind, including operational and availability issues but also security issues. With Incident Manager, you can automatically take action when a critical issue is detected by an Amazon CloudWatch alarm or Amazon EventBridge event. Incident Manager runs pre-configured response plans to engage responders by using SMS and phone calls, can enable chat commands and notifications using AWS Chatbot, and runs automation workflows with AWS Systems Manager Automation runbooks. The Incident Manager console integrates with AWS Systems Manager OpsCenter to help you track incidents and post-incident action items from a central place that also synchronizes with third-party management tools such as Jira Service Desk and ServiceNow. Incident Manager enables cross-account sharing of incidents using AWS RAM, and provides cross-Region replication of incidents to achieve higher availability.
Amazon Simple Storage Service (Amazon S3) is one of the most important services at AWS, and its steady addition of security-related enhancements is always big news. Here are the 2021 highlights.
Access Points aliases
Amazon S3 introduced a new feature, Amazon S3 Access Points aliases. With Amazon S3 Access Points aliases, you can make the access points backwards-compatible with a large amount of existing code that is programmed to interact with S3 buckets rather than access points.
To understand the importance of this launch, we have to go back to 2019 to the launch of Amazon S3 Access Points. Access points are a powerful mechanism for managing S3 bucket access. They provide a great simplification for managing and controlling access to shared datasets in S3 buckets. You can create up to 1,000 access points per Region within each of your AWS accounts. Although bucket access policies remain fully enforced, you can delegate access control from the bucket to its access points, allowing for distributed and granular control. Each access point enforces a customizable policy that can be managed by a particular workgroup, while also avoiding the problem of bucket policies needing to grow beyond their maximum size. Finally, you can also bind an access point to a particular VPC for its lifetime, to prevent access directly from the internet.
With the 2021 launch of Access Points aliases, Amazon S3 now generates a unique DNS name, or alias, for each access point. The Access Points aliases look and acts just like an S3 bucket to existing code. This means that you don’t need to make changes to older code to use Amazon S3 Access Points; just substitute an Access Points aliases wherever you previously used a bucket name. As a security team, it’s important to know that this flexible and powerful administrative feature is backwards-compatible and can be treated as a drop-in replacement in your various code bases that use Amazon S3 but haven’t been updated to use access point APIs. In addition, using Access Points aliases adds a number of powerful security-related controls, such as permanent binding of S3 access to a particular VPC.
S3 Bucket Keys were launched at the end of 2020, another great launch that security professionals should know about, so here is an overview in case you missed it. S3 Bucket Keys are data keys generated by AWS KMS to provide another layer of envelope encryption in which the outer layer (the S3 Bucket Key) is cached by S3 for a short period of time. This extra key layer increases performance and reduces the cost of requests to AWS KMS. It achieves this by decreasing the request traffic from Amazon S3 to AWS KMS from a one-to-one model—one request to AWS KMS for each object written to or read from Amazon S3—to a one-to-many model using the cached S3 Bucket Key. The S3 Bucket Key is never stored persistently in an unencrypted state outside AWS KMS, and so Amazon S3 ultimately must always return to AWS KMS to encrypt and decrypt the S3 Bucket Key, and thus, the data. As a result, you still retain control of the key hierarchy and resulting encrypted data through AWS KMS, and are still able to audit Amazon S3 returning periodically to AWS KMS to refresh the S3 Bucket Keys, as logged in CloudTrail.
Returning to our review of 2021, S3 Bucket Keys gained the ability to use Amazon S3 Inventory and Amazon S3 Batch Operations automatically to migrate objects from the higher cost, slightly lower-performance SSE-KMS model to the lower-cost, higher-performance S3 Bucket Keys model.
To understand this launch, we need to go in time to the origins of Amazon S3, which is one of the oldest services in AWS, created even before IAM was launched in 2011. In those pre-IAM days, a storage system like Amazon S3 needed to have some kind of access control model, so Amazon S3 invented its own: Amazon S3 access control lists (ACLs). Using ACLs, you could add access permissions down to the object level, but only with regard to access by other AWS account principals (the only kind of identity that was available at the time), or public access (read-only or read-write) to an object. And in this model, objects were always owned by the creator of the object, not the bucket owner.
After IAM was introduced, Amazon S3 added the bucket policy feature, a type of resource policy that provides the rich features of IAM, including full support for all IAM principals (users and roles), time-of-day conditions, source IP conditions, ability to require encryption, and more. For many years, Amazon S3 access decisions have been made by combining IAM policy permissions and ACL permissions, which has served customers well. But the object-writer-is-owner issue has often caused friction. The good news for security professionals has been that a deny by either type of access control type overrides an allow by the other, so there were no security issues with this bi-modal approach. The challenge was that it could be administratively difficult to manage both resource policies—which exist at the bucket and access point level—and ownership and ACLs—which exist at the object level. Ownership and ACLs might potentially impact the behavior of only a handful of objects, in a bucket full of millions or billions of objects.
With the features released in 2021, Amazon S3 has removed these points of friction, and now provides the features needed to reduce ownership issues and to make IAM-based policies the only access control system for a specified bucket. The first step came in 2020 with the ability to make object ownership track bucket ownership, regardless of writer. But that feature applied only to newly-written objects. The final step is the 2021 launch we’re highlighting here: the ability to disable at the bucket level the evaluation of all existing ACLs—including ownership and permissions—effectively nullifying all object ACLs. From this point forward, you have the mechanisms you need to govern Amazon S3 access with a combination of S3 bucket policies, S3 access point policies, and (within the same account) IAM principal policies, without worrying about legacy models of ACLs and per-object ownership.
Additional database and storage service features
AWS Backup Vault Lock
AWS Backup added an important new additional layer for backup protection with the availability of AWS Backup Vault Lock. A vault lock feature in AWS is the ability to configure a storage policy such that even the most powerful AWS principals (such as an account or Org root principal) can only delete data if the deletion conforms to the preset data retention policy. Even if the credentials of a powerful administrator are compromised, the data stored in the vault remains safe. Vault lock features are extremely valuable in guarding against a wide range of security and resiliency risks (including accidental deletion), notably in an era when ransomware represents a rising threat to data.
ACM Private CA achieved FedRAMP authorization for six additional AWS Regions in the US.
Additional certificate customization now allows administrators to tailor the contents of certificates for new use cases, such as identity and smart card certificates; or to securely add information to certificates instead of relying only on the information present in the certificate request.
Additional capabilities were added for sharing CAs across accounts by using AWS RAM to help administrators issue fully-customized certificates, or revoke them, from a shared CA.
Integration with Kubernetes provides a more secure certificate authority solution for Kubernetes containers.
Online Certificate Status Protocol (OCSP) provides a fully-managed solution for notifying endpoints that certificates have been revoked, without the need for you to manage or operate infrastructure yourself.
Network and application protection
We saw a lot of enhancements in network and application protection in 2021 that will help you to enforce fine-grained security policies at important network control points across your organization. The services and new capabilities offer flexible solutions for inspecting and filtering traffic to help prevent unauthorized resource access.
AWS WAF
AWS WAF launched AWS WAF Bot Control, which gives you visibility and control over common and pervasive bots that consume excess resources, skew metrics, cause downtime, or perform other undesired activities. The Bot Control managed rule group helps you monitor, block, or rate-limit pervasive bots, such as scrapers, scanners, and crawlers. You can also allow common bots that you consider acceptable, such as status monitors and search engines. AWS WAF also added support for custom responses, managed rule group versioning, in-line regular expressions, and Captcha. The Captcha feature has been popular with customers, removing another small example of “undifferentiated work” for customers.
AWS Shield Advanced
AWS Shield Advanced now automatically protects web applications by blocking application layer (L7) DDoS events with no manual intervention needed by you or the AWS Shield Response Team (SRT). When you protect your resources with AWS Shield Advanced and enable automatic application layer DDoS mitigation, Shield Advanced identifies patterns associated with L7 DDoS events and isolates this anomalous traffic by automatically creating AWS WAF rules in your web access control lists (ACLs).
Amazon CloudFront
In other edge networking news, Amazon CloudFront added support for response headers policies. This means that you can now add cross-origin resource sharing (CORS), security, and custom headers to HTTP responses returned by your CloudFront distributions. You no longer need to configure your origins or use custom Lambda@Edge or CloudFront Functions to insert these headers.
Following Route 53 Resolver’s much-anticipated launch of DNS logging in 2020, the big news for 2021 was the launch of its DNS Firewall capability. Route 53 Resolver DNS Firewall lets you create “blocklists” for domains you don’t want your VPC resources to communicate with, or you can take a stricter, “walled-garden” approach by creating “allowlists” that permit outbound DNS queries only to domains that you specify. You can also create alerts for when outbound DNS queries match certain firewall rules, allowing you to test your rules before deploying for production traffic. Route 53 Resolver DNS Firewall launched with two managed domain lists—malware domains and botnet command and control domains—enabling you to get started quickly with managed protections against common threats. It also integrated with Firewall Manager (see the following section) for easier centralized administration.
AWS Network Firewall and Firewall Manager
Speaking of AWS Network Firewall and Firewall Manager, 2021 was a big year for both. Network Firewall added support for AWS Managed Rules, which are groups of rules based on threat intelligence data, to enable you to stay up to date on the latest security threats without writing and maintaining your own rules. AWS Network Firewall features a flexible rules engine enabling you to define firewall rules that give you fine-grained control over network traffic. As of the launch in late 2021, you can enable managed domain list rules to block HTTP and HTTPS traffic to domains identified as low-reputation, or that are known or suspected to be associated with malware or botnets. Prior to that, another important launch was new configuration options for rule ordering and default drop, making it simpler to write and process rules to monitor your VPC traffic. Also in 2021, Network Firewall announced a major regional expansion following its initial launch in 2020, and a range of compliance achievements and eligibility including HIPAA, PCI DSS, SOC, and ISO.
Elastic Load Balancing now supports forwarding traffic directly from Network Load Balancer (NLB) to Application Load Balancer (ALB). With this important new integration, you can take advantage of many critical NLB features such as support for AWS PrivateLink and exposing static IP addresses for applications that still require ALB.
The AWS Networking team also made Amazon VPC private NAT gateways available in both AWS GovCloud (US) Regions. The expansion into the AWS GovCloud (US) Regions enables US government agencies and contractors to move more sensitive workloads into the cloud by helping them to address certain regulatory and compliance requirements.
Compute
Security professionals should also be aware of some interesting enhancements in AWS compute services that can help improve their organization’s experience in building and operating a secure environment.
Amazon Elastic Compute Cloud (Amazon EC2) launched the Global View on the console to provide visibility to all your resources across Regions. Global View helps you monitor resource counts, notice abnormalities sooner, and find stray resources. A few days into 2022, another simple but extremely useful EC2 launch was the new ability to obtain instance tags from the Instance Metadata Service (IMDS). Many customers run code on Amazon EC2 that needs to introspect about the EC2 tags associated with the instance and then change its behavior depending on the content of the tags. Prior to this launch, you had to associate an EC2 role and call the EC2 API to get this information. That required access to API endpoints, either through a NAT gateway or a VPC endpoint for Amazon EC2. Now, that information can be obtained directly from the IMDS, greatly simplifying a common use case.
Amazon EC2 launched sharing of Amazon Machine Images (AMIs) with AWS Organizations and Organizational Units (OUs). Previously, you could share AMIs only with specific AWS account IDs. To share AMIs within AWS Organizations, you had to explicitly manage sharing of AMIs on an account-by-account basis, as they were added to or removed from AWS Organizations. With this new feature, you no longer have to update your AMI permissions because of organizational changes. AMI sharing is automatically synchronized when organizational changes occur. This feature greatly helps both security professionals and governance teams to centrally manage and govern AMIs as you grow and scale your AWS accounts. As previously noted, this feature was also added to EC2 Image Builder. Finally, Amazon Data Lifecycle Manager, the tool that manages all your EBS volumes and AMIs in a policy-driven way, now supports automatic deprecation of AMIs. As a security professional, you will find this helpful as you can set a timeline on your AMIs so that, if the AMIs haven’t been updated for a specified period of time, they will no longer be considered valid or usable by development teams.
Looking ahead
In 2022, AWS continues to deliver experiences that meet administrators where they govern, developers where they code, and applications where they run. We will continue to summarize important launches in future blog posts. If you’re interested in learning more about AWS services, join us for AWS re:Inforce, the AWS conference focused on cloud security, identity, privacy, and compliance. AWS re:Inforce 2022 will take place July 26–27 in Boston, MA. Registration is now open. Register now with discount code SALxUsxEFCw to get $150 off your full conference pass to AWS re:Inforce. For a limited time only and while supplies last. We look forward to seeing you there!
To stay up to date on the latest product and feature launches and security use cases, be sure to read the What’s New with AWS announcements (or subscribe to the RSS feed) and the AWS Security Blog.
If you have feedback about this post, submit comments in the Comments section below. If you have questions about this post, contact AWS Support.
Want more AWS Security news? Follow us on Twitter.
NIST’s post-quantum computing cryptography standard process is entering its final phases. It announced the first four algorithms:
For general encryption, used when we access secure websites, NIST has selected the CRYSTALS-Kyber algorithm. Among its advantages are comparatively small encryption keys that two parties can exchange easily, as well as its speed of operation.
For digital signatures, often used when we need to verify identities during a digital transaction or to sign a document remotely, NIST has selected the three algorithms CRYSTALS-Dilithium, FALCON and SPHINCS+ (read as “Sphincs plus”). Reviewers noted the high efficiency of the first two, and NIST recommends CRYSTALS-Dilithium as the primary algorithm, with FALCON for applications that need smaller signatures than Dilithium can provide. The third, SPHINCS+, is somewhat larger and slower than the other two, but it is valuable as a backup for one chief reason: It is based on a different math approach than all three of NIST’s other selections.
NIST has not chosen a public-key encryption standard. The remaining candidates are BIKE, Classic McEliece, HQC, and SIKE.
I have a lot to say on this process, and have written an essay for IEEE Security & Privacy about it. It will be published in a month or so.
In June, we experienced four incidents resulting in significant impact and degraded state of availability to multiple GitHub.com services. This report also sheds light into an incident that impacted multiple GitHub.com services in May.
June 1 09:40 UTC (lasting 48 minutes)
During this incident, customers experienced delays in the start up of their GitHub Actions workflows. The cause of these delays was excessive load on a proxy server that routes traffic to the database.
At 09:37 UTC, Actions service noticed a marked increase in the time it takes customer jobs to start. Our on-call engineer was paged and Actions was statused red. Once we started to investigate, we noticed that the pods running the proxy server for the database were crash-looping due to out-of-memory errors. A change was created to increase the available memory to these pods, which fully rolled out by 10:08 UTC. We started to see recovery in Actions even before 10:08 UTC, and statused to yellow at 10:17 UTC. By 10:28 UTC, we were confident that the memory increase had mitigated the issue, and statused Actions green.
Ultimately, this issue was traced back to a set of data analysis queries being pointed at an incorrect database. The large load they placed on the database caused the crash loops and the broader impact. These queries have been moved to a dedicated analytics setup that does not serve production traffic.
We are adding alerts to identify increases in load to the proxy server to catch issues like this early. We are also investigating how we can put in guardrails to ensure production database access is limited to services that own the data.
June 21 17:02 UTC (lasting 1 hour and 10 minutes)
During this incident, shortly after the GA of Copilot, users with either a Marketplace or Sponsorship plan were unable to use Copilot. Users with those subscriptions received an error from our API responsible for creating authentication tokens. This impacted a little less than 20% of our active users at the time.
At approximately 16:45 UTC, we were alerted and noticed elevated error rates in the API and began investigating causes. We were able to identify the issue and statused red. Our engineers worked quickly to roll out a fix to the API endpoint and we saw API error rates begin lowering at approximately 17:45 UTC. By 18:00 UTC, we were no longer seeing this issue but decided to wait for 10 more minutes to status back to green to ensure there were no regressions.
We have increased our testing around this particular combination of subscription types, added these scenarios to our user testing and will add additional data shape testing before future rollouts.
June 28 17:16 UTC (lasting 26 minutes)
Our alerting systems detected degraded availability for Codespaces during this time. Due to the recency of this incident, we are still investigating the contributing factors and will provide a more detailed update on the causes and remediations in the July Availability Report, which will be published the first Wednesday of August.
June 29 14:48 UTC (lasting 1 hour and 27 minutes)
During this incident, services including GitHub Actions, API Requests, Codespaces, Git Operations, GitHub Packages, and GitHub Pages were impacted. As we continue to investigate the contributing factors, we will provide a more detailed update in the July Availability Report. We will also share more about our efforts to minimize the impact of similar incidents in the future.
Follow up to May 27 04:26 UTC (lasting 21 minutes) and May 27 07:36 UTC (lasting 1 hour and 21 minutes)
As mentioned in the May Availability Report, we are now providing a more detailed update on this incident following further investigation.
Both instances that occurred at 04:26 and 07:36 UTC were caused by the same contributing factors. In the first instance, an individual service team noticed higher than normal load and an increase in error rate on API requests and statused red. The load was particularly high on our login endpoint. While this did elevate error rates, it was not enough to cause a widespread outage and we should have likely statused yellow in this instance.
After follow-up that indicated the load pattern had subsided, our on-call team determined it was safe to report the situation was mitigated and began to investigate further.
However, three hours later, we again experienced a degradation of service from a sustained high load in traffic. This was again concentrated on our login endpoint. We statused all services red, since we were seeing sustained error rates for a variety of clients and situations, and then updated individual service statuses based on their SLOs. Services that were affected by the load pattern statused to yellow, while services that were not impacted statused back to green.
The duration of impact to GitHub.com from the second instance of the load pattern lasted about 15 minutes. We continued to see elevated traffic during this time and waited until a network-level mitigation was rolled out before statusing all affected services back to green.
In addition to network mitigation, we were able to use the data from this incident to add additional mitigations on the application side for a sustained load of this type, as well as inform architectural changes we can make in the future to make our services more resilient.
Following this incident, we are improving our on-call procedures to ensure we always report the correct status level based on SLO review. While we always want to over-communicate issues with customers for awareness, we want to only status red when necessary.
In summary
We will continue to keep you updated on the progress and investments we’re making to ensure the reliability of our services. To receive real-time updates on status changes, please follow our status page. You can also learn more about what we’re working on on the GitHub Engineering Blog.
In business, data loss is unavoidable unless you have good server backups. Files get deleted accidentally, servers crash, computers fail, and employees make mistakes.
However, those aren’t the only dangers. You could also lose your company data in a natural disaster or cybersecurity attack. Ransomware is a serious concern for small to medium-sized businesses as well as large enterprises. Smart companies plan ahead to avoid data loss.
This post will discuss server backup basics, the different types of server backup, why it’s critical to keep your data backed up, and how to create a solid backup strategy for your company. Read on to learn everything you ever wanted to know about server backups.
Check out the other posts in our Server Backup 101 series:
A server is a virtual or physical device that performs a function to support other computers and users. Sometimes servers are dedicated machines used for a single purpose, and sometimes they serve multiple functions. Other computers or devices that connect to the server are called “clients.” Typically, clients use special software to communicate with the server and reply to requests. This communication is referred to as the server/client model. Some common uses for this setup include:
Web Server: Hosts web pages and online applications.
Email Server: Manages email for a company.
Database Server: Hosts various databases and controls access.
Application Server: Allows users to share applications.
File Server: Used to host files shared on a network.
DNS Server: Used to decode web addresses and deliver the user to the correct address.
FTP Server: Used specifically for hosting files for shared use.
Proxy Server: Adds a layer of security between client and server.
Servers run on many operating systems (OS) such as Windows, Linux, Mac, Apache, Unix, NetWare, and FreeBSD. The OS handles access control, user connections, memory allocation, and network functions. Each OS offers varying degrees of control, security, flexibility, and scalability.
Why It’s Important to Back Up Your Server
Did you know that roughly 40% of small and medium-sized businesses (SMBs) will be attacked by cybercriminals within a year, and 61% of all SMBs have already been attacked? Additionally, statistics show that 93% of companies that lost data for more than 10 days were forced into bankruptcy within a year. More than half of them filed immediately, and most shut down.
Company data is vulnerable to fire, theft, natural disasters, hardware failure, and cybercrime. Backups are an essential prevention tool.
Types of Servers
Within the realm of servers, there are many different types for virtually any purpose and environment. However, the primary function of most servers is data storage and processing. Some examples of servers include:
Physical Servers: These are hardware devices (usually computers) that connect users, share resources, and control access.
Virtual Servers: Using special software (called a hypervisor), you can set up multiple virtual servers on one physical machine. Each server acts like a physical server while the hypervisor manages memory and allocates other system resources as needed.
Hybrid Servers: Hybrids are servers combining physical servers and virtual servers. They offer the speed and efficiency of a physical server combined with the flexibility of cloud-hosted resources.
NAS Devices: Network-attached storage (NAS) devices store data and are accessed directly through the network without first connecting to a computer. These hardware devices contain a storage drive, processor, and OS, and can be accessed remotely.
SAN Server: Although not technically a server, a storage area network (SAN) connects multiple storage devices to multiple servers expanding the network and controlling connections.
Cloud Servers: Cloud servers exist in a virtual online environment, and you can access them through web portals, applications, and specialized software.
Regardless of how you save your data and where, backups are essential to protecting yourself from loss.
How to Back Up a Server
You have options for backing up data, and the methods vary. First, let’s talk about terminology.
Backup vs. Archive
Backing up is copying your data, whereas an archive is a historical copy that you keep for retention purposes, often for long periods. Archives are typically used to save old, inactive data for compliance reasons.
Here are two examples that illustrate backups vs. an archives. An example of a backup is when your mobile phone backs up to the cloud, and if you factory reset the phone, you can restore all your applications, settings, and data from the backup copy. An example of an archive is a tape backup of old HR files that have long since been deleted from the server.
Backup vs. Sync
Sometimes people confuse the word backup with sync. They are not the same thing. A backup is a copy of your data you can use to restore lost files. Syncing is the automatic updating and merging of two file sources. Cloud computing often uses syncing to keep files in one location identical to files in another.
To prevent data loss, backups are the process to use. Syncing overwrites files with the latest version; a backup can restore back to a single point in time, so you don’t lose anything valuable.
Backup Destinations
When selecting a backup destination, you have many mediums to choose from. There are pros and cons for each type. Some popular backup destinations and their pros and cons are as follows:
Destination
Pros
Cons
External Media (USB, CD, Removable Hard Drives, Flash Drives, etc.)
Quick, easy, affordable.
Fragile if dropped, crushed, or exposed to magnets; very small capacity.
NAS
Always available on the network, small size, and great for SMBs.
Vulnerable to on-premises threats and non-scalable due to limits.
Network or SAN Storage
High speed, view connected drives as local, good security, failover protection, excellent disk utilization, and high-end disaster recovery options.
Can be expensive, doesn’t work with all types of servers, and is vulnerable to attacks on the network.
Tape
Dependable (robust, not fragile), can be kept for years, low cost, and simple to replicate.
High initial setup costs, limited scalability, potential media corruption over time, and time consuming to manage.
FTP
Excellent for large files, copy multiple files at once, can resume if the connection is lost, schedule backups and recover lost data.
No security, vendors vary widely, not all solutions include encryption, and vulnerable to attacks.
Cloud backups are an altogether different type of backup; typically, you have two options available: all-in-one tools or integrated solutions.
All-in-one Tools
All-in-one tools like Carbonite Safe, Carbonite Server, Acronis, IDrive, CrashPlan, and SpiderOak combine both the backup software and the backend cloud storage in one offering. They have the ability to back up entire operating systems, files, images, videos, and sometimes even mobile device data. Depending on the tool you choose, you may be able to back up an unlimited number of devices, or you may have limits. However, most of these all-in-one solutions are expensive and can be complex to use. All those bells and whistles often come at a price—a steep learning curve.
Integrated Solutions (Backup Software Paired With Cloud Storage)
Pairing software and cloud storage is another option that combines the best of both worlds. It allows users to choose the software they want with the features they need and fast, reliable cloud storage. Cloud storage is scalable, so you will never run out of space as your business grows. Using your chosen software, it’s fast and easy to restore your files. Although it may seem counterintuitive, it’s often more affordable to use two integrated solutions versus an all-in-one tool. Another big bonus of using cloud storage is that it integrates with many popular software options. For example, Backblaze works seamlessly with:
An important factor to consider when choosing the right backup software and cloud storage is compatibility. Research which platforms your software will back up and what types of backups it offers (file, image, system, etc.). You also need to think about the restore process and your options (e.g., file, folder, bare metal/image, virtual, etc.). User-friendliness is important when deciding. Some programs like rClone require a working knowledge of command line. Choose a software program that is best for you.
Think about scalability and how much storage it can handle now and in the future as your business grows. A few other things to consider are pricing, security, and support. Your backup files are no good if they are vulnerable to attack. Compare prices and check out the support options before making your final decision.
Creating a Solid Backup Strategy
A solid backup strategy is the best way to protect your company against data loss. Again, you have options. The 3-2-1 strategy is the gold standard, but some companies are choosing options like a 3-2-1-1-0 option or even a 4-3-2 scheme. Learn more about how each plan works.
Before determining your strategy, you must consider what data you need to back up. For example, will you be backing up just servers or also workstations and dedicated servers, such as email servers or SaaS data devices?
Another concern is how you will get your data into the cloud. You need to figure out which method will work best for you. You have the option of direct transfer over internet bandwidth or using a rapid ingest device (e.g., the Backblaze Fireball rapid ingest device).
Universal Data Migration
Migrating your data can seem like an insurmountable task. We launched our Universal Data Migration service to make migrating to Backblaze just as easy as it is to use Backblaze. You can migrate from virtually any source to Backblaze B2 Cloud Storage, and it’s free to new customers who have 10TB of data or more to migrate with a one-year commitment.
How Often Should You Back Up Your Data?
Should you run full backups regularly? Or rely on incremental backups? The answer is that both have their place.
To fully protect yourself, performing regular full backups and keeping them safe is essential. Full backups can be scheduled for slow times or performed overnight when no one is using the data. Remember that full backups take the longest to complete and are the costliest but the easiest to restore.
A full backup backs up the entire server. An incremental backup only backs up files that have changed or been added since the last backup, saving storage space. The cadence of full versus incremental backups might look different for each organization. Learn more about full vs. incremental, differential, and full synthetic backups.
How Long Should You Keep Your Previous Backups?
You also must consider how long you want to keep your previous backups. Will you keep them for a specific amount of time and overwrite older backups?
By overwriting the files, you can save space, but you may not have an old enough backup when you need it. Also, keep in mind that many cloud storage vendors have minimum retention policies for deleted files. While “retention” sounds like a good thing, in this case it’s not. They might be charging you for data storage for 30, 60, or even 90 days even if you deleted it after storing it for just one day. That may also factor into your decision about how long you should keep your previous backup files. Some experts recommend three months, but that may not be enough in some situations.
You need to keep full backups for as long as you might need to recover from various issues. If, for example, you are infiltrated by a cybercriminal and don’t discover it for two months, will your oldest backup be enough to restore your system back to a clean state?
Another question to think about is if you’ll keep an archive. As a refresher, an archive is a backup of historical data that you keep long-term even if the files have already been deleted from the server. Most sources say you should plan to keep archives forever unless you have no use for the data in the future, but your company might have a different appetite for retention timeframes. Forever probably seems like…well, a long time, but keep in mind that the security of having those files available may be worth it.
How Will You Monitor Your Backup?
It’s not enough to just schedule your backups and walk away. You need to monitor them to ensure they are occurring on schedule. You should also test your ability to restore and fully understand the options you have for restoring your data. A backup is only as good as its ability to restore. You must test this out periodically to ensure you have a solid disaster recovery plan in place.
Special Considerations for Backing Up
When backing up servers with different operating systems, you need to consider the constraints of that system. For example, SQL servers can handle differential backups, whereas other servers cannot. Some backup software like Veeam integrates easily with all the major operating systems and therefore supports backups of multiple servers using different platforms.
If you are backing up a single server, things are easy. You have only one OS to worry about. However, if you are backing up multiple servers with different platforms and applications running on them, things could get more complex. Be sure to research all your options and use a vendor that can easily handle groups management and SaaS-managed backup services so that you can view all your data through a single pane of glass. You want consolidation and easy delineation if you need to pinpoint a single system to restore. You can use groups to easily manage different servers with similar operating systems to keep things organized and streamline your backup strategy.
As you can see, there are many facets to server backups, and you have options. If you have questions or want to learn more about Backblaze backup solutions, contact us today. Or, click here if you’re ready to get started backing up your server.
This Q2 2022 recap post takes a look at some of the latest investments we’ve made to InsightIDR to drive detection and response forward for your organization.
New interactive HTML reports
InsightIDR’s new HTML reports incorporate the interactive features you know and love from our dashboards delivered straight to your inbox. The HTML report file is sent as an email attachment and allows you to scroll through tables, drill in and out of cards, and sort tables in the same way you would explore dashboards.
Increased visibility into malware activity
Traditional intrusion detection systems (IDS) can be noisy. Rapid7’s Threat Intelligence and Detection Engineering (TIDE) team has carefully analyzed thousands of IDS events to curate a list of only the most critical and actionable events. We’ve recently expanded our library to include over 4,500 curated IDS detection rules to help customers detect activity associated with thousands of common pieces of malware.
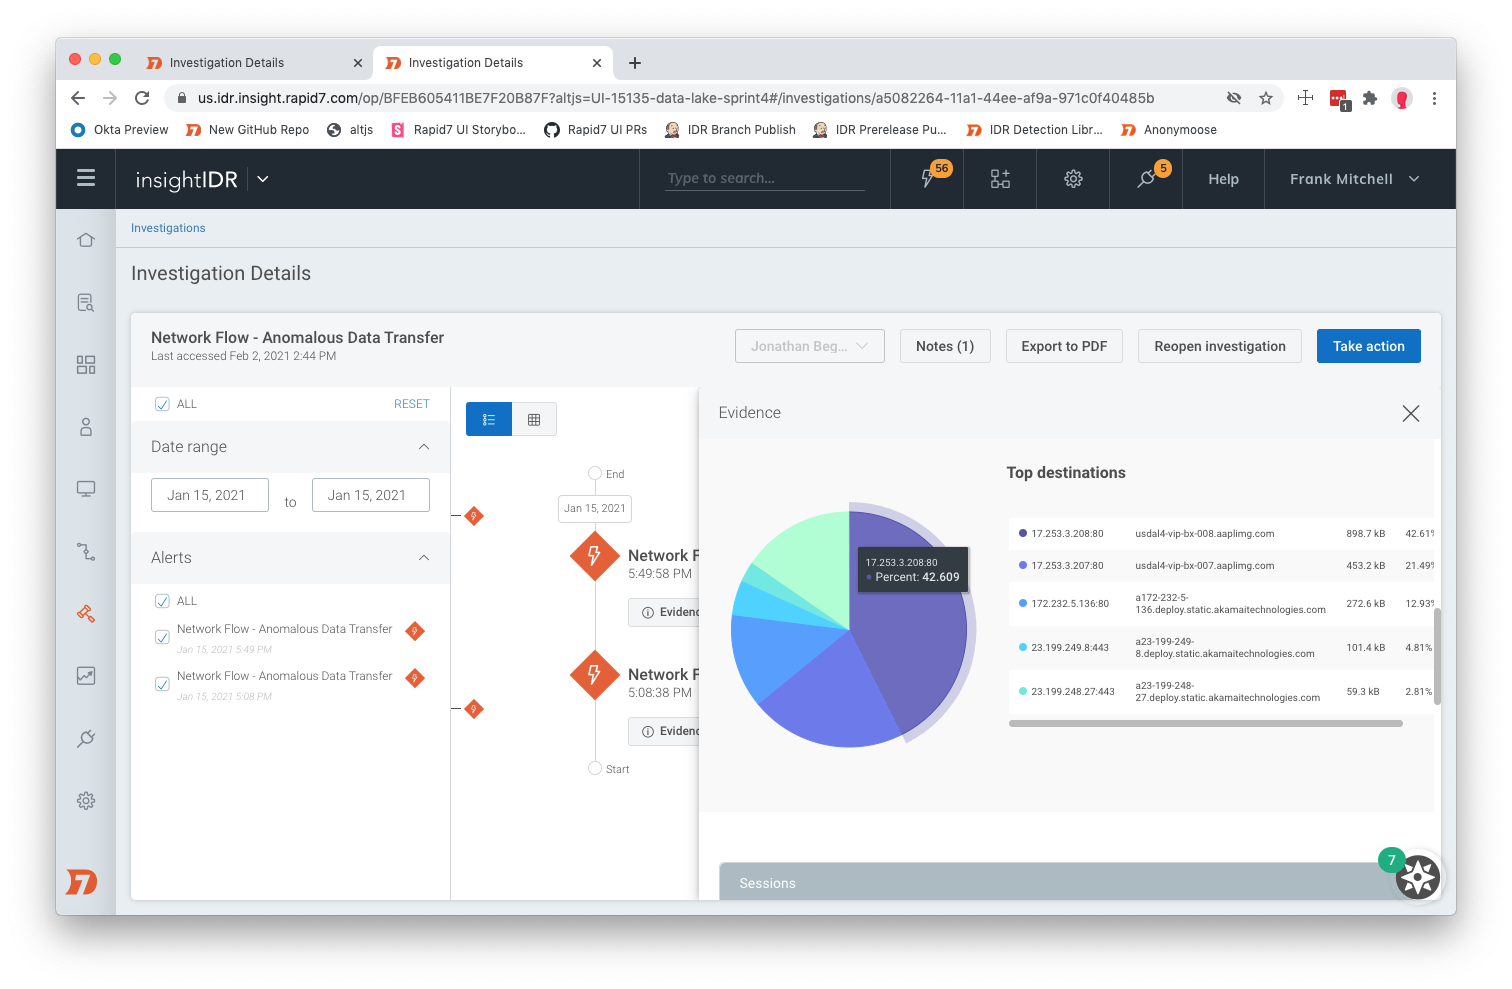
Catch data exfiltration attempts with Anomalous Data Transfer
Anomalous Data Transfer (ADT) is a new Attacker Behavior Analytics (ABA) detection rule that uses the Insight Network Sensor to identify large transfers of data sent by assets on a network. ADT outputs data exfiltration alerts which make it easier for you to monitor transfer activity and identify unusual behavior to stay ahead of threats. These new detections are available for select InsightIDR packages — see more details here in our documentation.
Build stronger integrations and quickly triage investigations with new InsightIDR APIs
Investigation management APIs
Our new APIs allow you to extract more extensive data from within your investigation and use it to integrate with third-party tools, or build automation workflows to help you save time analyzing and closing investigations. View our documentation to learn more.
Update one or more Investigation fields through a single API call
Retrieve a sortable list of Investigations
Search Investigations
Create a Manual Investigation
User, accounts, and asset APIs
We are excited to release new APIs to allow you to programmatically interface with InsightIDR users, accounts, local accounts, and assets. You can use these APIs to configure new automations that further contextualize alerts generated by InsightIDR or third-party tools and help you to create more actionable views of alert data.
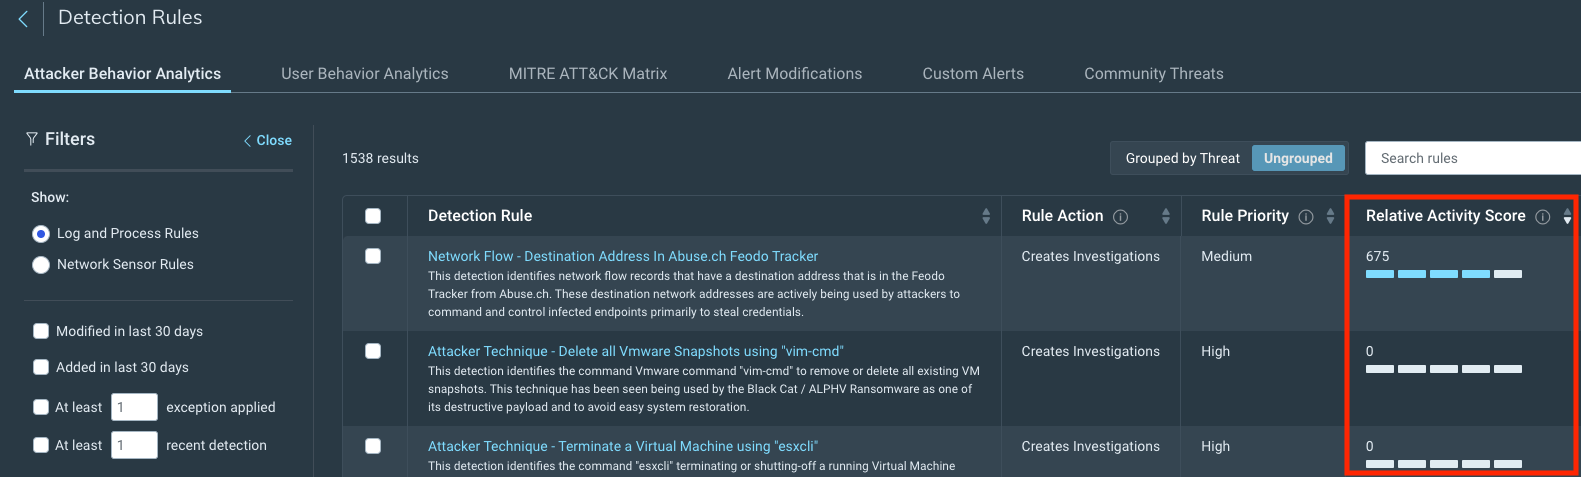
Relative Activity: A new way to analyze detection rules
We’ve introduced a new score called Relative Activity to ABA detection rules that analyzes how often the Rule Logic matches data in your environment based on certain parameters. The Relative Activity score is calculated over a rolling 24-hour period and can help you:
Identify detection rules that might cause frequent investigations or notable events if switched on
Determine which rules may benefit from tuning, either by changing the Rule Action or adding exceptions
New Relative Activity score for detection rules
Log Search improvements
Enrich Log Search results with new Quick Actions: Earlier this year InsightIDR and InsightConnect teamed up to create Quick Actions, a new feature that provides instant automation within InsightIDR to reduce time to respond to investigations, all with the click of a button. We’ve recently released new Quick Actions to enable pre-configured actions within InsightIDR’s Log Search for InsightIDR Ultimate and InsightIDR legacy customers. Quick Actions are available for select InsightIDR packages, see more details here in our documentation.
Use AWS S3 as a collection method for custom logs: Now customers have the choice to use either Cisco Umbrella or AWS S3 as a collection method when setting up custom logs. Alongside this update, we’ve also refactored the data source to make it more resilient and effective.
A growing library of actionable detections
In Q2, we added 290 new ABA detection rules to InsightIDR. See them in-product or visit the Detection Library for actionable descriptions and recommendations.
Stay tuned!
As always, we’re continuing to work on exciting product enhancements and releases throughout the year. Keep an eye on our blog and release notes as we continue to highlight the latest in detection and response at Rapid7.
Organizations have been using data warehouse and business intelligence (DWBI) workloads to support business decision making for many years. These workloads are brought to the Amazon Web Services (AWS) platform to utilize the benefit of AWS cloud. However, these workloads are built using multiple vendor tools and technologies, and the customer faces the burden of administrative overhead.
This post provides architectural guidance to consolidate multiple DWBI technologies to AWS Managed Services to help reduce the administrative overhead, bring operational ease, and business efficiency. Two scenarios are explored:
Upstream transactional databases are already on AWS
Upstream transactional databases are present at on-premise datacenter
Challenges faced by an organization
Organizations are engaged in managing multiple DWBI technologies due to acquisitions, mergers, and the lift-and-shift of workloads. These workloads use extract, transform, and load (ETL) tools to read relational data from upstream transactional databases, process it, and store it in a data warehouse. Thereafter, these workloads use business intelligence tools to generate valuable insight and present it to users in form of reports and dashboards.
These DWBI technologies are generally installed and maintained on their own server. Figure 1 demonstrates the increased the administrative overhead for the organization but also creates challenges in maintaining the team’s overall knowledge.
Figure 1. DWBI workload with multiple tools
Therefore, organizations are looking to consolidate technology usage and continue supporting important business functions.
Scenario 1
As we know, three major functions of DWBI workstream are:
ETL data using a tool
Store/manage the data in a data warehouse
Generate information from the data using business intelligence
Each of these functions can be performed efficiently using an AWS service. For example, AWS Glue can be used for ETL, Amazon Redshift for data warehouse, and Amazon QuickSight for business intelligence.
With the use of mentioned AWS services, organizations will be able to consolidate their DWBI technology usage. Organizations also will be able to quickly adapt to these services, as their engineering team can more easily use their DWBI knowledge with these services. For example, using SQL knowledge in AWS Glue jobs with SprakSQL, in Amazon Redshift queries, and in Amazon QuickSight dashboards.
Figure 2 demonstrates the redesigned the architecture of Figure 1 using AWS services. In this architecture, ETL functions are consolidated in AWS Glue. An AWS Glue crawler is used to auto-catalogue the source and target table metadata; then, AWS Glue ETL jobs use these catalogues to read data from source and write to target (data warehouse). AWS Glue jobs also apply necessary transformations (such as join, filter, and aggregate) to the data before writing. Additionally, an AWS Glue trigger is used to schedule the job executions. Alternatively, AWS Managed Workflows for Apache Airflow can be used to schedule jobs.
Figure 2. Consolidated workload with source on AWS
Similarly, data warehousing function is consolidated with Amazon Redshift. Amazon Redshift is used to store and organize enriched data and also enforce appropriate data access control for both workloads and users.
Lastly, business intelligence functions are consolidated using Amazon QuickSight. It used to create necessary dashboards that source data from Amazon Redshift and apply complex business logic to produce necessary charts and graphs needed for business insights. It is also used to implement necessary access restrictions to dashboards and data.
Scenario 2
In situation where source databases are in on-premises datacenter, the overall solution will be similar to Scenario 1, with an additional step to move the data continually from on-premise database to an Amazon Simple Storage Service (Amazon S3) bucket. The data movement can be efficiently handled by AWS Database Migration Service (AWS DMS).
To make the source database accessible to AWS DMS, a connection needs to established between the AWS cloud and on-premise network. Based on performance and throughput needs, the organization can choose either AWS Direct Connect service or AWS Site-to-Site VPN service to securely move the data. For the purpose of this discussion, we are considering AWS Direct Connect.
In Figure 3, AWS DMS task is used to perform a full-load followed by change data capture to continuously move the data to an S3 bucket. In this scenario, AWS Glue is used to catalogue and read the data from S3 bucket. The remaining portion of the dataflow is the same as the one mentioned in Scenario 1.
Figure 3. Consolidated workload with source at datacenter
Scaling
Both of the updated architectures provide necessary scaling:
Auto scaling feature can be used to scale-up or -down AWS Glue ETL job resources
Concurrency scaling feature can be used to support virtually unlimited concurrent users and queries in Amazon Redshift
Amazon QuickSight resources (web server, Amazon QuickSight engine, and SPICE) are auto scaled by design
Security, monitoring, and auditing
Also, the updated architectures provide necessary security by using access control, data encryption at-rest and in transit, monitoring, and auditing.
AWS CloudTrail can be used for tracking user activity and API usage for auditing and troubleshooting.
Amazon CloudWatch can be used to monitor Amazon Redshift service and log generated by AWS Glue jobs.
Amazon Simple Notification Service can be used for sending notifications from AWS cloud. For example, AWS Glue jobs’ execution status, Amazon QuickSight SPICE data failure notification.
Additionally, both Amazon Redshift and Amazon QuickSight provides their own authentication and access controls. Therefore, a user can be a local user or a federated one. With the help of these authentications, an organization will be able to control access to data in Amazon Redshift and also access to the dashboard in Amazon QuickSight.
Conclusion
In this blog post, we discussed how AWS Glue, Amazon Redshift, and Amazon QuickSight can be used to consolidate DWBI technologies. We also have discussed how an architecture can help an organization build a scalable, secure workload with auto scaling, access control, log monitoring and activity auditing.
Security updates have been issued by Debian (ldap-account-manager), Fedora (openssl1.1, thunderbird, and yubihsm-connector), Mageia (curl, cyrus-imapd, firefox, ruby-git, ruby-rack, squid, and thunderbird), Oracle (firefox, kernel, and thunderbird), Slackware (openssl), SUSE (dpdk, haproxy, and php7), and Ubuntu (gnupg2 and openssl).
Welcome to our 2022 Q2 DDoS report. This report includes insights and trends about the DDoS threat landscape — as observed across the global Cloudflare network. An interactive version of this report is also available on Radar.
In Q2, we’ve seen some of the largest attacks the world has ever seen including a 26 million request per second HTTPS DDoS attacks that Cloudflare automatically detected and mitigated. Furthermore, attacks against Ukraine and Russia continue, whilst a new Ransom DDoS attack campaign emerged.
The Highlights
Ukrainian and Russian Internet
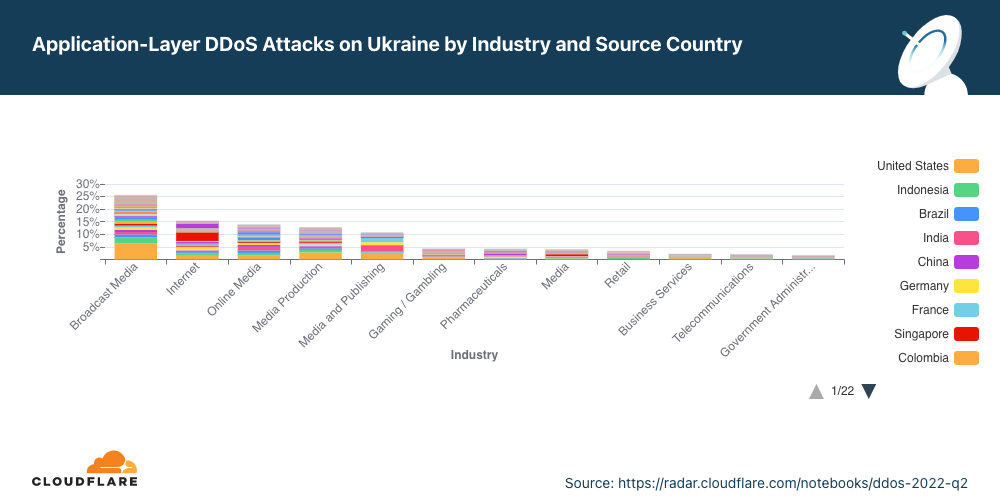
The war on the ground is accompanied by attacks targeting the spread of information.
Broadcast Media companies in the Ukraine were the most targeted in Q2 by DDoS attacks. In fact, all the top five most attacked industries are all in online/Internet media, publishing, and broadcasting.
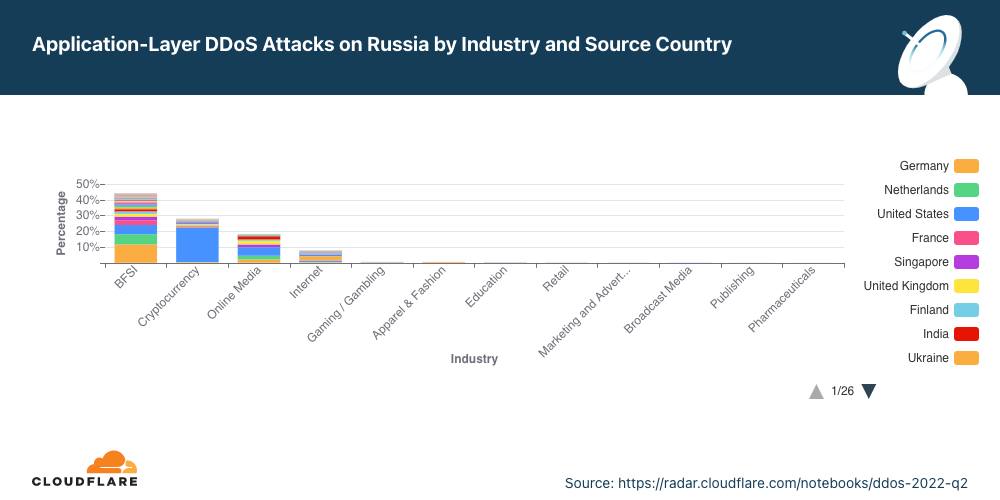
In Russia on the other hand, Online Media drops as the most attacked industry to the third place. Making their way to the top, Banking, Financial Services and Insurance (BFSI) companies in Russia were the most targeted in Q2; almost 45% of all application-layer DDoS attacks targeted the BFSI sector. Cryptocurrency companies in Russia were the second most attacked.
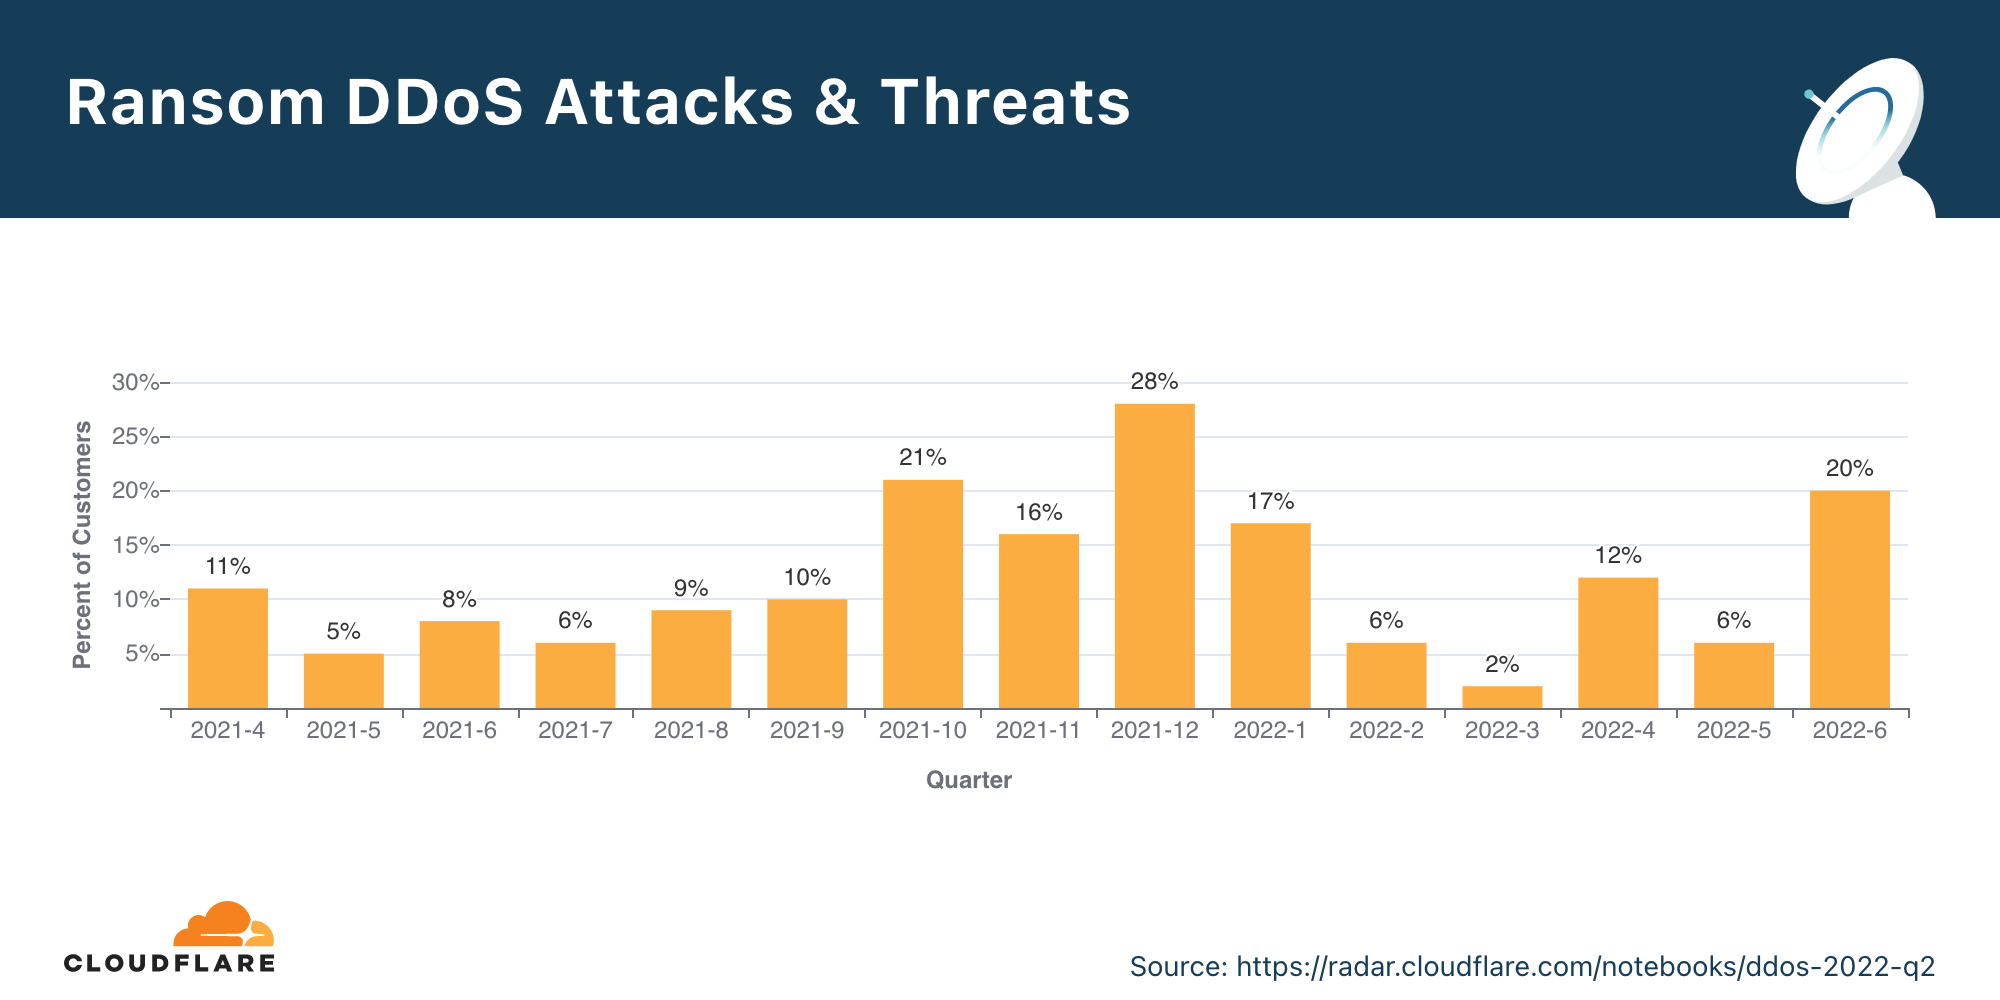
We’ve seen a new wave of Ransom DDoS attacks by entities claiming to be the Fancy Lazarus.
In June 2022, ransom attacks peaked to the highest of the year so far: one out of every five survey respondents who experienced a DDoS attack reported being subject to a Ransom DDoS attack or other threats.
Overall in Q2, the percent of Ransom DDoS attacks increased by 11% QoQ.
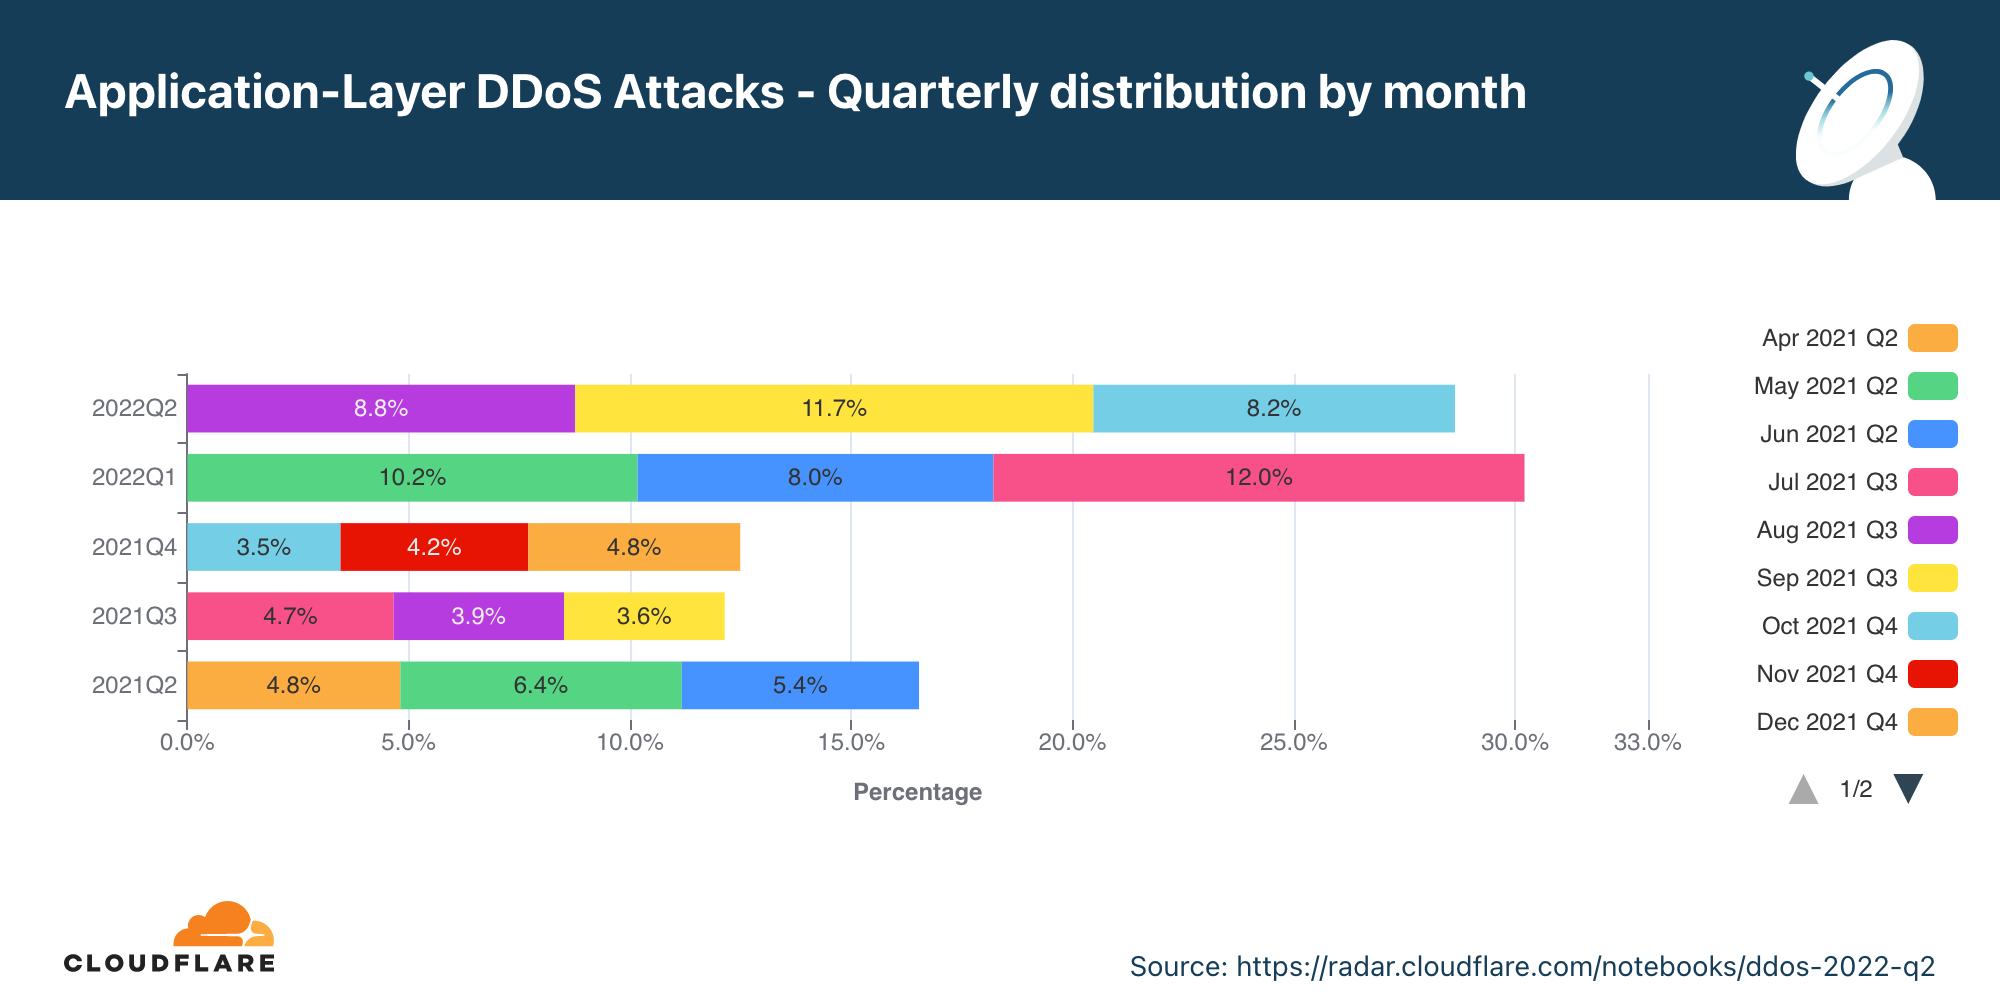
Application-layer DDoS attacks
In 2022 Q2, application-layer DDoS attacks increased by 72% YoY.
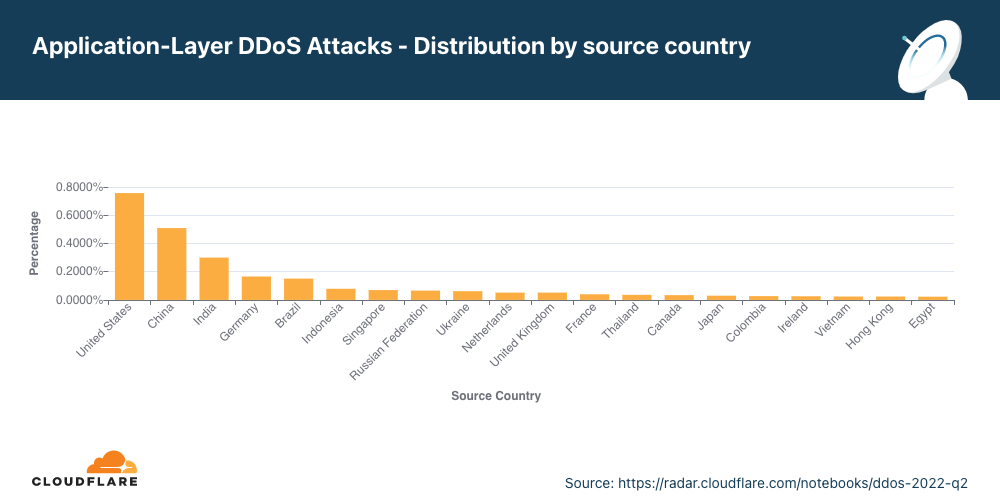
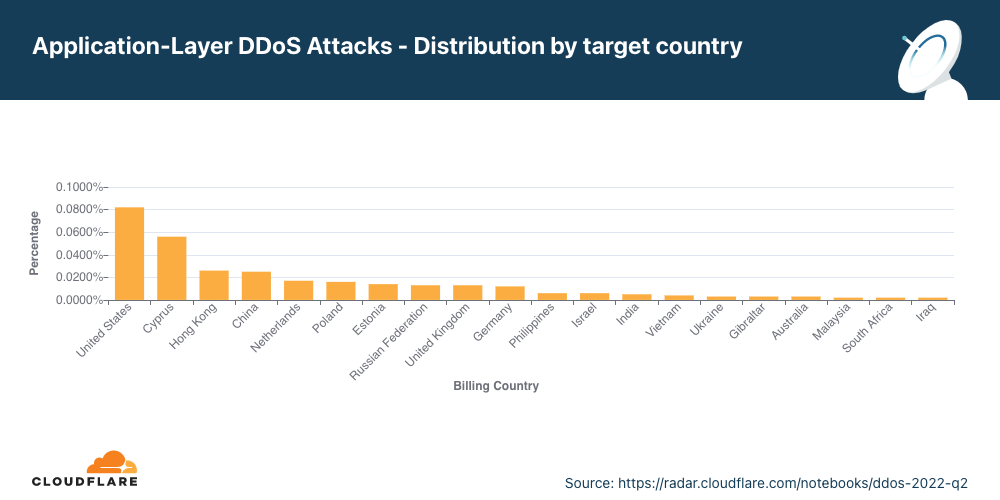
Organizations in the US were the most targeted, followed by Cyprus, Hong Kong, and China. Attacks on organizations in Cyprus increased by 166% QoQ.
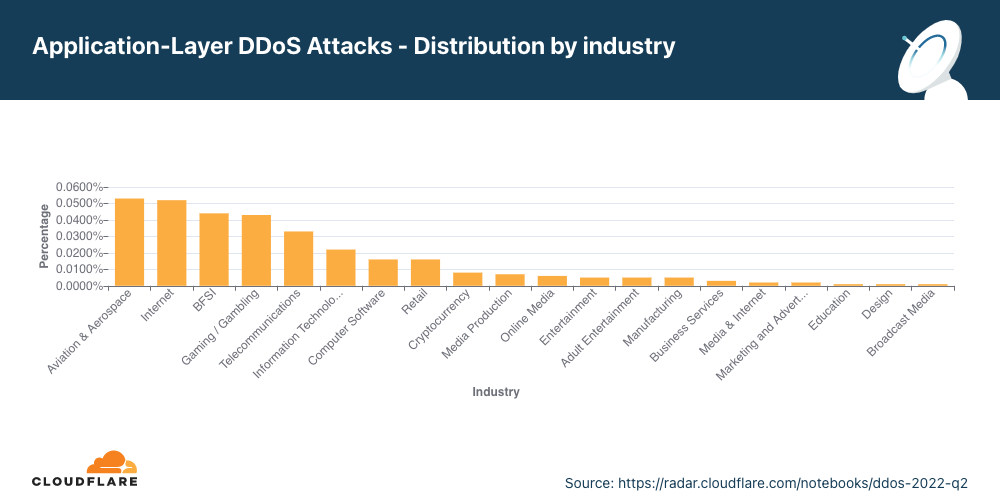
The Aviation & Aerospace industry was the most targeted in Q2, followed by the Internet industry, Banking, Financial Services and Insurance, and Gaming / Gambling in fourth place.
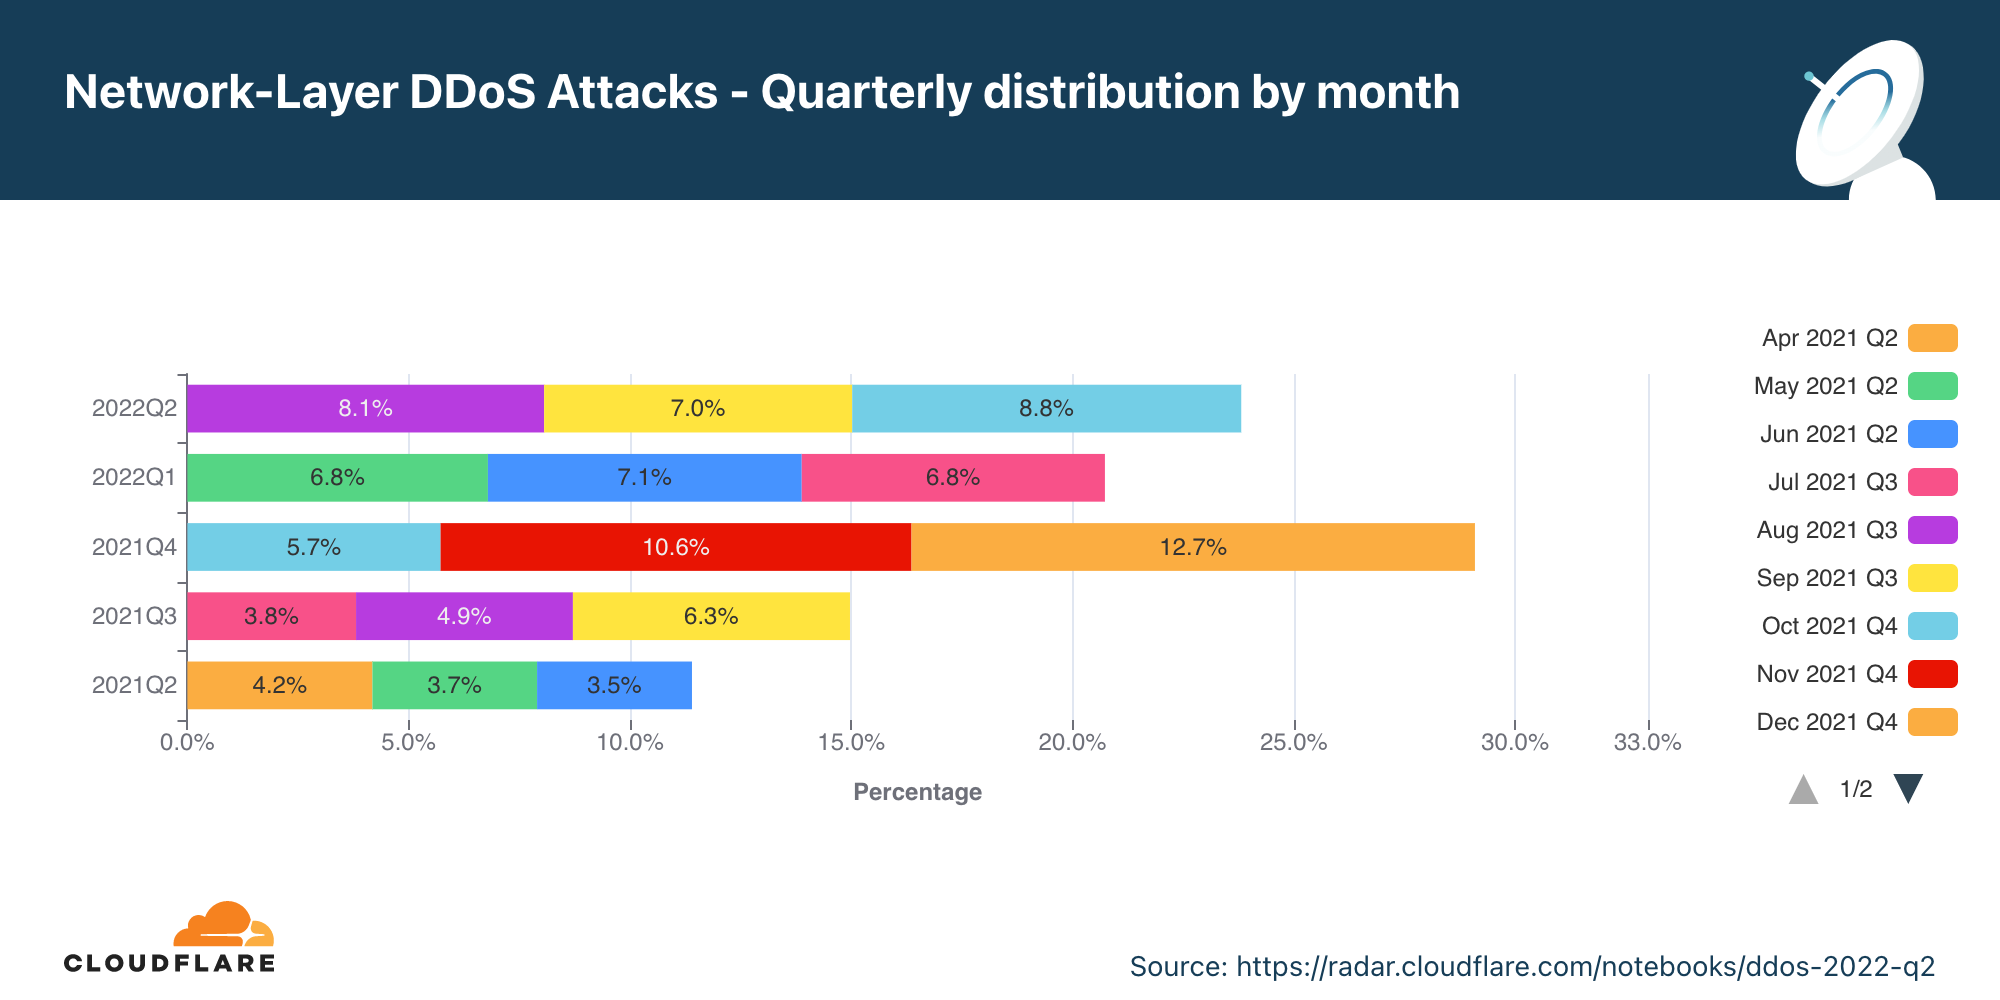
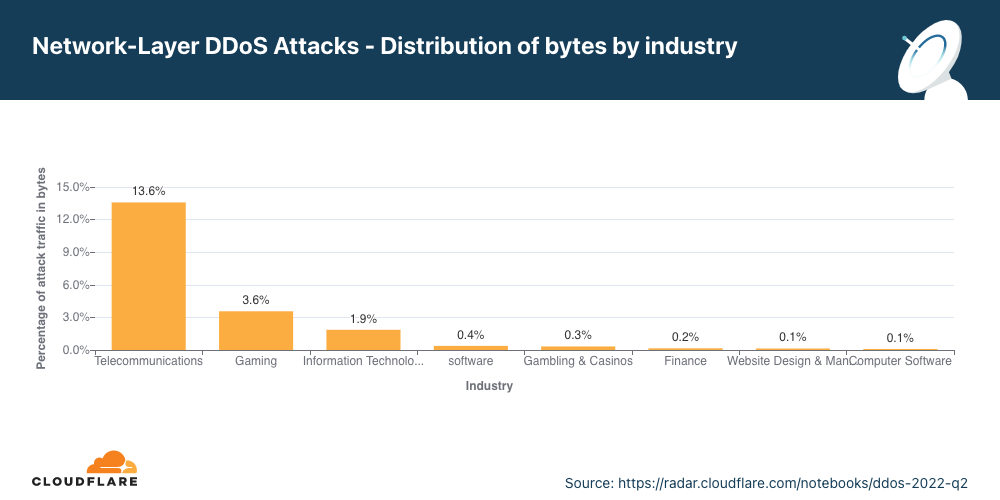
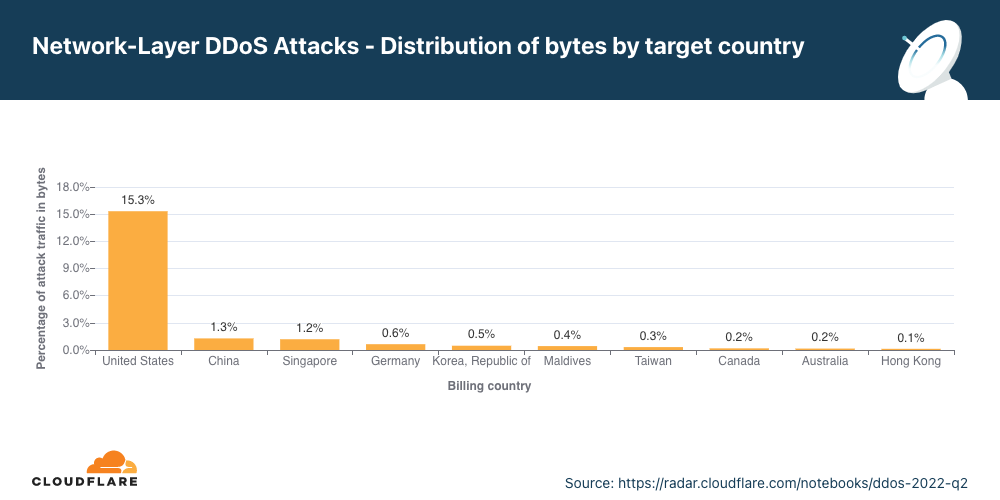
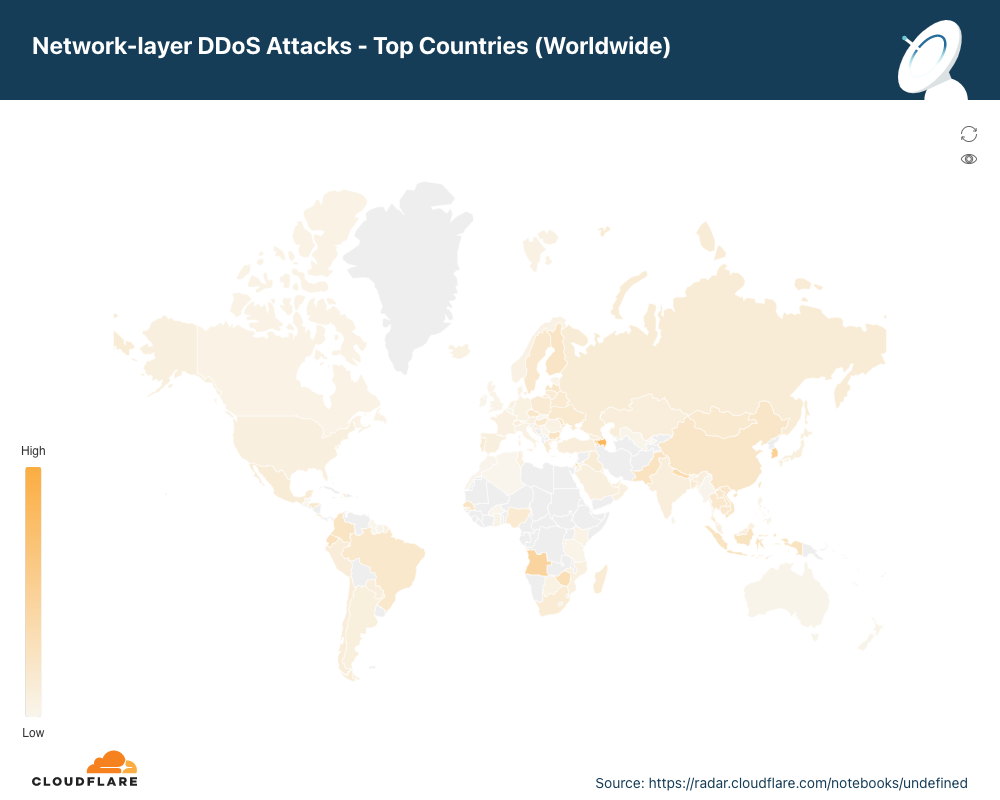
Network-layer DDoS attacks
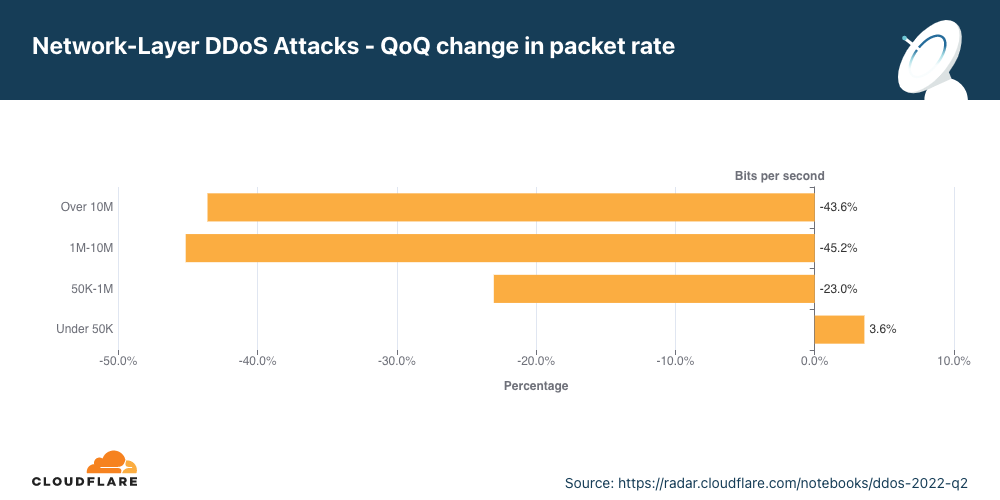
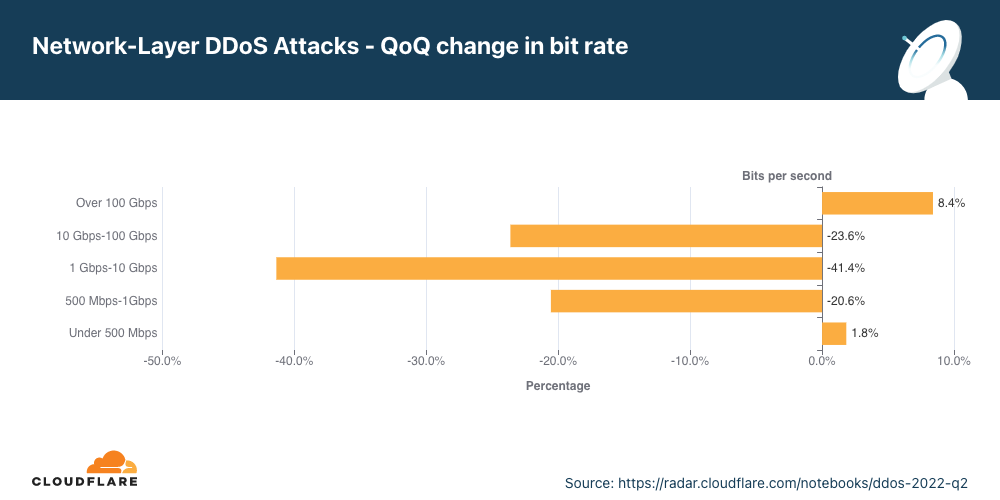
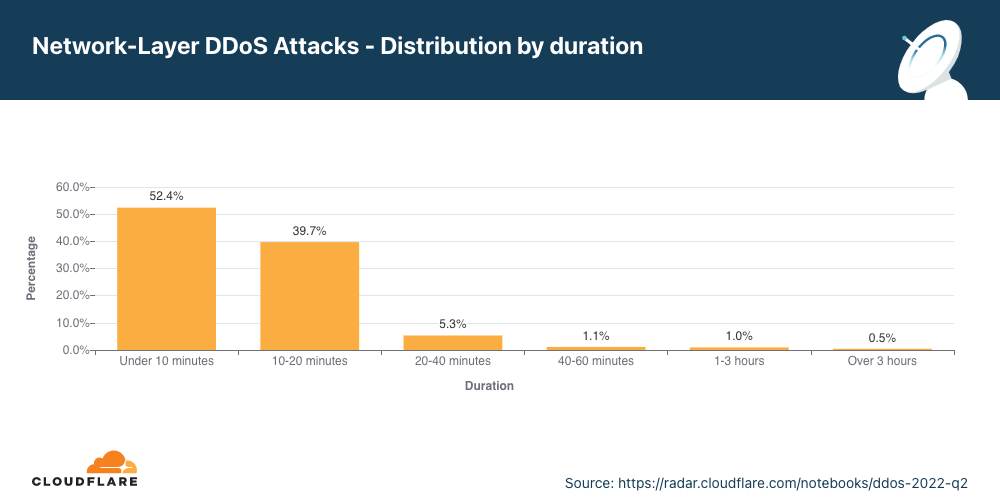
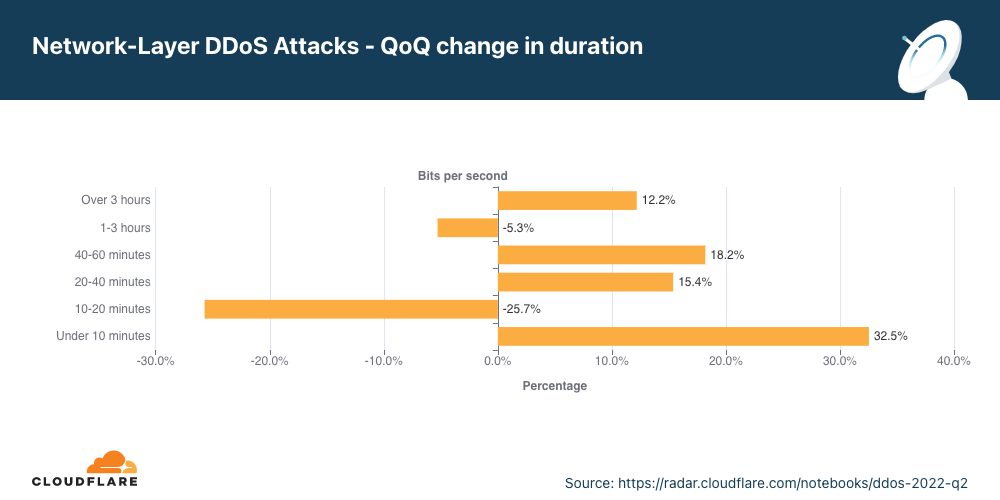
In 2022 Q2, network-layer DDoS attacks increased by 109% YoY. Attacks of 100 Gbps and larger increased by 8% QoQ, and attacks lasting more than 3 hours increased by 12% QoQ.
The top attacked industries were Telecommunications, Gaming / Gambling and the Information Technology and Services industry.
Organizations in the US were the most targeted, followed by China, Singapore, and Germany.
This report is based on DDoS attacks that were automatically detected and mitigated by Cloudflare’s DDoS Protection systems. To learn more about how it works, check out this deep-dive blog post.
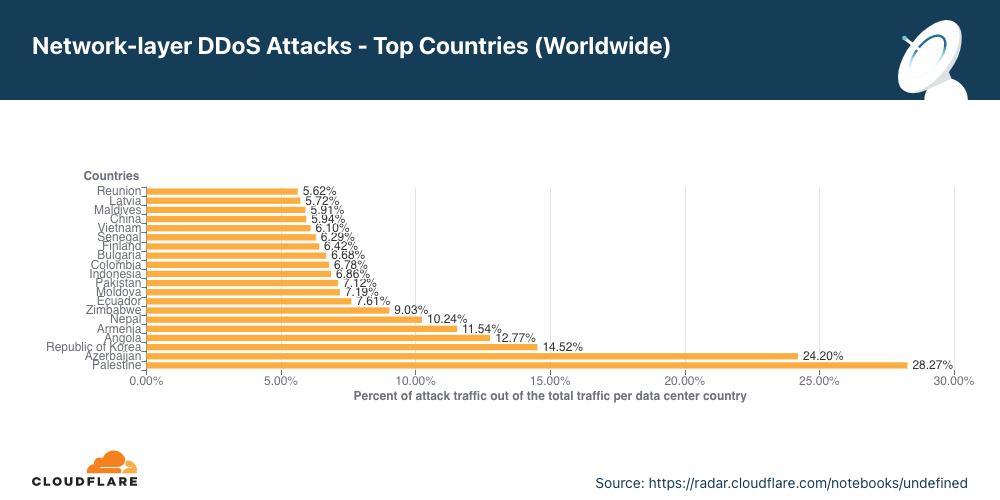
A note on how we measure DDoS attacks observed over our network
To analyze attack trends, we calculate the “DDoS activity” rate, which is either the percentage of attack traffic out of the total traffic (attack + clean) observed over our global network, or in a specific location, or in a specific category (e.g., industry or billing country). Measuring the percentages allows us to normalize data points and avoid biases reflected in absolute numbers towards, for example, a Cloudflare data center that receives more total traffic and likely, also more attacks.
Ransom Attacks
Our systems constantly analyze traffic and automatically apply mitigation when DDoS attacks are detected. Each DDoS’d customer is prompted with an automated survey to help us better understand the nature of the attack and the success of the mitigation.
For over two years now, Cloudflare has been surveying attacked customers — one question on the survey being if they received a threat or a ransom note demanding payment in exchange to stop the DDoS attack.
The number of respondents reporting threats or ransom notes in Q2 increased by 11% QoQ and YoY. During this quarter, we’ve been mitigating Ransom DDoS attacks that have been launched by entities claiming to be the Advanced Persistent Threat (APT) group “Fancy Lazarus”. The campaign has been focusing on financial institutions and cryptocurrency companies.
The percentage of respondents reported being targeted by a ransom DDoS attack or that have received threats in advance of the attack.
Drilling down into Q2, we can see that in June one out of every five respondents reported receiving a ransom DDoS attack or threat — the highest month in 2022, and the highest since December 2021.
Application-layer DDoS attacks
Application-layer DDoS attacks, specifically HTTP DDoS attacks, are attacks that usually aim to disrupt a web server by making it unable to process legitimate user requests. If a server is bombarded with more requests than it can process, the server will drop legitimate requests and — in some cases — crash, resulting in degraded performance or an outage for legitimate users.
Application-layer DDoS attacks by month
In Q2, application-layer DDoS attacks increased by 72% YoY.
Overall, in Q2, the volume of application-layer DDoS attacks increased by 72% YoY, but decreased 5% QoQ. May was the busiest month in the quarter. Almost 41% of all application-layer DDoS attacks took place in May, whereas the least number of attacks took place in June (28%).
Application-layer DDoS attacks by industry
Attacks on the Aviation and Aerospace industry increased by 493% QoQ.
In Q2, Aviation and Aerospace was the most targeted industry by application-layer DDoS attacks. After it, was the Internet industry, Banking, Financial Institutions and Insurance (BFSI) industry, and in fourth place the Gaming / Gambling industry.
Ukraine and Russia cyberspace
Media and publishing companies are the most targeted in Ukraine.
As the war in Ukraine continues on the ground, in the air and on the water, so does it continue in cyberspace. Entities targeting Ukrainian companies appear to be trying to silence information. The top five most attacked industries in the Ukraine are all in broadcasting, Internet, online media, and publishing — that’s almost 80% of all DDoS Attacks targeting Ukraine.
On the other side of the war, the Russian Banks, Financial Institutions and Insurance (BFSI) companies came under the most attacks. Almost 45% of all DDoS attacks targeted the BFSI sector. The second most targeted was the Cryptocurrency industry, followed by Online media.
In both sides of the war, we can see that the attacks are highly distributed, indicating the use of globally distributed botnets.
Application-layer DDoS attacks by source country
In Q2, attacks from China shrank by 78%, and attacks from the US shrank by 43%.
To understand the origin of the HTTP attacks, we look at the geolocation of the source IP address belonging to the client that generated the attack HTTP requests. Unlike network-layer attacks, source IP addresses cannot be spoofed in HTTP attacks. A high percentage of DDoS activity in a given country doesn’t mean that that specific country is launching the attacks but rather indicates the presence of botnets operating from within the country’s borders.
For the second quarter in a row, the United States tops the charts as the main source of HTTP DDoS attacks. Following the US is China in second place, and India and Germany in the third and fourth. Even though the US remained in the first place, attacks originating from the US shrank by 48% QoQ while attacks from other regions grew; attacks from India grew by 87%, from Germany by 33%, and attacks from Brazil grew by 67%.
Application-layer DDoS attacks by target country
In order to identify which countries are targeted by the most HTTP DDoS attacks, we bucket the DDoS attacks by our customers’ billing countries and represent it as a percentage out of all DDoS attacks.
HTTP DDoS attacks on US-based countries increased by 67% QoQ pushing the US back to the first place as the main target of application-layer DDoS attacks. Attacks on Chinese companies plunged by 80% QoQ dropping it from the first place to the fourth. Attacks on Cyprus increase by 167% making it the second most attacked country in Q2. Following Cyprus is Hong Kong, China, and the Netherlands.
Network-layer DDoS attacks
While application-layer attacks target the application (Layer 7 of the OSI model) running the service that end users are trying to access (HTTP/S in our case), network-layer attacks aim to overwhelm network infrastructure (such as in-line routers and servers) and the Internet link itself.
Network-layer DDoS attacks by month
In Q2, network-layer DDoS attacks increased by 109% YoY, and volumetric attacks of 100 Gbps and larger increased by 8% QoQ.
In Q2, the total amount of network-layer DDoS attacks increased by 109% YoY and 15% QoQ. June was the busiest month of the quarter with almost 36% of the attacks occurring in June.
Network-layer DDoS attacks by industry
In Q2, attacks on Telecommunication companies grew by 66% QoQ.
For the second consecutive quarter, the Telecommunications industry was the most targeted by network-layer DDoS attacks. Even more so, attacks on Telecommunication companies grew by 66% QoQ. The Gaming industry came in second place, followed by Information Technology and Services companies.
Network-layer DDoS attacks by target country
Attacks on US networks grew by 95% QoQ.
In Q2, the US remains the most attacked country. After the US came China, Singapore and Germany.
Network-layer DDoS attacks by ingress country
In Q2, almost a third of the traffic Cloudflare observed in Palestine and a fourth in Azerbaijan was part of a network-layer DDoS attack.
When trying to understand where network-layer DDoS attacks originate, we cannot use the same method as we use for the application-layer attack analysis. To launch an application-layer DDoS attack, successful handshakes must occur between the client and the server in order to establish an HTTP/S connection. For a successful handshake to occur, the attacks cannot spoof their source IP address. While the attacker may use botnets, proxies, and other methods to obfuscate their identity, the attacking client’s source IP location does sufficiently represent the attack source of application-layer DDoS attacks.
On the other hand, to launch network-layer DDoS attacks, in most cases, no handshake is needed. Attackers can spoof the source IP address in order to obfuscate the attack source and introduce randomness into the attack properties, which can make it harder for simple DDoS protection systems to block the attack. So if we were to derive the source country based on a spoofed source IP, we would get a ‘spoofed country’.
For this reason, when analyzing network-layer DDoS attack sources, we bucket the traffic by the Cloudflare data center locations where the traffic was ingested, and not by the (potentially) spoofed source IP to get an understanding of where the attacks originate from. We are able to achieve geographical accuracy in our report because we have data centers in over 270 cities around the world. However, even this method is not 100% accurate, as traffic may be back hauled and routed via various Internet Service Providers and countries for reasons that vary from cost reduction to congestion and failure management.
Palestine jumps from the second to the first place as the Cloudflare location with the highest percentage of network-layer DDoS attacks. Following Palestine is Azerbaijan, South Korea, and Angola.
To view all regions and countries, check out the interactive map.
Attack vectors
In Q2, DNS attacks increased making it the second most frequent attack vector.
An attack vector is a term used to describe the method that the attacker uses to launch their DDoS attack, i.e., the IP protocol, packet attributes such as TCP flags, flooding method, and other criteria.
In Q2, 53% of all network-layer attacks were SYN floods. SYN floods remain the most popular attack vector. They abuse the initial connection request of the stateful TCP handshake. During this initial connection request, servers don’t have any context about the TCP connection as it is new and without the proper protection may find it hard to mitigate a flood of initial connection requests. This makes it easier for the attacker to consume an unprotected server’s resources.
After the SYN floods are attacks targeting DNS infrastructure, RST floods again abusing TCP connection flow, and generic attacks over UDP.
Emerging threats
In Q2, the top emerging threats included attacks over CHARGEN, Ubiquiti and Memcached.
Identifying the top attack vectors helps organizations understand the threat landscape. In turn, this may help them improve their security posture to protect against those threats. Similarly, learning about new emerging threats that may not yet account for a significant portion of attacks, can help mitigate them before they become a significant force.
In Q2, the top emerging threats were amplification attacks abusing the Character Generator Protocol (CHARGEN), amplification attacks reflecting traffic off of exposed Ubiquiti devices, and the notorious Memcached attack.
Abusing the CHARGEN protocol to launch amplification attacks
In Q2, attacks abusing the CHARGEN protocol increased by 378% QoQ.
Initially defined in RFC 864 (1983), the Character Generator (CHARGEN) protocol is a service of the Internet Protocol Suite that does exactly what it says it does – it generates characters arbitrarily, and it doesn’t stop sending them to the client until the client closes the connection. Its original intent was for testing and debugging. However, it’s rarely used because it can so easily be abused to generate amplification/reflection attacks.
An attacker can spoof the source IP of their victim and fool supporting servers around the world to direct a stream of arbitrary characters “back” to the victim’s servers. This type of attack is amplification/reflection. Given enough simultaneous CHARGEN streams, the victim’s servers, if unprotected, would be flooded and unable to cope with legitimate traffic — resulting in a denial of service event.
Amplification attacks exploiting the Ubiquiti Discovery Protocol
In Q2, attacks over Ubiquity increased by 327% QoQ.
Ubiquiti is a US-based company that provides networking and Internet of Things (IoT) devices for consumers and businesses. Ubiquiti devices can be discovered on a network using the Ubiquiti Discovery protocol over UDP/TCP port 10001.
Similarly to the CHARGEN attack vector, here too, attackers can spoof the source IP to be the victim’s IP address and spray IP addresses that have port 10001 open. Those would then respond to the victim and essentially flood it if the volume is sufficient.
Memcached DDoS attacks
In Q2, Memcached DDoS attacks increased by 287% QoQ.
Memcached is a database caching system for speeding up websites and networks. Similarly to CHARGEN and Ubiquiti, Memcached servers that support UDP can be abused to launch amplification/reflection DDoS attacks. In this case, the attacker would request content from the caching system and spoof the victim’s IP address as the source IP in the UDP packets. The victim will be flooded with the Memcache responses which can be amplified by a factor of up to 51,200x.
Network-layer DDoS attacks by attack rate
Volumetric attacks of over 100 Gbps increase by 8% QoQ.
There are different ways of measuring the size of an L3/4 DDoS attack. One is the volume of traffic it delivers, measured as the bit rate (specifically, terabits per second or gigabits per second). Another is the number of packets it delivers, measured as the packet rate (specifically, millions of packets per second).
Attacks with high bit rates attempt to cause a denial-of-service event by clogging the Internet link, while attacks with high packet rates attempt to overwhelm the servers, routers, or other in-line hardware appliances. These devices dedicate a certain amount of memory and computation power to process each packet. Therefore, by bombarding it with many packets, the appliance can be left with no further processing resources. In such a case, packets are “dropped,” i.e., the appliance is unable to process them. For users, this results in service disruptions and denial of service.
Distribution by packet rate
The majority of network-layer DDoS attacks remain below 50,000 packets per second. While 50 kpps is on the lower side of the spectrum at Cloudflare scale, it can still easily take down unprotected Internet properties and congest even a standard Gigabit Ethernet connection.
When we look at the changes in the attack sizes, we can see that packet-intensive attacks above 50 kpps decreased in Q2, resulting in an increase of 4% in small attacks.
Distribution by bitrate
In Q2, most of the network-layer DDoS attacks remain below 500 Mbps. This too is a tiny drop in the water at Cloudflare scale, but can very quickly shut down unprotected Internet properties with less capacity or at the very least cause congestion for even a standard Gigabit Ethernet connection.
Interestingly enough, large attacks between 500 Mbps and 100 Gbps decreased by 20-40% QoQ, but volumetric attacks above 100 Gbps increased by 8%.
Network-layer DDoS attacks by duration
In Q2, attacks lasting over three hours increased by 9%.
We measure the duration of an attack by recording the difference between when it is first detected by our systems as an attack and the last packet we see with that attack signature towards that specific target.
In Q2, 52% of network-layer DDoS attacks lasted less than 10 minutes. Another 40% lasted 10-20 minutes. The remaining 8% include attacks ranging from 20 minutes to over three hours.
One important thing to keep in mind is that even if an attack lasts only a few minutes, if it is successful, the repercussions could last well beyond the initial attack duration. IT personnel responding to a successful attack may spend hours and even days restoring their services.
While most of the attacks are indeed short, we can see an increase of over 15% in attacks ranging between 20-60 minutes, and a 12% increase of attacks lasting more than three hours.
Short attacks can easily go undetected, especially burst attacks that, within seconds, bombard a target with a significant number of packets, bytes, or requests. In this case, DDoS protection services that rely on manual mitigation by security analysis have no chance in mitigating the attack in time. They can only learn from it in their post-attack analysis, then deploy a new rule that filters the attack fingerprint and hope to catch it next time. Similarly, using an “on-demand” service, where the security team will redirect traffic to a DDoS provider during the attack, is also inefficient because the attack will already be over before the traffic routes to the on-demand DDoS provider.
It’s recommended that companies use automated, always-on DDoS protection services that analyze traffic and apply real-time fingerprinting fast enough to block short-lived attacks.
Summary
Cloudflare’s mission is to help build a better Internet. A better Internet is one that is more secure, faster, and reliable for everyone — even in the face of DDoS attacks. As part of our mission, since 2017, we’ve been providing unmetered and unlimited DDoS protection for free to all of our customers. Over the years, it has become increasingly easier for attackers to launch DDoS attacks. But as easy as it has become, we want to make sure that it is even easier — and free — for organizations of all sizes to protect themselves against DDoS attacks of all types.
Not using Cloudflare yet? Start now with our Free and Pro plans to protect your websites, or contact us for comprehensive DDoS protection for your entire network using Magic Transit.
Bem-vindo ao nosso relatório de DDoS do segundo trimestre de 2022. Este relatório inclui informações e tendências sobre o cenário de ameaças DDoS — conforme observado em toda a Rede global da Cloudflare. Uma versão interativa deste relatório também está disponível no Radar.
A guerra no terreno é acompanhada por ataques direcionados à distribuição de informações.
Empresas de mídia de radiodifusão na Ucrânia foram as mais visadas por ataques DDoS no segundo trimestre. Na verdade, todos os seis principais setores vitimados estão na mídia on-line/internet, publicações e radiodifusão.
Por outro lado, na Rússia, a mídia on-line deixou de ser o setor mais atacado e caiu para o terceiro lugar. No topo, estão empresas como bancos, serviços financeiros e seguros (BFSI, na sigla em inglês) do país, que foram as mais visadas no segundo trimestre; sendo vítimas de quase 50% de todos os ataques DDoS na camada de aplicativos. O segundo lugar é das empresas de criptomoedas.
Em junho de 2022, houve o maior pico do ano nos ataques DDoS com pedido de resgate até agora: um em cada cinco participantes na pesquisa que passaram por um ataque DDoS relataram ter recebido um pedido de resgate ou outras ameaças.
No T2 em geral, o percentual de ataques DDoS com pedido de resgate aumentou 11% na comparação com o trimestre anterior.
Ataques DDoS na camada de aplicativos
No segundo trimestre de 2022, houve um aumento de 44% em termos anuais nos ataques DDoS na camada de aplicativos.
Empresas nos EUA foram as maiores vítimas, seguidas por outras no Chipre, em Hong Kong e na China. Os ataques à empresas do Chipre aumentaram 171% na comparação trimestral.
O setor de aviação e aeronáutica foi o mais visado no segundo trimestre, seguido por: internet, bancos, serviços financeiros, seguros, jogos e apostas.
Ataques DDoS na camada de rede
No segundo trimestre de 2022, houve um aumento de 75% em termos anuais nos ataques DDoS na camada de rede. Ataques de 100 Gbps e mais cresceram 19% em termos trimestrais; e ataques com mais de três horas aumentaram em 9% no mesmo período.
Os setores mais atacados foram: telecomunicações, jogos/apostas e tecnologia e serviços de informação.
Empresas nos EUA foram as maiores vítimas, seguidas por outras em Singapura, na Alemanha e na China.
Este relatório é baseado nos ataques DDoS detectados e mitigados automaticamente pelos sistemas de proteção contra DDoS da Cloudflare. Para saber mais sobre como isso funciona, confira este post no blog com mais detalhes.
Uma observação sobre como medimos os ataques DDoS observados em nossa Rede
Para analisar tendências de ataques, calculamos a taxa de “atividade DDoS”, que é o percentual do tráfego de ataque com relação ao tráfego total (ataque + limpo) observado em nossa Rede global, em um local específico ou em uma determinada categoria (por exemplo, setor ou país de faturamento). Medir os percentuais nos permite normalizar os pontos de dados e evitar uma abordagem tendenciosa em números absolutos, envolvendo, por exemplo, um data center da Cloudflare que recebe mais tráfego total e, provavelmente, mais ataques.
Ataques com pedido de resgate
Nossos sistemas estão constantemente analisando o tráfego e ao detectar ataques DDoS, automaticamente aplicam a mitigação. Cada cliente que sofre um ataque DDoS recebe uma pesquisa automatizada a fim de nos ajudar a entender melhor a natureza do ataque e o êxito da mitigação.
Há mais de dois anos a Cloudflare realiza pesquisas junto a clientes que foram atacados — uma das perguntas da pesquisa destina-se a saber se eles receberam ameaças ou pedidos de resgate exigindo pagamento em troca de parar o ataque DDoS.
O número de participantes que relatou ameaças ou pedidos de resgate no segundo trimestre aumentou 11% em termos trimestrais e anuais. Durante este trimestre, mitigamos ataques DDoS com pedido de resgate realizados por entidades que alegavam ser o grupo de ameaças avançadas permanentes (APT, na sigla em inglês) conhecido como “Fancy Lazarus”. A iniciativa se concentrou em instituições financeiras e empresas de criptomoedas.
O percentual de entrevistados que relatou ter sido alvo de um ataque DDoS com resgate ou ter recebido ameaças antes do ataque.
Analisando o segundo trimestre em mais detalhes, é possível ver que em junho um em cada cinco participantes relataram ataques DDoS com pedido de resgate ou ameaças — o mês com maior volume em 2022, o mais alto desde dezembro de 2021.
Ataques DDoS na camada de aplicativos
Ataques DDoS na camada de aplicativos, especificamente ataques DDoS por HTTP, são ataques que normalmente buscam interromper um servidor web tornando-o incapaz de processar solicitações legítimas dos usuários. Se um servidor é bombardeado com mais solicitações do que consegue processar, ele descartará solicitações legítimas e — em alguns casos — irá travar, resultando na deterioração da performance ou em uma interrupção para os usuários legítimos.
Ataques DDoS na camada de aplicativos por mês
No segundo trimestre, houve um aumento de 44% em termos anuais nos ataques DDoS na camada de aplicativos.
No T2 em geral, o volume de ataques DDoS na camada de aplicativos aumentou 44% na comparação anual, mas caiu 16% em termos trimestrais. Maio foi o mês mais movimentado no trimestre. Quase 47% de todos os ataques DDoS na camada de aplicativos ocorreu em maio, ao passo que o mês de junho foi o que teve o menor número de ataques (18%).
Ataques DDoS na camada de aplicativos por setor
Ataques ao setor de aviação e aeronáutica cresceram 256% em termos trimestrais
No segundo trimestre, o setor de aviação e aeronáutica foi o mais visado com ataques DDoS na camada de aplicativos. Depois, estão os setores de bancos, instituições financeiras e seguros (BFSI), e em terceiro lugar o setor de jogos/apostas.
Espaços cibernéticos da Ucrânia e da Rússia
Empresas de mídia e publicação são as mais visadas na Ucrânia.
Enquanto a guerra na Ucrânia continua em campo, no ar e na água, outra guerra é travada no espaço cibernético. Entidades que visam empresas ucranianas parecem estar tentando silenciar informações. Os seis setores mais atacados na Ucrânia estão todos em radiodifusão, internet, mídia on-line e publicação — quase 80% de todos os ataques DDoS ao país.
No outro lado da guerra, bancos, instituições financeiras e empresas de seguro (BFSI) da Rússia são os que sofreram mais ataques. Quase 50% de todos os ataques DDoS foram contra o setor de BFSI. O segundo setor mais visado é o de criptomoedas, seguido por mídia on-line.
Em ambos os lados da guerra, é possível ver que os ataques são altamente distribuídos, o que indica o uso de botnets distribuídas globalmente.
Ataques DDoS na camada de aplicativos por país de origem
No segundo trimestre, os ataques da China aumentaram 112, enquanto dos EUA diminuíram 43%.
Para entender a origem dos ataques HTTP, analisamos a geolocalização do endereço de IP de origem do cliente que gerou as solicitações HTTP de ataque. Ao contrário dos ataques na camada de rede, os IPs de origem não podem ser falsificados em ataques HTTP. Uma alta porcentagem de atividade DDoS em um determinado país não indica que os ataques estão vindo desse local, mas significa que há botnets funcionando dentro das fronteiras da nação em questão.
Pelo segundo trimestre consecutivo, os Estados Unidos estão no topo da lista como principal origem de ataques DDoS por HTTP. Logo depois estão China, Índia e Alemanha. Mesmo que os EUA tenham permanecido em primeiro lugar, os ataques com origem no país tiveram uma queda de 43% em termos trimestrais, ao passo que os originados em outras regiões aumentaram (China em 112%, Índia em 89% e Alemanha em 80%).
Ataques DDoS na camada de aplicativos por país-alvo
A fim de identificar quais países eram visados pela maioria dos ataques DDoS por HTTP, agrupamos os ataques DDoS pelos países de faturamento de nossos clientes e os representamos como porcentagem em relação ao total de ataques DDoS.
Ataques DDoS por HTTP em países baseados nos EUA aumentaram 45% na comparação trimestral, levando os EUA ao primeiro lugar como principal alvo de ataques DDoS na camada de aplicativos. Ataques a empresas chinesas diminuíram 79% em termos trimestrais, aindo do primeiro para o quarto lugar. Ataques no Chipre aumentaram 171%, o que tornou o país o segundo mais atacado no segundo trimestre, seguido por Hong Kong, China e Polônia.
Ataques DDoS na camada de rede
Enquanto os ataques na camada de aplicativo visam o aplicativo (Camada 7 do Modelo OSI) que executa o serviço que os usuários finais estão tentando acessar (HTTP/S em nosso caso), os ataques na camada de rede visam sobrecarregar a infraestrutura de rede (como roteadores e servidores internos) e a próprio link com da internet.
Ataques DDoS na camada de rede por mês
No segundo trimestre, houve um aumento de 75% em termos anuais nos ataques DDoS na camada de rede; e uma alta de 19% na comparação trimestral em ataques volumétricos de 100 Gbps e mais.
No segundo trimestre, o número total de ataques DDoS à camada de rede aumentou 75% em termos anuais, mas não mudou muito em comparação com o trimestre anterior. Abril foi o mês mais movimentado do trimestre, com quase 40% dos ataques.
Ataques DDoS na camada de rede por setor
No segundo trimestre, ataques a empresas de telecomunicações cresceram 45% em termos trimestrais.
Pelo segundo trimestre consecutivo, o setor de telecomunicações foi o mais visado por ataques DDoS na camada de rede. Além disso, os ataques a empresas de telecomunicações cresceram 45% em termos trimestrais. O setor de jogos ficou em segundo lugar, seguido por empresas de tecnologia e serviços de informação.
Ataques DDoS na camada de rede por país-alvo
Aumento de 70% em termos trimestrais nos ataques a redes dos EUA
No segundo trimestre, os EUA continuaram sendo o país mais atacado, seguido por Singapura, que saltou para o segundo lugar em relação ao quarto no trimestre anterior. Logo depois, em terceiro, está a Alemanha, seguida por China, Maldivas e Coreia do Sul.
Ataques DDoS na camada de rede por país de entrada
No segundo trimestre, quase um terço do tráfego observado pela Cloudflare na Palestina e no Azerbaijão foi parte de um ataque DDoS à camada de rede.
Ao tentar entender onde fica a origem de ataques DDoS na camada de rede, não podemos seguir o mesmo método usado para a análise de ataques na camada de aplicativos. Para que um ataque DDoS na camada de aplicativos aconteça, é preciso ocorrer handshakes bem-sucedidos entre o cliente e o servidor, a fim de estabelecer uma conexão HTTP/S. E para um handshake bem-sucedido acontecer, os ataques não podem falsificar o endereço de IP da origem. Embora o invasor possa usar botnets, proxies e outros métodos para ofuscar a identidade, o local do IP de origem do cliente, que faz o ataque, representa adequadamente a origem de ataques DDoS na camada de aplicativos.
Por outro lado, para lançar ataques DDoS na camada de rede, na maioria dos casos, não é necessário nenhum handshake. Os invasores podem falsificar o endereço de IP de origem para ofuscar a origem do ataque e introduzir aleatoriedade nas propriedades do ataque, o que pode dificultar que sistemas simples de proteção contra DDoS bloqueiem o ataque. Dessa forma, se formos tentar descobrir o país de origem com base em um endereço de IP falsificado, obteríamos um “país falsificado”.
Por esse motivo, ao analisar origens de ataques DDoS na camada de rede, dividimos o tráfego pelos locais de data centers da Cloudflare em que o tráfego foi ingerido, e não pelo IP de origem (possivelmente) falsificado, para entender melhor de onde os ataques vêm. Conseguimos ter precisão geográfica em nosso relatório porque temos data centers em mais de 270 cidades em todo o mundo. No entanto, até esse método não é 100% preciso, pois o tráfego pode passar por backhaul e ser direcionado por meio de diversos provedores de internet e países, por motivos que variam da redução de custos até à gestão de falhas e congestionamentos.
A Palestina saiu do segundo para o primeiro lugar como local da Cloudflare com maior percentual de ataques DDoS à camada de rede, seguida por Azerbaijão, Coreia do Sul e Angola.
Para visualizar todas as regiões e países, confira o mapa interativo.
Vetores de ataque
No segundo trimestre, houve um aumento dos ataques de DNS, e essa modalidade se tornou o segundo vetor de ataque mais frequente.
Vetor de ataque é o termo usado para descrever o método usado pelo invasor para lançar um ataque DDoS. Por exemplo, o protocolo IP, atributos de pacote, como sinalizadores TCP, método de inundação e outros critérios.
No segundo trimestre, 56% de todos os ataques na camada de rede foram inundações SYN, que ainda são o vetor de ataque mais popular e exploram a solicitação de conexão inicial do handshake TCP com estado. Durante essa solicitação de conexão inicial, os servidores não têm nenhum contexto sobre a conexão TCP, pois ela é nova; e sem a proteção adequada, pode ser difícil mitigar uma inundação de solicitações de conexão inicial. Assim fica mais fácil para o invasor consumir os recursos de um servidor desprotegido.
Após as inundações SYN, estão os ataques direcionados à infraestrutura DNS, inundações RST que exploram o fluxo de conexão TCP e ataques genéricos por UDP.
Ameaças emergentes
No segundo trimestre, as principais ameaças emergentes incluíram ataques por CHARGEN, Ubiquiti e Memcached.
Identificar os principais vetores de ataques ajuda as empresas a entender o cenário de ameaças. Por sua vez, isso as ajuda a melhorar a postura de segurança para se protegerem contra essas ameaças. Da mesma forma, aprender sobre novas ameaças emergentes, que ainda não representam uma parte significativa dos ataques, pode ajudar a mitigá-los antes que se tornem uma força expressiva.
No segundo trimestre, as principais ameaças emergentes foram ataques de amplificação que exploram o protocolo gerador de caracteres (CHARGEN), que desviam o tráfego de dispositivos Ubiquiti expostos e o conhecido ataque Memcached.
Abuso do protocolo CHARGEN para realizar ataques de amplificação
No segundo trimestre, ataques ao protocolo CHARGEN aumentaram 378% em termos trimestrais.
Definido inicialmente em RFC 864 (1983), o protocolo gerador de caracteres (CHARGEN) é um serviço da pilha de protocolos de internet que faz exatamente isso: gera caracteres de forma aleatória e não para de enviá-los ao cliente até ele encerrar a conexão. A intenção original era fazer teste e depuração. No entanto, é raramente usado, porque é muito fácil de explorar para gerar ataques de reflexão/amplificação.
Um invasor pode falsificar o IP de origem da vítima e enganar os servidores de apoio em todo o mundo para direcionar um fluxo de caracteres aleatórios “de volta” os servidores da vítima. Esse tipo de ataque é de reflexão/amplificação. Dependendo do número de fluxos CHARGEN simultâneos, se os servidores da vítima estiverem desprotegidos, serão inundados e não conseguirão processar o tráfego legítimo — resultando em um evento de negação de serviço.
Ataques de amplificação que exploram o protocolo de descoberta Ubiquiti
No segundo trimestre, ataques por Ubiquiti aumentaram 313% em termos trimestrais.
Ubiquiti é uma empresa americana que oferece dispositivos de Internet of Things (IoT) a consumidores e empresas. Os dispositivos da Ubiquiti podem ser descobertos em uma rede pelo protocolo de descoberta Ubiquiti na porta UDP/TCP 10001.
Semelhante ao vetor de ataque CHARGEN, os invasores podem falsificar o IP de origem para o endereço de IP da vítima e pulverizar os endereços de IP que estão com a porta 10001 aberta. Esses então responderiam à vítima e inundariam se o volume for suficiente.
Ataque DDoS ao Memcached
No segundo trimestre, ataques DDoS ao Memcached cresceram 281% em termos trimestrais.
Memcached é um sistema de caching de banco de dados para acelerar sites e redes. Semelhante ao CHARGEN e Ubiquiti, os servidores Memcached compatíveis com UDP podem ser aproveitados para iniciar ataques DDoS de amplificação/reflexão. Nesse caso, o invasor solicita conteúdo do sistema de caching e falsificam o endereço de IP da vítima como IP de origem nos pacotes UDP. A vítima será inundada com as respostas Memcache, que podem ser amplificadas por um fator de até 51.200x.
Ataques DDoS na camada de rede por taxa de ataque
Ataques volumétricos de mais de 100 Gbps aumentaram 19% em termos trimestrais. Ataques com mais de três horas cresceram 9%.
Existem diferentes maneiras de medir o tamanho de um ataque DDoS nas camadas 3 e 4. Uma é o volume de tráfego que ele fornece, medido como taxa de bits (especificamente, terabits por segundo ou gigabits por segundo). Outra é o número de pacotes que ele entrega, medido como taxa de pacotes (especificamente, milhões de pacotes por segundo).
Os ataques com altas taxas de bits tentam causar um evento de negação de serviço saturando a conexão com a internet, enquanto os ataques com altas taxas de pacotes tentam sobrecarregar os servidores, roteadores ou outros dispositivos de hardware em linha. Os dispositivos dedicam uma certa quantidade de memória e capacidade de computação para processar cada pacote. Portanto, ao bombardeá-los com muitos pacotes, os dispositivos podem ficar sem recursos de processamento. Nesse caso, os pacotes são “descartados,” ou seja, o dispositivo não consegue processá-los. Para os usuários, isso resulta em interrupções e em negação de serviço.
Distribuição por taxa de pacotes
A maioria dos ataques DDoS na camada de rede permanecem abaixo de 50 mil pacotes por segundo. Embora 50 kpps esteja no lado inferior do espectro na escala da Cloudflare, isto ainda pode derrubar facilmente ativos da internet desprotegidos e congestionar até mesmo uma conexão Ethernet Gigabit padrão.
Ao analisar as mudanças nos tamanhos dos ataques, vemos que houve uma queda em ataques com uso intenso de pacotes acima de 50 kpps no segundo trimestre, resultando em um aumento de 4% nos ataques menores.
Distribuição por taxa de bits
No segundo trimestre, a maioria dos ataques DDoS na camada de rede ficaram abaixo de 500 Mbps. Também é uma gota no oceano se pensarmos na escala da Cloudflare, mas que pode desconectar rapidamente ativos da internet desprotegidos com menos capacidade ou até congestionar uma conexão Ethernet Gigabit padrão.
É interessante ver que ataques grandes entre 500 Mbps e 100 Gbps diminuíram de 20% a 40% em termos trimestrais, mas ataques volumétricos acima de 100 Gbps cresceram 8%.
Ataques DDoS na camada de rede por duração
No segundo trimestre, ataques com mais de três horas aumentaram 9%.
Medimos a duração de um ataque registrando a diferença entre quando ele foi detectado pela primeira vez por nossos sistemas como um ataque e o último pacote que vimos com a assinatura desse ataque no alvo específico.
No segundo trimestre, 51% dos ataques DDoS à camada de rede duraram menos de 10 minutos, e 41% duraram de 10 a 20 minutos. Os 8% restantes incluem ataques que vão de 20 minutos até mais de 3 horas.
Vale lembrar que mesmo quando um ataque tem apenas alguns minutos, se ele for bem-sucedido, as consequências podem durar mais do que o próprio ataque. Os profissionais de TI que lidam com ataques bem-sucedidos podem passar horas e até dias restaurando serviços.
Embora a maioria dos ataques realmente sejam curtos, é possível ver um aumento de mais de 15% em ataques de 20 a 60 minutos, bem como um crescimento de 12% em ataques com mais de 3 horas.
Ataques curtos podem facilmente passar despercebidos, especialmente ataques burst que, em segundos, bombardeiam um alvo com um número significativo de pacotes, bytes ou solicitações. Nesse caso, os serviços de proteção contra DDoS, que contam com mitigação manual por meio de análise de segurança, não conseguem mitigar o ataque a tempo. Eles podem apenas aprender com esse ataque durante a análise pós-ataque e, em seguida, implantar uma nova regra que filtre o identificador do ataque, esperando capturá-lo na próxima vez. Da mesma forma, também é ineficiente usar um serviço “sob demanda”, em que a equipe de segurança redireciona o tráfego para um provedor de DDoS durante o ataque, uma vez que o ataque já terá terminado antes que o tráfego seja encaminhado para o provedor de DDoS sob demanda.
É recomendável que as empresas utilizem serviços de proteção contra DDoS automatizados sempre ativos, que analisem o tráfego e apliquem a identificação em tempo real com rapidez suficiente para bloquear ataques de curta duração.
Resumo
A missão da Cloudflare é ajudar a construir uma internet melhor, ou seja, mais segura, mais rápida e mais confiável para todos, até mesmo ao enfrentar ataques DDoS. Como parte de nossa missão, desde 2017 oferecemos proteção contra DDoS ilimitada e sem restrições, além de gratuita, para todos os nossos clientes. Ao longo dos anos, tornou-se cada vez mais fácil para os invasores lançar ataques DDoS. Para combater a vantagem do invasor, queremos garantir que também seja fácil e gratuito para organizações de todos os tamanhos se protegerem contra ataques DDoS de todos os tipos. Ainda não usa a Cloudflare? Comece agora com os planos Free e Pro para proteger sites ou fale conosco para ter uma proteção contra DDoS mais abrangente para toda a rede usando o Magic Transit.
Te damos la bienvenida a nuestro informe sobre los ataques DDoS del segundo trimestre de 2022, que incluye nuevos datos y tendencias sobre el panorama de las amenazas DDoS, según lo observado en la red global de Cloudflare. Puedes consultar la versión interactiva de este informe en Radar.
En el segundo trimestre, hemos observado algunos de los mayores ataques hasta la fecha, incluido un ataque DDoS HTTPS de 26 millones de solicitudes por segundo que Cloudflare detectó y mitigó automáticamente. Además, continúan los ataques contra Ucrania y Rusia, al tiempo que ha aparecido una nueva campaña de ataques DDoS de rescate.
Aspectos destacados
Internet en Ucrania y Rusia
La guerra en el terreno va acompañada de ataques dirigidos a la difusión de información.
Las empresas de medios de comunicación de Ucrania fueron el blanco más común de ataques DDoS en el segundo trimestre. De hecho, los seis sectores que recibieron el mayor número de ataques pertenecen a los medios de comunicación en línea/Internet, la edición y audiovisual.
En Rusia, por el contrario, los medios de comunicación en línea descendieron al tercer lugar como el sector más afectado. En los primeros puestos, las empresas de banca, servicios financieros y seguros (BFSI) de Rusia fueron las que recibieron más ataques en el segundo trimestre. Casi el 50 % de todos los ataques DDoS a la capa de aplicaciones tuvieron como objetivo el sector BFSI. Las empresas de criptomonedas en Rusia fueron el segundo sector peor parado.
Hemos observado una nueva oleada de ataques DDoS de rescate por parte de entidades que dicen ser Fancy Lazarus.
En junio de 2022, los ataques de rescate alcanzaron su punto más alto del año hasta la fecha. Uno de cada cinco encuestados que experimentaron un ataque DDoS declaró haber sido objeto de un ataque DDoS de rescate u otras amenazas.
En general, en el segundo trimestre, el porcentaje de ataques DDoS de rescate aumentó un 11 % en términos intertrimestrales.
Ataques DDoS a la capa de aplicación
En el segundo trimestre de 2022, los ataques DDoS a la capa de aplicación se incrementaron un 44 % respecto al mismo periodo del año pasado.
Las organizaciones de Estados Unidos fueron las más afectadas, seguidas de Chipre, Hong Kong y China. Los ataques a organizaciones en Chipre aumentaron un 171 % en comparación con el trimestre anterior.
El sector de la aviación y aeroespacial fue el más afectado en el segundo trimestre, seguido de Internet, la banca, los servicios financieros y los seguros, y los videojuegos/apuestas, que ocuparon el cuarto lugar.
Ataques DDoS a la capa de red
En el segundo trimestre de 2022, los ataques DDoS a la capa de red aumentaron un 75 % interanual. Los ataques de 100 GB/s o más se incrementaron un 19 % con respecto al trimestre anterior, y los ataques que duraron más de 3 horas se alzaron un 9 % en la misma comparación.
Los principales blancos de ataques fueron los sectores de las telecomunicaciones, videojuegos/apuestas y tecnologías de la información y servicios.
Las organizaciones de Estados Unidos fueron las que recibieron el mayor número de ataques, seguidas de Singapur, Alemania y China.
Este informe contempla los ataques DDoS que los sistemas de protección contra DDoS de Cloudflare detectaron y mitigaron de manera automática. Para obtener más información sobre su funcionamiento, consulta esta publicación detallada del blog.
Nota sobre cómo medimos los ataques DDoS observados en nuestra red
Para analizar las tendencias de los ataques, calculamos la tasa de la “actividad DDoS”, que es el porcentaje de tráfico de ataque sobre el tráfico total (ataque + legítimo) observado en nuestra red global, o en una ubicación específica o categoría determinada (por ejemplo, sector o país de facturación). Medir los porcentajes nos permite normalizar los datos y evitar los sesgos reflejados en las cifras absolutas hacia, por ejemplo, un centro de datos de Cloudflare que recibe más tráfico total y, probablemente, también más ataques.
Ataques de rescate
Nuestros sistemas analizan constantemente el tráfico y aplican soluciones de mitigación de forma automática cuando se detectan ataques DDoS. Cada cliente que es blanco de un ataque DDoS recibe una encuesta automatizada que nos ayuda a comprender mejor la naturaleza del ataque y el éxito de la mitigación.
Desde hace más de dos años, Cloudflare ha encuestado a clientes que han sido víctimas de ataques. Una de las preguntas de la encuesta es si han recibido una amenaza o una nota de rescate exigiendo un pago a cambio de detener el ataque DDoS.
El número de encuestados que informaron de amenazas o notas de rescate en el segundo trimestre aumentó un 11 % en términos intertrimestrales e interanuales. Durante este trimestre, hemos mitigado ataques DDoS de rescate lanzados por entidades que dicen ser el grupo de amenazas avanzadas persistentes “Fancy Lazarus”. La campaña se ha centrado en instituciones financieras y empresas de criptomonedas.
Porcentaje de encuestados que informaron haber sido blanco de un ataque DDoS de rescate o haber recibido amenazas antes del ataque.
Ya hacia finales del segundo trimestre, en junio, uno de cada cinco encuestados declaró haber recibido un ataque o amenaza DDoS de rescate, el pico mensual más alto del año y desde diciembre de 2021.
Ataques DDoS a la capa de aplicación
Los ataques DDoS a la capa de aplicación, en concreto los ataques DDoS HTTP, son ofensivas que suelen tener como objetivo interrumpir un servidor web evitando que pueda procesar las solicitudes legítimas de los usuarios. Si el servidor se satura con más solicitudes de las que puede procesar, el servidor descartará las solicitudes legítimas y, en algunos casos, se bloqueará, lo que degradará el rendimiento o interrumpirá los servicios para los usuarios legítimos.
Ataques DDoS a la capa de aplicación por mes
En el segundo trimestre, los ataques DDoS a la capa de aplicación aumentaron un 44 % interanual.
En general, en el segundo trimestre, el volumen de ataques DDoS a la capa de aplicación aumentó un 44 % interanual, pero disminuyó un 16 % intertrimestral. Mayo fue el mes más activo del trimestre. Casi el 47 % de todos los ataques DDoS a la capa de aplicación tuvieron lugar en mayo, mientras que el menor número de ataques se produjo en junio (18 %).
Ataques DDoS a la capa de aplicación por industria
Los ataques al sector aeronáutico y aeroespacial aumentaron un 256 % con respecto al trimestre anterior.
En el segundo trimestre, el sector de la aviación y el aeroespacial fue el más afectado por los ataques DDoS a la capa de aplicación. En segundo lugar, se situó el sector BFSI, y en tercer lugar el sector de los videojuegos/apuestas.
El ciberespacio en Ucrania y Rusia
Las empresas de medios de comunicación y editoriales son los principales blancos de ataques en Ucrania.
Mientras la guerra en Ucrania continúa por tierra, mar y aire, también lo hace en el ciberespacio. Las entidades que atacan a empresas ucranianas parecen estar intentando silenciar la información. Los seis principales blancos de ataque en Ucrania pertenecen a los sectores audiovisuales, Internet, medios de comunicación en línea y editorial, lo que supone casi el 80 % de todos los ataques DDoS contra Ucrania.
Del otro lado del conflicto, las empresas rusas de banca, instituciones financieras y seguros fueron las más afectadas. Casi el 50 % de todos los ataques DDoS tuvieron como objetivo el sector BFSI. El segundo sector peor parado fue el de las criptomonedas, seguido de los medios de comunicación en línea.
En ambos lados de la guerra, podemos ver que los ataques están muy distribuidos, lo que indica el uso de botnets distribuidas globalmente.
Ataques DDoS a la capa de aplicación por país de origen
En el segundo trimestre, los ataques procedentes de China aumentaron un 112 %, mientras que los ataques procedentes de Estados Unidos se redujeron un 43 %.
Para entender el origen de los ataques HTTP, observamos la geolocalización de la dirección IP de origen perteneciente al cliente que generó las solicitudes HTTP de ataque. A diferencia de los ataques a la capa de red, las direcciones IP de origen no se pueden suplantar en los ataques HTTP. Un alto porcentaje de actividad DDoS en un país determinado no significa que ese país específico esté lanzando los ataques, sino que indica la presencia de botnets que operan dentro de su propio país.
Por segundo trimestre consecutivo, Estados Unidos encabeza las listas como principal origen de ataques DDoS HTTP. Tras Estados Unidos se encuentra China en segundo lugar, e India y Alemania en el tercer y cuarta posición. Aunque Estados Unidos se mantuvo en el primer puesto, los ataques originados en este país se redujeron un 43 % con respecto al trimestre anterior, si bien los ataques procedentes de otras regiones crecieron. Los ataques de China se alzaron un 112 %, los de India un 89 % y los de Alemania un 50 %.
Ataques DDoS a la capa de aplicación por país de destino
Para identificar qué países son el objetivo de la mayoría de los ataques DDoS HTTP, agrupamos los ataques DDoS por el país de facturación de nuestros clientes y lo representamos como un porcentaje de todos los ataques DDoS.
Los ataques DDoS HTTP a empresas estadounidenses aumentaron un 45 % en términos intertrimestrales, lo que volvió a situar a EE. UU. en el primer lugar como principal objetivo de ataques DDoS a la capa de aplicación. Los ataques a empresas chinas cayeron un 79 % en términos intertrimestrales, pasando así del primer al cuarto puesto. Los ataques a Chipre aumentaron un 171 %, convirtiéndose en el segundo país más atacado en el segundo trimestre. Tras Chipre se encuentran Hong Kong, China y Polonia.
Ataques DDoS a la capa de red
Si bien los ataques a la capa de aplicación (capa 7 del modelo OSI) se dirigen contra la aplicación que ejecuta el servicio al que los usuarios finales intentan acceder (HTTP/S en nuestro caso), los ataques a la capa de red pretenden saturar la infraestructura de la red (como enrutadores y servidores en línea) y la propia conexión de Internet.
Ataques DDoS a la capa de red por mes
En el segundo trimestre, los ataques DDoS a la capa de red se incrementaron un 75 % interanual, y los ataques volumétricos de 100 GB/s o más lo hicieron un 19 % en la misma comparación.
En el segundo trimestre, la cantidad total de ataques DDoS a la capa de red aumentó un 75 % respecto al mismo periodo del año pasado, pero apenas varió en comparación con el trimestre anterior. Abril fue el mes más activo del trimestre, ya que concentró casi el 40 % de los ataques.
Ataques DDoS en la capa de red por sector
En el segundo trimestre, los ataques a empresas de telecomunicaciones aumentaron un 45 % en términos intertrimestrales.
Por segundo trimestre consecutivo, el sector de las telecomunicaciones fue el principal blanco de ataques DDoS a la capa de red. Más aún, los ataques a empresas de telecomunicaciones crecieron un 45 % en comparación con el trimestre anterior. El sector de los videojuegos ocupó el segundo lugar, seguido de las empresas de tecnologías de la información y servicios.
Ataques DDoS en la capa de red por país de destino
Los ataques a las redes estadounidenses crecieron un 70 % en términos intertrimestrales.
En el segundo trimestre, Estados Unidos siguió siendo el país más afectado. Después de EE. UU. se situó Singapur, que escaló del cuarto lugar del trimestre anterior al segundo lugar. En tercer lugar estaba Alemania, y después China, Maldivas y Corea del Sur.
Ataques DDoS a la capa de red por país de ingreso
En el segundo trimestre, casi un tercio del tráfico que Cloudflare observó en Palestina y Azerbaiyán formaba parte de un ataque DDoS a la capa de red.
Para entender dónde se originan los ataques DDoS a la capa de red, no podemos utilizar el mismo método que usamos para el análisis de los ataques a la capa de aplicación. Para lanzar un ataque DDoS contra la capa de aplicación, se debe lograr un protocolo de enlace entre el cliente y el servidor para establecer una conexión HTTP/S. Para que esto ocurra, los ataques no pueden suplantar su dirección IP de origen. Si bien el atacante puede utilizar botnets, proxies y otros métodos para ofuscar su identidad, la ubicación de la dirección IP de origen del cliente atacante representa suficientemente la procedencia de los ataques DDoS a la capa de aplicación.
Por otro lado, para lanzar ataques DDoS a la capa de red, en la mayoría de los casos, no se necesita un protocolo de enlace. Los atacantes pueden suplantar la dirección IP de origen para ofuscar el origen del ataque y desconcertar por el carácter aleatorio de sus propiedades, lo que puede impedir que sistemas sencillos de protección DDoS bloqueen el ataque. Por lo tanto, si tuviéramos que obtener el país de origen basándonos en una dirección IP de origen suplantada, obtendríamos un “país falso”.
Por esta razón, al analizar la procedencia de los ataques DDoS a la capa de red, agrupamos el tráfico por las ubicaciones de los centros de datos de Cloudflare en los que se recibió el tráfico, y no por la dirección IP de origen (potencialmente) suplantada, para comprender la procedencia de los ataques. Podemos conseguir precisión geográfica en nuestro informe porque tenemos centros de datos en más de 270 ciudades de todo el mundo. Sin embargo, incluso este método no es 100 % exacto, ya que el tráfico se puede redireccionar y enrutar a través de varios proveedores de servicios de Internet y países por distintas razones, desde la reducción de costes hasta la gestión de la congestión y los fallos.
Palestina pasó del segundo al primer puesto como ubicación de Cloudflare con el mayor porcentaje de ataques DDoS a la capa de red. Tras Palestina están Azerbaiyán, Corea del Sur y Angola.
Para ver todas las regiones y países, consulta el mapa interactivo.
Vectores de ataque
En el segundo trimestre, los ataques de DNS aumentaron, convirtiéndose en el segundo vector de ataque más frecuente.
Un vector de ataque es un término utilizado para describir el método que el atacante utiliza para lanzar su ataque DDoS, es decir, el protocolo IP, los atributos del paquete, tales como las marcas TCP, el método de inundación y otros criterios.
En el segundo trimestre, el 56 % de todos los ataques a la capa de red fueron inundaciones SYN. Las inundaciones SYN siguen siendo el vector de ataque más popular. Abusan de la solicitud de conexión inicial del protocolo de enlace TCP con estado. Durante esta solicitud de conexión inicial, los servidores no tienen ningún contexto sobre la conexión TCP, ya que es nueva, y sin la protección adecuada pueden tener dificultades para mitigar una avalancha de solicitudes de conexión inicial. Esto facilita que el atacante consuma los recursos de un servidor sin protección.
Después de las inundaciones SYN están los ataques contra la infraestructura DNS, las inundaciones RST que vuelven a abusar del flujo de conexiones TCP y los ataques genéricos sobre UDP.
Amenazas emergentes
En el segundo trimestre, las principales amenazas emergentes fueron los ataques sobre CHARGEN, Ubiquiti y Memcached.
Identificar los principales vectores de ataque ayuda a las organizaciones a comprender el panorama de las amenazas. A su vez, puede ayudarles a mejorar su postura de seguridad para protegerse contra esas amenazas. Del mismo modo, conocer las nuevas amenazas emergentes que aún no representan una parte significativa de los ataques, puede ayudar a mitigarlas antes de que ejerzan una presión importante.
En el segundo trimestre, las principales amenazas emergentes fueron los ataques de amplificación que abusan del protocolo generador de caracteres (CHARGEN), los ataques de amplificación que reflejan el tráfico de los dispositivos Ubiquiti expuestos y el famoso ataque a Memcached.
Abuso del protocolo CHARGEN para lanzar ataques de amplificación
En el segundo trimestre, los ataques que abusan del protocolo CHARGEN aumentaron en un 378 % respecto al trimestre anterior.
Definido inicialmente en el RFC 864 (1983), el protocolo generador de caracteres (CHARGEN) es un servicio de la familia de protocolos de Internet que hace exactamente lo que dice que hace, generar caracteres de forma arbitraria y no dejar de enviarlos al cliente hasta que este cierra la conexión. Su intención original era la de realizar pruebas y depuración. Sin embargo, rara vez se utiliza porque se puede explotar con facilidad para generar ataques de amplificación/reflexión.
Un atacante puede suplantar la dirección IP de origen de su víctima y engañar a los servidores de apoyo de todo el mundo para dirigir un flujo de caracteres arbitrarios “de vuelta” a los servidores de la víctima. Este tipo de ataque es la amplificación/reflexión. Con un número suficiente de flujos simultáneos de CHARGEN, los servidores de la víctima, si no están protegidos, se verán inundados e incapaces de hacer frente al tráfico legítimo, lo que provocará una denegación de servicio.
Ataques de amplificación que explotan el protocolo de descubrimiento de Ubiquiti
En el segundo trimestre, los ataques a Ubiquity aumentaron un 313 % en términos intertrimestrales.
Ubiquiti es una empresa con sede en Estados Unidos que ofrece dispositivos de red e Internet de las cosas (IoT) para consumidores y empresas. Los dispositivos de Ubiquiti se pueden descubrir en una red mediante el protocolo de descubrimiento de Ubiquiti a través del puerto UDP/TCP 10001.
De manera similar al vector de ataque CHARGEN, aquí también los atacantes pueden suplantar la dirección IP de origen para que sea la dirección IP de la víctima y difundir las direcciones IP que tienen el puerto 10001 abierto. Estas responderían a la víctima y la inundarían esencialmente si el volumen es suficiente.
Ataques DDoS dirigido a Memcached
En el segundo trimestre, los ataques DDoS a Memcached aumentaron un 281 % con respecto al trimestre anterior.
Memcached es un sistema de almacenamiento en caché de bases de datos para acelerar los sitios web y las redes. Al igual que CHARGEN y Ubiquiti, los servidores de Memcached que admiten UDP pueden ser objeto de abuso para lanzar ataques DDoS de amplificación/reflexión. En este caso, el atacante solicitaría contenido al sistema de caché y suplantaría la dirección IP de la víctima como dirección IP de origen en los paquetes UDP. La víctima se inundará con respuestas de Memcache que se pueden amplificar por un factor de hasta 51 200 veces.
Ataques DDoS a la capa de red por velocidad de ataque
Los ataques volumétricos de más de 100 GB/s aumentan un 19 % respecto al trimestre anterior. Los ataques de más de 3 horas aumentaron un 9 %.
Hay diferentes formas de medir el tamaño de un ataque DDoS a las capas 3 y 4. Una es el volumen de tráfico que entrega, medido como la velocidad de bits (en concreto, terabits por segundo o gigabits por segundo). Otro es el número de paquetes que entrega, medido como la velocidad de paquetes (en concreto, millones de paquetes por segundo).
Los ataques con una velocidad de bits elevada intentan provocar un evento de denegación de servicio bloqueando la conexión de Internet, mientras que los ataques con alta velocidad de paquetes tratan de saturar los servidores, enrutadores u otros dispositivos de hardware en línea. Estos dispositivos dedican una cierta cantidad de memoria y capacidad de procesamiento para procesar cada paquete. Por lo tanto, si se satura con muchos paquetes, el dispositivo se puede quedar sin recursos de procesamiento. En este caso, los paquetes se “descartan”, es decir, el dispositivo no puede procesarlos. Para los usuarios, esto se traduce en interrupciones y denegación del servicio.
Distribución por velocidad de paquete
La mayoría de los ataques DDoS a la capa de red siguen siendo inferiores a 50 000 paquetes por segundo. Si bien 50 000 paquetes está en el extremo inferior del Spectrum de Cloudflare, esta velocidad puede interrumpir fácilmente propiedades de Internet que no estén protegidas y sobrecargar incluso una conexión Gigabit Ethernet estándar.
Si observamos los cambios en el tamaño de los ataques, podemos ver que los ataques de un volumen importante de paquetes, de más de 50 000 paquetes por segundo, disminuyeron en el segundo trimestre, lo que supuso un aumento del 4 % en los ataques pequeños.
Distribución por velocidad de bits
En el segundo trimestre, la mayoría de los ataques DDoS a la capa de red se mantuvieron por debajo de los 500 MB/s, una velocidad mínima en la escala de Cloudflare, aunque pueden interrumpir con mucha rapidez propiedades de Internet que carezcan de protección o tengan menos capacidad o, incluso bloquear una conexión Gigabit Ethernet estándar.
Curiosamente, los ataques grandes de entre 500 MB/s y 100 GB/s disminuyeron un 20-40 % en términos intertrimestrales, pero los ataques volumétricos por encima de 100 GB/s aumentaron un 8 %.
Ataques DDoS a la capa de red por duración
En el segundo trimestre, los ataques de más de 3 horas se incrementaron un 9 %.
Medimos la duración de un ataque registrando la diferencia entre el momento en que nuestros sistemas lo detectan como ataque por primera vez, y el último paquete que vemos con esa firma de ataque hacia ese objetivo específico.
En el segundo trimestre, el 51 % de los ataques DDoS a la capa de red duraron menos de 10 minutos. Otro 41 % duró entre 10-20 minutos. El 8 % restante incluye ataques que van desde los 20 minutos a más de 3 horas.
Una cosa importante a tener en cuenta es que aunque un ataque dure solo unos minutos, si logra su objetivo, las repercusiones podrían ser más graves que la duración inicial del ataque. Los equipos informáticos que responden a un ataque que ha logrado su objetivo pueden pasar horas e incluso días restableciendo sus servicios.
Aunque la mayoría de los ataques son efectivamente breves, se observa un aumento de más del 15 % en los ataques que oscilan entre 20-60 minutos, y un aumento del 12 % de los ataques con una duración de más de 3 horas.
Los ataques breves pueden pasar fácilmente desapercibidos, sobre todo, los ataques en ráfaga que, en cuestión de segundos, atacan un objetivo con un número significativo de paquetes, bytes o solicitudes. En este caso, los servicios de protección DDoS que dependen de la mitigación manual mediante análisis de seguridad no tienen ninguna posibilidad de mitigar el ataque a tiempo. Solo pueden analizarlo después del ataque, implementar una nueva regla que filtre la huella digital del ataque y esperar a identificarlo la próxima vez. Del mismo modo, el uso de un servicio “a petición”, en el que el equipo responsable de la seguridad redirige el tráfico a un proveedor de DDoS durante el ataque, también es ineficiente porque el ataque ya habrá terminado antes de que el tráfico se dirija al proveedor de soluciones DDoS a la carta.
Se recomienda que las empresas utilicen servicios de protección DDoS automatizados y siempre activos que analicen el tráfico y apliquen una huella digital en tiempo real lo suficientemente rápido como para bloquear ataques de corta duración.
Resumen
La misión de Cloudflare es ayudar a mejorar Internet. Una red más eficiente es aquella que es más segura, rápida y fiable para todos, incluso frente a los ataques DDoS. Como parte de nuestra misión, desde 2017, hemos estado ofreciendo protección DDoS ilimitada y de uso no medido de forma gratuita a todos nuestros clientes. A lo largo de los años, a los atacantes les resulta cada vez más fácil lanzar ataques DDoS. Sin embargo, por muy fácil que se haya vuelto, queremos asegurarnos de que sea aún más sencillo y gratuito para todo tipo de organizaciones protegerse de ataques DDoS de cualquier naturaleza. ¿Todavía no utilizas Cloudflare? Empieza hoy mismo con nuestros planes gratuito y Pro para proteger tus sitios web, o ponte en contacto con nosotros para beneficiarte de una protección DDoS integral para toda tu red utilizando Magic Transit.
Willkommen zu unserem DDoS-Bericht für das zweite Quartal 2022. Darin beschreiben wir Trends hinsichtlich der DDoS-Bedrohungslandschaft, die sich im globalen Cloudflare-Netzwerk beobachten ließen, und die von uns daraus gezogenen Schlüsse. Eine interaktive Version dieses Berichts ist auch bei Radar verfügbar.
Im zweiten Quartal haben wir einige der größten Angriffen aller Zeiten registriert, darunter eine HTTPS-DDoS-Attacke mit 26 Millionen Anfragen pro Sekunde, die von Cloudflare automatisch erkannt und abgewehrt wurde. Neben fortgesetzten Angriffen auf die Ukraine und Russland hat sich zudem eine neue Ransom-DDoS-Angriffskampagne entwickelt.
Die wichtigsten Erkenntnisse auf einen Blick
Das Internet in Russland und der Ukraine
Der Krieg wird nicht nur physisch, sondern auch in der digitalen Welt ausgefochten. Dort zielen die Angriffe darauf ab, die Verbreitung von Informationen zu verhindern.
In der Ukraine waren im zweiten Quartal Rundfunk- und Medienunternehmen das häufigste Ziel von DDoS-Angriffen. Tatsächlich sind die sechs am stärkten betroffenen Branchen alle den Bereichen Online-/Internetmedien, Verlagswesen und Rundfunk zuzurechnen.
Demgegenüber sind in Russland die Online-Medien unter den Angriffszielen auf den dritten Platz zurückgefallen. Spitzenreiter war das Segment Banken, Finanzdienstleistungen und Versicherungen (Banking, Financial Services and Insurance – BFSI). Fast 50 % aller DDoS-Angriffe auf Anwendungsschicht richteten sich gegen diese Sparte. Am zweithäufigsten wurden in Russland Unternehmen im Bereich Kryptowährungen attackiert.
Es war eine neue Welle von Ransom DDoS-Angriffen durch Akteure zu verzeichnen, die nach eigenen Angaben der „Fancy Lazarus“-Gruppe angehören.
Im Juni 2022 erreichten die Ransom-Angriffe den bisherigen Höchststand des Jahres: Jeder fünfte unter den Befragten, der eine DDoS-Attacke erlebt hat, gab an, einem Ransom-DDoS-Angriff oder ähnlich gearteten Bedrohungen ausgesetzt gewesen zu sein.
Insgesamt stieg der Anteil der Ransomware-DDoS-Angriffe vom ersten auf das zweite Quartal um 11 %.
DDoS-Angriffe auf Anwendungsschicht
Im Jahresvergleich erhöhten sich die DDoS-Angriffe auf Anwendungsschicht zwischen April und Juni 2022 um 44 %.
Am häufigsten waren Unternehmen in den USA betroffen, gefolgt von Zypern, Hongkong und China. Die Attacken auf zypriotische Firmen nahmen gegenüber dem entsprechenden Vorjahreszeitraum um 171 % zu.
Im Branchenvergleich stand die Luft- und Raumfahrtindustrie im zweiten Quartal am stärksten im Fokus – gefolgt von der Internetbranche, dem BFSI-Sektor und dem Glücksspielsegment.
DDoS-Angriffe auf Netzwerkschicht
Die DDoS-Angriffe auf Netzwerkschicht stiegen im zweiten Quartal 2022 gemessen am Vorjahr um 75 % an. Verglichen mit den vorangegangenen drei Monaten legten Attacken mit 100 Gbit/s und mehr um 19 % und Angriffe mit einer Dauer von über drei Stunden um 9 % zu.
Am stärksten unter Beschuss standen die Telekommunikations-, Glücksspiel-, Informationstechnologie- und Dienstleistungsbranche.
Unternehmen in den USA waren am häufigsten betroffen, gefolgt von Firmen in Singapur, Deutschland und China.
Dieser Bericht beruht auf DDoS-Angriffen, die von den Schutzsystemen von Cloudflare automatisch erkannt und abgewehrt wurden. Wie dabei genau vorgegangen wurde, erfahren Sie in diesem ausführlichen Blog-Beitrag.
Wie wir DDoS-Angriffe messen, die in unserem Netzwerk registriert werden
Um Angriffstrends zu analysieren, berechnen wir die „DDoS-Aktivitätsrate“, die dem prozentualen Anteil des Angriffs-Traffics am gesamten Datenverkehr (Angriffs-Traffic + regulärer Traffic) in unserem globalen Netzwerk oder an einem konkreten Standort oder in einer bestimmten Kategorie entspricht. Wir messen die Prozentsätze, um eine statistische Normalisierung der Datensätze vorzunehmen und Verzerrungen zu vermeiden, die in den absoluten Zahlen auftreten, z. B. durch ein Cloudflare-Rechenzentrum, das insgesamt mehr Traffic und daher wahrscheinlich auch mehr Angriffe verzeichnet.
Ransom-Angriffe
Unsere Systeme analysieren ständig den Datenverkehr und wenden automatisch Schutzmaßnahmen an, wenn DDoS-Angriffe entdeckt werden. Jeder Kunde, der eine solche Attacke erlebt hat, wird zur Teilnahme an einer automatischen Umfrage aufgefordert. Diese hilft uns dabei, die Art des Angriffs und den Erfolg der Abwehrmaßnahmen besser einzuschätzen.
Seit über zwei Jahren befragt Cloudflare angegriffene Kunden danach, ob ihnen mit einem DDoS-Angriff gedroht wurde oder ihnen in Aussicht gestellt wurde, dass sie einen solchen durch Zahlung eines Lösegelds abwenden bzw. beenden können.
Die Anzahl der Befragten, die im Berichtszeitraum entsprechende Drohungen oder Lösegeldforderungen meldeten, steigerte sich um jeweils 11 % im Quartals- und Jahresvergleich. Im zweiten Jahresviertel haben wir Ransomware-DDoS-Angriffe von Akteuren abgewehrt, die behaupten, der APT (Advanced Persistent Threat)-Gruppe „Fancy Lazarus“ anzugehören. Die jüngste Kampagne konzentriert sich auf Finanzinstitute und Unternehmen im Bereich Kryptowährungen.
Der Anteil der Befragten, die nach eigenen Angaben von einem Ransom-DDoS-Angriff betroffen waren oder vor einem solchen Angriff Drohungen erhalten haben.
Im Juni gab unter den Befragten jeder fünfte an, einen Ransom-DDoS-Angriff erlebt oder eine entsprechende Drohung erhalten zu haben. Dies ist der höchste Wert seit Dezember 2021.
DDoS-Angriffe auf Anwendungsschicht
DDoS-Angriffe auf Anwendungsschicht – genauer gesagt HTTP-DDoS-Attacken – sind normalerweise Versuche, einen Webserver zu stören, sodass er keine legitimen Nutzer-Anfragen mehr verarbeiten kann: Wenn ein Server eine Flut von Anfragen erhält und nicht alle bearbeiten kann, verwirft er legitime Anfragen und stürzt in manchen Fällen sogar ab. Für die Nutzer hat das eine schlechtere Performance oder einen Ausfall zur Folge.
DDoS-Angriffe auf Anwendungsschicht aufgeschlüsselt nach Monat
Das Volumen der DDoS-Angriffe auf Anwendungsschicht hat sich im zweiten Quartal gemessen am Vorjahreszeitraum um 44 % erhöht.
Verglichen mit den vorangegangenen drei Monaten ergab sich dagegen ein Rückgang um 16 %. Die höchste Angriffsaktivität des zweiten Quartals wurde im Mai registriert, denn in diesem Monat fanden fast 47 % aller DDoS-Attacken auf Anwendungsschicht statt, während die wenigsten Angriffe im Juni erfolgten (18 %).
DDoS-Angriffe auf Anwendungsschicht aufgeschlüsselt nach Branche
Die Angriffe auf die Luft- und Raumfahrtindustrie sind gegenüber dem Vorquartal um 256 % gestiegen.
Die Branche war im Berichtszeitraum Spitzenreiter bei DDoS-Angriffen auf Anwendungsschicht. Dahinter folgten das Segment BFSI und an dritter Stelle die Glücksspielindustrie.
Der Cyberspace in Russland und der Ukraine
In der Ukraine stehen Medien- und Verlagsunternehmen am stärksten im Fadenkreuz.
Der Krieg tobt dort nicht nur am Boden, in der Luft und auf dem Wasser, sondern auch im Cyberspace. Akteure, die es auf ukrainische Firmen abgesehen haben, scheinen zu versuchen, Informationen zu unterdrücken. Die sechs am häufigsten angegriffenen ukrainischen Branchen stehen alle mit Rundfunk, Internet, Online-Medien und dem Verlagswesen in Verbindung. Auf diese Bereiche entfallen fast 80 % aller DDoS-Attacken in der Ukraine.
Was die andere Kriegspartei betrifft, stand in Russland der Bereich BFSI am stärksten unter digitalem Beschuss, denn fast 50 % aller DDoS-Angriffe richteten sich gegen diesen Sektor. Das zweithäufigste Angriffsziel war das Segment Kryptowährungen, gefolgt von Online-Medien.
Auf beiden Seiten ist zu beobachten, dass die Angriffe in hohem Maße dezentral sind, was auf den Einsatz global verteilter Botnetze hindeutet.
DDoS-Angriffe auf Anwendungsschicht aufgeschlüsselt nach Ursprungsland
Die Attacken aus China sind im Zeitraum April bis Juni 2022 um 112 % gestiegen, während von den Vereinigten Staaten ausgehende Angriffe um 43 % abgenommen haben.
Um die Herkunft der HTTP-Attacken zu ermitteln, nutzen wir die Geolokalisierungsdaten der Ursprungs-IP-Adresse des Clients, von dem die für den Angriff eingesetzten HTTP-Anfragen versandt wurden. Anders als bei Angriffen auf Netzwerkschicht können Ursprungs-IP-Adressen bei HTTP-Angriffen nicht gefälscht werden. Entfällt ein hoher Anteil der DDoS-Aktivität auf ein bestimmtes Land, heißt das nicht zwangsläufig, dass die Angriffe tatsächlich alle von diesem Land ausgehen. Vielmehr deutet dies auf den Einsatz von Botnetzen hin, die aus diesem Staat heraus agieren bzw. dort betrieben werden.
Die USA waren das zweite Quartal in Folge die größte Quelle von HTTP-DDoS-Angriffen. Es folgen China auf Rang zwei sowie Indien und Deutschland auf dem dritten und vierten Platz. Obwohl die Vereinigten Staaten weiterhin das Ranking anführen, gingen die US-amerikanischen Angriffe im Quartalsvergleich um 43 % zurück. Ein Zuwachs wurde dagegen bei den Attacken aus China (+112 %), Indien (+89 %) und Deutschland (+50 %) verbucht.
DDoS-Angriffe auf Anwendungsschicht aufgeschlüsselt nach Zielland
Um herauszufinden, auf welche Länder die meisten HTTP-DDoS-Angriffe abzielen, haben wir die Attacken nach den Ländern der Rechnungsadressen unserer Kunden aufgeschlüsselt und ihren prozentualen Anteil an allen DDoS-Angriffen dargestellt.
HTTP-DDoS-Angriffe auf Unternehmen mit Sitz in den USA nahmen im Quartalsvergleich um 45 % zu und brachten die Vereinigten Staaten wieder auf den ersten Platz als Hauptziel von DDoS-Angriffen auf Anwendungsschicht. Die Attacken auf chinesische Firmen sind im Quartalsvergleich um 79 % gesunken, sodass die Volksrepublik vom ersten auf den vierten Platz zurückgefallen ist. Die Angriffe auf Zypern haben sich hingegen um 171 % erhöht, was dem Land im zweiten Quartal Rang zwei bescherte. Es folgen Hongkong, China und Polen.
DDoS-Angriffe auf Netzwerkschicht
Bei Angriffen auf Anwendungsschicht (Layer 7 im OSI-Modell) sind die Dienste betroffen, auf die Endnutzer zugreifen wollen (in unserem Fall HTTP/S). Demgegenüber zielen Attacken auf Netzwerkschicht auf eine Überlastung der Netzwerkinfrastruktur (wie Router und Server innerhalb des Netzwerkpfads) und der Internetverbindung selbst ab.
DDoS-Angriffe auf Netzwerkschicht aufgeschlüsselt nach Monat
Im zweiten Quartal nahmen DDoS-Angriffe auf Netzwerkschicht um 75 % im Jahresvergleich zu. Volumetrische Angriffe von 100 Gbit/s und mehr stiegen gemessen am ersten Jahresviertel 2022 um 19 %.
Die Gesamtzahl der DDoS-Angriffe auf Netzwerkschicht erhöhte sich gegenüber dem Vorjahr um 75 %, änderte sich aber im Vergleich zum Vorquartal nicht wesentlich. Der April war der ereignisreichste Monat des Quartals, denn in diesem Zeitraum fanden fast 40 % der Angriffe statt.
DDoS-Angriffe auf Netzwerkschicht aufgeschlüsselt nach Branche
Im zweiten Jahresviertel 2022 wurden 45 % mehr Angriffe auf Telekommunikationsunternehmen verzeichnet als im ersten.
Zum zweiten Mal in Folge war die Telekommunikationsbranche das beliebteste Ziel von DDoS-Angriffen auf Netzwerkschicht. Mehr noch: Die Angriffe auf Telekommunikationsunternehmen stiegen um 45 % im Vergleich zum Vorquartal. Die Glücksspielindustrie belegte den zweiten Platz, gefolgt von Firmen aus dem Bereich Informationstechnologie und Dienstleistungen.
DDoS-Angriffe auf Netzwerkschicht aufgeschlüsselt nach Zielland
Die Angriffe auf US-Netzwerke stiegen im Quartalsvergleich um 70 %.
Im Zeitraum April bis Juni blieben die Vereinigten Staaten das am meisten angegriffene Land. Darauf folgte Singapur, denn der Stadtstaat kletterte vom vierten Platz im vorherigen Quartal auf den zweiten. An dritter Stelle lag Deutschland, gefolgt von China, den Malediven und Südkorea.
DDoS-Angriffe auf der Netzwerkschicht aufgeschlüsselt nach Land, aus dem der Traffic eingeht
Im Berichtszeitraum war fast ein Drittel des von Cloudflare in Palästina und Aserbaidschan beobachteten Datenverkehrs Teil eines DDoS-Angriffs auf Netzwerkschicht.
Wenn wir versuchen zu verstehen, wo DDoS-Angriffe auf Netzwerkschicht ihren Ursprung haben, können wir nicht dieselbe Methode anwenden wie bei der Analyse von Angriffen auf Anwendungsschicht. Um einen DDoS-Angriff auf Anwendungsschicht zu starten, müssen zur Herstellung einer HTTP/S-Verbindung erfolgreiche Handshakes zwischen dem Client und dem Server stattfinden. Dies ist nur möglich, wenn die Angreifer ihre Ursprungs-IP-Adresse nicht fälschen. Der Angreifer kann seine Identität zwar unter anderem mit Botnets und Proxys verschleiern, aber die Ursprungs-IP-Adresse des angreifenden Clients bildet die Angriffsquelle von DDoS-Angriffen auf Anwendungsschicht in ausreichendem Maße ab.
Andererseits ist für DDoS-Angriffe auf Netzwerkschicht in den meisten Fällen kein Handshake erforderlich. Angreifer können die Usprungs-IP-Adresse fälschen, um die Herkunft des Angriffs zu verschleiern und Zufälligkeit in die Angriffseigenschaften zu bringen. Dies kann es für einfache DDoS-Schutzsysteme schwieriger machen, die Attacke zu blockieren. Würden wir also das Herkunftsland aus einer gefälschten Ursprungs-IP ableiten, kämen wir zu einem falschen Ergebnis.
Aus diesem Grund haben wir bei der Analyse der Quellen von DDoS-Angriffen auf Netzwerkschicht den Datenverkehr nicht nach den (potenziell) gefälschten Usprungs-IPs aufgeschlüsselt, sondern nach den Standorten der Cloudflare-Rechenzentren, bei denen der Datenverkehr eingegangen ist. Da wir über Rechenzentren in über 270 Städten auf der ganzen Welt verfügen, können wir in unserem Bericht eine große geografische Genauigkeit erreichen. Doch selbst diese Methode ist nicht zu 100 % exakt, da der Datenverkehr aus diversen Gründen (von Kosteneinsparungen bis hin zum Überlastungs- und Ausfallmanagement) über verschiedene Internetdienstanbieter und Länder umgeleitet werden kann.
Palästina steigt als Cloudflare-Standort mit dem höchsten Prozentsatz an DDoS-Angriffen auf Netzwerkschicht vom zweiten auf den ersten Platz auf. Dahinter folgen Aserbaidschan, Südkorea und Angola.
Sie möchten sich alle Regionen und Länder ansehen? Benutzen Sie hierzu unsere interaktive Karte.
Angriffsvektoren
DNS-Attacken haben im zweiten Quartal zugenommen und sind zum zweithäufigsten Angriffsvektor aufgestiegen.
Ein Angriffsvektor bezeichnet die für einen DDoS-Angriff eingesetzte Methode, wobei als Kriterien unter anderem das IP-Protokoll, Paketattribute wie TCP-Flags und die Flooding-Methode herangezogen werden.
Im zweiten Quartal handelte es sich bei 56 % aller Angriffe auf Netzwerkschicht um SYN-Floods. Diese sind damit nach wie vor der beliebteste Angriffsvektor. Sie missbrauchen die erste Verbindungsanfrage zur Durchführung des zustandsabhängigen TCP-Handshake. Während dieser ersten Verbindungsanfrage verfügen Server noch über keinen Kontext bezüglich der TCP-Verbindung, da diese neu ist. Ohne den richtigen Schutz kann es ihnen daher schwer fallen, eine Flut von ersten Verbindungsanfragen abzuwehren. Dies macht es dem Angreifer leichter, die Ressourcen eines ungeschützten Servers voll zu beanspruchen.
Hinter den SYN-Floods folgen Angriffe auf die DNS-Infrastruktur, RST-Floods, die wiederum den TCP-Verbindungsfluss missbrauchen, und generische Angriffe über UDP.
Neue Bedrohungen
Angriffe mittels CHARGEN, Ubiquiti und Memcached gehörten im zweiten Quartal zu den wichtigsten neuen Bedrohungen.
Die Identifizierung der wichtigsten Angriffsvektoren erleichtert es Unternehmen, die Bedrohungslandschaft zu verstehen. Dies wiederum kann ihnen helfen, ihr Sicherheitsniveau zu verbessern, um sich vor diesen Bedrohungen zu schützen. Ebenso kann das Wissen um neu aufkommende Bedrohungen, die vielleicht noch keinen großen Teil der Angriffe ausmachen, zu ihrer frühzeitigen Neutralisierung beitragen.
Im zweiten Quartal waren die wichtigsten neuen Bedrohungen Amplification-Angriffe, die das Character Generator Protocol (CHARGEN) missbrauchen, Amplification-Angriffe, die den Datenverkehr von ungeschützten Ubiquiti-Geräten reflektieren, und der berüchtigte Memcached-Angriff.
Missbrauch des CHARGEN-Protokolls zur Durchführung von Amplification-Angriffen
Die Angriffe, bei denen das CHARGEN-Protokoll missbraucht wurde, haben vom ersten auf das zweite Quartal um 378 % zugenommen.
Das ursprünglich in RFC 864 (1983) definierte Character Generator (CHARGEN)-Protokoll ist ein Dienst der Internetprotokollfamilie, der genau das tut, was sein Name besagt: Er generiert willkürlich Zeichen und hört nicht auf, sie an den Client zu senden, bis dieser die Verbindung beendet. Ursprünglich war er zum Testen und Debugging gedacht. Er wird jedoch nur noch selten verwendet, weil er so leicht für Amplification-/Reflection-Angriffe missbraucht werden kann.
Ein Angreifer kann die Ursprungs-IP seines Opfers fälschen und unterstützende Server auf der ganzen Welt täuschen, um einen Strom beliebiger Zeichen „zurück“ zu den Servern des Opfers zu leiten. Es handelt sich hierbei um einen Amplification/Reflection-Angriff. Bei einer ausreichenden Anzahl gleichzeitiger CHARGEN-Ströme würden die Server des Opfers, wenn sie ungeschützt sind, überflutet. Sie wären dann nicht mehr in der Lage, den legitimen Datenverkehr zu bewältigen – was zu einem Denial-of-Service-Ereignis führen würde.
Amplification-Angriffe, die das Ubiquiti Discovery-Protokoll ausnutzen
Im zweiten Jahresviertel haben die Angriffe über Ubiquity im Quartalsvergleich um 313 % zugelegt.
Ubiquiti ist ein US-amerikanisches Unternehmen, das Netzwerk- und IoT (Internet of Things)-Geräte für Verbraucher und Unternehmen anbietet. Ubiquiti-Geräte können mit dem Ubiquiti Discovery-Protokoll über UDP/TCP-Port 10001 in einem Netzwerk ermittelt werden.
Ähnlich wie beim CHARGEN-Angriffsvektor können Angreifer auch hier die Ursprungs-IP-Adresse durch die IP-Adresse des Opfers ersetzen und Anfragen an IP-Adressen mit offenem Port 10001 verteilen. Diese würden dann auf das Opfer reagieren und es bei ausreichendem Volumen im Prinzip mit Daten überschwemmen.
Memcached-DDoS-Angriffe
Im zweiten Quartal wurden 281 % mehr DDoS-Angriffe über Memcached verzeichnet als in den vorangegangenen drei Monaten.
Memcached ist ein Datenbank-Caching-System zur Beschleunigung von Websites und Netzwerken. Ähnlich wie CHARGEN und Ubiquiti können Memcached-Server, die UDP unterstützen, für Amplification/Reflection-DDoS-Angriffe missbraucht werden. In diesem Fall würde der Angreifer Inhalte vom Caching-System anfordern und die IP-Adresse des Opfers als Ursprungs-IP in den UDP-Paketen eintragen. Das Opfer wird mit den Memcache-Antworten bombardiert, die um einen Faktor von bis zu 51.200 verstärkt werden können.
DDoS-Angriffe auf Netzwerkschicht aufgeschlüsselt nach Angriffsrate
Volumetrische Angriffe mit über 100 Gbit/s sind um 19 % gegenüber dem Vorquartal gestiegen. Attacken mit einer Dauer von mehr als drei Stunden haben um 9 % zugenommen.
Es gibt verschiedene Möglichkeiten, die Größe eines L3/4-DDoS-Angriffs zu messen. So kann man sich das Volumen des damit einhergehenden Traffics ansehen, das als Bitrate ausgedrückt wird. Diese wird in Terabit pro Sekunde oder Gigabit pro Sekunde angegeben. Ein anderer Messwert ist die Anzahl der übermittelten Datenpakete. Diese sogenannte Paketrate wird in Millionen Paketen pro Sekunde angegeben.
Angriffe mit hohen Bitraten zielen darauf ab, die Internetverbindung zu belegen, sodass es zu einer „Denial of Service“ (Nichtverfügbarkeit) kommt. Mit hohen Paketraten dagegen wird versucht, die Server, Router oder andere Hardwaregeräte innerhalb des Netzwerkpfads durch Überlastung lahmzulegen. Diese Geräte wenden eine bestimmte Speicher- und Rechenleistung zur Verarbeitung eines Datenpakets auf. Werden sie daher mit Paketen regelrecht überschwemmt, sind ihre Verarbeitungskapazitäten unter Umständen irgendwann erschöpft. In einem solchen Fall werden Pakete „verworfen“ – mit anderen Worten: Die Appliance ist nicht in der Lage, sie zu verarbeiten. Für Nutzer hat das zur Folge, dass die von ihnen angesteuerten Dienste nicht richtig funktionieren oder nicht mehr verfügbar sind.
Aufschlüsselung nach Paketrate
Die Mehrheit der DDoS-Angriffe auf Netzwerkschicht bleibt unter 50.000 Paketen pro Sekunde. 50.000 Pakete pro Sekunde sind bei der Dimension des Cloudflare-Netzwerks eher am unteren Ende des Spektrums angesiedelt. Dennoch können damit leicht Ausfälle ungeschützter Websites verursacht und sogar Standard-Gigabit-Ethernet-Verbindungen überlastet werden.
Wenn wir uns die Veränderungen bei den Angriffsgrößen ansehen, ist festzustellen, dass paketintensive Angriffe mit mehr als 50.000 Paketen pro Sekunde in zweiten Jahresviertel zurückgegangen sind, während kleine Angriffe um 4 % zugelegt haben.
Aufschlüsselung nach Bitrate
Die Mehrheit der DDoS-Angriffe auf Netzwerkschicht blieben im zweiten Quartal unter 500 Mbit/s. Bei der Größe des Cloudflare-Netzwerks ist auch dies zu vernachlässigen. Dennoch können solche Attacken ungeschützte Websites mit weniger Kapazität sehr schnell lahmlegen oder zumindest eine Standard-Gigabit-Ethernet-Verbindung überlasten.
Interessanterweise sind große Angriffe mit einem Umfang zwischen 500 Mbit/s und 100 Gbit/s im Quartalsvergleich um 20–40 % zurückgegangen, während volumetrische Attacken mit mehr als 100 Gbit/s um 8 % zugenommen haben.
DDoS-Angriffe auf Netzwerkschicht aufgeschlüsselt nach Dauer
Im zweiten Quartal sind Angriffe mit einer Dauer von mehr als drei Stunden um 9 % gestiegen.
Zur Ermittlung der Dauer eines Angriffs wird die Zeit zwischen dem Moment, in dem er von unseren Systemen erstmals als solcher erkannt wird, und dem Augenblick, in dem wir das letzte Paket mit der Signatur dieser Attacke auf dieses konkrete Ziel registrieren, gemessen.
Im Berichtszeitraum dauerten 51 % der DDoS-Angriffe auf Netzwerkschicht weniger als 10 Minuten. Weitere 41 % dauerten 10–20 Minuten. Die verbleibenden 8 % umfassen Angriffe, die zwischen 20 Minuten und mehr als drei Stunden dauern.
Es ist wichtig, zu bedenken, dass die Auswirkungen eines erfolgreichen Angriffs weit über seine eigentliche Dauer – die möglicherweise nur ein paar Minuten beträgt – hinausgehen können. IT-Mitarbeitende, die auf einen erfolgreichen Angriff reagieren, müssen unter Umständen Stunden oder sogar Tage investieren, um Dienste wieder in Betrieb zu setzen.
Die meisten Angriffe sind zwar in der Tat nach kurzer Zeit wieder vorbei, doch es war ein Anstieg um über 15 % bei Attacken mit einer Dauer von 20–60 Minuten und um 12 % bei Angriffen mit einer Dauer von mehr als drei Stunden festzustellen.
Kurze Attacken bleiben leicht unbemerkt, insbesondere solche, die ein Ziel für wenige Sekunden mit einer großen Zahl an Paketen, Bytes oder Anfragen bombardieren. In diesen Fällen haben Abwehrlösungen, die auf einer manuellen Bekämpfung mittels Sicherheitsanalyse beruhen, keine Chance, den Angriff rechtzeitig zu unterbinden. Es bleibt dann nur die Möglichkeit, ihn im Nachhinein zu untersuchen und auf Grundlage der dabei gewonnenen Erkenntnisse eine neue Regel zu erstellen, anhand derer der Traffic anschließend auf das Angriffsprofil hin gefiltert werden kann. Dann besteht zumindest eine gewisse Hoffnung, dass die nächste Attacke erkannt wird. Ebenso wenig zielführend ist der Einsatz eines „On Demand“-Services, bei denen das Sicherheitsteam den Datenverkehr während eines Angriffs zu einem DDoS-Dienst umleitet. Denn in diesen Fällen ist die Attacke vorüber, bevor der Traffic dort ankommt.
Unternehmen wird die Verwendung automatisch funktionierender und ständig aktiver DDoS-Schutzdienste empfohlen. Diese analysieren den Datenverkehr und wenden in Echtzeit Fingerprinting an, wodurch sie schnell genug sind, um auch kurze Angriffe zu blockieren.
Zusammenfassung
Cloudflare hat es sich zur Aufgabe gemacht, ein besseres Internet zu schaffen. Das bedeutet ein sichereres, schnelleres und zuverlässigeres Web für alle – auch bei DDoS-Angriffen. Deshalb bieten wir seit 2017 allen unseren Kunden zeitlich unbeschränkten und unbegrenzten DDoS-Schutz gratis an. Im Lauf der Jahre ist es immer einfacher geworden, DDoS-Angriffe durchzuführen. Wir wollen aus diesem Grund sicherstellen, dass es für Unternehmen gleich welcher Größe noch einfacher und kostenlos ist, sich vor DDoS-Angriffen aller Art zu schützen. Sie nutzen Cloudflare noch nicht? Dann starten Sie jetzt mit unseren Free- und Pro-Tarifen zum Schutz Ihrer Websites oder kontaktieren Sie uns für umfassenden DDoS-Schutz für Ihr gesamtes Netzwerk mit Magic Transit.
Bienvenue dans notre rapport consacré aux attaques DDoS survenues lors du deuxième trimestre 2022. Ce document présente des tendances et des statistiques relatives au panorama des menaces DDoS, telles qu’observées sur le réseau mondial de Cloudflare. Une version interactive de ce rapport est également disponible sur Radar.
Au cours du deuxième trimestre, nous avons observé certaines des plus vastes attaques jamais enregistrées, notamment une attaque DDoS HTTPS de 26 millions de requêtes par seconde, automatiquement détectée et atténuée par nos soins. Nous avons également constaté la poursuite des attaques contre l’Ukraine et la Russie, de même que l’émergence d’une nouvelle campagne d’attaques DDoS avec demande de rançon.
Points clés
Le réseau Internet russe et ukrainien
La guerre au sol s’accompagne d’attaques ciblant la diffusion des informations.
Les entreprises du secteur audiovisuel ukrainien ont été les plus visées par les attaques DDoS au deuxième trimestre. Pour tout dire, les six secteurs les plus attaqués se situent tous dans le domaine des médias en ligne/Internet, de la publication et de l’audiovisuel.
À l’inverse, en Russie, les médias en ligne reculent de secteur le plus attaqué à la troisième place. Les entreprises du secteur de la banque, des assurances et des services financiers (BFSI, Banking, Financial Services and Insurance) russe se sont frayées un chemin vers la première place et ont été les plus attaquées au deuxième trimestre. Près de 50 % de l’ensemble des attaques DDoS sur la couche applicative ont ainsi visé le secteur des BFSI. Les entreprises russes du secteur des cryptomonnaies décrochent la deuxième place.
En juin 2022, les attaques DDoS avec demande de rançon ont atteint leur point culminant de l’année jusqu’ici : une personne interrogée sur cinq parmi celles qui affirment avoir subi une attaque DDoS ont signalé avoir fait les frais d’une attaque DDoS ou d’autres menaces accompagnées d’une demande de rançon
Au total, le pourcentage d’attaques DDoS avec demande de rançon a augmenté de 11 % au deuxième trimestre, par rapport au trimestre précédent.
Attaques DDoS sur la couche applicative
En 2022, les attaques DDoS sur la couche applicative ont augmenté de 44 % par rapport à l’année précédente.
Les entreprises établies aux États-Unis ont été les plus touchées, suivies par celles situées à Chypre, à Hong Kong et en Chine. Les attaques visant les entreprises basées à Chypre ont augmenté de 171 % par rapport au trimestre précédent.
Le secteur de l’aéronautique et de l’aérospatiale a été le plus visé au deuxième trimestre, suivi par les secteurs de l’Internet, des BFSI (banque, assurances et services financiers) et le secteur des jeux/jeux de hasard, qui se place en quatrième position
Attaques DDoS sur la couche réseau
En 2022, les attaques DDoS sur la couche réseau ont augmenté de 75% par rapport à l’année précédente. Les attaques de 100 Gb/s et plus ont augmenté de 19 % par rapport au trimestre précédent et les attaques d’une durée supérieure à 3 heures de 9 % sur la même période.
Les secteurs les plus touchés ont été ceux des télécommunications, des jeux/jeux de hasard, ainsi que celui des services et technologies de l’information.
Les entreprises situées aux États-Unis ont été les plus visées, suivies par celles basées à Singapour, en Allemagne et en Chine.
Ce rapport concerne les attaques DDoS automatiquement détectées et atténuées par les systèmes de protection contre les attaques DDoS de Cloudflare. Pour en apprendre plus sur leur fonctionnement, consultez cet article de blog détaillé.
Remarque concernant la manière dont nous mesurons les attaques DDoS observées sur notre réseau
Pour analyser les tendances en matière d’attaques, nous calculons le taux d’« activité DDoS », qui correspond au pourcentage de trafic hostile par rapport au trafic total (hostile et légitime) observé sur notre réseau mondial, dans un emplacement spécifique ou au sein d’une catégorie spécifique (p. ex. le secteur ou le pays de facturation). La mesure de ces pourcentages nous permet de normaliser les points de données et d’éviter les biais résultant de l’utilisation de chiffres absolus (par exemple, envers un datacenter Cloudflare qui reçoit un trafic plus important et connaît donc plus d’attaques).
Attaques avec demande de rançon
Nos systèmes analysent le trafic en permanence et déploient des mesures d’atténuation de manière automatique lorsque des attaques DDoS sont détectées. Nous invitons chaque client ayant subi une attaque DDoS à répondre à une enquête automatisée afin de nous aider à mieux comprendre la nature de l’attaque et le degré de réussite de l’atténuation.
Depuis plus de deux ans désormais, Cloudflare interroge les clients victimes d’attaques. Nous leur demandons notamment s’ils ont reçu des menaces ou une demande de rançon exigeant un paiement en échange de la promesse d’arrêter l’attaque DDoS en cours ou de ne pas lancer d’attaque DDoS.
Le nombre de personnes interrogées ayant signalé des demandes de rançon ou des menaces accompagnées d’une demande de rançon au deuxième trimestre a augmenté de 11 % par rapport à l’année et au trimestre précédents. Au cours du trimestre, nous avons atténué des attaques DDoS avec demande de rançon lancées par des entités prétendant appartenir au groupe de menaces persistantes avancées (Advanced Persistent Threat, APT) « Fancy Lazarus ». La campagne se concentre sur les institutions financières et les entreprises du secteur des cryptomonnaies.
Le pourcentage de personnes ayant signalé avoir fait l’objet d’une attaque DDoS avec demande de rançon ou avoir reçu des menaces en préambule à une attaque.
L’analyse plus approfondie du deuxième trimestre montre qu’au mois de juin, une personne interrogée sur cinq a signalé avoir été menacée ou avoir fait les frais d’une attaque DDoS avec demande de rançon, une proportion qui fait du mois de juin le mois affichant le taux le plus élevé de signalements en la matière de l’année 2022, avec un niveau inégalé depuis décembre 2021.
Attaques DDoS sur la couche applicative
Les attaques DDoS sur la couche applicative (et plus spécifiquement les attaques DDoS HTTP) cherchent généralement à perturber le fonctionnement d’un serveur web en le rendant incapable de traiter les requêtes des utilisateurs légitimes. Si un serveur se trouve bombardé par plus de requêtes qu’il ne peut en gérer, il abandonne les requêtes légitimes et peut même finir dans certains cas par s’arrêter totalement, en entraînant ainsi une dégradation des performances ou une défaillance pour les utilisateurs légitimes.
Attaques DDoS sur la couche applicative, répartition mensuelle
Au deuxième trimestre, les attaques DDoS sur la couche applicative ont augmenté de 44 % par rapport à l’année précédente.
Au total, le volume d’attaques DDoS sur la couche applicative observé lors du deuxième trimestre a augmenté de 44 % par rapport à l’année précédente, mais a diminué de 16 % par rapport au trimestre précédent. Le mois de mai s’est avéré le plus actif du trimestre. Près de 47 % de l’ensemble des attaques DDoS sur la couche applicative ont eu lieu en mai, tandis que le mois de juin a connu le plus petit nombre d’attaques (18 %).
Attaques DDoS sur la couche applicative, répartition par secteur
Les attaques visant le secteur de l’aéronautique et de l’aérospatiale ont augmenté de 256 % par rapport au trimestre précédent.
Le secteur de l’aéronautique et de l’aérospatiale s’est révélé le plus visé par les attaques DDoS sur la couche applicative au deuxième trimestre. Il est suivi par celui de la banque, des assurances et des services financiers (BFSI), ainsi que le secteur des jeux/jeux de hasard, qui se positionne à la troisième place.
Le cyberespace russe et ukrainien
Les entreprises du secteur des médias et de la publication sont les plus visées en Ukraine.
Tandis que la guerre en Ukraine continue au sol, dans les airs et sur l’eau, elle se poursuit également dans le cyberespace. Les entités qui s’en prennent aux entreprises ukrainiennes semblent essayer de bâillonner l’information. Les six secteurs les plus attaqués en Ukraine se situent tous dans le domaine de l’audiovisuel, d’Internet, des médis en ligne et de la publication. Ces derniers totalisent près de 80 % de l’ensemble des attaques DDoS sévissant sur le territoire.
Dans le camp opposé (côté russe donc), ce sont les entreprises du secteur de la banque, des assurances et des services financiers (BFSI) qui ont connu le plus d’attaques. Près de 50 % de l’ensemble des attaques DDoS ont ainsi visé le secteur des BFSI. Le deuxième secteur le plus touché a été celui des cryptomonnaies, suivi du secteur des médias en ligne.
On constate que les attaques font preuve d’une forte distribution géographique dans les deux camps belligérants, un fait qui indique ainsi l’utilisation de botnets répartis sur l’ensemble du monde.
Attaques DDoS sur la couche applicative, répartition par pays d’origine
Les attaques provenant de Chine ont augmenté de 112 % au deuxième trimestre, tandis que les attaques issues des États-Unis ont diminué de 43 %.
Pour connaître l’origine des attaques HTTP, nous examinons la géolocalisation de l’adresse IP source du client à l’initiative des requêtes composant l’attaque HTTP. Contrairement aux attaques sur la couche réseau, les adresses IP ne peuvent pas être usurpées lors d’une attaque HTTP. Un pourcentage d’activité DDoS élevé dans un pays donné n’indique pas que ce dernier constitue la source des attaques, mais révèle plutôt la présence de botnets au sein de ce dernier.
Pour le deuxième trimestre consécutif, les États-Unis maintiennent leur première place en tant que source principale des attaques DDoS HTTP. La Chine détient la deuxième place après les États-Unis, tandis que l’Inde et l’Allemagne se placent respectivement en troisième et quatrième position. Même si les États-Unis ont conservé la première place, les attaques originaires de ce pays ont diminué de 43 % par rapport au trimestre précédent, tandis que les attaques issues d’autres régions sont en hausse. Les attaques en provenance de Chine ont ainsi augmenté de 112 %, les attaques originaires d’Inde de 89 % et les attaques lancées depuis l’Allemagne de 50 %.
Attaques DDoS sur la couche applicative, répartition par pays cible
Afin d’identifier les pays ciblés par le plus grand nombre d’attaques DDoS HTTP, nous décomposons l’activité des attaques DDoS en fonction du pays de facturation de nos clients et la représentons sous forme de pourcentage de l’ensemble des attaques DDoS.
Les attaques DDoS HTTP visant des entreprises situées aux États-Unis ont augmenté de 45 % par rapport au trimestre précédent. Ce chiffre replace ainsi les États-Unis à la première position en tant que source principale des attaques sur la couche applicative. Les attaques visant des entreprises chinoises ont baissé de 79 % par rapport au trimestre précédent, faisant ainsi chuter le pays de la première à la quatrième place; Les attaques sur les entreprises chypriotes ont connu une augmentation de 171 % et positionnent ainsi le pays à la deuxième place des pays les plus attaqués au deuxième trimestre. Après Chypre viennent ensuite Hong Kong, la Chine et la Pologne.
Attaques DDoS sur la couche réseau
Si les attaques au niveau de la couche applicative prennent pour cible l’application (la couche 7 du modèle OSI) exécutant le service auquel les utilisateurs finaux tentent d’accéder (HTTP/S dans notre cas), les attaques sur la couche réseau cherchent à surcharger l’infrastructure réseau (comme les routeurs et les serveurs internes), ainsi que la liaison Internet elle-même.
Attaques DDoS sur la couche réseau, répartition mensuelle
Au deuxième trimestre, les attaques DDoS sur la couche réseau ont augmenté de 75% par rapport à l’année précédente. De même, les attaques volumétriques de 100 Gb/s et plus ont augmenté de 19 % par rapport au trimestre précédent
Si le nombre total d’attaques DDoS sur la couche réseau observé lors du deuxième trimestre a augmenté de 75% par rapport à l’année précédente, il a néanmoins peu varié par rapport au trimestre précédent. Le mois d’avril s’est révélé le plus actif du trimestre, avec près de 40 % des attaques.
Attaques DDoS sur la couche réseau, répartition par secteur
Au deuxième trimestre, les attaques sur les entreprises de télécommunications ont augmenté de 45 % par rapport au trimestre précédent.
Pour le deuxième trimestre consécutif, le secteur des télécommunications a été le plus touché par les attaques DDoS sur la couche réseau. Les attaques sur les entreprises de télécommunications ont ainsi augmenté de 45 % par rapport au trimestre précédent. Le secteur des jeux arrive en deuxième place, suivi par celui des services et technologies de l’information
Attaques DDoS sur la couche réseau, répartition par pays cible
Les attaques sur les réseaux situés aux États-Unis ont augmenté de 70 % par rapport au trimestre précédent.
Les États-Unis demeurent le pays le plus attaqué au deuxième trimestre. Ils sont suivis de Singapour, qui se retrouve en seconde place après avoir occupé la quatrième lors du trimestre précédent. La troisième place est détenue par l’Allemagne, elle-même suivie par la Chine, les Maldives et la Corée du Sud.
Attaques DDoS sur la couche réseau, répartition par pays source de trafic entrant
Lors du deuxième trimestre, près d’un tiers du trafic observé par Cloudflare en Palestine et en Azerbaïdjan faisait partie d’une attaque DDoS sur la couche réseau.
Lorsque nous essayons de comprendre d’où les attaques DDoS sur la couche réseau proviennent, nous ne pouvons utiliser la même méthode que celle que nous employons pour l’analyse des attaques sur la couche applicative. Le lancement d’une attaque DDoS sur la couche applicative nécessite la réussite de certaines négociations entre le client et le serveur afin d’établir une connexion HTTP/S. Pour qu’une négociation puisse réussir, les attaques ne peuvent pas usurper leur adresse IP source. Si l’auteur de l’attaque peut tirer parti de botnets, de services de proxy et d’autres méthodes de dissimulation de son identité, l’emplacement de l’adresse IP source du client à l’origine de l’attaque représente avec suffisamment de précision la source des attaques DDoS sur la couche applicative.
D’un autre côté, le lancement d’attaques DDoS sur la couche réseau ne nécessite, dans la plupart des cas, aucune négociation. Les acteurs malveillants peuvent tout à fait usurper l’adresse IP source pour dissimuler la source de l’attaque et introduire un caractère aléatoire dans les propriétés de cette dernière. Le blocage des attaques par les systèmes de protection contre les attaques DDoS simples s’en trouve donc plus difficile. Par conséquent, si nous cherchons à déterminer le pays d’origine en nous fondant sur une adresse IP source usurpée, le résultat aboutira sur un pays usurpé.
C’est pour cette raison que lorsque nous analysons les sources des attaques DDoS sur la couche réseau, nous classons le trafic en fonction de l’emplacement des datacenters Cloudflare dans lequel le trafic a été ingéré et non de l’adresse IP (potentiellement) usurpée pour déterminer de quel endroit les attaques proviennent. Nous sommes en mesure de garantir la précision géographique de notre rapport dans la mesure où nous possédons des datacenters répartis dans plus de 270 villes à travers le monde. Toutefois, cette méthode n’est pas précise à 100 %, car le trafic peut faire l’objet d’une redirection (backhauling) et d’un routage via divers fournisseurs d’accès Internet et pays pour des raisons variables, qui vont de la réduction des coûts à la gestion des encombrements et des défaillances.
La Palestine passe de la seconde à la première place en tant que point d’implantation Cloudflare affichant le plus haut pourcentage d’attaques DDoS sur la couche réseau. L’Azerbaïdjan, la Corée du Sud et l’Angola lui emboîtent le pas.
Pour visualiser toutes les régions et tous les pays, consultez la carte interactive.
Vecteurs d’attaque
Les attaques DNS ont augmenté au deuxième trimestre, pour devenir le deuxième vecteur d’attaque le plus fréquent.
Le terme « vecteur d’attaque » désigne la méthode utilisée par le pirate pour lancer son attaque DDoS, c’est-à-dire le protocole IP, les attributs de paquets (comme les indicateurs TCP) et la méthode de saturation, parmi bien d’autres critères.
Lors du deuxième trimestre, 56 % de l’ensemble des attaques sur la couche réseau se composaient d’attaques de type SYN flood. Les SYN floods demeurent ainsi le vecteur d’attaque le plus populaire. Elles s’en prennent à la requête de connexion initiale de la négociation TCP avec état. Les serveurs ne disposent d’aucun contexte sur la connexion TCP pendant cette requête, car la connexion est en cours de création. Laissés sans protection, les serveurs peuvent ainsi éprouver des difficultés à atténuer un flood de requêtes de connexion initiale. Cette situation peut faciliter la consommation des ressources non protégées d’un serveur par un acteur malveillant.
Après les SYN floods viennent les attaques visant l’architecture DNS, les RST floods (qui s’attaquent eux aussi au processus de connexion TCP) et les attaques génériques via UDP.
Menaces émergentes
Les attaques lancées via CHARGEN, Ubiquiti et Memcached sont entrées au palmarès des principales menaces émergentes au deuxième trimestre.
L’identification des principaux vecteurs d’attaque permet aux entreprises de mieux comprendre le panorama des menaces. Cette opération peut également les aider à améliorer leur stratégie de sécurité afin de se protéger contre ces menaces. De même, si les nouvelles menaces émergentes ne constituent pas encore une partie substantielle des attaques, en apprendre plus à leur sujet peut contribuer à les atténuer avant qu’elles ne deviennent une force avec laquelle compter.
Au deuxième trimestre, les principales menaces émergentes comprenant les attaques par amplification abusant du protocole Character Generator (CHARGEN), les attaques par amplification réfléchissant le trafic destiné aux appareils Ubiquiti exposés et la tristement célèbre attaque Memcached.
Abuser du protocole CHARGEN pour lancer des attaques par amplification
Au deuxième trimestre, les attaques par amplification abusant du protocole CHARGEN ont augmenté de 378 % par rapport au trimestre précédent.
Initialement défini au sein de la RFC 864 (1983), le protocole Character Generator (CHARGEN) constitue un service de la suite de protocoles Internet. Il permet d’effectuer exactement ce que son nom indique, à savoir, générer des caractères de manière arbitraire et les envoyer en continu au client jusqu’à ce que ce dernier mette fin à la connexion. Développé à l’origine à des fins de tests et de débogage, il est rarement utilisé de nos jours, en raison de la facilité avec laquelle les attaques par amplification/réflexion peuvent en abuser.
Un acteur malveillant peut usurper l’adresse IP source de sa victime et tromper les serveurs de soutien implantés dans le monde entier afin qu’ils dirigent un flux de caractères arbitraires « en retour » vers les serveurs de la victime. Ce type d’attaque est désigné sous le nom d’attaque par amplification/réflexion. En présence d’un nombre suffisant de flux CHARGEN, les serveurs de la victime laissés sans protection se verraient submergés et incapables de faire face au trafic légitime. Cette situation entraînerait ainsi un événement de déni de service.
Attaques par amplification exploitant le protocole de découverte Ubiquiti
Au deuxième trimestre, les attaques lancées via Ubiquiti ont augmenté de 313 % par rapport au trimestre précédent.
Ubiquiti est une entreprise basée aux États-Unis. Elle fournit des services réseau et des appareils IdO (Internet des objets) aux consommateurs et aux entreprises. Les appareils Ubiquiti peuvent être identifiés sur un réseau à l’aide du protocole de découverte Ubiquiti, via le port UDP/TCP 10001.
Tout comme avec le vecteur d’attaque CHARGEN, les acteurs malveillants peuvent, là aussi, usurper l’adresse IP source afin qu’elle corresponde à l’adresse IP de la victime et ainsi affecter toutes les adresses IP dont le port 10001 est ouvert. Ces adresses répondent alors à la victime, qui se retrouve submergée une fois le volume suffisant atteint.
Attaque DDoS memcached
Au deuxième trimestre, les attaques DDoS Memcached ont augmenté de 281 % par rapport au trimestre précédent.
Memcached est un système de mise en cache de base de données conçu pour accélérer les sites web et les réseaux. Comme pour CHARGEN et Ubiquiti, les serveurs Memcached prenant en charge UDP peuvent être utilisés de manière abusive afin de lancer des attaques DDoS par amplification/réflexion. Dans ce cas précis, le pirate demande du contenu au système de mise en cache et usurpe l’adresse IP de la victime afin de l’utiliser en tant qu’IP source dans les paquets UDP. La victime est alors submergée sous les réponses Memcache, qui peuvent être amplifiées d’un facteur pouvant atteindre × 51 200.
Attaques DDoS sur la couche réseau, répartition par débit d’attaque
Les attaques volumétriques supérieures à 100 Gb/s ont augmenté de 19 % par rapport au trimestre précédent et les attaques d’une durée supérieure à 3 heures de 9 % sur la même période.
Il existe diverses manières de mesurer la taille d’une attaque DDoS sur la couche 3/4. L’une d’entre elles s’attache à son volume de trafic, mesuré en débit binaire (plus exactement, en térabits ou en gigabits par seconde). Une autre s’intéresse au nombre de paquets transmis, mesuré en termes de débit de paquets (plus spécifiquement, en millions de paquets par seconde).
Les attaques à haut débit binaire tentent de provoquer un événement de déni de service en encombrant la liaison Internet, tandis que les attaques à débit de paquets élevé essaient de surcharger les serveurs, les routeurs et les autres équipements physiques en ligne. Ces appareils consacrent une certaine quantité de mémoire et de puissance de calcul au traitement de chaque paquet. Par conséquent, lorsqu’il se trouve bombardé sous une multitude de paquets, l’appareil peut venir à manquer de ressources de traitement. Les paquets sont alors « abandonnés », c’est-à-dire que l’appareil se déclare incapable de les traiter. Pour les utilisateurs, ce constat se traduit par un événement de déni de service.
Répartition par débit de paquets
La majeure partie des attaques DDoS sur la couche réseau demeurent sous le seuil des 50 000 paquets par seconde. Si ce chiffre de 50 000 paquets par seconde se situe plutôt au bas de l’échelle du point de vue de Cloudflare, une telle attaque reste tout à fait capable d’abattre les propriétés Internet sans protection et d’entraîner des encombrements, même sur une connexion Gigabit Ethernet standard.
L’examen des changements au niveau de la taille des attaques nous permet de constater que les attaques volumineuses en termes de paquets (supérieures à 50 000 p/s) ont diminué au deuxième trimestre. Les attaques de petite taille n’ont ainsi augmenté que de 4 %.
Répartition en fonction du débit binaire
Au deuxième trimestre, la majorité des attaques DDoS sur la couche réseau sont restées sous le seuil des 500 Mb/s. S’il s’agit là aussi d’une goutte d’eau à l’échelle de Cloudflare, ces attaques demeurent capables de forcer très rapidement la mise hors ligne des propriétés Internet de moindre capacité laissées sans protection ou, au minimum, d’entraîner des encombrements, même sur une connexion Gigabit Ethernet standard.
Il est intéressant de noter que les attaques de grande capacité (entre 500 Mb/s et 100 Gb/s) ont diminué de 20 à 40 % par rapport au trimestre précédent, mais que les attaques volumétriques supérieures à 100 Gb/s ont augmenté de 8 %.
Attaques DDoS sur la couche réseau, répartition par durée
Les attaques d’une durée supérieure à 3 heures ont augmenté de 9 % au deuxième trimestre.
Nous mesurons la durée d’une attaque en enregistrant la différence entre l’instant auquel nos systèmes la détectent pour la première fois en tant qu’attaque et le dernier paquet porteur de cette signature d’attaque que nous observons en direction de cette cible spécifique.
Au cours du deuxième trimestre, 51 % des attaques DDoS sur la couche réseau ont duré moins de dix minutes. Les 41 % suivants ont duré entre 10 et 20 minutes. Les 8 % restants regroupent les attaques d’une durée comprise entre 20 minutes et plus de 3 heures.
L’un des éléments importants à garder à l’esprit repose sur le fait que si une attaque ne dure que quelques minutes, ses répercussions en cas de réussite peuvent durer bien plus longtemps que la période d’attaque initiale. Les membres des équipes informatiques qui répondent à une attaque réussie peuvent tout à fait passer des heures, voire des jours, à restaurer les services.
Si la plupart des attaques se révèlent en effet de courte durée, nous pouvons constater une augmentation de plus de 15 % des attaques comprises entre 20 et 60 minutes, ainsi qu’une augmentation de 12 % des attaques de plus de trois heures.
Les attaques de courte durée peuvent facilement passer inaperçues, notamment les attaques en rafale, qui bombardent une cible d’un nombre important de paquets, d’octets ou de requêtes en l’espace de quelques secondes. Dans ce cas précis, les services de protection contre les attaques DDoS qui reposent sur l’atténuation manuelle en fonction d’une analyse de sécurité n’ont aucune chance d’atténuer l’attaque à temps. Ils ne peuvent qu’en tirer des enseignements lors de l’analyse post-attaque, avant de déployer une nouvelle règle permettant de filtrer les empreintes numériques de l’attaque et d’espérer la repérer la prochaine fois. Dans le même esprit, l’utilisation d’un service « à la demande » (dans lequel l’équipe de sécurité redirige le trafic vers un fournisseur de services pendant l’attaque) se révèle également inefficace, car l’attaque sera déjà terminée avant la redirection du trafic vers le fournisseur de services anti-DDoS à la demande.
Nous recommandons aux entreprises d’avoir recours à des services de protection contre les attaques DDoS automatisés et actifs en permanence, capables d’analyser le trafic et de relever les empreintes numériques suffisamment vite pour bloquer les attaques de courte durée.
Résumé
Cloudflare s’est donné pour mission de construire un Internet meilleur, c’est-à-dire un Internet plus sécurisé, plus rapide et plus fiable pour chacun, même en cas d’attaques DDoS. Dans le cadre de notre mission, nous proposons gratuitement à tous nos clients une protection contre les attaques DDoS illimitée et sans surcoût lié à l’utilisation, et ce depuis 2017. Au fil des ans, il est devenu de plus en plus facile pour les pirates de lancer des attaques DDoS. Toutefois, malgré la simplicité de mise en œuvre de ces dernières, nous souhaitons nous assurer qu’il soit tout aussi facile et gratuit pour les entreprises de toutes les tailles de se protéger contre les attaques DDoS de tous types. Vous n’utilisez pas encore Cloudflare ? Commencez dès maintenant à protéger vos sites web avec nos offres gratuite et Pro ou contactez-nous pour bénéficier d’une protection contre les attaques DDoS complète sur l’ensemble de votre réseau grâce à Magic Transit.
2분기에 가장 많은 DDoS 공격이 이루어진 대상은 우크라이나의 방송매체 회사들이었습니다. 실제로, 가장 많은 공격을 받은 상위 6개 산업은 모두 온라인/인터넷 매체, 출판, 방송 분야에 속했습니다.
반면, 러시아의 경우 온라인 매체는 가장 많은 공격을 받은 산업 순위에서 3위로 처집니다. 온라인 매체보다 순위가 높은 산업을 보면 러시아의 은행, 금융 서비스 및 보험(BFSI) 회사들이 2분기에 공격을 가장 많이 받았고, 전체 응용 프로그램 계층 DDoS 공격의 거의 50%가 BFSI 분야를 대상으로 했습니다. 두 번째로 공격을 많이 받은 것은 암호화폐 회사들이었습니다.
우리는 팬시 라자러스(Fancy Lazarus)라고 자칭하는 공격자들에 의한 랜섬 DDoS 공격이 급증하는 것을 목격했습니다.
2022년 6월에는 랜섬 공격 건수가 올해 들어 최고 수준으로 늘어났습니다. DDoS 공격을 경험한 설문 응답자 5명 중 1명이 랜섬 DDoS 공격이나 기타 위협의 대상이 되었다고 응답했습니다.
2분기 전체로 보면 랜섬 DDoS 공격의 비율은 이전 분기 대비 11% 증가하였습니다.
응용 프로그램 계층 DDoS 공격
2022년 2분기에 응용 프로그램 계층 DDoS 공격은 전년 대비 44% 증가하였습니다.
가장 많이 공격의 대상이 된 것은 미국의 조직들이었고, 키프로스, 홍콩, 중국이 그 뒤를 이었습니다. 키프로스 내 조직들에 대한 공격은 이전 분기 대비 171% 증가했습니다.
2분기에 가장 많은 공격을 받은 산업은 항공우주 산업이었으며, 인터넷, BFSI, 그리고 4위의 게임/도박 산업이 그 뒤를 이었습니다.
네트워크 계층 DDoS 공격
2022년 2분기에 네트워크 계층 DDoS 공격은 전년 대비 75% 상승하였습니다. 100Gbps 이상의 공격은 이전 분기 대비 19%, 3시간 이상 지속된 공격 횟수는 이전 분기 대비 9% 증가하였습니다.
가장 많은 공격을 받은 산업은 이동통신, 게임/도박, 정보기술, 서비스 산업이었습니다.
가장 많이 공격의 대상이 된 것은 미국의 조직들이었고, 싱가포르, 독일, 중국이 그 뒤를 이었습니다.
이 보고서는 Cloudflare의 DDoS 방어 시스템에서 자동으로 감지되어 완화된 DDoS 공격을 기반으로 한 것입니다. 이 시스템의 원리에 대해 자세히 알아보려면 이 심층 블로그 게시물을 참고하세요.
우리가 네트워크에서 관찰된 DDoS 공격을 측정하는 방식
우리는 공격 동향을 분석하기 위해 “DDoS 활동” 비율을 측정합니다. 이는 우리의 전역 네트워크 또는 특정 위치 또는 특정 범주(예: 산업 또는 청구서 발행 국가)에서 관찰된 총 트래픽(공격 트래픽 + 정상 트래픽) 중 공격 트래픽의 비율을 의미합니다. 해당 트래픽 비율을 측정하면 데이터 포인트를 정규화하고, 예를 들어 더 많은 총 트래픽을 수신하면서 더 많은 공격을 받을 가능성이 있는 Cloudflare 데이터 센터에 대한 절대 수치에 편향이 반영되지 않도록 할 수 있습니다.
랜섬 공격
우리의 시스템은 지속해서 트래픽을 분석하면서, DDoS 공격이 감지되면 자동으로 완화 조치를 적용합니다. DDoS 공격을 당한 각 고객에게는 자동 설문이 표시되어 당사에서 공격의 특성을 보다 자세히 파악하고 완화에 성공하는 데 도움이 됩니다.
현재 2년 여에 걸쳐 Cloudflare는 공격을 받은 고객들을 대상으로 설문을 진행하고 있으며, 질문 중 하나로 DDoS 공격을 멈추는 대가로 돈을 요구하는 위협이나 랜섬 노트를 받았는지 물었습니다.
2분기에 위협이나 협박 메일을 받은 응답자의 수는 이전 분기 및 전년 대비 11% 상승하였습니다. 이번 분기 내내 우리는 지능형 지속 위협(APT) 집단 “팬시 라자러스”라고 자칭하는 공격자들이 실행한 랜섬 DDoS 공격을 완화해 왔습니다. 공격은 주로 금융기관과 암호화폐 회사에 집중되었습니다.
랜섬 DDoS 공격을 받았거나 공격에 앞서 위협을 받았다고 답한 응답자의 비율.
2분기를 더 자세히 살펴보면, 6월에 응답자 5명 중 1명이 랜섬 DDoS 공격을 받았거나 위협을 받았다고 응답했습니다. 이는 2022년 들어 응답 비율이 가장 높은 한 달이었으며, 2021년 12월 이후 가장 높은 수치입니다.
응용 프로그램 계층 DDoS 공격
응용 프로그램 계층 DDoS 공격 중 특히 HTTP DDoS 공격은 주로 웹 서버가 합법적인 사용자 요청을 처리할 수 없도록 하여 웹 서버를 사용 불가능하게 만드는 것을 목표로 합니다. 서버가 처리할 수 있는 양보다 많은 요청이 쏟아질 경우, 해당 서버는 합법적인 요청의 처리를 중단하게 되고, 경우에 따라서는 충돌을 일으켜 성능이 저하되거나 합법적인 사용자의 서비스도 거부하게 됩니다.
월별 응용 프로그램 계층 DDoS 공격
2분기에 응용 프로그램 계층 DDoS 공격은 전년 대비 44% 증가하였습니다.
2분기 전체에 걸쳐 응용 프로그램 계층 DDoS 공격 건수는 전년 대비 44% 증가하였지만, 이전 분기 대비 16% 감소하였습니다. 5월은 이 분기 들어 가장 분주했던 달입니다. 전체 응용 프로그램 계층 DDoS 공격의 47% 가까이가 5월에 발생했으며, 공격 건수는 6월에 가장 적었습니다(18%).
산업별 응용 프로그램 계층 DDoS 공격
항공우주 산업에 대한 공격은 이전 분기 대비 256% 증가했습니다.
항공우주 산업은 2분기에 가장 많이 응용 프로그램 계층 DDoS 공격의 대상이 된 산업이었습니다. 은행, 금융기관 및 보험(BFSI) 산업과 3위의 게임/도박 산업이 그 뒤를 이었습니다.
우크라이나와 러시아의 사이버 공간
우크라이나에서 가장 많이 공격 대상이 된 것은 미디어 및 출판 회사입니다.
지상, 공중, 바다에서 우크라이나 전쟁이 계속되고 있는 가운데, 사이버 공간에서도 전쟁이 계속되고 있습니다. 우크라이나 회사들을 겨냥하는 공격자는 정보 전파를 막으려 하는 것으로 추정됩니다. 우크라이나에서 가장 많이 공격받은 산업 6개는 모두 방송, 인터넷, 온라인 미디어, 출판업계에 속해 있습니다. 이는 우크라이나를 목표로 한 DDoS 공격 전체의 거의 80%에 달합니다.
반대편에서의 전쟁에서는 러시아의 은행, 금융기관 및 보험(BFSI) 회사들이 공격을 가장 많이 받았습니다. DDoS 공격 전체의 거의 50%가 BFSI 업계를 겨냥했습니다. 공격을 두 번째로 많이 받은 대상은 암호화폐 업계였고, 온라인 매체가 그 뒤를 이었습니다.
전쟁 당사자 양측에서 공격의 근원지가 매우 다양함을 확인할 수 있는데, 이는 전 세계에 걸쳐 봇넷이 사용되었음을 의미합니다.
공격 출처 국가별 응용 프로그램 계층 DDoS 공격
2분기에 중국발 공격은 112% 증가했지만, 미국발 공격은 43% 감소했습니다.
HTTP 공격의 출처를 파악하려면 공격 HTTP 요청을 생성한 클라이언트가 가진 소스 IP 주소의 지리적 위치를 살펴보아야 합니다. 네트워크 계층 공격 시와는 달리 HTTP 공격 시에는 소스 IP의 스푸핑이 불가능합니다. 특정 국가에서 DDoS 활동 비율이 높다는 것은 해당 국가에서 주도적으로 공격을 하고 있다는 것이 아니라 대개 해당 국가 내에서 봇넷이 작동 중임을 의미합니다.
2분기 연속으로 미국이 HTTP DDoS 공격의 주요 근원지 순위에서 1위를 차지했습니다. 미국 다음으로 2위에 중국, 3위와 4위에 인도와 독일이 각각 위치해 있습니다. 미국이 여전히 1위를 유지하고 있지만, 미국발 공격 건수는 지난 분기 대비 43% 감소하였으며, 다른 지역발 공격은 증가하였습니다. 중국발 공격은 112%, 인도발 공격은 89%, 독일발 공격은 50% 증가하였습니다.
대상 국가별 응용 프로그램 계층 DDoS 공격
어느 국가가 가장 많은 HTTP DDoS 공격을 받았는지 파악하기 위해 우리는 고객의 청구서 발행 국가별로 DDoS 공격을 분류하고, 이를 모든 DDoS 공격 대비 비율로 분석합니다.
미국에 본사를 둔 여러 회사에 대한 HTTP DDoS 공격 건수가 지난 분기 대비 45% 증가해 미국이 다시 응용 프로그램 계층 DDoS 공격의 주요 공격 대상 1위로 올라섰습니다. 중국의 회사들에 대한 공격은 지난 분기 대비 79% 급락해 해당 순위에서 중국이 1위에서 4위로 내려갔습니다. 키프로스에 대한 공격이 171% 증가하여 키프로스는 2분기에 두 번째로 많은 공격을 받은 나라가 되었습니다. 키프로스 다음에는 홍콩, 중국, 폴란드가 위치합니다.
네트워크 계층 DDoS 공격
응용 프로그램 계층 공격이 최종 사용자가 액세스하려는 서비스(우리의 경우 HTTP/S)를 구동하는 응용 프로그램(OSI 모델의 계층 7)를 대상으로 하는 반면, 네트워크 계층 공격은 네트워크 인프라(예: 인라인 라우터 및 서버)와 인터넷 링크 자체를 마비시키는 것을 목표로 합니다.
월별 네트워크 계층 DDoS 공격
2분기에 네트워크 계층 DDoS 공격은 전년 대비 75% 증가하였으며, 100Gbps 이상의 볼류메트릭 공격은 이전 분기 대비 19% 증가하였습니다.
2분기에 네트워크 계층 DDoS 공격의 총 건수는 전년 대비 75% 증가하였지만, 이전 분기와 비교할 때 큰 변화는 없었습니다. 이번 분기 들어 가장 분주했던 달은 4월로, 공격의 거의 40%가 4월에 발생하였습니다.
산업별 네트워크 계층 DDoS 공격
2분기에 이동통신 회사에 대한 공격이 이전 분기 대비 45% 증가하였습니다.
2분기 연속으로 통신 산업이 네트워크 계층 DDoS 공격의 가장 큰 목표가 되었습니다. 또한, 이동통신 회사에 대한 공격이 지난 분기 대비 45% 증가하였습니다. 게임 업계가 2위였고 정보 기술 및 서비스 회사들이 그 뒤를 이었습니다.
대상 국가별 네트워크 계층 DDoS 공격
미국 네트워크에 대한 공격은 이전 분기 대비 70% 증가했습니다.
2분기에도 미국은 가장 공격을 많이 받은 국가였습니다. 미국 다음으로는 지난 분기 4위였던 싱가포르가 2위로 상승했습니다. 3위는 독일, 그리고 그 뒤를 중국, 몰디브, 한국이 이었습니다.
수신 국가별 네트워크 계층 DDoS 공격
2분기에 Cloudflare가 팔레스타인과 아제르바이잔에서 관찰한 트래픽의 거의 1/3이 네트워크 계층 DDoS 공격이었습니다.
네트워크 계층 DDoS 공격이 어디에서 발생했는지 파악하려고 할 때 응용 프로그램 계층 공격 분석에 사용하는 방법과 같은 방법을 사용할 수는 없습니다. 응용 프로그램 계층 DDoS 공격을 시작하려면 HTTP/S 연결을 설정하기 위해 클라이언트와 서버 간에 성공적인 핸드셰이크가 발생해야 합니다. 성공적인 핸드셰이크를 발생시키려면 공격은 소스 IP 주소를 스푸핑할 수 없습니다. 공격자는 봇넷, 프록시 등의 방법을 사용하여 ID를 난독화할 수 있지만, 공격하는 클라이언트의 소스 IP 위치는 응용 프로그램 계층 DDoS 공격의 소스를 충분히 나타냅니다.
반면에 네트워크 계층 DDoS 공격을 시작하려면 대부분의 경우 핸드셰이크가 필요하지 않습니다. 공격자는 공격 소스를 난독화하고 공격 속성에 임의성을 도입하기 위해 소스 IP 주소를 스푸핑할 수 있습니다. 그럴 경우 단순한 DDoS 방어 시스템으로는 공격을 차단하기가 더 어려워질 수 있습니다. 따라서 스푸핑된 소스 IP를 기반으로 소스 국가를 파생시키면 ‘스푸핑된 국가’가 됩니다.
이러한 이유 때문에 네트워크 계층 DDoS 공격 소스를 분석할 때는 (잠재적으로) 스푸핑된 소스 IP가 아니라 트래픽이 수집된 Cloudflare 데이터 센터 위치별로 트래픽을 버킷팅하여 공격이 어디에서 발생했는지 파악합니다. 전 세계 270여 개 도시에 Cloudflare 데이터 센터가 있기 때문에 보고서에 지리적 위치를 정확하게 나타낼 수 있습니다. 그러나 이 방법도 100% 정확하지는 않습니다. 비용 절감, 혼잡, 장애 관리 등 다양한 이유로 트래픽이 백홀되고 다양한 인터넷 서비스 공급자 및 국가를 통해 라우팅될 수 있기 때문입니다.
네트워크 계층 DDoS 공격 비율이 가장 높은 Cloudflare 지역 측면에서 팔레스타인이 2위에서 1위로 상승하였습니다. 팔레스타인 다음으로는 아제르바이잔, 한국, 앙골라가 위치합니다.
공격 벡터는 공격자가 DDoS 공격을 실행하기 위해 사용하는 방법, 즉 IP 프로토콜, TCP 플래그 같은 패킷 속성, 폭주 등의 방법을 설명하는 용어입니다.
2분기에 전체 네트워크 계층 공격의 56%는 SYN 폭주 공격이었습니다. SYN 폭주는 여전히 가장 흔한 공격 방법입니다. 이 공격은 스테이트풀 TCP 핸드셰이크의 초기 연결 요청을 남용합니다. 초기 연결 요청 시에 서버에는 이 새로운 TCP 연결에 대한 어떠한 정보도 존재하지 않아 올바르게 보호되어 있지 않으면 수많은 초기 연결 요청의 폭주를 완화하는 데 어려움을 겪을 수 있습니다. 이에 따라 공격자는 보호되지 않은 서버의 리소스를 쉽게 소모시킬 수 있습니다.
DNS 인프라를 겨냥하는 SYN 폭주에 이어 TCP 연결 흐름을 남용하는 RST 폭주와 UDP를 통한 일반적인 공격이 있습니다.
새롭게 떠오르는 위협
2분기에 새로 등장한 위협으로는 CHARGEN, Ubiquiti, 멤캐시드를 통한 공격이 있었습니다.
주요 공격 벡터를 식별하면 조직에서 위협 환경을 파악하는 데 도움이 됩니다. 그에 따라 이러한 위협으로부터 보호하기 위해 조직의 보안 상태를 개선하는 데 도움이 될 수 있습니다. 마찬가지로, 아직 공격의 상당 부분을 차지하지 않는 새로운 위협에 대해 학습할 경우 해당 공격이 상당한 위력을 발휘하기 전에 공격을 완화하는 데 도움이 될 수 있습니다.
2분기에 새로 등장한 위협 상위권에는 문자 생성기 프로토콜(CHARGEN)을 남용하는 증폭 공격, 노출된 Ubiquiti 디바이스에서 트래픽을 반사하는 증폭 공격, 악명 높은 멤캐시드 공격이 있습니다.
CHARGEN 프로토콜을 남용해 증폭 공격 시행하기
2분기에는 CHARGEN 프로토콜을 남용한 공격이 이전 분기 대비 378% 증가하였습니다.
RFC 864(1983)에서 최초로 정의된 문자 생성기(CHARGEN) 프로토콜은 인터넷 프로토콜 스위트 상의 서비스로, 이름 그대로 임의의 문자를 생성하고 클라이언트가 연결을 닫기까지 해당 문자를 클라이언트에게 전송하는 것을 중지하지 않는 역할을 합니다. 이 서비스의 초기 개발 목적은 테스트와 디버깅 목적이었지만, 쉽게 남용해 증폭/반사 공격을 만들어낼 수 있기 때문에 거의 사용되지 않습니다.
공격자는 피해자의 소스 IP를 스푸핑해 전 세계에서 이 프로토콜을 지원하는 서버를 속여 임의의 문자로 이루어진 문자열을 피해자의 서버로 “되돌려보내도록” 만들 수 있습니다. 이 공격을 증폭/반사 공격이라고 합니다. 충분한 양의 CHARGEN 흐름이 존재한다면 피해자의 서버는 보호되지 않은 경우 폭주하게 되어 정상적인 트래픽을 처리할 수 없게 되며 따라서 서비스 거부 이벤트가 발생하게 됩니다.
Ubiquiti Discovery 프로토콜을 남용하는 증폭 공격
2분기에는 Ubiquity를 통한 공격이 이전 분기 대비 313% 증가했습니다.
Ubiquiti는 미국에 기반을 두고 소비자와 기업에 네트워킹 및 사물 인터넷(IoT) 장치를 제공하는 회사입니다. Ubiquiti 장비는 UDP/TCP 포트 10001를 사용해 Ubiquiti Discovery 프로토콜을 이용하는 네트워크에서 찾아볼 수 있습니다.
CHARGEN 공격 방식과 유사하게 여기에서도 공격자가 소스 IP를 피해자의 IP 주소로 스푸핑해 포트 10001이 열린 상태의 IP 주소를 살포할 수 있습니다. 이들 주소는 그 뒤 피해자의 IP에 반응해 충분한 양이 존재한다면 그 포트를 폭주하게 만듭니다.
멤캐시드 DDos 공격
2분기에 멤캐시드 DDoS 공격은 이전 분기 대비 281% 증가했습니다.
멤캐시드는 웹사이트와 네트워크의 속도를 향상시키기 위한 데이터베이스 캐싱 시스템입니다. CHARGEN과 Ubiquiti의 경우와 유사하게 UDP를 지원하는 멤캐시드 서버를 남용해 증폭/반사 DDoS 공격을 실행할 수 있습니다. 이 경우에는 공격자가 캐싱 시스템 상의 콘텐츠를 요청하고 UDP 패킷의 소스 IP를 피해자의 IP 주소로 스푸핑합니다. 이 경우 피해자는 최대 51,200배 증폭될 수 있는 멤캐시 응답으로 과부하가 걸리게 됩니다.
공격 비율별 네트워크 계층 DDoS 공격
100Gbps 이상의 볼류메트릭 공격이 지난 분기 대비 19% 증가했습니다. 3시간 이상 지속된 공격은 9% 증가했습니다.
L3/4 DDoS 공격의 규모를 측정하는 방법은 여러 가지입니다. 하나는 공격 트래픽의 양을 비트 전송률(초당 테라비트 또는 초당 기가비트 수)로 측정하는 방법입니다. 또 하나의 방법은 총 패킷의 개수를 패킷 전송률(수백만 단위의 초당 패킷 수)로 측정하는 것입니다.
비트 전송률이 높은 공격은 인터넷 링크를 포화시킴으로써 서비스 거부 이벤트를 발생시키려는 시도이며, 패킷 전송률이 높은 공격은 서버, 라우터, 기타 인라인 장비를 마비시키려는 시도입니다. 이러한 장비는 각각의 패킷을 처리하기 위해 일정량의 메모리와 연산 능력을 할당합니다. 따라서 장비에 많은 패킷을 퍼부으면 처리를 위한 리소스를 완전히 고갈시킬 수 있습니다. 이러한 경우에는 패킷의 “드롭(drop)”, 즉 해당 장비가 패킷을 처리할 수 없는 상황이 발생합니다. 그 결과 사용자는 서비스 중단 및 서비스 거부를 경험하게 됩니다.
패킷 전송률별 분포
네트워크 계층 DDoS 공격은 대부분 초당 50,000패킷 미만으로 유지됩니다. 50kpps는 Cloudflare의 규모에서는 스펙트럼의 아래쪽에 위치하지만, 여전히 보호되지 않는 인터넷 자산을 손쉽게 중단시키고 표준 기가비트 이더넷 연결까지도 혼잡하게 만들 수 있습니다.
공격 규모의 변화를 살펴보면 50kpps 이상의 패킷에 집중하는 공격 건수가 2분기에 감소해 소규모 공격 건수가 4% 증가하였음을 확인할 수 있습니다.
비트 전송률별 분포
2분기에는 네트워크 계층 DDoS 공격이 대부분 500Mbps 미만으로 유지되었습니다. 이 또한 Cloudflare의 규모에서 보면 아주 작은 티끌에 지나지 않지만, 용량이 작고 보호되지 않은 인터넷 자산을 빠르게 마비시키거나 심지어는 표준 기가비트 이더넷 연결의 경우에도 최소한 혼잡을 발생시킬 수 있습니다.
흥미롭게도 500Mbps에서 100Gbps 사이의 대규모 공격은 이전 분기 대비 20~40% 감소하였지만, 100Gbps 이상의 볼류메트릭 공격은 8% 증가하였습니다.
지속 시간별 네트워크 계층 DDoS 공격
2분기에 3시간 이상 지속된 공격은 9% 증가했습니다.
Cloudflare에서는 시스템에서 공격이 처음으로 감지 및 확인된 시점과 해당 공격 서명이 관찰된 마지막 패킷 사이의 간격을 기록하여 특정 타겟을 노리는 공격의 지속 시간을 측정합니다.
2분기에는 전체 네트워크 계층 DDoS 공격의 51%가 10분 미만 지속되었습니다. 41%는 10~20분 동안 지속되었습니다. 나머지 8%에는 20분부터 3시간 이상까지 지속된 공격이 포함됩니다.
한 가지 유의할 점은 공격이 몇 분 동안만 지속되더라도 공격이 성공하면 그 영향이 초기 공격 지속 시간보다 훨씬 더 오래 지속될 수 있다는 것입니다. 공격이 성공리에 끝나면 IT 직원은 서비스를 복구하는 데 몇 시간, 심지어 며칠까지 작업을 해야 할 수도 있습니다.
대부분의 공격은 정말 짧았지만, 20~60분 사이의 공격 건수가 15% 증가하였음을, 그리고 3시간 이상 지속된 공격은 12% 증가하였음을 확인할 수 있습니다.
짧은 공격은 감지되지 않은 채 지나갈 수 있으며, 막대한 수의 패킷, 바이트 또는 요청을 몇 초 안에 집중시켜 대상을 공격하는 버스트 공격은 특히 감지가 어렵습니다. 이 경우, 보안 분석을 통한 수동 완화에 의존하는 DDoS 방어 서비스로는 적시에 공격을 완화할 방법이 없습니다. 단지 공격 후 분석에서 이를 확인한 다음 해당 공격 지문을 필터링하는 새로운 규칙을 배포하고 다음을 기약할 수 있을 뿐입니다. 마찬가지로, 보안팀이 공격 진행 도중에 트래픽을 DDoS 공급자에게 리디렉션하는 “주문형” 서비스도 비효율적입니다. 해당 트래픽이 주문형 DDoS 공급자에게 라우팅되기 전에 이미 공격이 끝나버리기 때문입니다.
기업들에게는 트래픽을 분석하여 실시간 핑거프린팅을 빠르게 적용함으로써 단기 공격을 막아낼 수 있는 자동화된 상시 가동 DDoS 방어 서비스를 사용하는 것을 권장합니다.
요약
Cloudflare의 사명은 더 나은 인터넷 환경을 구축하는 데 힘을 보태는 것입니다. 더 나은 인터넷이란 더 안전하고 빠르며 믿을 수 있는 인터넷입니다. DDoS 공격이 발생하더라도 말입니다. 이 사명의 일환으로 2017년부터 우리는 모든 고객에게 무료로 무제한 DDoS 방어 기능을 제공하고 있습니다. 여러 해가 지나면서 공격자들이 DDoS 공격을 실행하기가 점점 더 쉬워지고 있습니다. 그렇지만 공격 실행이 더 쉬워졌을지라도, 우리는 모든 조직 역시 그 규모와 상관없이 모든 종류의 DDoS 공격에 맞서 스스로를 더 쉽게 무료로 보호할 수 있도록 하려 합니다. 아직 Cloudflare를 사용하지 않으시나요? 지금 우리의 Free 및 Pro 요금제에 가입해서 귀사의 웹 사이트를 보호하거나 당사에 문의해서 네트워크 전체에 대한 포괄적인 DDoS 방어를 제공하는 Magic Transit을 이용해 보세요.
To provide the best experiences, we use technologies like cookies to store and/or access device information. Consenting to these technologies will allow us to process data such as browsing behavior or unique IDs on this site. Not consenting or withdrawing consent, may adversely affect certain features and functions.
Functional
Always active
The technical storage or access is strictly necessary for the legitimate purpose of enabling the use of a specific service explicitly requested by the subscriber or user, or for the sole purpose of carrying out the transmission of a communication over an electronic communications network.
Preferences
The technical storage or access is necessary for the legitimate purpose of storing preferences that are not requested by the subscriber or user.
Statistics
The technical storage or access that is used exclusively for statistical purposes.The technical storage or access that is used exclusively for anonymous statistical purposes. Without a subpoena, voluntary compliance on the part of your Internet Service Provider, or additional records from a third party, information stored or retrieved for this purpose alone cannot usually be used to identify you.
Marketing
The technical storage or access is required to create user profiles to send advertising, or to track the user on a website or across several websites for similar marketing purposes.


![[Security Nation] Pete Cooper and Irene Pontisso on the Results of the UK Government’s Security Culture Challenge](https://blog.rapid7.com/content/images/2022/07/image1.jpg)
![[Security Nation] Pete Cooper and Irene Pontisso on the Results of the UK Government’s Security Culture Challenge](https://blog.rapid7.com/content/images/2022/07/irene.jpg)