Post Syndicated from Siva Guruvareddiar original https://aws.amazon.com/blogs/architecture/simulating-kubernetes-workload-az-failures-with-aws-fault-injection-simulator/
In highly distributed systems, it is crucial to ensure that applications function correctly even during infrastructure failures. One common infrastructure failure scenario is when an entire Availability Zone (AZ) becomes unavailable. Applications are often deployed across multiple AZs to ensure high availability and fault tolerance in cloud environments such as Amazon Web Services (AWS).
Kubernetes helps manage and deploy applications across multiple nodes and AZs, though it can be difficult to test how your applications will behave during an AZ failure. This is where fault injection simulators come in. The AWS Fault Injection Simulator (AWS FIS) service can intentionally inject faults or failures into a system to test its resilience. In this blog post, we will explore how to use an AWS FIS to simulate an AZ failure for Kubernetes workloads.
Solution overview
To ensure that Kubernetes cluster workloads are architected to handle failures, you must test their resilience by simulating real-world failure scenarios. Kubernetes allows you to deploy workloads across multiple AZs to handle failures, but it’s still important to test how your system behaves during AZ failures. To do this, we use a microservice for product details with the aim of running this microservice using auto-scaling with both Cluster Autoscaler (CA, from Kubernetes community) and Karpenter and test how the system responds to varying traffic levels.
This blog post explores a load test to mimic the behavior of hundreds of users accessing the service concurrently to simulate a realistic failure scenario. This test uses AWS FIS to disrupt network connectivity, and simulate AZ failure in a controlled manner. This allows us to measure how users are impacted when using CA and then with Karpenter.
Both CA and Karpenter automatically adjust the size of a cluster based on the resource requirements of the running workloads. By comparing the performance of the microservice under these two autoscaling tools, we can determine which tool is better-suited to handle such scenarios.
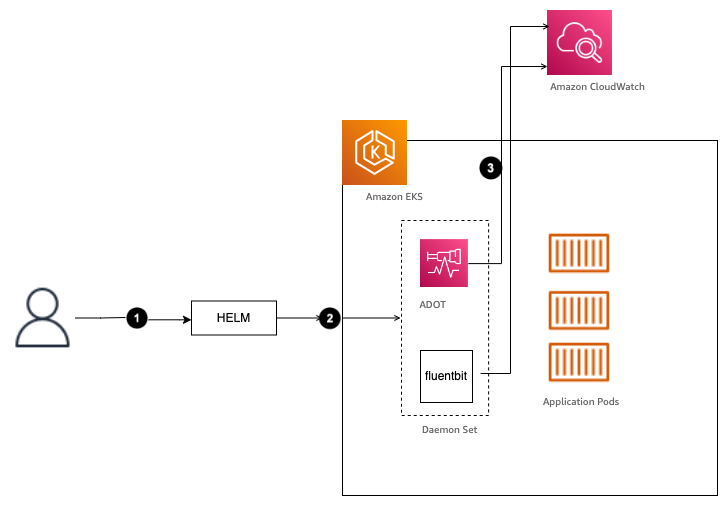
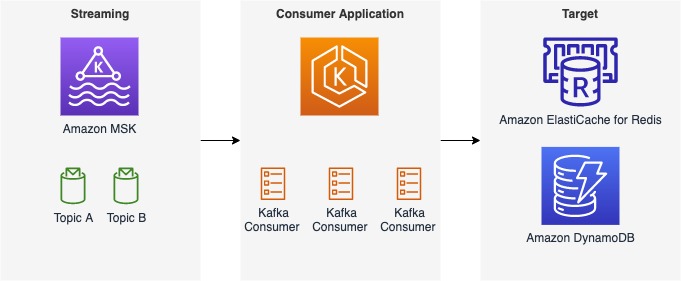
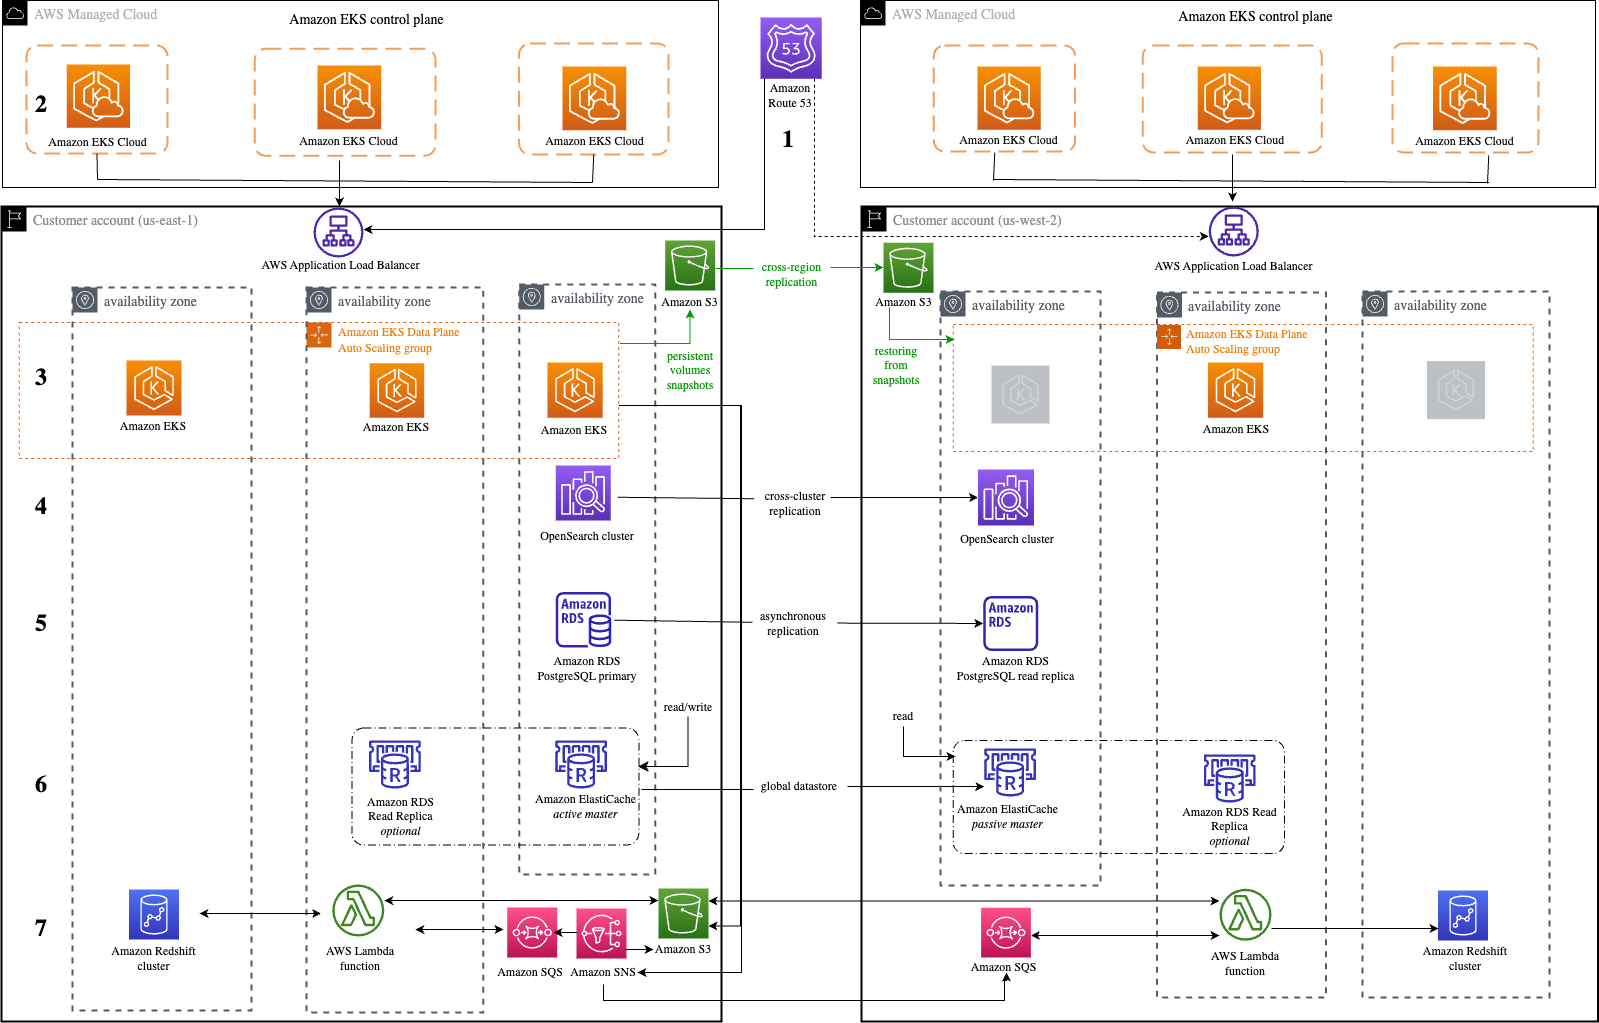
Figure 1 demonstrates the solution’s architecture.

Figure 1. Architecture flow for microservices to simulate a realistic failure scenario
Prerequisites
Install the following utilities on a Linux-based host machine, which can be an Amazon Elastic Compute Cloud (Amazon EC2) instance, AWS Cloud9 instance, or a local machine with access to your AWS account:
- AWS CLI version 2 to interact with AWS services using CLI commands
- Node.js (v16.0.0 or later) and npm (8.10.0 or later)
- AWS CDK v2.70.0 or later to build and deploy cloud infrastructure and Kubernetes resources programmatically
- Kubectl to communicate with the Kubernetes API server
- Helm to manage Kubernetes applications
- eks-node-viewer to visualize dynamic node usage within an Amazon Elastic Kubernetes Service (Amazon EKS) cluster
Setting up a microservice environment
This blog post consists of two major parts: Bootstrap and experiment. The bootstrap section provides step-by-step instructions for:
- Creating and deploying a sample microservice
- Creating an AWS IAM role for the FIS service
- Creating an FIS experiment template
By following these bootstrap instructions, you can set up your own environment to test the different autoscaling tools’ performance in Kubernetes.
In the experiment section, we showcase how the system behaves with CA, then Karpenter.
Let’s start by setting a few environment variables using the following code:
export FIS_ACCOUNT_ID=$(aws sts get-caller-identity --query 'Account' --output text)
export FIS_AWS_REGION=us-west-2
export FIS_CLUSTER_NAME="fis-simulation-cluster"
Next, clone the sample repository which contains the code for our solution:
git clone https://github.com/aws-samples/containers-blog-maelstrom.git
cd ./containers-blog-maelstrom/fis-simulation-blog
Step 1. Bootstrap the environment
This solution uses Amazon EKS for AWS Cloud Development Kit (AWS CDK) Blueprints to provision our Amazon EKS cluster.
The first step to any AWS CDK deployment is bootstrapping the environment. cdk bootstrap is an AWS Command Line Interface (AWS CLI) tool that prepares the environment with resources required by AWS CDK to perform deployments into that environment (for example, a combination of AWS account and AWS Region).
Let’s run the below commands to bootstrap your environment and install all node dependencies required for deploying the solution:
npm install
cdk bootstrap aws://$FIS_ACCOUNT_ID/$FIS_AWS_REGION
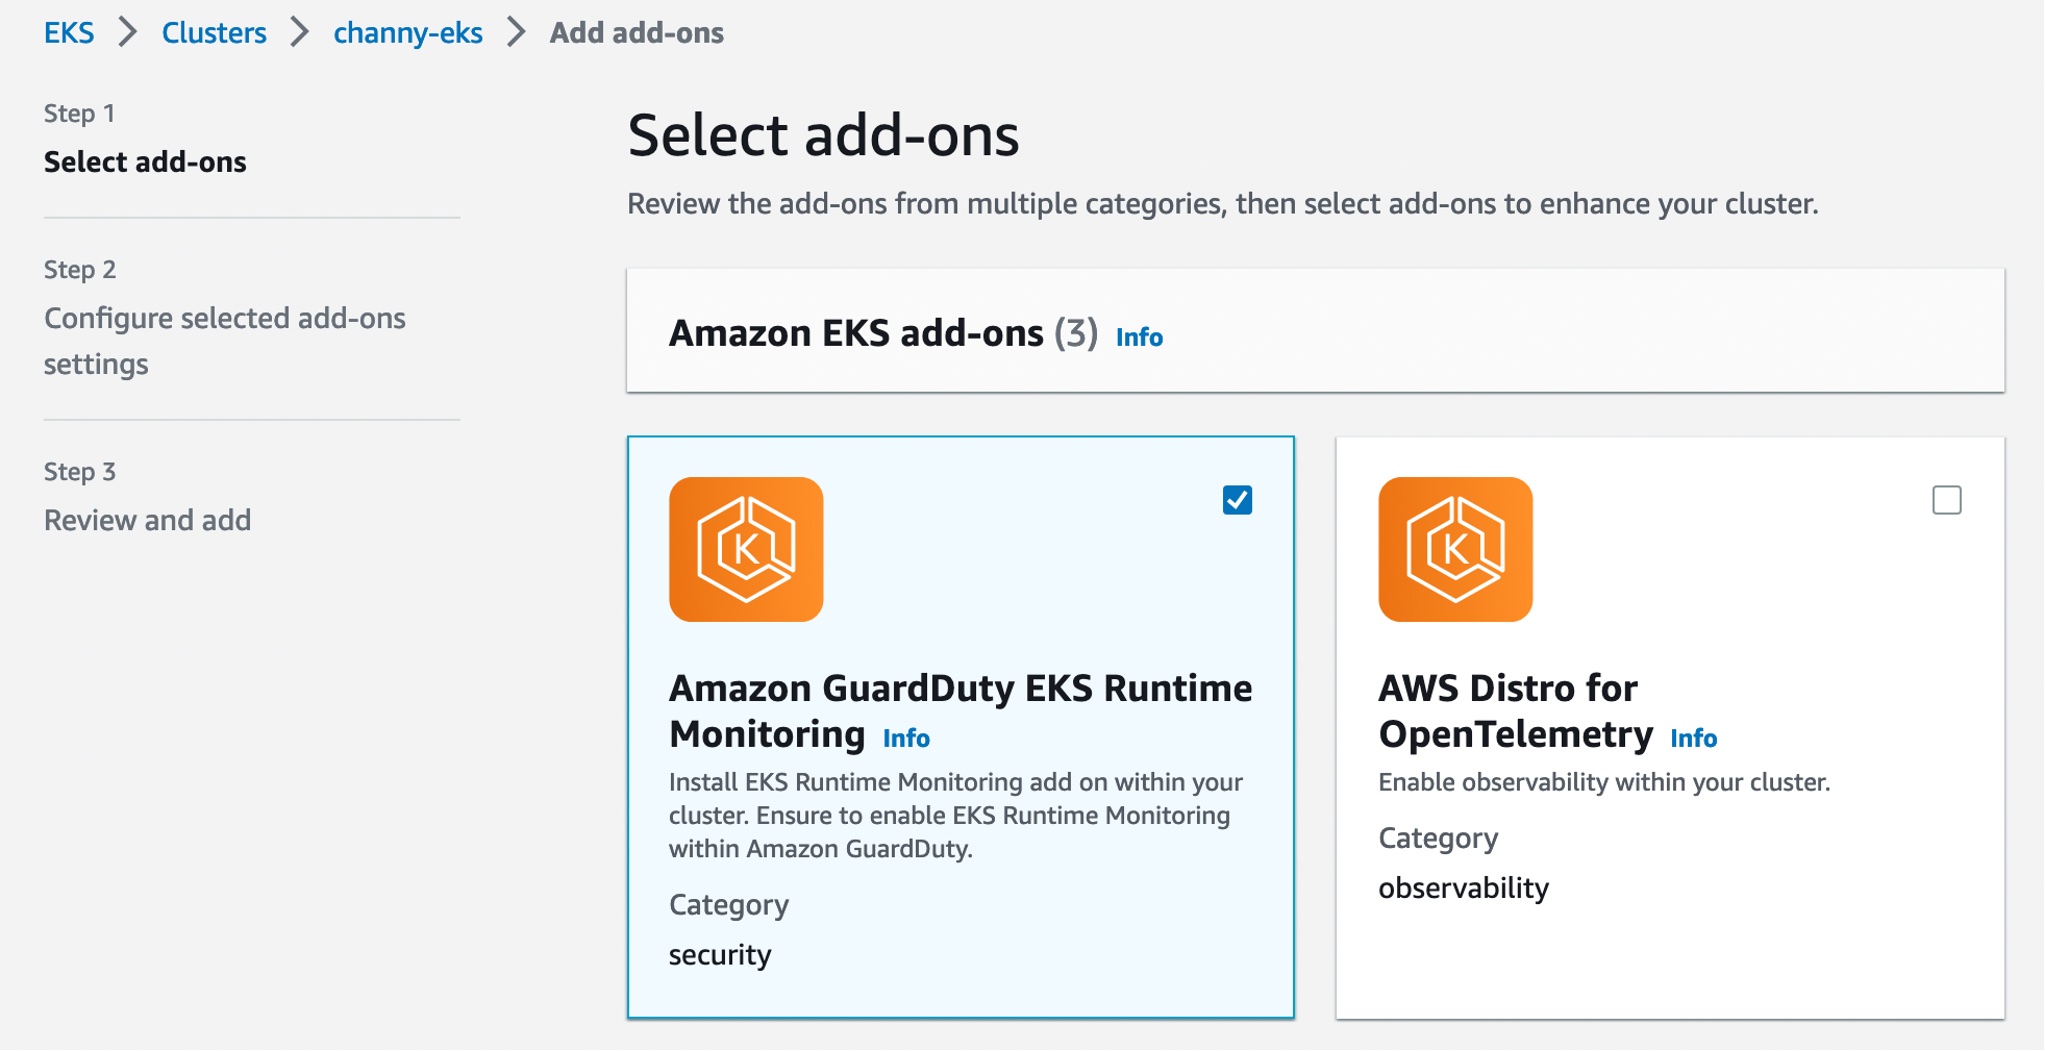
We’ll use Amazon EKS Blueprints for CDK to create an Amazon EKS cluster and deploy add-ons. This stack deploys the following add-ons into the cluster:
- AWS Load Balancer Controller
- AWS VPC CNI
- Core DNS
- Kube-proxy
Step 2. Create an Amazon EKS cluster
Run the below command to deploy the Amazon EKS cluster:
npm install
cdk deploy "*" --require-approval never
Deployment takes approximately 20-30 minutes; then you will have a fully functioning Amazon EKS cluster in your account.
fis-simulation-cluster
Deployment time: 1378.09s
Copy and run the aws eks update-kubeconfig ... command from the output section to gain access to your Amazon EKS cluster using kubectl.
Step 3. Deploy a microservice to Amazon EKS
Use the code from the following Github repository and deploy using Helm.
git clone https://github.com/aws-containers/eks-app-mesh-polyglot-demo.git
helm install workshop eks-app-mesh-polyglot-demo/workshop/helm-chart/
Note: You are not restricted to this one as a mandate. If you have other microservices, use the same. This command deploys the following three microservices:
- Frontend-node as the UI to the product catalog application
- Catalog detail backend
- Product catalog backend
To test the resiliency, let’s take one of the microservice viz productdetail, the backend microservice as an example. When checking the status of a service like the following, you will see that proddetail is of type ClusterIP, which is accessible only within the cluster. To access this outside of the cluster, perform the following steps.
kubectl get service proddetail -n workshop
NAME TYPE CLUSTER-IP EXTERNAL-IP PORT(S) AGE 5000/TCP 11h
proddetail ClusterIP 10.100.168.219 <none> 3000/TCP 11m
Create ingress class
cat <<EOF | kubectl create -f -
apiVersion: networking.k8s.io/v1
kind: IngressClass
metadata:
name: aws-alb
spec:
controller: ingress.k8s.aws/alb
EOF
Create ingress resource
cat <<EOF | kubectl create -f -
apiVersion: networking.k8s.io/v1
kind: Ingress
metadata:
namespace: workshop
name: proddtl-ingress
annotations:
alb.ingress.kubernetes.io/scheme: internet-facing
alb.ingress.kubernetes.io/target-type: ip
spec:
ingressClassName: aws-alb
rules:
- http:
paths:
- path: /
pathType: Prefix
backend:
service:
name: proddetail
port:
number: 3000
EOF
After this, your web URL is ready:
kubectl get ingress -n workshop
NAME CLASS HOSTS ADDRESS PORTS AGE
proddtl-ingress aws-alb * k8s-workshop-proddtli-166014b35f-354421654.us-west-1.elb.amazonaws.com 80 14s
Test the connectivity from your browser:

Figure 2. Testing the connectivity from your browser
Step 4. Create an IAM Role for AWS FIS
Before an AWS FIS experiment, create an IAM role. Let’s create a trust policy and attach as shown here:
cat > fis-trust-policy.json << EOF
{
"Version": "2012-10-17",
"Statement": [
{
"Effect": "Allow",
"Principal": {
"Service": [
"fis.amazonaws.com"
]
},
"Action": "sts:AssumeRole"
}
]
}
EOF
aws iam create-role --role-name my-fis-role --assume-role-policy-document file://permissons/fis-trust-policy.json
Create an AWS FIS policy and attach
aws iam attach-role-policy --role-name my-fis-role --policy-arn arn:aws:iam::aws:policy/service-role/AWSFaultInjectionSimulatorNetworkAccess
aws iam attach-role-policy --role-name my-fis-role --policy-arn arn:aws:iam::aws:policy/CloudWatchAgentServerPolicy
aws iam attach-role-policy --role-name my-fis-role --policy-arn arn:aws:iam::aws:policy/service-role/AWSFaultInjectionSimulatorEKSAccess
aws iam attach-role-policy --role-name my-fis-role --policy-arn arn:aws:iam::aws:policy/service-role/AWSFaultInjectionSimulatorEC2Access
aws iam attach-role-policy --role-name my-fis-role --policy-arn arn:aws:iam::aws:policy/service-role/AWSFaultInjectionSimulatorSSMAccess
Step 5: Create an AWS FIS experiment
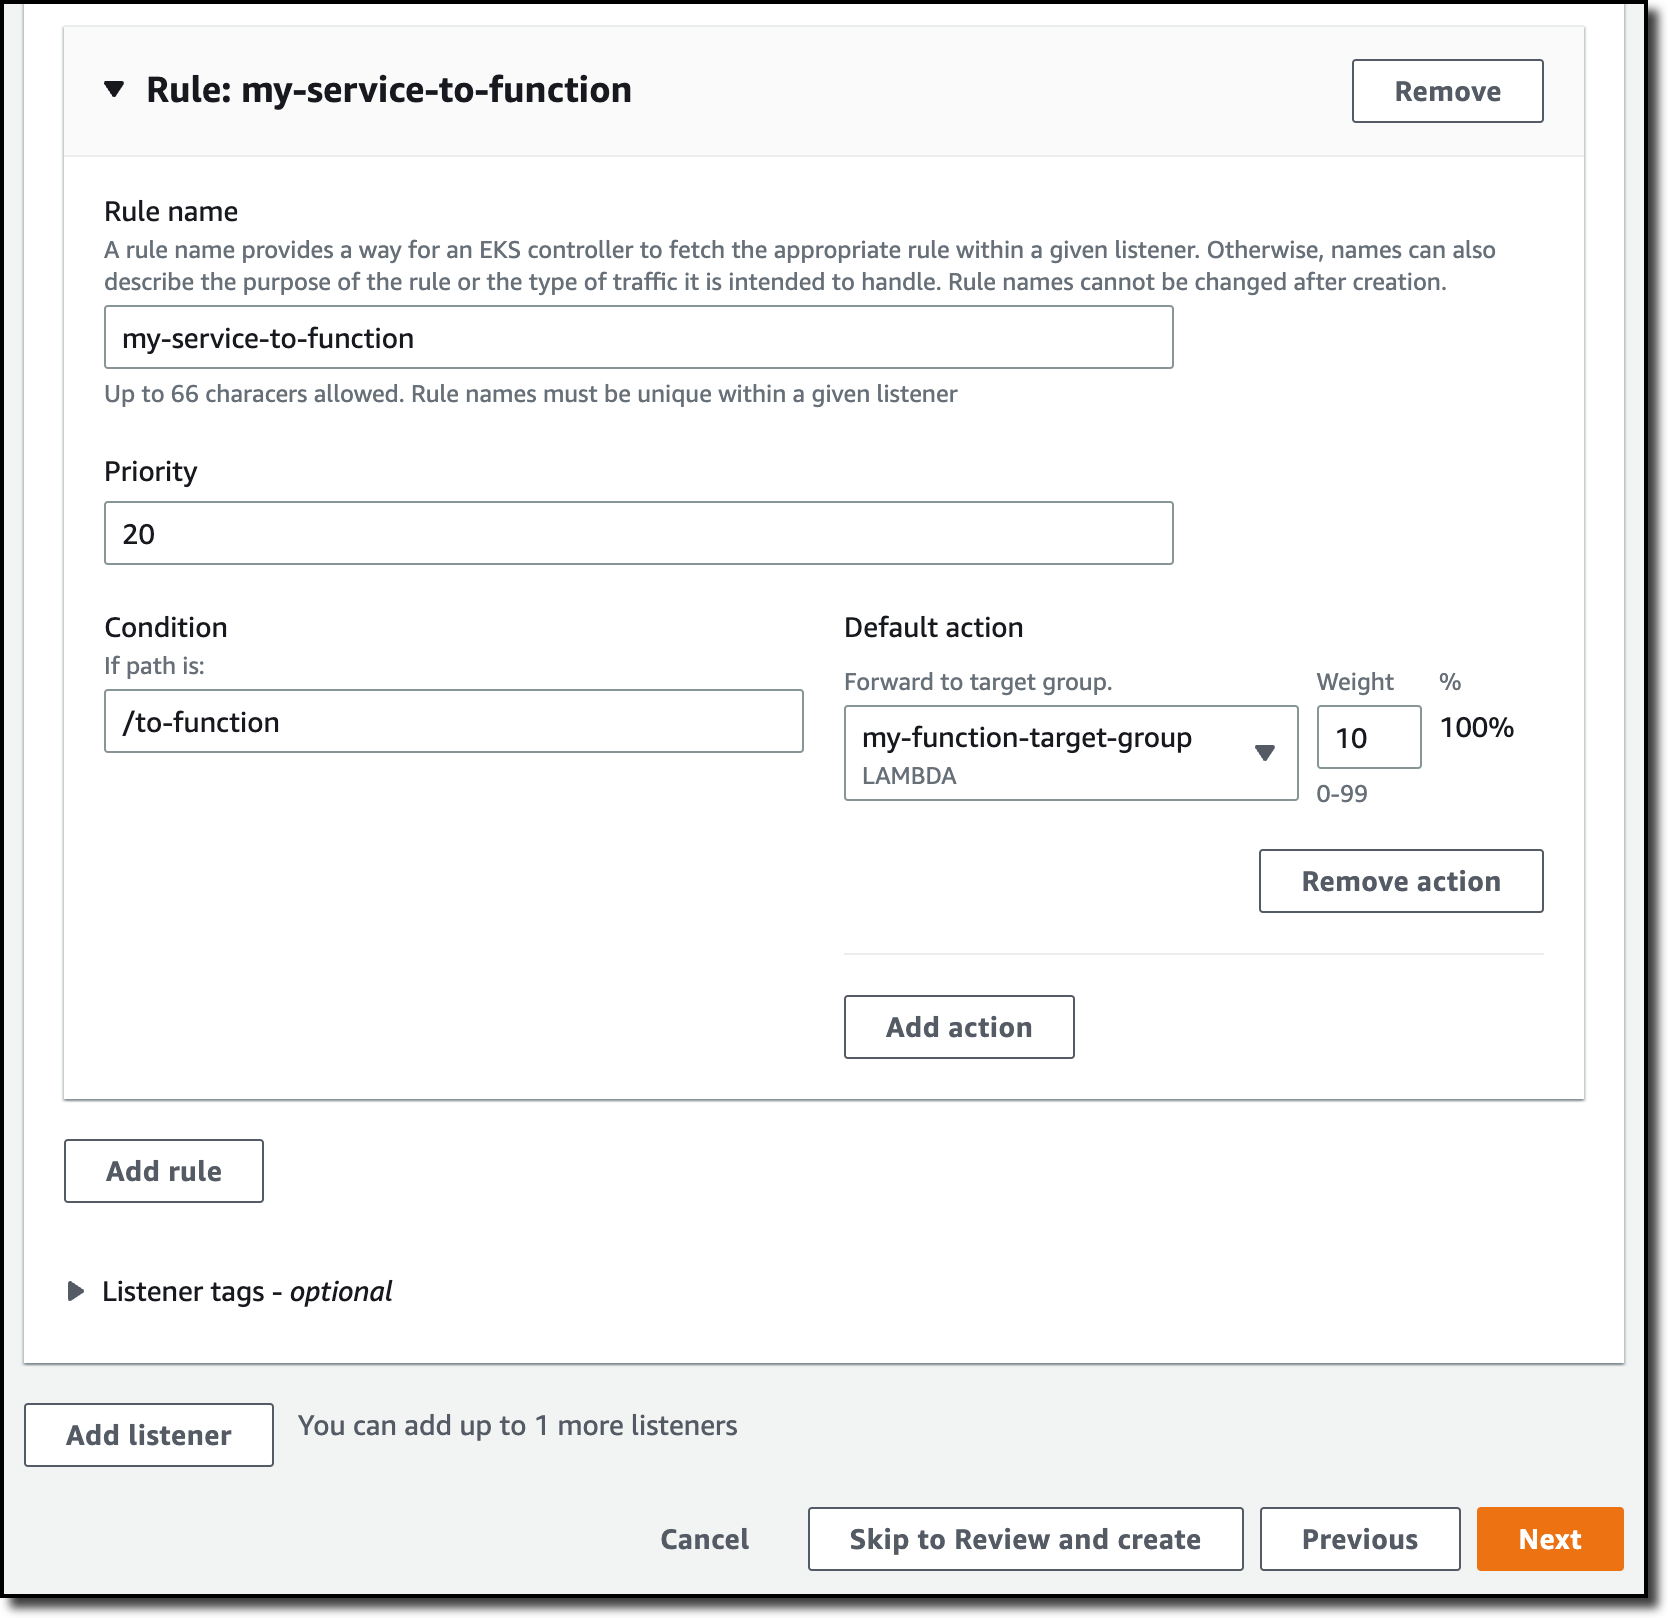
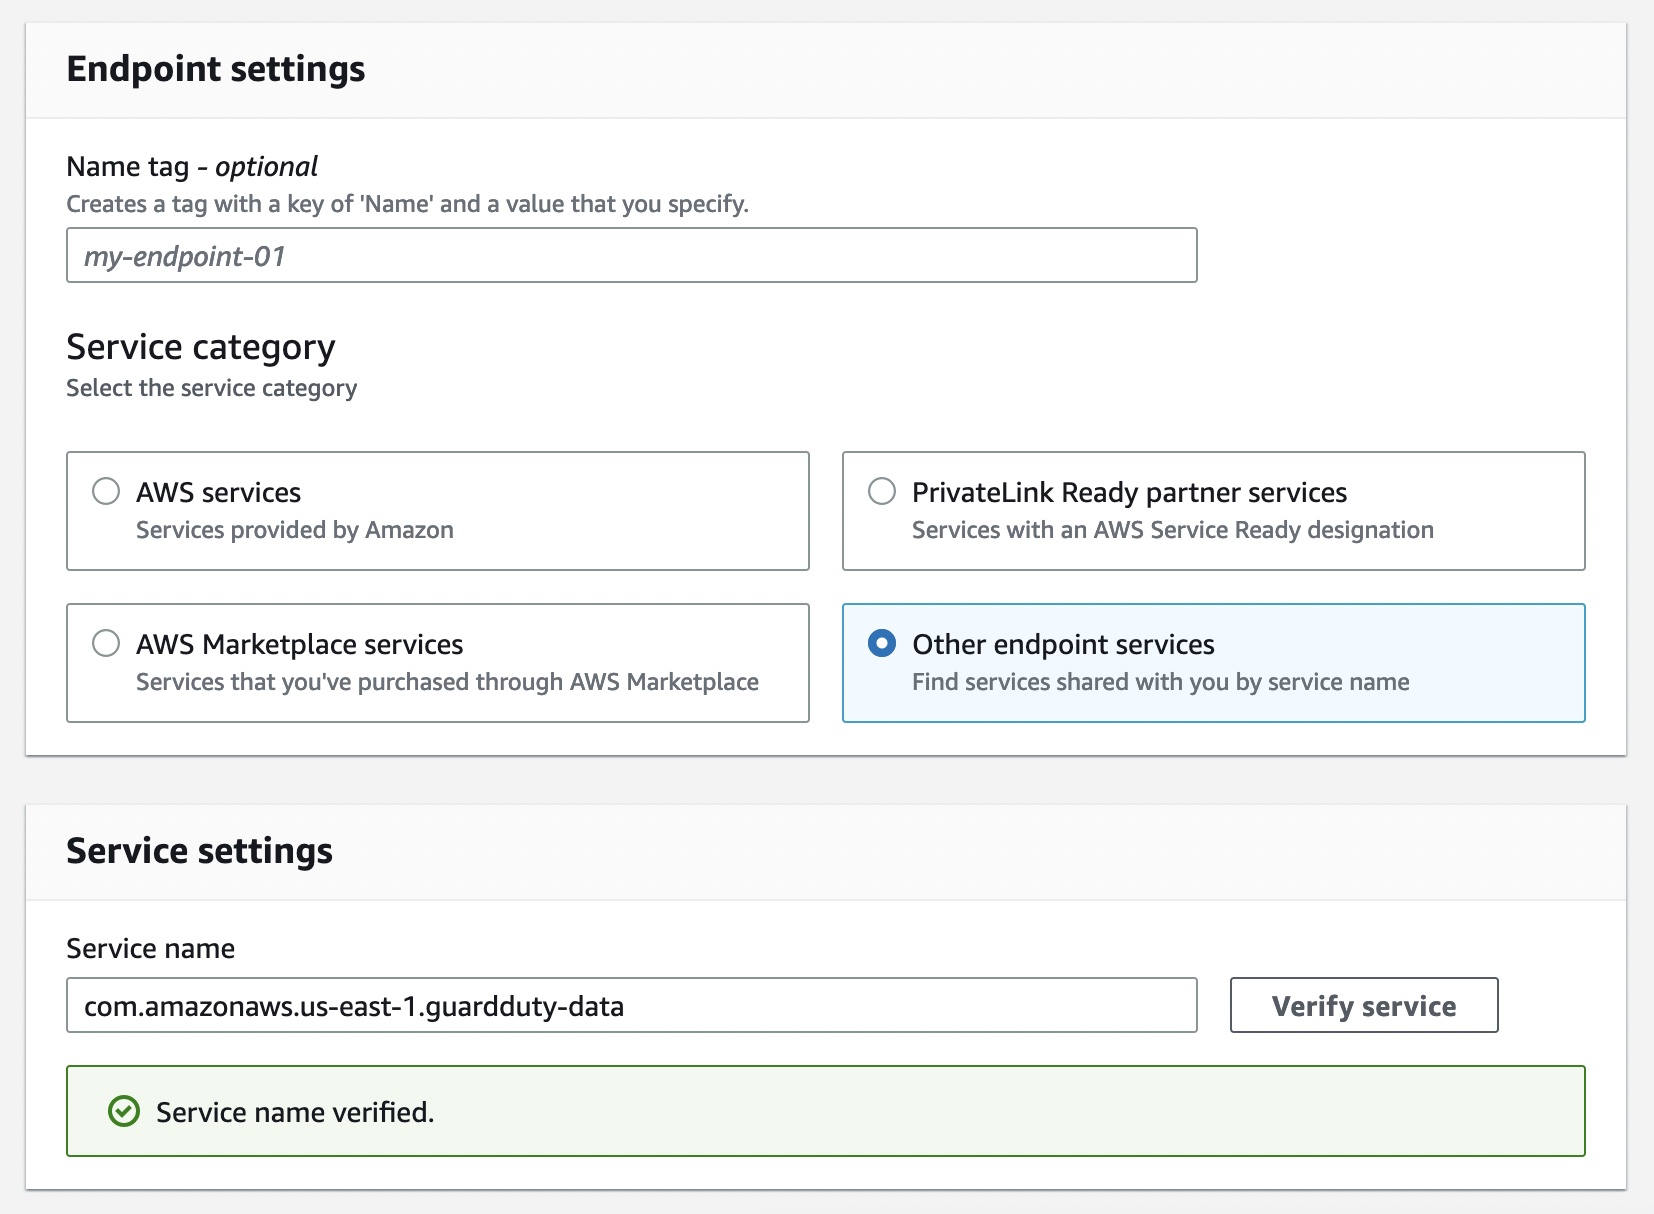
Use AWS FIS to create an experiment to disrupt the network connectivity as below. Use the following experiment template with the IAM role created from the previous step:

Figure 3. Experiment template
Step 6. Failure simulation with AWS FIS on CA and Karpenter
We’ve completed microservice setup, made it internet-accessible, and created an AWS FIS template to simulate failures. Now let’s experiment with how the system behaves with different autoscalers: CA and Karpenter.
With the microservice available within Amazon EKS cluster, we’ll use Locust to simulate user behavior with a total of 100 users trying to access the URLs concurrently.
For the following experiments, Run 1 shows 100 users trying to access the service without any system disruptions. We’ll then move to AWS FIS and disrupt network connectivity in Run 2. Measuring the user impact and comparing it to the results from the first run provides insights on how the system responds to failures and can be improved for greater reliability and performance.
Simulating failures with Cluster Autoscaler (CA)
To perform this experiment, select your experiment template and click Start experiment, then enter start in the field. Currently 12 replicas of the proddetail microservice are running.
As the following Locust charts detail, Run 1 completed without failures. Run 2 simulated network connectivity disruption, resulting in a visible failure rate of 4 percent, with a peak of 7 failures at one time.
For this experiment, we used a total of seven nodes of type t3.small. Use eks-node-viewer to visualize dynamic node usage within a cluster.

Figure 4. CA experiment results

Figure 5. Dynamic node usage within cluster
Simulating failures with Karpenter
Continuing the same experiment with 12 replicas of the proddetail microservice, this time we are using Karpenter. As in the following figures, the cluster uses a combination of t3.small and “C” and “M” instances provided in Karpenter’s provisioner configuration.
In Run 1, we observe 0 failures. In Run 2, when network connectivity was disrupted by AWS FIS, Karpenter was able to maintain user requests with almost 0 percent failure. This outcome highlights the effectiveness of Karpenter as an autoscaler for maintaining high availability by carefully configuring the provisioner.

Figure 6. Karpenter experiment results

Figure 7. Dynamic node usage within cluster
Cleanup
Use the following commands to clean up your experiment environment.
#delete Ingress resources
kubectl delete ingress proddtl-ingresss -n workshop
kubectl delete ingressclass aws-alb
#delete IAM resources
aws iam delete-role --role-name my-fis-role
#delete FIS resources
fis_template_id=`aws fis list-experiment-templates --region $FIS_AWS_REGION |jq ".experimentTemplates[0].id"`
aws fis delete-experiment-template --id $fis_template_id --region $FIS_AWS_REGION
#delete application resources and cluster
helm uninstall workshop
cdk destroy
Conclusion
This experiment results show that Karpenter performs better and recovers quicker from network disrupt connectivity than Cluster Autoscaler. The figures in this blog post highlight Karpenter’s resiliency and ability to scale and recover from failures quickly.
While this experiment provides valuable insights into the performance and reliability of Kubernetes workloads in the face of failures, it’s important to acknowledge that this is not a true test of an AZ unavailable situation. In a real-world scenario, an AZ failure can have a cascading effect, potentially impacting other services that workloads depend upon. But simulating an AZ failure in a controlled environment helps you better understand how your Kubernetes cluster and applications will behave in an actual failure scenario. This knowledge can help you identify and address any issues before they occur in production, ensuring that your applications remain highly available and resilient.
In summary, this experiment provides good insights into the performance and resilience of Kubernetes workloads. It is not a perfect representation of a real-world AZ failure, but by leveraging tools such as AWS FIS and carefully configuring autoscaling policies, you can take proactive steps to optimize performance and ensure high availability for critical applications.


 Lotfi Mouhib is a Senior Solutions Architect working for the Public Sector team with Amazon Web Services. He helps public sector customers across EMEA realize their ideas, build new services, and innovate for citizens. In his spare time, Lotfi enjoys cycling and running.
 Vara Bonthu is a dedicated technology professional and Worldwide Tech Leader for Data on EKS, specializing in assisting AWS customers ranging from strategic accounts to diverse organizations. He is passionate about open-source technologies, data analytics, AI/ML, and Kubernetes, and boasts an extensive background in development, DevOps, and architecture. Vara’s primary focus is on building highly scalable data and AI/ML solutions on Kubernetes platforms, helping customers harness the full potential of cutting-edge technology for their data-driven pursuits.


 Victor Gu is a Containers and Serverless Architect at AWS. He works with AWS customers to design microservices and cloud native solutions using Amazon EKS/ECS and AWS serverless services. His specialties are Kubernetes, Spark on Kubernetes, MLOps and DevOps.
 Michael Gasch is a Senior Product Manager for AWS EventBridge, driving innovations in event-driven architectures. Prior to AWS, Michael was a Staff Engineer at the VMware Office of the CTO, working on open-source projects, such as Kubernetes and Knative, and related distributed systems research.
 Peter Dalbhanjan is a Solutions Architect for AWS based in Herndon, VA. Peter has a keen interest in evangelizing AWS solutions and has written multiple blog posts that focus on simplifying complex use cases. At AWS, Peter helps with designing and architecting variety of customer workloads.


 AWS and Hugging Face collaborate to make generative AI more accessible and cost-efficient – This previous week, we announced an expanded collaboration between AWS and
 AWS Pi Day – Join me on March 14 for the third annual
 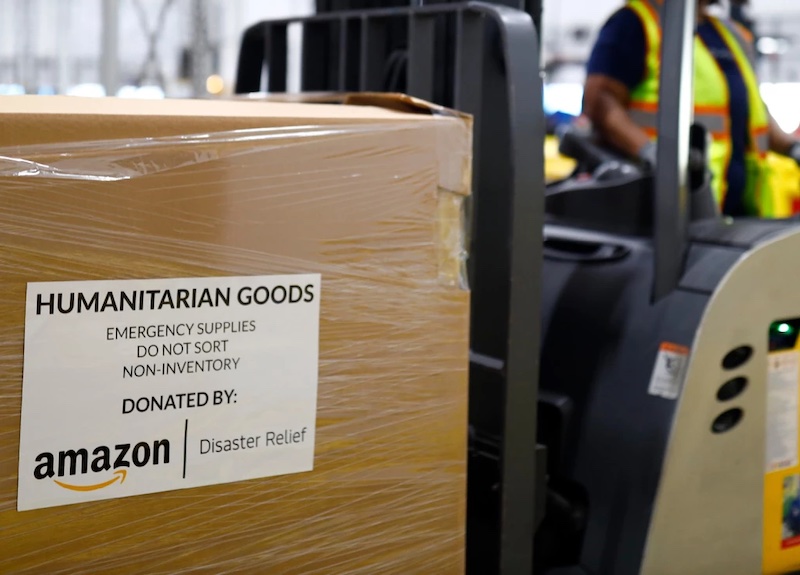 Since the devastating earthquake in Türkiye and Syria, Amazon has activated disaster relief services to quickly provide relief items to impacted areas. The company and Amazon customers have donated nearly 100,000 relief items so far, and donations continue to come in.


 Kinnar Kumar Sen is a Sr. Solutions Architect at Amazon Web Services (AWS) focusing on Flexible Compute. As a part of the EC2 Flexible Compute team, he works with customers to guide them to the most elastic and efficient compute options that are suitable for their workload running on AWS. Kinnar has more than 15 years of industry experience working in research, consultancy, engineering, and architecture.