Post Syndicated from Nima Fotouhi original https://aws.amazon.com/blogs/security/how-to-create-a-pipeline-for-hardening-amazon-eks-nodes-and-automate-updates/
Amazon Elastic Kubernetes Service (Amazon EKS) offers a powerful, Kubernetes-certified service to build, secure, operate, and maintain Kubernetes clusters on Amazon Web Services (AWS). It integrates seamlessly with key AWS services such as Amazon CloudWatch, Amazon EC2 Auto Scaling, and AWS Identity and Access Management (IAM), enhancing the monitoring, scaling, and load balancing of containerized applications. It’s an excellent choice for organizations shifting to AWS with existing Kubernetes setups because of its support for open-source Kubernetes tools and plugins.
In another blog post, I showed you how to create Amazon Elastic Container Service (Amazon ECS) hardened images using a Center for Internet Security (CIS) Docker Benchmark. In this blog post, I will show you how to enhance the security of your managed node groups using a CIS Amazon Linux benchmark for Amazon Linux 2 and Amazon Linux 2023. This approach will help you align with organizational or regulatory security standards.
Overview of CIS Amazon Linux Benchmarks
Security experts develop CIS Amazon Linux Benchmarks collaboratively, providing guidelines to enhance the security of Amazon Linux-based images. Through a consensus-based process that includes input from a global community of security professionals, these benchmarks are comprehensive and reflective of current cybersecurity challenges and best practices.
When running your container workloads on Amazon EKS, it’s essential to understand the shared responsibility model to clearly know which components fall under your purview to secure. This awareness is essential because it delineates the security responsibilities between you and AWS; although AWS secures the infrastructure, you are responsible for protecting your applications and data. Applying CIS benchmarks to Amazon EKS nodes represents a strategic approach to security enhancements, operational optimizations, and considerations for container host security. This strategy includes updating systems, adhering to modern cryptographic policies, configuring secure filesystems, and disabling unnecessary kernel modules among other recommendations.
Before implementing these benchmarks, I recommend conducting a thorough threat analysis to identify security risks within your environment. This proactive step makes sure that the application of CIS benchmarks is targeted and effective, addressing specific vulnerabilities and threats. Understanding the unique risks in your environment allows you to use the benchmarks strategically to mitigate these risks. This approach helps you to not blindly implement the benchmarks, but to interpret and use them intelligently, tailoring your application to best suit their specific needs. CIS benchmarks should be viewed as a critical tool in your security toolbox, intended for use alongside a broader understanding of your cybersecurity landscape. This balanced and informed application verifies an effective security posture, emphasizing that while CIS benchmarks are an excellent starting point, understanding your environment’s specific security risks is equally important for a comprehensive security strategy.
The benchmarks are widely available, enabling organizations of any size to adopt security measures without significant financial outlays. Furthermore, applying the CIS benchmarks aids in aligning with various security and privacy regulations such as National Institute of Standards and Technology (NIST), Health Insurance Portability and Accountability Act (HIPAA), and Payment Card Industry Data Security Standard (PCI DSS), simplifying compliance efforts.
In this solution, you’ll be implementing the recommendations outlined in the CIS Amazon Linux 2 Benchmark v2.0.0 or Amazon Linux 2023 v1.0.0. To apply the Benchmark’s guidance, you’ll use the Ansible role for the Amazon Linux 2 CIS Baseline, and the Ansible role for Amazon2023 CIS Baseline provided by Ansible Lockdown.
Solution overview
EC2 Image Builder is a fully managed AWS service designed to automate the creation, management and deployment of secure, up-to-date base images. In this solution, we’ll use Image Builder to apply the CIS Amazon Linux Benchmark to an Amazon EKS-optimized Amazon Machine Image (AMI). The resulting AMI will then be used to update your EKS clusters’ node groups. This approach is customizable, allowing you to choose specific security controls to harden your base AMI. However, it’s advisable to review the specific controls offered by this solution and consider how they may interact with your existing workloads and applications to maintain seamless integration and uninterrupted functionality.
Therefore, it’s crucial to understand each security control thoroughly and select those that align with your operational needs and compliance requirements without causing interference.
Additionally, you can specify cluster tags during the deployment of the AWS CloudFormation template. These tags help filter EKS clusters included in the node group update process. I have provided an CloudFormation template to facilitate the provisioning of the necessary resources.

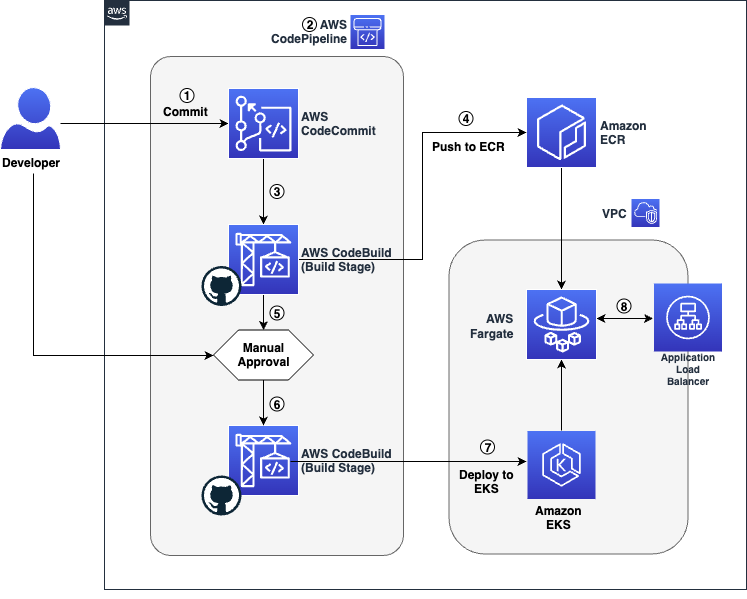
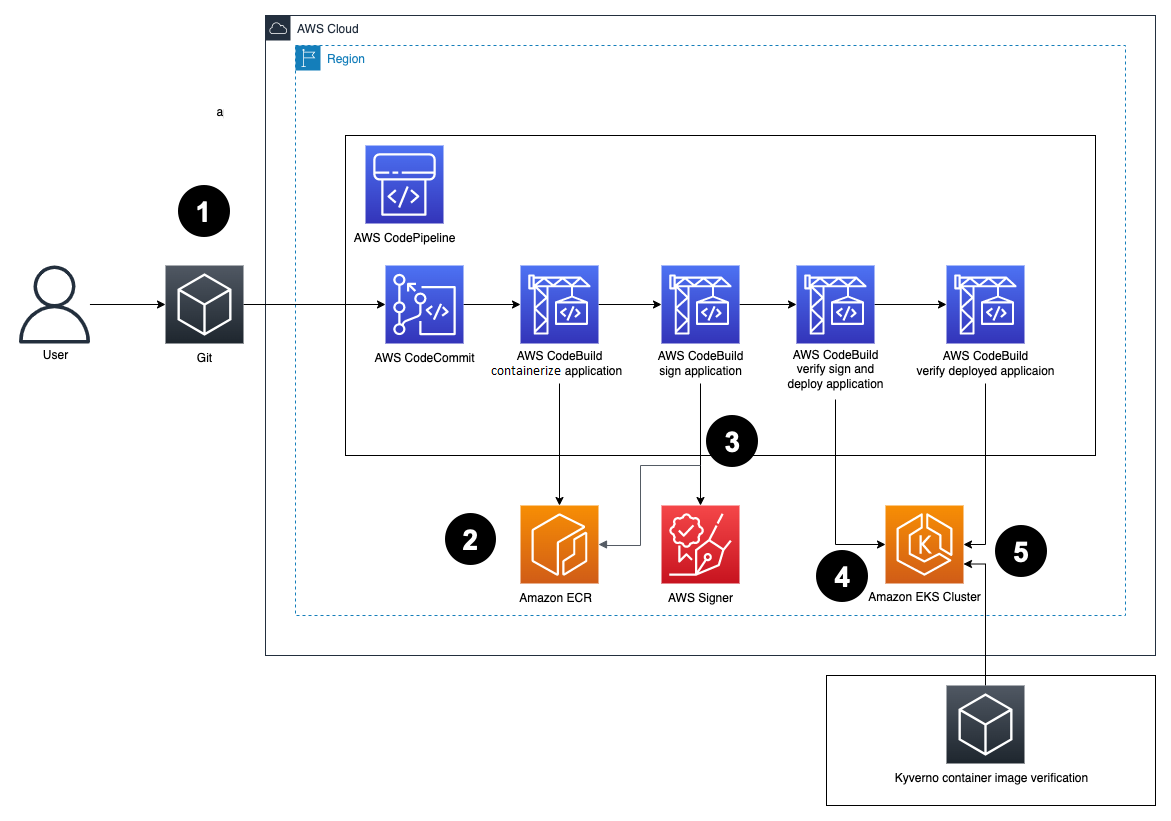
Figure 1: Amazon EKS node group update workflow
As shown in Figure 1, the solution involves the following steps:
- Image Builder
- The AMI image pipeline clones the Ansible role from the GitHub base on the parent image you specify in the CloudFormation template and applies the controls to the base image.
- The pipeline publishes the hardened AMI.
- The pipeline validates the benchmarks applied to the base image and publishes the results to an Amazon Simple Storage Service (Amazon S3) bucket. It also invokes Amazon Inspector to run a vulnerability scan on the published image.
- State machine initiation
- When the AMI is successfully published, the pipeline publishes a message to the AMI status Amazon Simple Notification Service (Amazon SNS) topic. The SNS topic invokes the State machine initiation AWS Lambda function.
- The State machine initiation Lambda function extracts the image ID of the published AMI and uses it as the input to initiate the state machine.
- State machine
- The first state gathers information related to Amazon EKS clusters’ node groups. It creates a new launch template version with the hardened AMI image ID for the node groups that are launched with custom launch template.
- The second state uses the new launch template to initiate a node group update on EKS clusters’ node groups.
- Image update reminder
- A weekly scheduled rule invokes the Image update reminder Lambda function.
- The Image update reminder Lambda function retrieves the value for LatestEKSOptimizedAMI from the CloudFormation template and extracts the last modified date of the Amazon EKS-optimized AMI used as the parent image in the Image Builder pipeline. It compares the last modified date of the AMI with the creation date of the latest AMI published by the pipeline. If a new base image is available, it publishes a message to the Image update reminder SNS topic.
- The Image update reminder SNS topic sends a message to subscribers notifying them of a new base image. You need to create a new version of your image recipe to update it with the new AMI.
Prerequisites
To follow along with this walkthrough, make sure that you have the following prerequisites in place or the CloudFormation deployment might fail:
- An AWS account
- Permission to create required resources
- An existing EKS cluster with one or more managed node groups deployed with your own launch template
- AWS Command Line Interface (AWS CLI) installed
- Amazon Inspector for Amazon Elastic Compute Cloud (Amazon EC2) enabled in your AWS account
- Have the AWSServiceRoleForImageBuilder service-linked role enabled in your account
Walkthrough
To deploy the solution, complete the following steps.
Step 1: Download or clone the repository
The first step is to download or clone the solution’s repository.
To download the repository
- Go to the main page of the repository on GitHub.
- Choose Code, and then choose Download ZIP.
To clone the repository
- Make sure that you have Git installed.
- Run the following command in your terminal:
git clone https://github.com/aws-samples/pipeline-for-hardening-eks-nodes-and-automating-updates.git
Step 2: Create the CloudFormation stack
In this step, deploy the solution’s resources by creating a CloudFormation stack using the provided CloudFormation template. Sign in to your account and choose an AWS Region where you want to create the stack. Make sure that the Region you choose supports the services used by this solution. To create the stack, follow the steps in Creating a stack on the AWS CloudFormation console. Note that you need to provide values for the parameters defined in the template to deploy the stack. The following table lists the parameters that you need to provide.
| Parameter | Description |
| AnsiblePlaybookArguments | Ansible-playbook command arguments. |
| CloudFormationUpdaterEventBridgeRuleState | Amazon EventBridge rule that invokes the Lambda function that checks for a new version of the Image Builder parent image. |
| ClusterTags | Tags in JSON format to filter the EKS clusters that you want to update.
[{“tag”= “value”}] |
| ComponentName | Name of the Image Builder component. |
| DistributionConfigurationName | Name of the Image Builder distribution configuration. |
| EnableImageScanning | Choose whether to enable Amazon Inspector image scanning. |
| ImagePipelineName | Name of the Image Builder pipeline. |
| InfrastructureConfigurationName | Name of the Image Builder infrastructure configuration. |
| InstanceType | Image Builder infrastructure configuration EC2 instance type. |
| LatestEKSOptimizedAMI | EKS-optimized AMI parameter name. For more information, see Retrieving Amazon EKS optimized Amazon Linux AMI IDs. |
| RecipeName | Name of the Image Builder recipe. |
Note: To make sure that the AWS Task Orchestrator and Executor (AWSTOE) application functions correctly within Image Builder, and to enable updated nodes with the hardened image to join your EKS cluster, it’s necessary to pass the following minimum Ansible parameters:
- Amazon Linux 2:
- Amazon Linux 2023:
Step 3: Set up Amazon SNS topic subscribers
Amazon Simple Notification Service (Amazon SNS) is a web service that coordinates and manages the sending and delivery of messages to subscribing endpoints or clients. An SNS topic is a logical access point that acts as a communication channel.
The solution in this post creates two Amazon SNS topics to keep you informed of each step of the process. The following is a list of the topics that the solution creates and their purpose.
- AMI status topic – a message is published to this topic upon successful creation of an AMI.
- Image update reminder topic – a message is published to this topic if a newer version of the base Amazon EKS-optimized AMI is published by AWS.
You need to manually modify the subscriptions for each topic to receive messages published to that topic.
To modify the subscriptions for the topics created by the CloudFormation template
- Sign in to the AWS Management Console and go to the Amazon SNS console.
- In the left navigation pane, choose Subscriptions.
- On the Subscriptions page, choose Create subscription.
- On the Create subscription page, in the Details section, do the following:
- For Topic ARN, choose the Amazon Resource Name (ARN) of one of the topics that the CloudFormation topic created.
- For Protocol, choose Email.
- For Endpoint, enter the endpoint value. In this example, the endpoint is an email address, such as the email address of a distribution list.
- Choose Create subscription.
- Repeat the preceding steps for the other topic.
Step 4: Run the pipeline
The Image Builder pipeline that the solution creates consists of an image recipe with one component, an infrastructure configuration, and a distribution configuration. I’ve set up the image recipe to create an AMI, select a parent image, and choose components. There’s only one component where building and testing steps are defined. For the building step, the solution applies the CIS Amazon Linux 2 Benchmark Ansible playbook and cleans up the unnecessary files and folders. In the test step, the solution runs Amazon Inspector, a continuous assessment service that scans your AWS workloads for software vulnerabilities and unintended network exposure, and Audit configuration for Amazon Linux 2 CIS. Optionally, you can create your own components and associate them with the image recipe to make further modifications to the base image.
You will need to manually run the pipeline by using either the console or AWS CLI.
To run the pipeline (console)
- Open the EC2 Image Builder console.
- From the pipeline details page, choose the name of your pipeline.
- From the Actions menu at the top of the page, select Run pipeline.
To run the pipeline (AWS CLI)
- You have two options to retrieve the ARN of the pipeline created by this solution:
- Using the CloudFormation console:
- On the Stacks page of the CloudFormation console, select the stack name. CloudFormation displays the stack details for the selected stack.
- From the stack output pane, note ImagePipelineArn.
- Using AWS CLI:
- Make sure that you have properly configured your AWS CLI.
- Run the following command. Replace <pipeline region> with your own information.
- From the list of pipelines, find the pipeline named EKS-AMI-hardening-Pipeline and note the pipeline ARN, which you will use in the next step.
- Using the CloudFormation console:
- Run the pipeline. Make sure to replace <pipeline arn> and <region> with your own information.
The following is a process overview of the image hardening and instance refresh:
- Image hardening – when you start the pipeline, Image Builder creates the required infrastructure to build your AMI, applies the Ansible role (CIS Amazon Linux 2 or Amazon Linux 2023 Benchmark) to the base AMI, and publishes the hardened AMI. A message is published to the AMI status topic as well.
- Image testing – after publishing the AMI, Image Builder scans the newly created AMI with Amazon Inspector and reports the findings back. For Amazon Linux 2 parent images, It also runs Audit configuration for Amazon Linux 2 CIS to verify the changes that the Ansible role made to the base AMI and publishes the results to an S3 bucket.
- State machine initiation – after a new AMI is successfully published, the AMI status topic invokes the State machine initiation Lambda function. The Lambda function invokes the EKS node group update state machine and passes on the AMI info.
- Update node groups – the EKS update node group state machine has two steps:
- Gathering node group information – a Lambda function gathers information regarding EKS clusters and their associated Amazon EC2 managed node groups. It only selects and processes node groups launched with custom launch templates that are in Active state. For each node group, the Lambda function creates a new launch template version including the hardened AMI ID published by the pipeline, and user data including bootstrap.sh arguments required for bootstrapping. View Customizing managed nodes with launch templates to learn more about requirements of specifying an AMI ID in the imageId field of EKS node group’s launch template. When you create the CloudFormation stack, if you pass a tag or a list of tags, only clusters with matching tags are processed in this step.
- Node group update – the state machine uses the output of the first Lambda function (first state) and starts updating node groups in parallel (second state).
This solution also creates an EventBridge rule that’s invoked weekly. This rule invokes the Image update reminder Lambda function and notifies you if a new version of your base AMI has been published by AWS so that you can run the pipeline and update your hardened AMI. You can check this EventBridge rule by getting it’s Physical ID on the CloudFormation Resources output, identified by ImageUpdateReminderEventBridgeRule.
After the build is finished the Image status will transition to Available in the EC2 Image Builder console, and you will be able to check the new AMI details by choosing the version link, and validate the security findings. The image will then be ready to be distributed across your environment.
Conclusion
In this blog post, I showed you how to create a workflow to harden Amazon EKS-optimized AMIs by using the CIS Amazon Linux 2 or Amazon Linux 2023 Benchmark and to automate the update of EKS node groups. This automated workflow has several advantages. First, it helps ensure a consistent and standardized process for image hardening, reducing potential human errors and inconsistencies. By automating the entire process, you can apply security and compliance standards across your instances. Second, the tight integration with AWS Step Functions enables smooth, orchestrated updates to the EKS node groups, enhancing the reliability and predictability of deployments. This automation also reduces manual intervention, helping you save time so that your teams can focus on more value-driven tasks. Moreover, this systematic approach helps to enhance the security posture of your Amazon EKS workloads because you can address vulnerabilities rapidly and systematically, helping to keep the environment resilient against potential threats.
If you have feedback about this post, submit comments in the Comments section below. If you have questions about this post, contact AWS Support.
 Kinnar Kumar Sen is a Sr. Solutions Architect at Amazon Web Services (AWS) focusing on Flexible Compute. As a part of the EC2 Flexible Compute team, he works with customers to guide them to the most elastic and efficient compute options that are suitable for their workload running on AWS. Kinnar has more than 15 years of industry experience working in research, consultancy, engineering, and architecture.
 Alex Lines is a Principal Containers Specialist at AWS helping customers modernize their Data and ML applications on Amazon EKS.
 Mengfei Wang is a Software Development Engineer specializing in building large-scale, robust software infrastructure to support big data demands on containers and Kubernetes within the EMR on EKS team. Beyond work, Mengfei is an enthusiastic snowboarder and a passionate home cook.
 Jerry Zhang is a Software Development Manager in AWS EMR on EKS. His team focuses on helping AWS customers to solve their business problems using cutting-edge data analytics technology on AWS infrastructure.


 AWS Summits – Join free online and in-person events that bring the cloud computing community together to connect, collaborate, and learn about AWS. Register in your nearest city:


 Ulrich Hinze is a Solutions Architect at AWS. He partners with software companies to architect and implement cloud-based solutions on AWS. Before joining AWS, he worked for AWS customers and partners in software engineering, consulting, and architecture roles for 8+ years.
 Patrick Oberherr is a Staff Data Engineer at Contentful with 4+ years of working with AWS and 10+ years in the Data field. At Contentful he is responsible for infrastructure and operations of the data stack which is hosted on AWS.
 Johannes Günther is a cloud & data consultant at Netlight with 5+ years of working with AWS. He has helped clients across various industries designing sustainable cloud platforms and is AWS certified.