Post Syndicated from Somdeb Bhattacharjee original https://aws.amazon.com/blogs/big-data/implement-a-custom-subscription-workflow-for-unmanaged-amazon-s3-assets-published-with-amazon-datazone/
Organizational data is often fragmented across multiple lines of business, leading to inconsistent and sometimes duplicate datasets. This fragmentation can delay decision-making and erode trust in available data. Amazon DataZone, a data management service, helps you catalog, discover, share, and govern data stored across AWS, on-premises systems, and third-party sources. Although Amazon DataZone automates subscription fulfillment for structured data assets—such as data stored in Amazon Simple Storage Service (Amazon S3), cataloged with the AWS Glue Data Catalog, or stored in Amazon Redshift—many organizations also rely heavily on unstructured data. For these customers, extending the streamlined data discovery and subscription workflows in Amazon DataZone to unstructured data, such as files stored in Amazon S3, is critical.
For example, Genentech, a leading biotechnology company, has vast sets of unstructured gene sequencing data organized across multiple S3 buckets and prefixes. They need to enable direct access to these data assets for downstream applications efficiently, while maintaining governance and access controls.
In this post, we demonstrate how to implement a custom subscription workflow using Amazon DataZone, Amazon EventBridge, and AWS Lambda to automate the fulfillment process for unmanaged data assets, such as unstructured data stored in Amazon S3. This solution enhances governance and simplifies access to unstructured data assets across the organization.
Solution overview
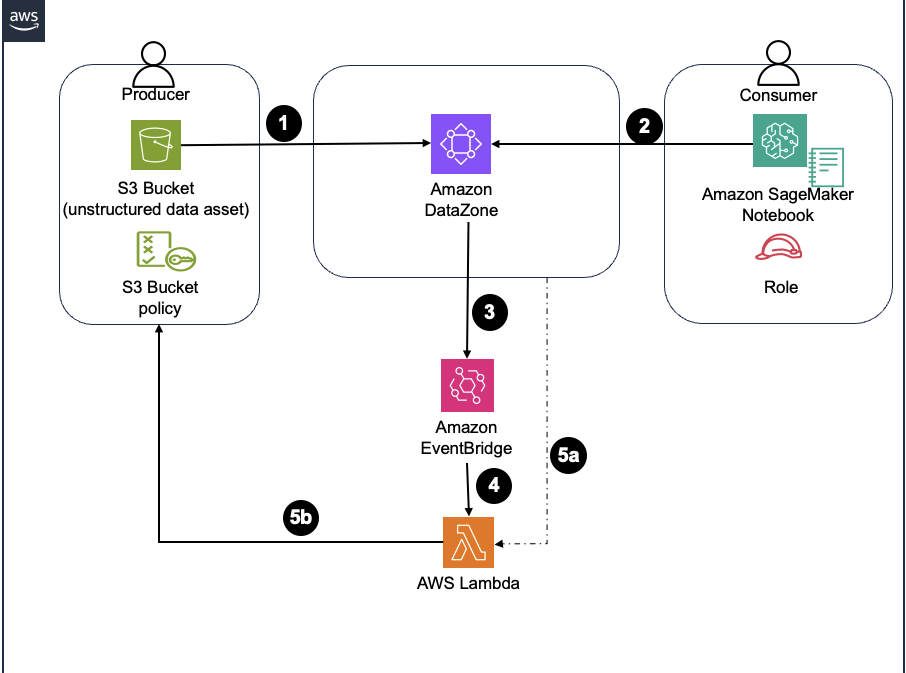
For our use case, the data producer has unstructured data stored in S3 buckets, organized with S3 prefixes. We want to publish this data to Amazon DataZone as discoverable S3 data. On the consumer side, users need to search for these assets, request subscriptions, and access the data within an Amazon SageMaker notebook, using their own custom AWS Identity and Access Management (IAM) roles.
The proposed solution involves creating a custom subscription workflow that uses the event-driven architecture of Amazon DataZone. Amazon DataZone keeps you informed of key activities (events) within your data portal, such as subscription requests, updates, comments, and system events. These events are delivered through the EventBridge default event bus.
An EventBridge rule captures subscription events and invokes a custom Lambda function. This Lambda function contains the logic to manage access policies for the subscribed unmanaged asset, automating the subscription process for unstructured S3 assets. This approach streamlines data access while ensuring proper governance.
To learn more about working with events using EventBridge, refer to Events via Amazon EventBridge default bus.
The solution architecture is shown in the following screenshot.

Custom subscription workflow architecture diagram
To implement the solution, we complete the following steps:
- As a data producer, publish an unstructured S3 based data asset as S3ObjectCollectionType to Amazon DataZone.
- For the consumer, create a custom AWS service environment in the consumer Amazon DataZone project and add a subscription target for the IAM role attached to a SageMaker notebook instance. Now, as a consumer, request access to the unstructured asset published in the previous step.
- When the request is approved, capture the subscription created event using an EventBridge rule.
- Invoke a Lambda function as the target for the EventBridge rule and pass the event payload to it:
- The Lambda function does 2 things:
- Fetches the asset details, including the Amazon Resource Name (ARN) of the S3 published asset and the IAM role ARN from the subscription target.
- Uses the information to update the S3 bucket policy granting List/Get access to the IAM role.
Prerequisites
To follow along with the post, you should have an AWS account. If you don’t have one, you can sign up for one.
For this post, we assume you know how to create an Amazon DataZone domain and Amazon DataZone projects. For more information, see Create domains and Working with projects and environments in Amazon DataZone.
Also, for simplicity, we use the same IAM role for the Amazon DataZone admin (creating domains) as well the producer and consumer personas.
Publish unstructured S3 data to Amazon DataZone
We have uploaded some sample unstructured data into an S3 bucket. This is the data that will be published to Amazon DataZone. You can use any unstructured data, such as an image or text file.

On the Properties tab of the S3 folder, note the ARN of the S3 bucket prefix.

Complete the following steps to publish the data:
- Create an Amazon DataZone domain in the account and navigate to the domain portal using the link for Data portal URL.

- Create a new Amazon DataZone project (for this post, we name it unstructured-data-producer-project) for publishing the unstructured S3 data asset.
- On the Data tab of the project, choose Create data asset.

- Enter a name for the asset.
- For Asset type, choose S3 object collection.
- For S3 location ARN, enter the ARN of the S3 prefix.

After you create the asset, you can add glossaries or metadata forms, but it’s not necessary for this post. You can publish the data asset so it’s now discoverable within the Amazon DataZone portal.
Set up the SageMaker notebook and SageMaker instance IAM role
Create an IAM role which will be attached to the SageMaker notebook instance. For the trust policy, allow SageMaker to assume this role and leave the Permissions tab blank. We refer to this role as the instance-role throughout the post.

Next, create a SageMaker notebook instance from the SageMaker console. Attach the instance-role to the notebook instance.

Set up the consumer Amazon DataZone project, custom AWS service environment, and subscription target
Complete the following steps:
- Log in to the Amazon DataZone portal and create a consumer project (for this post, we call it
custom-blueprint-consumer-project), which will used by the consumer persona to subscribe to the unstructured data asset.

We use the recently launched custom blueprints for AWS services for creating the environment in this consumer project. The custom blueprint allows you to bring your own environment IAM role to integrate your existing AWS resources with Amazon DataZone. For this post, we create a custom environment to directly integrate SageMaker notebook access from the Amazon DataZone portal.
- Before you create the custom environment, create the environment IAM role that will be used in the custom blueprint. The role should have a trust policy as shown in the following screenshot. For the permissions, attach the AWS managed policy
AmazonSageMakerFullAccess. We refer to this role as the environment-role throughout the post.

- To create the custom environment, first enable the Custom AWS Service blueprint on the Amazon DataZone console.

- Open the blueprint to create a new environment as shown in the following screenshot.
- For Owning project, use the consumer project that you created earlier and for Permissions, use the environment-role.

- After you create the environment, open it to create a customized URL for the SageMaker notebook access.
- Create a new custom AWS link and enter the URL from the SageMaker notebook.
You can find it by navigating to the SageMaker console and choosing Notebooks in the navigation pane.
- Choose Customize to add the custom link.
- Next, create a subscription target in the custom environment to pass the instance role that needs access to the unstructured data.
A subscription target is an Amazon DataZone engineering concept that allows Amazon DataZone to fulfill subscription requests for managed assets by granting access based on the information defined in the target like domain-id, environment-id, or authorized-principals.
Currently, creation of subscription targets is only allowed using the AWS Command Line Interface (AWS CLI). You can use the command create-subscription-target to create the subscription target.
The following is an example JSON payload for the subscription target creation. Create it as a JSON file on your workstation (for this post, we call it blog-sub-target.json). Replace the domain ID and the environment ID with the corresponding values for your domain and environment.
{
"domainIdentifier": "<<your-domain-id>>",
"environmentIdentifier": "<<your-environment-id>>",
"name": "custom-s3-target-consumerenv",
"type": "GlueSubscriptionTargetType",
"manageAccessRole": "<<provide the environment-role here>>",
"applicableAssetTypes": ["S3ObjectCollectionAssetType"],
"provider": "Custom Provider",
"authorizedPrincipals": [ "<<provide the instance-role here>>"],
"subscriptionTargetConfig": [{
"formName": "GlueSubscriptionTargetConfigForm",
"content": "{\"databaseName\":\"customdb1\"}"
}]
}
You can get the domain ID from the user name button in the upper right Amazon DataZone data portal; it’s in the format dzd_<<some-random-characters>>.
For the environment ID, you can find it on the Settings tab of the environment within your consumer project.
- Open an AWS CloudShell environment and upload the JSON payload file using the Actions option in the CloudShell terminal.
- You can now create a new subscription target using the following AWS CLI command:
aws datazone create-subscription-target --cli-input-json file://blog-sub-target.json
- To verify the subscription target was created successfully, run the list-subscription-target command from the AWS CloudShell environment:
aws datazone list-subscription-targets —domain-identifier <<domain-id>> —environment-identifier <<environment-id>>
Create a function to respond to subscription events
Now that you have the consumer environment and subscription target set up, the next step is to implement a custom workflow for handling subscription requests.
The simplest mechanism to handle subscription events is a Lambda function. The exact implementation may vary based on environment; for this post, we walk through the steps to create a simple function to handle subscription creation and cancellation.
- On the Lambda console, choose Functions in the navigation pane.
- Choose Create function.
- Select Author from scratch.
- For Function name, enter a name (for example,
create-s3policy-for-subscription-target).
- For Runtime¸ choose Python 3.12.
- Choose Create function.
This should open the Code tab for the function and allow editing of the Python code for the function. Let’s look at some of the key components of a function to handle the subscription for unmanaged S3 assets.
Handle only relevant events
When the function gets invoked, we check to make sure it’s one of the events that’s relevant for managing access. Otherwise, the function can simply return a message without taking further action.
def lambda_handler(event, context):
    # Get the basic info about the event
    event_detail = event['detail']

    # Make sure it's one of the events we're interested in
    event_source = event['source']
    event_type = event['detail-type']

    if event_source != 'aws.datazone':
        return '{"Response" : "Not a DataZone event"}'
    elif event_type not in ['Subscription Created', 'Subscription Cancelled',
                               'Subscription Revoked']:
        return '{"Response" : "Not a subscription created, cancelled, or revoked event"}'
These subscription events should include both the domain ID and a request ID (among other attributes). You can use these to look up the details of the subscription request in Amazon DataZone:
sub_request = dz.get_subscription_request_details(
domainIdentifier = domain_id,
identifier= sub_request_id
)
asset_listing = sub_request['subscribedListings'][0]['item']['assetListing']
form_data = json.loads(asset_listing['forms'])
asset_id = asset_listing['entityId']
asset_version = asset_listing['entityRevision']
asset_type = asset_listing['entityType']
Part of the subscription request should include the ARN for the S3 bucket in question, so you can retrieve that:
# We only want to take action if this is a S3 asset
    if asset_type == 'S3ObjectCollectionAssetType':
        # Get the bucket ARN from the form info for the asset
        bucket_arn = form_data['S3ObjectCollectionForm']['bucketArn']

        #Get the principal from the subscription target
        principal = get_principal(domain_id,project_id)

        try:
            # Get the bucket name from the ARN
            bucket_name_with_prefix = bucket_arn.split(':')[5]
            bucket_name = bucket_name_with_prefix.split('/')[0]

        except IndexError:
            response = '{"Response" : "Could not find bucket name in ARN"}'
            return response
You can also use the Amazon DataZone API calls to get the environment associated with the project making the subscription request for this S3 asset. After retrieving the environment ID, you can check which IAM principals have been authorized to access unmanaged S3 assets using the subscription target:
        list_sub_target = dz.list_subscription_targets(
            domainIdentifier=domain_id,
            environmentIdentifier=environment_id,
            maxResults=50,
            sortBy='CREATED_AT',
            sortOrder='DESCENDING'
            )

        print('asset type:', list_sub_target['items'][0]['applicableAssetTypes'])

        if list_sub_target['items'][0]['applicableAssetTypes'] == ['S3ObjectCollectionAssetType']:
            role_arn = list_sub_target['items'][0]['authorizedPrincipals']
            print('role arn',role_arn)
If this is a new subscription, add the relevant IAM principal to the S3 bucket policy by appending a statement that allows the desired S3 actions on this bucket for the new principal:
        if event_type == 'Subscription Created':
            if bucket_arn[-1] == '/':
                statement_block.append({
                    'Sid' : sid_string,
                    'Action': S3_ACTION_STRING,
                    'Resource': [
                        bucket_arn,
                        bucket_arn + '*'
                    ],
                    'Effect': 'Allow',
                    'Principal': {'AWS': principal}
                })
Conversely, if this is a subscription being revoked or cancelled, remove the previously added statement from the bucket policy to make sure the IAM principal no longer has access:
        elif event_type == 'Subscription Cancelled' or event_type == 'Subscription Revoked':
            # Remove the statement from the policy if it's there
            # Made sure to handle case where there's no Sid for a statement
            pruned_statement_block = []
            for statement in statement_block:
                if 'Sid' not in statement or statement['Sid'] != sid_string:
                    pruned_statement_block.append(statement)
            statement_block = pruned_statement_block
The completed function should be able to handle adding or removing principals like IAM roles or users to a bucket policy. Be sure to handle cases where there is no existing bucket policy or where a cancellation means removing the only statement in the policy, meaning the entire bucket policy is no longer needed.
The following is an example of a completed function:
import json
import boto3
import os


dz = boto3.client('datazone')
s3 = boto3.client('s3')

# The list of actions to be permitted on the bucket in the newly granted policy
S3_ACTION_STRING = 's3:*'

def build_policy_statements(event_type, statement_block, principal, sub_request_id, bucket_arn):
        # Generate a Sid that should be unique
        sid_string = ''.join(c for c in f'DZ{principal}{sub_request_id}' if c.isalnum())
        # Add a new policy statement that gives the prinicpal access to whole bucket.
        # If it turns out something other than bucket ARN is allowed in asset, we can
        # get more granular than that
        # Sid that should be unique in case we need to handle unsubscribe
        print('statement block :',statement_block)
        if event_type == 'Subscription Created':
            if bucket_arn[-1] == '/':
                statement_block.append({
                    'Sid' : sid_string,
                    'Action': S3_ACTION_STRING,
                    'Resource': [
                        bucket_arn,
                        bucket_arn + '*'
                    ],
                    'Effect': 'Allow',
                    'Principal': {'AWS': principal}
                })
            else:
                statement_block.append({
                    'Sid' : sid_string,
                    'Action': S3_ACTION_STRING,
                    'Resource': [
                        bucket_arn,
                        bucket_arn + '/*'
                    ],
                    'Effect': 'Allow',
                    'Principal': {'AWS': principal}
                })
        elif event_type == 'Subscription Cancelled' or event_type == 'Subscription Revoked':
            # Remove the statement from the policy if it's there
            # Made sure to handle case where there's no Sid for a statement
            pruned_statement_block = []
            for statement in statement_block:
                if 'Sid' not in statement or statement['Sid'] != sid_string:
                    pruned_statement_block.append(statement)
            statement_block = pruned_statement_block


        return statement_block

def lambda_handler(event, context):
    """Lambda function reacting to DataZone subscribe events

    Parameters
    ----------
    event: dict, required
        Event Bridge Events Format

    context: object, required
        Lambda Context runtime methods and attributes

    Returns
    ------
        Simple reponse indicating success or failure reason
    """
    # Get the basic info about the event
    event_detail = event['detail']

    # Make sure it's one of the events we're interested in
    event_source = event['source']
    event_type = event['detail-type']

    if event_source != 'aws.datazone':
        return '{"Response" : "Not a DataZone event"}'
    elif event_type not in ['Subscription Created', 'Subscription Cancelled',
                               'Subscription Revoked']:
        return '{"Response" : "Not a subscription created, cancelled, or revoked event"}'


    # get the domain_id and other information
    domain_id = event_detail['metadata']['domain']
    project_id = event_detail['metadata']['owningProjectId']
    sub_request_id = event_detail['data']['subscriptionRequestId']
    listing_id = event_detail['data']['subscribedListing']['id']
    listing_version = event_detail['data']['subscribedListing']['version']

    print('domain-id',domain_id)
    print('project-id:',project_id)

    sub_request = dz.get_subscription_request_details(
        domainIdentifier = domain_id,
        identifier= sub_request_id
    )

    # Retrieve info about the asset from the request
    asset_listing = sub_request['subscribedListings'][0]['item']['assetListing']
    form_data = json.loads(asset_listing['forms'])
    asset_id = asset_listing['entityId']
    asset_version = asset_listing['entityRevision']
    asset_type = asset_listing['entityType']

    # We only want to take action if this is a S3 asset
    if asset_type == 'S3ObjectCollectionAssetType':
        # Get the bucket ARN from the form info for the asset
        bucket_arn = form_data['S3ObjectCollectionForm']['bucketArn']

        #Get the principal from the subscription target
        principal = get_principal(domain_id,project_id)

        try:
            # Get the bucket name from the ARN
            bucket_name_with_prefix = bucket_arn.split(':')[5]
            bucket_name = bucket_name_with_prefix.split('/')[0]

        except IndexError:
            response = '{"Response" : "Could not find bucket name in ARN"}'
            return response

        # Get the current bucket policy, or else make a blank one if there currently
        # is no policy
        try:
            bucket_policy = json.loads(s3.get_bucket_policy(Bucket=bucket_name)['Policy'])
        except s3.exceptions.from_code('NoSuchBucketPolicy'):
            bucket_policy = {'Statement': []}
        except:
            response = '{"Response" : "Could not get bucket policy"}'
            return response

        # Gets new policy with the subscribing principal either added or removed based on
        # event type
        new_policy_statements = build_policy_statements(event_type, bucket_policy['Statement'], principal,
                                               sub_request_id, bucket_arn)


        # Write back the new policy. This can fail if the new policy is too big
        # or if for some reason the function role doesn't have rights to do this
        # If we removed the only policy statement, then just delete the policy
        try:
            if not new_policy_statements:
                s3.delete_bucket_policy(Bucket = bucket_name)
            else:
                bucket_policy['Statement'] = new_policy_statements
                policy_string = json.dumps(bucket_policy)
                print('policy string :',policy_string)
                s3.put_bucket_policy(
                    Bucket=bucket_name,
                    Policy = policy_string
                )
        except Exception as e:
            response = f'{{"Response" : "Error updating bucket policy: {e.args}"}}'
            return response

        # If we got here everything went as planned
        response = f'{{"Response" : "Updated policy for " + {bucket_name}}}'
    else:
        response = '{"Response" : "Not an S3 asset"}'


    return response

def get_principal(domain_id,project_id):
    # Call list environments to get the environment id
    listenv_request = dz.list_environments(
        domainIdentifier = domain_id,
        projectIdentifier= project_id
    )

   # In our example environment, there is only one of these
    environment_id = listenv_request['items'][0]['id']

   # Get the role we want to give access to from the subscription target info
    list_sub_target = dz.list_subscription_targets(
        domainIdentifier=domain_id,
        environmentIdentifier=environment_id,
        maxResults=50,
        sortBy='CREATED_AT',
        sortOrder='DESCENDING'
        )

    if list_sub_target['items'][0]['applicableAssetTypes'] == ['S3ObjectCollectionAssetType']:
       role_arn = list_sub_target['items'][0]['authorizedPrincipals']
   else:
        role_arn = []

    return role_arn
Because this Lambda function is intended to manage bucket policies, the role assigned to it will need a policy that allows the following actions on any buckets it is intended to manage:
- s3:GetBucketPolicy
- s3:PutBucketPolicy
- s3:DeleteBucketPolicy
Now you have a function that is capable of editing bucket policies to add or remove the principals configured for your subscription targets, but you need something to invoke this function any time a subscription is created, cancelled, or revoked. In the next section, we cover how to use EventBridge to integrate this new function with Amazon DataZone.
Respond to subscription events in EventBridge
For events that take place within Amazon DataZone, it publishes information about each event in EventBridge. You can watch for any of these events, and invoke actions based on matching predefined rules. In this case, we’re interested in asset subscriptions being created, cancelled, or revoked, because those will determine when we grant or revoke access to the data in Amazon S3.
- On the EventBridge console, choose Rules in the navigation pane.
The default event bus should automatically be present; we use it for creating the Amazon DataZone subscription rule.
- Choose Create rule.
- In the Rule detail section, enter the following:
- For Name, enter a name (for example,
DataZoneSubscriptions).
- For Description, enter a description that explains the purpose of the rule.
- For Event bus, choose default.
- Turn on Enable the rule on the selected event bus.
- For Rule type, select Rule with an event pattern.
- Choose Next.
- In the Event source section, select AWS Events or EventBridge partner events as the source of the events.
- In the Creation method section, select Custom Pattern (JSON editor) to enable exact specification of the events needed for this solution.
- In the Event pattern section, enter the following code:
{
"detail-type": ["Subscription Created", "Subscription Cancelled", "Subscription Revoked"],
"source": ["aws.datazone"]
}
- Choose Next.
Now that we’ve defined the events to watch for, we can make sure those Amazon DataZone events get sent to the Lambda function we defined in the previous section.
- On the Select target(s) page, enter the following for Target 1:
- For Target types, select AWS service.
- For Select a target, choose Lambda function
- For Function, choose create-s3policy-for-subscription-target.
- Choose Skip to Review and create.

- On the Review and create page, choose Create rule.
Subscribe to the unstructured data asset
Now that you have the custom subscription workflow in place, you can test the workflow by subscribing to the unstructured data asset.
- In the Amazon DataZone portal, search for the unstructured data asset you published by browsing the catalog.
- Subscribe to the unstructured data asset using the consumer project, which starts the Amazon DataZone approval workflow.
- You should get a notification for the subscription request; follow the link and approve it.

When the subscription is approved, it will invoke the custom EventBridge Lambda workflow, which will create the S3 bucket policies for the instance role to access the S3 object. You can verify that by navigating to the S3 bucket and reviewing the permissions.

Access the subscribed asset from the Amazon DataZone portal
Now that the consumer project has been given access to the unstructured asset, you can access it from the Amazon DataZone portal.
- In the Amazon DataZone portal, open the consumer project and navigate to the Environments
- Choose the SageMaker-Notebook
- In the confirmation pop-up, choose Open custom.
This will redirect you to the SageMaker notebook assuming the environment role. You can see the SageMaker notebook instance.
- Choose Open JupyterLab.
- Choose conda_python3 to launch a new notebook.
- Add code to run
get_object on the unstructured S3 data that you subscribed earlier and run the cells.

Now, because the S3 bucket policy has been updated to allow the instance role access to the S3 objects, you should see the get_object call return a HTTPStatusCode of 200.
Multi-account implementation
In the instructions so far, we’ve deployed everything in a single AWS account, but in larger organizations, resources can be distributed throughout AWS accounts, often managed by AWS Organizations. The same pattern can be applied in a multi-account environment, with some minor additions. Instead of directly acting on a bucket, the Lambda function in the domain account can assume a role in other accounts that contain S3 buckets to be managed. In each account with an S3 bucket containing assets, create a role that allows editing the bucket policy and has a trust policy referencing the Lambda role in the domain account as a principal.
Clean up
If you’ve finished experimenting and don’t want to incur any further cost for the resources deployed, you can clean up the components as follows:
- Delete the Amazon DataZone domain.
- Delete the Lambda function.
- Delete the SageMaker instance.
- Delete the S3 bucket that hosted the unstructured asset.
- Delete the IAM roles.
Conclusion
By implementing this custom workflow, organizations can extend the simplified subscription and access workflows provided by Amazon DataZone to their unstructured data stored in Amazon S3. This approach provides greater control over unstructured data assets, facilitating discovery and access across the enterprise.
We encourage you to try out the solution for your own use case, and share your feedback in the comments.
About the Authors
 Somdeb Bhattacharjee is a Senior Solutions Architect specializing on data and analytics. He is part of the global Healthcare and Life sciences industry at AWS, helping his customers modernize their data platform solutions to achieve their business outcomes.
 Sam Yates is a Senior Solutions Architect in the Healthcare and Life Sciences business unit at AWS. He has spent most of the past two decades helping life sciences companies apply technology in pursuit of their missions to help patients. Sam holds BS and MS degrees in Computer Science.


 Figure 7: Receiving test event with SQS
 Figure 8: Receiving test event with Lambda
 Figure 9: Receiving test event with SNS


 Somdeb Bhattacharjee is a Senior Solutions Architect specializing on data and analytics. He is part of the global Healthcare and Life sciences industry at AWS, helping his customers modernize their data platform solutions to achieve their business outcomes.
 Sam Yates is a Senior Solutions Architect in the Healthcare and Life Sciences business unit at AWS. He has spent most of the past two decades helping life sciences companies apply technology in pursuit of their missions to help patients. Sam holds BS and MS degrees in Computer Science.
 Resource Owner VPC – A VPC that has resources to be shared. The owner of this VPC creates a Resource Gateway with one or more associated Resource Configurations, then uses


 Ritesh Kumar Sinha is an Analytics Specialist Solutions Architect based out of San Francisco. He has helped customers build scalable data warehousing and big data solutions for over 16 years. He loves to design and build efficient end-to-end solutions on AWS. In his spare time, he loves reading, walking, and doing yoga.
 Praveen Kadipikonda is a Senior Analytics Specialist Solutions Architect at AWS based out of Dallas. He helps customers build efficient, performant, and scalable analytic solutions. He has worked with building databases and data warehouse solutions for over 15 years.
 Jagadish Kumar (Jag) is a Senior Specialist Solutions Architect at AWS focused on Amazon OpenSearch Service. He is deeply passionate about Data Architecture and helps customers build analytics solutions at scale on AWS.


 Chandan Rupakheti is a Senior Solutions Architect at AWS. His main focus at AWS lies in the intersection of Analytics, Serverless, and AdTech services. He is a passionate technical leader, researcher, and mentor with a knack for building innovative solutions in the cloud. Outside of his professional life, he loves spending time with his family and friends besides listening and playing music.
 Parnab Basak is a Senior Solutions Architect and a Serverless Specialist at AWS. He specializes in creating new solutions that are cloud native using modern software development practices like serverless, DevOps, and analytics. Parnab works closely in the analytics and integration services space helping customers adopt AWS services for their workflow orchestration needs.


 AWS Summits – Join free online and in-person events that bring the cloud computing community together to connect, collaborate, and learn about AWS. Register in your nearest city:


 Alan Peaty is a Senior Partner Solutions Architect at AWS. Alan helps Global Systems Integrators (GSIs) and Global Independent Software Vendors (GISVs) solve complex customer challenges using AWS services. Prior to joining AWS, Alan worked as an architect at systems integrators to translate business requirements into technical solutions. Outside of work, Alan is an IoT enthusiast and a keen runner who loves to hit the muddy trails of the English countryside.
 Parag Srivastava is a Solutions Architect at AWS, helping enterprise customers with successful cloud adoption and migration. During his professional career, he has been extensively involved in complex digital transformation projects. He is also passionate about building innovative solutions around geospatial aspects of addresses.