Post Syndicated from Satya S Tripathy original https://aws.amazon.com/blogs/messaging-and-targeting/improve-email-deliverability-with-tenant-management-in-amazon-ses/
Amazon Simple Email Service (Amazon SES) serves diverse industries—from ecommerce services to financial institutions to marketing technology product providers—helping organizations manage their email communication needs. Many businesses face the challenge of sending emails not just for themselves, but on behalf of their downstream customers or across various business divisions. These scenarios, commonly known as multi-tenant email sending practices, require careful architectural consideration. For example, a marketing service might need to send promotional emails for hundreds of retail clients, or an enterprise IT team might manage email communications across multiple business units (BUs). These clients and BUs are also identified as tenants. To successfully implement multi-tenancy in Amazon SES, customers usually develop an architecture pattern within Amazon SES that accomplishes critical objectives to efficiently handle the email sending needs of thousands of downstream tenants while maintaining isolated email sending reputations for each tenant. This isolation is crucial for protecting each customer’s deliverability metrics and to prevent issues with one tenant from impacting others.
Amazon SES customers can achieve multi-tenancy through isolated configuration sets for sending emails, but traditionally, reputation management and enforcement occur at the account level. To address this, Amazon SES now offers tenant management capabilities that enable tenant isolation and reputation management at the individual tenant level. This new feature provides greater control and flexibility for organizations managing multiple tenants within a single Amazon SES account, allowing each tenant to maintain its own sending reputation independently.
In this post, you will learn about the newly released tenant management feature that helps customers manage individual tenant onboardings and manage their reputations in isolation. This feature helps organizations create and manage up to 10,000 isolated tenants within a single AWS account (which can be increased 300,000 on explicit request), each with independent configurations and reputation metrics. You will discover how these capabilities maintain email deliverability through automated tenant-level controls, real-time monitoring, and customizable sending policies.
Whether you’re a service provider sending emails on behalf of multiple customers or an enterprise coordinating various BUs or lines of business (LOBs), this new feature offers sophisticated workflows to identify reputation-based findings and pause individual tenant sending to protect other tenants’ reputations. These enhancements are available globally across AWS Regions where Amazon SES is offered, representing a significant advancement in email deliverability management at scale.
Use cases
Following use cases can easily achieved though Amazon SES tenant management feature.
- Onboard multiple brands from different BUs with different domains
- Separate marketing and transaction tenants
- Support independent software vendor (ISV) customers’ requirement to segregate email sending reputation of their customers
- Domain management using configuration sets.
- Track individual customers’ email sending reputations and control their email sending processes
Multi-tenant email operation challenges
Businesses rely on email as a critical communication channel. However, managing email operations for multiple tenants (customers or business units) has historically presented significant challenges such as:
- Lack of isolation: Without proper tenant isolation, poor sending practices by one tenant could negatively impact the email deliverability of others, potentially jeopardizing your entire email sending operation.
- Limited visibility: Understanding per-tenant email performance metrics and managing reputation independently has been difficult, if not impossible.
- Scalability constraints: Many organizations struggle to scale their email operations because of account-level limitations on resources such as identities and configuration sets.
- Inadequate control: The inability to set tenant-specific limits and configurations has made it challenging to prevent individual tenants from impacting others or exceeding allocated resources.
- Complex monitoring: Building custom solutions for monitoring tenant activity often leads to inconsistent and inefficient workflows.
Benefits of tenant management capability
The Amazon SES tenant management feature provides a comprehensive solution for organizations managing email sending at scale on behalf of their customers or LOBs (called tenants). This capability is particularly valuable for software as a service (SaaS) providers, email service providers, and enterprises managing email operations across multiple clients or departments while separating tenants from each other.
Through tenant management, organizations can effectively manage email streams and reputation independently and maintain oversight of their various email operations. This new functionality transforms how organizations use Amazon SES, enabling them to handle complex, multi-faceted email operations with greater control and visibility at the tenant level with the following key capabilities.
- Isolate tenant resources and reputation: Tenant management provides dedicated resource isolation that protects your email reputation across different customers and lines of business. Each tenant (customers or LOBs) will have their own dedicated set of resources such as email sending IPs, domain, and identifiers in DomainKeys Identified Mail (DKIM) signed headers, which are observed by mailbox providers within your Amazon SES account. Tenant management delivers granular control over resource allocation. You can assign tenant-specific or shared sending identities based on your organizational requirements. Each tenant can receive dedicated SMTP or API credentials that provide secure access to their allocated resources. You can configure tenant-level IP pools that separate sending traffic and maintain distinct reputation profiles for each tenant. You can use tenant management to manage tenant-specific configuration sets that define how emails are processed and tracked for each tenant. You can associate email templates with specific tenants, confirms that branded communications remain properly segmented and controlled. This isolation helps ensure that one tenant’s actions cannot affect the reputation or performance of other tenants. When a tenant experiences delivery issues or reputation problems, these challenges remain contained within their dedicated resources. This approach maintains fairness across all tenants and establishes clear individual accountability for email practices.
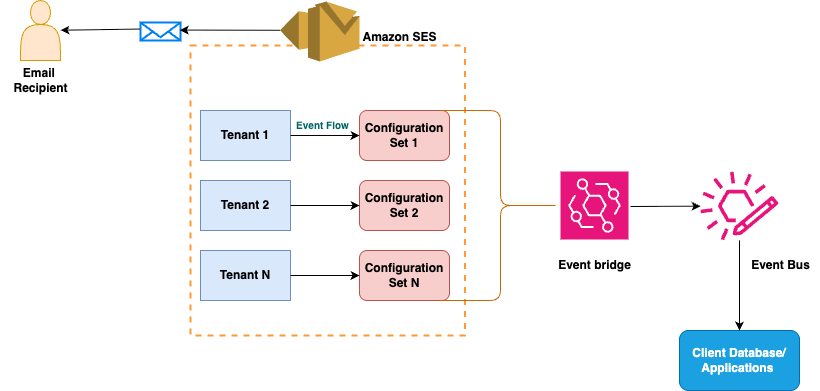
- Monitor tenant-specific metrics in real time: You can access specific reputation metrics for each tenant, including raw bounce rates and complaint rates that directly impact sender reputation. You can use this system to set up tenant-level event destinations though the respective configuration set mapped to the tenant for detailed tracking and analysis. With this, you gain access to detailed tenant-level events that track performance, engagement, and compliance metrics for each tenant individually. You can also establish automated enforcement policies based on configurable thresholds that align with your business requirements. When tenant reputation findings are detected or when tenant status changes occur, you can receive real-time alerts through Amazon EventBridge.
- Scale to hundreds of thousands of tenants: The system is designed to handle massive scale (starting at 10 thousand tenants per account and can increase to as many as 300 thousand tenants), allowing you to grow your business or expand your email operations without worrying about infrastructure limitations. Whether you’re managing dozens or hundreds of thousands of tenants, the system will adapt to your needs.
- Automate tenant management workflows: You can set up automated processes for onboarding new tenants, applying policies, and managing tenant lifecycles. With this system, you can use API and console interfaces to create, modify, and delete tenants and have the flexibility to pause or resume sending capabilities as required. This automation reduces manual overhead for consistent application of your email sending standards across all tenants.
- Take targeted enforcement actions to maintain high deliverability: If issues arise with a specific tenant, you can take precise actions—such as suspending sending privileges or applying stricter reputation policies—without affecting other tenants. This capability helps maintain overall high deliverability rates for your entire operation.
These features collectively represent an advancement in email management capabilities, so organizations can offer more sophisticated, scalable, and reliable email services to their clients or internal departments while maintaining strict control over reputation and compliance.
How tenant management works
You can use the tenant management feature from Amazon SES to segment your email sending operations effectively. You can use the system to create multiple tenants within a single Amazon SES account, with each tenant having its own dedicated resources. These resources include essential components such as sending identities, SMTP credentials, configuration sets, and dedicated IP pools. What makes this architecture particularly flexible is the ability to share common resources across tenants, such as IP pools and configuration sets, enabling optimal resource utilization while maintaining operational separation. The following diagram illustrates the preceding information in detail.

Prerequisites
To get started with tenant management, you need:
- An AWS account
- Verified sending identities within Amazon SES (domains or email addresses)
- Configuration sets for email settings
- A clear understanding of your tenant structure based on your business requirements
How to set up tenant management and its key considerations
Setting up a multi-tenant system in Amazon SES requires careful configuration of three key components: IP pools, domain verification, and configuration sets. By following the set-up procedure, each tenant will have isolated resources, proper tracking, and monitoring capabilities. Using the AWS Management Console for Amazon SES or the Amazon SES APIs, you can create a robust email sending infrastructure that maintains high deliverability while keeping each tenant’s reputation separate.
IP pool configuration
IP pool configuration is a fundamental step to send email communications using Amazon SES. Begin your multi-tenant setup by establishing dedicated IP pools or managed IP pools for each customer though a configuration set. First, access the Amazon SES console and navigate to the Dedicated IP pools section. Create a new Standard dedicated IP pool, giving it a name that clearly identifies the customer. Through AWS Support, request the specific number of IP addresses needed based on your customer’s sending volume—typically one IP per 50,000 daily emails. After the IPs are provisioned, assign them to the appropriate pool. Then, map the IP pool with the configuration set mapped to the tenant. For IP warm-up, you have two options: enable the automatic warm-up schedule, which gradually increases sending volume over 45 days, or disable it to implement your own custom warm-up plan. Monitor the warm-up progress closely to help ensure optimal delivery rates.
Domain verification process
After setting up the IP pool, proceed with domain verification to establish your customer’s sending identity. Navigate to the “verified Identities” (verified identities are the domains or email ids those you have already whitelisted with Amazon SES) section in the Amazon SES console and create a new domain identity using your customer’s domain name. Amazon SES will provide DKIM records that need to be added to the domain’s DNS settings. Work with your customer to implement these records correctly in their DNS configuration. The verification process typically takes 24–72 hours to complete. During this time, regularly check the verification status in the Amazon SES console to make sure the process completes successfully.
Authentication and authorization for tenants
In addition to restricting email sending to specific identities and configurations, you can restrict email sending permissions by tenant using AWS Identity and Access Management (IAM) user or role policies. The following policy demonstrates these restrictions by allowing emails only when the tenant Amazon Resource Name (ARN) is arn:aws:ses:us-east-1:111122223333:tenant/testTenant1/tn-e08a68010000a3e4c67bcd990910, the identity is arn:aws:ses:us-east-1:111122223333:identity/example.com and the configuration-set is arn:aws:ses:us-east-1:111122223333:configuration-set/testTenant1.
{
  "Version": "2012-10-17",
  "Statement": [
    {
      "Sid": "VisualEditor0",
      "Effect": "Allow",
      "Action": "ses:SendRawEmail",
      "Resource": [
        "arn:aws:ses:us-east-1:111122223333:identity/example.com",
        "arn:aws:ses:us-east-1:111122223333:configuration-set/TestTenant1"
      ],
  "Condition":
{ "StringEquals":
{ "ses:TenantName": "testTenant1" }
}
    }
  ]
}
Set up a configuration set
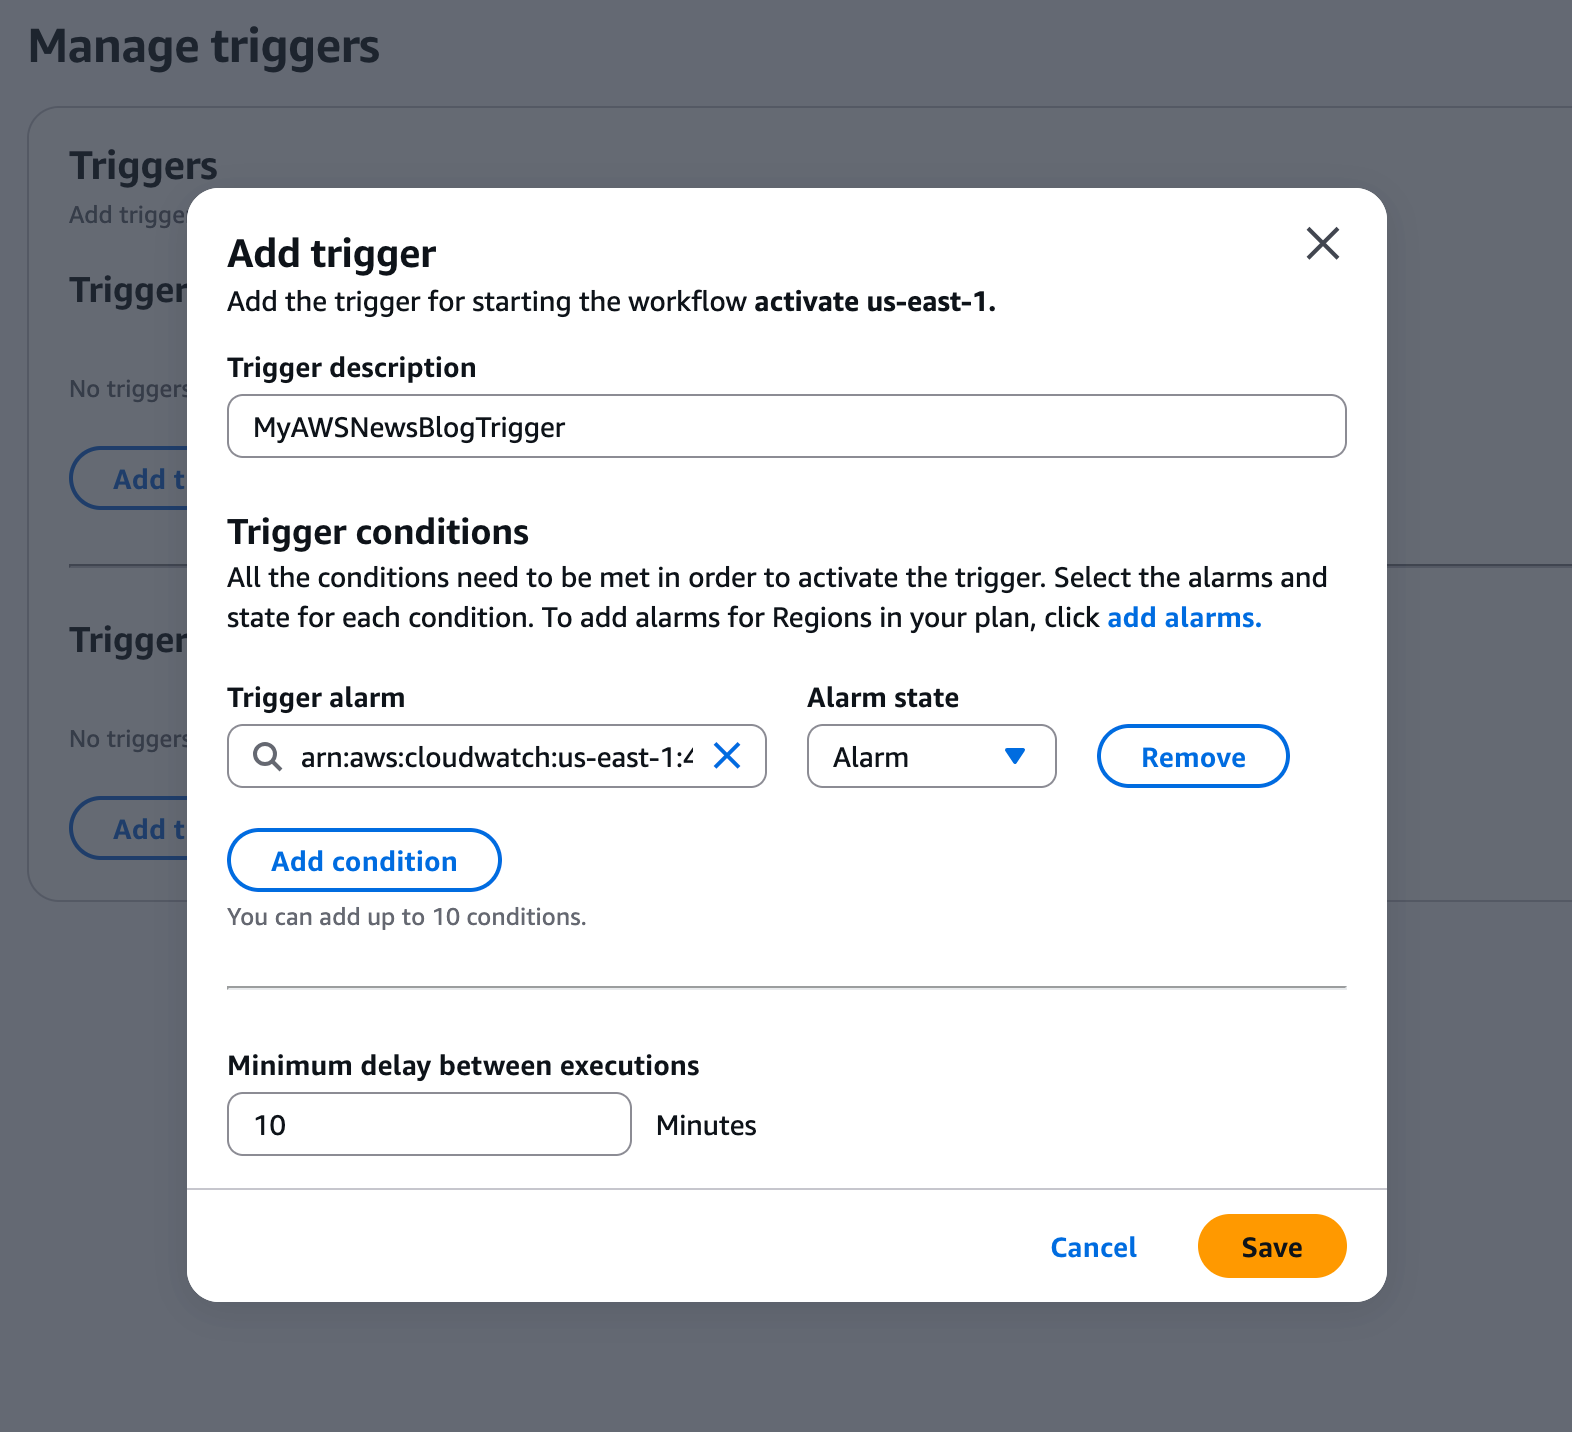
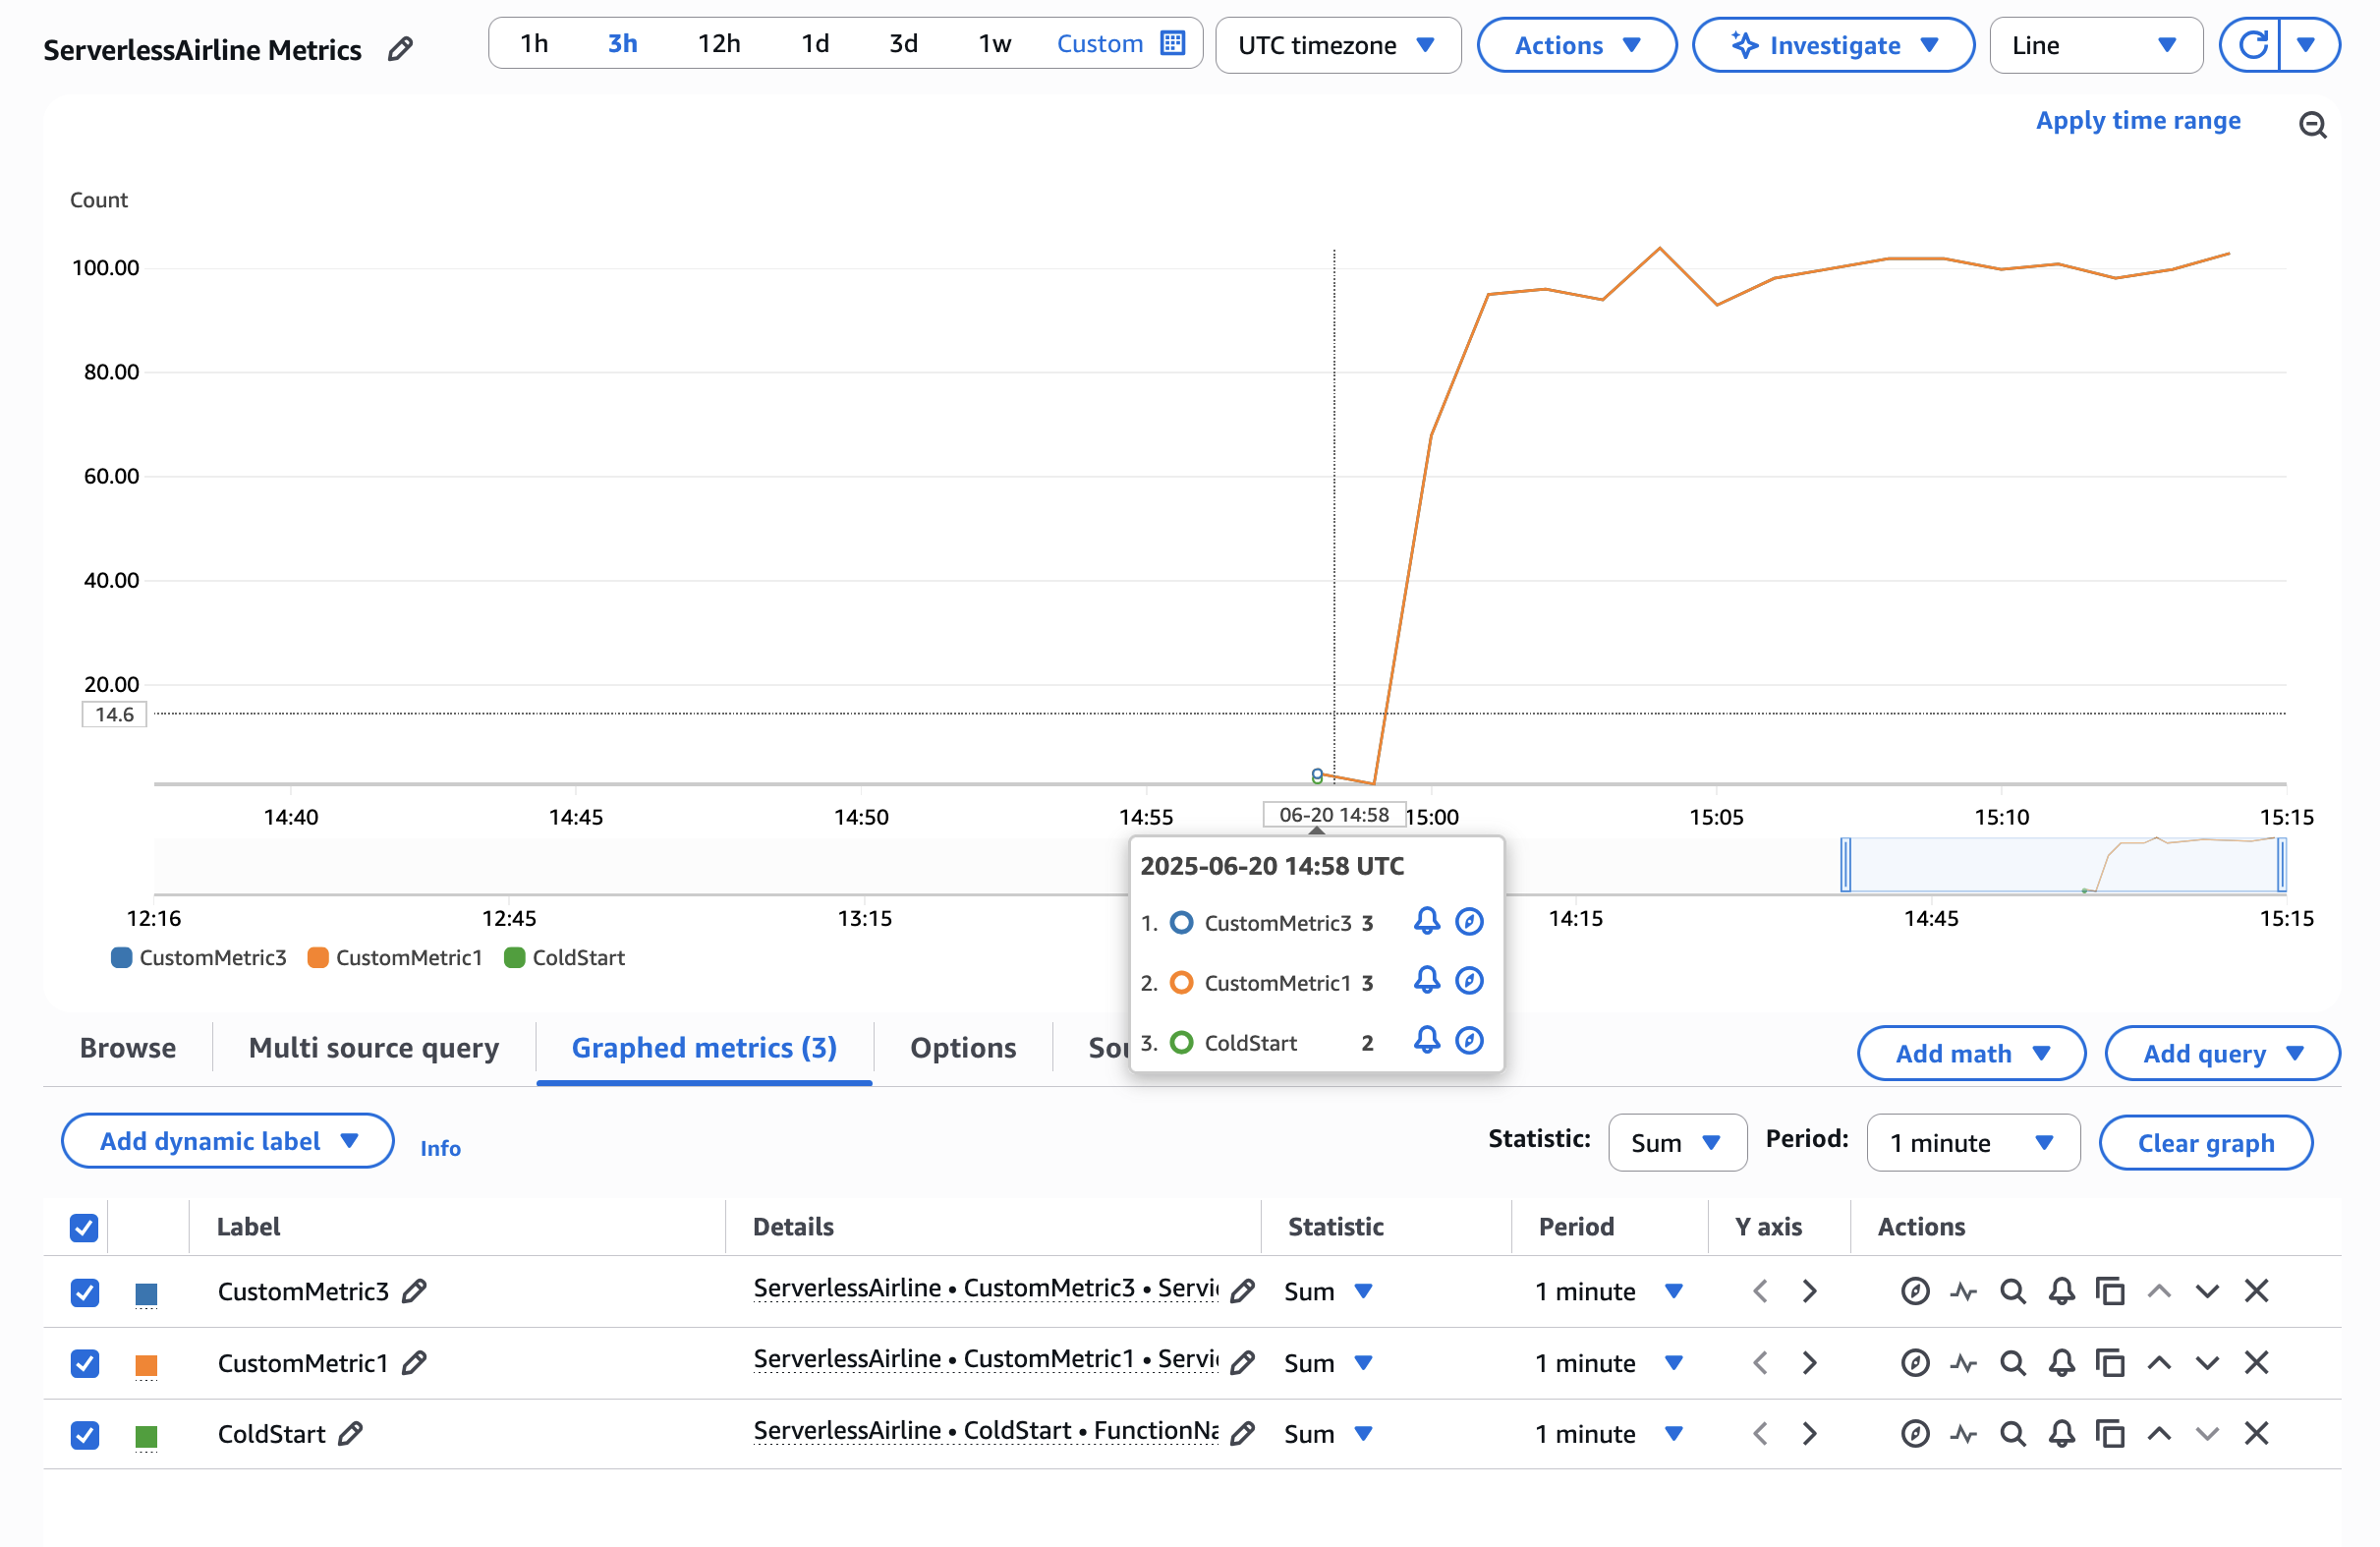
The final step involves creating and configuring the configuration set, which manages tracking and monitoring. Start by creating a new configuration set under configuration set section in the Amazon SES console, naming it to match your customer’s identification. Configure the custom tracking domain and enable appropriate tracking settings for opens and clicks. Link this configuration to the previously created IP pool. Next, set up event destinations to monitor email performance—this can include Amazon CloudWatch metrics, Amazon Data Firehose, or Amazon Simple Notification Service (Amazon SNS) topics. In CloudWatch, create alarms for critical metrics such as bounce rates (recommended threshold: 5%) and complaint rates (recommended threshold: 0.1%). Set up notification systems to alert your team when these thresholds are breached, so you can quickly respond to any delivery issues.
Sample CLI commands
To start using tenant management, you can use the console, AWS Command Line Interface (AWS CLI), or AWS SDKs. The following are basic examples of creating and configuring a tenant using the AWS CLI:
Following states a life cycle of the tenant management procedure starting from creating a tenant to deleting it in case you want to remove the tenant. Make sure that you are using AWS CLI version to 2.28.0 or later. See AWS CLI install and update instructions if necessary.
Create a new tenant
aws sesv2 create-tenant --tenant-name testTenant1 --region us-east-1
Note that “-–region” value is optional
Assign a sending identity to the tenant (domain or email ID)
aws sesv2 create-tenant-resource-association --tenant-name testTenant1 --resource-arn arn:aws:ses:us-east-1:111122223333:identity/example.com
Add a configuration set to the tenant
aws sesv2 create-tenant-resource-association --tenant-name testTenant1 --resource-arn arn:aws:ses:us-east-1:111122223333:configuration-set/test1
The assumption here is that the selected configuration set already has an IP-Pool associated.
Get tenant information through get-tenants or list-tenants
aws sesv2 get-tenant --tenant-name testTenant1 --region us-east-1

aws sesv2 list-tenants --region us-east-1 <List all the tenants with their ARN>
You can use get-tenant or List-tenants to get information about a specific tenant, including the tenant’s name, ID, ARN, creation timestamp, tags, and sending status or list-tenants to list all tenants associated with your account
List resources of a tenant
aws sesv2 list-tenant-resources --tenant-name testTenant1
Send email using tenant
aws sesv2 send-email --from-email-address "[email protected]" --destination "[email protected] " --configuration-set-name test1 --content '{"Simple":{"Subject":{"Data":"Your email subject","Charset":"UTF-8"},"Body":{"Text":{"Data":"This is the plain text version.","Charset":"UTF-8"},"Html":{"Data":"<html><body><h1>This is the HTML version</h1><p>With formatted content.</p></body></html>","Charset":"UTF-8"}}}}' --tenant-name testTenant1
To change the reputation policy from standard to strict (Standard policy is applied by default)
aws sesv2 update-reputation-entity-policy --reputation-entity-type RESOURCE --reputation-entity-reference arn:aws:ses:us-east-1: 111122223333:tenant/ testTenant1/tn-145f7885b000074362bfa074ec4e1 --reputation-entity-policy arn:aws:ses:us-east-1:aws:reputation-policy/strict
Disable sending for a tenant (to temporarily disable or pause a tenant)
aws sesv2 update-reputation-entity-customer-managed-status —reputation-entity-type RESOURCE —reputation-entity-reference arn:aws:ses:us-east-1:111122223333:tenant/testTenant1/tn-145f7885b000074362bfa074ec4e1 —sending-status DISABLED
Delete the tenant (remove the tenant completely from the Amazon SES account)
aws sesv2 delete-tenant --tenant-name testTenant1
Send emails using SMTP
The X-SES-TENANT header is utilized by AWS to manage emails across multiple tenants. You can specify the tenant name by including it in the X-SES-TENANT field. This approach allows for better organization and routing of emails based on tenant information. To implement this, you can add the X-SES-TENANT header when sending emails using SMTP. The following Python code demonstrates how to include this header in your email sending process::
<Pseudo code>
import smtplib
from email.mime.text import MIMEText
from email.mime.multipart import MIMEMultipart

def send_email(smtp_server, port, username, password, from_email, to_email, subject, body, config_set=None):
    msg = MIMEMultipart()
    msg['From'] = from_email
    msg['To'] = to_email
    msg['Subject'] = subject
    msg['X-SES-TENANT'] = 'test1'
    if config_set:
        msg['X-SES-CONFIGURATION-SET'] = config_set
    msg.attach(MIMEText(body, 'plain'))

    with smtplib.SMTP(smtp_server, port) as server:
        server.starttls()
        server.login(username, password)
        server.send_message(msg)

# Example usage:
send_email('email-smtp.us-east-1.amazonaws.com', 587, 'YOUR_SMTP_USERNAME', 'YOUR_SMTP_PASSWORD','[email protected]', '[email protected]', 'Test Subject', 'Hello World', 'test1')
Email event feedback loop management for tenants
Receiving email events or using a feedback loop is important to monitor the email sending practices followed by the tenants. Tenant management provides reputation management capabilities for multi-tenant environments, so organizations can maintain granular control over email sending practices across their tenant base. You can automatically monitor and enforce reputation-based policies at the tenant level, so that problematic email sending behavior from one tenant doesn’t impact the deliverability of others. When reputation issues are detected, Amazon SES can automatically pause sending for the affected tenant while allowing other tenants to continue their email operations unimpeded.Organizations can now implement precise enforcement mechanisms through automated reputation findings that provide early detection of potential deliverability issues. Tenant isolation uses machine learning models and signal-based detection to identify problematic patterns in email sending behaviour. When issues are detected, Amazon SES automatically notifies the parent account and can trigger predetermined actions based on customizable thresholds. This granular control helps maintain strong deliverability rates across the entire email sending infrastructure while isolating and addressing issues at the tenant level.

Enforcement data and patterns
Unlike other communication channels that are governed by a patchwork of national laws, bulk email delivery is subject to requirements dictated by a handful of large inbox providers. Google, Yahoo, Microsoft, and several others set deliverability targets, leaving compliance up to the sender or service providers such as Amazon SES. Amazon SES, in turn, expects its direct customers, including multi-tenant providers, to monitor key signals of enforcement. If any of the tenants send rogue emails, Amazon SES expects the AWS customer to monitor key enforcement signals and take appropriate actions such as pausing or stopping the rogue tenants. Signals for enforcement and trust indicators are essential components of our email reputation management system. These signals are various data points and behaviours we monitor to assess the trustworthiness of email senders. Trust indicators, derived from these signals, provide a measure of a sender’s reputation and adherence to best practices. Amazon SES uses a combination of pre-send signals (such as account vetting and configuration) and post-send signals (including delivery success rates, bounce rates, and recipient engagement) to calculate reputation findings. These findings then inform automated enforcement actions and manual reviews, helping to ensure that our service maintains high deliverability standards while protecting recipients from unwanted or malicious emails. By continuously refining our signal analysis and enforcement processes, we strive to create a reliable and secure email ecosystem for all users.
Administrating tenant isolation and reputation management
When managing multiple tenants sending email through your SES account, you’ll want to monitor sending behaviour and reputation. Amazon SES provides a comprehensive monitoring system through reputation findings, which alert you when tenants exhibit concerning sending patterns. These findings appear in your dashboard and are delivered as events through Amazon EventBridge default event bus, letting you know immediately when issues arise.
As an email deferability administrator, your daily monitoring routine needs to include reviewing the tenant management dashboard where you can see all your tenants’ status at a glance. Pay particular attention to any reputation findings, which come in two levels—low and high severity. These findings indicate when tenants exceed acceptable thresholds for metrics like bounce rates or complaint rates. You can configure reputation policies to automatically pause tenant sending when these thresholds are breached, with options for standard enforcement (pausing on high severity findings) or strict enforcement (pausing on low severity findings).
When a tenant is paused, either automatically or manually, you’ll need to investigate the cause. The reputation findings provide detailed information about what triggered the pause, such as elevated bounce rates or complaint rates. After addressing the underlying issues with the tenant, you can reinstate their sending capabilities. During reinstatement, the tenant can continue sending while you monitor their metrics to verify that they return to healthy levels. After their metrics improve, the tenant will automatically transition back to a normal enabled status.
Available metrics and data points
These core reputation metrics are released by Amazon SES and can be routed to EventBridge. The event feedback loop will contain the tenant name and ID to enable tracking of tenant-specific bounce rates
- Complaint rates per tenant
- Third-party specific complaint rates
- Spamhaus IP listing status
- Email volume pattern
For ongoing management, you have full control over tenant resources and configurations. You can assign or remove sending identities and configuration sets as needed, adjust reputation policies, and manually pause sending if you observe concerning patterns. By using this combination of automated monitoring, clear reputation signals, and flexible management tools, you can maintain control over your tenants while preventing individual tenant issues from affecting your overall account reputation. The key is to stay proactive in monitoring the dashboard and reputation findings, and to act quickly when issues arise.
Conclusion
We’re excited to see how our customers will use the tenant management feature to transform their email operations, boost efficiency, and create better experiences for their users. To get started with tenant isolation simply visit the Amazon SES console or see Tenants in the Amazon SES Developer Guide. You can find details about pricing on the Amazon SES pricing page. We’re committed to improving tenant isolation and management based on your feedback and needs, and we look forward to bringing you even more powerful and flexible email management capabilities in the future. Start exploring multi-tenant management today with Amazon SES.
About the authors
 By attending the August 21 livestream event, you’ll hear from Aurora technical leaders and founders, including Swami Sivasubramanian, Ganapathy (G2) Krishnamoorthy, Yan Leshinsky, Grant McAlister, and Raman Mittal. You’ll learn directly from the architects who pioneered the separation of compute and storage in cloud databases, with technical insights into Aurora architecture and scaling capabilities. You’ll also get a glimpse into the future of database technology as Aurora engineers share their vision and discuss the complex challenges they’re working to solve on behalf of customers.


 2. This will start initializing the MCP servers in the background, allowing you to immediately start using Q Chat even if they are still loading. As a note, if these have not finished loading, your prompts will be handled without using any MCP servers. To check the status of the servers, run
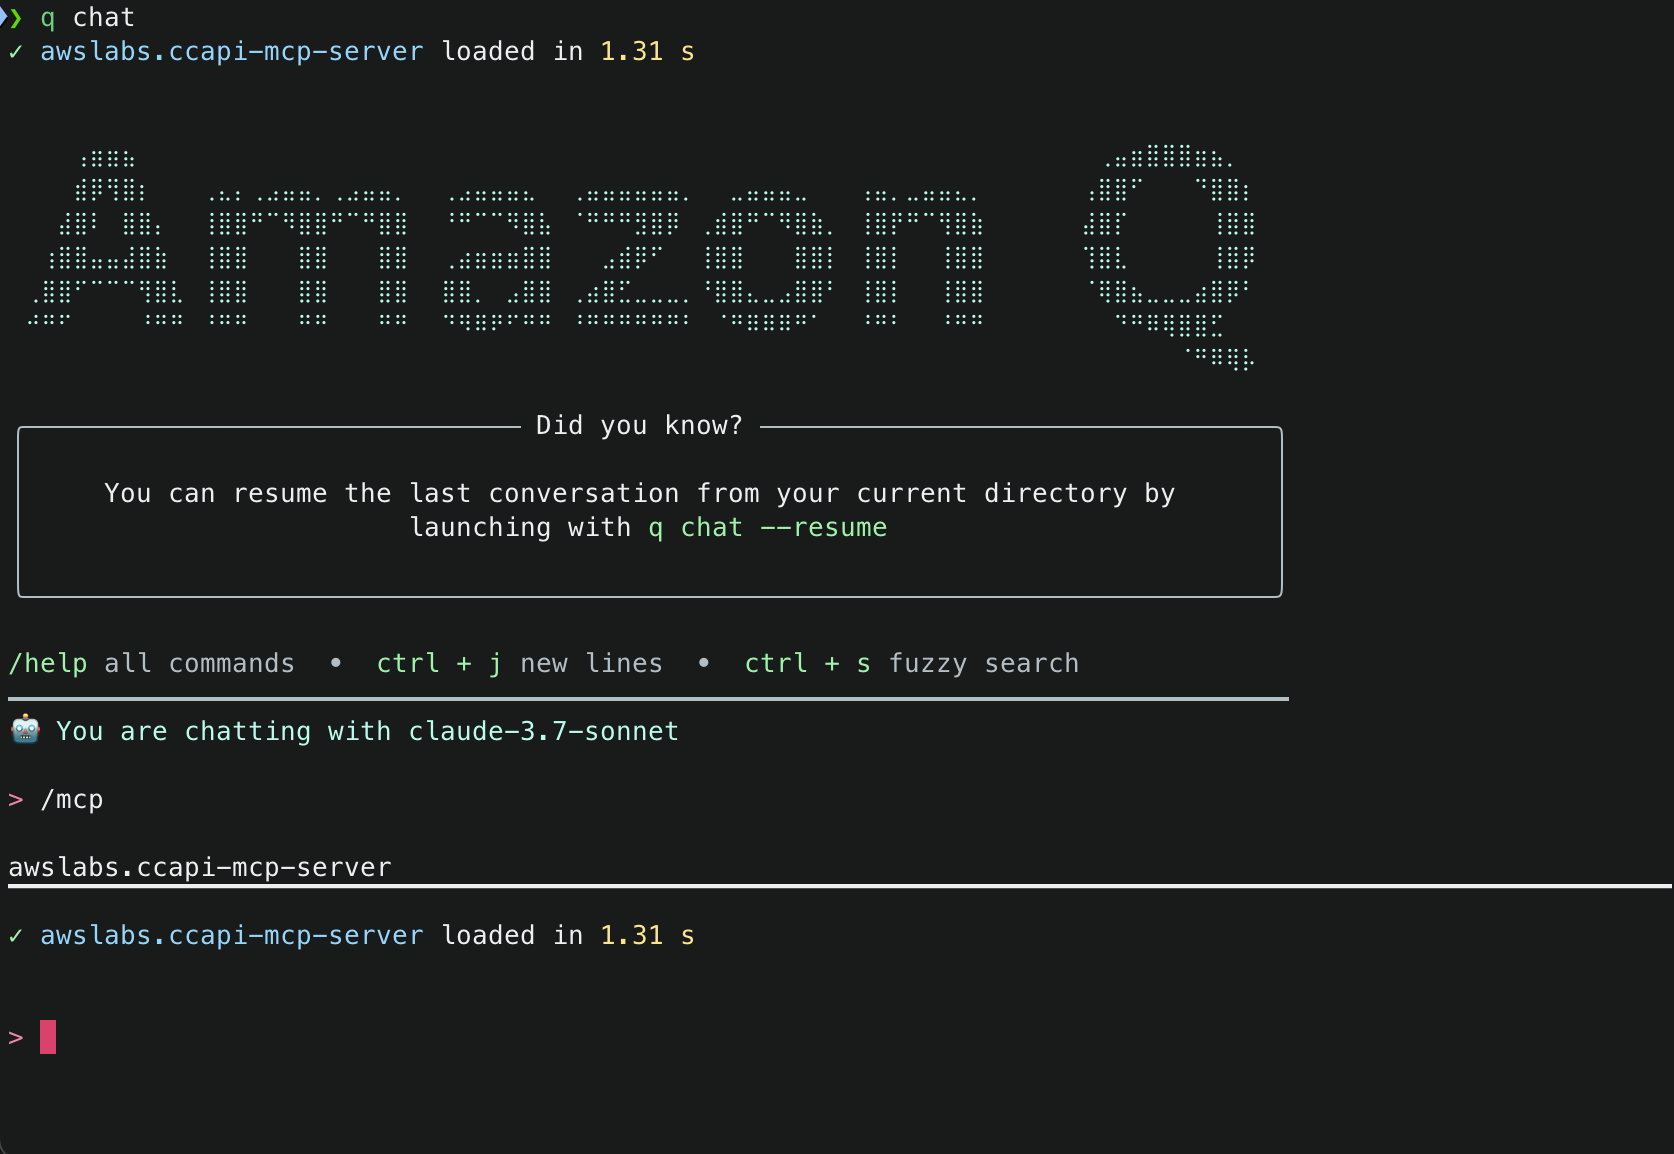
 Tomohiro Tanaka is a Senior Cloud Support Engineer at Amazon Web Services (AWS). He’s passionate about helping customers use Apache Iceberg for their data lakes on AWS. In his free time, he enjoys a coffee break with his colleagues and making coffee at home.
 Noritaka Sekiyama is a Principal Big Data Architect with AWS Analytics services. He’s responsible for building software artifacts to help customers. In his spare time, he enjoys cycling on his road bike.
 Sandeep Adwankar is a Senior Product Manager at Amazon Web Services (AWS). Based in the California Bay Area, he works with customers around the globe to translate business and technical requirements into products customers can use to improve how they manage, secure, and access data.
 Siddharth Padmanabhan Ramanarayanan is a Senior Software Engineer on the AWS Glue and AWS Lake Formation team, where he focuses on building scalable distributed systems for data analytics workloads. He is passionate about helping customers optimize their cloud infrastructure for performance and cost efficiency.
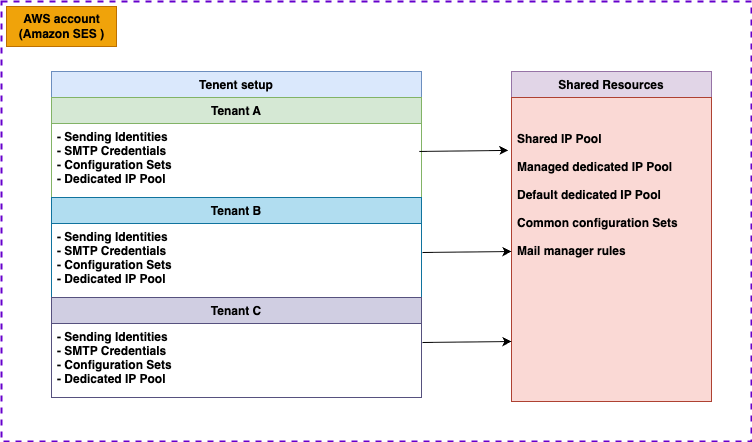
 Nadeem Bulsara is a Principal Solutions Architect at AWS specializing in Genomics and Life Sciences. He brings his 13+ years of Bioinformatics, Software Engineering, and Cloud Development skills as well as experience in research and clinical genomics and multi-omics to help Healthcare and Life Sciences organizations globally. He is motivated by the industry’s mission to enable people to have a long and healthy life.
 Chaitanya Vejendla is a Senior Solutions Architect specialized in DataLake & Analytics primarily working for Healthcare and Life Sciences industry division at AWS. Chaitanya is responsible for helping life sciences organizations and healthcare companies in developing modern data strategies, deploy data governance and analytical applications, electronic medical records, devices, and AI/ML-based applications, while educating customers about how to build secure, scalable, and cost-effective AWS solutions. His expertise spans across data analytics, data governance, AI, ML, big data, and healthcare-related technologies.
 Dr. Mileidy Giraldo has over 20 years of experience bridging bioinformatics, research, and industry technology strategy. She specializes in making technology accessible for organizations in the life sciences sector. In her current role as WW Lead for Life Sciences Strategy and Lab of the Future at AWS, she helps biotechs, biopharma, and diagnostics organizations design Data & AI-driven initiatives that modernize labs and help scientists unlock the full value of their data.
 Chris Clark is a Senior Solutions Architect focused on helping Life Science customers leverage AWS technology to advance their operational capabilities. With 20+ years of hands-on experience in life sciences manufacturing and supply chain, he combines deep industry knowledge with his AWS expertise to guide his customers. When he’s not working to solve customer challenges, he enjoys cycling and building and repairing things in his workshop.
 Nick Furr is a Specialist Solutions Architect at AWS, supporting Data & Analytics for Healthcare and Life Sciences. He helps providers, payers, and life sciences organizations build secure, scalable data platforms to drive innovation and improve outcomes. His work focuses on modernizing data strategies through cloud analytics, governed data processing, and machine learning for use cases like clinical research and population health.
 Subrat Das is a Principal Solutions Architect for Global Healthcare and Life Sciences accounts at AWS. He is passionate about modernizing and architecting complex customers workloads. When he’s not working on technology solutions, he enjoys long hikes and traveling around the world.