Post Syndicated from Kirankumar Chandrashekar original https://aws.amazon.com/blogs/devops/deploy-cloudformation-hooks-to-an-organization-with-service-managed-stacksets/
This post demonstrates using AWS CloudFormation StackSets to deploy CloudFormation Hooks from a centralized delegated administrator account to all accounts within an Organization Unit(OU). It provides step-by-step guidance to deploy controls at scale to your AWS Organization as Hooks using StackSets. By following this post, you will learn how to deploy a hook to hundreds of AWS accounts in minutes.
AWS CloudFormation StackSets help deploy CloudFormation stacks to multiple accounts and regions with a single operation. Using service-managed permissions, StackSets automatically generate the IAM roles required to deploy stack instances, eliminating the need for manual creation in each target account prior to deployment. StackSets provide auto-deploy capabilities to deploy stacks to new accounts as they’re added to an Organizational Unit (OU) in AWS Organization. With StackSets, you can deploy AWS well-architected multi-account solutions organization-wide in a single click and target stacks to selected accounts in OUs. You can also leverage StackSets to auto deploy foundational stacks like networking, policies, security, monitoring, disaster recovery, billing, and analytics to new accounts. This ensures consistent security and governance reflecting AWS best practices.
AWS CloudFormation Hooks allow customers to invoke custom logic to validate resource configurations before a CloudFormation stack create/update/delete operation. This helps enforce infrastructure-as-code policies by preventing non-compliant resources. Hooks enable policy-as-code to support consistency and compliance at scale. Without hooks, controlling CloudFormation stack operations centrally across accounts is more challenging because governance checks and enforcement have to be implemented through disjointed workarounds across disparate services after the resources are deployed. Other options like Config rules evaluate resource configurations on a timed basis rather than on stack operations. And SCPs manage account permissions but don’t include custom logic tailored to granular resource configurations. In contrast, CloudFormation hooks allows customer-defined automation to validate each resource as new stacks are deployed or existing ones updated. This enables stronger compliance guarantees and rapid feedback compared to asynchronous or indirect policy enforcement via other mechanisms.
Follow the later sections of this post that provide a step-by-step implementation for deploying hooks across accounts in an organization unit (OU) with a StackSet including:
- Configure service-managed permissions to automatically create IAM roles
- Create the StackSet in the delegated administrator account
- Target the OU to distribute hook stacks to member accounts
This shows how to easily enable a policy-as-code framework organization-wide.
I will show you how to register a custom CloudFormation hook as a private extension, restricting permissions and usage to internal administrators and automation. Registering the hook as a private extension limits discoverability and access. Only approved accounts and roles within the organization can invoke the hook, following security best practices of least privilege.
StackSets Architecture
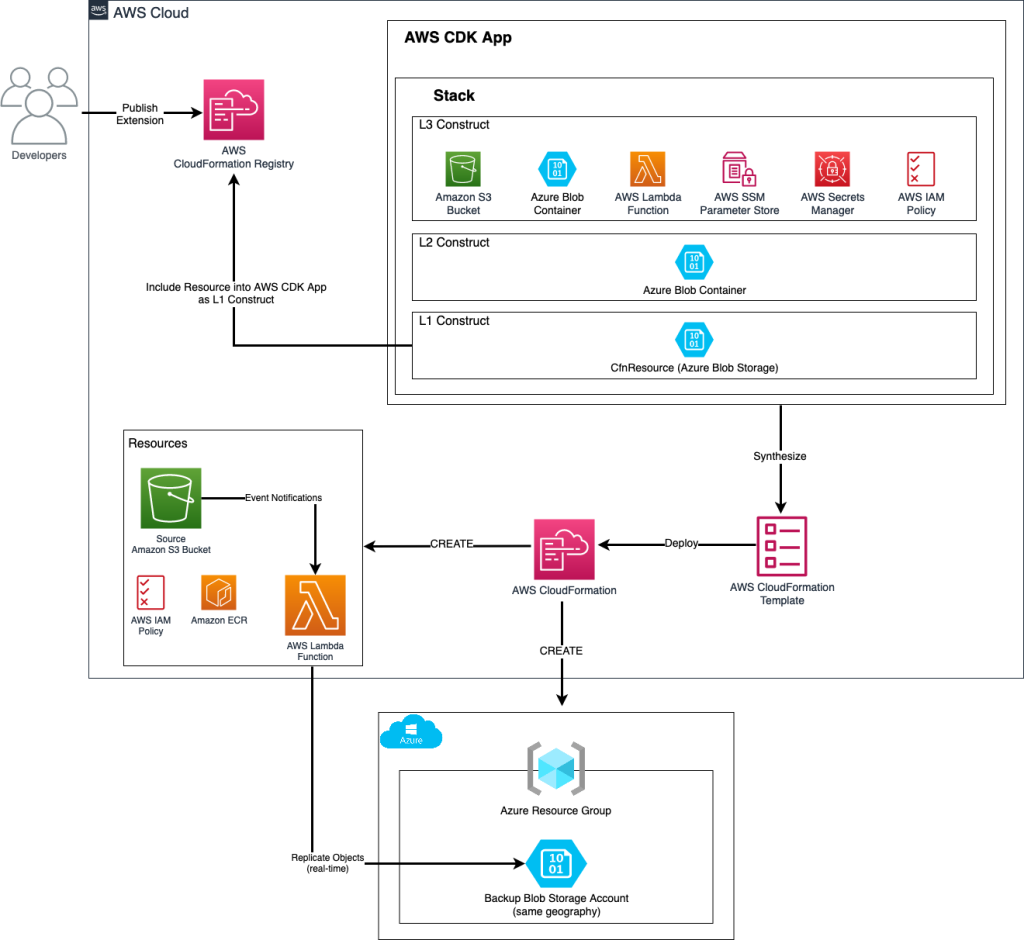
As depicted in the following AWS StackSets architecture diagram, a dedicated Delegated Administrator Account handles creation, configuration, and management of the StackSet that defines the template for standardized provisioning. In addition, these centrally managed StackSets are deploying a private CloudFormation hook into all member accounts that belong to the given Organization Unit. Registering this as a private CloudFormation hook enables administrative control over the deployment lifecycle events it can respond to. Private hooks prevent public usage, ensuring the hook can only be invoked by approved accounts, roles, or resources inside your organization.

Diagram 1: StackSets Delegated Administration and Member Account Diagram
In the above architecture, Member accounts join the StackSet through their inclusion in a central Organization Unit. By joining, these accounts receive deployed instances of the StackSet template which provisions resources consistently across accounts, including the controlled private hook for administrative visibility and control.
The delegation of StackSet administration responsibilities to the Delegated Admin Account follows security best practices. Rather than having the sensitive central Management Account handle deployment logistics, delegation isolates these controls to an admin account with purpose-built permissions. The Management Account representing the overall AWS Organization focuses more on high-level compliance governance and organizational oversight. The Delegated Admin Account translates broader guardrails and policies into specific infrastructure automation leveraging StackSets capabilities. This separation of duties ensures administrative privileges are restricted through delegation while also enabling an organization-wide StackSet solution deployment at scale.
Centralized StackSets facilitate account governance through code-based infrastructure management rather than manual account-by-account changes. In summary, the combination of account delegation roles, StackSet administration, and joining through Organization Units creates an architecture to allow governed, infrastructure-as-code deployments across any number of accounts in an AWS Organization.
Sample Hook Development and Deployment
In the section, we will develop a hook on a workstation using the AWS CloudFormation CLI, package it, and upload it to the Hook Package S3 Bucket. Then we will deploy a CloudFormation stack that in turn deploys a hook across member accounts within an Organization Unit (OU) using StackSets.
The sample hook used in this blog post enforces that server-side encryption must be enabled for any S3 buckets and SQS queues created or updated on a CloudFormation stack. This policy requires that all S3 buckets and SQS queues be configured with server-side encryption when provisioned, ensuring security is built into our infrastructure by default. By enforcing encryption at the CloudFormation level, we prevent data from being stored unencrypted and minimize risk of exposure. Rather than manually enabling encryption post-resource creation, our developers simply enable it as a basic CloudFormation parameter. Adding this check directly into provisioning stacks leads to a stronger security posture across environments and applications. This example hook demonstrates functionality for mandating security best practices on infrastructure-as-code deployments.
Prerequisites
On the AWS Organization:
- An AWS Organization setup with a management account or a delegated administrator for stack set deployments. For more information, see CloudFormation StackSets delegated administration for setting a delegated administrator.
- An AWS Organization setup with Organization Units with AWS accounts. For more information, refer Managing organizational units.
- Enable trusted access to CloudFormation StackSets with AWS Organizations. This is required for the service-managed permissions to work. Follow the steps in the AWS CloudFormation User Guide to enable trusted access with AWS Organizations.
On the workstation where the hooks will be developed:
- AWS CloudFormation CLI installed
- Any Code editor or a Cloud9 Instance
- AWS CLI installedand configured with your AWS credentials that has access to the delegated administrator account. This post uses the
us-west-2Region.aws configure Default region name [us-east-1]: us-west-2
In the Delegated Administrator account:
Create a hooks package S3 bucket within the delegated administrator account. Upload the hooks package and CloudFormation templates that StackSets will deploy. Ensure the S3 bucket policy allows access from the AWS accounts within the OU. This access lets AWS CloudFormation access the hooks package objects and CloudFormation template objects in the S3 bucket from the member accounts during stack deployment.
Follow these steps to deploy a CloudFormation template that sets up the S3 bucket and permissions:
- Click here to download the
admin-cfn-hook-deployment-s3-bucket.yamltemplate file in to your local workstation.
Note: Make sure you model the S3 bucket and IAM policies as least privilege as possible. For the above S3 Bucket policy, you can add a list of IAM Role ARNs created by the StackSets service managed permissions instead of AWS: “*”, which allows S3 bucket access to all the IAM entities from the accounts in the OU. The ARN of this role will be “arn:aws:iam:::role/stacksets-exec-” in every member account within the OU. For more information about equipping least privilege access to IAM policies and S3 Bucket Policies, refer IAM Policies and Bucket Policies and ACLs! Oh, My! (Controlling Access to S3 Resources) blog post. - Execute the following command to deploy the template
admin-cfn-hook-deployment-s3-bucket.yamlusing AWS CLI. For more information see Creating a stack using the AWS Command Line Interface. If using AWS CloudFormation console, see Creating a stack on the AWS CloudFormation console.
To get the OU Id, see Viewing the details of an OU. OU Id starts with “ou-“. To get the Organization Id, see Viewing details about your organization. Organization Id starts with “o-”aws cloudformation create-stack \ --stack-name hooks-asset-stack \ --template-body file://admin-cfn-deployment-s3-bucket.yaml \ --parameters ParameterKey=OrgId,ParameterValue="<Org_id>" \ ParameterKey=OUId,ParameterValue="<OU_id>" - After deploying the stack, note down the AWS S3 bucket name from the CloudFormation Outputs.
Hook Development
In this section, you will develop a sample CloudFormation hook package that will enforce encryption for S3 Buckets and SQS queues within the preCreate and preDelete hook. Follow the steps in the walkthrough to develop a sample hook and generate a zip package for deploying and enabling them in all the accounts within an OU. While following the walkthrough, within the Registering hooks section, make sure that you stop right after executing the cfn submit --dry-run command. The --dry-run option will make sure that your hook is built and packaged your without registering it with CloudFormation on your account. While initiating a Hook project if you created a new directory with the name mycompany-testing-mytesthook, the hook package will be generated as a zip file with the name mycompany-testing-mytesthook.zip at the root your hooks project.
Upload mycompany-testing-mytesthook.zip file to the hooks package S3 bucket within the Delegated Administrator account. The packaged zip file can then be distributed to enable the encryption hooks across all accounts in the target OU.
Note: If you are using your own hooks project and not doing the tutorial, irrespective of it, you should make sure that you are executing the cfn submit command with the --dry-run option. This ensures you have a hooks package that can be distributed and reused across multiple accounts.
Hook Deployment using CloudFormation Stack Sets
In this section, deploy the sample hook developed previously across all accounts within an OU. Use a centralized CloudFormation stack deployed from the delegated administrator account via StackSets.
Deploying hooks via CloudFormation requires these key resources:
- AWS::CloudFormation::HookVersion: Publishes a new hook version to the CloudFormation registry
- AWS::CloudFormation::HookDefaultVersion: Specifies the default hook version for the AWS account and region
- AWS::CloudFormation::HookTypeConfig: Defines the hook configuration
- AWS::IAM::Role #1: Task execution role that grants the hook permissions
- AWS::IAM::Role #2: (Optional) role for CloudWatch logging that CloudFormation will assume to send log entries during hook execution
- AWS::Logs::LogGroup: (Optional) Enables CloudWatch error logging for hook executions
Follow these steps to deploy CloudFormation Hooks to accounts within the OU using StackSets:
- Click here to download the
hooks-template.yamltemplate file into your local workstation and upload it into the Hooks package S3 bucket in the Delegated Administrator account. - Deploy the hooks CloudFormation template
hooks-template.yamlto all accounts within an OU using StackSets. Leverage service-managed permissions for automatic IAM role creation across the OU.
To deploy the hooks templatehooks-template.yamlacross OU using StackSets, click here to download the CloudFormation StackSets templatehooks-stack-sets-template.yamllocally, and upload it to the hooks package S3 bucket in the delegated administrator account. This StackSets template contains anAWS::CloudFormation::StackSetresource that will deploy the necessary hooks resources fromhooks-template.yamlto all accounts in the target OU. UsingSERVICE_MANAGEDpermissions model automatically handle provisioning the required IAM execution roles per account within the OU. - Execute the following command to deploy the template
hooks-stack-sets-template.yamlusing AWS CLI. For more information see Creating a stack using the AWS Command Line Interface. If using AWS CloudFormation console, see Creating a stack on the AWS CloudFormation console.To get the S3 Https URL for the hooks template, hooks package and StackSets template, login to the AWS S3 service on the AWS console, select the respective object and click on Copy URL button as shown in the following screenshot:
Diagram 2: S3 Https URL
To get the OU Id, see Viewing the details of an OU. OU Id starts with “ou-“.
Make sure to replace the <S3BucketName> and then <OU_Id> accordingly in the following command:aws cloudformation create-stack --stack-name hooks-stack-set-stack \ --template-url https://<S3BucketName>.s3.us-west-2.amazonaws.com/hooks-stack-sets-template.yaml \ --parameters ParameterKey=OuId,ParameterValue="<OU_Id>" \ ParameterKey=HookTypeName,ParameterValue="MyCompany::Testing::MyTestHook" \ ParameterKey=s3TemplateURL,ParameterValue="https://<S3BucketName>.s3.us-west-2.amazonaws.com/hooks-template.yaml" \ ParameterKey=SchemaHandlerPackageS3URL,ParameterValue="https://<S3BucketName>.s3.us-west-2.amazonaws.com/mycompany-testing-mytesthook.zip" - Check the progress of the stack deployment using the
aws cloudformation describe-stackcommand. Move to the next section when the stack status isCREATE_COMPLETE.aws cloudformation describe-stacks --stack-name hooks-stack-set-stack - If you navigate to the AWS CloudFormation Service’s StackSets section in the console, you can view the stack instances deployed to the accounts within the OU. Alternatively, you can execute the AWS CloudFormation list-stack-instances CLI command below to list the deployed stack instances:
aws cloudformation list-stack-instances --stack-set-name MyTestHookStackSet

Testing the deployed hook
Deploy the following sample templates into any AWS account that is within the OU where the hooks was deployed and activated. Follow the steps in the Creating a stack on the AWS CloudFormation console. If using AWS CloudFormation CLI, follow the steps in the Creating a stack using the AWS Command Line Interface.
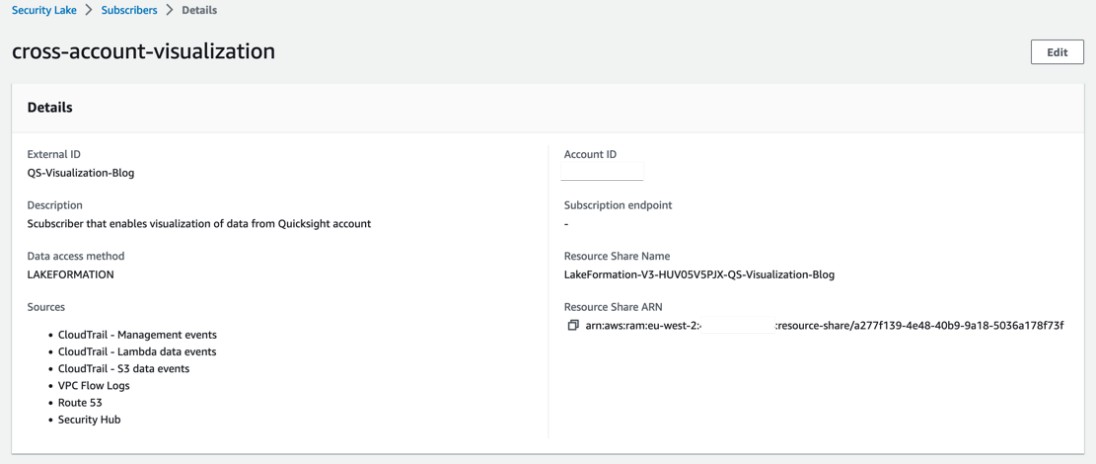
- Provision a non-compliant stack without server-side encryption using the following template:
AWSTemplateFormatVersion: 2010-09-09
Description: |
  This CloudFormation template provisions an S3 Bucket
Resources:
  S3Bucket:
    Type: 'AWS::S3::Bucket'
    Properties: {}
The stack deployment will not succeed and will give the following error message
The following hook(s) failed: [MyCompany::Testing::MyTestHook]and the hook status reason as shown in the following screenshot:
Diagram 3: S3 Bucket creation failure with hooks execution - Provision a stack using the following template that has server-side encryption for the S3 Bucket.
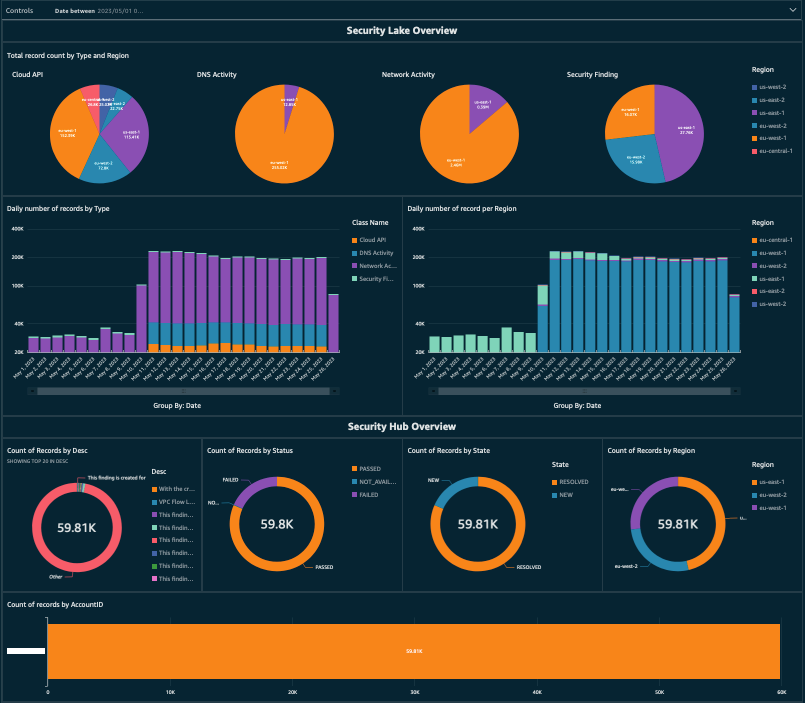
AWSTemplateFormatVersion: 2010-09-09
Description: |
  This CloudFormation template provisions an encrypted S3 Bucket. **WARNING** This template creates an Amazon S3 bucket and a KMS key that you will be charged for. You will be billed for the AWS resources used if you create a stack from this template.
Resources:
  EncryptedS3Bucket:
    Type: "AWS::S3::Bucket"
    Properties:
      BucketName: !Sub "encryptedbucket-${AWS::Region}-${AWS::AccountId}"
      BucketEncryption:
        ServerSideEncryptionConfiguration:
          - ServerSideEncryptionByDefault:
              SSEAlgorithm: "aws:kms"
              KMSMasterKeyID: !Ref EncryptionKey
            BucketKeyEnabled: true
  EncryptionKey:
    Type: "AWS::KMS::Key"
    DeletionPolicy: Retain
    UpdateReplacePolicy: Retain
    Properties:
      Description: KMS key used to encrypt the resource type artifacts
      EnableKeyRotation: true
      KeyPolicy:
        Version: 2012-10-17
        Statement:
          - Sid: Enable full access for owning account
            Effect: Allow
            Principal:
              AWS: !Ref "AWS::AccountId"
            Action: "kms:*"
            Resource: "*"
Outputs:
  EncryptedBucketName:
    Value: !Ref EncryptedS3Bucket
The deployment will succeed as it will pass the hook validation with the following hook status reason as shown in the following screenshot:
 Diagram 4: S3 Bucket creation success with hooks execution

 Diagram 4: S3 Bucket creation success with hooks execution
Updating the hooks package
To update the hooks package, follow the same steps described in the Hooks Development section to change the hook code accordingly. Then, execute the cfn submit --dry-run command to build and generate the hooks package file with the registering the type with the CloudFormation registry. Make sure to rename the zip file with a unique name compared to what was previously used. Otherwise, while updating the CloudFormation StackSets stack, it will not see any changes in the template and thus not deploy updates. The best practice is to use a CI/CD pipeline to manage the hook package. Typically, it is good to assign unique version numbers to the hooks packages so that CloudFormation stacks with the new changes get deployed.
Cleanup
Navigate to the AWS CloudFormation console on the Delegated Administrator account, and note down the Hooks package S3 bucket name and empty its contents. Refer to Emptying the Bucket for more information.
Delete the CloudFormation stacks in the following order:
- Test stack that failed
- Test stack that passed
- StackSets CloudFormation stack. This has a DeletionPolicy set to Retain, update the stack by removing the DeletionPolicy and then initiate a stack deletion via CloudFormation or physically delete the StackSet instances and StackSets from the Console or CLI by following: 1. Delete stack instances from your stack set 2. Delete a stack set
- Hooks asset CloudFormation stack
Refer to the following documentation to delete CloudFormation Stacks: Deleting a stack on the AWS CloudFormation console or Deleting a stack using AWS CLI.
Conclusion
Throughout this blog post, you have explored how AWS StackSets enable the scalable and centralized deployment of CloudFormation hooks across all accounts within an Organization Unit. By implementing hooks as reusable code templates, StackSets provide consistency benefits and slash the administrative labor associated with fragmented and manual installs. As organizations aim to fortify governance, compliance, and security through hooks, StackSets offer a turnkey mechanism to efficiently reach hundreds of accounts. By leveraging the described architecture of delegated StackSet administration and member account joining, organizations can implement a single hook across hundreds of accounts rather than manually enabling hooks per account. Centralizing your hook code-base within StackSets templates facilitates uniform adoption while also simplifying maintenance. Administrators can update hooks in one location instead of attempting fragmented, account-by-account changes. By enclosing new hooks within reusable StackSets templates, administrators benefit from infrastructure-as-code descriptiveness and version control instead of one-off scripts. Once configured, StackSets provide automated hook propagation without overhead. The delegated administrator merely needs to include target accounts through their Organization Unit alignment rather than handling individual permissions. New accounts added to the OU automatically receive hook deployments through the StackSet orchestration engine.
About the Author

Kirankumar Chandrashekar is a Sr. Solutions Architect for Strategic Accounts at AWS. He focuses on leading customers in architecting DevOps, modernization using serverless, containers and container orchestration technologies like Docker, ECS, EKS to name a few. Kirankumar is passionate about DevOps, Infrastructure as Code, modernization and solving complex customer issues. He enjoys music, as well as cooking and traveling.


 Parnab Basak is a Senior Solutions Architect and a Serverless Specialist at AWS. He specializes in creating new solutions that are cloud native using modern software development practices like serverless, DevOps, and analytics. Parnab works closely in the analytics and integration services space helping customers adopt AWS services for their workflow orchestration needs.
 Chandan Rupakheti is a Solutions Architect and a Serverless Specialist at AWS. He is a passionate technical leader, researcher, and mentor with a knack for building innovative solutions in the cloud and bringing stakeholders together in their cloud journey. Outside his professional life, he loves spending time with his family and friends besides listening and playing music.
 Vinod Jayendra is a Enterprise Support Lead in ISV accounts at Amazon Web Services, where he helps customers in solving their architectural, operational, and cost optimization challenges. With a particular focus on Serverless technologies, he draws from his extensive background in application development to deliver top-tier solutions. Beyond work, he finds joy in quality family time, embarking on biking adventures, and coaching youth sports team.
 Rupesh Tiwari is a Senior Solutions Architect at AWS in New York City, with a focus on Financial Services. He has over 18 years of IT experience in the finance, insurance, and education domains, and specializes in architecting large-scale applications and cloud-native big data workloads. In his spare time, Rupesh enjoys singing karaoke, watching comedy TV series, and creating joyful moments with his family.


 Sakti Mishra is a Principal Solutions Architect at AWS, where he helps customers modernize their data architecture and define their end-to-end data strategy, including data security, accessibility, governance, and more. He is also the author of the book
  Bhavana Chirumamilla is a Senior Resident Architect at AWS with a strong passion for data and machine learning operations. She brings a wealth of experience and enthusiasm to help enterprises build effective data and ML strategies. In her spare time, Bhavana enjoys spending time with her family and engaging in various activities such as traveling, hiking, gardening, and watching documentaries.
 Sheela Sonone is a Senior Resident Architect at AWS. She helps AWS customers make informed choices and trade-offs about accelerating their data, analytics, and AI/ML workloads and implementations. In her spare time, she enjoys spending time with her family—usually on tennis courts.
 Daniel Bruno is a Principal Resident Architect at AWS. He had been building analytics and machine learning solutions for over 20 years and splits his time helping customers build data science programs and designing impactful ML products.


 Shoukat Ghouse is a Senior Big Data Specialist Solutions Architect at AWS. He helps customers around the world build robust, efficient and scalable data platforms on AWS leveraging AWS analytics services like AWS Glue, AWS Lake Formation, Amazon Athena and Amazon EMR.