Developers today face a constant balancing act – building new features and functionality while also ensuring the security and reliability of their codebase. Two powerful tools, Snyk and Amazon Q Developer, can work in tandem to help developers navigate this challenge with greater efficiency and efficacy.
Snyk is a leading developer security platform that empowers developers to seamlessly secure their code, open-source dependencies, container images, and cloud infrastructure all from a single, unified platform. Amazon Q Developer is a generative AI-powered assistant designed to accelerate a variety of tasks across the software development lifecycle. By combining the security insights from Snyk with the assistive capabilities of Amazon Q Developer, developers can streamline their workflows and focus on delivery.
Getting started with Amazon Q Developer and Snyk IDE Plugins
To get started with Amazon Q Developer, you need to have an AWS Builder ID or be part of an organization with an AWS IAM Identity Center instance that allows you to use Amazon Q. To use Amazon Q Developer agents for software development in Visual Studio Code, start by installing the Amazon Q extension. Find the latest version of the extension on the Amazon Q Developer page. The extension is also available for JetBrains, Eclipse (Preview), and Visual Studio IDEs. For a detailed list of supported IDEs and the features available in each, refer to the Amazon Q Developer documentation.
To get started with Snyk, sign up for a free Snyk account or log in with your existing account. To use Snyk in your IDE to automatically find security issues, review the IDE documentation and install Snyk using your IDE extension marketplace. After Snyk is installed, navigate to the Snyk panel in your IDE and follow the on-screen instructions to authenticate with your Snyk account.
After authenticating, Snyk will automatically scan your entire codebase for security issues. Snyk will continue scanning periodically as you write code or generate code with Amazon Q Developer.
Walkthrough
Let’s explore how Snyk and Amazon Q Developer can be used together through a few examples. Imagine that you maintain an open-source project. As a new Snyk user, you would like to find and fix the security issues in the project. In this first and simple scenario, Snyk has identified many cases of security vulnerabilities in specific lines of code. Among the vulnerabilities, we’ll focus on the Information Exposure vulnerability.
Figure 1 – Snyk IDE Plugin displaying vulnerability analysis of an Information Exposure issue, showing severity, affected code, and prevention tips.
Rather than manually researching and implementing the fix, you can simply highlight the flagged line, invoke Amazon Q Developer’s inline chat by pressing ⌘+I (Mac) or Ctrl+I (Windows), and request assistance. Amazon Q Developer will analyze the issue, propose the necessary code changes, and provide you with an inline diff to review and accept. This allows for rapid remediation of security flaws saving time while improving the code.
Figure 2 – Activating Amazon Q Developer inline code generation to fix the detected information exposure vulnerability.
We are happy with the change Amazon Q Developer proposed, so we’ll simply hit enter to accept the suggestions. Of course, we could always hit escape to reject the suggestion if needed.
Figure 3 – Amazon Q Developer displaying an inline code generation to fix the detected information exposure vulnerability.
In addition to the inline chat, you can pass the vulnerability details directly from the Snyk plugin’s Problems view into the Amazon Q Developer /dev agentic capability.
In the chat interface of Q Developer, the /dev agentic capability allows longer conversation, broader workspace context, and handle changes within multiple files and topics. When this workflow is invoked, the Amazon Q Developer Agent will generate code based on the description and existing code in the workspace, provide a list of suggestions to review and add to the workspace, and if needed, iterate on the code based on feedback.
Figure 4 – Using Amazon Q’s /dev agent to implement project-wide fixes for Snyk-detected vulnerabilities across multiple files.
Not all issues are trivial as the prior example. In a more complex case, Snyk may surface a vulnerability that requires a deeper understanding of the code and the potential risk. Let’s look at another issue that Snyk identified in the project we have been discussing.
Figure 5 – Snyk Plugin highlighting a cross-site scripting (XSS) vulnerability, showing the affected code line and prevention recommendations.
Here, you can switch to Amazon Q Developer’s chat interface, provide the details of the issue, and ask for a more thorough explanation. Amazon Q Developer can then dive into the codebase, explain the problem in detail, and walk you through the appropriate fixes. This collaborative approach empowers developers to make informed decisions and gain broader knowledge, rather than simply implementing a suggestion.
Figure 6 – Amazon Q Developer’s chat interface explaining an XSS vulnerability and its security implications through natural language dialogue.
Note that Amazon Q Developer provides links to documentation and other sources for further reading. In addition, you can continue discussing the issue to learn more. For example, imagine that you want to understand real world breaches that have occurred as a result of the issues that Synk has identified. Q provides a few examples for me to learn more.
Figure 7 – Amazon Q Developer discussing notable real-world XSS breach examples and their security impacts.
Beyond fixing issues, Amazon Q Developer can also assist with other development tasks identified by Snyk, such as updating dependencies, refactoring code, or optimizing cloud infrastructure. By integrating these two tools, developers can streamline security scanning, issue investigation, and remediation, dramatically increasing their overall productivity.
Conclusion
In this blog, we took a look at how Snyk and Amazon Q Developer are a powerful duo in the modern developer’s toolkit. Integrating Snyk’s leading security insights with the generative AI capabilities of Amazon Q Developer empowers developers to more efficiently identify, comprehend, and address security vulnerabilities. This combination enables developers to upskill and enhance their own abilities as they work to resolve security issues. Get started with installing the Amazon Q Developer in the IDE and Snyk plugin.
Software runs the world – not just the new software applications built in modern languages and deployed on the most optimized cloud infrastructure, but also legacy software built over years and barely understood by the teams that inherit them. These legacy applications may have snowballed into monolithic blocks or may be fragmented across siloed on-premises infrastructure. The significant maintenance, security, and compliance challenges caused can create lasting implications for business performance and competitiveness. Therefore, transformation of legacy applications using modern languages, new frameworks, and cloud services has become an organizational imperative.
Application modernization challenges
Modernization of software applications is a long and painful journey – requiring large teams of developers, domain experts, and consultants who first need to understand the application landscape, devise strategic modernization plans, and then tactically implement the plans in phases, typically over a span of many years. This process is linear, slow, and complex. Traditional labor-intensive modernization approaches incur significant costs and take years to leverage new cloud technologies and innovations for business-critical applications.
Generative AI can help with intelligent automation, domain expertise, and scalability to transform modernization journeys.
Amazon Q Developer, the most capable generative AI–powered assistant for software development, is now the first generative AI-powered assistant for large-scale modernization and migration of .NET, mainframe, and VMware workloads. This extends Q Developer’s transformation capabilities for Java upgrades launched in April 2024 to new types of workloads. Q Developer combines both foundational models and specialized tools based on AI and automated reasoning via autonomous agents that tackle workload-specific modernization steps spanning analysis, planning, and implementation.
Multifunctional teams, including consultants, IT experts, workload domain experts, and developers, can use a unified web experience to offload transformation tasks to Amazon Q Developer agents and transform hundreds of workloads at a time. The agents can port .NET Framework to cross-platform Linux-ready .NET, modernize COBOL applications on mainframes to Java applications on AWS, or virtualized workloads on VMware to scalable workloads on EC2. The modernization teams engage with Q Developer using natural language and share transformation objectives, code repositories, and context. Q Developer agents analyze artifacts like code segments, dependencies, and integrations, applying expertise from prior modernizations. They propose customized plans tailored to codebases, resource utilization, and objectives. The teams can then review, adjust, and approve the plans with iterative engagement with the agents. After the plans are approved, the agents implement the transformation keeping the modernization teams updated on milestones completed and blockers needing human guidance. The transformation journey is an interactive process between the modernization team and Q Developer, with modernization team maintaining control and visibility over the transformation.
Natural language chat with Q Developer AI agents
Faster, scalable, and better modernization
Amazon Q Developer enhances transformation in three primary ways – acceleration, scalability, and quality.
Amazon Q Developer automates and accelerates complex, multi-step processes. Agents conduct assessment and discovery of legacy artifacts to build documentation and dependency maps that improve the understanding of source assets. Most large-scale modernization projects are done in waves that need to be carefully planned. The agents develop modernization wave plans based on source dependencies, stated project goals, and teams can review and approve the plans. Thereafter, the goal-seeking autonomous agents handle implementation complexities to execute the plans. Customers using Amazon Q Developer can modernize Windows .NET applications to Linux up to four times faster than traditional methods and help customers realize up to 40% savings in licensing costs. Migration Planning for the sequence to transform monolith z/OS COBOL application code that takes months to accomplish with human subject matter experts, Amazon Q Developer generates in minutes. Q Developer agents convert on-premises VMware network configurations into modern AWS equivalents in hours vs. the weeks required with traditional manual approaches. The shorter time spent on manual modernization means more freedom for your team to focus on innovation.
Modernization has traditionally been a linear journey with multiple steps and dependencies on cross-functional teams with limited mechanisms for collaboration. This limits teams’ ability to tackle large-scale projects. Amazon Q Developer addresses the challenges by task parallelization and web-based collaboration. Multiple generative AI agents work simultaneously on tasks. Large monolithic applications can be decomposed along business functions like engineering, marketing, sales applications, and transformed in parallel. A unified web-based experience for large-scale transformation means multi-functional team members can collaborate with the autonomous agents, and review and approve key decisions in one place, enabling teams to execute larger and more complex projects in a given time.
Finally, the quality of transformation manifested in functional equivalence, security, and resilience of modernized applications determines the business outcomes like project ROI and operational performance. To ensure transformation quality, you need expertise in languages and frameworks like COBOL, Java, .NET; specialized steps like code base analysis, monolith decomposition, code refactoring, network translation; and domains like mainframe, virtualization, and cloud. You may not have the requisite expertise in your team. That is where Amazon Q Developer can help. Q Developer agents are trained with specific domain expertise to identify code dependencies and frameworks, replace deprecated code, upgrade to new language frameworks, incorporate security best practices, and validate upgraded workloads using workload-tailored plans. Your team can examine the agents’ recommendations, make informed decisions, and guide the modernization journey towards better outcomes like enhanced security, compliance, and performance.
Workloads supported by Amazon Q Developer transformation capabilities
Next steps
Amazon Q Developer transformation capabilities are now available in preview. To learn more, please visit Q Developer web page featuring short demo videos and documentation that can get you started. Read the AWS News blogs that walk you through the unified web experience and IDE experience. Dive deeper into the transformation of specific workloads by reading the workload-specific blogs related to transformation of .NET, mainframe, and VMware workloads.
As I sat down to write this post, my daughter called from the top of the Eiffel Tower on a trip with her high school class. While she excitedly pointed her camera toward the Parisian skyline, I was struck by how technology has transformed our concept of distance. Her world, at eighteen, is infinitely more connected than the one I knew at her age. I couldn’t help but smile at the timing of this call, because today Amazon Q Developer is expanding to Europe.
The launch of Amazon Q Developer Pro Tier in the Frankfurt (eu-central-1) region marks a significant milestone for our European customers, addressing two critical needs: data residency and performance optimization. For organizations that need to meet EU data residency requirements, the ability to store customer content within EU boundaries can help provide the assurances they require. Beyond compliance, this regional presence brings performance benefits. European customers will experience reduced latency in their interactions with Amazon Q Developer, as requests are processed closer to home. This proximity not only improves response times but also enhances the overall development experience, making real-time interactions with Amazon Q Developer more fluid and natural.
Amazon Q Developer Pro tier users now have the choice of creating a profile in N. Virginia (us-east-1) or Frankfurt (eu-central-1). Associated data – including customizations – is stored in this region. While data is stored in Frankfurt, Amazon Q utilizes cross-region inferencing to optimize request processing. At launch, this includes Frankfurt, Ireland, Paris and Stockholm, as shown in the following image.
Finally, it is important to note that certain operations, such as querying AWS resources in other regions (e.g. “List my S3 buckets in Tokyo”), will naturally involve cross-region calls regardless of your Q Developer profile’s location.
The Frankfurt region includes all GA features except the command line and the ability to chat with Support. You can read more in the Amazon Q Developer User Guide. We invite you to experience these new capabilities by upgrading to the Pro tier and selecting Frankfurt as your region during profile creation. Get started with Amazon Q Developer, and share your feedback with us as we continue to expand our global presence.
In the fast-paced world of software development, maintaining comprehensive documentation often falls to the bottom of priority lists in favor of delivering functionality. Amazon Q Developer’s /doc agent changes this equation by automating README generation and updates. With this tool, the variable of time spent producing documentation is reduced to the point that it’s no longer a burden to the detriment of functionality.
The /doc agent leverages generative AI to analyze your codebase and generate comprehensive documentation. Additionally, the agent respects your .gitignore file and excludes files you don’t want to be included in documentation review.
Solution Overview: As an example, imagine a cloud infrastructure team at a technology consultancy had been working for weeks on their AWS DataSync project. The solution they built provided an elegant CDK implementation that automated data transfer between Amazon S3 buckets using AWS DataSync. The lead engineer had just finished implementing the final IAM role configurations when the product manager requested comprehensive documentation for the next day’s client handoff meeting. The team realized this would typically take hours of focused work. Instead, they decided to try Amazon Q Developer /doc agent.
Open your IDE with the Amazon Q extension installed
Click the Amazon Q icon to open the chat panel
Enter /doc to start the documentation process
Select your documentation task:
Create a new README
Update an existing README with recent code changes
Figure 1 – Entering /doc to start the documentation process.
Example: Creating a New README:
For projects without documentation, simply select: Create a README. It will confirm the project you are creating the README for.
Figure 2 – Select the Create a README option.
Once you verify the folder and select yes, the agent begins creating the README document for the folder. Here are the steps it works through: scanning the source files, summarizing the source files, and generating the documentation.
Figure 3 – Verify the folder and select yes.
When the document is created, you can preview the README file. The agent then presents you with the ability to either accept the changes or request modifications before implementation.
Figure 4 – Preview the created README file.
If you choose to accept, the README file is added to your project.
Figure 5 – Accept the changes so the README is added to your project folder.
Example: Updating Documentation with Code Changes
When your code evolves, you can keep the documentation synchronized by using /doc. The agent will review your recent code modifications and suggest appropriate documentation updates.
Figure 6 – Select Update an existing README to make changes to a README file.
Then you can describe the changes you want the agent to make to your README file.
Figure 7 – Describe changes to your README files.
For targeted documentation updates, you can provide specific instructions:
Figure 8 – Verify the folder and select yes.
Once you’ve made the changes, the agent asks you to verify them by selecting yes.
Figure 9 – Verify the changes and select yes.
Advanced Documentation Management
Multi-step Documentation Refinement:
Figure 10 – Multi-step Documentation Refinement.
Amazon Q Developer /doc agent allows for iterative improvement of your documentation through feedback loops. After generating initial documentation, you can:
Review the generated content for gaps or inaccuracies
Provide specific feedback to refine particular sections
Request additional sections on complex topics
Gradually build comprehensive documentation through multiple iterations
This iterative approach is particularly valuable for complex projects where documentation needs to evolve alongside the codebase.
Documentation for Specific Components
For modular projects, you can create targeted documentation at different levels:
Root-level README for project overview
Component-level READMEs for specific modules
Service-level documentation for microservices
API documentation for interfaces
By combining these documentation levels, you can maintain a hierarchical documentation structure that remains manageable and specific.
Handling Documentation Inheritance
Figure 11 – Handling Documentation Inheritance.
When working with derived or extended codebases:
Generate base documentation for the parent project
Create specialized documentation for extensions
Cross-reference related documentation to maintain consistency
Use the /doc agent to update specific sections when inheritance patterns change
Documentation Syncing Strategy
Figure 12 – Documentation Syncing Strategy.
For teams working on rapidly evolving projects:
Establish a documentation update schedule aligned with sprints
Assign documentation reviews as part of code review processes
Use /doc to generate change summaries after significant updates
Implement a verification process to ensure generated documentation accurately reflects code changes
Best Practices for /doc Agent
To improve results from documentation generation with Amazon Q Developer, follow these best practices:
Optimize repository size: Amazon Q Developer supports documentation generation across your codebase, accommodating projects up to the specified size limits. While documentation for larger repositories may require additional processing time and could provide more generalized results, you have the option to request documentation for specific subsets of code or individual files to receive more detailed insights.
Maintain high-quality code: The quality of documentation Amazon Q Developer generates improves significantly when your code is well-commented and organized, has meaningful naming conventions for programming entities, and follows standard coding conventions.
Be specific with change requests: When requesting specific README changes in natural language, choose to update an existing README and select the option to make a specific change. After initial documentation generation, you can request additional modifications by describing exactly what updates you want.
Craft effective change descriptions: When describing desired updates, include:
Specific sections you want to modify
Exact content you want to add or remove
Particular issues that need correcting
How project functionality should be reflected in the README
References to content available in your codebase.
Understand system limitations: Amazon Q Developer doesn’t have access to private or internal platforms and might lack knowledge of third-party tools, specialized software, or custom tooling in your code. Content requiring this knowledge won’t be documented automatically. In these cases, you’ll need to manually edit the README to include information Amazon Q Developer cannot generate.
Documentation Quotas and Limitations
When working with Amazon Q Developer /doc agent, be aware of these important constraints:
Document generations per task: There’s a limit to the number of feedback iterations allowed per documentation session. This quota resets each time you start a new documentation task.
File filtering: Amazon Q Developer filters out files or folders defined in your .gitignore file. This helps streamline the documentation process by focusing only on relevant code files.
Conclusion
Amazon Q Developer /doc agent transforms the documentation process from a tedious chore to an automated, efficient workflow. By generating and maintaining READMEs based on your actual code, it ensures documentation remains accurate and up-to-date without consuming precious development time.
As part of Amazon Q Developer’s free tier, the /doc agent is readily available to integrate into your development process. Start using it today to improve your project documentation and enhance team collaboration.
As the world of software development becomes increasingly global, the need for tools that support multiple languages has become paramount. Today, I am excited to announce expanded language support in Amazon Q Developer. In this post, I explore the recent expansion of language support in Amazon Q Developer, a powerful platform used by developers worldwide to discuss architecture, create documentation, design interfaces, and build applications.
While English remains the lingua franca of programming, the reality of modern software development extends far beyond code. Developers worldwide use Amazon Q Developer to discuss architecture decisions, create documentation, design user interfaces, and build applications that serve global audiences. By expanding language support, Amazon Q Developer now enables developers to have more natural, fluid conversations about complex technical concepts in their preferred language, whether they’re designing system architecture, generating documentation, or planning application localization strategies.
The power of this expanded language support is demonstrated in the following image, where I asked the same container hosting question in English, Chinese, Hindi, and Spanish. Not only does Amazon Q Developer now provide complete responses in these languages, but it also maintains technical accuracy while adapting to linguistic nuances. Furthermore, Q Developer now suggests follow-up questions and responses in the user’s chosen language, creating a more intuitive and seamless experience for developers worldwide. This natural flow of conversation in any language helps maintain the developer’s focus and flow, eliminating the mental overhead of constant translation.
Whether you’re a developer in Seoul writing documentation in Korean, a startup in Madrid brainstorming architecture in Spanish, or a team in Brazil collaborating in Portuguese, Amazon Q Developer is now ready to support your journey and your preferred language. Expanded language support is available to users of both the Free and Pro Tier starting today. Get started with Amazon Q Developer, and share your feedback. Together, we’re building a more inclusive and accessible future for software development.
In today’s rapidly evolving software landscape, maintaining and modernizing Java applications is a critical challenge for many organizations. As new Java versions are released and best practices evolve, the need for efficient code transformation becomes increasingly important. Amazon Q Developer transformation for Java using the Command Line Interface (CLI) presents a powerful alternative to integrated development environments (IDEs), offering unique advantages in scenarios requiring batch processing, CI/CD integration, headless environments, and custom automation workflows. By leveraging the CLI, development teams can perform consistent, scalable, and easily reproducible transformations across extensive codebases.
One key difference between CLI and IDE-based transformations lies in the standardization and customization capabilities. With CLI transformations, teams can define and enforce standardized transformation rules across the entire organization, ensuring consistency in code modernization efforts. This standardization is particularly valuable for large teams or distributed development environments. Additionally, the CLI approach allows for deeper customization of transformation rules, enabling teams to tailor the modernization process to their specific needs and coding standards. Whether updating deprecated APIs, migrating to newer Java versions, or enforcing coding standards, Amazon Q Developer’s CLI transformations provide a flexible and powerful solution.
This blog will explore how to use Amazon Q Developer’s CLI capabilities to create custom transformations for upgrading Java applications. We’ll dive into the process of defining transformation rules, executing them across your codebase, and demonstrate how to customize these transformations to meet specific requirements. By the end of this blog, you’ll have a clear understanding of how to leverage Amazon Q Developer’s CLI for Java transformations, enabling you to modernize your applications more efficiently and with greater control. You’ll be equipped to standardize your transformation processes across teams and projects while also customizing them to fit your unique requirements.
Pre-requisites
Before you begin a transformation, see the prerequisites for transformation on the command line with Amazon Q Developer.
Note: The Amazon Q Developer command line tool for transformation (qct cli) is distinct from the Amazon Q Developer CLI – while qct cli is specifically designed for code transformations, the Amazon Q Developer CLI provides features such as autocompletion, Amazon Q chat, inline ZShell completion, etc.
These pre-requisites ensure that you have all the necessary tools and permissions to use Amazon Q Developer’s CLI capabilities for custom transformations on your Java applications.
About the Application
This sample project will be used to demonstrate the Amazon Q Developer CLI code transformation feature in action. It’s a Java 1.8 based microservice application that displays a free list of movies for the month using configuration stored in AWS AppConfig service. Originally open sourced in 2020, it intentionally uses legacy versions of libraries (Spring Boot 2.x, Log4j 2.13.x, Mockito 1.x, Javax and Junit 4) to showcase the upgrade process. The application includes a dependency on another module built in both Java 1.8 and 17, specifically to demonstrate how post transformation steps can be used to modernize your application’s internal dependencies. You can download this sample project to experiment with the CLI upgrade feature in your own environment.
Configuring Amazon Q command line tool and authenticate
Configure the Amazon Q command line tool for transformation by running the qct configure command:
qct configure
This command will:
Prompt you to specify the JDK path for Java 8, 11, 17 and 21. You only need to specify the path to the JDK of the Java version you are upgrading.
Two options are available for authentication
Option 1 authenticates with IAM credentials stored in your AWS CLI profile. Refer Figure 2.
Figure 2: qct configure – Authenticate with IAM
Provide the AWS CLI profile to use for the IAM authentication. You can specify a specific profile name or press enter to use the default profile.
Provide a file path that will point to a CSV file which will be used to add tags for your transformation (optional). The CSV must have two columns, with headers titled key and value, where tag key-value pairs are listed.
Prompt you to provide the Start URL to authenticate to Amazon Q Developer Pro. The Start URL can be obtained from the console in the Q Developer > Settings.
Provide the AWS Region
If you’re upgrading your code’s Java version, you have the option to receive your code suggestions from Amazon Q in one commit or multiple commits. Amazon Q will split the upgraded code into multiple commits by default. If you want all your code changes to appear in one commit, enter the letter ‘O’ for one commit when prompted.
You can customize transformations by providing custom logic in the form of ast-grep rules that Amazon Q uses to make changes to your code.
To start with customization, create an Orchestrator file where you provide the paths to the custom transformation files. The Orchestrator file is a YAML file containing paths to custom pre-transformation and post-transformation files, which contain ast-grep rules that will run before and after transformation.
Here’s an example:
orchestrator_qct_cli.yaml
name: orchestrator_qct_cli
description: My collection of custom transformations to run before and after a transformation.

pre_qct_actions:
  ast-grep:
    rules:
      - custom-transformation-pre-qct.yaml

post_qct_actions:
  ast-grep:
    rules:
      - custom-transformation-post-qct.yaml
The pre-transformation rules file shown below is used to
Identify unused local variables declarations and remove them
Identify unused import declarations and remove them
This custom transformation cleans up unused local variable declarations and imports, helping in reducing the number of lines that will be considered for transformation as demonstrated in the following example:
custom-transformation-pre-qct.yaml
id: no-unused-vars
language: java
rule:
    kind: local_variable_declaration
    all:
        - has:
              has:
                  kind: identifier
                  pattern: $IDENT
        - not:
              precedes:
                  stopBy: end
                  has:
                      stopBy: end
                      any:
                          - { kind: identifier, pattern: $IDENT }
                          - { has: {kind: identifier, pattern: $IDENT, stopBy: end}}
fix: ''

--- # this is YAML doc separator to have multiple rules in one file

id: no-unused-imports
rule:
    kind: import_declaration
    all:
        - has:
            has:
                kind: identifier
                pattern: $IDENT
        - not:
            precedes:
                stopBy: end
                has:
                    stopBy: end
                    any:
                        - { kind: type_identifier, pattern: $IDENT }
                        - { has: {kind: type_identifier, pattern: $IDENT, stopBy: end}}
fix: ''
The post-transformation rules file serves multiple purposes and helps customers seamlessly upgrade their first-party (1P) dependencies after QCT transforms their application to Java 17 or 21:
When your project uses internal AWS dependencies that have been upgraded to Java 17 or 21, these rules automatically update your POM file to use the latest compatible versions. This eliminates manual dependency version updates and resolves build errors related to private dependencies.
After updating the POM file, the rules automatically modify your code to replace deprecated methods from internal dependencies with their latest supported versions, ensuring compatibility with the upgraded dependencies.
The rules identify System.out.println statements and replace them with a proper logger framework, improving application observability. This automated approach significantly simplifies the migration process by handling both the application transformation and internal dependency updates in one streamlined operation.
These rules help modernize your codebase and ensure compatibility with updated dependencies.
custom-transformation-post-qct.yaml
id: update-movie-service-util-java17
language: html
rule:
    pattern: |-
        <dependency>
            <groupId>org.amazonaws.samples</groupId>
            <artifactId>movie-service-utils</artifactId>
            <version>$VERSION</version>
        </dependency>
constraints:
    VERSION:
        regex: "^0\\.1\\.0"
fix: |-
    <dependency>
        <groupId>org.amazonaws.samples</groupId>
        <artifactId>movie-service-utils</artifactId>
        <version>0.2.0</version>
    </dependency>

--- # this is YAML doc separator to have multiple rules in one file
id: update-movie-service-util-method
language: java
rule:
    pattern: |-
        MovieUtils.isValidMovieName($MOVIE_NAME)
fix: |-
    MovieUtils.isValidMovie($MOVIE_NAME, movieId)

--- # this is YAML doc separator to have multiple rules in one file
id: sysout-to-logger
language: java
rule:
    pattern: System.out.println($MATCH)
fix: logger.info($MATCH)
Both pre- and post-transformation enhances logging capabilities, increases configurability, improves error handling, and makes the application more production-ready, while the use of transformation rules automates the process, saving time and reducing errors in large codebases.
Executing the transformation
Now, run the transformation using the Amazon Q Developer CLI:
–source_folder points to the path of the folder containing the Java application that needs to be transformed from version 8 to either 17 or 21.
–custom_transformation_file specifies the path to the orchestrator file (orchestrator_qct_cli.yaml).
–target_version refers to the target Java version to which the application will be transformed. It can be either JAVA_17 or JAVA_21.
If you have common requirements across all the applications you’re transforming, it’s better to store this file in a shared location and use an absolute path during transformation.
For applications with specific requirements, you can include the orchestrator file in the application’s codebase and use a relative path.
Once you execute the transform command if you choose to authenticate with IDC, it will prompt to authenticate providing a URL using the credentials set up in identity center that have access to Amazon Q Developer Pro: Figure 4: qct transform authentication with the IAM Identity provider
After logging in through the browser, verify if the code matches with the code in the CLI and approve access to Amazon Q Developer.
Once the request is approved – enter Y in the command line to proceed with transformation:
Before starting the transformation, the agent verifies if you have at least the minimum supported version of Maven for transformation
Figure 5: qct transform starts with pre-processing followed with transformation job
First ast-grep command is run using the pre-transformation template before transformation and once it’s successful, the Q Developer transformation job begins.
Figure 6: qct transform completed with the results committed to a new branch
After the transformation is complete the changes are saved to a local branch and the branch name can be obtained from CLI output.
After successful transformation ast-grep post-transformation step is executed and the branch is updated with the custom transformed code.
Reviewing and applying the changes
After the transformation is complete, review the changes in the new branch that’s in the CLI output. Use “git branch” to view the new branch created with the transformed files.
git branch
Figure 7: git branch – shows the new branch containing transformation result
Now compare the transformed branch with the source branch in our case its change-branch.
git diff change-branch
Figure 8: Spring boot upgraded to 3.3.8 from 2.0.5
Figure 9: Java upgraded from 8 to 17
You can see the application is upgraded to Java 17, Spring Boot upgraded to 3.3.0 form 2.0.5, and the internal dependency movie-service-utils upgraded to 0.2.0 version to support Java 17.
Figure 10: Unused variable removed also System.out.println replaced with Logging framework
Figure 11: Unused imports removed
Figure 12: MobieUtils.isValidMovie method updated to match the updated internal dependency
During pre-transformation
Unused local variables are identified and removed from the code.
Unused imports are identified and removed
During post-transformation
Using custom transformation, the sysout statements are replaced with logger framework.
The internal dependency MovieUtils.isValidMovieName method is updated with the required parameters that are required for the latest version using custom post transformation template.
Other changes of the Java 8 to 17 transformation are mentioned here.
Pre-transformation, transformation, and post-transformation changes are committed separately to help users compare differences and identify changes made in each step.
If you’re satisfied with the results, you can create a pull request from the branch which contains the transformed code to your corresponding release branch.
Troubleshooting
When working with Amazon Q Developer CLI transformations, you might encounter some common issues. Here’s how to address them:
Unstaged Git Commits
Before running a transformation, make sure to stash or commit any pending changes to your local branch. This ensures a clean working directory for the transformation process.
Clearing the Working Directory
If a transformation fails, clear the workspace located at ~/.aws/qcodetransform/transformation_projects/<your project name> before retrying the transformation. This step is only necessary for failed transformations.
Clean up
To clean up after the transformation:
Remove the user or group access to the Amazon Q Developer Pro application
Unsubscribe from Amazon Q Developer Pro
Call to Action
Ready to modernize your Java applications? Here’s how to get started:
Review the prerequisites for the command line transformation with Amazon Q Developer.
Download the sample project to practice transformations in a safe environment
Conclusion
Using Amazon Q Developer’s CLI capabilities for custom transformations provides a powerful and flexible way to upgrade Java applications. This approach allows you to automate the modernization process, saving time and reducing the risk of manual errors.
By leveraging custom rules, you can tailor the transformation to your specific needs, whether it’s updating deprecated methods, migrating to new APIs, or applying best practices across your codebase.
As you continue to work with Amazon Q Developer, explore more advanced transformation scenarios and integrate this process into your development workflow for ongoing modernization efforts.
Increasing developer productivity has been a persistent challenge for senior leaders over the past decades. With the rise of generative artificial intelligence (AI), a new wave of innovation is transforming how software teams work. Generative AI tools like Amazon Q Developer are emerging as game-changers, supporting developers across the entire software development lifecycle. But how are large-scale organizations successfully adopting this AI-assisted approach? This document shares good practices I have discovered through working with enterprise customers navigating this technological transformation.
A common misperception still is that a developer is more productive when they write code faster. But a median developer spends less than one hour per day writing code, as a study conducted by software.com in 2022 shows. This makes clear that there are other aspects to consider when it comes to building an application and running it in production. Generative AI tools for developers, such as Amazon Q Developer, started as coding companions that provided inline completions. As the technology evolved, Amazon Q Developer is now able to support developers across the entire software development life cycle.
The Change Challenge
Generative AI offers new and interesting ways for developers to solve challenges and to support them in their daily work. But taking advantage of those opportunities takes some time. It introduces a noticeable change to their familiar ways of working and therefore it is much about forming a new habit. This, according to science, usually takes a minimum of two months. Teams need the space and permission to play with this new approach and to find out what works best for them. Expecting them to adopt a new way of working while expecting the same (or higher) level of output at the same time will only lead to teams falling back to what they know works. For customers that successfully have adopted Amazon Q Developer I have seen them reducing the delivery expectations to give space to learn, and having required teams to share learnings in return.
Additionally, as in any other large change project there is a significant cultural aspect to consider. If people feel intrinsically convinced by the value and benefits of an AI-supported approach to software engineering they will use it. “Simply ordering from above” will not help making an adoption successful. But building community, experimenting, learning, and sharing successes will. “Culture eats strategy for breakfast”, as the management visionary Peter Drucker said.
Keeping that in mind it is clear that there is no one-size-fits-all prescriptive way of successfully introducing generative AI tools for developers in your organization. It very much depends on your individual culture, goals, challenges, people, skills, and technology stack for example. However, there are a number of principles and good practices that work well with several of our large-scale customers who have successfully adopted Amazon Q Developer.
Best Practices for Successful Adoption
The following illustration describes the change management cycle and recommended activities for adopting AI-assisted software development.
Figure 1. The change management cycle
1. Secure Top-Down Commitment
Secure executive buy-in for adopting AI-assisted software development because this is a powerful sign for the organization. It helps to remove roadblocks and to promote successes across the organization. An executive sponsor links the adoption of AI-assisted software development to the strategic goals of the organization, will help resolving prioritization and capacity conflicts. Invite the sponsor to a kick-off meeting. Include them for the discussion of goals and success criteria, and keep them updated on progress, success stories, and challenges.
2. Become Clear on Goals and Success Criteria
Simply rolling out Generative AI tools to a large developer base won’t be enough. You need to be clear what you expect from such an adoption for your organization, for your developers, and for your business. It is important for you to understand your organization’s pain points from a developer experience perspective and how they affect your development productivity. These likely differ between different personas, like Software Developers and DevOps Engineers. For example, are your applications lacking test coverage or is your code lacking documentation, which creates a maintenance burden, and makes it difficult to onboard new developers? Is handling legacy code risky and time-consuming so that you avoid necessary upgrades because of the complexity and effort? Is troubleshooting applications locally or in production eating up your developers’ time? Or are you facing challenges caused by hard-to-find security issues in the code? What is it that you want to achieve by introducing an AI-assisted development approach, and why?
3. Establish Ownership
Adopting a new approach like the use of generative AI in software development at scale leads to many change management and coordination tasks. Those are related to getting access to the tool, enablement for new users, budget planning, measuring success and creating transparency on problems, creating momentum and making sure the adoption sustains, amongst others. Therefore, introducing a Customer Champion as a leader who coordinates the business and technology related aspects of the adoption is a common approach. They will connect the strategic goals of the organization with the tactical activities necessary for the implementation. If your adoption is spanning multiple different business units with larger developer bases consider establishing this role for each of them, forming a team that collaborates across your whole organization. Key responsibilities of the Customer Champion are to bring the right people together to successfully work on the adoption, to create transparency on status, and to address impediments early on.
4. Introduce Metrics
Once you have gained clarity on the specific pain points and goals for your organization, the next step is to determine the appropriate metrics to measure the success of your efforts. For example, you can measure the impact of using Amazon Q Developer on onboarding new developers by tracking the time to first commit against a previously established baseline average. Comparing the time it takes to complete certain tasks – like writing and integrating code, fixing bugs, setting up or upgrading environments, the time it takes to build a new feature, or by comparing sprint velocity before and after the introduction of Amazon Q Developer will give you further indications. But keep in mind that there is ambiguity in these metrics because they are impacted by different factors.
Focusing on developer experience and productivity, monitor the development of your established measurement framework, like DORA, SPACE, or GSM. SPACE in particular, with its “Satisfaction & Well-Being” dimension, pays close attention to how software developers perceive their work and how satisfied they are with their own productivity. Tools like Amazon Q Developer have shown a positive effect here, as for example a McKinsey study shows. They help to free developers from tasks that are perceived as toil, like repetitive and boring grunt work that doesn’t necessarily bring business value. To measure this impact on perceived productivity, customers sometimes design simple surveys, asking developers questions like “in percentage, how would you estimate the impact of using Amazon Q Developer on your productivity” or “on a scale from 1-5, how is Amazon Q Developer impacting the satisfaction with your day-to-day work?”
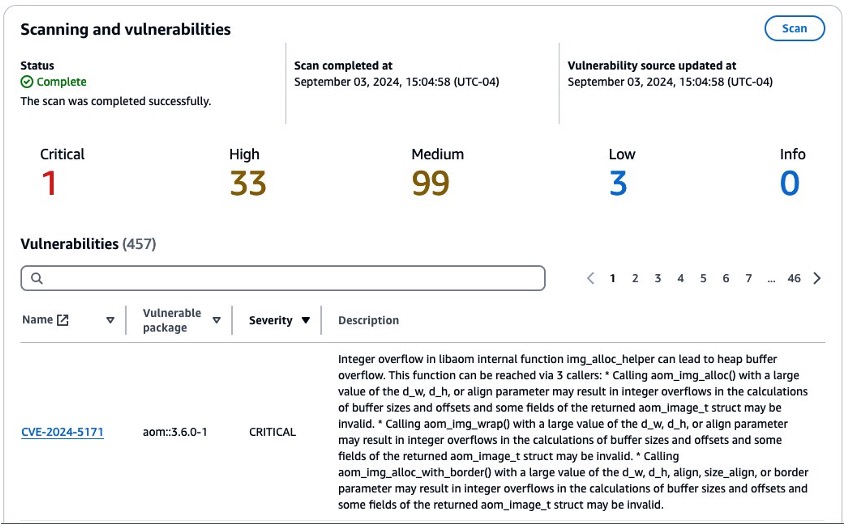
As a last dimension, understanding the general usage of Amazon Q Developer across your organization is important. Monitor the number active subscriptions, accepted code recommendations, or the number of executed security scans from the Amazon Q Developer dashboard. That way you will get an understanding for the acceptance of the tool in your developer base. Correlate this information with the success metrics you defined.
5. Start Small
When “rolling out” an AI-assisted software development approach, keep the technology adoption lifecycle and Everett Roger’s bell curve in mind. It describes that adoption of a new technology usually starts with a few “innovators”, followed by a small fraction of “early adopters”. Only if those early groups demonstrate convincing success, the majority of users will follow the adoption. To settle on this model will help you making the adoption of AI-assisted development successful in your organization.
Start small. Identify your tech innovators, or champions, who are enthusiastic to support the introduction of Amazon Q Developer and to advocate the approach in your organization. With them, build a team or a Center of Excellence (COE) that will help with identifying early adopters across your development teams, building technical and enablement foundations for onboarding users, creating roll-out plans, and evangelizing and sustaining the adoption. The champions will act as a bridge between your adoption program team and your users. They can provide insights and feedback on the adoption and come up with recommendations.
6. Create Momentum
Now that you have your foundations in place it is time to create momentum and onboard your early adopters to Amazon Q Developer. Start with a communication plan to raise awareness, to share updates and success stories, and to collect feedback from the users. You will need to create training material covering organization-specific resources (how to get access, for example, or which communication channels and contact points exist), user guides, tutorials, and pointers to relevant documentation and online resources. Consider creating your own prompt library, documenting prompts for Amazon Q Developer that your users find particularly helpful. There are community projects like promptz.dev that can deliver inspiration. Especially for new users this will have a lot of value for getting up to speed.
Consider how to integrate learning pathways with your organization’s learning platform moving forward. These should include the company-specific experience and knowledge you collect. In addition, it might be helpful to integrate external offers, like classroom trainings or workshop formats offered by AWS.
Hands-on technical enablement workshops will help your early adopters jumpstarting their experience. AWS offers multiple formats that can be tailored to your individual context. These include service deep-dives with Amazon Q Developer specialists, Immersion Days and hackathon support for teams to hands-on experience the tool in a guided, interactive format, or joined proof-of-value engagements. Your AWS account team will provide you more information.
7. Sustain and Scale Adoption
At that point you will have established Amazon Q Developer among an initial segment of your developer base. However, keeping Roger’s adoption curve in mind the largest part of the adoption still lies ahead of you. To facilitate the it across your whole organization, focus on delivering enablement workshops for the teams to be onboarded. These will be led by your champions and incorporate your organization-specific practices and knowledge.
To sustain the adoption, make sure the existing user base stays active. Continue offering exchange and support, collecting feedback, updating your enablement material, sharing updates on the latest developments for Amazon Q Developer, and reviewing your metrics. Create visibility across your organization for the accomplishments and positive experiences. Let user talk about the impact Amazon Q Developer has on their work. This will help building momentum. Nurture community building around your users of AI-assisted development.
Establish regular office hours with your champions for providing support and enablement to your users of Amazon Q Developer. This will facilitate the continuous gathering of feedback to improve documentation and enablement materials, collect and promote success stories, and validate the adoption approach. Additionally, establish a consistent communications and reporting cadence to keep all relevant stakeholders informed of key metrics, updates, feedback, and success stories. This ensures the alignment of the adoption of AI-assisted development with your strategic goals and expectations.
8. Inspect and Adapt
In addition, keep reflecting on the goals and metrics you came up with from a strategic perspective. Are they developing in the right direction? Are your pain points still the same? Should you move your focus to different aspects of the software development life cycle? And how might new capabilities of Amazon Q Developer support your goals?
Conclusion
By following the outlined approach, large organizations can successfully navigate the challenges of adopting Amazon Q Developer. The approach addresses technical, cultural, and organizational aspects of the adoption, increasing the likelihood of realizing the full potential of AI-assisted development across the enterprise.
If you are looking for advice or support during your adoption journey, your AWS Account Team will connect you with experts on Amazon Q Developer, provide you information on training and enablement, and support you with setting up a successful rollout program for your organization. To learn more about how Amazon Q Developer’s capabilities support the whole software development lifecycle, visit the product page or have a look at the documentation.
About the Author
Rene-Martin Tudyka is a Senior Customer Solutions Manager at AWS and provides guidance and support for enterprise customers on their cloud maturity journey. He has a long background in developing highly performant IT organizations and in successful large-scale cloud adoption.
I’m excited to announce that AWS CodeBuild now supports parallel test execution, so you can run your test suites concurrently and reduce build times significantly.
Very long test times pose a significant challenge when running continuous integration (CI) at scale. As projects grow in complexity and team size, the time required to execute comprehensive test suites can increase dramatically, leading to extended pipeline execution times. This not only delays the delivery of new features and bug fixes, but also hampers developer productivity by forcing them to wait for build results before proceeding with their tasks. I have experienced pipelines that took up to 60 minutes to run, only to fail at the last step, requiring a complete rerun and further delays. These lengthy cycles can erode developer trust in the CI process, contribute to frustration, and ultimately slow down the entire software delivery cycle. Moreover, long-running tests can lead to resource contention, increased costs because of wasted computing power, and reduced overall efficiency of the development process.
With parallel test execution in CodeBuild, you can now run your tests concurrently across multiple build compute environments. This feature implements a sharding approach where each build node independently executes a subset of your test suite. CodeBuild provides environment variables that identify the current node number and the total number of nodes, which are used to determine which tests each node should run. There is no control build node or coordination between nodes at build time—each node operates independently to execute its assigned portion of your tests.
To enable test splitting, configure the batch fanout section in your buildspec.xml, specifying the desired parallelism level and other relevant parameters. Additionally, use the codebuild-tests-run utility in your build step, along with the appropriate test commands and the chosen splitting method.
The tests are split based on the sharding strategy you specify. codebuild-tests-run offers two sharding strategies:
Equal-distribution. This strategy sorts test files alphabetically and distributes them in chunks equally across parallel test environments. Changes in the names or quantity of test files might reassign files across shards.
Stability. This strategy fixes the distribution of tests across shards by using a consistent hashing algorithm. It maintains existing file-to-shard assignments when new files are added or removed.
CodeBuild supports automatic merging of test reports when running tests in parallel. With automatic test report merging, CodeBuild consolidates tests reports into a single test summary, simplifying result analysis. The merged report includes aggregated pass/fail statuses, test durations, and failure details, reducing the need for manual report processing. You can view the merged results in the CodeBuild console, retrieve them using the AWS Command Line Interface (AWS CLI), or integrate them with other reporting tools to streamline test analysis.
Let’s look at how it works Let me demonstrate how to implement parallel testing in a project. For this demo, I created a very basic Python project with hundreds of tests. To speed things up, I asked Amazon Q Developer on the command line to create a project and 1,800 test cases. Each test case is in a separate file and takes one second to complete. Running all tests in a sequence requires 30 minutes, excluding the time to provision the environment.
In this demo, I run the test suite on ten compute environments in parallel and measure how long it takes to run the suite.
To do so, I added a buildspec.yml file to my project.
There are three parts to highlight in the YAML file.
First, there’s a build-fanout section under batch. The parallelism command tells CodeBuild how many test environments to run in parallel. The ignore-failure command indicates if failure in any of the fanout build tasks can be ignored.
Second, I use the pre-installed codebuild-tests-run command to run my tests.
This command receives the complete list of test files and decides which of the tests must be run on the current node.
Use the sharding-strategy argument to choose between equally distributed or stable distribution as I explain above.
Use the files-search argument to pass all the files that are candidates for a run. We recommend to use the provided codebuild-glob-search command for performance reasons, but any file search tool, such as find(1), will work.
I pass the actual test command to run on the shard with the test-command argument.
Lastly, the reports section instructs CodeBuild to collect and merge the test reports on each node.
Now, I’m ready to trigger an execution of the test suite. I can commit new code on my GitHub repository or trigger the build in the console.
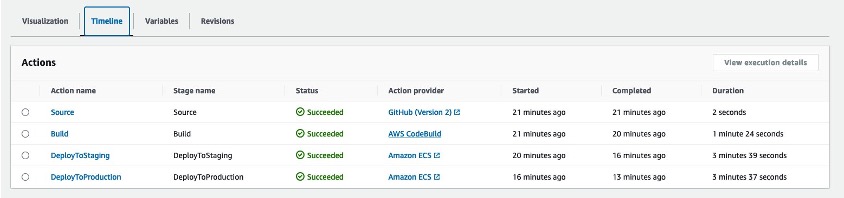
After a few minutes, I see a status report of the different steps of the build; with a status for each test environment or shard.
When the test is complete, I select the Reports tab to access the merged test reports.
The Reports section aggregates all test data from all shards and keeps the history for all builds. I select my most recent build in the Report history section to access the detailed report.
As expected, I can see the aggregated and the individual status for each of my 1,800 test cases. In this demo, they’re all passing, and the report is green.
The 1,800 tests of the demo project take one second each to complete. When I run this test suite sequentially, it took 35 minutes to complete. When I run the test suite in parallel on ten compute environments, it took six minutes to complete, including the time to provision the environments. The parallel run took 17.1 percent of the time of the sequential run. Actual numbers will vary with your projects.
Additional things to know This new capability is compatible with all testing frameworks. The documentation includes examples for Django, Elixir, Go, Java (Maven), Javascript (Jest), Kotlin, PHPUnit, Pytest, Ruby (Cucumber), and Ruby (RSpec).
For test frameworks that don’t accept space-separated lists, the codebuild-tests-run CLI provides a flexible alternative through the CODEBUILD_CURRENT_SHARD_FILES environment variable. This variable contains a newline-separated list of test file paths for the current build shard. You can use it to adapt to different test framework requirements and format test file names.
You can further customize how tests are split across environments by writing your own sharding script and using the CODEBUILD_BATCH_BUILD_IDENTIFIER environment variable, which is automatically set in each build. You can use this technique to implement framework-specific parallelization or optimization.
Pricing and availability With parallel test execution, you can now complete your test suites in a fraction of the time previously required, accelerating your development cycle and improving your team’s productivity. The demo project I created to illustrate this post consumes 18.7 percent of the time of a sequential build.
This capability is available today in all AWS Regions where CodeBuild is offered, with no additional cost beyond the standard CodeBuild pricing for the compute resources used.
I invite you to try parallel test execution in CodeBuild today. Visit the AWS CodeBuild documentation to learn more and get started with parallelizing your tests.
PS: Here’s the prompt I used to create the demo application and its test suite: “I’m writing a blog post to announce codebuild parallel testing. Write a very simple python app that has hundreds of tests, each test in a separate test file. Each test takes one second to complete.”
(This survey is hosted by an external company. AWS handles your information as described in the AWS Privacy Notice. AWS will own the data gathered via this survey and will not share the information collected with survey respondents.)
The AWS Cloud Development Kit (CDK) is an open source framework that enables developers to define cloud infrastructure using a familiar programming language. Additionally, CDK provides higher level abstractions (Constructs), which reduce the complexity required to define and integrate AWS services together when building on AWS. CDK also provides core functionality like CDK Assets, which gives users the ability to bundle application assets into their CDK applications. These assets can be local files (main.py), directories (python_app/), or Docker images (Dockerfile). CDK Assets are stored in an Amazon Simple Storage Service (Amazon S3) Bucket or Amazon Elastic Container Registry (Amazon ECR) Repository that is created during CDK bootstrapping.
For CDK developers that leverage assets at scale, they may notice over time that the bootstrapped bucket or repository accumulated old or unused data. If users wanted to clean this data on their own, CDK didn’t provide a clear way of determining which data is safe to delete. To solve this problem, we are excited to announce the preview launch of CDK Garbage Collection, a new feature of the CDK that automatically deletes old assets in your bootstrapped Amazon S3 Bucket and Amazon ECR Repository, saving users time and money. This feature is available starting in AWS CDK version 2.165.0.
We expect CDK Garbage Collection to help AWS CDK customers save on storage costs associated with using the product while not affecting how customers use CDK.
Quickstart
CDK Garbage Collection is exposed as a CDK CLI command named gc. To use CDK Garbage Collection in its default configuration, run the following command on a terminal in your CDK application.
cdk gc --unstable=gc
The --unstable flag is meant to acknowledge that CDK Garbage Collection is in preview mode. This indicates that the scope and API of the feature might still change, but otherwise the feature is generally production ready and fully supported.
Walkthrough
CDK Garbage Collection works at the environment level, so it will attempt to delete isolated assets in the AWS account / region that you call it in. For the purposes of this walkthrough, you will be re-bootstrapping the environment with a custom qualifier so that you do not delete isolated assets before you are ready.
You now have a new bootstrap template under the name CDKToolkitDemo and bootstrap resources associated with it. Next, set up a CDK application with both Amazon S3 and Amazon ECR assets:
mkdir garbage-collection-demo && cd garbage-collection-demo
cdk init -l typescript app
Your next step is to replace the existing code In lib/garbage-collection-demo-stack.ts with the following CDK Stack:
import * as path from 'path';
import * as cdk from 'aws-cdk-lib';
import { Construct } from 'constructs';
import * as lambda from 'aws-cdk-lib/aws-lambda';

export class GarbageCollectionDemoStack extends cdk.Stack {
  constructor(scope: Construct, id: string, props?: cdk.StackProps) {
    super(scope, id, props);

    const fn1 = new lambda.Function(this, 'my-function-s3', {
    code: lambda.Code.fromAsset(path.join(__dirname, '..', 'lambda')),
    runtime: lambda.Runtime.NODEJS_LATEST,
    handler: 'index.handler',
    });

    const fn2 = new lambda.Function(this, 'my-function-ecr', {
    code: lambda.Code.fromAssetImage(path.join(__dirname, '..', 'docker')),
    runtime: lambda.Runtime.FROM_IMAGE,
    handler: lambda.Handler.FROM_IMAGE,
    });
  }
}
This creates two AWS Lambda functions, one which uses an Amazon S3 asset as its source code and one that uses an Amazon ECR image as its source code. You need to add the assets that are referenced to our CDK application. In lambda/index.js add a simple Lambda function:
At this point you can check to make sure that assets have been correctly added into the bootstrapped Amazon S3 bucket and Amazon ECR repository:
Two objects exist in the bootstrapped Amazon S3 Bucket after the initial AWS CDK Deploy.
One image exists in the bootstrapped Amazon ECR Repository after the initial AWS CDK Deploy.
The output shows that you have the data you expect in both bootstrapped resources. The Amazon S3 Bucket also stores the json file of the AWS CloudFormation Template that was generated when you ran cdk deploy.
You can now simulate a typical CDK development cycle by updating both assets. Add a small change to the Amazon S3 asset that lives in lambda/index.js:
FROM public.ecr.aws/docker/library/alpine:latest
CMD echo 'Hello World'
You can now run cdk deploy again, and both assets should be re-uploaded under a new hash.
Four objects exist in the bootstrapped Amazon S3 Bucket after the second AWS CDK Deploy.
Two images exist in the bootstrapped Amazon ECR Repository after the second AWS CDK Deploy.
This output confirms that everything is as expected and the new assets have been added in. Because you are using new bootstrapped resources, you can still tell which resources are currently isolated and which are not. Right now, only the zipfile prefixed with 50f409b9 is referenced in AWS CloudFormation, and in Amazon ECR, only the image prefixed a5801b5b is referenced. That means that every other asset — 3 objects in Amazon S3 and 1 object in Amazon ECR — are isolated and can be deleted.
One item to note is the additional files in Amazon S3 that are not your local assets — these are AWS CloudFormation templates that are uploaded to Amazon S3 as an intermediary step before being sent to AWS CloudFormation. They are not needed after being copied over and are a perfect candidate for deletion via CDK Garbage Collection.
Here is where CDK Garbage Collection comes in. With the right parameters, you are able to clean up the isolated objects while not disturbing the assets that are actively in use.
Because you want to delete assets immediately, and not tag them for deletion later, set rollback-buffer-days to 0. You also want to delete assets that were just created, so be sure to set created-buffer-days to 0 as well. The default for created-buffer-days is 1.
 ⏳ Garbage Collecting environment aws://912331974472/us-east-1...
Found 3 objects to delete based off of the following criteria:
- objects have been isolated for > 0 days
- objects were created > 0 days ago

Delete this batch (yes/no/delete-all)?
CDK Garbage Collection found three assets to be deleted from Amazon S3, which is to be expected. It prompts you to verify that you want to delete, which you do, so enter yes. You will then get this response:
Found 1 image to delete based off of the following criteria:
- images have been isolated for > 0 days
- images were created > 0 days ago

Delete this batch (yes/no/delete-all)?
Once again, this is to be expected for Amazon ECR, so you enter yes again. You then get the response:
At this point, CDK Garbage Collection is finished.
Details
CDK Garbage Collection exposes some parameters to help you customize the experience to your specific scenario. These options help you determine how aggressive you want your garbage collection to be.
rollback-buffer-days: this is the amount of days an asset has to be marked as isolated before it is eligible for deletion.
created-buffer-days: this is the amount of days an asset must live before it is eligible for deletion.
Rollback Buffer Days should be considered when you are not using cdk deploy and instead use a deployment method that operates on templates only, like a pipeline. If your pipeline can rollback without any involvement of the CDK CLI, this parameter will help ensure that assets are not prematurely deleted. When used, instead of deleting unused objects, cdk gc tags them with the current date. Subsequent runs of cdk gc will check this tag and delete the asset only after it has been tagged for longer than the specified buffer days.
Created Buffer Days should be considered if you want to be extra safe about assets that have been recently uploaded. When used, cdk gc filters out any assets that have not persisted that number of days. Note that this may not include assets that have been shared across multiple CDK Apps CDK reuses assets that are identical, and its possible that a recent deploy of a CDK App references an asset that was uploaded earlier.
For example, if you want to ensure that only assets that are over a month old and have been isolated for a week are deleted, you can specify:
Decision flow diagram of an asset as it gets audited for garbage collection.
Limitations of CDK Garbage Collection
During CDK Garbage Collection, we collect all stack templates to see what assets are in use. If garbage collection runs between the asset upload and stack deployment, there is a chance that it does not pick up the latest stack deployment, but it does pick up the latest asset. In this scenario, CDK Garbage Collection may delete those assets.
We recommend not deploying stacks while running CDK Garbage Collection. If that is unavoidable, setting --created-buffer-days will help as garbage collection will avoid deleting assets that are recently created. Finally, if you do experience a failed deployment, the mitigation is to redeploy, as the asset upload step will be able to re-upload the missing asset. In practice, this race condition is only for a specific edge case and unlikely to happen. However, we are working on a new method of storing CDK Assets to reduce the risk of this race condition. That work is being tracked in this issue.
Conclusion
CDK Garbage Collection helps users manage the lifecycle of unused CDK Assets in their AWS account. As users continue to scale with the CDK, tools like CDK Garbage Collection will play a crucial role in maintaining clean, efficient, and cost-effective cloud environments. We encourage CDK users to explore this feature, provide feedback, and incorporate it into their workflows to optimize their AWS resource management.
AWS CloudFormation enables you to model and provision your cloud application infrastructure as code-base templates. Whether you prefer writing templates directly in JSON or YAML, or using programming languages like Python, Java, and TypeScript with the AWS Cloud Development Kit (CDK), CloudFormation and CDK provide the flexibility you need. For organizations adopting multi-account strategies, CloudFormation StackSets offers a powerful capability to deploy resources across multiple regions and accounts in parallel.
Last year, we delivered broad set of enhancements that accelerated the development cycle, simplified troubleshooting, and introduced new deployment safety and configuration governance capabilities. Let’s dive into the key launches that shaped CloudFormation in 2024.
Development cycle improvements
Deploy stacks up to 40% faster with optimistic stabilization and configuration complete
In March, we introduced optimistic stabilization with the new CONFIGURATION_COMPLETE event, delivering up to 40% faster stack creation times. This new event signals that CloudFormation has created the resource and applied the configuration as defined in the stack template, allowing us to begin parallel creation of dependent resources. For example, if your stack contains resource B that depends on resource A, CloudFormation will now start provisioning resource B when resource A reaches the CONFIGURATION_COMPLETE state, rather than waiting for full stabilization. Read How we sped up AWS CloudFormation deployments with optimistic stabilization to learn more.
Figure 1: CloudFormation’s old and new deployment strategy
Catch template errors before deployment with early validation
In March, we launched early resource properties validation checks. This feature validates your stack operation upfront for invalid resource property errors, helping you fail fast and minimize the steps required for a successful deployment. Previously, you had to wait until CloudFormation attempted to provision a resource before discovering property-related errors. Now, we validate your template before deploying the first resource and provide clear error messages upfront.
Figure 2: CloudFormation’s early template properties validation feature
Safely clean up failed stacks with enhanced deletion controls
In May, we enhanced the DeleteStack API with a new DeletionMode parameter, allowing you to safely delete stacks that are in DELETE_FAILED state. By passing the FORCE_DELETE_STACK value to this parameter, you can now resolve stuck stacks more efficiently during your development and testing cycles.
Accelerate feedback loops with CloudFormation custom resource timeout controls
In June, we introduced the ServiceTimeout property for custom resources. This new capability allows you to set custom timeout values for your custom resource logic execution. Previously, custom resources had a fixed one-hour timeout, which could lead to long wait times when debugging custom resource logic. Now, you can set appropriate timeout values to accelerate your development feedback loops. Refer to the custom resourcesdocumentation to learn more about the ServiceTimeout property.
Figure 3: CloudFormation’s ServiceTimeout property for Custom resource
Streamlined Troubleshooting Experience
Resolve deployment issues faster with one-click CloudTrail access
In May, we launched integration with AWS CloudTrail in the Events tab of the CloudFormation console. Troubleshooting some failed stack operations can be time-consuming, so we have streamlined this process by providing direct links from stack operation events to relevant CloudTrail events. When you click ‘Detect Root Cause’ in the CloudFormation Console, you’ll now see a pre-configured CloudTrail deep-link to the API events generated by your stack operation, eliminating multiple manual steps from the troubleshooting process.
Figure 4: CloudFormation troubleshooting with CloudTrail integration
Visualize your entire deployment process with timeline view
In November, we launched deployment timeline view. It gives you unprecedented visibility into your stack operations. This visual tool shows the sequence of actions CloudFormation takes during a deployment, helping you understand resource dependencies and provisioning duration. You can see which resources are being created in parallel, track their status through color-coding, and quickly identify bottlenecks in your deployments.
Get instant troubleshooting help with Amazon Q Developer
We integrated Amazon Q Developer to provide AI-powered assistance for troubleshooting. When you encounter a failed stack operation, you can now click “Diagnose with Q” to receive a clear, human-readable analysis of the error. Need more help? The “Help me resolve” button provides actionable steps tailored to your specific scenario.
Figure 6: CloudFormation troubleshooting with Q feature
We’ve also improved how change sets handle references. When referenced values are available before deployment, Change sets can now resolve them to their expected values, giving you a more accurate preview of your planned changes.
Figure 7: CloudFormation’s change sets feature
Easy onboarding to Infrastructure-as-Code (IaC)
Eliminate weeks of manual effort with IaC Generator
In February, we launched the CloudFormation IaC Generator, a capability addressing one of our customers’ biggest challenges: onboarding existing cloud resources to CloudFormation. This feature makes it easier to generate CloudFormation templates for existing AWS resources. You can now onboard workloads to IaC in minutes instead of spending weeks writing templates manually.
The IaC generator supports over 600 AWS resource types and provides recommendations for related resources. For instance, when you select an S3 bucket, it automatically suggests including associated bucket policies. You can use the generated templates to import resources into CloudFormation, download them for deployment.
Figure 8: CloudFormation’s IaC Generator
In August, we enhanced the IaC Generator with two improvements. First, we added a graphical summary view that helps you quickly find resources after the account scan completes. Second, we integrated with AWS Infrastructure Composer to visualize your application architecture, making it easier to understand resource relationships and configurations.
Figure 9: IaC generator resource scan
Proactive Control Improvements
In November, we launched major enhancements to CloudFormation Hooks, giving you easier ways to author proactive configuration controls and more points to enforce them with your cloud infrastructure provisioning.
CloudFormation Hooks for stack and change set target invocation points
First, we introduced stack and change set target invocation points for CloudFormation Hooks. This extends Hooks beyond individual resource validation, allowing you to run validation checks against entire templates and examine resource relationships. For example, you can now create hooks that validate architectural patterns across multiple resources or enforce team-specific deployment standards. With the change set invocation point, you can automate your change set reviews and reduce the time needed to resolve compliance issues. Refer to the Hooks developer guide to learn more.
Figure 10: CloudFormation’s Hooks for stack and change set target invocation points
Managed hooks for the CloudFormation Guard domain specific language
We introduced the managed hooks to author configuration controls using CloudFormation Guard domain-specific language. This simplifies the hook creation process—you can now write hooks by providing your Guard rule set stored as an S3 object. This is particularly valuable if you’re already using Guard for static template validation, as you can extend these rules to dynamic checks before deployments. To learn more about the Guard hook, check out the AWS DevOps Blog or refer to the Guard Hook User Guide.
Figure 11: CloudFormation Hooks’ Guard language feature
Figure 12: CloudFormation Hooks’ Lambda function feature
CloudFormation Hooks for AWS Cloud Control API target invocation points
Lastly, we extended Hooks to support AWS Cloud Control API (CCAPI) resource configurations. This means your existing resource Hooks can now evaluate configurations from CCAPI create and update operations, allowing you to standardize your proactive control evaluation regardless your IaC tool. If you’re already using pre-built Lambda or Guard hooks, you simply need to specify “Cloud_Control” as a target in your hooks’ configuration to extend their coverage. Learn the detail of this feature from this AWS DevOps Blog. Figure 13: CloudFormation Hooks for AWS Cloud Control API target invocation point
Additional Platform Improvements
StackSets ListStackSetAutoDeploymentTargets API
In March, we enhanced StackSets with the ListStackSetAutoDeploymentTargets API. This new capability gives you better visibility into your auto-deployment configurations by allowing you to list existing target Organizational Units (OUs) and AWS Regions for a given stack set. Instead of logging into individual accounts to understand your deployment scope, you can now get this information in a single API call.
CloudFormation Git sync with request review support
In September, we improved CloudFormation Git sync with pull request workflow support. When you create or update a pull request in a linked repository, CloudFormation automatically posts change set information as PR comments. This integration provides a clear overview of proposed changes within your familiar Git workflow, allowing team members to review infrastructure changes alongside code changes. Visit our user guide and launch blog to learn more.
Figure 14: CloudFormation Git sync with request review support feature
Early 2025 improvements
Reshape your AWS CloudFormation stacks seamlessly with stack refactoring
In February 2025, CloudFormation introduced a new capability called stack refactoring that makes it easy to reorganize cloud resources across your CloudFormation stacks. Stack refactoring enables you to move resources from one stack to another, split monolithic stacks into smaller components, and rename the logical name of resources within a stack. This enables you to adapt your stacks to meet architectural patterns, operational needs, or business requirements. To explore an example scenario, read Introducing AWS CloudFormation Stack Refactoring.
Learn more
Here are some resources to help you get started learning and using CloudFormation to manage your cloud infrastructure:
As we are starting 2025, our focus remains on making infrastructure deployment faster, safer, and more manageable. These enhancements reflect our commitment to solving real customer challenges and improving the CloudFormation experience. We are excited about the roadmap ahead and look forward to bringing you more innovations in 2025.
We encourage you to try these new features and share your feedback. For more detailed information about any of these launches, visit our documentation or check out the AWS DevOps Blog.
The management of configurations across multiple environments and tenants poses a significant challenge in modern software development. Organizations must balance maintaining distinct settings for various environments while accommodating the unique needs of different tenants in multi-tenant architectures. This complexity is compounded by requirements for consistency, version control, security, and efficient troubleshooting.
AWS AppConfig offers a powerful solution to these challenges. AWS AppConfig centrally stores, manages, and deploys application configurations. It streamlines pushing changes without frequent code deployments. The service also enables automatic rollbacks, providing a safety net for configuration changes.
When integrated with a CI/CD pipeline, such as GitLab, AWS AppConfig becomes part of a streamlined, automated system for configuration management. This combination addresses the complexities of multi-environment and multi-tenant deployments, ensuring consistent, version-controlled, and secure configuration management across the entire application ecosystem.
Solution and Scenario Overview
The GitLab CI/CD pipeline in this blog focuses on the way application configurations are managed and deployed using AWS AppConfig. By automating the entire process from configuration updates to multi-environment deployment, it offers a streamlined approach to configuration management.
In this configuration management setup, we’re dealing with a multi-environment, multi-tenant application structure that leverages AWS AppConfig for configuration deployment.
It describes a multi-tenant configuration setup where each tenant has dedicated environments (dev and qa). Real-world examples of what these could represent:
Development (dev): Where developers test new features and changes
Quality Assurance (qa): Where quality assurance teams validate changes before production
The system supports multiple tenants (tenant1, tenant2), each with their own isolated environments. In real-world applications, these tenants could represent:
Different customers:
A retail company (tenant1)
A healthcare provider (tenant2)
Different business units:
North America division (tenant1)
EMEA division (tenant2)
Each tenant maintains separate configurations for their dev and qa environments, with three example configuration files:
AllowList.yml
FeatureFlags.yml
ThrottlingLimits.yml
The ‘template’ directory provides base configuration files that can be inherited and customized by each tenant’s environment-specific configurations. This hierarchical structure ensures that tenants can maintain their unique configurations while adhering to a standardized template format.
Here’s an example of how the template YAML files might look:
The ‘tenants’ directory follows a hierarchical structure where each tenant (tenant1, tenant2) has their own directory. Within each tenant’s directory, there are ‘dev’ and ‘qa’ environment subdirectories. Each environment directory contains three configuration files: AllowList.yml, FeatureFlags.yml, and ThrottlingLimits.yml. These files represent different aspects of the application’s configuration and can override the base templates found in the ‘template’ directory. This structure allows for environment-specific configurations while maintaining a clear separation between tenants and their respective environments.
This structure allows for:
Standardization through templates: The base templates in the ‘template’ directory ensure consistency across all tenants, providing default configurations that can be selectively overridden by tenant-specific needs.
Tenant-specific customization: Each tenant can maintain unique configurations in their dev and qa environments while inheriting from the base templates. This allows for customization without losing standardization benefits.
Environment isolation: Clear separation between dev and qa environments within each tenant’s directory ensures that configuration changes in one environment don’t affect other
Version control of configurations: By storing configurations in a Git repository, changes can be tracked, reviewed, and rolled back if necessary.
AWS AppConfig integration:
Each tenant gets their own Application in AWS AppConfig
Configuration profiles map to different configuration types (AllowList, FeatureFlags, ThrottlingLimits)
Separate environments (dev/qa) within each tenant’s application
The GitLab CI/CD pipeline we’re setting up will need to:
Generate environment and tenant-specific configurations based on these templates
Update the corresponding applications and configuration profiles in AWS AppConfig
Deploy the appropriate configurations to each tenant and environment
Use tags to specify which runner should execute your jobs:
job_name:
tags:
- aws-runner  # Tag of your specific runner
Setting Up the Directory Structure:
First, create the base directory structure using these commands:
# Create directory structure and files
mkdir -p template tenants/{tenant1,tenant2}/{dev,qa}
Create all required YAML files:
for file in AllowList.yml FeatureFlags.yml ThrottlingLimits.yml;do
  touch template/$file
  touch tenants/tenant{1,2}/{dev,qa}/$file
done
Populate the template files:
Copy the content of each YAML file (AllowList.yml, FeatureFlags.yml, ThrottlingLimits.yml) shown above into the corresponding files in the template directory.
For tenant-specific configurations:
Start by copying the template files to each tenant's environment directory
Make sure to replace these variables in both stages (update-app-config and deploy-app-config) of the pipeline. The AWS role should have appropriate permissions to interact with AWS AppConfig service
Here’s the complete .gitlab-ci.yml file:
stages:
- update-app-config
- deploy-app-config
update-app-config:
stage: update-app-config
image:
name: amazon/aws-cli:latest
entrypoint:
- '/usr/bin/env'
script:
- |
# Get list of all tenant
TENANTS=$(find tenants -mindepth 1 -maxdepth 1 -type d -exec basename {} \;)
for TENANT in $TENANTS; do
echo "Processing tenant: $TENANT"
# Create/Get Application for tenant
APP_ID=$(aws appconfig list-applications --query "Items[?Name=='$TENANT'].Id" --output text)
if [ -z "$APP_ID" ]; then
echo "Creating application for tenant '$TENANT'..."
APP_ID=$(aws appconfig create-application --name $TENANT --query Id --output text)
fi
# Process each configuration type
for CONFIG_TYPE in AllowList FeatureFlags ThrottlingLimits; do
echo "Processing config type: $CONFIG_TYPE"
# Create/Get Configuration Profile
PROFILE_ID=$(aws appconfig list-configuration-profiles --application-id "$APP_ID" --query "Items[?Name=='$CONFIG_TYPE'].Id" --output text)
if [ -z "$PROFILE_ID" ]; then
echo "Creating configuration profile '$CONFIG_TYPE' for tenant '$TENANT'..."
PROFILE_ID=$(aws appconfig create-configuration-profile --application-id "$APP_ID" --name "$CONFIG_TYPE" --description "Configuration profile for $CONFIG_TYPE" --location-uri hosted --query Id --output text)
fi
# Process each environment
for ENV in dev qa; do
echo "Processing environment: $ENV"
# Priority: Use tenant-specific config if it exists, otherwise use template
if [ -f "tenants/$TENANT/$ENV/$CONFIG_TYPE.yml" ]; then
echo "Using tenant-specific configuration for $ENV"
CONFIG_CONTENT=$(cat "tenants/$TENANT/$ENV/$CONFIG_TYPE.yml" | base64)
else
echo "Using template configuration for $ENV"
CONFIG_CONTENT=$(cat "template/$CONFIG_TYPE.yml" | base64)
fi
echo "Creating new version for $CONFIG_TYPE configuration in $ENV..."
aws appconfig create-hosted-configuration-version \
--application-id "$APP_ID" \
--configuration-profile-id "$PROFILE_ID" \
--content "$CONFIG_CONTENT" \
--content-type "application/json" \
configuration_version_output
done
done
done
variables:
  AWS_CREDS_TARGET_ROLE: arn:aws:iam::<aws_account_ID>:role/GitLab
  AWS_DEFAULT_REGION: <aws_region>
deploy-app-config:
stage: deploy-app-config
image:
name: amazon/aws-cli:latest
entrypoint:
- '/usr/bin/env'
script:
- yum install -y jq
- |
TENANTS=$(find tenants -mindepth 1 -maxdepth 1 -type d -exec basename {} \;)
for TENANT in $TENANTS; do
echo "Processing tenant: $TENANT"
APP_ID=$(aws appconfig list-applications --query "Items[?Name=='$TENANT'].Id" --output text)
# Process each environment
for ENV in dev qa; do
echo "Processing environment: $ENV"
# Create/Get Environment
ENV_ID=$(aws appconfig list-environments --application-id "$APP_ID" --query "Items[?Name=='$ENV'].Id" --output text)
if [ -z "$ENV_ID" ]; then
echo "Creating environment '$ENV' for tenant '$TENANT'..."
ENV_ID=$(aws appconfig create-environment --application-id "$APP_ID" --name "$ENV" --description "Environment for $ENV" --query Id --output text)
fi
# Process each configuration types
for CONFIG_TYPE in AllowList FeatureFlags ThrottlingLimits; do
echo "Processing $CONFIG_TYPE for $TENANT/$ENV"
PROFILE_ID=$(aws appconfig list-configuration-profiles --application-id "$APP_ID" --query "Items[?Name=='$CONFIG_TYPE'].Id" --output text)
echo " Profile ID $PROFILE_ID "
# Get latest version for this specific profile
LATEST_VERSION=$(aws appconfig list-hosted-configuration-versions \
--application-id "$APP_ID" \
--configuration-profile-id "$PROFILE_ID" \
--query "Items[0].VersionNumber" \
--output text)
# Get current deployment for this specific profile
CURRENT_DEPLOYMENT=$(aws appconfig list-deployments \
--application-id "$APP_ID" \
--environment-id "$ENV_ID" \
--query "Items[?ConfigurationName=='$CONFIG_TYPE'].ConfigurationVersion | [0]" \
--output text)
echo "Current deployment $CURRENT_DEPLOYMENT"
CURRENT_VERSION=$(aws appconfig list-deployments \
--application-id "$APP_ID" \
--environment-id "$ENV_ID" \
--query "Items[?ConfigurationName=='$CONFIG_TYPE'].ConfigurationVersion | [0]" \
--output text)
echo "Latest Version: $LATEST_VERSION"
echo "Current Version: $CURRENT_VERSION"
if [[ "$CURRENT_DEPLOYMENT" == "None" ]] || [[ "$LATEST_VERSION" != "$CURRENT_VERSION" ]]; then
echo "Starting deployment for $TENANT/$ENV/$CONFIG_TYPE..."
DEPLOYMENT_RESPONSE=$(aws appconfig start-deployment \
--application-id "$APP_ID" \
--environment-id "$ENV_ID" \
--deployment-strategy-id Linear50PercentEvery30Seconds \
--configuration-profile-id "$PROFILE_ID" \
--configuration-version "$LATEST_VERSION")
DEPLOYMENT_ID=$(echo $DEPLOYMENT_RESPONSE | jq -r '.DeploymentNumber')
# Monitor deployment
max_attempts=10
attempt=1
while [ $attempt -le $max_attempts ]; do
echo "Checking deployment status (attempt $attempt of $max_attempts)..."
status=$(aws appconfig get-deployment \
--application-id "$APP_ID" \
--environment-id "$ENV_ID" \
--deployment-number "$DEPLOYMENT_ID" \
--query "State" \
--output text)
if [ "$status" = "COMPLETE" ]; then
echo "Deployment completed successfully!"
break
elif [ "$status" = "FAILED" ] || [ "$status" = "ROLLED_BACK" ]; then
echo "Deployment failed or was rolled back!"
exit 1
fi
if [ $attempt -eq $max_attempts ]; then
echo "Deployment timed out after $max_attempts attempts"
exit 1
fi
attempt=$((attempt + 1))
sleep 30
done
else
echo "No changes detected for $TENANT/$ENV/$CONFIG_TYPE (Current: $CURRENT_VERSION, Latest: $LATEST_VERSION). Skipping deployment..."
fi
done
done
done
dependencies:
- update-app-config
variables:
AWS_CREDS_TARGET_ROLE: arn:aws:iam::<aws_account_ID>:role/GitLab
AWS_DEFAULT_REGION: <aws_region>
Implementing Pipeline Stages
Update-App-Config Stage:
Creates/Updates AWS AppConfig Applications:
Creates one application per tenant (tenant1, tenant2)
Uses tenant ID as application name
Retrieves existing application if already present
Manages Configuration Profiles:
Creates three profiles per tenant application (AllowList, FeatureFlags, ThrottlingLimits)
Each profile represents a distinct configuration type
Handles profile creation if not already existing
Creates Hosted Configuration Versions:
Processes changes from both template and tenant directories
Prioritizes tenant-specific configurations over templates
Creates new versions only for modified configurations
Uploads properly encoded configurations to AWS AppConfig
Deploy-App-Config Stage:
Environment Deployment:
Manages dev and qa environments per tenant
Creates environments if not existing
Uses staged deployment strategy
Tenant Configuration Process:
Deploys per tenant and configuration type
Checks current deployed version against latest version
Only deploys if either of the follows is true:
No existing deployment is found
Latest Hosted Configuration version differs from currently deployed version
Maintains tenant-specific settings and version history
Provides clear deployment status messages, including cases where deployment is skipped
Deployment Management:
Executes AWS AppConfig deployments
Monitors deployment status
Handles failures and rollbacks
Times out after 10 retries
Executing the Pipeline
Initiation:
Pipeline triggered by changes pushed to the repository
Update-App-Config Stage:
Creates or updates applications and configuration profiles
Generates new versions of hosted configurations
Deploy-App-Config Stage:
Iterates through each environment tenant and their environments
Checks current deployment status for each environment and tenant
Initiates new deployments only for changed configurations
Note: Deployment Strategy used in this example is a fast one used for testing (Linear50PercentEvery30Seconds) but for real production workloads, the reader should use the slower, AWS-recommended Linear20PercentEvery6Minutes strategy. More details here
This structured execution process ensures efficient and consistent deployment of configuration changes across the entire application ecosystem, maintaining synchronization between GitLab and AWS AppConfig.
Cleaning up
To clean up all AWS AppConfig resources created by this solution, you can use the following cleanup script. Create a file named delete_appconfig_resources.sh with this content:
#!/bin/bash

# List all applications
APPS=$(aws appconfig list-applications --query 'Items[*].Id' --output text)

for APP_ID in $APPS
do
  echo "Processing application $APP_ID"

  # List and delete all environments for this application
  ENVS=$(aws appconfig list-environments --application-id $APP_ID --query 'Items[*].Id' --output text)
  for ENV_ID in $ENVS
  do
    echo "  Deleting environment $ENV_ID"
    aws appconfig delete-environment --application-id $APP_ID --environment-id $ENV_ID
  done

  # List and delete all configuration profiles for this application
  PROFILES=$(aws appconfig list-configuration-profiles --application-id $APP_ID --query 'Items[*].Id' --output text)
  for PROFILE_ID in $PROFILES
  do
    echo "  Deleting configuration profile $PROFILE_ID"

    # Delete all hosted configuration versions for this profile
    VERSIONS=$(aws appconfig list-hosted-configuration-versions --application-id $APP_ID --configuration-profile-id $PROFILE_ID --query 'Items[*].VersionNumber' --output text)
    for VERSION in $VERSIONS
    do
      echo "    Deleting hosted configuration version $VERSION"
      aws appconfig delete-hosted-configuration-version --application-id $APP_ID --configuration-profile-id $PROFILE_ID --version-number $VERSION
    done

    # Delete the configuration profile
    aws appconfig delete-configuration-profile --application-id $APP_ID --configuration-profile-id $PROFILE_ID
  done

  # Delete the application
  echo "  Deleting application $APP_ID"
  aws appconfig delete-application --application-id $APP_ID
done

echo "All AppConfig resources have been deleted."
The script is a comprehensive cleanup utility for AWS AppConfig resources.
To execute this script, you need to have the AWS CLI installed and configured with appropriate credentials that have permissions to delete AppConfig resources. Make the script delete_appconfig_resources.sh executable by running the command:
chmod +x cleanup_appconfig.sh.
Before running the script, ensure that you’re in the correct AWS account and region, as this script will delete ALL AppConfig resources in the configured account and region. To execute the script, simply run it from your terminal: ./ delete_appconfig_resources.sh
It’s crucial to note that this script performs irreversible deletions. Use it with extreme caution, preferably in non-production environments or when you’re absolutely certain you want to remove all AppConfig resources.
Conclusion
This blog post has explored the powerful synergy between GitLab CI/CD and AWS AppConfig for managing application configurations in multi-tenant environments. We’ve demonstrated how this integration automates and streamlines the process of updating, versioning, and deploying configuration changes, offering benefits such as scalability, version control, and the balance between consistency and flexibility. By adopting this approach, development teams can significantly reduce manual errors, save time, and focus more on building features, ultimately leading to faster development cycles and more reliable applications in our increasingly complex and distributed computing landscape.
Operators, administrators, developers, and many other personas leveraging AWS come across multiple use cases and common issues such as lack of permissions, bugs in code in AWS Lambda, and more when leveraging the AWS console. To help alleviate this burden when using the console, AWS released Amazon Q to assist with users accessing the console with these use cases. Amazon Q is AWS’s generative AI-powered assistant that helps write code, answer questions, generate content, solve problems, manage AWS resources, and take actions. A component of Amazon Q is Amazon Q Developer. One way to interact with the service is to chat with Amazon Q Developer in the AWS Management Console, the AWS Console Mobile Application, on AWS websites, AWS Documentation websites, and chat channels integrated with AWS Chatbot to learn about AWS services. You can ask Q Developer about best practices, recommendations, step-by-step instructions for AWS tasks, and architecting your AWS resources and workflows.
In this blog post, we will highlight best practices for interacting with Q Developer in the console including topics such as using Q Developer in the console to generate code snippets, architect workloads, and understand your costs.
Prerequisites
To follow along with these examples, the following prerequisites are required:
Please Note – Amazon Q in Console may generate different output than shown in examples below due to its non-deterministic nature.
To start, access the Amazon Q Developer service by signing into the AWS console and clicking the Amazon Q icon on the right-hand panel as shown below in Figure 1. Authenticate if necessary:
Figure 1: Accessing Amazon Q Chat
Use Q to learn about AWS services and best practices
In this section, we will look at how Amazon Q can help you learn about AWS services and also outline the best practices for using those services
Learn about services available in AWS
Whether someone is just learning or an experienced user, Amazon Q provides a simple way to discover AWS capabilities and get helpful information whenever needed. For example, if you are looking to learn on how to auto-scale your compute instances based on a metric you can ask Amazon Q in console.
Sample prompt – I need to set a autoscaling group for EC2 instances with this requirement, if CPU utilization goes above 50% for 5 minutes then it should add new instance and if CPU utilization drops below 50% for 5 minutes then it should delete 1 instance.
Figure 2: User Prompt and Response from Amazon Q for Auto Scaling Compute Instance based on a specific metric and threshold
The response from Amazon Q lists down all the steps to set an Auto Scaling Group based on the requirements provided in the prompt.
Ask specific questions about AWS services
Amazon Q in console can also help you to run systems to deliver business value keeping best practices in mind. With natural language prompts, you can learn the best practices when using AWS services.
Sample Prompt –
I am using API Gateway for REST APIs. I have configured timeout for requests. I would like to learn additional best practices to reduce and handle long running requests.
Figure 3: User Prompt and Response from Amazon Q keeping compute costs low
As shown above in Figure 3, Amazon Q then summarizes various ways to optimize for long running requests in Amazon API Gateway, for example, implement timeouts, use asynchronous invocation for long running operation if possible and several other ways to optimize.
Use Q to generate code snippets or scripts to automate tasks using AWS SDK or AWS CLI
Developers or System Administrators can use Q to generate code snippets or scripts to automate tasks instead of spending time going through documentation.
How to write an AWS Lambda function to read data from S3
For example, a developer may way to get started writing an AWS Lambda function that reads data from an Amazon S3 bucket but doesn’t know how to get started, Amazon Q can help.
Figure 4: User Prompt and Response from Amazon Q on instructions to write a Lambda function
Figure 5: Response from Amazon Q with sample code to write a Lambda function
As shown above in Figure 4 & 5, Amazon Q returns step-by-step instructions on how to write the Lambda function, including sample code for reference.
How do I upload a file to an S3 bucket using the AWS CLI?
If a developer or IT Professional uses the AWS CLI frequently but struggle with finding right commands to accomplish a task, then Amazon Q is definitely helpful
Sample Prompt –
How do I upload a file to an S3 bucket using the AWS CLI?
Figure 6: User Prompt and Response from Q with CLI command to upload file to S3 bucket
As shown above in Figure 6, Amazon Q returns the CLI command to upload a file to an S3 bucket. The response also suggests the command to verify the upload.
Use Console-to-Code to write code to automate use of other services
Console-to-Code records your console actions, then uses generative AI to suggest code in your preferred language which currently supports CLI commands, CDK Java, CDK Python, CDK TypeScript, CloudFormation JSON/YAML.
Let’s say a developer wants to generate a CloudFormation YAML with an Amazon EC2 instance and Amazon RDS database instance. For this, the developer can go to the console of Amazon EC2 and Amazon RDS. On the right side, choose Console-to-Code icon and choose Start Recording.
As shown in the figures below, once an Amazon EC2 instance and then Amazon RDS DB instance is launched, stop the recording and simply download the CloudFormation YAML template.
Figure 8: Generate Infrastructure-As-Code from the Console-to-Code recording
Figure 9: Generated CloudFormation YAML template from the Console-to-Code recording
Use Q to architect a workload & optimize
In this section, we will focus on leveraging Amazon Q to architect new workloads and optimize existing workloads.
Architecting Workloads
Now, a developer wants to build a new financial services application with the following requirements:
Architecture must be serverless & event driven
It must provide functionality as deposits and withdrawals
It should use low-cost, efficient AWS services.
It should scale with traffic spikes that can reach thousands of requests per second.
Should support REST APIs
Let’s prompt Amazon Q Developer by copying the following prompt below and pasting it into the chat window:
Sample Prompt:
How can I build a new financial services application with the following requirements: it should be serverless and event driven, must provide functionality as deposits and withdrawals, It should use low-cost efficient AWS services, It should scale with traffic spikes that can reach thousands of requests per second, and lastly it should support REST APIs.
Amazon Q should provide a response on how to architect this workload. Here is a sample response received from Amazon Q:
Figure 10: Response from Amazon Q for architecture
Amazon Q was able to provide the following response in full:
________________________________________________
To build a new financial services application with the requirements you described, I would recommend the following AWS services and architecture:
Serverless and Event-Driven Architecture:
Use AWS Lambda for the core application logic, which will allow you to run your code without provisioning or managing servers. Integrate AWS Lambda with other serverless services like Amazon API Gateway for the REST API, Amazon DynamoDB for the database, and Amazon SNS/SQS for event-driven messaging.
Deposits and Withdrawals Functionality:
Use Amazon DynamoDB as the database to store customer account information and transaction details.
Implement the deposit and withdrawal logic in AWS Lambda functions, which can be triggered by events from Amazon API Gateway or Amazon SNS/SQS.
Low-Cost and Efficient AWS Services:
Leverage AWS Lambda, which charges only for the compute time you consume, and Amazon DynamoDB, which provides a pay-per-request pricing model.
Use Amazon API Gateway’s pay-per-call pricing to keep costs low for the REST API.
Consider using Amazon SQS and Amazon SNS for their low-cost, highly available, and scalable messaging capabilities.
Scalability and High-Performance:
AWS Lambda and the other serverless services you choose will automatically scale to handle traffic spikes of thousands of requests per second.
You can further optimize performance by using features like Amazon API Gateway’s caching, Amazon DynamoDB’s auto-scaling, and Amazon SQS’s message batching.
REST API Support:
Integrate your application logic in AWS Lambda with Amazon API Gateway to expose a RESTful API. Amazon API Gateway will handle the API management, including routing, authentication, and throttling.
To get started, I recommend reviewing the following AWS documentation:
As shown above, Amazon Q was able to provide the service recommendations for our architecture based on the requirements provided along with links to services recommended based on the requirements
Optimizing workloads
Now, let’s a developer or IT professional has an architecture that revolves around Amazon EC2 and an instance deployed called Server-1-demo in AWS and wants to optimize to help save on costs.
Similar to the previous section, open a new chat window within the Amazon Q chat in the console and enter the following prompt:
Sample Prompt:
Based on the current CPU utilization of my EC2 Server-1-demo, what do you recommend I do to cost optimize?
As a result, Q provides the following response:
Figure 11: Optimization Response from Amazon Q
As shown, Amazon Q took in the context of the CPU utilization for Server-1-demo and made recommendations to leverage new instance types such as AWS Graviton which is designed to deliver the best price performance for your cloud workloads running in Amazon Elastic Compute Cloud (Amazon EC2) along with other recommendations.
Use Q to understand your costs
Another way to leverage Q in the console is to analyze costs. A developer or IT professional can use Amazon Q, to retrieve and analyze cost data from AWS Cost Explorer, being able ask questions about AWS costs and receive answers in natural language that reflect the actual costs of your AWS account.
Now, open a new Amazon Q in Console chat window and lets try the following prompt as an example:
Sample Prompt:
Show me the breakdown of EC2 costs by instance type for the last 30 days.
Figure 12: Response from Amazon Q for the breakdown of EC2 costs in the last month
As shown above in Figure 12, Q Developer provides a detailed breakdown of the EC2 instance types for the last 30 days.
Now, trying another example:
Sample Prompt:
What was my cost breakdown by service for the past three months?
Figure 13: Response from Amazon Q for last 3 months spend analysis
As shown in figure 13, Amazon Q provides detailed cost breakdowns, including percentages of total spend, making it easy to understand your AWS usage and expenses. This feature allows you to quickly identify your highest-cost services and track spending trends over time. Always verify your cost data with AWS Cost Explorer for the most accurate information. For more details and information on this capability, check out this blog covering the feature in more detail.
Best practices for using Amazon Q in the console
The previous sections showcased examples of leveraging Amazon Q capabilities for AWS application architecture and account management. In both cases, the input given to Amazon Q directly affects its output quality. Your question should be concise, clear and contain the necessary details for the tool to understand the scenario and what should be answered. The recommended approach for providing effective input to a generative AI chat bot is called Prompt Engineering. By adhering to the following best practices, you can achieve improved outcomes when using Amazon Q:
Specify the task you want Q to do: explain a concept, compare services, list pros and cons, generate a CLI command, generate a code snippet, suggest architecture options for a scenario.
Provide context: Why do you need to know this concept? For which part of your application or architecture will you apply the knowledge?
Figure 14: Amazon Q asks for additional details to better answer the question.
In this example, we asked for scenarios, which is what type of answer we want. We also specified the service we want scenarios about, and the edge case of the scenario (after instance creation). Amazon Q summarized our question and provided scenarios and sources in accordance with what we asked.
Break a series of questions into multiple questions.
Ask for one task at a time.
Don’t stop at the first answer; keep asking questions that use the information to help Q provide more enriched responses.
Figure 15: Amazon Q uses chat context to give an answer.
In this scenario, the provided input was not enough for Q to provide a good answer, so it asked for more details and considered both inputs as a context to the answer.
Be mindful about security related questions about your account- Amazon Q in console may not provide answers that address security in your account
Your input must have the maximum of 1000 characters. This is another reason to be concise while providing an input.
Create a new conversation if you are going to start a new topic discussion. Unnecessary context will reduce Q answers specificity to your new situation.
Figure 16: Amazon Q does not provide security tips. Create a new conversation. Maximum allowed characters are 1000.
Conclusion
In this blog post, we explored the various ways in which Amazon Q, AWS’s generative AI-powered assistant, is used in the AWS Console to enhance productivity and reduce ramp-up time for developers, DevOps engineers, and architects. Amazon Q functions as an AWS consultant, offering advice on various tasks, such as understanding AWS services and implementing best practices, as well as generating code snippets and automating CLI commands. The tool’s capability to help architect new workloads and enhance existing ones based on specific needs was demonstrated with detailed examples. The importance of prompt engineering – crafting clear, concise prompts to elicit high-quality responses from the AI assistant – was also discussed. By embracing the capabilities of Amazon Q in the console, AWS users will streamline their workflows and speed up their cloud journey. Whether you’re a seasoned cloud architect or starting out, this AI-powered assistant will serve as a partner, helping you navigate the AWS landscape and unlock new levels of efficiency. As you continue exploring the possibilities of Amazon Q, follow the best practices outlined in this post, experiment!
I’m pleased to announce the availability of Fastlane in your AWS CodeBuild for macOS environments. AWS CodeBuild is a fully managed continuous integration service that compiles source code, runs tests, and produces ready-to-deploy software packages.
Fastlane is an open source tool suite designed to automate various aspects of mobile application development. It provides mobile application developers with a centralized set of tools to manage tasks such as code signing, screenshot generation, beta distribution, and app store submissions. It integrates with popular continuous integration and continuous deployment (CI/CD) platforms and supports both iOS and Android development workflows. Although Fastlane offers significant automation capabilities, developers may encounter challenges during its setup and maintenance. Configuring Fastlane can be complex, particularly for teams unfamiliar with the syntax and package management system of Ruby. Keeping Fastlane and its dependencies up to date requires ongoing effort, because updates to mobile platforms or third-party services may necessitate adjustments to existing workflows.
When we introduced CodeBuild for macOS in August 2024, we knew that one of your challenges was to install and maintain Fastlane in your build environment. Although it was possible to manually install Fastlane in a custom build environment, at AWS, we remove the undifferentiated heaving lifting from your infrastructure so you can spend more time on the aspects that matter for your business. Starting today, Fastlane is installed by default, and you can use the familiar command fastlane buildin your buildspec.yaml file.
Fastlane and code signing To distribute an application on the App Store, developers must sign their binary with a private key generated on the Apple Developer portal. This private key, along with the certificate that validates it, must be accessible during the build process. This can be a challenge for development teams because they need to share the development private key (which allows deployment on selected test devices) among team members. Additionally, the distribution private key (which enables publishing on the App Store) must be available during the signing process before uploading the binary to the App Store.
Fastlane is a versatile build system in that it also helps developers with the management of development and distribution keys and certificates. Developers can use fastlane match to share signing materials in a team and make them securely and easily accessible on individual developers’ machines and on the CI environment. match allows the storage of private keys, the certificates, and the mobile provisioning profiles on a secured share storage. It makes sure that the local build environment, whether it’s a developer laptop or a server machine in the cloud, stays in sync with the shared storage. At build time, it securely downloads the required certificates to sign your app and configures the build machine to allow the codesign utility to pick them up.
If you already use one of these and you’re migrating your projects to CodeBuild, you don’t have much to do. You only need to make sure your CodeBuild build environment has access to the shared storage (see step 3 in the demo).
Let’s see how it works If you’re new to Fastlane or CodeBuild, let’s see how it works.
Import your existing signing materials to a shared private GitHub repository
Configure fastlane to build and sign your project
Use fastlanewith CodeBuild
Step 1: Import your signing materials
Most of the fastlanedocumentation I read explains how to create a new key pair and a new certificate to get started. Although this is certainly true for new projects, in real life, you probably already have your project and your signing keys. So, the first step is to import these existing signing materials.
Apple App Store uses different keys and certificates for development and distribution (there are also ad hoc and enterprise certificates, but these are outside the scope of this post). You must have three files for each usage (that’s a total of six files):
A .mobileprovision file that you can create and download from the Apple developer console. The provisioning profile links your identity, the app identity, and the entitlements the app might have.
A .cer file, which is the certificate emitted by Apple to validate your private key. You can download this from the Apple Developer portal. Select the certificate, then select Download.
A .p12 file, which contains your private key. You can download the key when you create it in the Apple Developer portal. If you didn’t download it but have it on your machine, you can export it from the Apple Keychain app. Note that the KeyChain.app is hidden in macOS 15.x. You can open it with open /System/Library/CoreServices/Applications/Keychain\ Access.app. Select the key you want to export and right click to select Export.
When you have these files, create a fastlane/Matchfile file with the following content:
git_url("https://github.com/sebsto/secret.git")
storage_mode("git")
type("development")
# or use appstore to use the distribution signing key and certificate
# type("appstore")
Be sure to replace the URL of your GitHub repository and make sure this repository is private. It will serve as a storage for your signing key and certificate.
Then, I import my existing files with the fastlane match import --type appstore command. I repeat the command for each environment: appstore and development.
The very first time, fastlane prompts me for my Apple Id username and password. It connects to App Store Connect to verify the validity of the certificates or to create new ones when necessary. The session cookie is stored in ~/.fastlane/spaceship/<your apple user id>/cookie.
fastlane match also asks for a password. It uses this password to generate a key to crypt the signing materials on the storage. Don’t forget this password because it will be used at build time to import the signing materials on the build machine.
Here is the command and its output in full:
 fastlane match import --type appstore

[✔] 🚀
[16:43:54]: Successfully loaded '~/amplify-ios-getting-started/code/fastlane/Matchfile' 📄

+-----------------------------------------------------+
| Detected Values from './fastlane/Matchfile'         |
+--------------+--------------------------------------+
| git_url.     | https://github.com/sebsto/secret.git |
| storage_mode | git                                  |
| type         | development                          |
+--------------+--------------------------------------+

[16:43:54]: Certificate (.cer) path:
./secrets/sebsto-apple-dist.cer
[16:44:07]: Private key (.p12) path:
./secrets/sebsto-apple-dist.p12
[16:44:12]: Provisioning profile (.mobileprovision or .provisionprofile) path or leave empty to skip
this file:
./secrets/amplifyiosgettingstarteddist.mobileprovision
[16:44:25]: Cloning remote git repo...
[16:44:25]: If cloning the repo takes too long, you can use the `clone_branch_directly` option in match.
[16:44:27]: Checking out branch master...
[16:44:27]: Enter the passphrase that should be used to encrypt/decrypt your certificates
[16:44:27]: This passphrase is specific per repository and will be stored in your local keychain
[16:44:27]: Make sure to remember the password, as you'll need it when you run match on a different machine
[16:44:27]: Passphrase for Match storage: ********
[16:44:30]: Type passphrase again: ********
security: SecKeychainAddInternetPassword <NULL>: The specified item already exists in the keychain.
[16:44:31]: 🔓 Successfully decrypted certificates repo
[16:44:31]: Repo is at: '/var/folders/14/nwpsn4b504gfp02_mrbyd2jr0000gr/T/d20250131-41830-z7b4ic'
[16:44:31]: Login to App Store Connect ([email protected])
[16:44:33]: Enter the passphrase that should be used to encrypt/decrypt your certificates
[16:44:33]: This passphrase is specific per repository and will be stored in your local keychain
[16:44:33]: Make sure to remember the password, as you'll need it when you run match on a different machine
[16:44:33]: Passphrase for Match storage: ********
[16:44:37]: Type passphrase again: ********
security: SecKeychainAddInternetPassword <NULL>: The specified item already exists in the keychain.
[16:44:39]: 🔒 Successfully encrypted certificates repo
[16:44:39]: Pushing changes to remote git repo...
[16:44:40]: Finished uploading files to Git Repo [https://github.com/sebsto/secret.git]
I verify that Fastlane imported my signing material to my Git repository.
I can also configure my local machine to use these signing materials during the next build:
» fastlane match appstore

[✔] 🚀
[17:39:08]: Successfully loaded '~/amplify-ios-getting-started/code/fastlane/Matchfile' 📄

+-----------------------------------------------------+
|   Detected Values from './fastlane/Matchfile'       |
+--------------+--------------------------------------+
| git_url      | https://github.com/sebsto/secret.git |
| storage_mode | git                                  |
| type         | development                          |
+--------------+--------------------------------------+


+-------------------------------------------------------------------------------------------+
|                                 Summary for match 2.226.0                                 |
+----------------------------------------+--------------------------------------------------+
| type                                   | appstore                                         |
| readonly                               | false                                            |
| generate_apple_certs                   | true                                             |
| skip_provisioning_profiles             | false                                            |
| app_identifier                         | ["com.amazonaws.amplify.mobile.getting-started"] |
| username                               | xxxx@xxxxxxxxx                                   |
| team_id                                | XXXXXXXXXX                                       |
| storage_mode                           | git                                              |
| git_url                                | https://github.com/sebsto/secret.git             |
| git_branch                             | master                                           |
| shallow_clone                          | false                                            |
| clone_branch_directly                  | false                                            |
| skip_google_cloud_account_confirmation | false                                            |
| s3_skip_encryption                     | false                                            |
| gitlab_host                            | https://gitlab.com                               |
| keychain_name                          | login.keychain                                   |
| force                                  | false                                            |
| force_for_new_devices                  | false                                            |
| include_mac_in_profiles                | false                                            |
| include_all_certificates               | false                                            |
| force_for_new_certificates             | false                                            |
| skip_confirmation                      | false                                            |
| safe_remove_certs                      | false                                            |
| skip_docs                              | false                                            |
| platform                               | ios                                              |
| derive_catalyst_app_identifier         | false                                            |
| fail_on_name_taken                     | false                                            |
| skip_certificate_matching              | false                                            |
| skip_set_partition_list                | false                                            |
| force_legacy_encryption                | false                                            |
| verbose                                | false                                            |
+----------------------------------------+--------------------------------------------------+

[17:39:08]: Cloning remote git repo...
[17:39:08]: If cloning the repo takes too long, you can use the `clone_branch_directly` option in match.
[17:39:10]: Checking out branch master...
[17:39:10]: Enter the passphrase that should be used to encrypt/decrypt your certificates
[17:39:10]: This passphrase is specific per repository and will be stored in your local keychain
[17:39:10]: Make sure to remember the password, as you'll need it when you run match on a different machine
[17:39:10]: Passphrase for Match storage: ********
[17:39:13]: Type passphrase again: ********
security: SecKeychainAddInternetPassword <NULL>: The specified item already exists in the keychain.
[17:39:15]: 🔓  Successfully decrypted certificates repo
[17:39:15]: Verifying that the certificate and profile are still valid on the Dev Portal...
[17:39:17]: Installing certificate...

+-------------------------------------------------------------------------+
|                          Installed Certificate                          |
+-------------------+-----------------------------------------------------+
| User ID           | XXXXXXXXXX                                          |
| Common Name       | Apple Distribution: Sebastien Stormacq (XXXXXXXXXX) |
| Organisation Unit | XXXXXXXXXX                                          |
| Organisation      | Sebastien Stormacq                                  |
| Country           | US                                                  |
| Start Datetime    | 2024-10-29 09:55:43 UTC                             |
| End Datetime      | 2025-10-29 09:55:42 UTC                             |
+-------------------+-----------------------------------------------------+

[17:39:18]: Installing provisioning profile...

+-------------------------------------------------------------------------------------------------------------------+
|                                          Installed Provisioning Profile                                           |
+---------------------+----------------------------------------------+----------------------------------------------+
| Parameter           | Environment Variable                         | Value                                        |
+---------------------+----------------------------------------------+----------------------------------------------+
| App Identifier      |                                              | com.amazonaws.amplify.mobile.getting-starte  |
|                     |                                              | d                                            |
| Type                |                                              | appstore                                     |
| Platform            |                                              | ios                                          |
| Profile UUID        | sigh_com.amazonaws.amplify.mobile.getting-s  | 4e497882-d80f-4684-945a-8bfec1b310b9         |
|                     | tarted_appstore                              |                                              |
| Profile Name        | sigh_com.amazonaws.amplify.mobile.getting-s  | amplify-ios-getting-started-dist             |
|                     | tarted_appstore_profile-name                 |                                              |
| Profile Path        | sigh_com.amazonaws.amplify.mobile.getting-s  | /Users/stormacq/Library/MobileDevice/Provis  |
|                     | tarted_appstore_profile-path                 | ioning                                       |
|                     |                                              | Profiles/4e497882-d80f-4684-945a-8bfec1b310  |
|                     |                                              | b9.mobileprovision                           |
| Development Team ID | sigh_com.amazonaws.amplify.mobile.getting-s  | XXXXXXXXXX                                   |
|                     | tarted_appstore_team-id                      |                                              |
| Certificate Name    | sigh_com.amazonaws.amplify.mobile.getting-s  | Apple Distribution: Sebastien Stormacq       |
|                     | tarted_appstore_certificate-name             | (XXXXXXXXXX)                                 |
+---------------------+----------------------------------------------+----------------------------------------------+

[17:39:18]: All required keys, certificates and provisioning profiles are installed 🙌
Step 2: Configure Fastlane to sign your project
I create a Fastlane build configuration file in fastlane/Fastfile (you can use fastlane init command to get started):
default_platform(:ios)

platform :ios do
  before_all do
    setup_ci
  end

  desc "Build and Sign the binary"
  lane :build do
    match(type: "appstore", readonly: true)
    gym(
      scheme: "getting started",
      export_method: "app-store"
    )
  end
end
Make sure that the setup_ci action is added to the before_all section of Fastfile for the match action to function correctly. This action creates a temporary Fastlane keychain with correct permissions. Without this step, you may encounter build failures or inconsistent results.
And I test a local build with the command fastlane build. I enter the password I used when importing my keys and certificate, then I let the system build and sign my project. When everything is correctly configured, it produces a similar output.
...
[17:58:33]: Successfully exported and compressed dSYM file
[17:58:33]: Successfully exported and signed the ipa file:
[17:58:33]: ~/amplify-ios-getting-started/code/getting started.ipa

+---------------------------------------+
|           fastlane summary            |
+------+------------------+-------------+
| Step | Action           | Time (in s) |
+------+------------------+-------------+
| 1    | default_platform | 0           |
| 2    | setup_ci         | 0           |
| 3    | match            | 36          |
| 4    | gym              | 151         |
+------+------------------+-------------+

[17:58:33]: fastlane.tools finished successfully 🎉
There is just one Fastlane-specific configuration. To access the signing materials, Fastlane requires access to three secret values that I’ll pass as environment variables:
MATCH_PASSWORD, the password I entered when importing the signing material. Fastlane uses this password to decipher the encrypted files in the GitHub repository
FASTLANE_SESSION, the value of the Apple Id session cookie, located at ~/.fastlane/spaceship/<your apple user id>/cookie. The session is valid from a couple of hours to multiple days. When the session expires, reauthenticate with the command fastlane spaceauth from your laptop and update the value of FASTLANE_SESSION with the new value of the cookie.
MATCH_GIT_BASIC_AUTHORIZATION, a base 64 encoding of your GitHub username, followed by a colon, followed by a personal authentication token (PAT) to access your private GitHub repository. You can generate PAT on the GitHub console in Your Profile > Settings > Developers Settings > Personal Access Token. I use this command to generate the value of this environment variable: echo -n my_git_username:my_git_pat | base64.
If your build project refers to secrets stored in Secrets Manager, the build project’s service role must allow the secretsmanager:GetSecretValue action. If you chose New service role when you created your project, CodeBuild includes this action in the default service role for your build project. However, if you chose Existing service role, you must include this action to your service role separately.
After I created the project in the CodeBuild section of the AWS Management Console, I enter the three environment variables. Notice that the value is the name of the secret in Secrets Manager.
You can also define the environment variables and their Secrets Manager secret name in your buildpsec.yaml file.
Next, I modify the buildspec.yaml file at the root of my project to use fastlane to build and sign the binary. My buildspec.yaml file now looks like this one:
The Rosetta and Amplify scripts are required to receive the Amplify configuration for the backend. If you don’t use AWS Amplify in your project, you don’t need these.
Notice that there is nothing in the build file that downloads the signing key or prepares the keychain in the build environment; fastlane match will do that for me.
I add the new buildspec.yaml file and my ./fastlane directory to Git. I commit and push these files. git commit -m "add fastlane support" && git push
When everything goes well, I can see the build running on CodeBuild and the Succeeded message.
Pricing and availability Fastlane is now pre-installed at no extra cost on all macOS images that CodeBuild uses, in all Regions where CodeBuild for macOS is available. At the time of this writing, these are US East (Ohio, N. Virginia), US West (Oregon), Asia Pacific (Sydney), and Europe (Frankfurt).
In my experience, it takes a bit of time to configure fastlane match correctly. When it’s configured, having it working on CodeBuild is pretty straightforward. Before trying this on CodeBuild, be sure it works on your local machine. When something goes wrong on CodeBuild, triple-check the values of the environment variables and make sure CodeBuild has access to your secrets on AWS Secrets Manager.
This post is co-written with Dr. Geoff Ryder, Manager, at SmugMug.
Introduction
SmugMug operates two very large online photo platforms: SmugMug and Flickr. These platforms enable more than 100 million customers to safely store, search, share, and sell tens of billions of photos every day. However, the data science and engineering team at SmugMug and Flickr often faces complex data modeling challenges that require significant time to resolve.
These challenges arise due to several factors. First, the team has to contend with diverse datasets from different sources. Additionally, the database schema and tables are highly complex, and the team needs to quickly understand application (PHP) code and database table structures in order to generate the necessary complex database queries. Specifically, SmugMug uses Amazon Redshift as its cloud data warehouse to analyze patterns in petabyte-scale data stored in Amazon S3, as well as transactional data in Amazon Aurora and Amazon DynamoDB. This allows them to generate dozens of business reports daily.
However, the complexity increases further as many database tables also need to be imported from third-party organizations into Amazon Redshift, where they are joined with SmugMug and Flickr’s internal tables. In extreme cases, properly modeling all these database tables and handling issues like granularity, cardinality, timestamps and missing data could take years – an impractical timeline for the business. We are excited to walk through SmugMug’s data modeling use cases and how SmugMug uses Amazon Q Developer to improve the data science and engineering team’s productivity.
Discovering Amazon Q Developer
SmugMug was one of the first customers to pilot Amazon Q Developer (previously Amazon CodeWhisperer), the most capable AI-powered assistant for software development that re-imagines the experience across the entire software development lifecycle, making it easier and faster to build, secure, manage, optimize, operate, and transform applications on AWS. There are multiple Amazon Q Developer use cases at SmugMug and Flickr, such as using Amazon Q Developer agent (/dev) for software development (i.e. generating implementation plans and the accompanying code), generating inline code suggestions, asking Amazon Q Developer in chat about AWS services and best practices, and analyzing AWS usage and costs for Cloud Financial Management (CFM) needs. For the data science and engineering team specifically, the key feature is chatting with Amazon Q Developer in integrated development environments (IDEs) like Intellij DataGrip. The data analysts and data scientists at SmugMug and Flickr ask questions in Amazon Q Developer chat to analyze database schemas, generate data model diagrams from DDL (Data Definition Language) statements, convert queries between languages, automatically generate complex database queries for data analysis, generate code to validate table contents, and predict trends using ML (Machine Learning).
Implementing Amazon Q Developer
To solve the data modeling challenges SmugMug faced, the team collaborated closely with their AWS Account Team, AWS Professional Services, and the Amazon Q Developer service team to create and test a data modeling assistant solution using Amazon Q Developer.
As a first step, the data modeler needs to bring the right metadata to bear. For simpler cases, the commands “show view myschema.v” or “show table myschema.t“ retrieve DDL schema information about the specified view or table from Amazon Redshift into the IDE console.
Here’s an example using simulated data for a hypothetical company. For this typical company that handles orders for products, the result of typing “show table sample.orderinfo” and “show table sample.skuinfo”might be:
This DDL text is now in the open tab. By selecting the text to highlight it, that DDL text becomes part of the context that Amazon Q Developer sees. The modeler can start asking questions about them in the Amazon Q Developer chat window in the IDE.
In complex scenarios, establishing the correct modeling context requires a combination of schema information, legacy SQL, application source code in various programming languages, sample values, and natural language documentation. Amazon Q Developer addresses this by creating a local index of relevant files and content. When a question is asked using @workspace, this index is consulted to identify and include pertinent sections of code and information in the request. (See this article for additional details on workspace). The prompt plays a crucial role in measuring similarity, so providing comprehensive context within it is essential. To optimize this process, the IDE settings feature a tunable workspace index function, allowing for enhanced performance in identifying and incorporating relevant context.
Workspace Index Settings
By adopting Amazon Q Developer as a team, we are able to jointly develop and share proprietary prompt text to address the four steps in our modeling process, as follows.
Step 1. Define the goal for the data modeling project
From prior knowledge, sketch a high-level goal for a data model. Gather the data for it manually, or by e.g. querying a vector database and adding its documents to the project.
For this example, we choose as the goal to compute aggregated metrics from a new table or view composed of two existing tables, sample.orderinfo and sample.skuinfo. These contain simulated data about product sales that are common to many companies. The order table is in the style of a fact table that logs customer orders, and the stock keeping unit (SKU) table is a dimension table that provides additional data points of interest about each order. The order and SKU information need to be combined by a join operation before we can compute the metrics. We would like Amazon Q Developer to tell us how to write that SQL join statement.
Step 2. Conduct an exploratory analysis and generate candidates
Next, prompt Amazon Q Developer for candidate foreign keys to join the tables, and for SQL code to execute those joins. Generate an entity-relationship diagram (ERD) as a visual aid. Prompts do not have to be complicated. For example:
@workspace What columns of database tables sample.orderinfo and sample.skuinfo
would be best to join the two tables? Provide SQL code for the join. Draw an
entity relationship diagram that shows the joins between the two tables, and
includes only the fields involved in the join. Add a crow's foot cardinality
marker to indicate a 1:many relationship, and add it next to the high
cardinality table.
Each time tables are joined together, new aggregated metrics become available to drive business insights. Now, for instance, we can find the top selling SKUs in October thanks to our results:
Sometimes we need to look at code written in languages other than SQL to complete the data model. For example, the names of some vendors this company works with happen to appear in application PHP code as human readable strings, but are saved in the application database as numbers. The analytics data staged in Redshift only contain the numbers. So, we pull a copy of the PHP text file into @workspace, and ask Amazon Q Developer to translate the relevant string-integer mappings into a SQL case statement.
PHP Switch statement showing the mapping of Vendor Ids to String Names.
I am a Redshift database administrator and I am working on a data modeling
problem. I would like to write SQL statements to join tables sample.orderinfo
and sample.skuinfo. Please write that SQL to join the two tables. Also, I
would like to write a SQL case statement to recover all string values defined
in PHP that are represented as integer values in the database table.
The output of that prompt is shown below.
Amazon Q Developer automatically detected the PHP switch case statement, converted to SQL, and added it to the final query. Many other programming languages are supported, and modelers should try this technique with other kinds of source code. Note that data scientists and analysts may not know where to look in complex application code for these details, so this discovery-plus-code translation step is a net new benefit to our company that is only possible thanks to Amazon Q Developer.
Step 3. Create code to test the analysis
Now we request SQL source code for a battery of small test queries. These can return cardinality, grain, arithmetic, and null count results.
Please write a short SQL test to compute counts of the key fields that are used
in the joins, which will verify the cardinality assignments indicated in the
entity relationship diagram above. The SQL test should compare distinct counts
to total counts and null counts when it verifies the cardinality.
Step 4. Validate the results of the analysis
Run the test queries to see if the candidate solution from step 2 meets our goals. The “Insert at cursor” button at the bottom of the response is handy for this. The data modeler can easily spot an error in the join logic and ERD from inspecting the output of the test query. (Or, if it’s hard to interpret the results, keep making the test queries simpler.) If errors arise from the AI misinterpreting or miscalculating a result, or from a vaguely worded prompt, simply adjust the prompt in step 2 to fix the known errors, and repeat steps 2 – 4.
After a few iterations, taking from seconds to at most tens of minutes each, the modeling errors have been worked out and we arrive at a valid production query.
Key Benefits and Results
With this Amazon Q Developer powered solution and iterative approach, SmugMug has achieved highly accurate data modeling results across numerous database tables. Once the correct modeling configuration is established, various useful outputs may become available.
We already described production SQL, unit tests, and ERDs for documentation. By the end of the process, because Amazon Q Developer has a good understanding of the data it just modeled in its chat history, it will also generate useful Python machine learning programs to predict business trends. Here is a prompt for that, and a partial screenshot of the Python output:
Please write Python code to implement a linear regression that predicts the
quantity_ordered value based on other fields in the data set. Choose predictor
variables that are less likely to cause multi-collinearity problems.
This only shows the model training step, but the full response included all library imports, a Redshift query, feature engineering steps, ML performance metrics, and code for plotting the metrics. And the AI can produce other types of predictive models. For example, you can try:
Please write Python code to implement an XGBoost model that predicts the
quantity_ordered value based on other fields in the data set.
Ultimately, the solution has improved team productivity for both existing and new team members, while maintaining legacy knowledge needed to onboard new team members more efficiently. Key benefits include:
Reducing SmugMug data analyst and scientist’s time spent on data modeling tasks from days to hours, allowing them to reallocate this time to other high-priority projects.
Automating the generation of BI documentation and predictive ML, also saving crucial time.
Providing net new value by translating application code constant definitions into SQL. Due to organizational boundaries, we would not have achieved this without an assist from the AI.
Future Plans and Expansion
SmugMug conducted the initial data modeling use case testing with over a dozen data science team members and analysts. We are moving on to analyze more complex tables and data schemas, and generating Python code in Amazon SageMaker for ML tasks like data preparation, training, inference, and MLOps. From our experience, Amazon Q Developer has become a preferred internal tool for development that has a data modeling component, and its use continues to expand to different groups around the company.
For SmugMug’s data modeling projects, we continue to enhance the four-step process described above. In order to gather the most relevant context to solve a problem, we build vector database collections to pull from schemas, older SQL code, application source code, BI tool content, and curated documentation. The vector search operation surfaces the right content, and spares data modelers from manually searching in different code archives. We use ChromaDB to do the searches, and bring the results from ChromaDB into the workspace as additional files.
Conclusion
Using Amazon Q Developer for data modeling use cases, SmugMug has managed to increase data science and engineering team productivity by up to 100% when compared to prior workflows. To explore how Amazon Q Developer can benefit your organization, get started here. If you have questions or suggestions, please leave a comment below.
Amazon Q Developer Agent for code transformation is an AI-powered tool which modernizes code bases from Java 8 and Java 11 to Java 17. Integrated into VS Code and IntelliJ, Amazon Q simplifies the migration process and reduce the time and effort compared to manual process. It proposes and verifies code changes, using AI to debug compilation errors. In this blog post, we’ll explore recent improvements to our code transformation agent, particularly its enhanced debugging capabilities. The enhanced debugger agent significantly improves transformation efficiency and quality compared to the existing debugger.
How Amazon Q transforms Java applications
To upgrade Java codebases, the code transformation agent takes the source code input and verify the build and test in source Java version. It then uses deterministic tools to apply code changes, followed by building and testing the changed code in the target Java version. If errors occur in this stage, a generative AI-based system debugs and resolves the compilation errors. Until today, the debugger resolves each error one by one, locating the code file with the error in the codebase, and fixing it. This debug step iterates until all compilation errors are solved or the maximum number of iterations is reached.
As an example, if, as the result of a library upgrade, an import statement is missing or wrong, the AI debugger will re-build, iterate to find all the references in multiple files one by one, and update each reference to resolve the error. Refer to this blog “Three ways Amazon Q Developer agent for code transformation accelerates Java upgrades” for detailed explanation of each transformation step. This approach has helped Q Developer customers achieve accelerations of migration effort by over 40%.
Improving the debugging capabilities of code transformations
To further improve the ability of Q Developer to generate error-free code, we’ve just released multiple foundational improvements to the AI debugger.
Multi-error context: the debug AI can now take multiple build errors into consideration, which provides more context, leading to better solution discovery.
More tools available for the AI: compared to simply localizing error to a single file and fixing the error previously, the agent can now execute multi-file solutions by exploring the codebase and operating on multiple files.
Inter-iteration memory: the debugger AI now remembers previous errors, which contributes to debugging new errors.
Intelligent backtracking: the debugger AI can now recognize if the current solution path leads to a dead end, in which case the agent can roll back to the previous state.
To implement these capabilities, the debugger AI is re-architected as a multi-agent system. A memory management agent is responsible to analyze last iteration results and append the relevant portions to the inter-iteration memory. A critic agent is responsible to analyze progress and provide additional information to the debugger agent and, if a dead end is detected, rollback the progress to a previous state. A debugger agent, analyzes the memory and the critique from the previous agents and modifies or updates the plan to fix the remaining errors in the codebase. The debugger agent has its disposal a set of generic and specialized tools to browse and explore the codebase, edit source files, trigger builds, add dependencies, and so on. It is important to note that the agent only has access to the files and tools related to the transformation task, which limits hallucinations and drive towards progress.
Let’s examine how the agent handles recurring issues across multiple files with these improvements. Consider a scenario where several Java files are missing the same import statement after upgrading from Java 8 to Java 17. This happens when you upgrade from older Java collections (like Vector and Enumeration) to modern streaming operations. The system is capable of helping you update these patterns automatically. The agent is now able to intelligently detect this pattern and implement a comprehensive solution across all affected files. Suppose we have three Java files that use the java.util.stream.Collectors class, but the import is missing in each:
File1.java:
public class File1 {
    public List<String> process(List<String> input) {
        return input.stream()
            .filter(s → s.length() > 5)
            .collect(Collectors.toList()); // Error: Cannot resolve symbol 'Collectors'
    }
}
File2.java:
public class File2 {
    public Map<String, Long> countWords(List<String> words) {
        return words.stream()
            .collect(Collectors.groupingBy(
                word -> word.toLowerCase(),
                Collectors.counting()
            )); // Error: Cannot resolve symbol 'Collectors'
    }
}
File3.java:
public class File3 {
    public String concatenate(List<String> strings) {
        return strings.stream()
            .collect(Collectors.joining(", "));
            // Error: Cannot resolve symbol 'Collectors'
    }
}
After the agent detects the common issue and applies the fix, all three files would be updated as follows:
File1.java (after fix):
import java.util.stream.Collectors;

public class File1 {
    public List<String> process(List<String> input) {
        return input.stream()
            .filter(s -> s.length() > 5)
            .collect(Collectors.toList());
    }
}
File2.java (after fix):
import java.util.stream.Collectors;

public class File2 {
    public Map<String, Long> countWords(List<String> words) {
        return words.stream()
            .collect(Collectors.groupingBy(
                word -> word.toLowerCase(),
                Collectors.counting()));
    }
}
File3.java (after fix):
import java.util.stream.Collectors;

public class File3 {
    public String concatenate(List<String> strings) {
        return strings.stream()
            .collect(Collectors.joining(", "));
    }
}
In this example, the agent has identified that the same import statement (import java.util.stream.Collectors;) was missing in all three files. It then applied the fix consistently across all affected files, demonstrating its ability to recognize patterns and implement solutions efficiently across the entire codebase, avoiding different solutions attempts for each individual error, and saving iteration budget to solve different errors, if present.
The contrast between existing debugger and enhanced Agent is more clear when handling complex, interconnected changes. For instance, in updating Springfox Swagger from 2.0 to 3.0 (OpenAPI), both systems initially made similar changes. However, when faced with subsequent errors, their approaches diverged significantly. Consider this scenario: Initially, both systems removed Springfox dependencies:
<!-- Removed by both systems -->
<dependency>
    <groupId>io.springfox</groupId>
    <artifactId>springfox-swagger2</artifactId>
    <version>2.9.2</version>
</dependency>
Later, when encountering a “missing symbol: Docket” error, existing debugger attempted to reintroduce Springfox:
<!-- existing debugger trying to add back Springfox -->
<dependency>
    <groupId>io.springfox</groupId>
    <artifactId>springfox-boot-starter</artifactId>
    <version>3.0.0</version>
</dependency>
In contrast, our Agent recognized this as consistent with the previous removal and rewrote the file using SpringDoc OpenAPI:
import org.springdoc.core.GroupedOpenApi;

@Configuration
public class SwaggerConfig {
    @Bean
    public GroupedOpenApi publicApi() {
        return GroupedOpenApi.builder()
                .group("springshop-public")
                .pathsToMatch("/public/**")
                .build();
    }
}
These latest improvements in our debug AI have yielded positive results. By incorporating multi-error context analysis, additional tooling of multi-file solution, and inter-iteration memory, the agent now delivers more comprehensive and consistent codebase upgrades. We tested our new approach on 62 large open-source applications, some containing over 100,000 lines of code, incorporating more than 100 open-source libraries. The results showed an 85% higher success rate compared to the previous approach. These enhancements significantly boost both the quality and efficiency of code transformation, marking a substantial leap forward in automated application modernization for Java.
As we continue to innovate in code transformation use cases, this release creates the foundation to expand language support, further enhance AI-driven problem-solving algorithms, and streamlining the integration with development workflows. Our goal remains to provide developers and organizations with cutting-edge tools that simplify complex maintenance and modernization processes and foster the adoption of modern, cloud-native architectures. Stay tuned for future updates as we push the boundaries of AI-assisted code transformation.
In today’s cloud-driven world, maintaining compliance and enforcing organizational policies across your infrastructure is more critical than ever. AWS CloudFormation, a service that enables you to model, provision, and manage AWS and third-party resources through Infrastructure as Code (IaC), has been a cornerstone for automating cloud deployments. While CloudFormation simplifies resource management, ensuring compliance with internal and external standards requires robust tools and strategies to align with organizational and regulatory requirements.
Enter the new managed hook for Guard, a new hook designed to seamlessly integrate compliance into your AWS CloudFormation workflows. AWS CloudFormation Hooks are a powerful tool that allow you to validate and enforce policies during the provisioning and management of resources in your CloudFormation stacks. With a Guard hook, you can now bring your AWS CloudFormation Guard rules directly into your CloudFormation stacks, change sets, and individual resources. This feature eliminates the need to incorporate the Guard runtime into custom hooks, simplifying compliance enforcement and enhancing your security posture.
What is a Guard hook?
A Guard hook is a service-managed CloudFormation Hook that integrates AWS CloudFormation Guard—a policy-as-code tool—directly into your CloudFormation deployment process. AWS CloudFormation Guard uses a domain-specific language (DSL) to define compliance rules in an easily readable and reusable format, enabling you to codify and enforce organizational policies. This hook allows you to automatically validate your CloudFormation templates against these established compliance rules, enforcing policies seamlessly without the need to manage custom Lambda functions or Guard runtimes. By identifying non-compliant resources early, it helps streamline deployments and ensures that your infrastructure aligns with organizational standards right from the start.
Benefits of Using a Guard hook
Guard hooks provide unique advantages by combining the flexibility of CloudFormation Hooks with the expressiveness of the Guard Domain Specific Language (DSL), giving you a powerful tool for infrastructure compliance and security. As a fully managed CloudFormation hook, Guard hooks eliminate the need for a custom hook implementation and management, allowing you to leverage AWS’s service-driven infrastructure to streamline policy enforcement.With a Guard hook, you can express compliance rules and configurations directly in the Guard DSL.
Guard hooks specifically add value by enabling these Guard-based compliance policies to be applied automatically during stack operations. This helps validate that your infrastructure consistently aligns with security and compliance standards, reducing the risks of misconfiguration and non-compliance. Additionally, Guard hooks allow you to take advantage of CloudFormation’s native stack-level and resource-level hooks, adding depth to your compliance by enforcing policies across entire stacks and individual resources alike.
Use Cases
Guard hooks can be applied in various scenarios to enhance compliance and security. In security compliance, for instance, it can ensure that all databases and storage services have encryption enabled or prevent security groups from allowing unrestricted inbound traffic. Regarding resource configuration, it can enforce the use of approved EC2 instance types or require specific tags on all resources for cost tracking and management.
For operational governance, Guard hooks can validate that resources do not exceed predefined thresholds, such as storage size, ensuring that resources are provisioned within acceptable limits. It can also enforce network policies by ensuring the use of approved VPCs and subnets, maintaining network security and compliance with organizational standards.
A resource hook in CloudFormation targets individual resources within a template, such as EC2 instances, S3 buckets, or IAM roles. It is particularly useful for enforcing specific standards or compliance requirements on individual resources, thereby helping customers ensure each one meets defined criteria. For instance, you could use a resource-level hook to enforce that every S3 bucket created through CloudFormation has server-side encryption enabled. In contrast, a stack or change set hook targets the entire CloudFormation stack as a single entity, allowing for the application of guardrails or validation requirements across all resources within the stack collectively. This helps to ensure that the entire stack, not just individual resources, aligns with set policies before the stack is created or updated. For example, a stack-level hook could be used to prevent a stack from containing certain types of resources or to ensure that a specific number of resources are created in each stack. Together, these hooks provide different layers of validation to enforce compliance and configuration standards at both the resource and stack levels.
Getting Started
Getting started with a Guard hook involves configuring the hook, uploading your Guard rules to Amazon S3, activating the hook, and enabling it to run against your CloudFormation stacks. Below are the detailed steps to help you set up and start using Guard Hook effectively.
Pre-requisites Create an Amazon S3 Bucket
If you do not have one already, you will need to create an S3 bucket in your region. This bucket will hold your Guard policy files and optionally the full Guard evaluation output if so desired.
Configuring a Guard hook Create your rule
In this section, you will provide an example of AWS CloudFormation Guard rules that help enforce best practices for Amazon S3 buckets. Please create a file called safebucket.guard and include the following rules:
# Rule Identifier:
#    S3_BUCKET_PUBLIC_WRITE_PROHIBITED
#
# Select all S3 resources from the incoming template (payload)
#
let s3_buckets_public_write_prohibited = Resources.*[ Type == 'AWS::S3::Bucket' ]

rule S3_BUCKET_PUBLIC_WRITE_PROHIBITED when %s3_buckets_public_write_prohibited !empty {
  %s3_buckets_public_write_prohibited.Properties.PublicAccessBlockConfiguration exists
  %s3_buckets_public_write_prohibited.Properties.PublicAccessBlockConfiguration.BlockPublicAcls == true
  %s3_buckets_public_write_prohibited.Properties.PublicAccessBlockConfiguration.BlockPublicPolicy == true
  %s3_buckets_public_write_prohibited.Properties.PublicAccessBlockConfiguration.IgnorePublicAcls == true
  %s3_buckets_public_write_prohibited.Properties.PublicAccessBlockConfiguration.RestrictPublicBuckets == true
  <<
    Violation: S3 Bucket public write access must be restricted.
    Fix: Set the S3 Bucket PublicAccessBlockConfiguration properties—BlockPublicAcls, BlockPublicPolicy, IgnorePublicAcls, RestrictPublicBuckets—to true.
  >>
}

# Rule Identifier:
#    S3_BUCKET_VERSIONING_ENABLED
#
# Select all S3 resources from the incoming template (payload)
#
let s3_buckets_versioning_enabled = Resources.*[ Type == 'AWS::S3::Bucket' ]

rule S3_BUCKET_VERSIONING_ENABLED when %s3_buckets_versioning_enabled !empty {
  %s3_buckets_versioning_enabled.Properties.VersioningConfiguration exists
  %s3_buckets_versioning_enabled.Properties.VersioningConfiguration.Status == 'Enabled'
  <<
    Violation: S3 Bucket versioning must be enabled.
    Fix: Set the S3 Bucket property VersioningConfiguration.Status to 'Enabled'.
  >>
}
In this file, you can define rules to prevent public write access and require versioning on all S3 buckets. Here’s what the two rules in this example do:
S3_BUCKET_PUBLIC_WRITE_PROHIBITED:
This rule identifies S3 buckets within a CloudFormation template and checks if the public write access is restricted. It ensures that each S3 bucket has PublicAccessBlockConfiguration properties enabled to block public ACLs, block public policies, ignore public ACLs, and restrict public buckets. If a bucket does not meet these criteria, a violation message is triggered, instructing the user to set these properties to true.
S3_BUCKET_VERSIONING_ENABLED:
This rule targets S3 buckets and verifies that versioning is enabled. The rule checks if the VersioningConfiguration property exists and has its Status set to 'Enabled'. If this configuration is missing or set incorrectly, it alerts the user to enable versioning on the S3 bucket, providing an additional layer of data protection.
These rules help you maintain strict security and operational best practices by ensuring that S3 buckets are configured according to compliance requirements. Place these rules in safebucket.guard, and you’re ready to start applying them to your CloudFormation templates using Guard Hook to enforce policies without any manual intervention.
Upload your rules to S3
The Guard hook expects your policy files to be uploaded to an S3 bucket to then be pulled down during hook execution time. The hook expects your rules to be either a single .guard file, or multiple .guard files uploaded as a .zip or .tar.gz
Once you have uploaded your Guard rule or Guard rules bundle to S3, take note of the S3 URI of the uploaded object, as you will need this later to configure the Guard hook. Example: s3://your-bucket-name/safebucket.guard
You can also get the S3 URI by copy-pasting it from the console
Authoring the Hook
You can author and activate a Guard hook from the console, CLI, and using the AWS::CloudFormation::GuardHook CloudFormation resource.
Console
You can use the new console flow to define and activate your hook. Click on Create a Hook and choose With Guard.
You can type in your Guard rules S3 URI from the step before, or you can browse your S3 bucket using the console button.
You can configure the hook by performing the following steps:
In the Hook Name field, enter My::Company::GuardHook.
Under Hook Targets, select both Stacks and Resources. By selecting both Stacks and Resources under Hook Targets, you’re instructing CloudFormation to apply your hook validations at both levels. This ensures that individual resources and the overall stack comply with your defined policies, providing a comprehensive safeguard across deployments.
For Hook Mode, choose Fail.
In Execution Role, select New execution role and enter my-guard-hook-role for the name if you want CloudFormation to create the necessary role and permissions. Alternatively, an IAM role ARN you created manually (learn more here).
While we didn’t include a filter in this example, you can limit the executions of the hook to the intended resource types by using a filter. For more information about filters view our documentation page. You can skip to the next step if you do not have anything to filter.
Review the hook details and then click the Activate Hook button.
Note: You can create your own type-name-alias → MyCompany::Hooks::GuardHook is just an example
Using the CloudFormation resource
Using the AWS::CloudFormation::GuardHook resource in a CloudFormation template allows you to enforce compliance checks and validations on your AWS resources before creating, modifying, or deleting them within a stack. By specifying Guard rules using the Guard domain-specific language (DSL), you can define policies to assess resource configurations and security standards. When integrated into a CloudFormation template, AWS::CloudFormation::GuardHook evaluates the resources during stack operations and can either block non-compliant actions or provide warnings, depending on the configuration. This tool benefits organizations by automating governance, enhancing security, and reducing manual intervention, which help ensure that deployments adhere to best practices and compliance requirements consistently across environments.
Here is an example of how to create a Guard hook with the AWS::CloudFormation::GuardHook resource in a YAML file.
For more about AWS::CloudFormation::GuardHook , see our docs.
Testing your hook (non-compliant stack)
Now at this point, the Guard Hook should be running against all S3 buckets deployed via CloudFormation stacks in your account. We can confirm this by creating a new stack, from the CLI.
To do so, create a file named s3-fail.yaml and add the following content:
AWSTemplateFormatVersion: "2010-09-09"
Description: This template creates a simple s3 bucket

Resources:
  DemoBucket:
   Type: AWS::S3::Bucket
Create a stack, and specify your template in the AWS Command Line Interface (AWS CLI). In the following example, specify the stack name as my-fail-stack and the template name as s3-fail.yaml.
You can see the completed assessment and the result (how many rules compliant vs. not compliant as part of describe-stack-events. As the Hook Failure Mode is set to Fail, you can see the stack status: CREATE_FAILED due to Hook failure.
For more information about downloading S3 Object, see our docs.
Testing your hook (compliant stack)
To do so, create a file named s3-pass.yaml and add the following content:
AWSTemplateFormatVersion: "2010-09-09"
Description: This template creates a simple S3 bucket with versioning enabled and public write access disabled

Resources:
  DemoBucket:
   Type: AWS::S3::Bucket
   Properties:
      VersioningConfiguration:
        Status: Enabled
      PublicAccessBlockConfiguration:
        BlockPublicAcls: true
        IgnorePublicAcls: true
        BlockPublicPolicy: true
        RestrictPublicBuckets: true
Notice in the template, our bucket now does not allow public write access and enables versioning.
Create a stack, and specify your template in the AWS Command Line Interface (AWS CLI). In the following example, specify the stack name as my-pass-stack and the template name as s3-pass.yaml.
Guard hooks revolutionize the way you enforce compliance and security policies within your AWS infrastructure. By leveraging a service-managed hook, you can seamlessly integrate policy validation into your CloudFormation deployments without additional operational overhead.
Take advantage of Guard hooks today to:
Simplify compliance enforcement.
Enhance your security posture.
Streamline your deployment workflows.
Focus on innovation rather than infrastructure management.
Ready to enhance your cloud compliance and security? Start integrating Guard hooks into your CloudFormation templates and experience a new level of simplicity and efficiency in policy enforcement.
Today, Amazon Web Services (AWS) announced the launch and general availability of Amazon Q Developer plugins for Datadog and Wiz in the AWS Management Console. When chatting with Amazon Q in the console, customers can access a subset of information from Datadog and Wiz services using natural language. Ask questions like @datadog do I have any active alerts? or @wiz what are my top 3 security issues today? to swiftly identify and fix problems without leaving the console.
Engineers and IT professionals can struggle with tool sprawl throughout an application’s operational lifecycle. Amazon Q Developer’s third-party plugin system works towards creating a single pane of glass for all your SaaS solutions.
In this post, we’ll explore:
How Q Developer plugins work
How to use these plugins to:
Understand the state of your infrastructure
Query and brainstorm on present issues
Generate code and CLI commands to use third-party systems
How to get started
Our goal is for you to gain a comprehensive understanding of how the third-party plugins will improve your operational productivity.
How do Q Developer plugins work
Amazon Q in the console uses the prefix you provide to select which plugin to query. This provides additional context on your request and the state of your infrastructure. Key processes include:
Intent recognition: Amazon Q Developer interprets your chat request’s intent. It searches through relevant APIs it can invoke and selects the correct workflow to get more context.
API invocation: Amazon Q Developer then calls the appropriate third-party APIs to gather relevant information. Neither the AWS context included in the chat nor any information from your prompt is passed to the third-party.
Response Generation: After obtaining the enriched context and original prompt, Amazon Q Developer composes a complete prompt. Amazon Q uses this to generate the best response.
Guardrails: The system checks the response against Amazon Q Developer guardrails to ensure it follows best practices.
This system enables Amazon Q Developer to, understand intent, request additional information, and provide rich assistance across your infrastructure and application operations.
Let’s see how each of the third-party plugins can help in a set of real-world use-cases.
Amazon Q Developer plugin for Datadog
Datadog, an AWS Advanced Technology Partner and observability and security platform for cloud applications, provides AWS customers with unified, real-time observability and security across their entire technology stack. Datadog unifies all of your telemetry in one place, so teams can troubleshoot, optimize, and secure resources at scale. If you use Datadog to monitor your AWS infrastructure and applications, you can query a subset of information from Datadog without leaving the AWS console by prefixing your Amazon Q queries with @datadog.
Learn to use Datadog in your workloads
You can ask about how Datadog features work with certain AWS services, by asking questions like @datadog how do I use APM on my EC2 instance?
Retrieve and summarize cases and monitors
You can ask about specific cases, monitors, or specify properties of a case to get more information about it and include it in your conversation by asking questions like @datadog list my cases. With a follow up to quickly get a summary of your top cases, @datadog summarize my top cases
Check and list monitors in alarm
You can ask about specific application monitors as well, including which monitors are in alarm, Amazon Q Developer also allows follow-up questions about which alarmed monitors. You can start with a question like, @datadog list my current monitors
And then follow it up with a question like, @datadog List some of the resources that are triggering the alarm
Amazon Q Developer plugin for Wiz
With Wiz, organizations can democratize security across the development lifecycle, empowering them to build fast and securely. As an AWS Security Competency Partner, Wiz is committed to effectively reducing risk for AWS customers by seamlessly integrating into AWS services. If you use Wiz to monitor your AWS infrastructure and applications, then you can query Wiz without leaving the console by prefixing your queries with @wiz.
View issues with critical severity
You can ask Q Developer to retrieve the specifics of your issues in Wiz, the plugin can currently return up to 10 issues and you can focus on a specific severity with a question like, @wiz list the issues with critical severity With that response, we can also ask it to find the top issues, with a follow-up question like, @wiz can you specify the top 5?
Find your critical resources
Wiz defines the security posture of your AWS resources based on their configuration and how many critical issues that are associated with them. Amazon Q Developer can ask Wiz which are the least secure resources with a question like, @wiz what are the critical resources in my AWS environment?
List issues based on certain properties
Wiz tracks security issues that exist in your AWS account and you can ask Amazon Q Developer to list issues based on date, status, severity or type, with questions like, @wiz what issues are due next?
Assess issues with security vulnerabilities
Wiz tracks external vulnerabilities and exposures that can potentially pose a security threat associated with your current resources and issues. Amazon Q Developer can ask Wiz which are the pertinent vulnerabilities with a question like, @wiz what are my issues that have been created in the last 7 days?
Getting Started
To enable third-party Plugin capability in the Amazon Q Developer console:
To use third-party plugins, subscribe to Amazon Q Developer Pro Tier if you don’t already have it. This activates plugins at an organizational level.
If you don’t already have a Amazon Q Administrator Role/User, create one using either the AmazonQFullAccess / AmazonQDeveloperAccess managed policies, or follow the instructions in the Q Developer user guide for security and IAM permissions.
Configure the plugins – To activate the plugins, you must configure their credentials to authenticate into the third-party system. This is possible through a new tab called “Plugins” in the Amazon Q Developer dashboard. The plugins require credentials from the third parties to authenticate and call APIs specific to your accounts. They’re stored in your AWS account in Secrets Manager.
Datadog – Follow the instructions in the Datadog API documentation to create a Datadog API key and copy over the Site URL, API Key, and application key to authorize Q Developer with your instance of Datadog.
Wiz – Follow the instructions in the Wiz Service account documentation to create a client ID, the client secret generated by wiz, and then retrieve the Wiz API endpoint URL to connect Amazon Q Developer to Wiz.
Query the new plugins – With the @datadog and @wiz prefixes, you can ask a wide variety of questions and get operational assistance leveraging from third-party SaaS products. This allows you to integrate data from all sources with lower overhead and friction.
Iterate and refine – Try rephrasing or explicitly including more context about the request by mentioning dates or issue severity. Providing more relevant information helps Amazon Q Developer better understand your request.
For best results with third-party plugins, understand what you’re looking for and use terminology specfic to the third-party. Avoid overly broad queries to guide Amazon Q Developer effectively.
Conclusion
In this post, we introduced Amazon Q Developer’s third-party plugins in chat via the @datadog and @wiz prefixes highlighting the benefits of using plugins when trying to leverage generative AI across multiple services. By allowing Q Developer to understand and analyze the state of your infrastructure across services, third-party plugins unlock new boundaries for operational productivity gains.
We will be highlighting Projen’s powerful features that cater to various aspects of project management and development. We’ll examine how Projen enhances polyglot programming within Amazon Web Services (AWS) Cloud Development Kit constructs. We’ll also touch on its built-in support for common development tools and practices.
In our previous blog, we introduced you to the basics of getting started with Projen. Projen is a powerful project generator that simplifies the management of complex software configurations. In our prior blog, we discussed developing a new AWS cloud development kit (CDK) construct library project. For consistency, we will continue using this construct library project as our example while exploring linting, dependency management, and test coverage. It’s important to note that these practices are equally applicable to CDK applications and other project types.
AWS CDK Polyglot Construct Library
The AWS Cloud Development Kit (AWS CDK) is an open-source software development framework that allows developers to define cloud infrastructure using familiar programming languages. In a CDK application, constructs serve as the foundational elements, allowing developers to represent either a single AWS resource or a complex combination of resources. These constructs are not only reusable but can be incorporated into other AWS CDK projects, promoting efficient and scalable development practices.
Projen and Polyglot Programming
Projen leverages the power of the JSII library, enabling developers to write constructs once and generate equivalent constructs across multiple programming languages. This feature streamlines the development process, especially when working with teams that have expertise in different languages.
Automated Publishing with Projen
With its publisher module, Projen automates the distribution of c ructs to various package managers. This process can be integrated into a GitHub workflow, such as a build job, which triggers the publication of the library to the designated package managers.
Starting with Projen
Initiating an AWS CDK construct library project is straightforward through the Projen command npx projen new <project_type>. By executing the command npx projen new awscdk-construct, you initialize a new project complete with a projenrc file. This file contains the essential configuration for a CDK construct library, setting the stage for further customization and development.
import { awscdk } from 'projen';
const project = new awscdk.AwsCdkConstructLibrary({
  author: 'github username',
  authorAddress: 'github email',
  cdkVersion: '2.1.0',
  defaultReleaseBranch: 'main',
  jsiiVersion: '~5.0.0',
  name: 'cdkconstruct',
  projenrcTs: true,
  repositoryUrl: 'https://github.com/*****/cdkconstruct.git',

  // deps: [],                /* Runtime dependencies of this module. */
  // description: undefined,  /* The description is just a string that helps people understand the purpose of the package. */
  // devDeps: [],             /* Build dependencies for this module. */
  // packageName: undefined,  /* The "name" in package.json. */
});
project.synth();
A release.yml file is generated by projen under the github>workflow directory. This file has the details of the public registry where the construct needs to be published. By default, it will add the details for npm.
release_npm:
    name: Publish to npm
The construct can be developed in typescript under src/main.ts, our previous blog shows how to create one. If the construct needs to be published to other public registries (such as Maven for java, Pypi for python), then a projenrc file can be updated to synthesize a new release.yml file.
For example, to publish a construct developed in typescript to Maven (so that it can be used in a java application) add publishToMaven API to the projenrc file.
This way the construct is built once and published to multiple registries with different programming languages.
Figure 1: High-level Architecture showing publication to multiple public registries
Linting, Dependency Management & Test Coverage
Projen streamlines the setup process by generating a comprehensive package.json file. This file includes pre-configured dependencies for ESLint and Jest, enabling developers to maintain coding standards and ensure robust test coverage right from the start. ESLint, a widely adopted static code analysis utility, empowers developers to enforce consistent coding practices by analyzing the source code and identifying potential errors, bugs, and stylistic issues. Additionally, Jest equips developers with a comprehensive suite of tools for writing and executing unit tests, facilitating comprehensive test coverage for their codebase. While Projen provides Jest as the default testing framework, it offers developers the flexibility to incorporate alternative testing frameworks based on their project requirements.
Following with the awscdk-construct from the previous section, under test>main.test.ts a default test file is created, which can be updated for writing test cases. A default package.json is generated in the root directory.
Projen can be extensively configured. For example, if you need to configure webpack as a module bundler, then you need to add a webpack.config.js file and update the projenrc file project.
The other dependencies can be updated in package.json by adding deps in the projenrc.ts file.
Run npx projen build to synthesize a package.json.
Continuous Integration and Continuous Delivery (CI/CD)
When you create a project using Projen, it comes equipped with an automated build process that triggers upon the submission of a pull request. This is one of the key, “out-of-the-box” features that streamlines development workflows.
Projen orchestrates this process through GitHub Actions, utilizing a sequence of tasks predefined in the project’s base ‘Project’ class.
When a build is initiated, it systematically carries out several sub-tasks:
Synthesis: It starts by synthesizing all the project files, ensuring they are up-to-date and correctly configured.
Bundling: Next, it bundles the necessary assets for the project.
Compilation: The project’s code is then compiled.
Testing: Following compilation, Projen runs the suite of tests defined for the project.
Packaging: Finally, it packages everything together, preparing it for deployment or distribution.
Projen manages these steps by auto-generating a build.yml file, which it places within the workflow directory of your project’s structure. This YAML file contains all the instructions for the GitHub Actions to execute the build process.
For instance, when you run the command npx projen new awscdk-app-ts, Projen sets up a TypeScript application for AWS CDK. It automatically creates a ‘build.yml’ file through the default projenrc file, which can be found in the github/workflow folder of your project repository. This automated process is designed to save time and reduce manual errors, making it an essential feature for efficient project management.
 .github
   workflow
    build.yml
A Projen build is self-mutating because files generated by Projen are part of the source directory. To ensure that a pull request branch always represents the final state of the repository, you can enable the mutableBuild option in your project configuration (currently only supported for projects derived from NodeProject).
The build process can be customized by adding any task in the project class, which can execute a shell command.
const buildproject = project.addTask('build');
buildproject.exec('npm run build');
The Task also supports the condition option that determines if the condition is true before running the task.
const hello = project.addTask('hello', {
  condition: '[ -n "$CI" ]', // only execute if the CI environment variable is defined
  exec: 'echo running in a CI environment'
});
Releases and Versioning
Projen uses Conventional Commits to generate semantic versioning of the releases automatically. This means that based on the commit message format, it can create the release version automatically.
Initially, the project is released under version 0.0.0. Anything may change at any time and public APIs should not be considered stable. Commits marked as a breaking change will increase the minor version. All other commits will increase the patch version.
You need to manually promote the major version to 1 once your project is considered stable. For major versions 1 and above, if a release includes fix commits only, it will increase the patch version. If a release includes any feat commits, then the new version will be a minor version.
One of the nice, out-of-the-box features that comes with Projen for AWS CDK constructs is the creation of API documentation for your constructs. By leveraging jsii-docgen, Projen’s build step will generate API documentation (API.md) from the comments in your code.
This feature is powerful for several reasons. Firstly, it ensures that documentation is kept up-to-date with the codebase, as the API documentation is generated directly from the source code comments. This reduces the risk of discrepancies between the code and its documentation, which can lead to misunderstandings and errors in usage.
Secondly, it streamlines the development process by automating a task that is often tedious and time-consuming. Developers can focus more on writing code and less on updating documentation manually.
Thirdly, it promotes better coding practices, as developers are encouraged to write clear and detailed comments in their code. This not only benefits the generation of documentation, but also helps any new developers who may work on the codebase in the future to understand the code more quickly and thoroughly.
Moreover, having readily available and accurate documentation can significantly enhance the developer experience. It makes it more straightforward for users of the CDK constructs to understand the functionality, parameters, return types, and the structure of the code they are working with.
In the context of team collaboration and open-source projects, this feature is especially beneficial. It ensures that anyone who contributes to the codebase is able to generate and view the latest documentation without any additional setup or configuration, facilitating smoother collaboration and integration processes.
Let’s recap all of the features that Projen can introduce into your project right out of the box:
Projen’s automation for linting and testing to maintain high code quality from the beginning.
Automated API documentation feature to keep your project’s documentation synchronized with the latest code changes.
Polyglot capabilities to cater to a diverse development team, ensuring flexibility in language preference.
The publisher module to streamline the release process across multiple package managers, saving time and reducing the scope for human error.
As we wrap up our deep dive into some of the advanced features of Projen within AWS CDK, it’s clear that Projen helps alleviate a lot of the pain points of a new greenfield project. By leveraging Projen, developers can navigate the complexities of polyglot programming, automate the mundane tasks of publishing and documentation, and ensure consistent code quality through linting and testing. Projen elevates the development workflow to a level where efficiency and scalability are the norms, not the exception.
What’s more compelling is Projen’s commitment to developer empowerment. Through its automated systems, it encourages developers to adhere to best practices without the overhead of manual enforcement. Its ability to seamlessly integrate with various package managers and generate detailed API documentation from inline comments signifies a leap in developer tooling.
Contact an AWS Representative to know how we can help accelerate your business.
Earlier today, Amazon Q Developer announced support for inline chat. Inline chat combines the benefits of in-IDE chat with the ability to directly update code, allowing developers to describe issues or ideas directly in the code editor, and receive AI-generated responses that are seamlessly integrated into their codebase. In this post, I will introduce the new inline chat and discuss when to use this new capability to get the most value from Amazon Q Developer.
Background
I started using Q Developer (previously called Amazon CodeWhisperer) when it first launched in June 2022. This initial release included support for inline suggestions, which automatically generated code completions based on existing code and comments. Inline suggestions resulted in significant productivity gains.
Later that year, OpenAI released ChatGPT, and generative AI-powered chat became a hot topic. Personally, I found the chat experience more helpful when I was unsure how to accomplish a task. The chat interface not only generated code, but also provided explanatory context. I preferred to use inline suggestions when I knew what I was doing, and chat when I was learning something new. Therefore, I was thrilled when Amazon Q Developer added chat to the IDE in 2023, as I could use it to explain coding concepts, generate code and tests, and improve existing code. Having chat in the IDE helps me stay on task and in a state of focus and flow.
I have been using both inline suggestions and chat for the past year equally. While I love both options, I still felt there was room for improvement. For example, when fixing a bug, inline suggestions excel at generating new code, but do not easily allow me to update the existing code. Chat allows me to update existing code, but the response is provided in the chat window rather than being directly integrated into my code. This is where inline chat aims to improve the workflow.
Introducing inline chat
Today, we are excited to announce inline chat for Visual Studio Code (VS Code) and JetBrains. Inline chat allows me to provide additional context, such as a description of the bug I’m trying to fix, directly in the code editor. The AI-generated response is then seamlessly merged into my existing code, rather than requiring me to copy and paste from a separate chat window. I can easily review the suggested changes and accept, or decline, them with minimal effort. This new capability is ideal for editing an existing file to fix issues, optimize code, refactor code, add comments. And, it’s included in Amazon Q Developer’s expansive Free tier.
Inline chat is really powerful and helps me do more complex things quickly and accurately. There’s a lot that goes into building an assistant, but one important component is the underlying model, and inline chat is the first Amazon Q Developer capability powered by the latest version of Anthropic’s Claude 3.5 Sonnet, which launched on October 22nd. This new model “shows wide-ranging improvements on industry benchmarks, with particularly strong gains in agentic coding.” As I write this, upgraded Claude 3.5 Sonnet is the top performing model on the SWE-bench, solving 49% of the verified dataset which consists of 500 real-world GitHub issues. This demonstrates the impressive capabilities of the latest Anthropic model.
Amazon Q Developer is built on Amazon Bedrock, a fully managed service for building generative AI applications that offers a choice of high-performing foundation models (FMs) from Amazon and leading AI companies. Amazon Q uses multiple FMs, including FMs from Amazon, and routes tasks to the FM that is the best fit for the job. Amazon Q is constantly getting better, and we regularly change or refine the underlying models to improve performance and take advantage of the latest technologies, as we have latest version of Anthropic’s Claude 3.5 Sonnet launching just a week ago.
By powering the new inline chat capability with this cutting-edge Anthropic model, Amazon Q Developer is delivering an AI assistant that can help you save time, while tackling your most complex coding challenges with unparalleled capabilities. And with the seamless model updates handled behind the scenes, you can be confident that your experience will only continue to improve over time. Let’s take a moment to see how inline chat works.
Refactoring code
Let’s see the inline chat in action. Imagine that I have a class that displays messages on a web page. It started simple, but over time I have added a few variants to change the color, display warning messages, and display error messages. I don’t want to continue adding more and more variants, so I will ask Amazon Q Developer to refactor them. I select all four methods, and press ⌘ + I on Mac or Ctrl + I on Windows. Then, I prompt Q Developer to “refactor these into a single method with optional parameters for the color and message type.”
As you can see in the previous video, Amazon Q Developer refactored my code into a single method. Note that Q is showing me which lines it will add, in green, and which lines it will remove, in red. I’m happy with this recommendation, so I will hit return to accept it. Q Developer then merges the changes into my code.
While I could have done this in the chat pane, I would have to copy the response, and merge it to my code manually. Inline chat returns a diff so I can see exactly which portions will be added and removed. Alternatively, I could have used inline suggestions to generate a new method. However, I would have been left to clean up the old methods manually. The new inline chat feature excels at updating code in place.
Adding documentation
I’ll demonstrate another practical use of inline chat. Recently, I was working on a complex data processing algorithm that I had written some time ago. While the code functioned correctly, it lacked proper documentation. Recognizing that this could hinder future maintenance and comprehension by the team, I decided to add comprehensive documentation.
I selected the entire function and activated the inline chat using ⌘ + I on Mac (or Ctrl + I on Windows). In the chat interface, I entered the prompt “Add documentation including descriptive comments throughout the code.” Q Developer swiftly analyzed the code and generated appropriate documentation. The suggestions appeared with new text highlighted in green, indicating additions.
Amazon Q Developer created a detailed comment block at the beginning of the script, including parameter descriptions and return value information. It also added inline comments throughout, explaining complex logic and calculations. After a thorough review of the suggested documentation, I accepted the changes by hitting return or clicking on “Accept”. Q Developer then integrated the new documentation seamlessly into the existing code.
This feature proves particularly useful when dealing with legacy code or preparing for new team members to join a project. It helps maintain consistency in documentation style across the codebase and significantly reduces the time required compared to manual documentation. The resulting well-documented code is self-explanatory, which can streamline the development process. Inline chat has made it more efficient to keep codebases well-documented and maintainable.
Conclusion
With the introduction of inline chat, Amazon Q Developer has taken the next leap in AI-powered development, combining the best of both worlds – combining the benefits of in-IDE chat with the ability to directly update code. This new capability, powered by Anthropic’s latest Claude 3.5 Sonnet, empowers developers to tackle complex coding challenges efficiently. Whether it’s generating new features, refactoring existing code, or adding comprehensive documentation, inline chat streamlines the workflow, eliminating the need to switch between separate chat and editor windows. By continuously integrating the latest advancements in AI language models, Amazon Q Developer ensures that developers always have access to the most advanced and capable generative AI-powered assistant, handling the undifferentiated heavy lifting and allowing them to focus on what they do best – writing high-quality, innovative code.
You can try it out today by updating or installing your Amazon Q Developer extension on VS Code or JetBrains. This update will help you unleash your productivity right in your IDE.
It’s an established practice for development teams to build deployment pipelines, with services such as AWS CodePipeline, to increase the quality of application and infrastructure releases through reliable, repeatable and consistent automation.
Automating the deployment process helps build quality into our products by introducing continuous integration to build and test code, however enterprises may sometimes wish to implement certain conditions such as an approved deployment window to ensure more fine-grained control over pipeline executions.
AWS CodePipeline recently added stage-level conditions to implement pipeline gates. In this blog post, we will cover how you can implement stage-level conditions to improve your governance, code quality, and security by following a simple pipeline scenario detailed in the sections below.
AWS CodePipeline
AWS CodePipeline is a fully managed continuous delivery service that helps you automate your release pipelines for fast and reliable application and infrastructure updates.
Figure 1. AWS CodePipeline orchestration
CodePipeline has three core constructs:
Pipelines – A pipeline is a workflow construct that describes how software changes go through a release process. Each pipeline is made up of a series of stages.
Stages – A stage is a logical unit you can use to isolate an environment and to limit the number of concurrent changes in that environment. Each stage contains actions that are performed on the application artifacts.
Actions – An action is a set of operations performed on application code and configured so that the actions run in the pipeline at a specified point.
A pipeline execution is a set of changes released by a pipeline. Each pipeline execution is unique and has its own ID. An execution corresponds to a set of changes, such as a merged commit or a manual release of the latest commit.
You can now configure stage-level conditions to gate a pipeline execution before entering the stage, as well as when exiting a stage for both success and failure state. A condition consists of one or more rules, and a result (such as rolling back) to apply when the condition fails. Conditions are also referred to as gates because they allow you to specify when an execution will enter and run through a stage or exit the stage after running through it.
You can configure a stage-level condition from the console, API, CLI, AWS CloudFormation, or SDK. For the purposes of this blog post, we will showcase how you can configure the two gate scenarios using the console. You can see how you can create conditions using the CLI in the documentation.
Scenario
For this blog, we started with a four stage Pipeline based off the Amazon ECS deployment example from this tutorial. While this tutorial provides a getting started example on how to build a CI/CD pipeline for an ECS application, it lacks the quality gates we want to enforce to ensure what we deploy to production is safe and tested. For this we will turn to CodePipeline stage-level conditions to verify certain criteria is met throughout the pipeline execution.
In our environment, we started with a source repository in a Github organization and used AWS CodeConnections to connect the source stage to our pipeline. Inside our repository are files for a sample application, a Dockerfile to build our application, and a buildspec.yaml file to define the steps that will be executed in the build stage of our pipeline. We added a fourth stage to our pipeline which separated production deployments after a successful deployment to the staging environment. We released a change using this pipeline to ensure everything deployed as expected.
Figure 2: Example of a 4-Stage CodePipeline
Applying Stage Conditions
One of the primary concerns in any development process is maintaining high code quality standards. With stage-level conditions, you can now include specific checks to verify that your organization’s security and governance standards are met throughout the entire execution of your pipelines. These checks can include restricting deployments to certain days of the week, monitoring Amazon CloudWatch alarms prior to progressing, and verifying the results of security testing before promoting code as examples.
The AWS CodePipeline documentation details what conditions are available and how they can be used.
You can add conditions to stages on the pipelines detail page by choosing Edit and then selecting Edit stage from the relevant stage.
Figure 3: Adding a Stage Condition in the AWS console
In our pipeline, we added rules that address three scenarios:
Before we added this condition rule, we created a Lambda function in the same region that was responsible for getting the findings from an image scan that Amazon ECR executed. If a critical finding was detected in the image, the Lambda function will fail the condition. You can read more about utilizing Lambda with CodePipeline in the documentation. The LambdaInvoke rule is able to use input artifacts to implement additional logic in the function. Here we passed in the artifact created during the build stage which contains the ECR image name and tag. This pattern allows you to re-use Lambda functions as conditions across many pipelines.
After configuring the rule, we reviewed our stage configuration and saved the pipeline.
Figure 5: Adding a stage condition to the build stage
Scenario 2 – “On Failure” condition
Next, we configured a condition to fail and rollback a deployment in our staging environment. If you would like to read more about implementing rollback in your CodePipeline pipelines, you can refer to De-risk releases with AWS CodePipeline rollbacks. Oftentimes a deployment will appear successful, but regressions in the code, or bugs in a new feature, may surface only when users interact with the application. To mitigate this risk, we configured a CloudWatch alarm to alert when error rates exceeded 3% of overall traffic.
Figure 6: Amazon CloudWatch alarm definition
We then added an OnSuccess condition to the DeployToStage stage with a rollback rule that tracks the CloudWatch alarm configured for the above error rate metric. A wait time was configured in the rule to allow time for CloudWatch to detect any increase in errors related to the new deployment.
Figure 7: AWS CodePipeline condition rule using Amazon CloudWatch
Scenario 3 – “Entry” condition
Finally, we added a third condition as an entry condition to the DeployToProduction stage. We added an AWS DeploymentWindow rule provider with a cron expression to fail the condition if a deployment to production was executed outside of our defined window.
Figure 8: Cron rule for AWS CodePipeline stage conditions
Testing Stage Conditions
Testing Scenario 1
To test our CodePipeline with these stage-level conditions, we executed a git push to the source repository, which triggered a new pipeline execution. Our build stage successfully built a Docker image and pushed that image to the ECR repository, triggering the OnSuccess condition to check for critical vulnerabilities. The Lambda function reported that the scan exceeded our vulnerability threshold and stopped our pipeline with a reason of “Critical Findings Detected”
Figure 9: Amazon ECR scan condition failure
Navigating to the Amazon Elastic Container Registry service console, we were able to identify the critical vulnerability.
Figure 10: Amazon ECR vulnerability report
By reading the CVE we learned that the finding was related to a system package present in the source image defined in our Dockerfile. To remediate this issue, we added a new line to the Dockerfile in our source repository. The full Dockerfile is shown below for example with the change highlighted.
FROM public.ecr.aws/docker/library/python:3.12

WORKDIR /qchess
COPY . /qchess/
RUN apt-get remove --purge git git-man -y
RUN cd /qchess && pip install -r requirements.txt
RUN apt update && apt upgrade -y

CMD ["flask","run","--host=0.0.0.0","--port=80"]
With this change, we ensured that our image’s system packages would be upgraded on every build along with the version of the vulnerable package discovered by our condition check. We committed and pushed to our source repository to trigger a new pipeline execution.
Testing Scenario 2
During the next run, our Pipeline made it to the DeployToStage stage and successfully deployed our code changes to our staging environment. However, when the OnSuccess condition was executed, it detected that the error rate alarm had transitioned to alarm status, resulting in the stage condition to issue a rollback. We had a bug in our new feature!
Figure 11: CloudWatch Rule triggering a stage rollback
We reviewed the CloudWatch alarm and noticed the elevated error rates related to the deployment. The error rates returned to normal after the stage completed its rollback.
Figure 12: Amazon CloudWatch alarm details
After this rollback we reviewed our code changes and discovered a bug in the code. We made the appropriate changes and pushed to our main branch.
Testing Scenario 3
In the final pipeline execution, the pipeline made it past our DeployToStage condition and entered the entry condition in our DeployToProduction stage. This condition verified that the deployment was being executed within the defined deployment window and successfully deployed our change to production.
Figure 13: Deployment window allowed by stage condition rule
Clean up
If you followed along you should remove any resources you created related to this scenario. These resources include:
ECS Services
ECR Repository
CodeBuild Project
CodePipeline Pipeline
Lambda Function
CloudWatch Alarm
Associated IAM roles
Conclusion
Adding conditions to your AWS CodePipeline pipelines allows you to have fine-grained control over your pipeline. We have seen how you can safely automate deployments based on variables relevant to your organization. To learn more about CodePipeline conditions, visit How do stage conditions work.
To provide the best experiences, we use technologies like cookies to store and/or access device information. Consenting to these technologies will allow us to process data such as browsing behavior or unique IDs on this site. Not consenting or withdrawing consent, may adversely affect certain features and functions.
Functional
Always active
The technical storage or access is strictly necessary for the legitimate purpose of enabling the use of a specific service explicitly requested by the subscriber or user, or for the sole purpose of carrying out the transmission of a communication over an electronic communications network.
Preferences
The technical storage or access is necessary for the legitimate purpose of storing preferences that are not requested by the subscriber or user.
Statistics
The technical storage or access that is used exclusively for statistical purposes.The technical storage or access that is used exclusively for anonymous statistical purposes. Without a subpoena, voluntary compliance on the part of your Internet Service Provider, or additional records from a third party, information stored or retrieved for this purpose alone cannot usually be used to identify you.
Marketing
The technical storage or access is required to create user profiles to send advertising, or to track the user on a website or across several websites for similar marketing purposes.


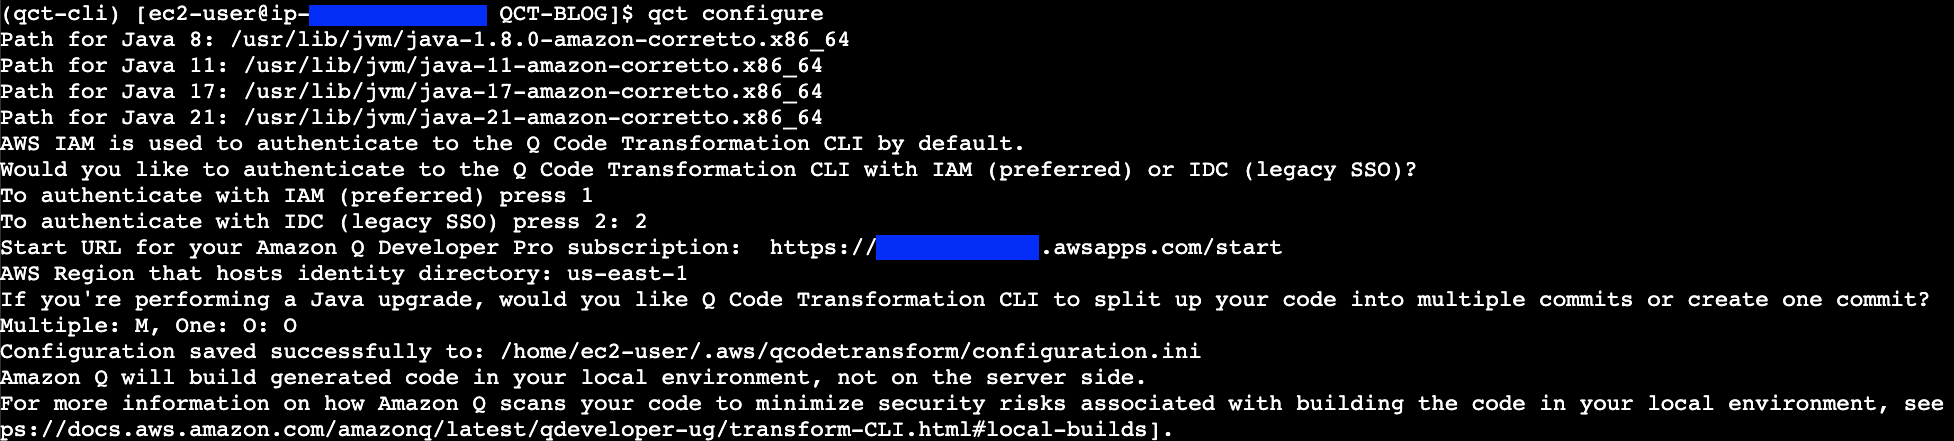


 Figure 4: CloudFormation troubleshooting with CloudTrail integration
 Figure 6: CloudFormation troubleshooting with Q feature

 Figure 9: IaC generator resource scan

 Figure 12: CloudFormation Hooks’ Lambda function feature
 Figure 14: CloudFormation Git sync with request review support feature


![] Response from Amazon Q for the breakdown of EC2 costs in the last month](https://d2908q01vomqb2.cloudfront.net/7719a1c782a1ba91c031a682a0a2f8658209adbf/2025/02/03/figure12.png)