What took the Internet offline in Q3 2026

Post Syndicated from Lai Yi Ohlsen original https://blog.cloudflare.com/q3-2026-internet-disruption-summary/

The Internet can feel invisible when everything is working normally. But when connectivity breaks, the many systems it depends upon become evident in an instant. Because Cloudflare’s global network handles more than 20% of the web’s traffic, it offers a unique perspective of how Internet traffic is behaving. When failures in infrastructure, power, policy, or security disrupt access to the Internet, Cloudflare Radar can observe the impact by monitoring traffic to our customers. Each quarter, we review the disruptions detected and annotated on Radar, highlighting what happened, where it happened, and the broader conditions that shaped each event.

In this post, we examine the major categories of Internet disruptions observed during the third quarter of 2026, including government-directed shutdowns, power outages and natural disasters.

Disruptions at a glance

Between July and September, Internet disruptions were largely driven by failures in the systems the Internet depends on. Power grids failed in Cuba, Honduras, Guam, Ukraine, and several other countries. Natural disasters damaged electricity and telecommunications infrastructure from Nepal to Colombia. Government-directed shutdowns remained the most frequent source of disruption, driven largely by exam-related shutdowns in Iraq, while renewed conflict in Ethiopia’s Tigray region showed how quickly connectivity can become part of a broader political and humanitarian crisis. Outages within the United States, Japan, and Portugal — countries with a relatively strong history of Internet resilience — remind us that no country is immune to disruption.

In total, Cloudflare Radar recorded 49 disruptions during the quarter. Government-directed shutdowns accounted for 19 incidents, including 18 exam shutdowns in Iraq. Power outages followed with 14 incidents, while natural disasters accounted for five.

Power failure was a leading cause of disruptions

The Internet is designed to be distributed and resilient, but that resilience still depends on electricity. When power fails, routers, mobile base stations, data centers, interconnection facilities, and the networks that connect them can fail with it. Over the past three months, that dependency was one of the clearest patterns in Radar’s disruption data. Power outages were the second-most common cause of disruptions by incident count this quarter, behind government-directed exam shutdowns.

In Cuba, Internet disruptions followed the erratic patterns of an unstable power grid. Radar observed four power-related outages across the quarter, meaning connectivity was affected by grid failures at least once a month. The outages took place July 6, July 14, August 3, and a three-day blackout from September 18 to 20. The traffic volume decreases ranged from 18% on July 14 to 59% on August 3.

Honduras illustrated how a localized infrastructure failure can produce national-level effects. A power failure on September 10 at an interconnection facility affected at least 11 major providers, showing how concentrated traffic exchange points can become single points of failure. The outage lasted approximately three hours, during which HTTP traffic across the country fell by 63%.

Two notable exceptions were the cross-border provider Telecomunicaciones de Guatemala (AS14754) and mobile carrier Celtel (AS52262), which were unaffected. This suggests that their Honduran connectivity may rely more heavily on infrastructure outside the country.

Cloudflare Radar – Traffic volume by autonomous system

On July 5, a power outage in Sevastopol, Ukraine, caused an eight-hour blackout, with HTTP traffic dropping by 98%. A little over a month later, on August 12, drone strikes targeting energy infrastructure caused another power outage, resulting in a ten-hour Internet disruption and up to a 95% decline in traffic volume. As discussed in more detail below, geopolitical conflict remains a major driver of Internet disruptions. These incidents also show how conflict, energy infrastructure, and Internet connectivity are fundamentally intertwined.

Cloudflare Radar – HTTP traffic

Cloudflare Radar – HTTP traffic

Also of note: on August 13, a cooling system failure at a data center in the U.S. city of Phoenix caused a near-total drop in Internet traffic from Namecheap (AS22612). Outages such as these will be important to watch as the role of cooling systems becomes increasingly critical.

Beyond the larger outages in Cuba, Honduras, and Ukraine, power-related disruptions also appeared across a wide range of countries, including Eswatini, Botswana, Tajikistan, Kenya, Saint Lucia, Georgia, and Gabon. Some of these events were caused by sudden failures, while others, such as planned load-shedding in Eswatini, reflected deliberate efforts to manage constrained power supply. Their scale and duration varied, but together they point to the same underlying dependency: when power systems become unstable, Internet connectivity often becomes unstable with them. In total, Radar observed 14 power-related disruptions across 10 countries during the quarter.

The physical world takes the virtual world offline

Last quarter, Radar reported on the impact of Super Typhoon Sinlaku, as it moved through the Mariana Islands, knocking out power and, in turn, Internet connectivity in Guam, where HTTP traffic took four days to return to typical levels.

Super Typhoon Bavi followed Sinlaku by less than three months, giving Guam two major storm-related connectivity disruptions in a single year. Officials appeared to take earlier preparedness steps ahead of Bavi, including declaring a state of emergency before peak storm conditions. Even so, the storm caused widespread power outages. The Guam Power Authority reported that strong winds brought down key transmission lines, leaving only about 25% of distribution feeders online at one point. From a connectivity perspective, the outcome was familiar: widespread power outages, downed transmission lines, and a multi-day recovery period for Internet traffic.

Cloudflare Radar – HTTP traffic

In Japan, an earthquake of similar magnitude, 7.1, prompted evacuation orders affecting roughly 150,000 people in Kumamoto. The impact on Internet connectivity primarily appeared in desktop traffic, while mobile traffic remained largely unaffected.

Cloudflare Radar – HTTP requests time series for Kumamoto, Japan

In Colombia, a magnitude 7.4 earthquake in August caused building collapses, injuries, mass evacuations, and a four-and-a-half-day Internet disruption. Damage to fiber-optic infrastructure, compounded by the wider earthquake aftermath, drove a significant drop in traffic from Colombia Telecomunicaciones (AS3816).

Cloudflare Radar – HTTP traffic

Finally, in Nepal, sudden flash floods swept through the Bhote Koshi and Trishuli river systems on August 26, affecting communities across Rasuwa, Nuwakot, and Dhading districts. The flooding damaged homes, infrastructure, and essential services, including power, which in turn disrupted regional Internet connectivity. The outage recorded on Radar lasted two hours, during which HTTP traffic dropped by up to 18%.

Cloudflare Radar – HTTP traffic

Exam shutdowns continue in Iraq

Government-directed shutdowns were the largest cause of disruptions in Q3, the majority of which occurred in Iraq with separate scheduled shutdowns occurring throughout the quarter. The shutdowns took place on a strict schedule 03:30–04:00 UTC, lasting about 15-90 min each. The majority occurred between August 26 and September 28, with three occurring between July 1 and 8.

Cloudflare Radar – HTTP traffic

Per Internet Society Pulse, “In a video message, Minister Mustafa Sanad, Iraq's Minister of Communication, confirmed the shutdown and vowed to develop a digital system that would eliminate the need for centralized exam distribution and, by extension, the need to shut down Internet access on exam days.” Cloudflare Radar will continue to monitor the country’s networks as the development of the new system progresses.

Notably, Syria and Sudan, two countries that have also frequently used exam-related Internet shutdowns in recent years, did not record similar disruptions this quarter. However, this likely reflects differences in exam calendars rather than a clear shift in policy. Radar will continue to monitor whether future national exam periods bring renewed shutdowns in either country.

Disruptions coincide with political events  

In Ethiopia, renewed conflict in the Tigray region was accompanied by a government-directed Internet shutdown that lasted 10 days. Traffic dropped by 100%, signaling a full-scale shutdown.

Cloudflare Radar – HTTP traffic

The disruption revived memories of the extensive blockade imposed during Ethiopia’s civil war from 2020 to 2022, when Tigray was largely cut off from telecommunications, electricity, banking services, fuel, and humanitarian aid (France24), which the World Health Organization described as a “de facto blockade.” Although this latest outage appears to have remained localized to Tigray, its impact was still visible in country-level traffic, with HTTP traffic falling by up to 30%.

Cloudflare Radar – HTTP traffic

On September 19, during nationwide elections, fiber-optic cable damage in Russia’s Far East caused regional connectivity disruptions affecting Chukotka, Magadan Oblast, Kamchatka Krai, and Sakhalin Oblast. Rostelecom described the incidents as deliberate damage to backbone fiber lines and said connectivity was restored using backup channels. Radar data alone cannot determine whether the cable damage was related to the elections, but the timing is notable.

Cloudflare Radar – HTTP traffic

Cloudflare Radar – HTTP traffic

Cloudflare Radar – HTTP traffic

A quarter shaped by shutdowns and power outages, but also resilience

Across Q3 2026, government-directed shutdowns were the most frequent source of disruption, driven largely by Iraq’s exam-related shutdowns. Power outages were close behind, affecting networks across Cuba, Honduras, Ukraine, Eswatini, Botswana, Tajikistan, Kenya, Saint Lucia, Georgia, and Gabon. Natural disasters and conflict added another layer of disruption, reminding us that Internet resilience depends on far more than routers and cables. It depends on electricity, physical infrastructure, policy decisions, and the ability of networks to route around failure.

Radar also observed outages inside individual networks, including One Communications (AS19863) in Guyana following a cable cut, MEO (AS3243) in Portugal following a reported “mass attack”, Digicel Haiti (AS27653), TurkNet (AS12735) in Turkey, and Fanap Telecom (AS206065) in Iran.

Each of these events demonstrates the Internet’s fragility, but also its resilience. Many disruptions were brief: 14 saw traffic return to typical levels in under an hour, and 16 recovered in less than three hours. But short outages can still have real consequences for the people affected, especially during storms, earthquakes, conflict, or political unrest. Access to the Internet is often access to information, coordination, safety, and help.

Cloudflare Radar will continue to monitor Internet disruptions around the world and share what we see from Cloudflare’s global network. Follow Cloudflare Radar on X @CloudflareRadar and Bluesky @radar.cloudflare.com for updates.

Hiding Capabilities in AI Models

Post Syndicated from Bruce Schneier original https://www.schneier.com/blog/archives/2026/10/hiding-capabilities-in-ai-models.html

Interesting research: “AI Models Can Provably Hide Arbitrary Capabilities”

Abstract: Capability evaluations aim to surface dangerous model behaviors before deployment, but their reliability depends on the assumption that hidden capabilities can be elicited. We show this assumption does not hold under adversarial conditions by constructing backdoor attacks that embed encrypted neural networks within host model weights, decrypting and executing them only upon receiving a secret trigger. Using digital lockers, these hidden circuits remain provably hard to elicit and interpret under cryptographic assumptions, even given full access to model weights, extending prior work from hiding fixed strings to arbitrary computations. We implement our proof of concept constructions in PyTorch and evaluate elicitation through fine-tuning, weight noising, gradient-based trigger search, and latent adversarial training, using a small chemical reaction prediction task as a proxy for CBRN-relevant capabilities. Our results demonstrate resistance to these methods and, together with our cryptographic guarantees, reveal a limit of elicitation-based capability audits. We release our models to support the improvement of defenses.

Cross-request KV cache exposure in the GLM-5.3 Workers AI model, and our remediation with SGLang

Post Syndicated from Kevin Flansburg original https://blog.cloudflare.com/kv-cache-exposure-remediation/

On September 8, 2026, we were alerted by a security researcher, Gadi Evron from Knostic, to a tenant isolation issue affecting the GLM-5.3 Workers AI model (@cf/zai-org/glm-5.3) starting on August 27, 2026. We have remediated the issue, and we restored the model on September 9. We have confirmed that no other model hosted on Workers AI was affected.

Between August 27 and September 9, a small number of customers using the GLM 5.3 Workers AI model received responses that contained data from other customers' requests made to the same model shortly before theirs. In total, 155 responses were affected, all to prompts longer than 681,280 tokens.

After excluding our own testing and the researcher's, the requests we identified are consistent in timing and volume with ordinary long-context use, not with someone repeatedly exploiting the bug. We found no evidence of deliberate exploitation.

Today we are publishing this report alongside a post from SGLang, the open-source inference engine that we use, as a coordinated disclosure. This post describes the bug that caused this issue, our response timeline, and the subsequent hardening we have conducted on our production SGLang deployments. We also detail our continued efforts with the upstream maintainers of SGLang to address this and similar bugs.

What happened

GLM is a text generation model from Z.ai that is built for agentic coding workflows; it is one of the many models available through Workers AI. Gadi Evron submitted a report on September 8 through our HackerOne program stating that very long prompts sent to @cf/zai-org/glm-5.3 on Workers AI sometimes returned text that belonged to other users' sessions. Cloudflare reproduced the issue the next morning and took the model offline within 40 minutes of declaring an incident. We then deployed a corrected configuration and a patched inference engine, and restored service the same day.  

This specific report of cross-request KV cache exposure was the result of two overlapping issues. The first was a misconfiguration of the open-source inference engine, SGLang, used by Cloudflare. We deployed GLM 5.3 with a 1,048,576-token context window, but the KV cache pool on our prefill GPUs only had room for 681,280 tokens. We were aware of this mismatch before launch. We expected the engine to return an error for any prompt it could not process, and our long-context tests returned successful responses, so we did not believe this to be an issue.

The second was a bug in how SGLang handled the resulting over-length requests in disaggregated prefill/decode mode. A prompt that did not fit the pool was internally marked as rejected and replaced with a one-token placeholder, but instead of aborting the request and returning a client error, prefill generated the KV cache for the placeholder prompt and transferred it to the decode node. The decode node received a "transfer complete" message and assumed that prefill overwrote the KV cache from previous requests with the full prompt for this request, when in fact it left the majority of the previous state intact. The decode node subsequently generated a response while attending over stale cache pages that still held data from earlier requests. As a result, responses to prompts longer than 681,280 tokens could contain data from other users' GLM 5.3 sessions.

Immediate remediation

After disabling the model, we took the following actions to correct this vulnerability before restoring public access to it:

To fix our configuration, we made the pool hold the full context. We adjusted our GLM 5.3 configuration to match our GLM 5.2 configuration, which freed enough GPU memory that the prefill KV pool now holds about 2.04 million tokens, roughly twice the 1,048,576-token context length. A prompt that fits the context window now always fits the pool, so the rejection path is never reached for a valid request. This alone prevents the bug from being exercised.

To fix the engine, we also made the rejection path safe. Relying on pool size alone is fragile: any change to quantization, tensor parallelism, CUDA graph sizes, or a future model version changes the pool size in a way that's easy to miss. Furthermore, there may be other situations in which the prefill scheduler can reject a request and trigger the same bug. To prevent this, we also patched the engine so that a request carrying a pending rejection is retired at the disaggregation admission queue, with its original error, before any bootstrap, allocation, or KV transfer happens. We proposed this upstream as #38704, which also had the decode node verify that the number of tokens transferred matches the number it reserved. The fix was already on SGLang main in #36988, merged September 6 for a related failure path but not yet released. The maintainers also merged #38935, which rejects these requests earlier, following our approach.

We validated both changes against the researcher's reproduction script and our own canary-marker tests before restoring the model.

Background: how we serve GLM 5.3

Workers AI runs GLM 5.3 with SGLang in a disaggregated configuration: a pool of prefill GPUs processes the prompt and produces the model's KV cache for it, then hands that cache over remote direct memory access (RDMA), via Mooncake, to a pool of decode GPUs that generate the response. We have written about this architecture before in our posts on high-performance LLMs and smaller, faster, safer models.

The KV cache in GPU memory is a shared pool of fixed-size pages. Each request is assigned pages when it is admitted and releases them when it finishes. Pages are not currently zeroed between requests; the next request that gets a page simply overwrites it. This approach is common among inference engines and is necessary to achieve the best performance, but it means that the inference engine is responsible for tracking ownership of these memory pages. KV cache page ownership and lifetime tracking has to deal with not just shared ownership within a node (KV cache offload and token generation both access the memory with different lifetimes), but also ownership that is technically shared with the remote prefill node (which holds a simultaneous mutable reference to the page).

Furthermore, the size of this pool is not a configuration value. SGLang sizes it at startup from whatever GPU memory remains after loading the model weights. The model's advertised context length is a separate configuration value. Nothing forces the two to agree, and it is our job to check that they do.

Issue one: misconfiguration

On our GLM 5.3 prefill nodes with our configuration, the pool came to 681,280 tokens while the model's context length is 1,048,576 tokens. The selected KV pool size is printed by SGLang in logs during startup and exposed as a metric. We were aware of this size mismatch; however, during pre-launch testing we observed successful HTTP status codes and a streaming body with no error frames during benchmarking. We assumed that the engine was capable of gracefully handling the difference between the KV cache pool and requested context window via streaming or some other mechanism.

This was one critical gap in our testing: we only validated HTTP response codes and engine performance at long contexts, without validating model output and coherence. We now check KV pool size against context length directly, from the running engine, before any disaggregated deployment change ships, rather than inferring it from response codes.

Issue two: SGLang bug

In v0.5.21, the SGLang team has now addressed this bug in how it was handling prompts longer than the KV pool size. Here’s what was happening before.

When a prompt arrived that was longer than the KV pool could hold, SGLang's scheduler rejected it. The rejection path (Req.set_finish_with_abort) recorded the error to be returned to the client and swapped the prompt for a one-token placeholder so that the request could drain through the normal batch machinery without allocating real memory. On a single-node deployment this worked: the placeholder ran, the batch finished, and the client received an error.

In disaggregated mode such as we operate, the admission queues on both prefill and decode checked whether a request was finished, not whether it was rejected. A rejected request reported itself as live. So:

  1. Bootstrap. The router told the decode node the prompt length (8 pages in the diagram). Decode reserved 8 KV pages for the request.
  2. Prefill admission. The prefill admission queue admitted any request where req.finished() was False. A rejected request stored its rejection in to_finish, not finished_reason, so finished() still returned False. The rejected request was admitted.
  3. Prefill forward pass. Rejection had already replaced the prompt with a one-token placeholder. Prefill ran a trivial forward pass on that one token.
  4. KV transfer. Prefill sent one page of KV to decode and signaled that the transfer was complete.
  5. Decode admission. Decode's admission queue had the same finished() check, so it accepted the handoff.
  6. Decode attention. Decode started generating and attention read all 8 reserved pages. Only page P0 had been written by this request. Pages P1 to P7 still held what earlier requests left in them: other users' prompts and partial generations.
  7. Response. The client got HTTP 200 instead of HTTP 400. prompt_tokens matched the long prompt and the reply was coherent. It arrived faster than an 8-page prefill should take, and it contained content from other users' KV pages.

Every request over the threshold behaved this way. This bug had been reported to SGLang by another user as issue #30233 on July 6, 2026, which Cloudflare noticed while investigating this incident. We had been flagging these types of issues with SGLang since v0.5.10 and this security incident sped up work that Cloudflare had already started in collaboration with the SGLang team. The patch for this issue was released in SGLang v0.5.20, with follow-ups in v0.5.21 and v0.5.22, and is available for all other operators dependent on SGLang to use. We highly recommend all operators update SGLang dependencies to v0.5.22 or later. For more details on specific PRs, read on below.

GLM 5.3 was the only model affected by this bug. Every other disaggregated deployment on Workers AI has KV pools larger than its context length on both prefill and decode, so no request could reach the rejection path. We have applied the engine fix and the hardening described below to every model we serve with SGLang, and our deployment checks require them for every new deployment.

Timeline

All times UTC.

When

What

Aug 27, 2026

GLM 5.3 launched on Workers AI with a prefill KV pool smaller than its context window. The exposure was present from launch.

Sep 8, 2026 – 23:11

Report received via HackerOne.

Sep 9, 2026 – 08:00

Cloudflare begins verifying the HackerOne report.

Sep 9, 2026 – 13:22

Security incident declared. Product Security reproduced the leak using two independent accounts within 25 minutes.

Sep 9, 2026 – 14:00

After confirming the scope of the issue, GLM 5.3 was set to private. Requests return HTTP 400. Status page updated.

Sep 9, 2026 – 14:35

Root cause identified as the prefill pool being smaller than the context length. Canary prefill node with a larger pool confirmed not susceptible.

Sep 9, 2026 – 14:52

All prefill nodes rolled to the corrected configuration.

Sep 9, 2026 – 19:04

Full deployment rebuilt with the corrected configuration plus a Cloudflare-authored engine patch that correctly returns errors for requests rejected by the prefill scheduler. Validated against the researcher's reproduction script.

Sep 9, 2026 – 19:40

Model restored to public.

Sep 10, 2026 – 23:30

Meeting with the SGLang maintainers (RadixArk CTO and core engineers) to agree on upstream fixes.

Sep 11-19, 2026

Additional hardening rolled to all production SGLang deployments (details below).

Sep 16-Oct 12, 2026

Upstream SGLang merges the admission fix, per-transfer checksums, abort-ACK preservation, and turns deferred KV release on by default.

Oct 2, 2026

SGLang v0.5.21 released.

Oct 19, 2026

SGLang v0.5.22 released.

Oct 26, 2026

Coordinated publication with the researcher and RadixArk.

Ongoing hardening effort

This bug belongs to a class of KV cache memory-safety bugs that Cloudflare has been working to address for several months. In each case, a page is freed, reused, or read while something else still has a claim on it. We see two common causes.

The first is page lifetime within a single node. Several tasks on a decode node can hold the same page at once: token generation, offload to host memory, the KV transfer receiver, and the abort and error paths. If one of them frees the page while another is still using it, a new request can be given that page while it is still being read or written. Our earlier fixes for decode offload (#24226, #30899) and double release on grammar errors (#30937) were of this kind.

The second is a race across nodes. When a request is aborted while prefill is still writing its KV cache to decode over RDMA, the writes already sent cannot be recalled. If decode frees those pages right away, those pages can be given to another request, and the late writes land in that request's KV cache. Cloudflare has contributed to the effort to fix this race through proposed fixes (#31357, #38961) and a reproduction script (#32564). In both cases the result is corrupted output, or one user's data in another user's response, with no error raised. The bug in this incident was different: a rejected request went through the handoff every time, rather than by a timing accident. But it had the same result: decode reading pages this request never wrote. None of these covered the failure in this incident in which prefill rejected the request, and decode never learned of it.

Since the incident, we have:

  • Extended deferred release to hold prefill's source pages as well, and to cover every failure type, not just aborts. We proposed it upstream as #38961, which was superseded by #40645, #41402, and #41404.
  • Deployed bounded Mooncake transfer batches (#32758, from the SGLang community), so no single transfer call can outlast the release timeout.
  • Changed our load balancer so a client disconnect no longer aborts a request mid-transfer. It holds the prefill connection until prefill finishes and the decode connection until the first token, then closes both.
  • Added a check to every disaggregated deployment change: KV pool size measured against context length, deferred release on both roles, transfer batch bounds inside the release timeout, and all required patches applied.

All of these changes were released to our disaggregated production deployments.

Working with the SGLang team

We met with the SGLang maintainers at RadixArk on September 10, the day after the incident. We agreed that RadixArk would investigate the race conditions we had reported, upstream the integrity-checking idea, and build reproduction tests for this class of bug.

The following have landed on SGLang main to address this incident and related KV cache race conditions, and all but one are included in v0.5.22. Operators running disaggregated SGLang should update to v0.5.22 or backport these patches as needed. 

Category

Pull request

Release

What it does

Incident

#36988

v0.5.20

Retires aborted prefill requests before their result reaches decode. This stops the exposure in this incident.

Incident

#38935

v0.5.21

Rejects these requests at admission, before any bootstrap, allocation, or KV transfer. Follows the approach in Cloudflare's draft patch, #38704.

Race

#39461, #41612

v0.5.21, v0.5.22

sgl-router cancels both halves of a request on client disconnect or prefill failure.

Race

#37454, #41023

v0.5.20, v0.5.21

Enables deferred KV release only on backends that support it, then turns it on by default.

Race

#40645, #41402

v0.5.21

Fixes cases where the drain confirmation was lost, so releases happen on confirmation instead of waiting out the timeout.

Race

#41404

v0.5.21

Holds pages on every transfer failure, not only decode-initiated aborts.

Race

#41618

v0.5.21

Fixes a regression in the abort notification path.

Race

#43719

v0.5.22

A failed Mooncake send no longer reports its writes as drained.

Race

#37077

v0.5.22

Tags abort messages per request so a reused ID cannot consume a stale confirmation. Adds MORI support.

Race

#36612

v0.5.20

Shares the prefill-to-decode failure notification across Mooncake, NIXL, and MORI.

Race

#32758

v0.5.20

Optional cap on Mooncake transfer batch size, so one timed-out call cannot leave an unbounded number of writes in flight.

Lifetime

#30899

v0.5.21

Decode waits for an in-progress offload to host memory before retracting a request and freeing its pages. Authored by Cloudflare.

Lifetime

#43562

v0.5.22

Keeps tensor-parallel ranks in agreement when a host-memory cache restore fails.

Observability

#39500

v0.5.21

Adds --disaggregation-enable-kv-checksum: decode verifies a checksum of the transferred KV before generating. Cleanup in #39729, merged and awaiting release.

Observability

#38596, #40642

v0.5.20, v0.5.21

Fixes for SGLang's KV canary, which detects and logs potential corruption.

Observability

#41128

v0.5.22

Metrics for deferred release: count, duration, and whether each hold ended on drain confirmation or timeout.

These follow-ups are still works in progress:

  • #39729 Additional cleanup for --disaggregation-enable-kv-checksum. Merged, awaiting release.
  • Zero KV pages on release, draft proposal: #46435
  • Extend KV checksum validation from the prefill-to-decode handoff to every decode step (see Integrity by construction, below)
  • Broader KV Canary and KV Checksum model and feature support

What we recommend to other operators

If you run SGLang in disaggregated prefill/decode mode, we recommend the following:

  1. Measure your KV pool and compare it to your context length, on every prefill and decode node, from the engine's startup log, after every change to weights, quantization, parallelism, or memory fraction. If the pool is smaller, lower the context length to fit. Do not rely on a proxy to enforce the limit, and do not assume the engine will reject what does not fit. This is the check we did not enforce.
  2. Upgrade to a build that includes #36988 and #38935 (v0.5.22 or later), so an over-length request is rejected before handoff regardless of pool size. This is the engine-side fix, and it is the backstop for the day your check in step one is wrong.
  3. Run with deferred KV release on both roles (default after #41023), and bound your Mooncake transfer batches so a single timed-out call cannot leave an unbounded tail of writes.
  4. Turn on corruption detection where your model supports it. --disaggregation-enable-kv-checksum and --kv-canary do not yet cover every model architecture. Check your logs to confirm requests are being verified. We are working with the SGLang team to extend both checks to more architectures, including GLM 5.3, GLM 5.3 Flash, and DeepSeek V4.
  5. Ensure your proxy is not generating unnecessary aborts. Configure your load balancer to allow requests to proceed up to the first token, so that you do not trigger an abort that requires cross-node coordination.

Longer term

Integrity by construction

Configuration checks and lifecycle fixes reduce the number of ways a page can be misused. They do not make misuse impossible, and this incident is a reminder that the next bug will have a shape we have not seen. The durable answer is for the engine to detect, at read time, that a request is about to attend over a page it does not own, and fail that one request rather than return someone else's data.

We built a prototype of this over the summer and described it in August. Every physical KV page carries a tag that changes when the page is reallocated, each request records the tags it expects, and the mapping is checked before decode reads the cache. In our tests it cost under 1% in throughput and tail latency. We tested it on GLM 5.2 in mid-August, but disabled it shortly afterwards due to reliability issues.

The prototype was also tied to specific attention backends and model architectures, so it could not be a general fix. We are working with the SGLang team to build a production version into the engine that works across every model, rather than maintaining Cloudflare-specific patches. The per-transfer checksum in #39500 is a first step: it validates the handoff from prefill to decode. Page-level tags go further, because they check every read, including reads long after the transfer.

Integrity by mathematical impossibility

RDMA copies data directly from one node’s memory to another’s. It’s vital for the two machines to agree on where the data goes, how large it is, and when it’s finished; any mismatch can cause the receiver to read the wrong data. This bug is an example of a consistency failure in a distributed system, in which the two machines had inconsistent views of the state of that system.

Elsewhere in Cloudflare, we have put effort into proving the safety of distributed systems using formal verification methods. Topaz enables conflict-free IP selection for our authoritative DNS servers. Models of Meerkat’s QuePaxa implementation have demonstrated consistency bugs that were subsequently fixed.

We are now directing our experience in formal methods to KV cache transfer engines. This will start with modeling and proving the safety of an RDMA-based KV cache transfer protocol. The goal is to model our production SGLang’s distributed KV cache system using Mooncake, then track and fix any divergence from the safety properties we want to guarantee. The aim is to prove — as far as possible — that a bug like this cannot occur again. Realistically, we expect gaps in what the provers can tell us, but proving the rest of the system allows us to more closely review and monitor those gaps.

Coordinated disclosure

We are publishing this report as part of a coordinated disclosure. We want to thank the researcher, Gadi Evron, who reported this through our HackerOne program with a clear, reproducible script and gave us time to fix it and to coordinate with the SGLang maintainers before publishing. We also want to thank the SGLang team at RadixArk, who treated this as their problem as well as ours and landed the upstream fixes with urgency.

Read more at the post from the SGLang team.

If you find a security issue in Workers AI, please report it at hackerone.com/cloudflare.

Migrate production SMS traffic to a short code with AWS End User Messaging

Post Syndicated from Harshvardhan Chunawala original https://aws.amazon.com/blogs/messaging-and-targeting/migrate-production-sms-traffic-to-a-short-code-with-aws-end-user-messaging/

Your new short code just went active, and you’re ready to migrate production SMS traffic to it from a toll-free number or 10-digit long code (10DLC) where you have collected two years of opt-outs. Those recipients still expect to stay opted out. Your STOP and HELP keywords, along with any custom keywords, must work on the new number from the first message. Carriers also treat the short code as a brand-new sender, with no record of the consent history attached to your old number. A misstep can result in messages blocked at the carrier level or, worse, messages delivered to recipients who believe they already unsubscribed.

This post walks through the operational mechanics of cutting over production SMS traffic to a short code using AWS End User Messaging SMS. It applies whether you’re migrating from a toll-free number, a 10DLC, or consolidating multiple originators into a single pool. It covers opt-out list migration, keyword handoff, carrier behavior while both originators are active, and validation steps to verify recipients are not disrupted.

Prerequisites

Before starting the migration, verify the following:

  • You send SMS through AWS End User Messaging SMS, using the SendTextMessage API in the pinpoint-sms-voice-v2 namespace.
  • Your new short code is in Active status in the AWS End User Messaging SMS console.
  • You have completed the short code registration and the carriers have approved it. Short code provisioning can take several weeks to months depending on carrier review, so plan accordingly.
  • You have AWS Identity and Access Management (IAM) permissions for the pinpoint-sms-voice-v2 API actions used in this post: DescribePhoneNumbers, DescribeOptedOutNumbers, CreateOptOutList, PutOptedOutNumber, UpdatePhoneNumber, UpdatePool, DescribeOptOutLists, DescribeKeywords, PutKeyword, CreateConfigurationSet, CreateEventDestination, CreatePool, AssociateOriginationIdentity, DisassociateOriginationIdentity, SendTextMessage, ReleasePhoneNumber, and DeleteOptOutList. The export and backfill scripts also need s3:PutObject and s3:GetObject on the Amazon Simple Storage Service (Amazon S3) bucket that holds the export, and creating the event destination requires iam:PassRole for the Amazon CloudWatch Logs role.
  • The AWS Command Line Interface (AWS CLI) version 2 and jq are installed. Both are available in AWS CloudShell.
  • The new short code is not yet associated with a pool. The UpdatePhoneNumber API returns an error if the phone number is already in a pool. Complete all per-number configuration (opt-out list, keywords, two-way messaging) before adding the short code to any pool.
  • If you use self-managed opt-outs, your application already handles STOP and HELP responses and logs opt-out state externally.

The migration surface area

Three data structures travel with an origination identity in AWS End User Messaging SMS, and all three must be accounted for during a migration:

Opt-out lists. Each origination identity is associated with one opt-out list containing phone numbers that have sent STOP (or an equivalent keyword) to that originator. When you provision a phone number, AWS End User Messaging SMS assigns it to the account’s Default opt-out list, so in many accounts every originator shares that single list. If you created custom opt-out lists to separate opt-outs by use case, you need to associate the new originator with the same list.

Keyword configurations. Keywords like STOP, HELP, UNSTOP, and any custom keywords you defined (for example, JOIN or PROMO) each carry an action (OPT_OUT, OPT_IN, or AUTOMATIC_RESPONSE) and a response message. These are configured per origination identity or per phone pool.

Two-way messaging configuration. If your application processes inbound messages through an Amazon Simple Notification Service (Amazon SNS) topic, the new originator must be wired to the same (or equivalent) topic before cutover.

Migrating opt-out lists

The opt-out list is the most critical piece of the migration. Sending a message to someone who previously opted out is a compliance violation in most jurisdictions, and US carriers impose fines for it.

Start by confirming which opt-out list your current originator and your new short code are associated with. The following command returns both in one call. The --phone-number-ids parameter takes the phone number ID or Amazon Resource Name (ARN), not the E.164 number. You can find the ID in the AWS End User Messaging SMS console or by running describe-phone-numbers without parameters.

aws pinpoint-sms-voice-v2 describe-phone-numbers \
    --phone-number-ids "old-number-id" "short-code-id" \
    --query "PhoneNumbers[].[PhoneNumber,NumberType,MessageType,OptOutListName]" \
    --output table

The result determines your migration path:

  • Both originators use the Default list. Opt-outs are already shared. A recipient who opted out on the old number is also blocked on the new short code, so no backfill is needed. Run the export in the next step to create a baseline for validation, then skip ahead to Replicating keyword configurations section.
  • The old originator uses a custom list. Associate the short code with the same list, or create a dedicated list and backfill it. Both options are described later in this section.
  • You want the short code on its own list. Create a dedicated list and backfill it from whichever list the old originator uses today.

If self-managed opt-outs are turned on for your old originator, AWS End User Messaging SMS doesn’t add STOP replies to the opt-out list automatically. In that case, your application’s opt-out records are the source of truth. Import them into the list associated with the short code before cutover.

Next, export every opted-out number from the opt-out list associated with your current origination identity. If you are using the Default opt-out list, invoke DescribeOptedOutNumbers with the opt-out list name set to Default. For custom opt-out lists, specify the list name you associated with your toll-free or 10DLC number.

aws pinpoint-sms-voice-v2 describe-opted-out-numbers \
    --opt-out-list-name "my-marketing-optout-list" \
    --max-results 100 \
    --output json > opted-out-numbers.json

If the response contains a NextToken, the list has more entries. Paginate until NextToken is no longer present. The following script automates the full export:

OPT_OUT_LIST="my-marketing-optout-list" # replace with your opt-out list name
S3_BUCKET="s3://amzn-s3-demo-sms-blog-example" # replace with your S3 bucket
NEXT_TOKEN=""
OUTPUT_FILE=$(mktemp)
export AWS_RETRY_MODE=adaptive # back off automatically when throttled
export AWS_MAX_ATTEMPTS=10

while true; do
    RESPONSE=$(aws pinpoint-sms-voice-v2 describe-opted-out-numbers \
        --opt-out-list-name "$OPT_OUT_LIST" \
        --max-results 100 \
        ${NEXT_TOKEN:+--next-token "$NEXT_TOKEN"} \
        --cli-read-timeout 120 \
        --output json)
    echo "$RESPONSE" | jq -c '.OptedOutNumbers[]' >> "$OUTPUT_FILE"
    NEXT_TOKEN=$(echo "$RESPONSE" | jq -r '.NextToken // empty')
    [ -z "$NEXT_TOKEN" ] && break
    sleep 1 # respect the 1 RPS rate limit
done

# Upload to S3 for durable storage
aws s3 cp "$OUTPUT_FILE" "${S3_BUCKET}/opted-out-numbers.jsonl"
rm "$OUTPUT_FILE"
echo "Exported to ${S3_BUCKET}/opted-out-numbers.jsonl"

The script writes to a temporary file and then uploads it to Amazon S3. This keeps the export durable regardless of where you run the command (a local workstation, an Amazon Elastic Compute Cloud (Amazon EC2) instance, or AWS CloudShell). You will reference this file during the backfill step.

The --cli-read-timeout flag raises the per-request read timeout above the 60-second default, which helps over slow connections, and adaptive retry mode keeps a long export running through brief throttling.

If your old originator uses a custom list, or you want the short code on its own list, choose one of the following approaches.

Sharing the same opt-out list

If your old and new originators serve the same use case and you want a single source of truth, associate the new short code with the same custom opt-out list your old number used. Use UpdatePhoneNumber to set the OptOutListName on the new short code:

aws pinpoint-sms-voice-v2 update-phone-number \
    --phone-number-id "short-code-id" \
    --opt-out-list-name "my-marketing-optout-list"

This approach means both originators honor the same opt-out entries during the transition period while you run them in parallel.

Important: The UpdatePhoneNumber API returns an error if the phone number is already associated with a pool. You must set the opt-out list on the short code before adding it to any pool. If the short code is already in a pool, use UpdatePool with the --opt-out-list-name parameter instead.

Creating a dedicated opt-out list and backfilling

If you want the new short code to have its own opt-out list (recommended when you plan to decommission the old number entirely), create a new list and import the exported numbers:

aws pinpoint-sms-voice-v2 create-opt-out-list \
    --opt-out-list-name "shortcode-marketing-optout"

Then import each opted-out number:

aws pinpoint-sms-voice-v2 put-opted-out-number \
    --opt-out-list-name "shortcode-marketing-optout" \
    --opted-out-number "+12065550123"

Production opt-out lists often hold 100,000 numbers or more, so plan the backfill as a batch job. PutOptedOutNumber has a default quota of 10 requests per second (RPS), and DescribeOptedOutNumbers, which the export uses, has a default of 1 RPS. At those defaults, exporting 100,000 numbers takes at least 17 minutes (1,000 pages of 100 results). Importing them takes at least 2 hours and 45 minutes, and longer in practice because each AWS CLI call adds startup time.

The following script reads the export from Amazon S3 and imports numbers in batches of 10. It runs each batch in parallel, waits for the batch to finish, and then sleeps for one second before starting the next one, which keeps the import at or below the default quota. Numbers that still fail after retries are written to a file so you can rerun them.

OPT_OUT_LIST="shortcode-marketing-optout" # replace with your new opt-out list name
S3_EXPORT="s3://amzn-s3-demo-sms-blog-example/opted-out-numbers.jsonl" # export file from the previous step
BATCH_SIZE=10 # default PutOptedOutNumber quota is 10 RPS
export AWS_RETRY_MODE=adaptive # back off automatically when throttled
export AWS_MAX_ATTEMPTS=10

aws s3 cp "$S3_EXPORT" - | jq -r '.OptedOutNumber' > numbers.txt
: > failed-numbers.txt
TOTAL=$(wc -l < numbers.txt | tr -d ' ')
COUNT=0

while read -r NUMBER; do
    aws pinpoint-sms-voice-v2 put-opted-out-number \
        --opt-out-list-name "$OPT_OUT_LIST" \
        --opted-out-number "$NUMBER" \
        < /dev/null > /dev/null 2>&1 \
        || echo "$NUMBER" >> failed-numbers.txt &
    COUNT=$((COUNT + 1))
    if [ $((COUNT % BATCH_SIZE)) -eq 0 ]; then
        wait # let the current batch finish
        sleep 1 # stay within the per-second quota
        echo "Imported $COUNT of $TOTAL"
    fi
done < numbers.txt
wait
echo "Done. $(wc -l < failed-numbers.txt | tr -d ' ') numbers failed. See failed-numbers.txt"

The AWS_RETRY_MODE and AWS_MAX_ATTEMPTS settings tell the AWS CLI to back off and retry when a request is throttled, instead of stopping at the first ThrottlingException. If you raise BATCH_SIZE after a quota increase, keep the one-second sleep so each batch stays within your approved rate. When the import finishes, rerun any numbers in failed-numbers.txt, then compare the count against your export as described in Validating the migration section.

If the backfill window is too long for your migration plan, request a higher rate for PutOptedOutNumber and DescribeOptedOutNumbers. Every action in the pinpoint-sms-voice-v2 API is eligible for a rate increase through the Service Quotas console or an AWS Support case, as described in Quotas for AWS End User Messaging SMS. AWS Support provides an initial response within 24 hours, so submit the request several days before your migration window.

After backfilling, associate the new list with the short code using UpdatePhoneNumber (before the short code is added to a pool).

One important nuance: Nothing outside your AWS opt-out list carries over to the short code. For US toll-free numbers, carriers also block STOP senders at the network level, but that block is tied to the specific toll-free number and does not transfer. Opt-outs recorded against a 10DLC campaign likewise stay with that campaign. From the carrier’s perspective the short code is a new sender, so the opt-out list associated with it, whether shared with your old number or backfilled from your export, is the only mechanism that honors prior opt-out requests.

Replicating keyword configurations

Keywords define how your originator responds to inbound messages. If a recipient texts HELP to your current toll-free number and receives a support message, the same behavior must exist on the new short code before any traffic shifts.

Export the keyword configuration from your existing originator:

aws pinpoint-sms-voice-v2 describe-keywords \
    --origination-identity "old-number-id"

For each keyword returned, replicate it on the new short code with the same action and response message:

aws pinpoint-sms-voice-v2 put-keyword \
    --origination-identity "short-code-id" \
    --keyword "STOP" \
    --keyword-message "You have been unsubscribed. No more messages will be sent. Reply START to re-subscribe." \
    --keyword-action "OPT_OUT"

Repeat for HELP, any OPT_IN keywords (like START or UNSTOP), and custom AUTOMATIC_RESPONSE keywords. Verify each one by invoking DescribeKeywords on the new originator and comparing the output against your source configuration.

If your existing originator also routes inbound messages to an Amazon SNS topic for two-way processing, configure the same on the new short code:

aws pinpoint-sms-voice-v2 update-phone-number \
    --phone-number-id "short-code-id" \
    --two-way-enabled \
    --two-way-channel-arn "arn:aws:sns:us-east-1:123456789012:sms-inbound-topic"

For self-managed opt-out configurations where your application handles STOP and HELP logic rather than the service, turn on that setting for the new originator as well. Two-way messaging must be turned on before you can turn on self-managed opt-outs:

aws pinpoint-sms-voice-v2 update-phone-number \
    --phone-number-id "short-code-id" \
    --self-managed-opt-outs-enabled

With self-managed opt-outs enabled, AWS End User Messaging SMS stops automatically processing STOP and HELP keywords. Your application receives these messages through the SNS topic and must handle opt-out logic, respond to the sender, and maintain compliance records.

Order of operations. UpdatePhoneNumber returns an error after a phone number is associated with a pool, and CreatePool copies the short code’s keywords, opt-out list, two-way settings, and self-managed opt-out setting into the new pool. Complete the per-number configuration on the short code in this order:

  1. Set the opt-out list (UpdatePhoneNumber --opt-out-list-name). Skip this step if both originators use the Default opt-out list.
  2. Replicate keywords (PutKeyword).
  3. Turn on two-way messaging (UpdatePhoneNumber --two-way-enabled).
  4. Turn on self-managed opt-outs, if you use them (UpdatePhoneNumber --self-managed-opt-outs-enabled). This step requires two-way messaging from step 3.
  5. Add the short code to a pool (CreatePool with the short code as the origination identity, or AssociateOriginationIdentity for an existing pool).

If you need to change a setting after step 5, use UpdatePool to change the pool-level configuration instead.

Carrier behavior during transitions

Carriers treat each originator type as an independent entity. This is the operational reality that makes originator migrations more complex than a configuration change.

Toll-free to short code. US carriers manage toll-free opt-outs at the carrier network level. When a recipient sends STOP to your toll-free number, the carrier blocks future messages from that specific toll-free number. This block does not carry over to your short code. From the carrier perspective, the short code is an entirely new sender. Your responsibility is to honor prior opt-outs through the short code’s opt-out list, either by sharing the list your toll-free number uses or by importing its entries, even though the carrier won’t enforce them automatically.

10DLC to short code. 10DLC numbers and short codes go through separate registration processes. Your 10DLC campaign is registered with The Campaign Registry (TCR). A US short code goes through its own brand vetting by the US Short Code Registry and approval by each carrier. Moving traffic to the short code doesn’t change your 10DLC campaign. The campaign stays active, and the old number stays associated with it, until you release the number and delete the campaign as described in Cleaning up section. Opt-outs recorded against your 10DLC campaign also don’t carry over to the short code. The opt-out list associated with your short code, whether shared with your old number or backfilled from your export, is the authoritative source of truth.

Behavior while both originators are active. During the transition window when both your old and new originators are sending to the same recipient pool, a recipient might receive messages from both numbers in the same day. As a general practice, avoid sending identical content from both originators to the same recipient, because carriers might interpret this as duplicate messaging.

Grace period considerations. There is no industry-standard grace period for originator transitions. After you stop sending from the old originator, recipients can no longer text STOP to it (since the number will eventually be decommissioned or reassigned). This creates a gap: a recipient who wants to opt out during the transition might not know which number to text. The mitigation is to communicate the number change proactively. Send a one-time notification from the old originator informing recipients that future messages will come from the new short code, and include opt-out instructions for the new number.

Configuring delivery event monitoring

Before any production traffic reaches the short code, set up a configuration set with an event destination so you can compare delivery results between your old and new originators. AWS End User Messaging SMS sends basic events to Amazon EventBridge by default, but those events omit the recipient phone number and identify the sender by phone number ID, which makes side-by-side comparison and alarming difficult. A configuration set with an event destination streams full event records to Amazon CloudWatch Logs, Amazon Data Firehose, or Amazon SNS.

If you already send with a configuration set that has an event destination, keep using it for both originators and skip to the query later in this section. Otherwise, create a configuration set and a CloudWatch Logs event destination. The event destination requires an existing log group and an IAM role that allows AWS End User Messaging SMS to write to it, as described in Set up an Amazon CloudWatch event destination.

aws pinpoint-sms-voice-v2 create-configuration-set \
    --configuration-set-name "shortcode-migration"

aws pinpoint-sms-voice-v2 create-event-destination \
    --configuration-set-name "shortcode-migration" \
    --event-destination-name "migration-delivery-logs" \
    --matching-event-types TEXT_ALL \
    --cloud-watch-logs-destination IamRoleArn=arn:aws:iam::123456789012:role/SMSEventsToCloudWatch,LogGroupArn=arn:aws:logs:us-east-1:123456789012:log-group:/aws/sms/shortcode-migration

Configuration sets apply per message, not per originator. Pass --configuration-set-name on every SendTextMessage request during the transition, whether the request goes to the old number, the short code, or a pool that contains both. Messages sent without it don’t reach the event destination.

Each event record includes an originationPhoneNumber field, so a single configuration set covers both originators. To compare them, run the following query in CloudWatch Logs Insights against your log group:

fields originationPhoneNumber, eventType
| stats count(*) as events by originationPhoneNumber, eventType
| sort originationPhoneNumber asc

Run the query once before cutover to record a baseline for the old originator, then again throughout the transition window.

Cutover strategy

A hard cutover (switching 100% of traffic instantly) introduces risk you can avoid. Two approaches work well for phased migrations.

Pool-based routing. Create a phone pool containing both your old originator and the new short code. When you send through a pool, AWS End User Messaging SMS selects an originator from the pool. Start with a 48- to 72-hour validation window where both originators serve traffic. Monitor delivery events in the log group you configured in Configuring delivery event monitoring section, comparing delivery rates and carrier failure events per originator, and track new opt-outs in your opt-out list. After the short code’s delivery success rate is consistent with the old number’s rate, begin the final cutover by removing the old originator from the pool.

When creating the pool, understand that the pool inherits its configuration (keywords, message type, opt-out list, two-way settings, and self-managed opt-out configuration) from the origination identity you specify in the CreatePool request. Deletion protection isn’t inherited and defaults to false regardless of the source originator’s setting. Because this pool carries production traffic, turn on deletion protection explicitly when you create the pool, or later with UpdatePool. If you want the short code’s configuration to be the pool default, use it as the origination identity when creating the pool, then associate the old number afterward using AssociateOriginationIdentity.

aws pinpoint-sms-voice-v2 create-pool \
    --origination-identity "short-code-id" \
    --iso-country-code "US" \
    --message-type "TRANSACTIONAL" \
    --deletion-protection-enabled

Set --message-type to the message type of your short code.

Three constraints apply:

  1. Configuration match required. Every phone number you add to a pool must have the same configuration as the first number specified when the pool was created, and AssociateOriginationIdentity returns an error if it doesn’t. For example, if the pool was created with a number that has two-way messaging enabled, the other number must also have two-way messaging enabled before you can add it to the pool. The same applies to opt-out lists: both numbers must use the same list. If you created a dedicated opt-out list for the short code, either use application-layer routing during the parallel run, or keep both numbers on the shared list while they are in the pool and switch the pool to the dedicated list with UpdatePool after you remove the old number.
  2. Matching message type. The pool’s message type (TRANSACTIONAL or PROMOTIONAL) comes from the number you create it with and can’t be changed after the pool is created. You can’t add a TRANSACTIONAL number to a pool created from a PROMOTIONAL number, or the reverse. A phone number’s message type is set when you request the number, and UpdatePhoneNumber doesn’t change it. If your old number and short code have different message types, use application-layer routing instead.
  3. One pool per phone number. A phone number can only be associated with one pool at a time. If your old originator is already in a different pool, you must disassociate it first using DisassociateOriginationIdentity.

Application-layer routing. If pool-based routing does not fit your architecture (for example, if you need deterministic control over which recipients see which originator), implement the split at the application layer. Route a percentage of recipients to the new short code using a feature flag or weighted distribution. Increase the percentage gradually over several days as delivery metrics hold. This gives you granular control, and you can roll back instantly by setting the weight back to zero.

Rollback. If delivery rates on the short code drop significantly below the old originator’s baseline, or you observe a spike in TEXT_CARRIER_UNREACHABLE events, revert immediately. For pool-based routing, remove the short code from the pool. For application-layer routing, set the short code weight to zero. Investigate the root cause before resuming.

Timing. Plan the cutover during business hours on a weekday when your team and carrier support are available, in case issues arise that require investigation.

Whichever approach you choose, send the recipient transition notification from the old originator before beginning the cutover. In this message, tell recipients that future messages will arrive from the new short code number, and remind them they can reply STOP at any time.

Validating the migration

Before decommissioning the old originator, verify four things.

Opt-out list completeness. Compare the count of entries in the new opt-out list against your exported baseline. Paginate through DescribeOptedOutNumbers for both the original export and the new list, and compare the totals. If you backfilled a dedicated list, the numbers should match exactly. If you shared a list between both originators, verify that new opt-outs received during the transition period are being recorded.

Keyword responses. Send test messages containing each keyword (STOP, HELP, custom keywords) to the new short code from a test handset. Verify that the response messages match your expected content and that the opt-out or opt-in actions fire correctly in your opt-out list.

Inbound message routing. Send a non-keyword message to the new short code and verify it arrives at your SNS topic and is processed by your application. This validates the two-way messaging path end to end.

Delivery metrics. Compare delivery success rates on the new short code against the old originator over your transition window. Use the event destination configured on your configuration set to track per-originator delivery events in Amazon CloudWatch. Watch for elevated failure rates that might indicate a carrier-side issue with the short code registration that needs resolution before you complete the cutover.

Cleaning up

After the migration is validated and the old originator is no longer receiving traffic:

  • Remove the old origination identity from any phone pools using DisassociateOriginationIdentity.
  • If the old number was a toll-free or 10DLC you no longer need, release it through the AWS End User Messaging SMS console or by using the ReleasePhoneNumber API to stop incurring monthly lease charges. Releasing a number is permanent and removes your rollback path, so wait until the short code has carried production traffic through your validation window.
  • If you moved off a 10DLC number, delete the 10DLC campaign after every number associated with it is released. The campaign’s recurring registration fee continues until you delete it. You can delete the campaign under Registrations in the AWS End User Messaging SMS console, as described in Delete a registration. Deleted campaigns can’t be restored. If other 10DLC numbers still send under the campaign, keep it.
  • If the old originator used a custom opt-out list that no other originator or pool references, delete it with DeleteOptOutList. Keep the Default opt-out list, which every account requires.
  • Update any IAM policies, alarm configurations, or configuration sets that referenced the old originator’s ARN.

Conclusion

In this post, we showed how to migrate production SMS traffic from a toll-free number or 10DLC to a short code using AWS End User Messaging SMS. The critical areas are opt-out list portability, keyword configuration replication, carrier-level opt-out isolation between originator types, and a phased cutover with rollback readiness.

Carriers treat your short code as a brand-new sender, so carrier-level STOP blocks on a toll-free number and opt-outs recorded against a 10DLC campaign stay with the old number. The opt-out list associated with your short code is the only record that protects recipients who already unsubscribed. By confirming which opt-out list each originator uses, migrating consent records where needed, validating behavior on the new originator, and monitoring delivery metrics against a defined baseline before completing the cutover, you reduce the risk of compliance violations and delivery disruptions.

To begin, run the opt-out list check in Migrating opt-out lists section against your current originator and your short code, and set up the configuration set described in “Configuring delivery event monitoring” so you have a baseline before cutover. If your short code is still being provisioned, see Getting your SMS short code production-ready with AWS End User Messaging. For consent requirements and registration planning, see A Guide to SMS Short Codes with AWS End User Messaging. If you send from multiple AWS accounts and want them to share the short code, a pool, or an opt-out list, see A Complete Guide to Resource Sharing for AWS End User Messaging. For the full API reference, see the AWS End User Messaging SMS and Voice v2 API documentation, or visit the AWS End User Messaging SMS detail page.


About the authors

Harshvardhan Chunawala

Harshvardhan Chunawala

Harshvardhan Chunawala is an AWS Golden Jacket awardee, a Solutions Architect at AWS, and an AWS Academy Authorized Educator. A globally recognized thought leader in cloud security with over a decade of experience, he leads cross-functional efforts across Amazon teams to shape frontier capabilities in cloud security, aerospace and trustworthy AI services. Harshvardhan is an advisory board member, Visiting Faculty, and cybersecurity researcher at Carnegie Mellon University, where he served as Space Mission Engineering Lead for the United States’ first lunar mission since Apollo 17 under NASA’s CLPS program. He is a former lead research fellow at Stanford’s SLAC National Accelerator Laboratory for U.S. Department of Energy projects in secure distributed computing and smart electric grids. Away from the keyboard, Harshvardhan pursues his love of the skies through skydiving and flying planes.

Zip Zieper

Zip Zieper

Zip is a Senior Worldwide Specialist Solutions Architect at AWS focused on messaging and communications services. He helps customers design compliant, high-throughput SMS architectures across industries.

Brett Ezell

Brett Ezell

Brett is a Solutions Architect for AWS End User Messaging and Amazon Simple Email Service. Outside of work, Brett spends his time collecting vinyl, comic books, catching live shows, and training at the gym.

ASRock Creator Radeon AI Pro R9700 Review: Workstation Inference, AMD Style

Post Syndicated from Ryan Smith original https://www.servethehome.com/asrock-creator-radeon-ai-pro-r9700-review-workstation-inference-amd-style/

Today we are taking a look at ASRock’s high-end Radeon AI inference card for workstations, the Creator Radeon AI Pro R9700. With 32GB of RAM and a $1700 price tag, the card is a highly affordable way to fill out a workstation for local AI inference

The post ASRock Creator Radeon AI Pro R9700 Review: Workstation Inference, AMD Style appeared first on ServeTheHome.

Data governance with annotations in Amazon S3

Post Syndicated from Aditya Jain original https://aws.amazon.com/blogs/architecture/data-governance-with-annotations-in-amazon-s3/

If you run data governance in Amazon Simple Storage Service (Amazon S3), the context that matters most probably lives somewhere other than S3. Think of how an object is classified, which retention policy applies to it, where the data may reside, and whether it holds personally identifiable information (PII). You typically keep that context in a separate database, one system away from the objects it describes.

Amazon S3 annotations closes that gap. You can attach the governance context directly to the S3 object, without rewriting the object. A single object version can carry up to 1,000 annotations. Each one is a UTF-8 payload between 1 byte and 1 MB, in a format such as JSON, XML, YAML, or plain text. That’s room for a complete governance record rather than a few key-value pairs.

Annotations give you five properties that are hard to get from a separate metadata store:

  • Context that travels with the data – S3 stores annotations with the object version rather than in a separate system. When you copy or replicate an object, S3 moves the annotations with it, so a classification or residency label accompanies a disaster-recovery copy.
  • Context you can revise in place – Updating an annotation doesn’t rewrite the object or change its ETag, so a record’s classification can be corrected, or a generated label promoted from proposed to reviewed, as the context is validated.
  • Governance answers without reading the data – A consumer with read-only annotation access can answer a question such as “which objects hold PII and have an expired retention policy” per object through the annotation APIs, or across the bucket through an S3 Metadata annotation table.
  • Context stays readable in any storage class – Even when an object is archived in a cold storage class, its annotations stay directly readable. You can retrieve the governance context for an object in Amazon S3 Glacier Flexible Retrieval or S3 Glacier Deep Archive without restoring the object first. You pay S3 Standard rates for annotations regardless of the parent object’s storage class.
  • SQL at scale – An S3 Metadata annotation table, which is an Apache Iceberg table, makes the same context queryable with Amazon Athena or any Iceberg-compatible engine across a large object population.

This post walks through the pattern end to end, then the handful of S3 behaviors that determine whether the design is correct. Each behavior comes with the documented rule and a working example: an annotation payload, an AWS Identity and Access Management (IAM) policy statement, or an AWS Command Line Interface (AWS CLI) call.

Prerequisites

To follow along and adapt the examples, you need the following:

  • An AWS account with an S3 bucket that has versioning enabled.
  • An AWS Identity and Access Management (IAM) principal with permission to configure bucket policies and annotation actions.
  • The AWS CLI installed and configured.

Familiarity with S3 annotations concepts, object versioning, and IAM identity-based policies is assumed.

The governance record

Consider a governed bucket where each object is a business record such as a contract, policy document, or customer record. You build an enrichment pipeline that reads each new object and records a governance annotation. That annotation captures the classification, the applicable retention policy, the jurisdiction and data residency, a PII inventory, and a short rationale. Annotations aren’t limited to governance context. The same mechanism can attach other object context, such as a short content summary or a processing date. In this pattern, the annotation is written after the upload completes, through the annotation API operations. The same process backfills objects that predate the pipeline, through the separate path shown in the architecture section.

A PutObjectAnnotation call writes exactly one uniquely named annotation on a given object version, and an object version can hold up to 1,000 annotations. How you distribute a governance record across them is a design choice. With granular annotations, you can update one aspect of the context without rewriting the rest, keep an accidental overwrite scoped to a single field, and query finer-grained units in an S3 Metadata annotation table, which you optionally enable for richer queryability. A single annotation that holds the whole record keeps each write and each read to one operation, and keeps the record internally consistent. There’s no partial state across several names to reconcile. This post uses one annotation, named governance-context, because the record here is authored and consumed as a unit.

The payload looks like the following.

{
  "schema_version": "1.0",
  "classification": "confidential",
  "retention": {
    "policy": "contracts-7y",
    "effective_date": "2026-06-01",
    "expires_on": "2033-06-01",
    "status": "active"
  },
  "jurisdiction": "EU",
  "data_residency": "eu-west-1",
  "pii": {
    "present": true,
    "categories": ["name", "email", "national_id"]
  },
  "rationale": "Signed customer contract containing personal data of EU data subjects; classified confidential under the 7-year contracts retention policy.",
  "generated_by": "enrichment-process",
  "generated_at": "2026-06-29T10:15:00Z",
  "review_required": true
}

When a record is reviewed or reclassified, the enrichment process updates the annotation in place with PutObjectAnnotation. The classification changes without rewriting the object or changing its ETag. That in-place update is itself replicated, so a later re-classification on the source keeps a cross-Region copy’s context current without recopying the object. This works as long as the replication role carries the annotation-replication permission described later in this post.

Objects that predate the pipeline need the same context. A backfill pass annotates existing object versions in bulk with the same PutObjectAnnotation call, so the write path covers new objects as they arrive while the backfill path brings the existing population up to the same standard. Both paths appear in the architecture that follows.

On the read side, a consumer with read-only annotation access answers the governance question by listing and retrieving annotation context. There are no object reads and no separate governance database.

At scale, you activate an S3 Metadata annotation table with a bucket metadata configuration that names an IAM role S3 assumes to read your annotations. S3 then provisions and maintains a table in Amazon S3 Tables, a capability of Amazon S3, backed by Apache Iceberg, that you query with SQL. The role trusts the metadata.s3.amazonaws.com service principal. That turns the same question into one Athena statement across a large object population. S3 populates the table asynchronously, and the initial backfill can take minutes to hours depending on how many objects and annotations the bucket holds. Query results reflect annotations as of the most recent table refresh, which typically happens within about an hour, so treat them as eventually consistent rather than real time.

SELECT object_key, object_version_id
FROM "s3tablescatalog/aws-s3"."b_amzn_s3_demo_governance"."annotation"
WHERE name = 'governance-context'
AND json_extract_scalar(text_value, '$.pii.present') = 'true'
AND json_extract_scalar(text_value, '$.retention.status') = 'expired';

Reference architecture for the pattern

The pattern sits inside an event-driven system with S3 at the center, shown in Figure 1. It carries four paths. A write path enriches new objects, a maintenance path keeps context current, a backfill path annotates existing objects, and a read path serves consumers from annotation context alone.

Event-driven S3 annotation architecture showing the write, maintenance, backfill, and read paths

Figure 1: Event-driven architecture for authoring, maintaining, backfilling, and reading S3 annotation governance context.

The numbered steps in Figure 1 trace the four paths:

  1. A producer uploads an object to the governed S3 bucket with PutObject.
  2. S3 emits an object-created event to Amazon EventBridge. When you route through Amazon EventBridge rather than invoking AWS Lambda directly from S3, you can filter on event attributes such as prefix or object size. You can also route the same event to multiple targets without changing the bucket configuration. A direct notification or an Amazon Simple Queue Service (Amazon SQS) queue is a reasonable simpler choice if you don’t need that routing.
  3. Amazon EventBridge invokes the enrichment Lambda function.
  4. The function calls the Amazon Bedrock enrichment agent to classify the object and extract retention, jurisdiction, and PII context. The agent returns the structured context to the function (dashed return arrow). Have the function validate that the output parses as JSON and conforms to your schema before it writes anything. Models often wrap JSON in a Markdown code fence, and an annotation payload must be the raw structured document.
  5. The function writes the context to the object with PutObjectAnnotation. The write emits an s3:ObjectAnnotation:Put event notification that downstream consumers can subscribe to, which fits the event-driven design.
  6. On a schedule, Amazon EventBridge Scheduler re-invokes the enrichment function to re-assess and update annotations in place.
  7. To annotate objects that predate the pipeline, S3 Batch Operations invokes a backfill Lambda function.
  8. The backfill function writes context with PutObjectAnnotation.
  9. A consumer asks the Bedrock consumer agent a governance question, and the agent returns a grounded answer (dashed return arrow).
  10. The consumer agent lists and retrieves the relevant annotations with ListObjectAnnotations and GetObjectAnnotation. S3 returns annotation context only, never the object body (dashed return arrow).
  11. For queries across many objects, the consumer agent queries Athena.
  12. Athena reads the S3 Metadata annotation table, which S3 maintains automatically from the object annotations (dashed “maintains” relationship).

The scheduled update in step 6 needs one guard: a conditional write on the object’s ETag. Pass the ETag with the --object-if-match CLI parameter, which maps to the x-amz-object-if-match request header.

An ETag is the identifier S3 returns for an object version’s content. The function reads it when it fetches the object and passes it back on the write. If the object was overwritten in the meantime, the ETag no longer matches and the annotation write fails. That guards against overwriting context that belongs to a version the function never evaluated.

The behaviors that decide your design

The plumbing is straightforward. The behaviors in this section are where teams most often get a governance design wrong. Each behavior appears in the documentation, and each has a governance implication that becomes clear only when you trace it through. One principle predicts most of them:

An annotation is caller-authored context bound to a specific object version. S3 stores it and moves it, but it doesn’t interpret or validate its meaning. The annotation’s lifecycle follows the object version’s lifecycle.

Two consequences follow. Because an annotation is bound to an object version, versioning behavior governs whether your context stays or disappears: delete markers, version-specific deletes, and overwrites all change what remains attached. And because S3 doesn’t interpret the content, a classification your agent writes is only as trustworthy as the process that produced it. For each behavior, ask what the annotation is bound to, and what the object version’s lifecycle does in that situation.

Deletion is scoped to the object version

A common governance requirement is to delete a data subject’s records on request. The annotation is bound to a specific object version, so it disappears only when that version disappears. Deleting the object and assuming its context goes with it is correct only in a non-versioned bucket.

In a versioned bucket, a DELETE request without a version ID creates a delete marker and leaves the underlying version, along with its annotations, in place. The object no longer appears in a ListObjectsV2 response, so it looks gone. It’s still returned by ListObjectVersions, and the PII context you recorded still exists on that prior version.

To actually remove the annotations, delete the specific version.

aws s3api delete-object \
  --bucket amzn-s3-demo-governance \
  --key contracts/acme-msa.pdf \
  --version-id <VERSION_ID>

To expire noncurrent versions on a schedule instead, apply an S3 Lifecycle configuration such as the following. It permanently deletes noncurrent versions 30 days after they become noncurrent.

{
  "Rules": [
    {
      "ID": "expire-noncurrent-governed-records",
      "Filter": { "Prefix": "contracts/" },
      "Status": "Enabled",
      "NoncurrentVersionExpiration": { "NoncurrentDays": 30 }
    }
  ]
}

A lifecycle rule expires versions on a time schedule. It can’t read annotation values. If you want an object’s classification or retention status to trigger expiration or deletion, your own automation has to read the annotation and issue the delete. If the trigger you need is an event rather than a value, such as a contract closing or an audit completing, Object Lock event holds handle that natively and you don’t need to build the automation.

Don’t rely on a plain delete for a right-to-be-forgotten workflow in a versioned bucket. Decide up front whether you will issue version-targeted deletes or expire noncurrent versions, make that the only supported path in your tooling, and test it against a real object. The failure mode is silent. Version-targeted deletion is also permanent, so tooling that deletes the wrong version destroys data that is recoverable only from a separate backup.

Object Lock freezes annotations

Governance buckets frequently use S3 Object Lock, and annotations count as modifications to the object version, which Object Lock blocks. While a version is under an active Object Lock retention, PutObjectAnnotation and DeleteObjectAnnotation are both denied with AccessDenied and the message “object protected by object lock retention,” in both Governance and Compliance mode. Reading annotations still works, so consumers are unaffected. What you can’t do is add or update a governance annotation on a version whose retention has already started.

That makes sequencing a design rule: Annotate the object first, then apply the retention period. An annotation written before the lock survives and remains readable, but it’s frozen until retention expires. If your agent re-assesses classifications over time, plan the retention duration and the enrichment cadence together. Where retention starts on a future event rather than at write time, there’s no known end to that frozen window when you annotate, so write the complete governance record before the hold goes on.

The retention mode also changes the right-to-be-forgotten path. In Governance mode, a version-targeted delete of a locked version is denied unless the caller holds s3:BypassGovernanceRetention and passes --bypass-governance-retention. That workflow therefore needs the permission and an approval step around it. In Compliance mode, no one can delete the version, including the root user, until retention expires, so a request may not be satisfiable before then.

Event holds add a third case. A version under an event hold is protected while the hold is in place. Releasing the hold starts the retention period rather than ending protection, so releasing it moves a deletion request further away rather than closer. IAM and bucket policy condition keys govern who may set or release a hold and can enforce minimum and maximum durations, which is where the approval gate belongs.

Object Lock and annotations do different jobs. Object Lock enforces retention, including event-based retention through event holds. The annotation records which policy applies and why, which is context Object Lock doesn’t store. One protects the object, the other explains the decision.

Multipart copies drop annotations unless you opt in

Governance labels are only useful if they stay attached as data moves. For a CopyObject request (objects up to 5 GiB), S3 copies annotations along with the object by default.

For larger objects copied with multipart upload, annotations aren’t copied unless you opt in. Multipart upload is what the AWS CLI and SDKs use through their transfer managers above roughly 8 MB. The default is easy to overlook, because the behavior changes with object size rather than with the command you run. A copy that carries its labels on a small object silently drops them once the object crosses the multipart threshold, with no error or warning. With the multipart opt-in, the SDK writes the annotations after the copy completes, so the destination object exists briefly without all its annotations.

aws s3 cp \
  s3://amzn-s3-demo-governance/contracts/acme-msa.pdf \
  s3://amzn-s3-demo-governance-dr/contracts/acme-msa.pdf \
  --copy-props all

When you call CopyObject directly, the x-amz-annotation-directive header gives explicit control. COPY includes the source annotations on the destination object, and EXCLUDE omits them. Reach for EXCLUDE when you deliberately want a reduced-sensitivity copy.

Set this once as a default rather than deciding per call. Standardize on the copy-props opt-in in every annotation-dependent copy path. Confirm it with a test that copies an object larger than the multipart threshold, because a small-object test would pass while hiding the problem.

Annotation deletion and overwrite are irreversible

Object versioning gives you a safety net. Annotations don’t have one. There’s no delete marker and no version history for an annotation, even in a versioned bucket, so after you delete one it’s gone. The same is true of an update: writing a new payload to an existing annotation name overwrites the previous content in place. That makes an accidental overwrite as destructive as a delete.

Treat annotation deletion as a deliberate, gated action rather than routine cleanup. Restrict s3:DeleteObjectAnnotation to a dedicated administrative role, with an approval step. If a record’s context might be needed for an audit, subscribe to the s3:ObjectAnnotation:Put and s3:ObjectAnnotation:Delete event notifications, or use the S3 Metadata journal table, to keep an audit trail of annotation changes, so that removing the annotation doesn’t erase your only copy of the governance decision.

SSE-C objects can’t have annotations

S3 encrypts annotations using the same configuration as their parent object. That covers server-side encryption with Amazon S3 managed keys (SSE-S3), with AWS Key Management Service (AWS KMS) keys (SSE-KMS), and dual-layer SSE-KMS (DSSE-KMS). One exception matters at design time: Objects encrypted with server-side encryption using customer-provided keys (SSE-C) can’t have annotations. The following AWS CLI call attempts to annotate an SSE-C object and shows the error you get back.

aws s3api put-object-annotation \
  --bucket amzn-s3-demo-governance \
  --key contracts/acme-msa.pdf \
  --annotation-name governance-context \
  --annotation-payload governance-context.json \
  --sse-customer-algorithm AES256 \
  --sse-customer-key <BASE64_KEY> \
  --sse-customer-key-md5 <KEY_MD5>

An error occurred (InvalidRequest) when calling the PutObjectAnnotation operation:
Adding metadata to object with CUSTOMER_MANAGED encryption is not supported

If you build a governed bucket on SSE-C and plan to layer annotation-based context on top, the pattern won’t work. This aligns with the broader direction for SSE-C: in April 2026, S3 disabled SSE-C by default for new buckets and select existing buckets. If you use or are considering SSE-C, plan to move to SSE-S3, SSE-KMS, or DSSE-KMS, all of which support annotations.

Scope read, write, and delete access separately

Governance context shouldn’t be writable by everyone who can read it. S3 exposes distinct IAM actions for annotation reads and writes, so an enrichment process can write context while consumers only read it. The following identity-based policy allows an enrichment role to write and read annotations on a governed bucket. On buckets that use SSE-KMS, annotations use the object’s KMS key, so both the enrichment and consumer roles also need kms:Decrypt, and the enrichment role needs kms:GenerateDataKey.

{
  "Version": "2012-10-17",
  "Statement": [
    {
      "Sid": "EnrichmentRoleMayWriteAnnotations",
      "Effect": "Allow",
      "Action": ["s3:PutObjectAnnotation", "s3:GetObjectAnnotation", "s3:GetObjectVersionAnnotation"],
      "Resource": "arn:aws:s3:::amzn-s3-demo-governance/*"
    }
  ]
}

A consumer role receives read-only access to the same context.

{
  "Version": "2012-10-17",
  "Statement": [
    {
      "Sid": "ConsumerRoleReadsAnnotations",
      "Effect": "Allow",
      "Action": ["s3:GetObjectAnnotation", "s3:GetObjectVersionAnnotation","s3:ListObjectAnnotations"],
      "Resource": "arn:aws:s3:::amzn-s3-demo-governance/*"
    }
  ]
}

Keep the destructive action separate. Grant s3:DeleteObjectAnnotation only to a dedicated administrative role, not to the enrichment or consumer roles, so a routine process can’t permanently remove governance context. For defense in depth, add an explicit Deny on s3:DeleteObjectAnnotation to the enrichment and consumer role policies, as shown in the following statement.

{
  "Version": "2012-10-17",
  "Statement": [
    {
      "Sid": "DenyAnnotationDeletion",
      "Effect": "Deny",
      "Action": "s3:DeleteObjectAnnotation",
      "Resource": "arn:aws:s3:::amzn-s3-demo-governance/*"
    }
  ]
}

An explicit deny overrides any allow that might reach the role through another policy, so even a future permission change can’t let those roles delete annotations. The deny covers deletion only. The enrichment role can still overwrite governance-context with PutObjectAnnotation, so rely on the audit trail described earlier to detect an unintended change.

Replication has its own controls. To keep classification and residency labels attached to a cross-Region copy, grant s3:GetObjectVersionAnnotationForReplication on the source objects and s3:ReplicateObjectAnnotation on the destination objects.

{
  "Version": "2012-10-17",
  "Statement": [
    {
      "Sid": "ReadSourceAnnotationsForReplication",
      "Effect": "Allow",
      "Action": "s3:GetObjectVersionAnnotationForReplication",
      "Resource": "arn:aws:s3:::amzn-s3-demo-governance/*"
    },
    {
      "Sid": "ReplicateAnnotationsToDestination",
      "Effect": "Allow",
      "Action": "s3:ReplicateObjectAnnotation",
      "Resource": "arn:aws:s3:::amzn-s3-demo-governance-dr/*"
    }
  ]
}

Annotations replicate independently of the object and complete after it, so treat replicated annotations as eventually consistent. The object can show a completed replication status while its annotation is still in transit. You can verify annotation replication through the per-annotation replication_status column in the annotation table. To replicate objects while holding their annotations in the source Region, deny s3:ReplicateObjectAnnotation in the replication role policy. Object replication continues, and only annotation replication is blocked.

Generated labels are proposals, not decisions

When an application or agent generates the classification, the second consequence of the mental model becomes a control rather than a footnote. S3 stores whatever label you write and doesn’t check whether it is correct. If a generated PII flag or retention status feeds an automated expiration or deletion, an incorrect label becomes an incorrect deletion.

Keep a validation boundary between authoring context and acting on it. Use generated annotations to inform and prioritize, and require a verification step before any label drives an irreversible lifecycle operation. That step can be an automated policy check or a human review.

The review_required field in the payload shown earlier encodes this boundary. It starts as true and is set to false only after validation, so downstream automation keys off a reviewed label rather than a raw prediction. The generated_by and generated_at fields give you the audit trail to trace which process produced a label when a decision is later questioned.

Treat the enrichment agent as a proposer, never an approver. For reversible or low-impact actions, the approving step can be an automated rule check. For irreversible or high-impact actions such as deletion, expiring retention, or a cross-border transfer, require explicit human approval regardless of how confident the model is.

When annotations are not the right tool

Annotations occupy a specific niche: larger, structured, mutable context that travels with the object. S3 offers other ways to attach information to objects, and they are not interchangeable.

Object tags are limited to 10 small key-value pairs, but they integrate with IAM policy conditions, S3 Lifecycle rules, and cost allocation. User-defined metadata is fixed at upload time and can’t change without copying the object. An external data source offers rich or specialized queries, but it adds a system to operate and keeps context separate from the data it describes.

Tags and user-defined metadata are also queryable at scale through S3 Metadata live inventory tables, so querying isn’t what makes annotations distinct. The larger, richer, mutable payload is. Annotations are the wrong tool in three cases:

  • Your access pattern is relational or join-heavy.
  • You need policy-condition or lifecycle filtering on the values themselves.
  • You have a very high write rate on the same object.

One more constraint shapes the design. Because annotations are written after the object exists, there is a short window between upload and enrichment during which the object carries no governance context. If your controls can’t tolerate that gap, the context can arrive with the upload itself, through user-defined metadata or a pre-registration step. The following table summarizes the comparison.

Design decision S3 annotations Object tags User-defined metadata External data source
Maximum per object version 1,000 10 Fixed set at upload Not applicable
Maximum size 512-byte name + 1 MB payload 128-char key + 256-char value Up to 2 KB total Effectively unbounded
Data format Any UTF-8 text (JSON, XML, YAML, plain text) Key-value strings Key-value strings Any
Mutable after write Yes Yes No (requires object copy) Yes
Set during upload No (after upload only) Yes Yes Not applicable
IAM condition / lifecycle filtering No Yes No Not applicable
Query at scale S3 Metadata annotation table S3 Metadata live inventory table S3 Metadata live inventory table Rich / relational

Production guidance

Three operational points complete the design:

  • Apply least privilege by separating the enrichment role that writes annotations from the consumer roles that read them, and control annotation replication explicitly.
  • Follow the annotation naming rules. Names are 1–512 bytes, limited to letters, digits, underscore, period, and hyphen, and they can’t begin with the reserved aws or s3 prefixes.
  • Version your payload schema so consumers can evolve with it, and encode any binary content with Base64, because payloads must be valid UTF-8.

When you compare cost, account for each component:

  • The storage that the annotation payloads consume.
  • The request charges for PutObjectAnnotation and the read operations.
  • If you enable an S3 Metadata annotation table, that table’s storage and request costs, plus the Athena scan charges when you query it.

Two points are worth highlighting. You pay S3 Standard rates for annotation storage regardless of the parent object’s storage class, so an annotation on an S3 Glacier Deep Archive object still costs Standard-tier storage. And when an object is copied or replicated, each annotation is copied too and metered as a separate PUT. Bulk-copy and replication paths on objects that carry many annotations therefore incur a request cost proportional to the annotation count.

Weigh the total against the cost of running and querying a separate metadata data source, and against the object reads you avoid by keeping context with the object. Confirm current pricing on the S3 pricing page (see Annotations under Management & Insights) and on the S3 Metadata and Athena pricing pages.

Conclusion

With S3 annotations, you can keep governance context with the data it describes: attached to the object, revisable in place, carried across copies and replication, and queryable with SQL through an S3 Metadata annotation table.

Getting that right depends on a small number of behaviors: version-scoped deletion, Object Lock sequencing, annotation preservation across multipart copies, irreversible annotation deletion, the SSE-C constraint, IAM scoping, and the trust boundary around generated labels. The mental model holds that an annotation is caller-authored context bound to an object version, which S3 stores and moves but doesn’t interpret. With that model, you can reason about each behavior before you build.

To get started, adapt the governance annotation schema in this post to your own classification and retention model, and apply the IAM separation and lifecycle handling described here. Each payload, policy statement, and AWS CLI call is inline, so you can copy it directly into your own environment.


About the author
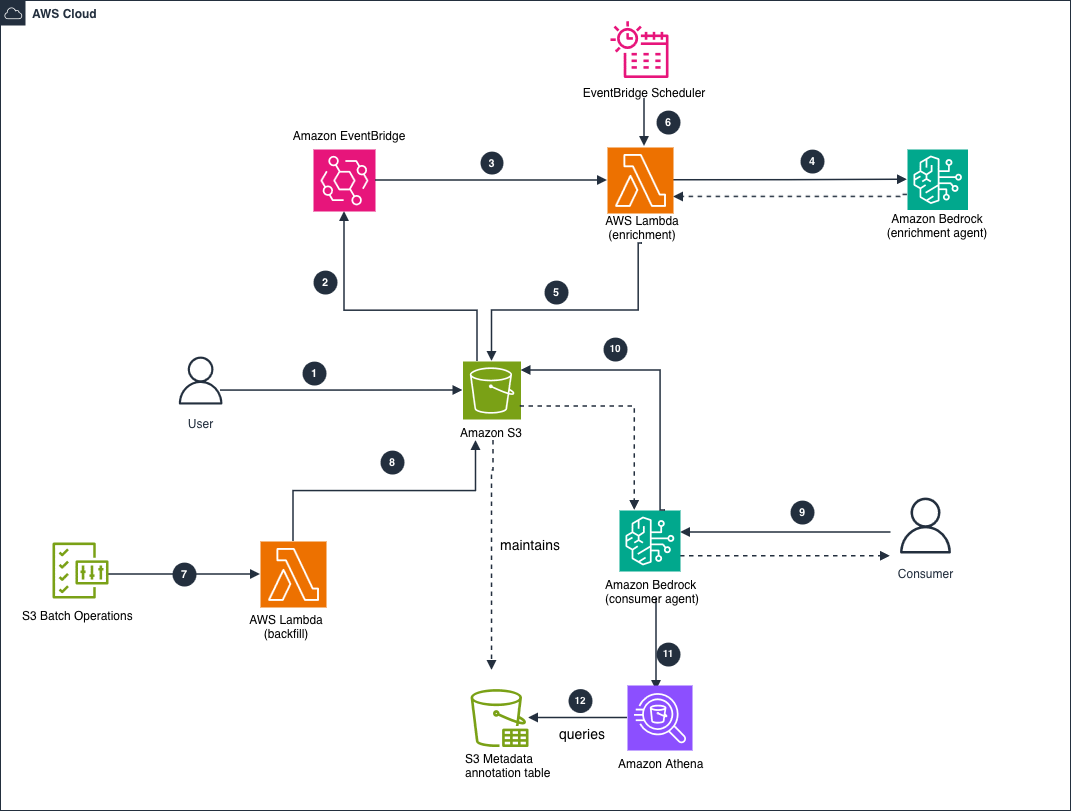
Aditya Jain

Aditya Jain

Aditya is a Delivery Consultant on the migration team at AWS Professional Services, where he helps customers move on-premises workloads to AWS through infrastructure automation. He focuses on building scalable, automated solutions for cloud-native storage and compute, and on applying AI and machine learning to strengthen those workloads. Connect with him on LinkedIn.

Recommended resilience testing in the next generation of AWS Resilience Hub

Post Syndicated from Jennifer Moran original https://aws.amazon.com/blogs/architecture/recommended-resilience-testing-in-the-next-generation-of-aws-resilience-hub/

Organizations that have defined resilience policies and assessed their applications face a common next step: verifying those applications behave as expected when failures occur. Designing fault injection experiments manually requires deep expertise. You need to know which faults to inject, which resources to target, and how to judge whether the outcome counts as success. Many teams do not know where to start, and experiments built by hand can drift out of date as architectures evolve.

Recommended resilience testing in the next generation of AWS Resilience Hub addresses this. It’s a new capability that helps you validate how your services respond to and recover from failure scenarios. The tests are pre-configured and powered by AWS Fault Injection Service (FIS).

Recommended resilience testing uses what AWS Resilience Hub already knows about your service, including its resources, dependencies, and resilience policy. With this information, AWS Resilience Hub automatically creates FIS experiments, injects faults, and evaluates the results against your success criteria and recovery time objective (RTO). It uses that evaluation to determine a pass or fail outcome. What used to be manual experiment design becomes an out-of-the-box test with built-in success evaluation based on your policy. Each test run auto-generates a report, accessible through the Resilience Hub console.

Customers frequently ask which failure modes to test for and what prescriptive testing guidance we can offer. AWS Resilience Hub answers this by providing four tests at launch, selected based on your service’s architecture and resilience policy.

Availability Zone: recovery – Validates your service can detect and recover from an Availability Zone impairment. The test injects the symptoms of a power interruption in a single Availability Zone, affecting compute, networking, storage, and database resources within that AZ. It confirms your service detects the impaired AZ, continues operating in the healthy AZs, and returns to a healthy state within your defined RTO. It can also help surface single-AZ dependencies you might not be aware of.

Dependency validation – Validates how your service responds when its dependencies within the AWS Region are impaired. If you have enabled dependency discovery, the discovered soft dependency with the highest query volume is pre-selected by default. You can adjust the selection to target individual dependencies or specific groups. The dependency validation test blocks dependencies within the Region to see how your service behaves when they are unavailable. It can help you validate that your service remains healthy when soft dependencies are impaired, and surface dependencies you might not have known were hard. You can also include known hard dependencies to understand their impact and confirm your service detects and responds when they are unavailable. We recommend starting with a single soft dependency and expanding from there.

Multi-Region: isolation – Validates your service can operate independently from a Region when connectivity to another Region is unavailable. The test blocks connectivity between the two Regions, including network traffic, cross-Region data replication, and selected dependencies. This test applies to both active-active and active-passive architectures, and is also a useful precursor to the Multi-Region: recovery test.

Multi-Region: recovery – Validates that your service can recover and serve clients within your defined RTO after a Region is impaired. The test introduces failures into dependencies in the selected Region. Through success alarms, it confirms that your service recovers within your defined RTO in the recovery Region and remains healthy for the duration of the test. You perform the recovery action yourself, such as triggering a failover or executing an Amazon Application Recovery Controller (ARC) Region switch plan.

Each test works at three levels. A test template is the pre-configured recommendation, specifying the fault actions, target resource types, and parameters. A test is your configured instance of a template for your service, with your success alarms, stop conditions, and settings. A test run is a single execution that scopes to your current resources and produces a pass/fail outcome with results and a report. You can run the same test quarterly, monthly, or on demand. To get to that pass/fail outcome you can use success criteria in the test.

Choose success criteria that reflect your service’s health and customer experience, such as order success rate or end-to-end availability, rather than the state of individual resources. The impaired resources are expected to be unhealthy. What you are validating is whether your service as a whole absorbed the failure. Combined with your resilience policy, these criteria determine the pass/fail outcome.

For recovery tests (Availability Zone recovery and Multi-Region recovery), the test passes when all success criteria return to a healthy state within the RTO defined in your policy and hold until the test ends. This validates not just that your service recovered, but that it recovered fast enough to meet your stated objectives.

For sustained tests (Dependency validation and Multi-Region isolation), the test passes when all success criteria hold their thresholds from fault injection through the end of the test, proving your service remained healthy throughout the impairment.

You can also select additional alarms for observability only, such as watching the impaired Region degrade. These appear in results and reports without affecting the outcome.

Deep dive: Dependency validation

Of the four recommended resilience tests, dependency validation was one of the most requested capabilities by our customers, and for good reason. Modern applications depend on dozens of services, and understanding which of those dependencies your application can function without is the key to building a resilient application. The dependency validation test determines whether your application continues to work when a given dependency becomes unavailable.

How dependency validation works

The dependency validation test blocks connectivity to your selected dependencies within an AWS Region to observe how your service behaves when they are unavailable. It validates that your service remains healthy when soft dependencies are impaired and surfaces dependencies you might not have known were hard. You can also include known hard dependencies to understand their failure impact.

This is a sustained test. Unlike recovery tests that measure whether you meet your RTO, the dependency validation test passes when all success alarms remain in OK state from the moment faults are injected through the end of the test.

Dependency discovery

You can define dependencies in two ways:

  1. Turn on dependency discovery. This uses DNS query log analysis with a 35-day look-back window and continuous polling to automatically identify the AWS services, internal endpoints, and third-party endpoints your service calls. Dependency discovery surfaces dependencies you might not be aware of, including unexpected cross-Region calls, critical third-party dependencies, and infrequently accessed services that could cause failures during incidents.
  2. Manually enter DNS endpoints directly when configuring the test.

After you define your dependencies, we recommend classifying each one as a soft or hard dependency.

Classification When to use Example What the test validates
Soft Your service degrades but continues operating without this dependency Analytics API, notification service, feature flags, recommendation engine Application handles absence gracefully. Test should pass
Hard Your service fails if this dependency is unavailable Primary database, authentication service, credential exchange Application detects failure and handles it gracefully. Test might fail (this is expected and informative)

Prerequisites

Before you begin, make sure you have at least one service created and assessed in the next generation of Resilience Hub. You would also require an AWS Identity and Access Management (IAM) service role for the next generation of Resilience Hub to assume when running a resilience test. This role can either be created in the next generation of Resilience Hub console or you can specify an existing one.

Configuring the test

From your service dashboard in the next generation of Resilience Hub, choose the Testing tab. You will see four recommended resilience tests. Select Dependency validation, and then choose Edit test configuration.

The configuration page walks you through six sections:

1. Basic settings

Test duration: The length of time fault actions run. Set any value from 1 minute to 12 hours (default: 30 minutes). After the duration, the test takes a few additional minutes to evaluate success before it ends.

Dependency Region: The AWS Region where your service is deployed that you want to test for dependency failures.

2. Dependencies to block

This is where the distinction between soft and hard dependencies directly drives your test.

Default behavior:

The discovered soft dependency with the highest query volume is pre-selected. If no dependencies have been classified as soft, none are pre-selected.

  • Discovered dependencies: A selection box pre-populated with dependencies found in your service in the selected AWS Region. You can choose up to 10 dependencies to test.
  • (Optional) Additional dependencies: Expand this section to include hard dependencies or dependencies not listed in the primary selection. If you didn’t run any dependency discovery, you can use this field to enter a DNS address that will be blocked as a dependency.

Best practice: Start with a single soft dependency and expand from there, progressively building confidence in your application’s failure handling before including hard dependencies.

3. Test actions (fault actions)

The next generation of Resilience Hub uses AWS FIS actions to block connectivity to your selected dependencies, automatically targeting resources discovered in your service. The fault actions inject 100 percent packet loss at the compute layer, dropping traffic to the selected dependencies:

Fault action What it does
aws:ssm:send-command Drops traffic from Amazon Elastic Compute Cloud (Amazon EC2) instances to the selected dependencies
aws:ecs:task-network-packet-loss Drops traffic from Amazon Elastic Container Service (Amazon ECS) tasks (EC2 and AWS Fargate) to the selected dependencies
aws:eks:pod-network-packet-loss Drops traffic from Amazon Elastic Kubernetes Service (Amazon EKS) pods to the selected dependencies

When the test starts, it matches actions to resources discovered in your service. If no resources match an action’s target type, that action is skipped. This means the test automatically adapts to your compute environment, whether you are running on Amazon EC2, Amazon ECS, Amazon EKS, or a combination.

Additional setup required: The setup for these actions depends on your compute type. You need an AWS Systems Manager Agent container in your Amazon ECS task definition, a Kubernetes service account for Amazon EKS pods, or AWS Systems Manager Agent installed on your Amazon EC2 instances.

4. Test alarms

Alarms determine whether the test passes or fails. Select alarms discovered from your service that reflect service performance and customer experience. For example, order success rate for an ecommerce service or transactions processed for a payments system.

  • Success alarms: The next generation of Resilience Hub uses these to validate whether your service passed or failed the test. Choose alarms that measure your service’s health across the AWS Region.
  • (Optional) Additional alarms: Tracked during the test run and shown in the report, but don’t affect the test outcome. Use additional alarms for observability to monitor how these alarms behave during the dependency impairment.

How to pass: The test passes if all success alarms remain in OK state until the test actions end.

Success criteria and additional alarms share a limit of 5 per configuration update.

5. Stop conditions, reports, and logs

Stop conditions: Amazon CloudWatch alarms that act as guardrails. If breached, they stop the test automatically to protect your workloads. Choose up to five alarms. They must be in the account where the test runs and the AWS Region where the faults are injected.

(Optional) Reports: If you configure an Amazon Simple Storage Service (Amazon S3) bucket as a report destination on your service, the next generation of Resilience Hub generates a report after each test run that includes the test configuration, alarm status, timeline, and results.

Logs: Optionally send test logs to an Amazon S3 bucket or Amazon CloudWatch Logs for deeper analysis. The next generation of Resilience Hub doesn’t charge for sending logs, though ingestion and storage charges apply.

6. Test permissions

The test requires an IAM role to grant access to AWS services and resources. For single account setups, you need one execution role. For multi-account setups, you need an orchestrator role in the account running the test and a target role in each account containing targeted resources. You can create the role directly from AWS Management Console with required permissions pre-configured or use an existing role. Once saved, the role is used by default for future runs.

Note: Updating test settings might change required IAM permissions. Required permissions vary based on the trust policy, fault actions, and test options selected. Always review the IAM role instructions to confirm correct permissions.

Running the test: What success and failure look like

The value of the dependency validation test becomes clear when you compare results across dependency classifications. We walk through two test runs on the same service with the same success alarms: one blocking soft dependencies, one blocking hard dependencies.

Test run: Soft dependencies blocked — PASSED ✅

Dependencies blocked:

  • Payment Gateway.
  • Notification Service.

Success alarms:

  • canary-heartbeat-canary-failure-us-east-2: Monitors service health check availability.
  • canary-order-flow-canary-failure-us-east-2: Monitors end-to-end order processing.
Soft dependency test results: both success alarms in OK state, solid green timeline throughout test duration

Figure 1: Soft dependency test run with both success alarms holding in OK state for the full test duration

What the results show: Both alarms remained in OK state (solid green) from the moment test actions started through the end of the test. The application continued functioning normally without Payment Gateway and Notification Service. The order flow kept processing. The heartbeat kept responding. The service handled the absence of its soft dependencies gracefully, exactly as designed.

What this proves: These dependencies are correctly classified as soft. Your application can tolerate the loss of these dependencies, suppressing notifications without impacting the customer-facing order flow.

Test run: Hard dependencies blocked — FAILED ❌

Dependencies blocked:

  • Amazon Cognito.
  • AWS Security Token Service (AWS STS).

Success alarms:

  • canary-heartbeat-canary-failure-us-east-2: Monitors service health check availability.
  • canary-order-flow-canary-failure-us-east-2: Monitors end-to-end order processing.
Hard dependency test results: order-flow alarm transitions to red immediately after test actions start, heartbeat remains green

Figure 2: Hard dependency test run with the order-flow alarm entering alarm state while the heartbeat alarm stays healthy

What the results show: The heartbeat canary stayed green throughout. The application did not become unavailable. But the order-flow canary transitioned to alarm state (red) immediately after faults were injected and remained there until the test ended. Without Amazon Cognito (authentication) and AWS STS (credential exchange), the application couldn’t complete the business-critical order flow.

What this proves: Amazon Cognito and AWS STS are correctly classified as hard dependencies. The test confirms that their absence impacts critical functionality, but importantly, it also shows the failure was contained. The application did not cascade into a complete failure. It continued responding (heartbeat passed) while the specific business flow that required authentication failed gracefully.

Interpreting results: A decision framework

Test results aren’t simply pass or fail. A passing test can still surface a misclassified dependency, and a failing test can confirm that a dependency is genuinely critical. What matters is reading the outcome against how you classified the dependency, so you know whether your architecture behaved as intended and what to do about it.

The following decision framework helps you interpret the results of each test, understand what they mean, and decide what to do next.

Scenario Expected Outcome What it means What to do next
Soft dependency blocked → test passes Yes Graceful degradation is working. Classification is accurate. No action required. Your architecture handles this failure correctly.
Soft dependency blocked → test fails No The dependency might be misclassified as soft when it’s actually hard. Or your degradation logic has a gap. Review application behavior. Reclassify as hard, or fix the degradation path.
Hard dependency blocked → test fails Yes Confirms the classification. Critical functionality is impacted without this dependency. Verify the failure is graceful (no cascading failures, no data corruption, no hung connections). Consider whether you can add retry/fallback to reclassify as soft in the future.
Hard dependency blocked → test passes No The dependency might be misclassified. It could actually be soft. This could also indicate the dependency isn’t being called as intended. Investigate whether your application is more resilient than expected, or whether the dependency is not being exercised. Reclassify if appropriate or fix the application logic.

Summary

Recommended resilience testing in the next generation of AWS Resilience Hub removes the barrier between knowing your architecture and proving it holds under failure. It provides four AWS recommended tests built on AWS FIS, covering Availability Zone recovery, dependency validation, Multi-Region isolation, and Multi-Region recovery. You can move from policy definition and failure mode assessment to evidence-backed validation without building experiments from scratch.

You can start with the dependency validation test to understand how your application handles the loss of its dependencies. Expand to AZ recovery and multi-Region tests as your program matures. Each test run captures a point-in-time snapshot of your current resources, produces a pass/fail outcome evaluated against your resilience policy, and feeds results into your compliance and reporting workflows over time.

Recommended resilience testing is available today in all AWS commercial Regions where the next generation of AWS Resilience Hub is supported. To learn more and get started, visit the AWS Resilience Hub User Guide and the AWS Resilience Hub product page.


About the authors

Jennifer Moran

Jennifer Moran

Jennifer is a Principal Resilience Specialist Solutions Architect at AWS, where she helps customers architect resilient cloud solutions that improve their resilience posture and operational excellence. She is the co-author of Engineering Resilient Systems on AWS (O’Reilly Media). Her interests include fault-tolerant design, scalable architectures, and high-availability systems.

Imran Sadiq

Imran Sadiq

Imran is a Senior Solutions Architect at Amazon Web Services, working with financial services customers across New Zealand. As a resilience specialist, he is passionate about helping organizations prepare for, respond to, and recover from the unexpected. With deep expertise in resilience testing, disaster recovery, and cloud-native resilience patterns, Imran partners with customers to build resilient systems.

Tracing failures across Terraform state boundaries with AWS DevOps Agent

Post Syndicated from Shruti Saxena original https://aws.amazon.com/blogs/devops/tracing-failures-across-terraform-state-boundaries-with-aws-devops-agent/

AWS DevOps Agent helps trace failures that cross Terraform state boundaries, which may be hard to diagnose because the team that sees the symptoms often doesn’t own the stack that caused them. This post shows how AWS DevOps Agent helps find the root cause of these cross-stack failures. First, some context on why those boundaries can introduce challenges.

Many teams split infrastructure into independent Terraform stacks. It gives teams clear ownership boundaries and smaller scope. An infrastructure team owns networking, and an application team owns compute and data. Each stack has its own state file, and neither team has to coordinate with the other for routine changes.

That separation also creates a visibility gap. When one team changes a stack and their change silently breaks an application in another stack, the team that sees the symptoms rarely owns the stack that the first team modified. They check their own AWS Lambda logs, AWS Identity and Access Management (IAM) policies, and database metrics. Everything looks fine, because their stack shows no issues.

Here’s the scenario this post walks through. An infrastructure team tightens a security group egress rule during a routine security audit. The infrastructure team’s change accidentally severs an application team’s Lambda from Amazon DynamoDB. The application team sees timeouts, and the alarms point everywhere except the real problem.

AWS DevOps Agent helps address that challenge. It correlates the alarms, maps the dependency chain across the state boundary, and inspects AWS CloudTrail to help narrow down the networking change as the likely root cause. You can then take its mitigation spec into Kiro to generate and apply the fix.

You can find all the Terraform and Lambda code referenced here in the accompanying GitHub repository. This is demonstration code that intentionally injects a failure and exposes an unauthenticated API for teaching purposes. It isn’t production-ready. See the repository’s SECURITY.md for the known gaps and hardening steps.

Solution architecture

The following diagram shows the full request path and how AWS DevOps Agent connects to it.

Cross-stack failure architecture: Client to Amazon API Gateway to Lambda to security group to DynamoDB VPC endpoint to DynamoDB, with Amazon CloudWatch alarms feeding Amazon Simple Notification Service (Amazon SNS) and a webhook bridge Lambda that forwards signed events to the AWS DevOps Agent Space, which diagnoses the root cause back in the networking stack.

Figure 1: Request path and monitoring flow that connects the sample application to AWS DevOps Agent

As the diagram shows, a client request enters through Amazon API Gateway, which invokes the Lambda function running inside the VPC. The function reaches Amazon DynamoDB over TCP/443 through a Gateway VPC endpoint, and a security group egress rule in the networking stack controls that path. On the monitoring side, Amazon CloudWatch alarms publish to an Amazon SNS topic. A webhook bridge Lambda function forwards each signed alarm to the AWS DevOps Agent Space, and the agent traces the failure back to the networking stack that owns the changed rule.

The architecture is a small serverless application split across three independent Terraform stacks, each with its own state file, plus an optional AWS DevOps Agent stack. The stack boundaries mirror real team ownership: an infrastructure team owns networking, while an application team owns compute and data.

stacks/
  networking/        # Stack 1, infrastructure team: VPC, private subnets,
                     #          Lambda security group, DynamoDB Gateway
                     #          VPC endpoint, VPC Flow Logs
  compute/           # Stack 2, app team: Lambda (in VPC) + HTTP API Gateway
  data-monitoring/   # Stack 3, app team: DynamoDB table, SNS topic,
                     #          CloudWatch alarms
devops-agent/        # DevOps Agent Space, IAM trust role, webhook bridge Lambda

When everything is healthy, a request flows like this:

Client → API Gateway → Lambda (in VPC) → Security Group → DynamoDB VPC endpoint → DynamoDB

The compute stack doesn’t hardcode anything from the other two. It reads the networking stack’s outputs through terraform_remote_state. Those outputs are the Amazon Virtual Private Cloud (Amazon VPC), the subnet IDs, and the security group ID. It reads the data stack’s outputs (table name and ARN) the same way.

That’s the dependency chain that matters. The application’s runtime health depends on a security group that lives in a stack it only reads from, never writes to.

The key detail is that Lambda reaches DynamoDB through a Gateway VPC endpoint, not over the public internet. There’s no NAT gateway. The only path from the Lambda function to DynamoDB is TCP/443 out to the DynamoDB service prefix list. A single security group egress rule in the networking stack gates that path. Break that rule, and every DynamoDB call from the Lambda function hangs until it times out.

The data-monitoring stack defines two CloudWatch alarms. One is the real signal, the other is a deliberate red herring:

  • Lambda error-rate alarm fires on the Errors metric. It’s the genuine symptom of trouble.
  • DynamoDB read-capacity-drop alarm fires when ConsumedReadCapacityUnits falls to near zero. While this appears to implicate DynamoDB, the table is healthy. Capacity drops only because the network layer blocks requests before they ever reach DynamoDB.

Both alarms publish to an Amazon SNS topic. The webhook bridge Lambda function in the AWS DevOps Agent stack subscribes to that topic, signs each alarm payload, and then forwards the payload to AWS DevOps Agent.

Prerequisites

Before you deploy this sample, make sure that you have the following in place:

  • An AWS account with access to the US East (N. Virginia) AWS Region (us-east-1), where you use AWS DevOps Agent. AWS DevOps Agent is available in 11 AWS Regions, and regardless of which supported Region you create your Agent Space in, it can monitor and investigate resources in AWS accounts located in any AWS Region. This walkthrough uses the US East (N. Virginia) Region (us-east-1) for the demo.
  • Permissions to create the resources used across the stacks: Amazon VPC networking (VPC, subnets, security groups, VPC endpoints, VPC Flow Logs), AWS Lambda, Amazon API Gateway, Amazon DynamoDB, Amazon SNS, Amazon CloudWatch alarms, AWS Systems Manager Parameter Store parameters, and the IAM roles and policies these resources require.
  • Permissions to provision AWS DevOps Agent resources through AWS Cloud Control API, including creating the Agent Space and account association and passing the agent’s IAM role.
  • Terraform 1.6.0 or later, with the hashicorp/aws (5.50.0 or later) and hashicorp/awscc (1.66.0 or later) providers. The AWS provider manages standard resources, and the AWS Cloud Control API provider manages the AWS DevOps Agent resources.
  • The AWS Command Line Interface (AWS CLI) configured with credentials for the target account.
  • An Amazon Simple Storage Service (Amazon S3) bucket for Terraform remote state and an Amazon DynamoDB table for state locking because the compute stack reads the other stacks’ state through terraform_remote_state.

Setting up AWS DevOps Agent with Terraform

AWS DevOps Agent resources aren’t in the standard hashicorp/aws provider. You provision the Agent Space and account association through the hashicorp/awscc provider (the AWS Cloud Control API provider). A few things trip people up here, so they’re worth calling out.

Use the US East (N. Virginia) Region

AWS DevOps Agent is available in 11 AWS Regions, and no matter which supported Region hosts your Agent Space, the agent can monitor and investigate resources in AWS accounts located in any AWS Region. This walkthrough creates the Agent Space in us-east-1 for the demo.

Get the IAM trust policy right

Two details matter. The service principal is aidevops.amazonaws.com (not devops-agent.amazonaws.com), and the aws:SourceArn condition must be the exact Agent Space ARN. A wildcard ARN causes a 400 error.

resource "awscc_devopsagent_agent_space" "this" {
  name = var.agent_space_name

  tags = [
    { key = "Project",   value = var.project },
    { key = "ManagedBy", value = "terraform" },
  ]
}

data "aws_iam_policy_document" "agent_assume_role" {
  statement {
    effect  = "Allow"
    actions = ["sts:AssumeRole"]

    principals {
      type        = "Service"
      identifiers = ["aidevops.amazonaws.com"]
    }

    condition {
      test     = "StringEquals"
      variable = "aws:SourceAccount"
      values   = [local.account_id]
    }

    condition {
      test     = "ArnEquals"
      variable = "aws:SourceArn"
      values   = [awscc_devopsagent_agent_space.this.arn]
    }
  }
}

Attach the AWS managed policy AIDevOpsAgentAccessPolicy to the role, plus a small inline policy allowing iam:CreateServiceLinkedRole for AWS Resource Explorer. The agent creates that service-linked role on its first run.

Then associate your account with the Agent Space in monitor mode:

resource "awscc_devopsagent_association" "account" {
  agent_space_id = awscc_devopsagent_agent_space.this.agent_space_id
  service_id     = "aws"

  configuration = {
    aws = {
      account_id         = local.account_id
      account_type       = "monitor"
      assumable_role_arn = aws_iam_role.devops_agent.arn
    }
  }
}

On the first apply, the association can fail with “Invalid AWS Security Token Service (AWS STS) role configuration.” That’s a race between the IAM trust policy propagating and the association forming. Re-run the same apply and it succeeds.

Bridge the alarms to the agent

CloudWatch alarms have no native action that targets AWS DevOps Agent, so you need a small bridge Lambda between SNS and the agent’s webhook. The bridge:

  1. Receives the CloudWatch alarm through SNS.
  2. Fetches the webhook URL and HMAC signing secret from AWS Systems Manager Parameter Store (stored as SecureString).
  3. Builds an event payload from the alarm data.
  4. Signs it with HMAC-SHA256 over timestamp:payload, Base64-encoded.
  5. POSTs it with the x-amzn-event-signature and x-amzn-event-timestamp headers.

The signing method is specific. The agent rejects the request with a 403 if the signature isn’t HMAC-SHA256 over timestamp:payload in exactly that form:

def _sign_payload(secret, timestamp, payload_str):
    message = f"{timestamp}:{payload_str}"
    sig = hmac.new(
        secret.encode("utf-8"),
        message.encode("utf-8"),
        hashlib.sha256,
    ).digest()
    return base64.b64encode(sig).decode("utf-8")

To generate the webhook, open your Agent Space on the console, go to Capabilities, choose Webhook, and then choose Generate. When prompted for the authentication method, choose HMAC so the agent validates each request against the HMAC-SHA256 signature the bridge Lambda produces. This returns a webhook URL and a signing secret. This walkthrough generates the webhook on the console because that is the only option today. Unlike the Agent Space, IAM roles, and associations, which this post provisions with Terraform, the generic webhook is not exposed as a Terraform resource. The generated URL and secret are only available from the Capabilities tab. This mirrors the official AWS DevOps Agent Terraform sample, which provisions everything in code but leaves console-only steps, such as connecting Datadog, as manual actions. Once you generate the webhook, store its URL and secret in the Parameter Store parameters that Terraform created with placeholder values. The bridge Lambda then picks them up from there.

Deploying the three interdependent Terraform stacks

Deploy order follows the dependency chain. Networking comes first (everything depends on the VPC and security group), then data-monitoring (the table has to exist before compute references it), then compute (it reads both other stacks’ remote state).

# 1. Networking: VPC, subnets, security group, DynamoDB VPC endpoint
terraform -chdir=stacks/networking apply -var-file=terraform.tfvars

# 2. Data and monitoring: table, SNS topic, alarms
terraform -chdir=stacks/data-monitoring apply

# 3. Compute: Lambda + API Gateway (reads the other two stacks' state)
terraform -chdir=stacks/compute apply -var "tf_state_bucket=${BUCKET}"

Terraform takes a minute or two to create the VPC-attached Lambda because of elastic network interface (ENI) setup. If an apply times out mid-run, re-run the same command, and Terraform picks up where it left off.

After compute finishes, retrieve the API URL and confirm the expected behavior before introducing the failure:

API_URL=$(terraform -chdir=stacks/compute output -raw api_endpoint)

curl -sS -X POST "$API_URL/items" \
  -H "Content-Type: application/json" \
  -d '{"id":"item-001","name":"Test Item","price":"29.99"}'

curl -sS "$API_URL/items/item-001"

A POST returns {"message": "Item created"} and the GET returns the item. The full path now works, from the API request through to the DynamoDB write and read: API Gateway invokes the Lambda function, the Lambda function writes and reads DynamoDB through the VPC endpoint, confirming both stacks work as expected.

Note: price is a string ("29.99"), not a number. DynamoDB through boto3 rejects Python floats.

Finally, deploy the AWS DevOps Agent stack and complete the manual webhook step described earlier. After the account association is active, the Agent Space page starts showing “Relationships mapped” climbing as the agent discovers your resources and builds topology. This discovery phase populates the agent space memory that AWS DevOps Agent relies on to understand your environment and correlate signals during an investigation. Wait until discovery has completed and the agent has finalized its agent space memory before you proceed. That way, the agent has the full context it needs for the incident investigations that follow. You can tell discovery is finished from the Agent Space page on the console. The “Relationships mapped” count stops climbing and holds steady over a few minutes. The account association shows an Active status rather than Syncing or In progress. The resource and topology view reflects the resources you deployed (the VPC, Lambda functions, DynamoDB table, and their relationships). For a brand-new account of this size, the initial build typically settles within roughly 10 to 15 minutes.

Introducing the cross-stack failure

Here’s the change that starts the failure. The whole failure hinges on one security group egress rule in the networking stack, toggled by a single variable:

resource "aws_security_group_rule" "lambda_egress" {
  type              = "egress"
  from_port         = 443
  to_port           = 443
  protocol          = "tcp"
  security_group_id = aws_security_group.lambda.id

  # restrict_egress = false → allow TCP/443 to the DynamoDB VPC endpoint prefix list (working)
  # restrict_egress = true  → restrict TCP/443 to the VPC CIDR only (broken)
  prefix_list_ids = var.restrict_egress ? null : [aws_vpc_endpoint.dynamodb.prefix_list_id]
  cidr_blocks     = var.restrict_egress ? [var.vpc_cidr] : null

  description = var.restrict_egress ? "Restricted egress - security audit compliance" : "Allow Lambda to reach DynamoDB via VPC endpoint"
}

Flipping restrict_egress to true is the kind of change that looks entirely reasonable in a pull request. “Scope Lambda egress to the VPC CIDR instead of a broad prefix list” reads like tightening, not breaking. The description even says “security audit compliance.” A reviewer on the infrastructure team would likely approve it without a second thought. From inside the networking stack, there’s no visible connection to the application’s DynamoDB traffic.

Inject it with the provided script:

./scripts/introduce-failure.sh   # re-applies networking with restrict_egress=true

The moment you change the rule, the path from the Lambda function to the DynamoDB VPC endpoint disappears. The Lambda function is still perfectly invocable, because API Gateway ingress is untouched. Requests come in and the handler runs, but every DynamoDB call then sits there until the 30-second Lambda timeout. Drive a little traffic and confirm:

curl -sS --max-time 35 "$API_URL/items/item-001"
# => {"error": "Connect timeout on endpoint URL: https://dynamodb.us-east-1.amazonaws.com/"}

Within a minute or two, the alarms fire. And this is where a human investigation goes sideways:

  • The Lambda logs show Task timed out after 30.00 seconds. No stack trace, no AccessDenied, nothing that points at networking.
  • The DynamoDB console shows a perfectly healthy table. No throttling, no errors, capacity near zero.
  • IAM is correct. The Lambda role has the right DynamoDB permissions. This isn’t a permissions problem.
  • The DynamoDB capacity alarm actively misleads you toward the database.

An engineer troubleshooting this naturally checks Lambda configuration, then IAM, then DynamoDB. Only after exhausting all of those might they think to look at VPC networking. That networking lives in a stack another team owns, one they didn’t know had changed. That’s the visibility gap the state boundary creates.

AWS DevOps Agent investigation

Both alarms publish to SNS, the bridge Lambda signs and forwards them, and AWS DevOps Agent opens an investigation triggered by the event channel. From there it works the problem in parallel rather than the linear path a human would take.

The investigation fans out into subagents. They look at Lambda metrics, DynamoDB metrics, Lambda logs, CloudTrail, and VPC networking simultaneously. That parallelism is what collapses sequential log-diving into a much shorter effort. While one line of inquiry reads the Lambda timeout logs, another is already correlating the two alarms as a single event. A third is pulling recent CloudTrail events for the resources in the topology.

What the agent establishes:

  1. A single correlated event – The two alarms started within the same window and are related, not independent failures.
  2. The dependency chain – API Gateway to Lambda to VPC to security group to DynamoDB VPC endpoint to DynamoDB. Critically, it walks this chain across the Terraform state boundary. It sees AWS resources and their relationships, not stack ownership. The boundary that hides the cause from the app team is invisible to the agent, which works in its favor.
  3. A network timeout, not a permissions or database fault – The Lambda logs show connection timeouts to the DynamoDB endpoint. The DynamoDB metrics confirm the table is idle rather than erroring.
  4. The trigger – CloudTrail shows a recent egress change on the Lambda security group, with the principal and timestamp. Correlating that timestamp against the onset of Lambda timeouts (roughly a minute later) establishes causation.
  5. A red herring that is really a symptom – The DynamoDB capacity drop reflects a downstream effect (requests never arrive), not a DynamoDB fault.

It lands on a root cause along these lines:

A security group egress modification blocked the network path from Lambda to DynamoDB. The change replaced the egress rule that allowed TCP/443 to the DynamoDB VPC endpoint prefix list with a rule scoped to the VPC CIDR only. As a result, Lambda functions in the private subnets can no longer establish connections to DynamoDB through the Gateway VPC endpoint. Both alarms are symptoms of this one network-layer change, and the DynamoDB table itself is healthy.

With VPC Flow Logs active in the networking stack, the agent gains additional network-layer evidence to confirm that the network drops the traffic rather than letting it reach DynamoDB and fail there.

Generating the mitigation specification with Kiro

AWS DevOps Agent doesn’t stop at diagnosis. Alongside the root cause, it produces a mitigation plan, which is structured, agent-ready guidance describing what needs to change. In the web app, the Mitigation plan tab has a Copy spec button that hands you a spec you can drop straight into Kiro.

The spec captures the intent without prescribing exact syntax:

Mitigation: Restore the security group egress rule that allows Lambda to reach DynamoDB through the VPC endpoint.

  • Security group: the Lambda security group in the networking stack.
  • Rule: egress, TCP, port 443.
  • Destination: the DynamoDB VPC endpoint prefix list.
  • Effect: restore the Lambda to DynamoDB network path that the recent change removed.

This is the handoff point between detection and remediation. The agent understood what is wrong and what the fix needs to accomplish. Kiro turns that into the actual Terraform change in your repository.

Implementing the remediation with Kiro

Open the spec in Kiro. Because the fix is a matter of intent expressed against real code, Kiro reads the networking stack, locates the toggled egress rule, and produces the corrected Terraform. In this repo the clean fix is to flip restrict_egress back to false, which restores the prefix-list rule:

- prefix_list_ids = var.restrict_egress ? null : [aws_vpc_endpoint.dynamodb.prefix_list_id]
- cidr_blocks     = var.restrict_egress ? [var.vpc_cidr] : null
+ # restrict_egress = false: Lambda egress to the DynamoDB VPC endpoint prefix list restored
+ prefix_list_ids = [aws_vpc_endpoint.dynamodb.prefix_list_id]
+ cidr_blocks     = null

For a repo that defines the restrictive rule directly (not behind a toggle), Kiro generates the equivalent change. It swaps the cidr_blocks destination back to the DynamoDB prefix_list_ids:

  resource "aws_security_group_rule" "lambda_egress" {
    type              = "egress"
    from_port         = 443
    to_port           = 443
    protocol          = "tcp"
    security_group_id = aws_security_group.lambda.id
-   cidr_blocks       = [var.vpc_cidr]
-   description       = "Restricted egress - security audit compliance"
+   prefix_list_ids   = [aws_vpc_endpoint.dynamodb.prefix_list_id]
+   description       = "Allow Lambda to reach DynamoDB via VPC endpoint"
  }

The engineer stays in control. You review the diff, run terraform plan to confirm it only touches the one egress rule, and then apply:

terraform -chdir=stacks/networking plan   # confirm the change is scoped to the egress rule
terraform -chdir=stacks/networking apply

The loop is now closed. AWS DevOps Agent detected and diagnosed, Kiro generated the fix, and a human approved it before anything changed. While iterating on the demo, you can shortcut this with ./scripts/restore.sh, which re-applies with restrict_egress=false.

Validating recovery

As soon as you restore the egress rule, the path from the Lambda function to the DynamoDB VPC endpoint comes back. Confirm with the same request that was timing out:

curl -sS "$API_URL/items/item-001"
# => {"id": "item-001", "name": "Test Item", "price": "29.99"}

The request returns immediately instead of hanging for 30 seconds. On the monitoring side, once real traffic reaches DynamoDB again, consumed read capacity climbs back above the threshold and the DynamoDB alarm returns to OK. The Lambda error-rate alarm clears as timeouts stop. The bridge Lambda forwards the OK-state transitions to AWS DevOps Agent, which reflects the issue resolving.

Assessment and key takeaways

Being honest about what the agent does well and where it has limits matters more than a clean demo.

What it got right:

  • The agent identified networking as the root cause instead of chasing DynamoDB or IAM, which is exactly where the human investigation stalls.
  • It traced the VPC endpoint connectivity path accurately and correlated the two alarms into a single event.
  • The DynamoDB red herring didn’t fool it, because it explained the capacity drop as a downstream symptom.
  • CloudTrail analysis surfaced the security group change, and the agent tied its timestamp to the onset of failures.
  • Most importantly, it turned a cross-team investigation that spans multiple stacks into a single, correlated result.

Where to keep expectations realistic:

  • The agent reasons about AWS resources and their relationships, not Terraform stacks. That’s a strength here, because it sees past the state boundary. It does mean the agent won’t tell you “this was in the networking stack.” Instead, it names the security group and the change, and you map that back to the stack.
  • When a security group change is made by running terraform apply, CloudTrail records the IAM role that ran the apply, not the individual engineer. Attribution stops at the automation identity unless you have additional context.
  • The quality of the network-layer diagnosis depends on signals being available. With VPC Flow Logs active in this demo, the agent gains concrete evidence. Without them, it has less to work with and may flag the gap.

The broader takeaway is that Terraform state separation is the right call for team ownership, but it manufactures operational visibility gaps. The team that owns the symptoms often doesn’t own the cause and can’t see the change that triggered it. AWS DevOps Agent helps address that gap by understanding resource topology regardless of how you provisioned the resources or which state file describes them.

Clean up

To avoid ongoing charges, destroy the resources when you’re done. Because the compute stack depends on the networking and data-monitoring stacks, tear the stacks down in the reverse of the deploy order. Destroy AWS DevOps Agent first, then compute, then data-monitoring, and networking last.

# 1. AWS DevOps Agent stack (Agent Space, trust role, webhook bridge Lambda)
ALARMS_SNS_ARN=$(terraform -chdir=stacks/data-monitoring output -raw alarms_sns_topic_arn)
terraform -chdir=devops-agent destroy -var "alarms_sns_topic_arn=${ALARMS_SNS_ARN}"

# 2. Compute stack (Lambda + API Gateway)
terraform -chdir=stacks/compute destroy -var "tf_state_bucket=${TF_STATE_BUCKET}"

# 3. Data and monitoring stack (DynamoDB table, SNS topic, alarms)
terraform -chdir=stacks/data-monitoring destroy

# 4. Networking stack (VPC, subnets, security group, DynamoDB VPC endpoint)
terraform -chdir=stacks/networking destroy -var-file=terraform.tfvars

Deleting the VPC-attached Lambda function can take a minute or two while AWS releases its elastic network interfaces. Allow the networking stack destroy to finish before you remove the remote state backend. If you created a dedicated Amazon S3 bucket and Amazon DynamoDB lock table for Terraform state, delete those last, after you destroy all four stacks.

Conclusion

Independent Terraform stacks give you clean ownership boundaries and small scope, and you should keep using them. The tradeoff is that failures don’t respect those boundaries. A routine, reasonable-looking security group change in the infrastructure team’s stack can time out an application team’s Lambda, and the symptoms will point everywhere except the actual cause.

AWS DevOps Agent narrows that gap. It correlates alarms, maps the dependency chain across state boundaries, and reads CloudTrail to find the triggering change. Pairing it with Kiro closes the full loop from detect to remediate. The agent produces a mitigation spec, Kiro turns it into a reviewed Terraform diff, and an engineer applies the fix with confidence. The human still makes the call, and the cross-team log-diving is no longer the bottleneck.

Next steps

To try this end to end, deploy the sample from the accompanying GitHub repository, inject the failure, and watch the agent trace the cause across the state boundary. To learn more, see the following resources:


About the author

Shruti Saxena

Shruti Saxena

Shruti is an Associate Delivery Consultant at AWS Professional Services, specializing in DevOps, infrastructure as code, and automated development workflows. She works on cloud modernization and Amazon Elastic Kubernetes Service (Amazon EKS) environments for regulated environments, helping customers build compliant, scalable infrastructure using Terraform and automated development tools. She is passionate about pushing the boundaries of what automated tools can do for software delivery and about helping others do the same.

Making Failure Diagnosis Reliable with Pensive AI

Post Syndicated from Netflix Technology Blog original https://netflixtechblog.com/making-failure-diagnosis-reliable-with-pensive-ai-6b0811a1c015

By Praneeth Yenugutala, Victor Dusa, Anastasia Samoilova, Megan Ren, Justin Wei, Marcelo Mayworm

At Netflix, data and machine learning practitioners run millions of workloads each day across orchestration systems and compute engines such as Titus, Spark, Trino, and Druid. On peak days, roughly 100,000 workloads fail. When workloads fail, the failure itself is only the beginning. Someone still needs to find the useful signal in several logs, decide whether the cause sits in their code or the platform, and determine whether to retry, reconfigure, or escalate. Even a small share of difficult failures can consume engineering time, waste compute, and interrupt critical data pipelines.

Our first answer to that problem was Pensive, an auto-diagnosis and remediation system in Netflix’s data platform. Pensive collected logs from failed workloads, used regular expressions and hand-authored Java rules to extract and classify errors, then passed retry or remediation guidance to products such as Maestro. It made ~ 50% of failures self-service and, in some cases, automatic.

Rules work well for known patterns, but their coverage grows only when someone recognizes a new failure mode, understands the logs, writes a rule, and keeps it current as engines and log formats change. Over one three-month period, Pensive processed roughly seven million job-failure classifications, yet about half fell into the unknown bucket. We needed a way to expand coverage without giving up the deterministic parts of Pensive that already worked.

To solve this ambiguous and complex problem at Netflix scale, we invested in Pensive AI to add AI-assisted error extractions and focused diagnosis and remediation guidance to our data and ML practitioners. The goal was not simply to place a model in front of a large collection of logs. We needed bounded extraction, predictable evaluation inputs, responsive product behavior, and quality checks that could follow the system from local development through production. Those requirements shaped every layer of the design, which we will discuss in this blog. Pensive AI wraps AI around deterministic processes, which gives broader coverage, low latency, controlled AI costs, and easier maintenance across the software development lifecycle. Building on this foundation, we plan to explore more agentic debugging experiences, as Part 6 describes.

Early results are encouraging. AI error extraction now covers 100% of failures, including the failures that legacy Pensive classified as unknown. Failed step attempts where no one used Pensive AI averaged 321% more manual debug-log exploration actions than attempts where someone did (an observational comparison, not a causal claim).

Figure 1. Pensive AI architecture. Always-on error extraction and on-demand debugging complement each other and share log sources, the LLM gateway, tracing, and the cache. Archived logs feed offline evals and release gates.

The two paths complement each other. Error extraction improves an existing capability and is always on. It lets the user of a failed Maestro workload quickly check the parts of the logs that may point to an immediate root cause. It has low latency and low cost, and it can help in a large share of cases. On-demand debugging enables a new capability. It looks at symptoms across the logs and adds the LLM’s own knowledge and reasoning for a deeper analysis, at slightly higher latency and cost. Extraction gives a fast first look at every failure, and on-demand debugging triggered by the user goes deeper when that first look is not enough.

Part 1: Finding the useful errors

Legacy Pensive rules are precise, but each one captures a particular log shape. A simplified rule looks like this:

- name: SparkContainerOOM
logSource: GENIE_STDERR
restartable: false
regex: "Container.*is running beyond physical memory limits.*Killing container"
summary: Spark AM container runs out of memory

With Pensive AI, we wanted to find useful errors that had no corresponding rule and adapt more easily when familiar errors changed shape after a platform upgrade. Data Portal (our UI for data pipelines) surfaces these extracted errors when available and links back to the source logs, giving practitioners a focused starting point for triage. That raises a question: how can we ask a model to identify an error without asking it to repeat a long stack trace token by token?

Producing output tokens is much slower than reading input tokens. A direct transcription approach would make long errors expensive and slow. Instead, Pensive numbers the lines of each log and gives the model a sequence of {lineNumber, text} records. The model identifies the first and last lines of the error span, and Pensive reconstructs the selected text from its own log copy, leading to lower cost and better latency. This way, the model always returns two integers (start and end line number), whether the selected logs span a few lines or hundreds of lines. The displayed content comes directly from the original log, reducing hallucinations. The model can still choose the wrong range, which is why extraction quality remains an integral measurement for our AI evals, as we will discuss later.

For orchestrated workflows, “Pensive AI Error Extraction” runs automatically whenever a step fails. A step attempt is one execution of a step within a Maestro workflow. Maestro already calls Pensive for a regex-derived error and restartability classification, so AI extraction runs in the same request and returns its results alongside the established fields. The overall Pensive response must return within Maestro’s hard 90-second post-processing timeout for a failed step attempt.

Figure 2. Error extraction. Legacy rules always run. The AI call is bound by a shared deadline, and late calls are excluded. Pensive merges both results into one response and caches it.

That deadline shaped the extraction path. Pensive extracts errors from the logs in parallel to reduce latency, and the per-log calls share one deadline set well inside Maestro’s timeout limit. A per-log extraction call that misses the deadline is excluded from the result, allowing the overall request to return on time.

The data contract between Pensive AI and the various consumers needed the same care. The legacy data model contained one flattened error string; AI extraction instead returns a list of errors, one for each log source, with deep links back to the originating logs. Changing the old field in place would have broken existing clients. We introduced the new data model beside the legacy non-AI error extraction data model and continued producing both. Data Portal, our user interface for monitoring and observing data pipelines, preferred AI errors when available and fell back to the legacy value when they were not during the rollout. That allowed a gradual rollout and ensured that historical failures still display an error, since we chose not to backfill the old data due to log retention issues.

The migration is still in progress today. The Data Portal UI surface used for failed Maestro steps reads the new AI extracted error field today, while the query editor (for editing and running SQL), Workbench notebooks (managed compute platform and UI to edit and run jupyter based notebooks) and some slack clients calling Pensive still use the legacy error extraction path. Each client needs a compatible schema change before it can consume the new data. Keeping both fields populated lets teams adopt the new behavior at their own pace without forcing a coordinated cutover as we continue evolving Pensive AI.

Part 2: Full failure diagnosis and the product experience

Beyond error extraction, we built Pensive AI Debugging, a tool that analyzes failed step attempts and provides root-cause analysis and suggested remediations. It is available through programmatic APIs, MCP, and the product UI (Data Portal), all backed by a common entry point across the Netflix Data Platform. This shared model supports consistent behavior and custom product experiences.

This diagnosis still has to arrive quickly and remain consistent across investigations. A debugging response can take tens of seconds or a minute to generate, compared with a few seconds for error extraction. We run full AI-based debugging on demand instead of automatically, which keeps costs under control because most failed steps are never opened. We treat the failed step attempt, not the person who triggered it, as the unit of work, so everyone investigating the same failed attempt sees the same diagnosis.

That choice gives us a stable unit of work for caching. We cache each debugging response by step attempt. A second request becomes a key-value read instead of another AI inference call. The cache also prevents duplicate work, reducing latency and lowering costs further. This also means that a debugging generated in the Data Portal is cached and immediately retrieved for the MCP path instead of incurring another AI inference call. A conditional write creates an in-progress record, one caller starts generation, and other callers wait for the shared result to avoid conflicts when concurrent requests come in for the same step attempt failure. If generation remains in progress past an abandonment timeout, Pensive treats the record as abandoned and reclaims it. Completed responses expire after 90 days to help control costs and optimize storage because debugging requests for much older workloads are uncommon.

Pensive AI supports multiple ways to initiate debugging responses. A caller can (1) read a cached response, (2) generate one if no cache entry exists, or (3) regenerate and overwrite an existing response. Those semantics support the product UI, programmatic access, and the evaluation harness while keeping the response associated with a single immutable workload failure.

Figure 3. On-demand debugging. Three client actions share one entry point. A conditional write claims the step attempt. A cache hit returns the cached result. A won claim generates and streams a response, and the result persists even if the client disconnects.

For users, the most important behavior is that a long-running answer feels alive. Pensive streams the response as it is produced. The service emits server-sent events, and the GraphQL layer republishes them as a WebSocket subscription for the Data Portal client.

Each event carries the complete response generated so far. That duplicates a small amount of text, but it keeps the client simple: it does not need a replay buffer or token reassembly logic, and the next event corrects the display after a dropped or late event. Generation is independent of the connection that requested it. A disconnect does not cancel the work, and the final answer still reaches the cache. A hard reload can show a loading state and poll for the completed result. Within the single-page application backing the Data Portal UI, active streams are maintained independently of view and component lifecycle, so navigation does not interrupt a response in progress.

Part 3: Measuring and improving the behavior we want

LLM-assisted systems need more than a demo or a few working examples. Before shipping in production, we need confidence in both error extraction and debugging guidance, and we need to know that we have not regressed on failures that legacy Pensive already handled. We built separate evaluation frameworks focused on the two distinct jobs.

Building labeled data is often the expensive part of evaluation. For error extraction, legacy Pensive’s hand-written rules provide reference labels for failures they recognize. They also serve as excellent ground truth in most cases. We run those rules over production logs and compare their extracted spans with Pensive AI’s output. This gives us a reliable regression set without relabeling every example by hand, though it is not an absolute ground truth (since our human-built rules could also have been stale). For now, we keep these rules frozen as a label source. This lets us continue to build comparison evals and run them on top of the existing system.

Stable inputs are essential for repeatable evaluation experiments where we A/B test new models/configurations or context injections to improve response quality. The logs Pensive AI uses can expire after as few as seven days or as many as 30 days. Production Pensive AI requests archive fetched logs to S3 object storage asynchronously during workload execution time so the upload is not on the user-facing critical path. Uploads do not overwrite an existing object, preserving the exact snapshot used to create an evaluation case. Evals use those archived logs, so score changes remain attributable to the system under test. The archive also prevents parallel experiments from overloading the source systems and lets us run them without affecting production. Cached S3 log inputs further reduce costs when running evaluations.

Concretely, we measure four complementary signals for error extraction:

  • Inclusion: An LLM judge compares the legacy Pensive error for a failure with the errors Pensive AI extracted and determines whether the known error is still represented, even when wording differs.
  • Precision: A second judge sees only the extracted AI errors and evaluates whether each is meaningful and actionable on its own.
  • Repeated noise: A script looks across the whole dataset for lines that recur too often. A generic status line may look harmless in one answer but become distracting if it appears in a large share of failures. Lines appearing in more than about 30% of workflows are candidates for explicit exclusion. In practice, the exclusion list has only three lines, each of which otherwise appeared in nearly every extracted error.
  • Latency: We record the latency of every extraction call. Quality scores alone cannot reveal when an apparent improvement requires too much additional work, which often correlates with increased AI costs.

This combination gives us an actionable feedback loop. Prompt changes can reduce general noise, while the dataset-level view exposes the stubborn boilerplate that prompt changes do not eliminate. Existing rules act as a regression floor, and archived logs give us a repeatable way to compare changes. At Pensive AI’s scale, model and system choices must satisfy quality, latency, maintainability and cost constraints together.

To seed the debugging ground-truth dataset for evaluation, we mine internal engineering-support Slack threads and use an LLM to identify threads that link to an orchestrated workflow, describe a resolved problem, and match the class of issue Pensive AI handles. A second model synthesizes a reference debugging response from the relevant discussion. Paired with logs from that workflow failure, it becomes a concrete evaluation row in our evals dataset. This approach works only retrospectively, because Pensive AI in production aims to provide debugging guidance before such a Slack discussion happens.

We also made the debugging generation process visible. Tracing follows the request through Pensive, with child spans for each log fetch and extraction tool call. Our tracing backend based on Braintrust brings the prompt, completion, tool calls, and latency into a single view. During early product development, that visibility helped us inspect low-performing debugging responses in context instead of guessing which input or operation caused them. Tracing helped us improve the responses and fill context gaps even before we had comprehensive evals. In production, the API and UI return the trace identifier with the response, so feedback can lead directly to the trace for in-depth analysis.

Part 4: Keeping quality in the release path

Evaluation is not only for experiments with LLM orchestration, models, prompts, or context changes. Changes to log selection, trimming logic, or a source system can change what the model sees and therefore change extraction quality. We use the same evaluation harness and evaluators throughout local development and Pensive AI deployment so those effects are visible before users encounter them.

For each pull request, the code branch is deployed to an isolated preview environment and a CI job runs an experiment with our evals against that isolated environment. Precision and inclusion thresholds gate the merge. The job also runs after a build is promoted, catching interactions that were not present when individual pull requests were evaluated in isolation. If the promoted build misses its thresholds, it alerts the on-call engineer to investigate or roll back.

The evaluator runs on a schedule against production to surface gradual drift or external changes. Developers can also trigger evaluation experiments remotely while iterating, using the same deployed-environment path as CI. Consistent infrastructure makes the results comparable across local iteration, preview builds, promoted builds, and production.

Part 5: Looking for feedback signal from users

The system is only valuable if it reduces the amount of manual debugging and log chasing done by our users. We wanted a measurement that was available from product telemetry and close to the behavior Pensive AI was designed to change. Manual debug-log exploration became one of the main signals. The Pensive interface already offers links to logs for a failed step attempt. To estimate whether the feature reduced raw-log hunting, we compared failed step attempts where someone interacted with Pensive AI with those where no one did. The second group averaged 321% more manual debug-log exploration actions. This observational comparison does not establish causality or a specific reduction in mean time to resolution, but it suggests that focused diagnosis often allows practitioners to inspect fewer raw logs. Programmatic MCP access also lets teams build operational flows with their terminals or custom agentic experiences around the same diagnosis service.

Another more explicit signal we collect is thumbs up and thumbs down on the debugging response. These feedback signals land directly alongside the internal traces so we can quickly associate feedback to the complete log of inputs/outputs and the path the AI took to arrive at the answer. More importantly, we created an internal business-hours alerting system where each thumbs down response sends us a Slack alert. This was valuable to resolve a lot of rough edges and context gaps initially in the product and is helping us improve the product continuously even today.

Figure 4. Feedback loop. A thumbs up or down joins the exact LLM trace that produced the response, by the same logId stamped during generation. Traces and feedback feed ground truth and eval datasets, and each thumbs down sends a Slack alert during business hours.

Part 6: Future Work building on these foundations

Pensive AI is the foundation for more work that goes beyond diagnosis and recommended remediations. We are exploring “Pensive AI Deepthink,” an opt-in managed agentic experience with higher cost and latency. It builds on the precise, low-latency analysis produced by Pensive AI Debugging and gathers additional context from internal documentation, manuals, past Slack discussions, source code, read-only warehouse queries, and Spark execution details. A routing step directs the investigation to the appropriate skill, such as Spark failures, data-audit failures, or late workflows. This keeps the shared starting point stable and deterministic while allowing the investigation to become more specialized, further improving recall. We are also in talks with the Spark team to leverage Pensive AI responses for failure debugging analysis and A/B comparison for upcoming platform migrations.

We also plan to invest in “Pensive AI Error Classification”. Hard-to-maintain legacy rules also classify failures by restartability and by whether they are platform or user caused. Maestro acts on those labels and changes its retry behavior accordingly like failing fast or tuning the default number of retries (platform errors are tried more than user errors by default). Error classifications must meet a higher bar than error extractions and debugging alone. Moving the majority of the error classifications to AI would let us retire most of the remaining rule-maintenance burden and avoid retrying unknown failures that were unlikely to succeed. For restartability, the costliest error is classifying a recoverable failure as non-restartable, because Maestro will turn a step that could have been recovered into a hard failure, leading to end user alerts and manual remediations. The evaluation framework will need to be tuned around that outcome before AI-enabled classifications can take on those decisions. Equally important, we must avoid retrying non-transient failures that will not succeed, because retries waste compute and delay data pipelines.

Our work on Pensive AI in Data Platform addresses concrete user pain points in debugging, improves maintainability for platform owners, and improves precision and recall for error extraction. Pensive AI extends coverage to failures that legacy Pensive previously classified as unknown. Reliability comes from the system around the AI model calls: bounded error extractions, compatible client data contracts, responsive delivery, reproducible evaluations, caching and tracing, and release controls that keep quality and cost visible as the platform changes.

Part 7: Acknowledgements

This work would not have been possible without our stunning colleagues across Data Platform and our Data Engineering and Analytics partners who provided early feedback. While we cannot name everyone individually, we are deeply grateful for their contributions, which shaped both response quality and the product experience. Special thanks to Adith Swaminathan for advising on evaluations and inference improvements and acting as a thought partner. Thank you to the Orchestration team members, especially Deepak Ramalingam and Malcolm Ramirez for their additional engineering contributions.

For dogfooding and integrating Pensive AI as part of user support, we also thank the engineering support organization (ESO Team). We also thank Abhishek Kapatkar (Data Developer Experiences Team) and Emmie Dong (Data Movement Team) for their feedback to improve the Pensive AI integrations with the rest of the ecosystem. Special thanks to the AI Platform team (Kyle Ahn, Rob Mann) and Braintrust Team for helping with distributed tracing, evals infrastructure and model gateway runtime support.

We also thank Kamran Masood, Ely Spears, Ronald Leung, Anjali Norwood, Prashanth Ramdas, Charles Smith, Harikrishna Menon and other leaders for their constructive feedback and support on the Pensive AI project.


Making Failure Diagnosis Reliable with Pensive AI was originally published in Netflix TechBlog on Medium, where people are continuing the conversation by highlighting and responding to this story.

Multi‑Ratio Video Resizing for Mobile Feed and Marketing

Post Syndicated from Netflix Technology Blog original https://netflixtechblog.com/multi-ratio-video-resizing-for-mobile-feed-and-marketing-2e6b42810f49

Serdar Cellat, Yuchen Xie, Bernadette Marcu, Blaid Burgess, Cody Jarrett, Carlos Pereira, Qing Shi, Samuel Carvajal, Manuel Pamplona, Dorothy Jung, Feiko Ritsema, Benjamin Klein, Alex Woo, Eugene Lok, Anna Pulido, Rebecka Swe, Sanford Holsapple, Ranjith Kumar Shetty

Introduction

Clips in the Netflix mobile app.

At Netflix, a crucial part of our mission is ensuring our content looks stunning on any device. Vertical formats are increasingly important for Netflix, as we have 1.2B followers across our social media accounts, and have recently rolled out Clips, our vertical video feed in the Netflix mobile app. Traditionally, creating vertical assets meant editors and producers manually reframed horizontal videos in editing tools, a process that doesn’t scale as our catalog and use cases grow. To support both our in‑app feed and external marketing campaigns at scale, we built an automated multi‑ratio video cropping system, tightly integrated into our internal production tools, that can generate high‑quality vertical and other aspect‑ratio variants with minimal manual effort.

Our Video Resizing Approach

Converting cinematic 16:9 footage into mobile‑friendly aspect ratios takes more than a simple center crop. Filmmaking often involves dynamic character blocking and complex camera movement. We need an intelligent “virtual camera” that can follow the key action, respond to how each scene is composed, and produce crops that feel as intentional as the original shot.

We address this challenge by framing video resizing as a tracking and temporal optimization problem. Our pipeline processes each asset in three main stages, designed to produce 9:16, 4:5, and 1:1 crops in a single pass, without incurring additional computational overhead.

An overview of the three-stage process converting horizontal footage into mobile aspect ratios.

Shot Detection and Splitting

First, we segment the video into atomic shots using a neural‑network–based shot boundary detector. In many cases, shots contain multiple characters conversing on opposite sides of the frame. To better handle these scenarios, we use an Active Speaker Detection based approach to logically split a single continuous shot into multiple sub‑shots. This allows our virtual camera to cut and re-focus on different speakers as the conversation flows. Our Active Speaker Detection leverages an internal face detector and LipFlap to reliably identify active speakers in both live‑action and animated titles.

Shot splitting via Active Speaker Detection. The magenta box represents the dynamic vertical crop.

Focus Region Discovery

Once shots and sub‑shots are defined, we identify the most important region in each frame. We combine face detections with visual saliency maps to filter and prioritize the faces that should be in focus. In scenes with multiple characters, we further rank faces using signals such as active speaker status and relative size. Our model aggregates these cues with shot‑level content understanding to establish a continuous “focus region” for the virtual camera.

Blue box shows the focus region around the primary character for reframing.

Temporal Reframing

Once we’ve established the focus region, the next challenge is deciding how the crop should move over time. Tracking the focus region on a strict frame-by-frame basis would produce a shaky, distracting viewing experience, so we apply a set of heuristics that consider how the focus region moves over the course of a shot. When its displacement is small, we lock a static crop window that consistently covers the relevant area. When there is significant motion, we compute a dynamic tracking window and smooth its path so that any panning feels intentional and cinematic.

The vertical crop (magenta box) follows the character’s movement with a smooth panning path.

Tooling and Workflow Integration

We integrated the resizing algorithm directly into our internal Clips tool, so editors and producers can access it as part of their existing workflow. The interface enables them to automatically generate multiple aspect‑ratio versions of a clip with smart reframing. A unified in‑app module provides intuitive shot‑reframing controls, allowing users to review the algorithm’s crops, and quickly make targeted adjustments where needed.

For more complex shots or custom campaigns, producers can export the resizing parameters as XML and load them directly into external timeline editors such as Adobe Premiere. This allows agencies and external partners to start from the algorithm’s framing decisions instead of recreating crops manually or relying on tools like Premiere’s Auto Reframe. In our internal test, our resizing algorithm outperforms Auto Reframe on a curated evaluation set, so the XML export effectively brings those higher‑quality crops into external workflows. By bringing automated resizing and manual refinement into a single place, this pipeline significantly reduces production time and manual effort while preserving creative control.

Video resizing interface with reframing controls

Conclusion

Our work on multi-ratio video resizing is one step in a broader effort to make content creation more scalable, without compromising creative intent. By pairing algorithm-driven reframing with editor-friendly tools, we’ve reduced the time teams spend on repetitive resizing tasks and unlocked faster experimentation across mobile feeds and marketing campaigns. As we continue to broaden these capabilities to new formats and workflows, our goal remains the same: to give creatives more time to tell great stories, and to deliver a consistently high-quality viewing experience for our members and fans.


Multi‑Ratio Video Resizing for Mobile Feed and Marketing was originally published in Netflix TechBlog on Medium, where people are continuing the conversation by highlighting and responding to this story.

За София, Брюксел и трептенето на пеперудите

Post Syndicated from Анахит Хачикян original https://www.toest.bg/za-sofiya-bryuxel-i-trepteneto-na-peperudite/

За София, Брюксел и трептенето на пеперудите

Светът е едно голямо село, в което всички сме свързани и си взаимодействаме. И когато пеперуда потрепне с крилете си в единия край на планетата, може да причини цунами от другата страна на земното кълбо. Това не е мантра от древноизточно учение, а онагледяване на мястото на всяка държава в системата от международни отношения. Както и на рисковете, които поемаме, когато сами си избираме ролята на подвижния храст или заемаме неясна, разкрачена позиция между две воюващи страни, маскирайки я като неутралитет,

а светът ни удостоява с презрение на квадрат.

През изминалите две седмици България съвсем основателно беше включена в дневния ред на европейските институции заради ударите, извършени от Русия над кораби в Черно море, а българската външна политика се намести в кампанията за президентските избори. Европейският съвет, а после и Европейският парламент (ЕП) обсъдиха и съвсем категорично осъдиха руските атаки в Черно море, докато в България на държавно ниво все още хипотетично обсъждаха „неизвестния извършител“.

По време на срещата на 15–16 октомври в Брюксел Европейският съвет директно обвини Русия в нарушаване на международното и морското право. Седмица по-късно ЕП включи темата в дневния ред на пленарното заседание в Страсбург с участието на върховната представителка за външна политика Кая Калас и гласува резолюция, критикуваща липсата на адекватна реакция от страна на българското правителство.

В резолюцията, подготвена от пет политически групи и подкрепена с 432 гласа, евродепутатите изразяват

загриженост относно неясния отговор на българското правителство във връзка с руската заплаха,

съжаление относно слабата дипломатическа реакция на българското правителство спрямо Руската федерация

и призовават българския министър-председател Румен Радев да

съчетае призивите за съюзническа солидарност с конкретни действия.

Евродепутатите също изразяват съжаление във връзка със забавеното участие на България в инициативата на НАТО за противодействие на дронове и настоятелно призовават българското правителство да не отлага допълнително, а официално да потвърди до 30 октомври 2026 г. участието си в нея. Прави впечатление и колко пъти в резолюцията е споменат румънският президент Никушор Дан като осъждащ „агресивната незаконна война“ на Русия и как това контрастира с липсата на адекватна българска реакция.

Радев срещу Европарламента

Българска реакция след резолюцията имаше, но тя не ни представи в по-добра светлина. В открито обръщение към политическите групи в ЕП и председателката му Роберта Мецола министър-председателят Румен Радев остро разкритикува институцията, която според него

се използва като инструмент от български евродепутати с ограничена политическа легитимност в собствената им страна,

и омаловажи резолюцията като нямаща „правна стойност“. Според българския министър-председател ЕП – който е всъщност най-демократичната европейска институция, тъй като депутатите са пряко избрани от европейските граждани – е станал жертва на българските евродепутати, които подвеждат своите колеги, „за да водят обречена предизборна кампания на национално равнище“ в навечерието на президентските избори.

Така гневът на Радев излезе извън пределите на страната и беше отбелязан нов етап в отношенията между София и Брюксел, който е безпрецедентен за последните двайсет години, откакто България е член на ЕС. Първо, имаме национална позиция по отношение на външнополитическа тема, която е в пълен разрез с европейската линия. Второ, поставяме под съмнение институционалното функциониране, политическите инструменти (каквито са резолюциите) и разума на 720 депутати от 27 европейски държави, като ги обявяваме за заблудени.

Страдателният залог на генерал-премиера

„Онзи-който-не-бива-да-се-назовава“ продължава да потапя кораби в Черно море. Междувременно Румъния сваля дронове и укрепва отбраната си, а ние търсим доказателства и призоваваме безадресно за мораториуми. Колко струва снишаването, когато войната вече е на брега ни? От Емилия Милчева.

Как се пишат резолюции?

Как всъщност една тема влиза в дневния ред на ЕП и какво се случва с една резолюция, преди да бъде предложена за гласуване?

Резолюцията е политически текст, чрез който ЕП изразява позиция по даден актуален въпрос. Резолюциите нямат правен характер, но значението им е символно и политическо. Когато засягат външнополитически теми, резолюциите са гласът на Европа в света. Те могат да осъждат определени действия, да призовават за мерки, да отправят препоръки към други институции или да изискват политически отговор. Процедурата за приемане на една резолюция зависи от вида ѝ. В случая с резолюцията за Черно море тя беше свързана с пленарния дебат по същата тема два дни по-рано с участието на Кая Калас. По време на двучасовите дискусии евродепутатите дискутираха темата и разбира се, българските избраници бяха много активни. Още тогава обаче ясно се очерта разделителната линия между тях, която пролича и по време на гласуването.

Половината български евродепутати – осем от общо седемнайсет, подкрепиха резолюцията: Андрей Ковачев, Илия Лазаров, Ева Майдел, Андрей Новаков, Емил Радев (ГЕРБ), Танер Кабилов (ДПС), Илхан Кючюк (АПС) и Христо Петров („Продължаваме промяната“). Двама депутати от „Възраждане“ бяха против (Станислав Стоянов и Рада Лайкова). Двамата от БСП (Кристиан Вигенин и Цветелина Пенкова) и един от ДПС (Елена Йончева) се въздържаха. Четирима (Радан Кънев, Петър Волгин, Никола Минчев и Ивайло Вълчев) отсъстваха по време на гласуването, но Минчев („Продължаваме промяната“) участва в дебата.

Изказванията на българските депутати в пленарната зала отразяваха партийните им позиции на национално ниво, но бяха съобразени и с европейските политически групи, в които членуват. Така евродепутатите от ГЕРБ и от „Продължаваме промяната“ настояваха за европейска солидарност срещу руските атаки в съзвучие с позициите на Европейската народна партия (ЕНП) и „Обнови Европа“, а „Възраждане“ беше в тон с проруските убеждения на „Европа на суверенните нации“. Единственото разминаване дойде от страна на представителите на БСП, които се доближиха повече до крайната десница, настоявайки за мирни преговори и премълчавайки ролята на Русия като агресор в разрез с позициите на Групата на социалистите и демократите (СиД), в която БСП членува и която открито се противопоставя на Москва.

Разликите в позициите между различните групи проличаха и по време на преговорите по текста на резолюцията.

Първоначално бяха внесени седем различни предложения от различните политически групи. На основата на тези текстове се водиха преговори и се търсиха компромисни формулировки, за да се стигне накрая до едно консолидирано общо предложение, внесено от пет групи – Зелените, ЕНП, „Обнови Европа“, „Европа на консерваторите и реформистите“ и СиД. Параграфът, критикуващ слабата дипломатическа реакция на българското правителство и липсата на конкретни действия, е предложен от немския евродепутат Сергей Ягодински от Групата на Зелените, в която не членуват български евродепутати. Финалната подкрепа, която резолюцията получи от 60% от гласувалите, показва, че документът не изразява гледната точка на един депутат или една политическа група, а се превръща в официална и легитимна позиция на целия Европарламент. Тя е постигната след задълбочени и продължителни преговори и не може да бъде резултат от злонамерените действия на шепа депутати в опозиция, колкото и обиграни политици да са те.

Факт е, че партията на Радев „Прогресивна България“ (ПБ) няма свои представители в Брюксел, тъй като все още не съществуваше, когато се проведоха последните евроизбори през 2024 г. В момента всички български евродепутати (може би с изключение на тези от БСП) представляват опозиционни партии и това може да създаде допълнително напрежение в отношенията между София и Брюксел. Но дори сега да се състояха нови евроизбори, не би било ясно как ПБ би се позиционирала в ЕП, към коя политическа група би се присъединила и чии европейски политики би разпознала като свои. Двама от близките сподвижници на Радев вече са били евродепутати, но от БСП – от 2019 г. до 2024 г. Иво Христов и Петър Витанов са членували в Групата на социалистите и демократите в ЕП, но засега няма индикации, че те използват международните си контакти, за да позиционират партията на Радев в левия спектър на европейската политическа сцена.

За Радев и таралежите

Кое ще е европейското политическо семейство, което ще си сложи този „таралеж в гащите“ – да приеме в редиците си „Прогресивна България“? Анахит Хачикян разсъждава по темата и ни запознава с малкото изразени мнения на евродепутати за политическия проект на Радев.

От друга страна, скорошният конфликт по повод резолюцията за Черно море и поведението на левите евродепутати Кристиян Вигенин и Цветелина Петкова от БСП, както и на Елена Йончева (първо от БСП, а после от ДПС на Пеевски) демонстрират ясно подкрепата на БСП от Брюксел за ПБ. Макар че именно партията на Радев ускори парламентарната смърт на БСП, като изтегли много от членовете ѝ в своите редици и впоследствие столетницата дори не прескочи 4-процентовата бариера, за да влезе в парламента на последните избори. Разбира се, в контекста на президентските избори тази подкрепа е свързана и с кандидатурата на Илияна Йотова, която остава своеобразна топла връзка между БСП и ПБ, колкото и неясни да са отношенията между двете партии.

От създалата се ситуация може да се направят няколко извода.

Първо, мнозинството български евродепутати вече са схванали логиката на функциониране на ЕП и имат добро сътрудничество с европейските си колеги, които могат да мобилизират, за да защитават заедно европейските (вкл. българските) интереси. Това пролича непосредствено след ударите на кораби в Черно море, когато представители на ГЕРБ и „Продължаваме промяната“ се бяха задействали в рамките на политическите си групи и реагираха веднага там, където събитията ги завариха. Андрей Новаков и Емил Радев събраха колеги от ЕНП, която провеждаше в този момент външното си заседание в Италия, и обявиха, че организират посещение на делегация от Комисията по сигурност и отбрана на ЕП във Варна и София. Асен Василев и Никола Минчев от „Продължаваме промяната“ се солидаризираха с румънските си либерални колеги от „Съюз за спасението на Румъния“ и с подкрепата и подписа на Валери Айер, лидерка на „Обнови Европа“ в ЕП, изпратиха писмо до генералния секретар на НАТО Марк Рюте, в което настояват за мерки за засилване на сигурността в Черно море. Така те показаха нагледно не само че имат влияние в европейските политически семейства, към които принадлежат, а и че защитаването на българския национален интерес според тях съвпада с европейските политики по сигурността и отбраната.

Второ, дори в България да има правителство със силно парламентарно мнозинство, когато то води непопулярна външна политика в разрез с европейските си партньори, поставя страната в риск от международна изолация и значителни репутационни щети, без да споменаваме рисковете за сигурността и отбраната в случай на нападение.

Трето, когато българският министър-председател не познава механизмите на функциониране на институциите, в които страната ни членува от двайсет години, и не е в състояние да им засвидетелства поне минимално уважение, няма как да очакваме да изгради добро сътрудничество и да заема достойно място в тях. В този контекст разкрачената поза не е от най-далновидните и едва ли ще ни позволи навреме да видим дали сме от страната на пеперудите, или от тази на бързо приближаващото цунами.


Изразеното мнение е лично и не представлява позицията на Европейския парламент.

Reintroducing Code Classroom – now with the Blocks editor

Post Syndicated from Mel Farrington original https://www.raspberrypi.org/blog/reintroducing-code-classroom-now-with-the-blocks-editor/

Code Classroom — formerly known as the Code Editor for Education — is our free, safe tool for teaching and learning computing and programming. We’re delighted to share that Code Classroom now includes our new Blocks editor, based on the open-source Scratch editor.

With the Blocks editor, Code Classroom offers the familiar creative programming experience used by millions of young learners worldwide, plus all its helpful features for teachers. You can now inspire learners’ imagination and build their confidence through drag-and-drop coding in the same tool over 4500 schools already use to teach Python and web development. 

Early feedback on this Code Classroom addition has been very encouraging. One UK computer science teacher told us:

“I think it’s going to be hugely transformative for schools… Not just Scratch. Python, HTML and CSS… all in one platform is enormous.”

Bartholomew Owuor, a computer science  teacher at Cathsam School in Kenya said:

“When the coding blocks were introduced, I was able to widen my scope and to include so many learners from different ages.”

All Code Classroom features, including the Blocks editor, are now also available when you use Experience CS.

Made for the classroom

Code Classroom is built for schools and shaped by real teacher feedback. Every feature is designed around how teachers and students actually work.

  • Free forever: Completely free to use, with no hidden costs or subscriptions
  • Private by default: A secure environment designed for schools’ needs
  • Built-in classroom / learning management: Create classes, assign work, and track learner progress in one simple platform

Up and running in minutes

There’s no software to install and nothing for your school’s IT team to manage. Code Classroom runs in the browser, so you can set up your classes, add your students, and be ready to teach by your very next lesson.

Code Classroom is now also integrated with Google Classroom. That means you can import your existing classes with just a few clicks, which reduces setup time. With Google single sign-on for students, everything stays connected and easy to manage. You can spend less time on administration and more time on teaching.

Three ways to learn, one platform

  • Blocks editor: Where young people can drag and drop colourful blocks to code games, stories, and animations, learning core programming concepts without needing to type
  • Python editor: Where learners can move from typing their very first text-based program all the way to the skills and confidence to write and understand code
  • Web editor: Where young people can design and build their own web pages with text-based HTML and CSS

With all three editors in one place, you can support every student, whatever their coding experience.

The post Reintroducing Code Classroom – now with the Blocks editor appeared first on Raspberry Pi Foundation.

AWS Weekly Roundup: Amazon Polly Generative engine, TorchNeuron for Trainium, and more (October 26, 2026)

Post Syndicated from Daniel Abib original https://aws.amazon.com/blogs/aws/aws-weekly-roundup-amazon-polly-generative-engine-torchneuron-for-trainium-and-more-october-26-2026/

A few weeks ago I presented to a small group of commercial and technology leaders from Brazilian agribusiness at the AWS office in São Paulo. My talk ran through where generative AI fits across the different stages of an agribusiness operation, and the point I kept returning to is that the markets we call traditional are exactly the ones where keeping up with this technology decides who ends up ahead of the curve. Nobody there was arguing about whether AI belongs in agriculture. The questions were about delivery: who receives the output, in which language, on which device, often while driving between farms. That is why a launch I might otherwise have filed under routine leads my list this week. The Amazon Polly Generative engine upgrade added 14 new voices, two of them in Brazilian Portuguese. When your user has both hands on a steering wheel, the interface is a voice.

Presenting a session titled GenAI no Agronegocio Brasileiro to a group of agribusiness leaders seated around a boardroom table at the AWS office in Sao Paulo

Presenting “GenAI no Agronegócio Brasileiro” at the AWS office in São Paulo.

The rest of the week had a sharper edge. The biggest launch is a security service built on the premise that the gap between a vulnerability being disclosed and a vulnerability being exploited has effectively closed, and AWS published the honeypot evidence for exactly that in the same week. Now, let’s get into this week’s AWS news…

AWS Continuum for code vulnerabilities is now generally available
AWS Continuum reframes vulnerability management as an end-to-end job rather than a scanner that hands you a list. It builds a context graph from your repositories and your AWS environment, assigns each finding an evidence level, and reproduces exploitable findings in an isolated sandbox with proof-of-concept code so you see the issue rather than a severity label. It ranks issues by how close the attack path runs to business-critical systems, then opens the fix as a pull request. The control boundary matters: every remediation currently requires human approval, so you review and merge the pull request, with autonomous classes of fix gated behind confidence thresholds for the future.

The “why now” came from AWS’s own honeypots in the same week. Amazon Threat Intelligence found a PHP2Shell exploitation attempt in MadPot telemetry dated October 17, four days before CVE-2026-109618 and CVE-2026-109619 were publicly disclosed, and on disclosure day proof-of-concept exploits were circulating around 02:00 UTC, roughly twelve hours before the embargo was due to lift at 14:00 UTC. The practical reading is direct: a patch window measured in days assumes a delay that no longer exists, and an investigation should start from the earliest known exploitation rather than from the disclosure date. AWS also published the AWS WAF mitigations for the same CVEs. Continuum is available in US East (N. Virginia) and US West (Oregon).

Introducing Amazon ECS Gateway
Amazon ECS Gateway splits the work of exposing a service between the people who own the network and the people who own the application. Platform teams define one gateway with the organization’s subnets, security groups, TLS certificates, listener settings, and AWS WAF web ACLs. Application teams opt in by adding a gateway connector to the service definition, and ECS gives them an ACM certificate, a unique DNS hostname, listener rules, a target group, and a security group that admits traffic only from the Application Load Balancer.

The numbers make the economics clear: up to 25 services share a single ALB, ECS provisions the first ALB on first connect and removes ALBs when they are no longer needed, and a gateway can associate with up to 10,000 clusters, with five gateways per cluster. You can adopt it incrementally with UpdateService while your existing load balancer stays in place. Amazon ECS Gateway is available in all commercial Regions where Amazon ECS is available, at no additional charge.

Last week’s launches
Here are some launches that caught my attention this week.

Amazon Polly delivers a major upgrade to its Generative engine – The Generative engine now runs a larger, more expressive catalog: 57 generative voices across 11 languages and 25 locales, with 14 new voices across 9 locales and Hindi and Finnish generally available for the first time. Two of the new voices are Brazilian Portuguese, Leo and Carolina. It is a drop-in upgrade, so the voice names, the same SynthesizeSpeech call, and the price all stay the same while the output gets more natural.

AWS announces TorchNeuron: native PyTorch support for AWS Trainium (public beta) – TorchNeuron is an open source PyTorch backend that lets you run your model on Trainium by switching to .to(‘neuron’), a configuration change instead of a rewrite, with eager execution and torch.compile intact. It integrates with the Neuron Kernel Interface for custom operators, and it works on Trainium2 and Trainium3 instances. If you want the bigger picture on why hardware choice should not lock in your software, the AWS Insights piece on that theme is a good companion read, and the release lands alongside AWS Neuron 2.33.

New ways to customize models with Amazon SageMaker AI, without managing GPUs – Training sessions are now generally available, giving you control of the post-training loop, including custom loss functions and reward signals, while SageMaker AI handles GPU allocation, distributed execution, fault recovery, and checkpoint storage. You pay for the tokens SageMaker AI processes, and the meter stops while your reward function scores a batch. There is a full technical walkthrough, the training session APIs, and new support for Muse Glimmer, Qwen 3.8, and Ministral 3.

Structured outputs for Claude models available on Amazon Bedrock – You can now get schema-compliant JSON back from any Anthropic Claude model on Amazon Bedrock, across both the bedrock-runtime and bedrock-mantle endpoints, without custom parsing, retry logic, or post-processing. That makes jobs like pulling every required field from a financial report, parsing clinical notes, or routing support tickets by intent far more reliable to automate.

Amazon ElastiCache Serverless for Valkey now supports online migration with zero downtime – You can migrate self-managed Valkey or Redis OSS on Amazon EC2 into ElastiCache Serverless with zero downtime, meaning zero errors returned to the client during the move, measured the way the ElastiCache SLA measures availability. You prepare the migration, start the data sync, then choose a manual or automatic cutover, with no third-party replication tools. It is available in all commercial Regions, the China Regions, and the AWS GovCloud (US) Regions.

Other AWS news
Here are some additional projects and posts that you might find interesting.

Discover tools at runtime with AWS Agent Registry – AWS Agent Registry is a managed catalog for MCP servers, agents, and agent skills, so an orchestrator can search approved capabilities at runtime instead of compiling every tool in at build time. This walkthrough shows the discover, instantiate, and execute loop in a working sample, with search results that return connection metadata but never invocation credentials.

Tokenomics for coding agents: benchmark cost and quality on your own code – Coding assistants replay a growing transcript on every turn, so their cost math is nothing like ordinary inference. This post gives you open source tooling to measure model, harness, and hosting choices on your own repositories and build a cost-and-quality frontier you own, with sample results where routing came out 44.7 percent cheaper for 4.8 percent lower mean quality.

How U.S. Bank migrated 119 TB from Oracle Exadata to Amazon RDS for Oracle – U.S. Bank moved four Oracle Exadata databases totaling about 119 TB to Amazon RDS for Oracle using a config-driven pipeline built on Oracle XTTS, AWS DataSync, and Amazon EFS. The initial baseline copy finished in about 7 days with zero data loss and cutovers averaging roughly four hours per database, over a bandwidth-capped Direct Connect link.

Upcoming AWS events
Mark your calendars for these upcoming events.

AWS re:Invent – AWS re:Invent runs November 30 to December 4 in Las Vegas, with more than 2,200 sessions. The session catalog is live and reserved seating is open, so now is the time to build your schedule.

AWS Community Days – AWS Community Day Brasil Norte takes place in Belém on October 31, closing out the 2026 Brazilian community season. Check the hub for events near you.

That’s all for this week. Check back next Monday for another Weekly Roundup!

– Daniel

This post is part of our Weekly Roundup series. Check back each week for a quick roundup of interesting news and announcements from AWS!

Анти-примери в озеленяването – Harmony One

Post Syndicated from Боян Юруков original https://yurukov.net/blog/2026/ozelenyavane-4/

Озеленяването е задължителен и значителен елемент от всеки нов строеж. Доколкото има изисквания залегнали в ЗУТ, всеки град има свои наредби. В София специално се отнасят до дълбочината на почвения слой отстоянията от фасадата, стълбове и тротоарите и прочие. Целта е да се избегне посяването на дървета под тераси и каквото и да е озеленяване без почвен слой. Въпреки тези изисквания бутафорното озеленяване или практическата му липса е масово явление.

Приемателните комисии си затварят очите при издаване на акт 16, а в последствие контролът практически липсва. Положението е толкова лошо, че инвеститори в прав текст казват на контролите органи, че ще си бетонират и без това никаквата трева за паркоместа, а кашпите са под наем и ще бъдат преместени на следващия им обект веднага след заветния документ за ползване.

Опитвам се да разбера и покажа този проблем по няколко причини. Първо, защото има пряк ефект към качеството и безопасността на градската среда. Второ, защото при стриктно спазване на и без това доста леките изисквания за озеленяване интензивността и височината на застрояването ще намалеят до 30%. Не на последно място, защото за разлика от други нарушения като спестяването на материали, незаконния пясък и структурни проблеми, проблемите в озеленяването може да се видят с просто око и липсата на контрол и надзор е червен флаг и добра илюстрация за аналогичните над незаконното и некачественото строителсто като цяло.

Тук ще намерите някои от предишните ми статии по темата. Днес ще дам още един пример за такъв обект, които е класически пример за бутафорно озеленяване. Намира се на метри от другите, с които илюстрирах системния проблем преди

Harmony One

Строителите рекламират сградата, че е в кв. Изгрев, защото изглежда „по-елитно“, но в действителност е в Дианабад. По-важното е, че е построена върху имот, които според устройствения план трябва да е за обществено обслужване. Т.е. градина, училище, ресторант или нещо подобно. Не жилищна сграда. След дълъг процес и дела все пак Здравков издава заповед за изготвяне на ПУП в края на 2018 и разрешение за строеж през 2021 г. През 2025 г. Панайотова прави няколко съществени промени по разрешението – предимно във вътрешното устройство.

Устройствения план и разрешението предвиждат 20 метра височина, кинт от 3.0, минимално озеленяване от 30% и 10% от площа на имота да е във висока дървесна растителност. Когато говорим за максимална височина в документите, разбира се, архитектите се карат, че всъщност се имало предвид кота корниз, т.е. можело да се боцнат 1-2 етажа отгоре. Тук това е сторено и реалната височина е 25 метра и осем етажа. Последният на теория се води терасовиден.

Според кинт-а би трябвало разгърнатата застроена площта да е 4641. Разрешили са застроена площ до 732 кв. Според скиците подадени в кадастъра са застроили 573 и така с осем етажа РЗП-то пасва. Интересното обаче е, че рекламират последния етаж като апартамент от 352 кв. заедно с „неизползван плосък покрив“ от 171 кв. Даже на скицата е отбелязан като усвоени тераси, а на някои от визуализациите си се вижда, че от самото начало планират въпросния неизползван покрив да се затвори и остъкли.

Този апартамент вече е купен за разлика от 17% от останалите жилищата в сградата въпреки, че се строи от пет години. Това е обща тенденция, която се забелязва включително в т.н. „луксозен“ сегмент, в който до 40% от жилищата застояват. Затова и някои строежи се изоставят с години, други фирми фалират, а трети се обръщат към отчаяни рекламни тактики, бонуси и медийни кампании.

Тук ще се спрем обаче по-подробно на озеленяването. В галерията долу виждате различни изгледи от състоянието към края на октомври 2026 г. Първите две снимки показват липсата на дървета в задната част на сградата. Следващите четири показват 13 дървета забодени непосредствено пред терасите или направо под тях. Поне три от дърветата са в малки кашпи.

Изискването за тези дървета е да има поне метър от стъблото до издадени елементи на фасадата, което не е вярно за поне седем от тях. Кашпите на тези трите не са достатъчни за дори храст, а какво остава за дърво и не отговарят на наредбата. Останалите дървета нямат и достатъчен почвен слой. Преди да изсипят малкото пръст се виждаше, че дълбочината не е повече от 60 см. до бетонната плоча над гаражите при изискване от 120 см. Отделно лехите са много малки, а трябва да има поне 70 см. от стъблото във всички страни до паважа. Всичко това са абсолютно минимални и честно казано крайно недостатъчни изисквания, за да оцелее едно дърво.

Причината обаче да няма нормална дълбочина и широчина на лехите, както и дърветата да не са на по-голямо отстояние от фасадата е, че просто всичко това е предвидено за паркоместа и ще бъде бетонирано след няколко месеца. Вижда се ясно и в собствените им визуализации и брошури. Показал съм какво от озеленяването ще изчезне в 7-ма и 8-ма снимка. Дори сега не следва да се счита към задължителното озеленяване, тъй като дълбочината на почвения слой не отговаря на изискванията (9-та снимка).

На 10-та и 11-та снимка показвам разликите между рекламните визуализации и реалното изпълнение. Освен, че не са оставили достатъчно място за зелени площи, липсват всички дървета и храсти, които несъмнено са заложили в плана за озеленяване. Тук почвеният слой също е доста по-малък от изискванията – на места под 15 см. Лесно се проверява, но се виждаше лесно докато строяха сградата. Аналогично 12-та и 13-та снимка показват храстите и това, което трябва да се води за зелени площи под стрехите на сградата отзад. Надали някой очаква да оцелеят дълго така, но отново не отговарят на изискванията, за да считат към задължителното озеленяване.

Почуда будят други няколко кашпи сложени върху тротоара пред сградата. Технически отговарят на изискванията за 1 куб. метър почвен слой. Абсурдно е, че нормативно е позволено такова нещо, но в случая е изпълнено. Всеки арборист ще ви каже, че дърветата няма да оцелеят или пораснат отвъд това, което виждаме на снимката сега. В случая интересното е, че кашпите са върху общински имот. В червено на снимката е отбелязана частта на тротоара, която е общинска. На картата долу виждате къде са кашпите и къде минава границата на имота. Снимката е от iSofMap с изглед отгоре от 2024 г.

Единствената причина, която ми хрумва, да е позволено на строителят да слага такива кашпи на тротоара (ако въобще е позволено) е, че става въпрос за компенсаторно залесяване. Не ми е известно да е разрешено такова под тази форма. Възможно е да искат да не се паркира на тротоара, но това е по-лесно с колчета. По-скоро става въпрос за кашпи под наем колкото да мине акт 16. За целта обаче приемателната комисия трябва да си затвори очите, че въпросните „дървета под наем“ не са в самия имот.

Това може и да не е нужно. Имотът е 1547 кв.м. Длъжни са да имат 10% високо дървесно озеленяване. Ако приемем, че ония пръчки ще израстнат в дървета над 5 метра въпреки, че са долепени до терасите и въпреки, че нямат почвен слой и въпреки, че първата паркирана кола ще ги пречупи, то може да вземем щедрото 12.5 кв.м. на дърво. Така за да изпълнят минималните изисквания им трябват 13 дървета. Имат ги – ония същите от първите снимки горе. Нито едно от тях не отговаря на изискванията по наредбата на Столична община – повечето не отговарят на всички изисквания.

Това никога не изглежда да е спирало приемателната комисия до сега. Ако озеленяването на тази сграда мине акт 16, то личното ми мнение е, че поне няколко души от комисията следва да бъдат подведени под наказателна отговорност. Тъй като не следва да се съмняваме в професионалните качества на хората в тези комисии – нещо, което архитекти, инвеститори и самите ДНСК са ми изтъквали многократно, то разумен човек би останал единствено с разумното обяснение, че подобно затваряне на очите е обвързано с корупция или престъпление по служба. Разбира се, възможно е да греша и всъщност проектът да е бил позволен с нулево озеленяване или скрито изключение от нормативните изисквания. Тогава такава отговорността би следвало да се търси от издалия разрешението за строеж … който в момента ръководи ДНСК в София.

Друго интересно за тази сграда е, че е построена точно до колектора на река Новачица. Той минава точно през средата на имота. Непонятно е как е позволено строителство на такава сграда толкова близо до него. Докато лееха основите се виждаше, че колекторът тече и реката наводнява подземните гаражи. В последствие работниците там са споделяли същото. Предполагам, че са оправили проблема, но това ще се установи в бъдеще.

Какво следва?

Не знам дали сградата е минала приемателна комисия. Няма публична информация за това. Със сигурност районната община Изгрев ще има роля в този процес и следва да знаят. Районният кмет се беше похвалил преди години, че е водил дела да не се случва тази сграда заради колектора, но ги е загубил. Това би могло да значи, че този път ще обърне внимание на липсващото озеленяване и прекомерното застрояване и администрацията му няма да допусне сградата да мине метър за разлика от другите примери, които дадох.

Ще поискам плана за озеленяване на този имот и всички други документи, свързани с наблюденията ми на място. Вече получих тези за другите примери от тази серия статии. Спечелих две дела срещу ДНСК именно за актовете на приемателните комисии и скоро ще знам точно какво са разглеждали, подписал и за какво са си затворили очите. Ще научим и за тази сграда. Въпросът винаги е бил да не се налага – да не се позволява подобни своеволия още на ниво инвестиционен проект, ПУП и разрешение.

Прозрачността тук е ключова и всичко, което пиша е на база документите достъпни на страницата на общината. Трябва обаче документите за озеленяването, пожарната безопасност, транспортните анализи и всички други, които засягат безопасността и интересите на околните да бъдат публични по подразбиране. Административният съд категорично каза на два пъти, че документите на приемателната комисия и въобще пускането в експлоатация следва да са публични и да ги получаваме най-малкото по ЗДОИ. Надявам се скоро да научим повече.

The collective thoughts of the interwebz