Post Syndicated from Suleman Ahmad original http://blog.cloudflare.com/connection-coalescing-with-origin-frames-fewer-dns-queries-fewer-connections/

This blog reports and summarizes the contents of a Cloudflare research paper which appeared at the ACM Internet Measurement Conference, that measures and prototypes connection coalescing with ORIGIN Frames.

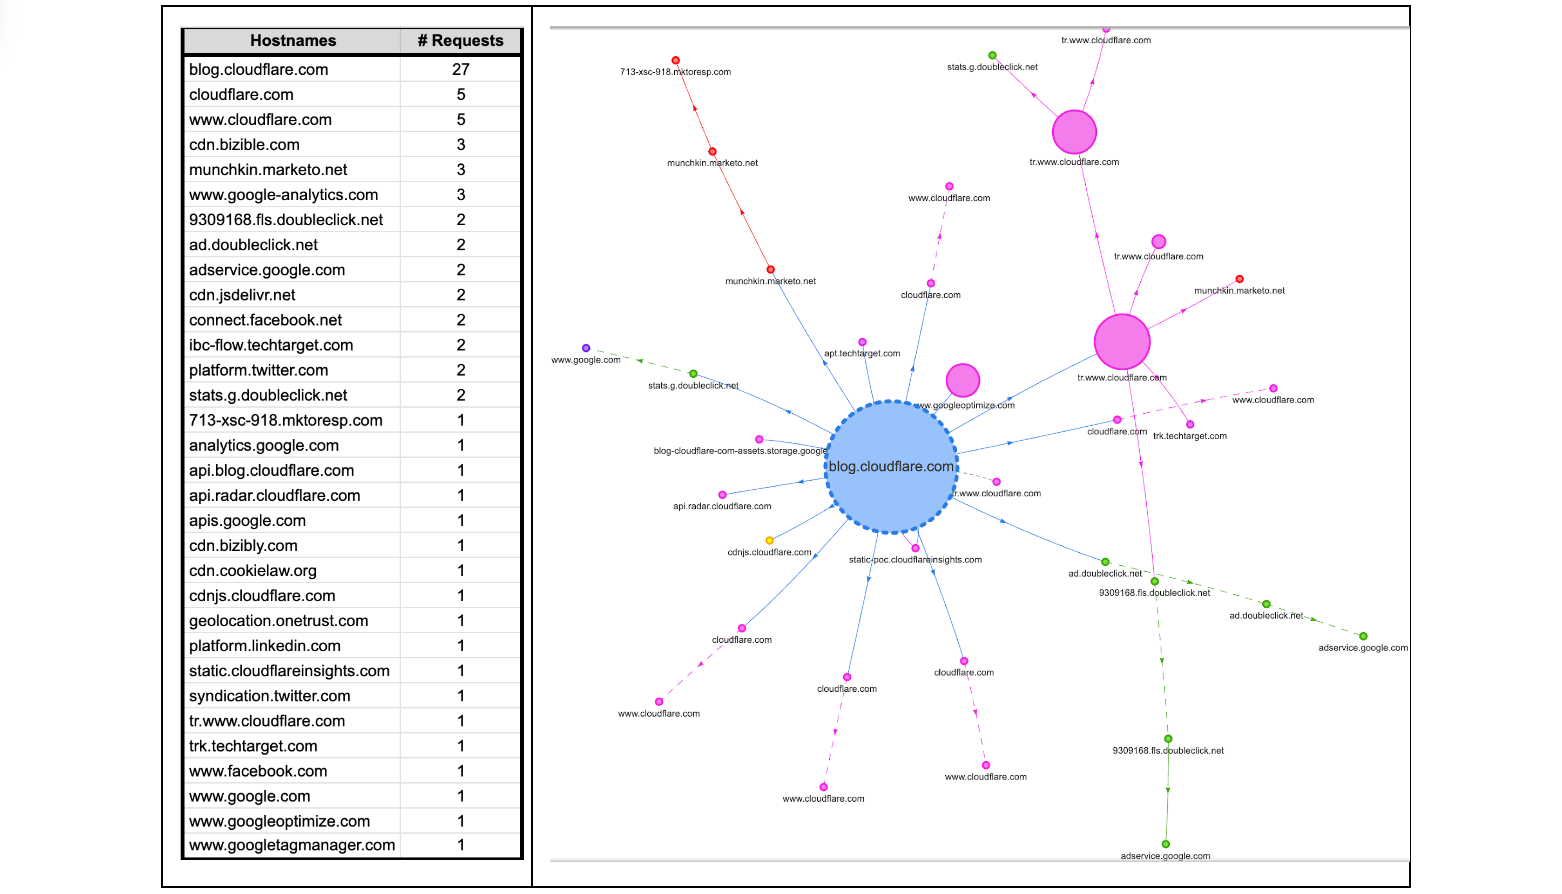
Some readers might be surprised to hear that a single visit to a web page can cause a browser to make tens, sometimes even hundreds, of web connections. Take this very blog as an example. If it is your first visit to the Cloudflare blog, or it has been a while since your last visit, your browser will make multiple connections to render the page. The browser will make DNS queries to find IP addresses corresponding to blog.cloudflare.com and then subsequent requests to retrieve any necessary subresources on the web page needed to successfully render the complete page. How many? Looking below, at the time of writing, there are 32 different hostnames used to load the Cloudflare Blog. That means 32 DNS queries and at least 32 TCP (or QUIC) connections, unless the client is able to reuse (or coalesce) some of those connections.
Each new web connection not only introduces additional load on a server's processing capabilities – potentially leading to scalability challenges during peak usage hours – but also exposes client metadata to the network, such as the plaintext hostnames being accessed by an individual. Such meta information can potentially reveal a user’s online activities and browsing behaviors to on-path network adversaries and eavesdroppers!
In this blog we’re going to take a closer look at “connection coalescing”. Since our initial look at IP-based coalescing in 2021, we have done further large-scale measurements and modeling across the Internet, to understand and predict if and where coalescing would work best. Since IP coalescing is difficult to manage at large scale, last year we implemented and experimented with a promising standard called the HTTP/2 ORIGIN Frame extension that we leveraged to coalesce connections to our edge without worrying about managing IP addresses.
All told, there are opportunities being missed by many large providers. We hope that this blog (and our publication at ACM IMC 2022 with full details) offers a first step that helps servers and clients take advantage of the ORIGIN Frame standard.
Setting the stage
At a high level, as a user navigates the web, the browser renders web pages by retrieving dependent subresources to construct the complete web page. This process bears a striking resemblance to the way physical products are assembled in a factory. In this sense, a modern web page can be considered like an assembly plant. It relies on a ‘supply chain’ of resources that are needed to produce the final product.
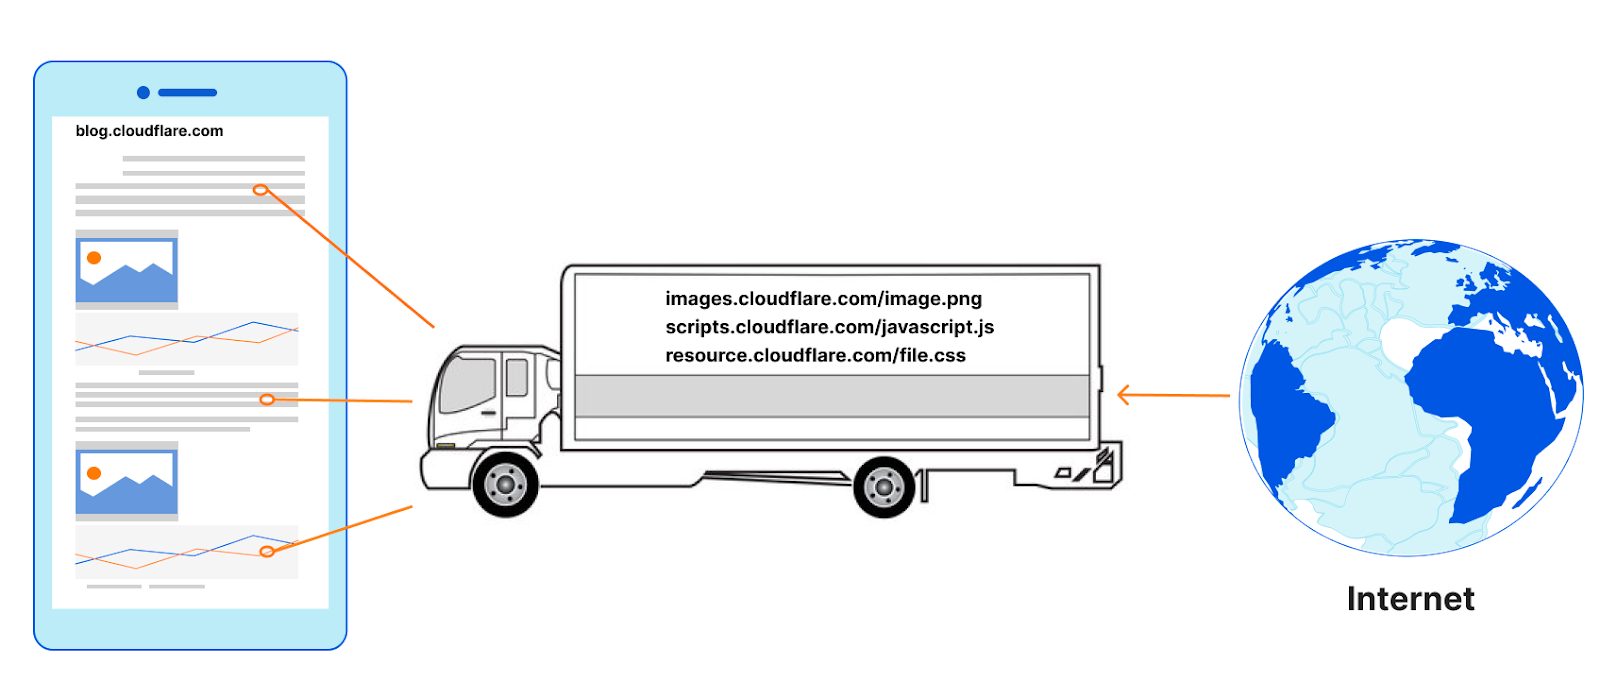
An assembly plant in the physical world can place a single order for different parts and get a single shipment from the supplier (similar to the kitting process for maximizing value and minimizing response time); no matter the manufacturer of those parts or where they are made — one ‘connection’ to the supplier is all that is needed. Any single truck from a supplier to an assembly plant can be filled with parts from multiple manufacturers.
The design of the web causes browsers to typically do the opposite in nature. To retrieve the images, JavaScript, and other resources on a web page (the parts), web clients (assembly plants) have to make at least one connection to every hostname (the manufacturers) defined in the HTML that is returned by the server (the supplier). It makes no difference if the connections to those hostnames go to the same server or not, for example they could go to a reverse proxy like Cloudflare. For each manufacturer a ‘new’ truck would be needed to transfer the materials to the assembly plant from the same supplier, or more formally, a new connection would need to be made to request a subresource from a hostname on the same web page.
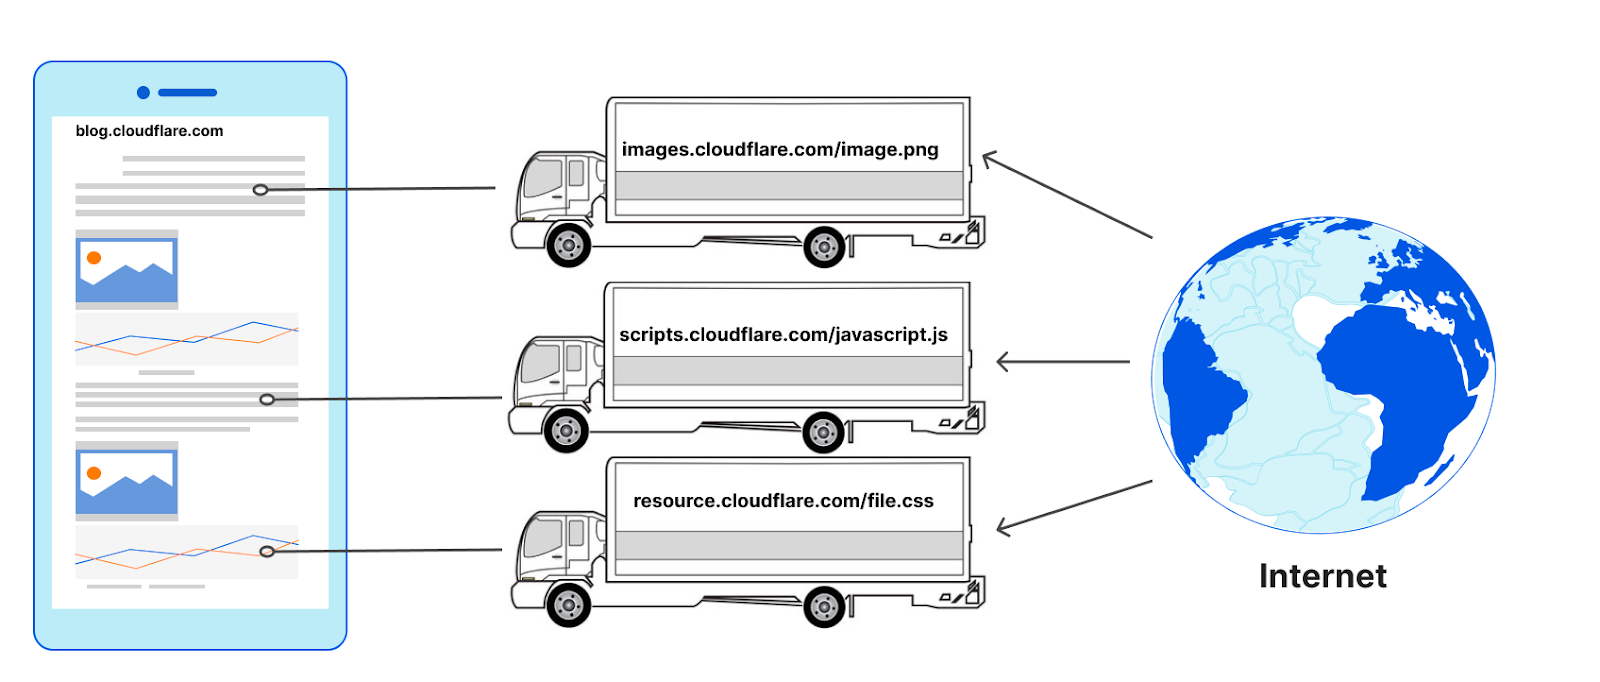
The number of connections used to load a web page can be surprisingly high. It is also common for the subresources to need yet other sub-subresources, and so new connections emerge as a result of earlier ones. Remember, too, that HTTP connections to hostnames are often preceded by DNS queries! Connection coalescing allows us to use fewer connections, or ‘reuse’ the same set of trucks to carry parts from multiple manufacturers from a single supplier.
Connection coalescing in principle
Connection coalescing was introduced in HTTP/2, and carried over into HTTP/3. We’ve blogged about connection coalescing previously (for a detailed primer we encourage going over that blog). While the idea is simple, implementing it can present a number of engineering challenges. For example, recall from above that there are 32 hostnames (at the time of writing) to load the web page you are reading right now. Among the 32 hostnames are 16 unique domains (defined as “Effective TLD+1”). Can we create fewer connections or ‘coalesce’ existing connections for each unique domain? The answer is ‘Yes, but it depends’.
The exact number of connections to load the blog page is not at all obvious, and hard to know. There may be 32 hostnames attached to 16 domains but, counter-intuitively, this does not mean the answer to “how many unique connections?” is 16. The true answer could be as few as one connection if all the hostnames are reachable at a single server; or as many as 32 independent connections if a different and distinct server is needed to access each individual hostname.
Connection reuse comes in many forms, so it’s important to define “connection coalescing” in the HTTP space. For example, the reuse of an existing TCP or TLS connection to a hostname to make multiple requests for subresources from that same hostname is connection reuse, but not coalescing.
Coalescing occurs when an existing TLS channel for some hostname can be repurposed or used for connecting to a different hostname. For example, upon visiting blog.cloudflare.com, the HTML points to subresources at cdnjs.cloudflare.com. To reuse the same TLS connection for the subresources, it is necessary for both hostnames to appear together in the TLS certificate's “Server Alternative Name (SAN)” list, but this step alone is not sufficient to convince browsers to coalesce. After all, the cdnjs.cloudflare.com service may or may not be reachable at the same server as blog.cloudflare.com, despite being on the same certificate. So how can the browser know? Coalescing only works if servers set up the right conditions, but clients have to decide whether to coalesce or not – thus, browsers require a signal to coalesce beyond the SANs list on the certificate. Revisiting our analogy, the assembly plant may order a part from a manufacturer directly, not knowing that the supplier already has the same part in its warehouse.
There are two explicit signals a browser can use to decide whether connections can be coalesced: one is IP-based, the other ORIGIN Frame-based. The former requires the server operators to tightly bind DNS records to the HTTP resources available on the server. This is difficult to manage and deploy, and actually creates a risky dependency, because you have to place all the resources behind a specific set or a single IP address. The way IP addresses influence coalescing decisions varies among browsers, with some choosing to be more conservative and others more permissive. Alternatively, the HTTP ORIGIN Frame is an easier signal for the servers to orchestrate; it’s also flexible and has graceful failure with no interruption to service (for a specification compliant implementation).
A foundational difference between both these coalescing signals is: IP-based coalescing signals are implicit, even accidental, and force clients to infer coalescing possibilities that may exist, or not. None of this is surprising since IP addresses are designed to have no real relationship with names! In contrast, ORIGIN Frame is an explicit signal from servers to clients that coalescing is available no matter what DNS says for any particular hostname.
We have experimented with IP-based coalescing previously; for the purpose of this blog we will take a deeper look at ORIGIN Frame-based coalescing.
What is the ORIGIN Frame standard?
The ORIGIN Frame is an extension to the HTTP/2 and HTTP/3 specification, a special Frame sent on stream 0 or the control stream of the connection respectively. The Frame allows the servers to send an ‘origin-set’ to the clients on an existing established TLS connection, which includes hostnames that it is authorized for and will not incur any HTTP 421 errors. Hostnames in the origin-set MUST also appear in the certificate SAN list for the server, even if those hostnames are announced on different IP addresses via DNS.
Specifically, two different steps are required:
- Web servers must send a list enumerating the Origin Set (the hostnames that a given connection might be used for) in the ORIGIN Frame extension.
- The TLS certificate returned by the web server must cover the additional hostnames being returned in the ORIGIN Frame in the DNS names SAN entries.
At a high-level ORIGIN Frames are a supplement to the TLS certificate that operators can attach to say, “Psst! Hey, client, here are the names in the SANs that are available on this connection — you can coalesce!” Since the ORIGIN Frame is not part of the certificate itself, its contents can be made to change independently. No new certificate is required. There is also no dependency on IP addresses. For a coalesceable hostname, existing TCP/QUIC+TLS connections can be reused without requiring new connections or DNS queries.
Many websites today rely on content which is served by CDNs, like Cloudflare CDN service. The practice of using external CDN services offers websites the advantages of speed, reliability, and reduces the load of content served by their origin servers. When both the website, and the resources are served by the same CDN, despite being different hostnames, owned by different entities, it opens up some very interesting opportunities for CDN operators to allow connections to be reused and coalesced since they can control both the certificate management and connection requests for sending ORIGIN frames on behalf of the real origin server.
Unfortunately, there has been no way to turn the possibilities enabled by ORIGIN Frame into practice. To the best of our knowledge, until today, there has been no server implementation that supports ORIGIN Frames. Among browsers, only Firefox supports ORIGIN Frames. Since IP coalescing is challenging and ORIGIN Frame has no deployed support, is the engineering time and energy to better support coalescing worth the investment? We decided to find out with a large-scale Internet-wide measurement to understand the opportunities and predict the possibilities, and then implemented the ORIGIN Frame to experiment on production traffic.
Experiment #1: What is the scale of required changes?
In February 2021, we collected data for 500K of the most popular websites on the Internet, using a modified Web Page Test on 100 virtual machines. An automated Chrome (v88) browser instance was launched for every visit to a web page to eliminate caching effects (because we wanted to understand coalescing, not caching). On successful completion of each session, Chrome developer tools were used to retrieve and write the page load data as an HTTP Archive format (HAR) file with a full timeline of events, as well as additional information about certificates and their validation. Additionally, we parsed the certificate chains for the root web page and new TLS connections triggered by subresource requests to (i) identify certificate issuers for the hostnames, (ii) inspect the presence of the Subject Alternative Name (SAN) extension, and (iii) validate that DNS names resolve to the IP address used. Further details about our methodology and results can be found in the technical paper.
The first step was to understand what resources are requested by web pages to successfully render the page contents, and where these resources were present on the Internet. Connection coalescing becomes possible when subresource domains are ideally co-located. We approximated the location of a domain by finding its corresponding autonomous system (AS). For example, the domain attached to cdnjs is reachable via AS 13335 in the BGP routing table, and that AS number belongs to Cloudflare. The figure below describes the percentage of web pages and the number of unique ASes needed to fully load a web page.
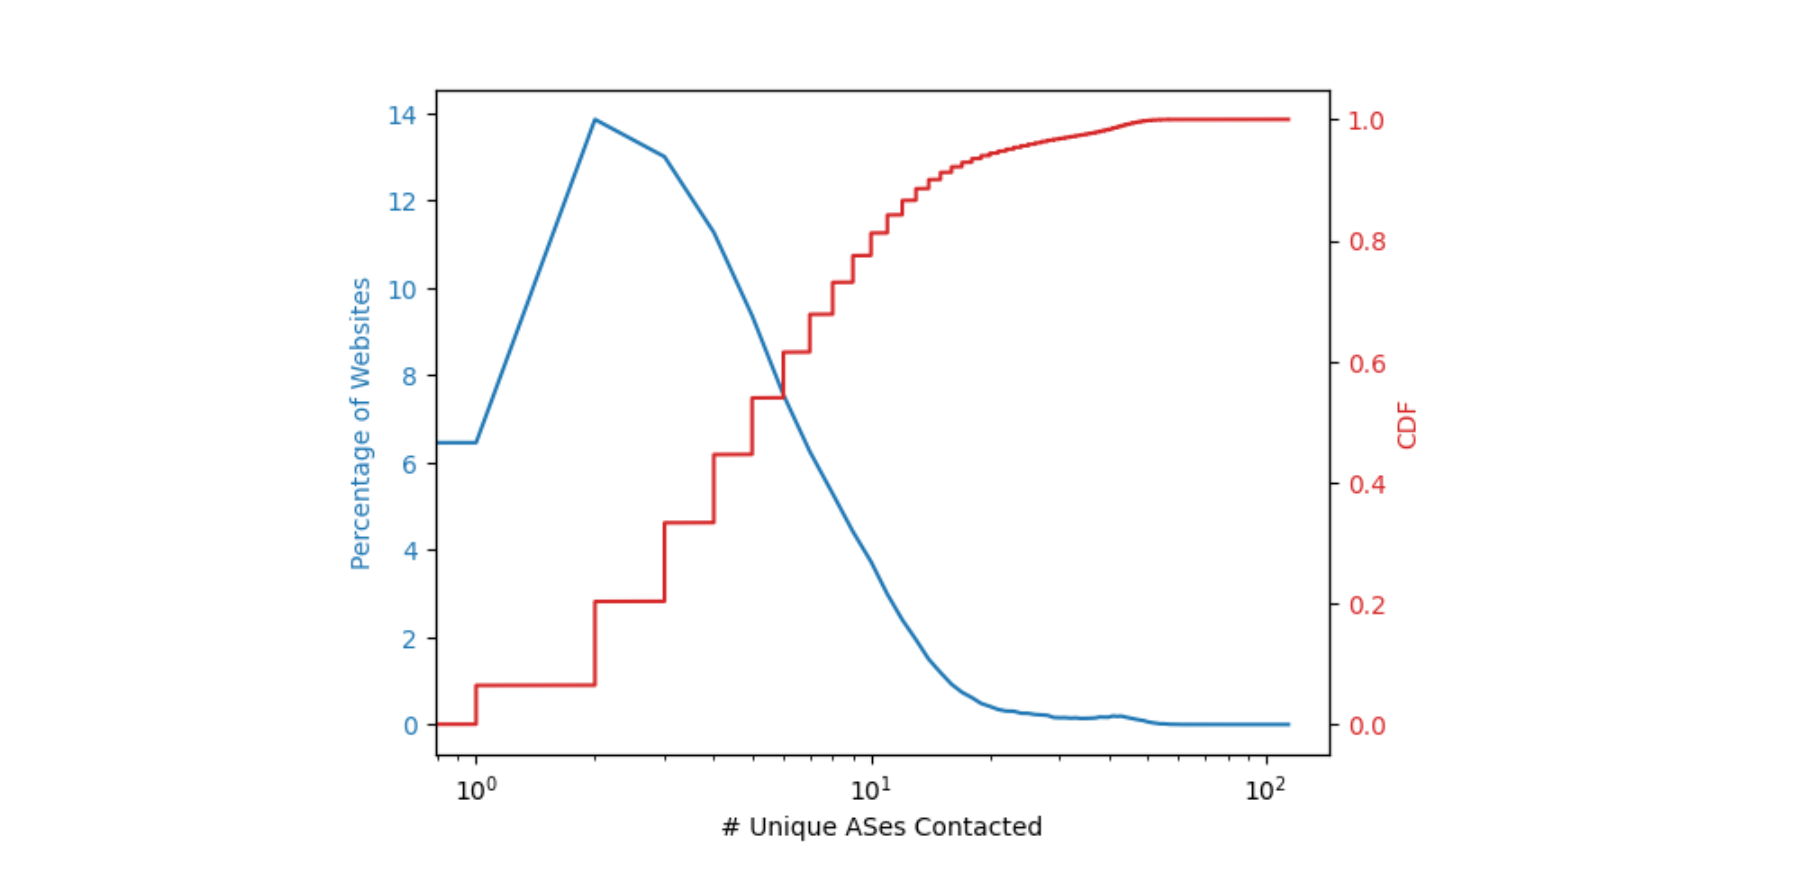
Around 14% of the web pages need two ASes to fully load i.e. pages that have a dependency on one additional AS for subresources. More than 50% of the web pages need to contact no more than six ASes to obtain all the necessary subresources. This finding as shown in the plot above implies that a relatively small number of operators serve the sub-resource content necessary for a majority (~50%) of the websites, and any usage of ORIGIN Frames would need only a few changes to have its intended impact. The potential for connection coalescing can therefore be optimistically approximated to the number of unique ASes needed to retrieve all subresources in a web page. In practice however, this may be superseded by operational factors such as SLAs or helped by flexible mappings between sockets, names, and IP addresses which we worked on previously at Cloudflare.
We then tried to understand the impact of coalescing on connection metrics. The measured and ideal number of DNS queries and TLS connections needed to load a web page are summarized by their CDFs in the figure below.
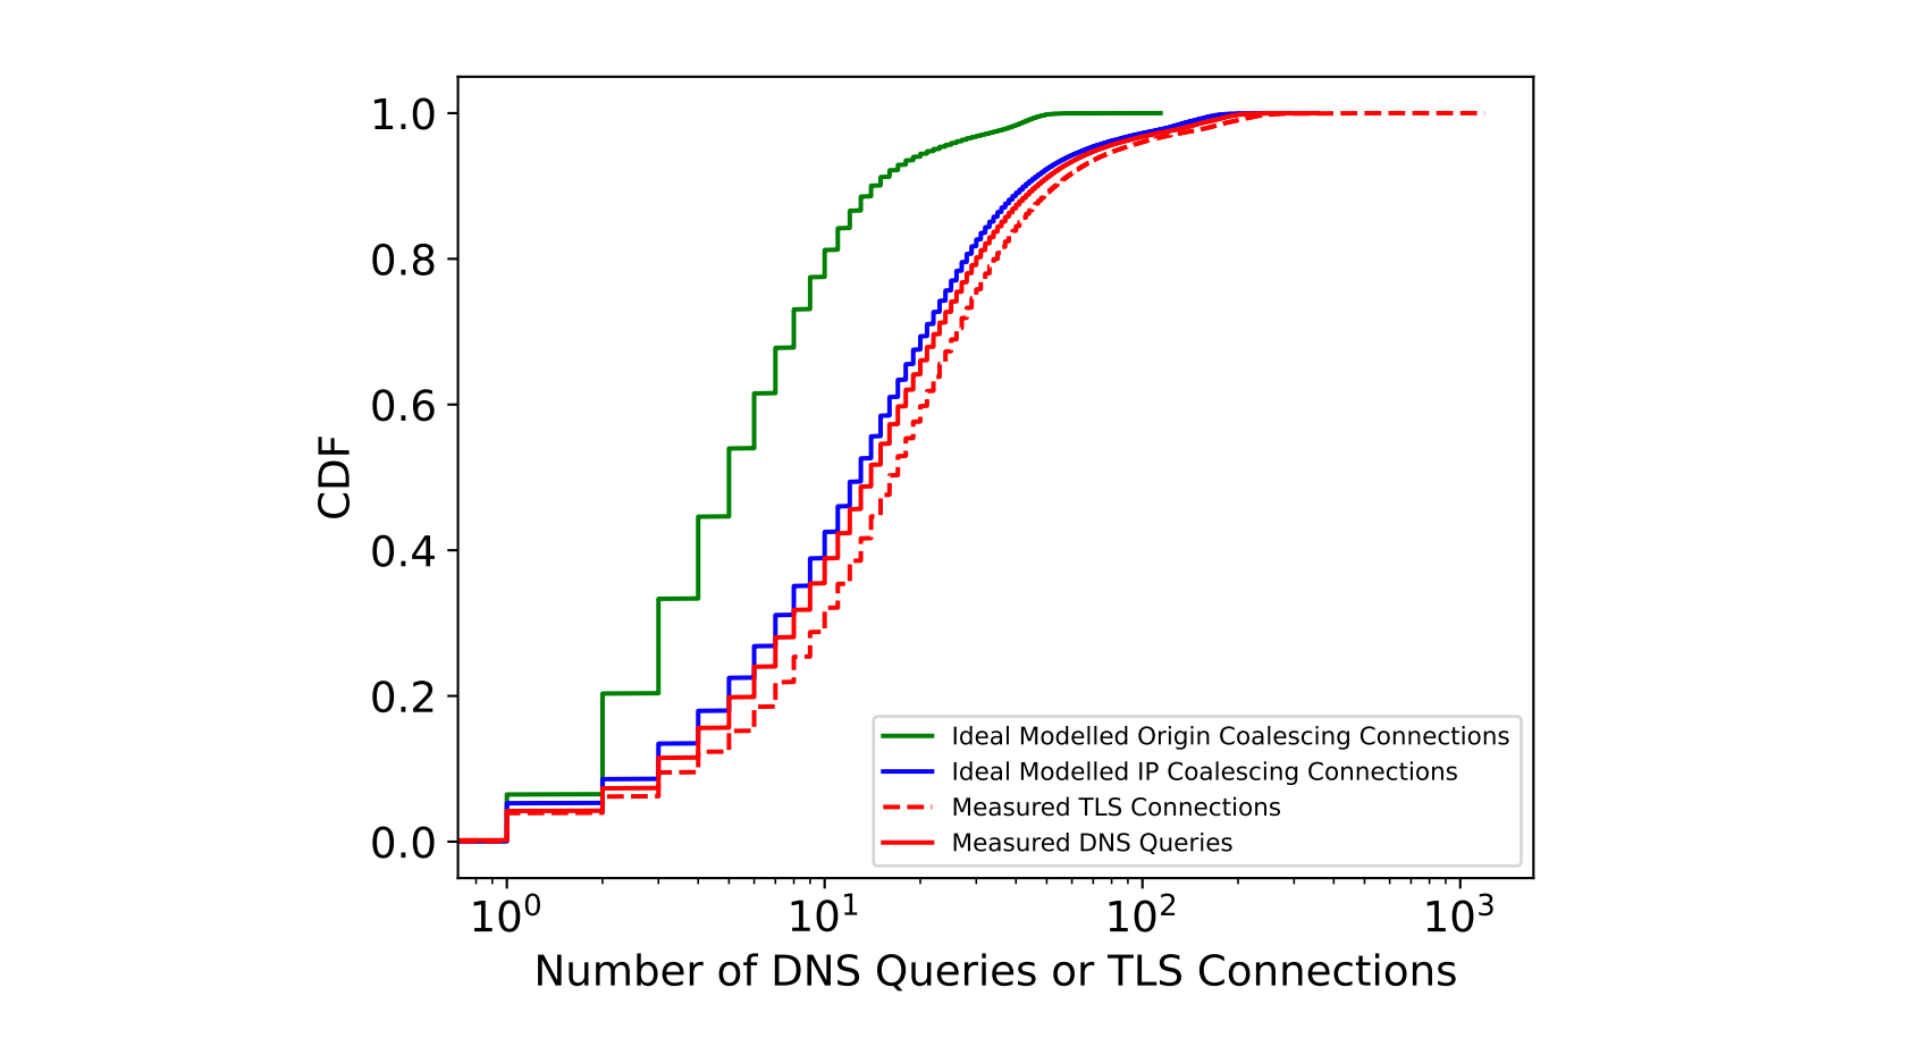
Through modeling and extensive analysis, we identify that connection coalescing through ORIGIN Frames could reduce the number of DNS and TLS connections made by browsers by over 60% at the median. We performed this modeling by identifying the number of times the clients requested DNS records, and combined them with the ideal ORIGIN Frames to serve.
Many multi-origin servers such as those operated by CDNs tend to reuse certificates and serve the same certificate with multiple DNS SAN entries. This allows the operators to manage fewer certificates through their creation and renewal cycles. While theoretically one can have millions of names in the certificate, creating such certificates is unreasonable and a challenge to manage effectively. By continuing to rely on existing certificates, our modeling measurements bring to light the volume of changes required to enable perfect coalescing, while presenting information about the scale of changes needed, as highlighted in the figure below.
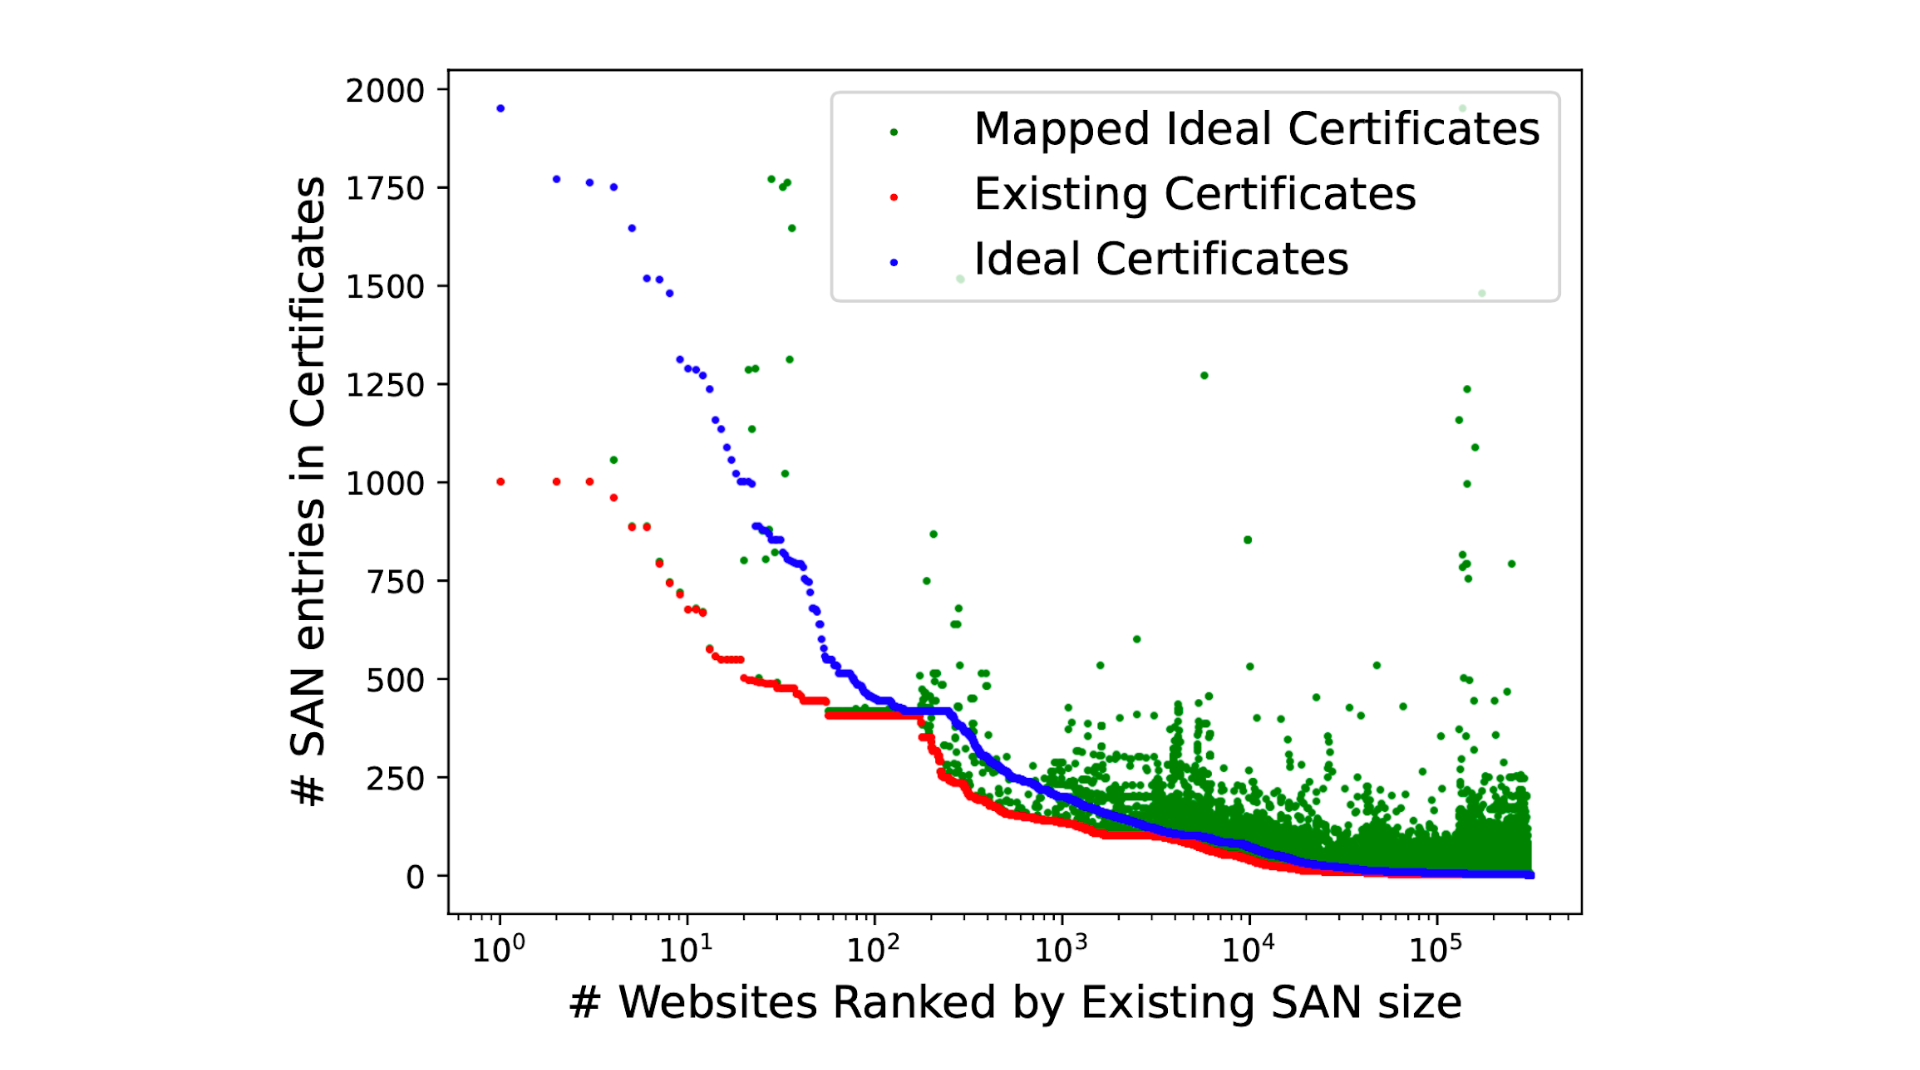
We identify that over 60% of the certificates served by websites do not need any modifications and could benefit from ORIGIN Frames, while with no more than 10 additions to the DNS SAN names in certificates we’re able to successfully coalesce connections to over 92% of the websites in our measurement. The most effective changes could be made by CDN providers by adding three or four of their most popular requested hostnames into each certificate.
Experiment #2: ORIGIN Frames in action
In order to validate our modeling expectations, we then took a more active approach in early 2022. Our next experiment focused on 5,000 websites that make extensive use of cdnjs.cloudflare.com as a subresource. By modifying our experimental TLS termination endpoint we deployed HTTP/2 ORIGIN Frame support as defined in the RFC standard. This involved changing the internal fork of net and http dependency modules of Golang which we have open sourced (see here, and here).
During the experiments, connecting to a website in the experiment set would return cdnjs.cloudflare.com in the ORIGIN frame, while the control set returned an arbitrary (unused) hostname. All existing edge certificates for the 5000 websites were also modified. For the experimental group, the corresponding certificates were renewed with cdnjs.cloudflare.com added to the SAN. To ensure integrity between control and experimental sets, control group domains certificates were also renewed with a valid and identical size third party domain used by none of the control domains. This is done to ensure that the relative size changes to the certificates is kept constant avoiding potential biases due to different certificate sizes. Our results were striking!
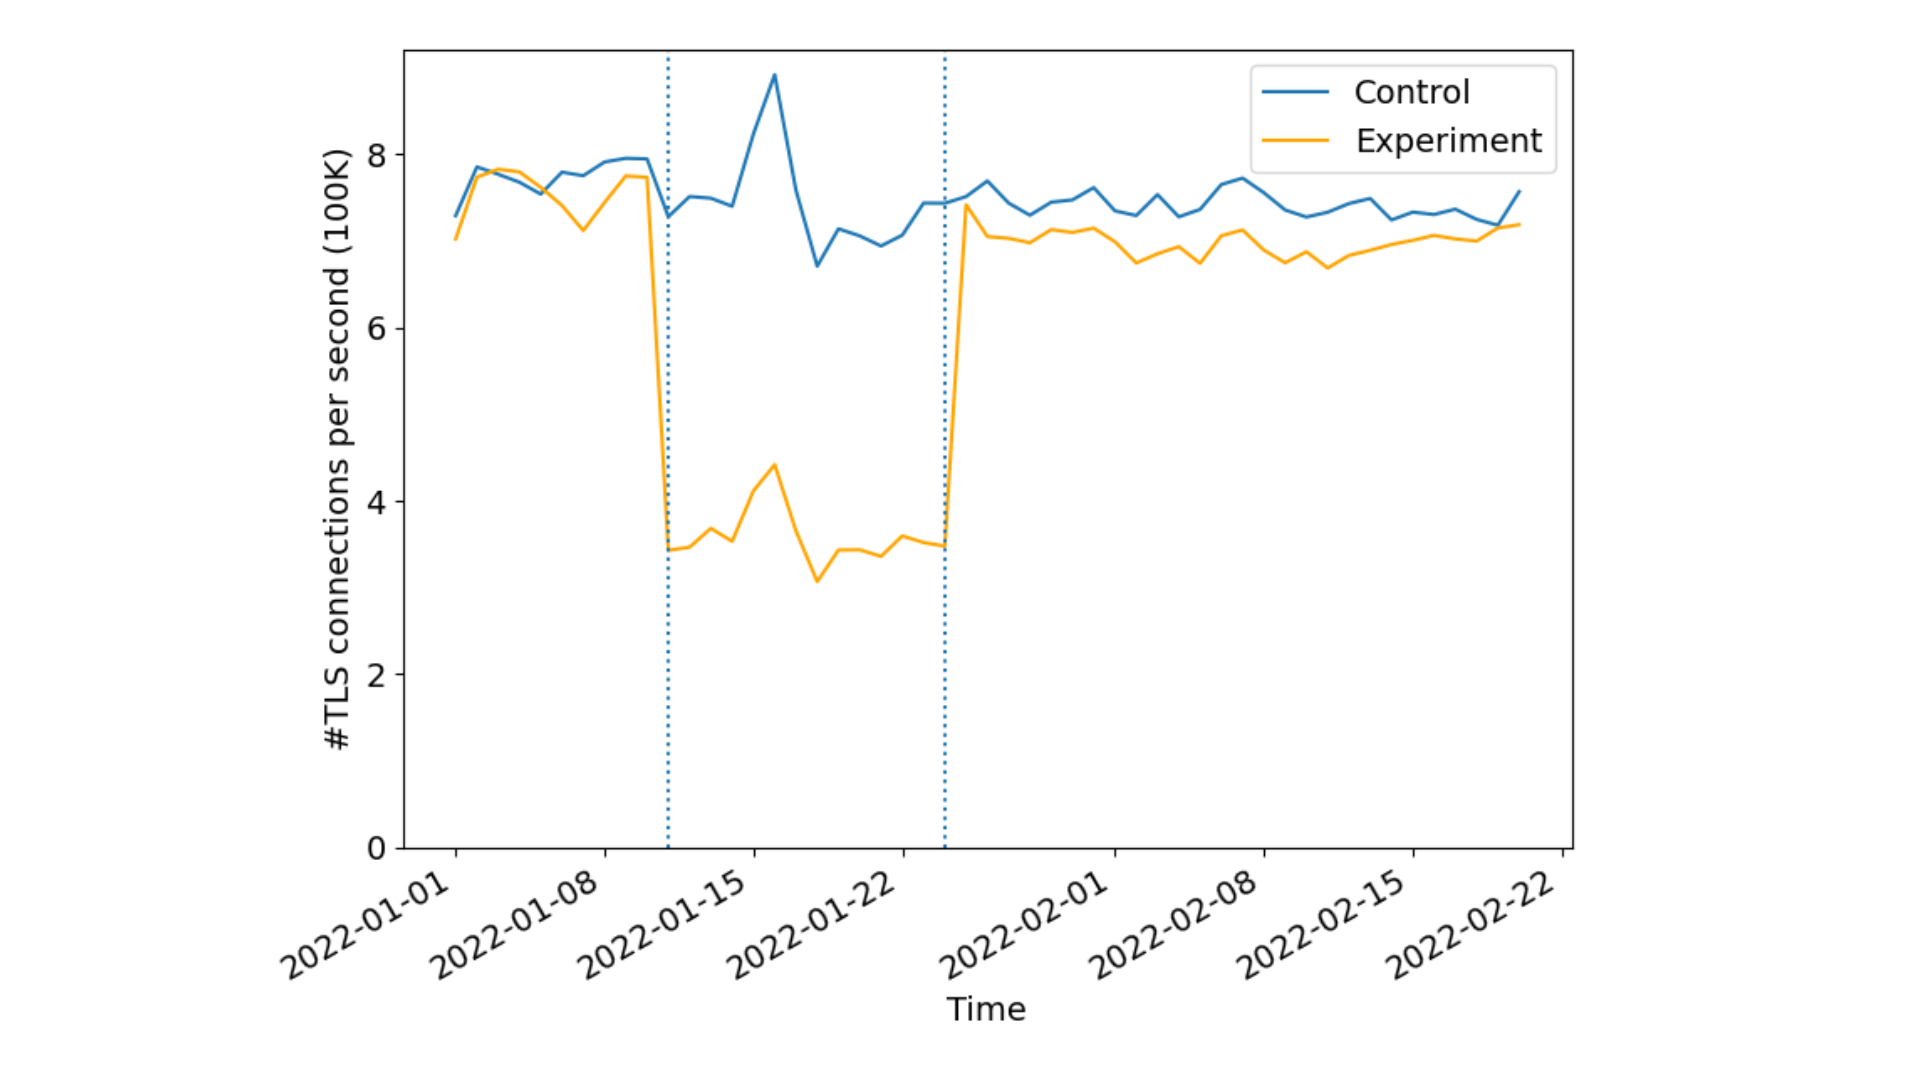
Sampling 1% of the requests we received from Firefox to the websites in the experiment, we identified over 50% reduction in new TLS connections per second indicating a lesser number of cryptographic verification operations done by both the client and reduced server compute overheads. As expected there were no differences in the control set indicating the effectiveness of connection re-use as seen by the CDN or server operators.
Discussion and insights
While our modeling measurements indicated that we could anticipate some performance improvements, in practice it was not significantly better suggesting that ‘no-worse’ is the appropriate mental model regarding performance. The subtle interplay between resource object sizes, competing connections, and congestion control is subject to network conditions. Bottleneck-share capacity, for example, diminishes as fewer connections compete for bottleneck resources on network links. It would be interesting to revisit these measurements as more operators deploy support on their servers for ORIGIN Frames.
Apart from performance, one major benefit of ORIGIN frames is in terms of privacy. How? Well, each coalesced connection hides client metadata that is otherwise leaked from non-coalesced connections. Certain resources on a web page are loaded depending on how one is interacting with the website. This means for every new connection for retrieving some resource from the server, TLS plaintext metadata like SNI (in the absence of Encrypted Client Hello) and at least one plaintext DNS query, if transmitted over UDP or TCP on port 53, is exposed to the network. Coalescing connections helps remove the need for browsers to open new TLS connections, and the need to do extra DNS queries. This prevents metadata leakage from anyone listening on the network. ORIGIN Frames help minimize those signals from the network path, improving privacy by reducing the amount of cleartext information leaked on path to network eavesdroppers.
While the browsers benefit from reduced cryptographic computations needed to verify multiple certificates, a major advantage comes from the fact that it opens up very interesting future opportunities for resource scheduling at the endpoints (the browsers, and the origin servers) such as prioritization, or recent proposals like HTTP early hints to provide clients experiences where connections are not overloaded or competing for those resources. When coupled with CERTIFICATE Frames IETF draft, we can further eliminate the need for manual certificate modifications as a server can prove its authority of hostnames after connection establishment without any additional SAN entries on the website’s TLS certificate.
Conclusion and call to action
In summary, the current Internet ecosystem has a lot of opportunities for connection coalescing with only a few changes to certificates and their server infrastructure. Servers can significantly reduce the number of TLS handshakes by roughly 50%, while reducing the number of render blocking DNS queries by over 60%. Clients additionally reap these benefits in privacy by reducing cleartext DNS exposure to network on-lookers.
To help make this a reality we are currently planning to add support for both HTTP/2 and HTTP/3 ORIGIN Frames for our customers. We also encourage other operators that manage third party resources to adopt support of ORIGIN Frame to improve the Internet ecosystem.
Our paper submission was accepted to the ACM Internet Measurement Conference 2022 and is available for download. If you’d like to work on projects like this, where you get to see the rubber meet the road for new standards, visit our careers page!