Tag Archives: Advanced (300)

How to detect suspicious activity in your AWS account by using private decoy resources

Post Syndicated from Maitreya Ranganath original https://aws.amazon.com/blogs/security/how-to-detect-suspicious-activity-in-your-aws-account-by-using-private-decoy-resources/

As customers mature their security posture on Amazon Web Services (AWS), they are adopting multiple ways to detect suspicious behavior and notify response teams or workflows to take action. One example is using Amazon GuardDuty to monitor AWS accounts and workloads for malicious activity and deliver detailed security findings for visibility and remediation. Another tactic is to deploy decoys, also called honeypots, as an effective way to detect suspicious behavior.

In this blog post, we’ll show how you can create low-cost private decoy AWS resources in your AWS accounts and configure them to generate alerts when they are accessed. These decoy resources appear legitimate but don’t contain any useful or sensitive data and typically are not accessed in the normal course of business by your users and systems. Any attempt to access them is a clear signal of suspicious activity that should be investigated. You can use data sources like AWS CloudTrail, services like Amazon Detective, and your own security incident and event monitoring (SIEM) systems to investigate the activity further. This post is aimed at experienced AWS users and security professionals.

Detecting suspicious activity

Imagine that an unauthorized user has obtained credentials for your account. This could also be an insider, malicious or careless, using their valid credentials inappropriately. The unauthorized user might use these credentials to invoke AWS API calls to list resources in your account. As the next step, they might try to access resources that are commonly used to store sensitive data—such as objects in Amazon Simple Storage Service (Amazon S3) buckets, secrets in AWS Secrets Manager, or items in Amazon DynamoDB. They might also try to elevate their privileges by assuming other Identity and Access Management (IAM) roles in your account. In your role as a security professional, your task is to detect this suspicious behaviour and take actions in response. One approach is to learn the baseline of activities of the IAM users and roles in your account and flag any deviations from the learned baseline—this is the approach taken by GuardDuty when it generates findings such as Discovery:IAMUser/AnomalousBehavior.

This post focuses on another approach of creating private decoy resources in your account that are intended to look legitimate, but don’t have any useful or sensitive data and are not exposed publicly. These decoys are designed to alert you about suspicious activities that could indicate AWS credentials exposure or account compromise. You can use the decoys in conjunction with other techniques, such as creating deception environments and public and private honeypots to better detect suspicious activity in your accounts and applications.

The Fidelity-Isolation-Cost trilemma

In an ACM Queue article titled Lamboozling Attackers: A New Generation of Deception, Kelly Shortridge and Ryan Petrich introduced the Fidelity-Isolation-Cost (FIC) trilemma that “captures the most important dimensions of designing deception systems: fidelity, isolation, and cost.” Using their definition of the FIC trilemma, we see that decoy AWS resources can be well suited to designing deception systems:

  • Fidelity – Because the decoys are actual AWS resources, they behave like other legitimate resources and have high fidelity. For example, a decoy S3 bucket behaves exactly like any other S3 bucket, with the only exception being that the object data it contains is dummy and not useful. However, the unauthorized user only discovers this fact after downloading the object data and generating an automated alert to your security team.
  • Isolation – You can simply isolate the decoy AWS resources from other resources in the same account. For example, an S3 bucket is inherently isolated from other S3 buckets in the same account. An unauthorized user that can read the decoy S3 bucket does not, by doing so, get the ability to access or impact the availability of other resources in the account. The credentials obtained by the unauthorized user might have permissions to actions on other services, but the presence of the decoy S3 bucket doesn’t add to those permissions in any way.
  • Cost – You can keep the cost of deception low by choosing AWS resources that have no cost or low cost to deploy, are deployed by means of automation, and require no further operation or maintenance effort. For example, an S3 bucket with several files that are a few MB in size costs a fraction of a US cent per month for storage. The API request cost should be zero, because the bucket is designed never to be accessed in the normal course of business. Choosing similar zero or low-cost resources can make it cost-effective and feasible to create such decoy resources in multiple accounts, including in Production accounts, where it’s especially important to detect suspicious activity.

Examples of private decoy AWS resources

The following table shows examples of private decoy AWS resources that are high-fidelity, high-isolation, low-cost and are suitable to be deployed in an account that has sensitive data or applications. The table also lists the CloudTrail event fields that provide the source and name for accesses to each resource. You can use these CloudTrail events to create corresponding Amazon EventBridge rules that will generate alerts and notifications.

Private decoy resource CloudTrail event source CloudTrail event names Considerations
S3 bucket and S3 objects with dummy data s3.amazonaws.com GetObject
HeadObject
Ensure that the S3 objects do not contain any sensitive data.

S3 data events must be enabled in CloudTrail for the decoy S3 bucket

IAM role that should never be assumed sts.amazonaws.com AssumeRole Ensure that the IAM policies attached to this role allow access only to decoy resources and no other data or resources.

Ensure that the IAM role’s trust policy only trusts principals in the same account to assume the role.

Secrets Manager secret (See Note at end of table) kms.amazonaws.com Decrypt Ensure that the secret value does not contain any sensitive data.
AWS Systems Manager Parameter Store parameter (See Note at end of table) kms.amazonaws.com Decrypt Ensure that the parameter value does not contain any sensitive data.
DynamoDB table that contains items with dummy data dynamodb.amazonaws.com BatchExecuteStatement
BatchGetItem
BatchWriteItem
DeleteItem
ExecuteStatement
ExecuteTransaction
GetItem
PutItem
Query
Scan
TransactGetItems
TransactWriteItems
UpdateItem
Ensure that the item does not have any sensitive data.

DynamoDB data events must be enabled in CloudTrail for the decoy DynamoDB table.

Note: When CloudTrail Management API events are sent to EventBridge, read-only events such as Get*, List*, and Describe* are filtered out and not processed. In order to get findings for secrets and Systems Manager parameters that are being accessed, you need to alert on GetSecretValue and GetParameter API calls. Since these are not processed by EventBridge, you can instead use the fact that secrets and secure string parameters are encrypted by using AWS Key Management Service (AWS KMS), and match on the corresponding AWS KMS Decrypt API calls. This means that successful calls from an unauthorized user to GetSecretValue and GetParameter are able to be matched and alerted on.

Notifications from matching EventBridge rules can be sent to an AWS Lambda function that generates custom findings in Security Hub. These findings can then be sent to downstream systems that you might have configured in your environment, such as your SIEM system or an automated response workflow in your Security Orchestration, Automation, and Response system. Figure 1 shows this workflow.

Figure 1: Accesses to decoy resources automatically create custom Security Hub findings

Figure 1: Accesses to decoy resources automatically create custom Security Hub findings

Deploy the private decoy resources

We’ve provided an AWS CloudFormation template that you can use to deploy the solution. The template creates the following private decoy AWS resources in your account:

  • DynamoDB table
  • IAM role
  • S3 bucket with a decoy S3 object
  • Systems Manager SecureString parameter
  • Secrets Manager secret

In addition, the CloudFormation template deploys the following resources in your account to detect accesses to the decoys and send custom findings to Security Hub:

  • A CloudTrail data events trail that includes only data events from the decoy S3 bucket and DynamoDB table
  • Six EventBridge rules to match specific CloudTrail API events
  • Two Lambda functions with corresponding IAM roles:
    • The WriteData Lambda function is a CloudFormation custom resource that is used to create the decoy S3 object and the Systems Manager SecureString parameter
    • The Data Lambda function is a target for the EventBridge rules, and it sends custom findings to Security Hub when the decoy resources are accessed

Prerequisites

The prerequisites to deploying the solution are as follows:

  • Security Hub must be enabled in the AWS Regions where the private decoys will be deployed, in order to receive custom findings.
  • You must have created a CloudTrail trail to log management events for the AWS account in the Region where you deploy the private decoys. This trail can be created locally in the account or can be an organization trail. Ensure that you have enabled both read and write events, and enabled all AWS KMS events in the trail (this is the default configuration).

Deploy the solution

After you have the prerequisites set up, you can launch the CloudFormation template to deploy the private decoys.

To launch the template

  1. Choose the following Launch Stack button to launch a CloudFormation stack in your account.

    Launch Stack

    Note: The stack will launch in the N. Virginia (us-east-1) Region. To deploy this solution into other AWS Regions, download the solution’s CloudFormation template, modify it, and deploy it to the selected Region. In order to get maximum coverage for detecting suspicious activity, we recommend that you deploy the solution into your key production accounts and Regions.

  2. On the Specify stack details page, enter the stack name, then choose Next.

    The CloudFormation template will use the stack name as part of the naming of the resources that are created. We recommend that you use your organization’s existing naming conventions for stack names, and not make reference to decoy resources, because this could alert any unauthorized user to the real purpose of the resources they’re attempting to access.

    Figure 2: Specify stack details

    Figure 2: Specify stack details

  3. Configure any tags or other organization-specific stack options you need, or accept the default settings, and then choose Next.
  4. Review the CloudFormation settings and select the box acknowledging that AWS CloudFormation might create IAM resources with custom names, and then choose Create stack.
  5. After the stack has completed deployment, the CloudFormation stack output will show the Amazon Resource Names (ARNs) of the decoy resources that were created.
    Figure 3: CloudFormation stack outputs

    Figure 3: CloudFormation stack outputs

Estimated costs

This solution has been designed to keep costs as low as possible, by using services that have no associated costs (such as IAM roles or any parameters stored in Systems Manager Parameter Store), and keeping the use of paid for services (such as S3 and DynamoDB) to a minimum.

Deploying the solution as outlined in this blog post should result in a cost of less than $1 per month for a single account deployment, however please refer to the AWS Pricing Calculator where you can create a pricing estimate based on your deployment using the most up-to-date pricing information.

Test the alerts

In normal circumstances, after you configure the decoys, there will be no attempted access to these resources, and no findings will be sent to Security Hub in your account. To test that the configuration is working as expected, you can issue the following commands from a device that has programmatic access to your account where the private decoy resources have been deployed. To run each command, replace the bracketed, italicized text with your own information. You can find the details for each of the resources in the outputs section of the CloudFormation stack after it has been deployed successfully.

S3 object access

  • aws s3 cp s3://<bucket_name/object_name> /tmp
  • aws s3 cp s3://<bucket_name/object_name> s3://<any_existing_bucket>

IAM role assumption

  • aws sts assume-role –role-arn <role_name> –role-session-name BlogTestRole

Secrets Manager access

  • aws secretsmanager get-secret-value –secret-id <secret_name>

Parameter Store access

  • aws ssm get-parameters –names <ssm_parameter> –with-decryption

    DynamoDB table scan

  • aws dynamodb scan –table-name <table_name>

An example of what these test-generated findings looks like is shown in Figure 4.

Figure 4: Security Hub findings

Figure 4: Security Hub findings

Considerations

Consider the following as you deploy decoy AWS resources:

  • You should consider decoy AWS resources as enhancements to your foundational security controls. Your foundational controls should include these measures:
    • Help prevent the compromise of AWS credentials and limit the privileges of credentials by implementing strong identity management and permissions management.
    • Identify and investigate alerts generated by decoy resources by implementing detective controls.
    • Implement incident response mechanisms to respond to and mitigate the potential impact of security incidents, such as a decoy AWS resource being accessed.
  • You should ensure that your monitoring services and tools are configured to query the configuration of resources and not the data stored in resources. Otherwise, you might get a large volume of false positives because every time a resource is accessed, a custom finding is created in Security Hub. For example, consider a service like Security Hub Security Standards checks, or a cloud security posture management (CSPM) tool that monitors your S3 buckets by describing the properties of all buckets in your account. Such tools will find the decoy S3 bucket and will interrogate its configuration by making calls such as GetBucketPolicy and GetBucketLogging. However, as long as these tools don’t try to read data in the bucket through calls such as GetObject, the EventBridge rules that are configured as described in this post won’t generate a finding.
  • As a specific example of the previous point, ensure that you don’t run a sensitive data discovery job in Amazon Macie on the decoy S3 bucket, to avoid false alerts. You can configure Amazon Macie to monitor the metadata of your S3 buckets, because those actions won’t generate alerts.
  • The solution generates custom findings in Security Hub only for successful accesses of Secrets Manager secrets and Systems Manager parameters. However, both successful and unsuccessful accesses of S3 objects and DynamoDB items, and IAM role assumption, will generate custom findings in Security Hub.

Conclusion

In this post, we discussed the advantages of using private decoy AWS resources to detect suspicious activities within your account and how these decoys can complement your existing security solutions. You learned how to create private decoys, set up alerting, and ingest (and test) these alerts as custom findings into Security Hub for central visibility across your AWS environment. The solution deployment included a set of common resources as private decoys; however, the necessary code and templates can be found in our GitHub repository, and you can extend and customize these to add other resources that you want to include in your accounts.

If you would also like to learn about using CloudTrail as another method of detecting unexpected behavior within your accounts, see the blog post Using CloudTrail to identify unexpected behaviors in individual workloads for more information.

If you have feedback about this post, submit comments in the Comments section below. If you have questions about this post, contact AWS Support.

Want more AWS Security news? Follow us on Twitter.

Author

Maitreya Ranganath

Maitreya is an AWS Security Solutions Architect. He enjoys helping customers solve security and compliance challenges and architect scalable and cost-effective solutions on AWS.

Mark Keating

Mark Keating

Mark is an AWS Security Solutions Architect based out of the U.K. who works with Global Healthcare & Life Sciences and Automotive customers to solve their security and compliance challenges and help them reduce risk. He has over 20 years of experience working with technology, within in operations, solution, and enterprise architecture roles.

How to incorporate ACM PCA into your existing Windows Active Directory Certificate Services

Post Syndicated from Geoff Sweet original https://aws.amazon.com/blogs/security/how-to-incorporate-acm-pca-into-your-existing-windows-active-directory-certificate-services/

Using certificates to authenticate and encrypt data is vital to any enterprise security. For example, companies rely on certificates to provide TLS encryption for web applications so that client data is protected. However, not all certificates need to be issued from a publicly trusted certificate authority (CA). A privately trusted CA can be leveraged to issue certificates to help protect data in transit on resources such as load-balancers and also device authentication for endpoints and IoT devices. Many organizations already have that privately trusted CA running in their Microsoft Active Directory architecture via Active Directory Certificate Services (ADCS).

This post outlines how you can use Microsoft’s Windows 2019 ADCS to sign an AWS Certificate Manager (ACM) Private Certificate Authority (Private CA) instance, extending your existing ADCS system into your AWS environment. This will allow you to issue certificates via ACM for resources like Application Load Balancer that are trusted by your Active Directory members. The ACM PCA documentation talks about how to use an external CA to sign the ACM PCA certificate. However, it leaves the details of the external CA outside of the documentation scope.

Why use ACM PCA?

AWS Certificate Manager Private Certificate Authority (ACM Private CA or ACM PCA) is a private CA service that extends ACM certificate management capabilities to both public and private certificates. ACM PCA provides a highly available private CA service without the upfront investment and ongoing maintenance costs of operating your own private CA. ACM PCA allows developers to be more agile by providing them with APIs to create and deploy private certificates programmatically. You also have the flexibility to create private certificates for applications that require custom certificate lifetimes or resource names.

Why use ACM PCA with Windows Active Directory?

Many enterprises already use Active Directory to manage their IT resources. Whether it is on-premises or built into your AWS accounts, Active Directory’s built-in CA can be extended by ACM PCA. Using your ADCS to sign an ACM PCA means that members of your Active Directory automatically trust certificates issued by that ACM PCA. Keep in mind that these are still private certificates, and they are intended to be used just like certificates from ADCS itself. They will not be trusted by unmanaged devices, because these are not signed by a publicly trusted external CA. Therefore, systems like Mac and Linux may require that you manually deploy the ADCS certificate chain in order to trust certificates issued by your new ACM PCA.

This means it is more efficient for you to rapidly deploy certificates to your endpoint workstations for authentication. Or you can protect internal-only workloads with certificates that are constrained to your internal domain namespace. These tasks can be done conveniently through AWS APIs and the AWS SDK.

Solution overview

In the following sections, we will configure Microsoft ADCS to be able to sign a subordinate CA, deploy and sign ACM PCA, and then test the solution using a private website that is protected by a TLS certificate issued from the ACM PCA.

Configure Microsoft ADCS

Microsoft ADCS is normally deployed as part of your Windows Active Directory architecture. It can be extended to do multiple different types of certificate signing depending on your environment’s needs. Each of these different types of certificates is defined by a template that you must enable and configure. Each template contains configuration information about how Microsoft ADCS will issue the certificate type. You can copy and configure templates differently depending on your environment’s requirements. The specifics of each type of template is outside the scope of this blog post.

To configure ADCS to sign subordinate CAs

  1. On the CA server that will be signing the private CA certificate, open the Certification Authority Microsoft Management Console (MMC).
  2. In the left-side tree view, expand the name of the server.
  3. Open the context (right-click) menu for Certificate Templates and choose Manage.
    Figure 1: Navigating to the Manage option for the certificate templates

    Figure 1: Navigating to the Manage option for the certificate templates

    This opens the Certificate Template Console, which is populated with the list of optional templates.

  4. Scroll down, open the context (right-click) menu for Subordinate Certification Authority, and choose Duplicate Template, as shown in Figure 2. This will create a duplicate of the template that you can alter for your needs, while leaving the original template unaltered for future use. Selecting Duplicate Template immediately opens the configuration for the new template.
    Figure 2: Select Duplicate Template to create a copy of the Subordinate Certification Authority template

    Figure 2: Select Duplicate Template to create a copy of the Subordinate Certification Authority template

To configure and use the new template

  1. On the new template configuration page, choose the General tab, and change the template display name to something that uniquely identifies it. The example in this post uses the name Subordinate Certification Authority – Private CA.
  2. Select the check box for Publish certificate in Active Directory, and then choose OK. The new template appears in the list of available templates. Close the Certificate Templates Console.
  3. Return to the Certification Authority MMC. Open the context (right-click) menu for Certificate Templates again, but this time choose New -> Certificate Template to Issue.
    Figure 3: Issue the new Certificate Template you created for subordinate Cas

    Figure 3: Issue the new Certificate Template you created for subordinate Cas

  4. In the dialog box that appears, choose the new template you created in Step 1 of this procedure, and then choose OK.

That’s all that’s needed! Your CA is now ready to issue certificates for subordinate CAs in your public key infrastructure. Open a browser from either the ADCS CA server itself or through a network connection to the ADCS CA server, and use the following URL to access the certificate server’s certificate signing interface.

http://<hostname-of-your-ca-with-domain>/certsrv/certrqxt.asp

Now you can see that in the Certificate Templates list, you can choose the Subordinate Certification Authority template that you created, as shown in Figure 4.

Figure 4: The interface to sign certificates on your CA now shows the new certificate template you created

Figure 4: The interface to sign certificates on your CA now shows the new certificate template you created

Deploy and sign the ACM Private CA’s certificate

In this step, you will deploy the ACM PCA, which is the first step to create a subordinate CA to deploy in your AWS account. The process of deploying the ACM PCA is well documented, so this post will not go into depth about the deployment itself. Instead, this procedure focuses on the steps for taking the certificate signing request (CSR) and signing it against the ADCS, and then covers the additional steps to convert the certificates that ADCS produces into the certificate format that ACM PCA expects.

After the ACM PCA is initially deployed, it needs to have a certificate signed to authenticate it. ACM PCA offers two options for signing the new instance’s certificate. You can choose to sign either through another ACM PCA instance, or via an external CA. Since you are using ADCS in this walkthrough, you will use the process of an external CA. The ACM PCA deployment is now at a point where it needs its CSR signed by Microsoft ADCS. You should see that it is ready in the AWS Management Console for ACM PCA.

To deploy and sign the ACM PCA’s certificate

  1. When the ACM PCA is ready, in the ACM PCA console, begin the Install subordinate CA certificate process by choosing External private CA for the CA type.
    Figure 5: Options for signing the new instance’s certificate

    Figure 5: Options for signing the new instance’s certificate

  2. You will then be provided the certificate signing request (CSR) for the ACM PCA. Copy and paste the CSR content into the ADCS CA signing URL you visited earlier on the CA server. Then choose Next. The next page is where you will paste in the new signed certificate and certchain in a later step.
  3. From the ADCS CA URL, be sure that the new Subordinate Certification Authority template is selected, and then choose Submit. The new certificate will be issued to you. The ADCS issuing page provides two different formats for the certificate, either as Distinguished Encoding Rules (DER) or base64-encoded.
  4. Copy the base64-encoded files for both the certificate and the certchain to your local computer. The certificate is already in Privacy Enhanced Mail (PEM) format, and its contents can be pasted into the ACM PCA certificate input in the console. However, you must convert the certchain into the format required by the ACM PCA by following these steps:
    1. To convert the format of the certchain, use the openssl tool from the command line. The process of installing the openssl tool is outside the scope of this blog post. Refer to the OpenSSL site documentation for installation options for your operating system.
    2. Use the following command to convert the certchain file from Public Key Cryptographic Standards #7 (PKCS7) to PEM.

      openssl pkcs7 -print_certs -in certnew.p7b -out certchain.pem

    3. Using a text editor, open the certchain.pem file and copy the last certificate block from the file, starting with —–BEGIN CERTIFICATE—– and ending with —–END CERTIFICATE—–. You will notice that the file begins with the signed certificate and includes subject= and issuer= statements. ACM PCA only accepts the content that is the certificate chain.
  5. Return to the ACM PCA console page from Step 1, and paste the text the you just copied into the input area provided for the certificate chain. After this step is complete, the private CA is now signed by your corporate PKI.

Test the solution

Now that the ACM PCA is online, one of the things it can do is issue certificates via ACM that are trusted by your corporate Active Directory joined clients. These certificates can be used in services such as Application Load Balancers to provide TLS protected endpoints that are unique to your organization and trusted only by your internal clients.

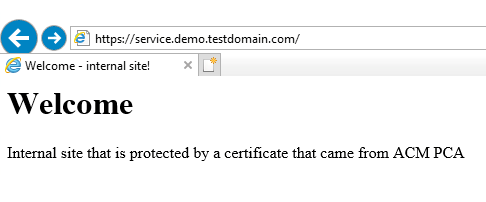
From a client joined to our test Active Directory, Internet Explorer shows that it trusts the TLS certificate issued by AWS Certificate Manager and used on the Application Load Balancer for a private site.

Figure 6: Internet Explorer showing that it trusts the TLS certificate

Figure 6: Internet Explorer showing that it trusts the TLS certificate

For this demo, we created a test web server that is hosting an example webpage. The web server is behind an AWS Application Load Balancer. The TLS certificate attached to the Application Load Balancer is issued from the new ACM PCA.

Conclusion

Organizations that have Microsoft Active Directory deployed can use Active Directory’s Certificate Services to issue certificates for private resources. This blog post shows how you can extend that certificate trust to AWS Certificate Manager Private CA. This provides a way for your developers to issue private certificates automatically, which are trusted by your Active Directory domain-joined clients or clients that have the ADCS certificate chain installed.

For more information on hybrid public key infrastructure (PKI) on AWS, refer to these blog posts:

For more information on certificates for Mac and Linux, refer to the following resources:

 
If you have feedback about this post, submit comments in the Comments section below. If you have questions about this post, contact AWS Support.

Want more AWS Security news? Follow us on Twitter.

Geoff Sweet

Geoff Sweet

Geoff has been in industry for over 20 years, and began his career in Electrical Engineering. Starting in IT during the dot-com boom, he has held a variety of diverse roles, such as systems architect, network architect, and, for the past several years, security architect. Geoff specializes in infrastructure security.

How NerdWallet uses AWS and Apache Hudi to build a serverless, real-time analytics platform

Post Syndicated from Kevin Chun original https://aws.amazon.com/blogs/big-data/how-nerdwallet-uses-aws-and-apache-hudi-to-build-a-serverless-real-time-analytics-platform/

This is a guest post by Kevin Chun, Staff Software Engineer in Core Engineering at NerdWallet.

NerdWallet’s mission is to provide clarity for all of life’s financial decisions. This covers a diverse set of topics: from choosing the right credit card, to managing your spending, to finding the best personal loan, to refinancing your mortgage. As a result, NerdWallet offers powerful capabilities that span across numerous domains, such as credit monitoring and alerting, dashboards for tracking net worth and cash flow, machine learning (ML)-driven recommendations, and many more for millions of users.

To build a cohesive and performant experience for our users, we need to be able to use large volumes of varying user data sourced by multiple independent teams. This requires a strong data culture along with a set of data infrastructure and self-serve tooling that enables creativity and collaboration.

In this post, we outline a use case that demonstrates how NerdWallet is scaling its data ecosystem by building a serverless pipeline that enables streaming data from across the company. We iterated on two different architectures. We explain the challenges we ran into with the initial design and the benefits we achieved by using Apache Hudi and additional AWS services in the second design.

Problem statement

NerdWallet captures a sizable amount of spending data. This data is used to build helpful dashboards and actionable insights for users. The data is stored in an Amazon Aurora cluster. Even though the Aurora cluster works well as an Online Transaction Processing (OLTP) engine, it’s not suitable for large, complex Online Analytical Processing (OLAP) queries. As a result, we can’t expose direct database access to analysts and data engineers. The data owners have to solve requests with new data derivations on read replicas. As the data volume and the diversity of data consumers and requests grow, this process gets more difficult to maintain. In addition, data scientists mostly require data files access from an object store like Amazon Simple Storage Service (Amazon S3).

We decided to explore alternatives where all consumers can independently fulfill their own data requests safely and scalably using open-standard tooling and protocols. Drawing inspiration from the data mesh paradigm, we designed a data lake based on Amazon S3 that decouples data producers from consumers while providing a self-serve, security-compliant, and scalable set of tooling that is easy to provision.

Initial design

The following diagram illustrates the architecture of the initial design.

The design included the following key components:

  1. We chose AWS Data Migration Service (AWS DMS) because it’s a managed service that facilitates the movement of data from various data stores such as relational and NoSQL databases into Amazon S3. AWS DMS allows one-time migration and ongoing replication with change data capture (CDC) to keep the source and target data stores in sync.
  2. We chose Amazon S3 as the foundation for our data lake because of its scalability, durability, and flexibility. You can seamlessly increase storage from gigabytes to petabytes, paying only for what you use. It’s designed to provide 11 9s of durability. It supports structured, semi-structured, and unstructured data, and has native integration with a broad portfolio of AWS services.
  3. AWS Glue is a fully managed data integration service. AWS Glue makes it easier to categorize, clean, transform, and reliably transfer data between different data stores.
  4. Amazon Athena is a serverless interactive query engine that makes it easy to analyze data directly in Amazon S3 using standard SQL. Athena scales automatically—running queries in parallel—so results are fast, even with large datasets, high concurrency, and complex queries.

This architecture works fine with small testing datasets. However, the team quickly ran into complications with the production datasets at scale.

Challenges

The team encountered the following challenges:

  • Long batch processing time and complexed transformation logic – A single run of the Spark batch job took 2–3 hours to complete, and we ended up getting a fairly large AWS bill when testing against billions of records. The core problem was that we had to reconstruct the latest state and rewrite the entire set of records per partition for every job run, even if the incremental changes were a single record of the partition. When we scaled that to thousands of unique transactions per second, we quickly saw the degradation in transformation performance.
  • Increased complexity with a large number of clients – This workload contained millions of clients, and one common query pattern was to filter by single client ID. There were numerous optimizations that we were forced to tack on, such as predicate pushdowns, tuning the Parquet file size, using a bucketed partition scheme, and more. As more data owners adopted this architecture, we would have to customize each of these optimizations for their data models and consumer query patterns.
  • Limited extendibility for real-time use cases – This batch extract, transform, and load (ETL) architecture wasn’t going to scale to handle hourly updates of thousands of records upserts per second. In addition, it would be challenging for the data platform team to keep up with the diverse real-time analytical needs. Incremental queries, time-travel queries, improved latency, and so on would require heavy investment over a long period of time. Improving on this issue would open up possibilities like near-real-time ML inference and event-based alerting.

With all these limitations of the initial design, we decided to go all-in on a real incremental processing framework.

Solution

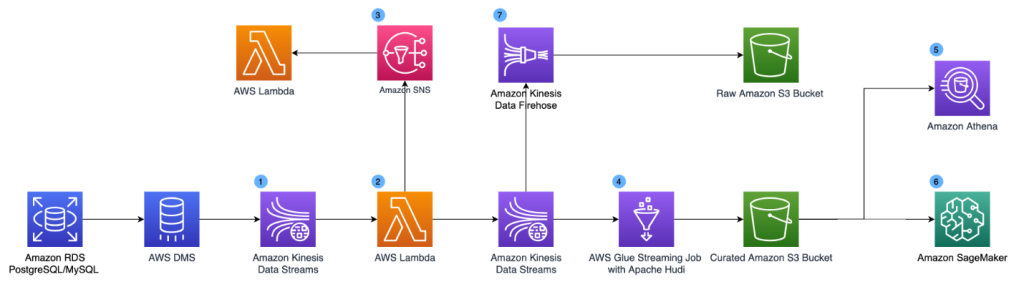
The following diagram illustrates our updated design. To support real-time use cases, we added Amazon Kinesis Data Streams, AWS Lambda, Amazon Kinesis Data Firehose and Amazon Simple Notification Service (Amazon SNS) into the architecture.

The updated components are as follows:

  1. Amazon Kinesis Data Streams is a serverless streaming data service that makes it easy to capture, process, and store data streams. We set up a Kinesis data stream as a target for AWS DMS. The data stream collects the CDC logs.
  2. We use a Lambda function to transform the CDC records. We apply schema validation and data enrichment at the record level in the Lambda function. The transformed results are published to a second Kinesis data stream for the data lake consumption and an Amazon SNS topic so that changes can be fanned out to various downstream systems.
  3. Downstream systems can subscribe to the Amazon SNS topic and take real-time actions (within seconds) based on the CDC logs. This can support use cases like anomaly detection and event-based alerting.
  4. To solve the problem of long batch processing time, we use Apache Hudi file format to store the data and perform streaming ETL using AWS Glue streaming jobs. Apache Hudi is an open-source transactional data lake framework that greatly simplifies incremental data processing and data pipeline development. Hudi allows you to build streaming data lakes with incremental data pipelines, with support for transactions, record-level updates, and deletes on data stored in data lakes. Hudi integrates well with various AWS analytics services such as AWS Glue, Amazon EMR, and Athena, which makes it a straightforward extension of our previous architecture. While Apache Hudi solves the record-level update and delete challenges, AWS Glue streaming jobs convert the long-running batch transformations into low-latency micro-batch transformations. We use the AWS Glue Connector for Apache Hudi to import the Apache Hudi dependencies in the AWS Glue streaming job and write transformed data to Amazon S3 continuously. Hudi does all the heavy lifting of record-level upserts, while we simply configure the writer and transform the data into Hudi Copy-on-Write table type. With Hudi on AWS Glue streaming jobs, we reduce the data freshness latency for our core datasets from hours to under 15 minutes.
  5. To solve the partition challenges for high cardinality UUIDs, we use the bucketing technique. Bucketing groups data based on specific columns together within a single partition. These columns are known as bucket keys. When you group related data together into a single bucket (a file within a partition), you significantly reduce the amount of data scanned by Athena, thereby improving query performance and reducing cost. Our existing queries are filtered on the user ID already, so we significantly improve the performance of our Athena usage without having to rewrite queries by using bucketed user IDs as the partition scheme. For example, the following code shows total spending per user in specific categories:
    SELECT ID, SUM(AMOUNT) SPENDING
    FROM "{{DATABASE}}"."{{TABLE}}"
    WHERE CATEGORY IN (
    'ENTERTAINMENT',
    'SOME_OTHER_CATEGORY')
    AND ID_BUCKET ='{{ID_BUCKET}}'
    GROUP BY ID;

  1. Our data scientist team can access the dataset and perform ML model training using Amazon SageMaker.
  2. We maintain a copy of the raw CDC logs in Amazon S3 via Amazon Kinesis Data Firehose.

Conclusion

In the end, we landed on a serverless stream processing architecture that can scale to thousands of writes per second within minutes of freshness on our data lakes. We’ve rolled out to our first high-volume team! At our current scale, the Hudi job is processing roughly 1.75 MiB per second per AWS Glue worker, which can automatically scale up and down (thanks to AWS Glue auto scaling). We’ve also observed an outstanding improvement of end-to-end freshness at less than 5 minutes due to Hudi’s incremental upserts vs. our first attempt.

With Hudi on Amazon S3, we’ve built a high-leverage foundation to personalize our users’ experiences. Teams that own data can now share their data across the organization with reliability and performance characteristics built into a cookie-cutter solution. This enables our data consumers to build more sophisticated signals to provide clarity for all of life’s financial decisions.

We hope that this post will inspire your organization to build a real-time analytics platform using serverless technologies to accelerate your business goals.


About the authors

Kevin Chun is a Staff Software Engineer in Core Engineering at NerdWallet. He builds data infrastructure and tooling to help NerdWallet provide clarity for all of life’s financial decisions.

Dylan Qu is a Specialist Solutions Architect focused on big data and analytics with Amazon Web Services. He helps customers architect and build highly scalable, performant, and secure cloud-based solutions on AWS.

Automatically block suspicious DNS activity with Amazon GuardDuty and Route 53 Resolver DNS Firewall

Post Syndicated from Akshay Karanth original https://aws.amazon.com/blogs/security/automatically-block-suspicious-dns-activity-with-amazon-guardduty-and-route-53-resolver-dns-firewall/

In this blog post, we’ll show you how to use Amazon Route 53 Resolver DNS Firewall to automatically respond to suspicious DNS queries that are detected by Amazon GuardDuty within your Amazon Web Services (AWS) environment.

The Security Pillar of the AWS Well-Architected Framework includes incident response, stating that your organization should implement mechanisms to automatically respond to and mitigate the potential impact of security issues. Automating incident response helps you scale your capabilities, rapidly reduce the scope of compromised resources, and reduce repetitive work by security teams.

Use cases for Route 53 Resolver DNS Firewall

Route 53 Resolver DNS Firewall is a managed firewall that you can use to block DNS queries that are made for known malicious domains and to allow queries for trusted domains. It provides more granular control over the DNS querying behavior of resources within your VPCs.

Let’s discuss two use cases for Route 53 Resolver DNS Firewall:

Use of allow lists – If you have stricter security requirements around network security controls and want to deny all outbound DNS queries for domains that don’t match those on your lists of approved domains (known as allow lists), you can create such rules. This is called a walled garden approach to DNS security. These allow lists only include the domains for which resources within your Amazon Virtual Private Cloud (Amazon VPC) are allowed to make DNS queries through Amazon-provided DNS. This helps to ensure that the DNS queries containing the domains that your organization doesn’t trust are blocked.

Use of deny lists – If your organization prefers to allow all outbound DNS lookups within your accounts by default and only requires the ability to block DNS queries for known malicious domains, you can use DNS Firewall to create deny lists, which include all the malicious domain names that your organization is aware of. DNS Firewall also provides AWS Managed Rules, giving you to the ability to configure protections against known DNS threats like command-and-control (C&C) bots. You can also add block lists from open-source third-party threat intelligence sources.

A few important points about the use of allow and deny lists:

  1. Broader use of allow lists is more effective at blocking a greater number of malicious DNS queries than a short deny list. For example, if your workloads only need access to .com domains, then allowing only .com will block many malicious domains that might be specific to certain countries. View a list of country code top-level domains (ccTLDs).
  2. If you use allow lists, you need to make sure that you keep up with the domains that your applications need to communicate with. Likewise, if you use deny lists, you need to keep up with updates to the lists.
  3. Allow lists and deny lists are not mutually exclusive models and can be used together. For example, let’s say that you have an allow list that only allows .com domains (with the intention of blocking several ccTLDs by default). You can also use the built-in AWS Managed Rules deny list to block known malicious .com domains for an additional layer of security.

Solution overview

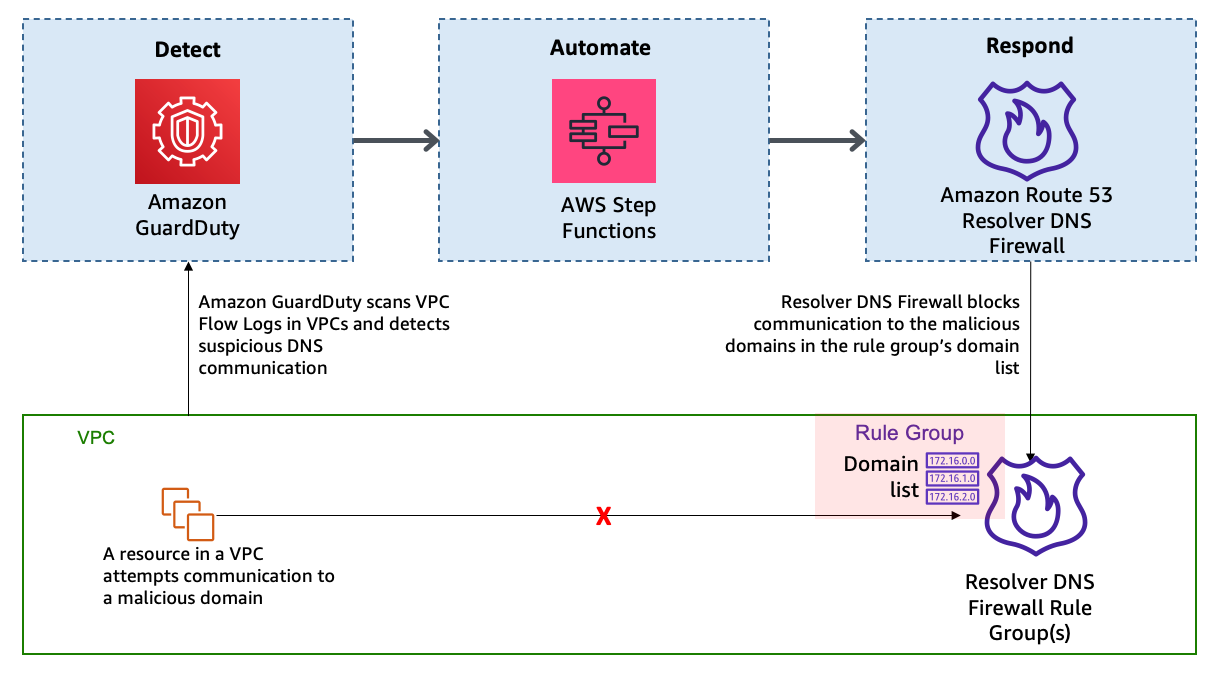
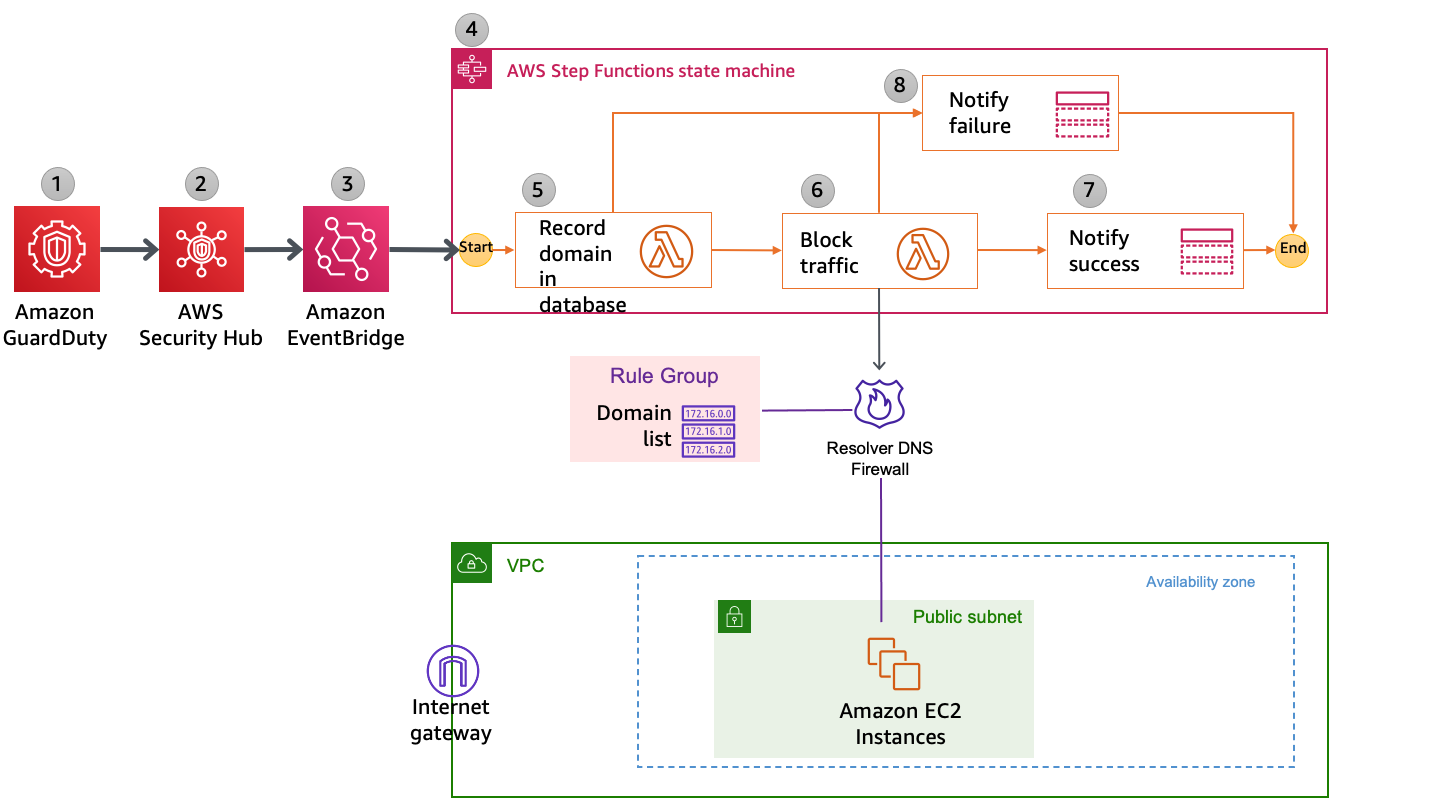
Refer to the DNS Firewall documentation to familiarize yourself with its constructs and understand how it works. The automation example we provide in this blog post is focused on providing blocks or alerts for DNS queries with suspicious domain names. For example, consider the scenario where an Amazon Elastic Compute Cloud (Amazon EC2) instance queries a domain name that is associated with a known command-and-control server. As shown in Figure 1, when GuardDuty detects communication with the malicious domain, it initiates a series of steps. First, AWS Step Functions orchestrates the remediation response through a defined workflow, then DNS Firewall adds the suspicious domain to deny list or alert list, and finally GuardDuty notifies the security operators of the attempted communication.

Figure 1: High-level solution overview

Figure 1: High-level solution overview

In this solution, the detection of threats by GuardDuty triggers the automated remediation procedure documented in this post. GuardDuty informs you of the status of your AWS environment by producing security findings. Each GuardDuty finding has an assigned severity level and value that reflects the potential risk that the finding could have to your network as determined by our security engineers. The value of the severity can fall anywhere within the 0.1 to 8.9 range, with higher values indicating greater security risk. To help you determine a response to a potential security issue that is highlighted by a finding, GuardDuty breaks down this range into High, Medium, and Low severity levels. We have seen that many of the DNS-based GuardDuty findings fall into the category of High severity, and many times these findings are strongly indicative of potential compromise (for example, pre ransomware activity).

In this blog post, we specifically focus on the following types of GuardDuty findings:

  • Backdoor:EC2/C&CActivity.B!DNS
  • Impact:EC2/MaliciousDomainRequest.Reputation
  • Trojan:EC2/DNSDataExfiltration

We’ve configured DNS Firewall to block only events with High severity by sending only those domains to the deny list. DNS Firewall sends the rest of the domains to an alert list.

This solution uses Step Functions and AWS Lambda so that incident response steps run in the correct order. Step Functions also provides retry and error-handling logic. Lambda functions interact with networking services to block traffic, and with databases to store data about blocked domain lists and AWS Security Hub finding Amazon Resource Names (ARNs).

How it works

Figure 2 shows the automated remediation workflow in detail.
 

Figure 2: Detailed workflow diagram

Figure 2: Detailed workflow diagram

The solution is implemented as follows:

  1. GuardDuty detects communication attempts that include a suspicious domain. GuardDuty generates a finding, in JSON format, that includes details such as the EC2 instance ID involved (if applicable), account information, type of finding, domain, and other details. Following is a sample finding (some fields removed for brevity).
    {
      "schemaVersion": "2.0",
      "accountId": "123456789012",
      "id": " 1234567890abcdef0",
      "type": "Backdoor:EC2/C&CActivity.B!DNS",
      "service": {
        "serviceName": "guardduty",
        "action": {
          "actionType": "DNS_REQUEST",
         "dnsRequestAction": {
    "domain": "guarddutyc2activityb.com",
    "protocol": "UDP",
    "blocked": false
          }
        }
      }
    }
    

  2. Security Hub ingests the finding generated by GuardDuty and consolidates it with findings from other AWS security services. Security Hub also publishes the contents of the finding to the default bus in Amazon EventBridge. Following is a snippet from a sample event published to EventBridge.
    { 
      "id": "12345abc-ca56-771b-cd1b-710550598e37", 
      "detail-type": "Security Hub Findings - Imported", 
      "source": "aws.securityhub", 
      "account": "123456789012", 
      "time": "2021-01-05T01:20:33Z", 
      "region": "us-east-1", 
      "detail": { 
        "findings": [ 
            { "ProductArn": "arn:aws:securityhub:us-east-1::product/aws/guardduty", 
            "Types": ["Software and Configuration Checks/Backdoor:EC2.C&CActivity.B!DNS"], 
            "LastObservedAt": "2021-01-05T01:15:01.549Z", 
            "ProductFields": 
                {"aws/guardduty/service/action/dnsRequestAction/blocked": "false",
                "aws/guardduty/service/action/dnsRequestAction/domain": "guarddutyc2activityb.com"} 
                }
                ]}}
    

  3. EventBridge has a rule with an event pattern that matches GuardDuty events that contain the malicious domain name. When an event matching the pattern is published on the default bus, EventBridge routes that event to the designated target, in this case a Step Functions state machine. Following is a snippet of AWS CloudFormation code that defines the EventBridge rule.
    # EventBridge Event Rule - For Security Hub event published to EventBridge:
      SecurityHubtoFirewallStateMachineEvent:
        Type: "AWS::Events::Rule"
        Properties:
          Description: "Security Hub - GuardDuty findings with DNS Domain"
          EventPattern:
            source:
            - aws.securityhub
            detail:
              findings:
                ProductFields:
                  aws/guardduty/service/action/dnsRequestAction/blocked:
                    - "exists": true
          State: "ENABLED"
          Targets:
            -
              Arn: !GetAtt SecurityHubtoDnsFirewallStateMachine.Arn
              RoleArn: !GetAtt SecurityHubtoFirewallStateMachineEventRole.Arn
              Id: "GuardDutyEvent-StepFunctions-Trigger"
    

  4. The Step Functions state machine ingests the details of the Security Hub finding published in EventBridge and orchestrates the remediation response through a defined workflow. Figure 3 shows the state machine workflow.
     
    Figure 3: AWS Step Functions state machine workflow

    Figure 3: AWS Step Functions state machine workflow

  5. The first two steps in the state machine, getDomainFromDynamo and isDomainInDynamo, invoke the Lambda function CheckDomainInDynamoLambdaFunction that checks whether the flagged domain is already in the Amazon DynamoDB table. If the domain already exists in DynamoDB, then the workflow continues to check whether the domain is also in the domain list and adds it accordingly. If the domain is not in DynamoDB, then the workflow considers it a new addition and adds the domain to both domain lists, as well as the DynamoDB table.
  6. The next three steps in the state machine—getDomainFromDomainList, isDomainInDomainList, and addDomainToDnsFirewallDomainList—invoke a second Lambda function that checks and updates the DNS Firewall domain lists with the domain name. Figure 4 shows an example of the DNS Firewall rules and associated domain list.
     
    Figure 4: Sample rules in a DNS Firewall rule group

    Figure 4: Sample rules in a DNS Firewall rule group

    Figure 5 shows the domain lists.
     

    Figure 5: Domain lists

    Figure 5: Domain lists

    The next step in the state machine, updateDynamoDB, invokes a third Lambda function that updates the DynamoDB table with the domain that was just added to the domain list. Figure 6 shows an example domain entry that gets stored inside the DynamoDB table.
     

    Figure 6: DynamoDB table entry

    Figure 6: DynamoDB table entry

  7. The notifySuccess step of the state machine uses an Amazon Simple Notification Service (Amazon SNS) topic to send out a message that the automatic block or alert happened.
  8. If there was a failure in any of the previous steps, then the state machine runs the notifyFailure step. The state machine publishes a message on the SNS topic that the automated remediation workflow has failed to complete, and that manual intervention might be required.

Solution deployment and testing

To set up this solution, you’ll do the following steps:

  1. Verify prerequisites in your AWS account.
  2. Deploy the CloudFormation template.
  3. Create a test Security Hub event.
  4. Confirm the entry in the DNS Firewall rule group domain list.
  5. Confirm the SNS notification.
  6. Apply the rule group to your VPC by using DNS Firewall.

Step 1: Verify prerequisites in your AWS account

The sample solution we provide in this blog post requires that you activate both GuardDuty and Security Hub in your AWS account. If either of these services is not activated in your account, do the following:

Step 2: Deploy the CloudFormation template

For this next step, make sure that you deploy the template within the AWS account and the AWS Region where you want to monitor GuardDuty findings and block suspicious DNS activity. Depending on your architecture, you can deploy the solution one time centrally in a security account or deploy it repeatedly across multiple accounts.

To deploy the template

  1. Choose the Launch Stack button to launch a CloudFormation stack in your account:
    Select the Launch Stack button to launch the template

    Note: The stack will launch in the N. Virginia (us-east-1) Region. It takes approximately 15 minutes for the CloudFormation stack to complete. To deploy this solution into other AWS Regions, download the solution’s CloudFormation template and deploy it to the selected Region. Network Firewall isn’t currently available in all Regions. For more information about where it’s available, see the list of service endpoints.

  2. In the AWS CloudFormation console, select the Select Template form, and then choose Next.
  3. On the Specify Details page, provide the following input parameters. You can modify the default values to customize the solution for your environment.
    • AdminEmail – The email address to receive notifications. This must be a valid email address. There is no default value.
    • DnsFireWallAlertDomainListName – The name of the domain list for DNS Firewall that consists of domains that will be only alerted and not blocked. The default value is DemoAlertDomainListAutoUpdated.
    • DnsFireWallBlockDomainListName – The name of the domain list for DNS Firewall that consists of domains that will be blocked. The default value is DemoBlockedDomainListAutoUpdated.
    • DnsFirewallBlockAction – You can select NODATA or NXDOMAIN. NODATA implies that there is no response available if a DNS query from the VPC matches a domain in the block domain list. NXDOMAIN implies that the response is an error message, which indicates that a domain doesn’t exist. The default value is NODATA.

    Figure 7 shows an example of the values entered in the Parameters screen.

    Figure 7: Sample CloudFormation stack parameters

    Figure 7: Sample CloudFormation stack parameters

  4. After you’ve entered values for all of the input parameters, choose Next.
  5. On the Options page, keep the defaults, and then choose Next.
  6. On the Review page, in the Capabilities section, select the check box next to I acknowledge that AWS CloudFormation might create IAM resources. Then choose Create. Figure 8 shows what the CloudFormation capabilities acknowledgement prompt looks like.
     
    Figure 8: AWS CloudFormation capabilities acknowledgement

    Figure 8: AWS CloudFormation capabilities acknowledgement

While the stack is being created, check the email inbox that corresponds to the value that you gave for the AdminEmail address parameter. Look for an email message with the subject “AWS Notification – Subscription Confirmation.” Choose the link to confirm the subscription to the SNS topic.

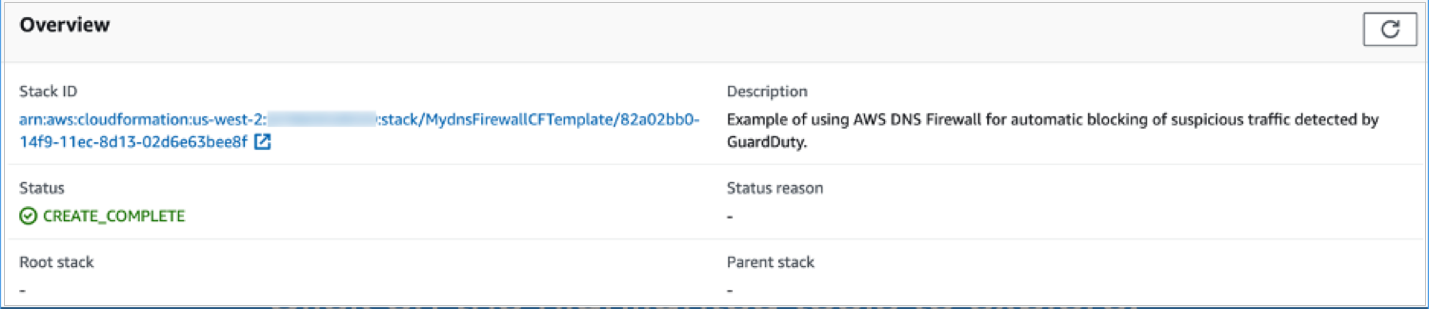
After the Status field for the CloudFormation stack changes to CREATE_COMPLETE, as shown in Figure 9, the solution is implemented and is ready for testing.
 

Figure 9: CloudFormation stack completed deployment

Figure 9: CloudFormation stack completed deployment

Step 3: Create a test Security Hub event

After the CloudFormation stack has completed deployment, you can test the functionality by creating a test event in the same format as would be published by Security Hub.

To create a test run of the solution

  1. In the AWS Management Console, choose Services, choose CloudFormation, and then for Stack, choose the stack name that you provided in Step 2: Deploy the CloudFormation template.
  2. In the Resources tab for the stack, look for the SecurityHubDnsFirewallStateMachine entry. It should appear as shown in Figure 10.
     
    Figure 10: CloudFormation stack resources

    Figure 10: CloudFormation stack resources

  3. Choose the link in the entry. You’ll be redirected to the Step Functions console, with the state machine already open. Choose Start execution.
     
    Figure 11: AWS Step Functions state machine

    Figure 11: AWS Step Functions state machine

  4. To facilitate testing, we’ve provided a test event file. On the Start execution page, in the Input section, paste the C&CActivity.B!DNS finding sample as shown in Figure 12.
     
    Figure 12: Sample input for the Step Functions state machine execution

    Figure 12: Sample input for the Step Functions state machine execution

  5. Note the domain name guarddutyc2activityb.com for the remote host identified in the GuardDuty finding in the test event on line 57 of the sample. The solution should block or alert traffic from that domain name in the following steps.
  6. Choose Start execution to begin the processing of the test event.
  7. You can now track the state machine processing of the test event. The processing should complete within a few seconds. You can select different steps in the visual Graph inspector to view input and output data. Figure 13 shows the input to the addDomainToDnsFirewallDomainList step that launches a Lambda function that interacts with DNS Firewall.
     
    Figure 13: Step Functions state machine step details

    Figure 13: Step Functions state machine step details

Step 4: Confirm the entry in the DNS Firewall rule group

Now that a test event was processed by the state machine, you can check whether the DNS Firewall rule group would block traffic to the domain name identified in the GuardDuty finding.

To validate entries in the DNS Firewall rule group

  1. In the AWS Management Console, choose Services, and then choose VPC. In the DNS Firewall section in the left navigation bar, choose DNS Firewall rule groups.
  2. Choose the demoDnsFirewallRuleGroup rule group created by the solution, and you’ll be able to see the rules as shown in Figure 14.
     
    Figure 14: Select the DNS Firewall rule

    Figure 14: Select the DNS Firewall rule

  3. Choose the domain list associated with the BLOCK rule. Confirm that the rules blocking the traffic from the source and to the domain that you specified in the test event were created. The domain list should look similar to what is shown in Figure 15.
     
    Figure 15: Verify that the domain was added to the blocked domain list

    Figure 15: Verify that the domain was added to the blocked domain list

Step 5: Confirm the SNS notification

In this step, you’ll view the SNS notification that was sent to the email address you set up.

To confirm the SNS notification

  • Review the email inbox for the value that you provided for the AdminEmail parameter and look for a message with the subject line “AWS Notification Message.” The contents of the message from SNS should be similar to the following.
    {"Blocked":"true","Input":{"ResponseMetadata":{"RequestId":"HOLOAAENUS3MN9B0DS6CO8BF4BVV4KQNSO5AEMVJF66Q9ASUAAJG","HTTPStatusCode":200,"HTTPHeaders":{"server":"Server","date":"Wed, 17 Nov 2021 08:20:38 GMT","content-type":"application/x-amz-json-1.0","content-length":"2","connection":"keep-alive","x-amzn-requestid":"HOLOAAENUS3MN9B0DS6CO8BF4BVV4KQNSO5AEMVJF66Q9ASUAAJG","x-amz-crc32":"2745614147"},"RetryAttempts":0}}}
    

Step 6: Apply the rule group to your VPC by using DNS Firewall

As part of the CloudFormation template deployment, two test VPCs have been created for you, to demonstrate that you can assign a single DNS Firewall rule group to multiple VPCs. You can also associate this rule group to your existing VPC of interest. To learn how to do this task, see Managing associations between your VPC and Route 53 Resolver DNS Firewall rule group. For visibility into DNS queries and for debugging purposes, the template creates log groups that accumulate DNS Resolver query logs.

After you’ve successfully tested the given sample that emulates C&CActivity.B!DNS, you can repeat steps 3 to 6 for the MaliciousDomainRequest.Reputation finding sample and the DNSDataExfiltration finding sample.

These samples are supplied for your convenience, and you will see the blocking action in a matter of minutes. Alternatively, you can use other ways to test, which might need about an hour for blocking action to happen. To initiate DNS C&C activity, you can make a DNS request from your instance (using dig for Linux or nslookup for Windows) against the test domain guarddutyc2activityb.com. Alternatively, you can use GuardDuty Tester, which generates DNS C&C activity and DNS exfiltration unauthorized events.

To take this solution one step further, you can implement automatic aging out of the domains that get added to the domain list. One way to do this is to use the Time to Live feature in DynamoDB and keep repopulating the domain list from DynamoDB at regular intervals of time. The benefit of this is that if the malicious nature of a domain in the domain list changes over time, the list will be kept up to date during this age out and repopulation process.

Considerations

There are a few considerations that you should keep in mind regarding DNS Firewall:

  • DNS Firewall and AWS Network Firewall work together for improved domain-filtering capability across HTTP(S) traffic. A domain list that you configure in Network Firewall should reflect the domain list configured in DNS Firewall.
  • DNS Firewall filters based on the domain name. It doesn’t translate that domain name to an IP address to be blocked.
  • It’s a best practice to block outbound traffic to port 53 with network access control lists (network ACLs) or Network Firewall so that GuardDuty can monitor DNS queries.
  • DNS Firewall filters DNS queries to the Amazon Route 53 Resolver (also known as AmazonProvidedDNS or VPC .2 Resolver) in the VPC. So for traffic leaving the VPC, we recommend that you use DNS Firewall along with Network Firewall, which you can use to secure traffic that isn’t headed to Amazon Route 53 Resolver. Network Firewall can also block domain names that exist in network traffic leaving the Amazon VPC, such as in HTTP HOST headers, TLS Server Name Indication (SNI) fields, and so on.
  • You can use Network Firewall to block external encrypted DNS services so that these services can’t be used to circumvent your DNS Firewall policies.

Conclusion

In this blog post, you learned how to automatically block malicious domains by using Route 53 Resolver DNS Firewall and GuardDuty. You can use this sample solution to automatically block communication to suspicious hosts discovered by GuardDuty, and you can apply those blocks across all configured DNS Firewall firewalls within your account.

All of the code for this solution is available on GitHub. Feel free to play around with the code; we hope it helps you learn more about automated security remediation. You can adjust the code to better fit your unique environment or extend the code with additional steps.

If you have comments about this blog post, submit them in the Comments section below. If you have questions about using this solution, start a thread in the Route 53 Resolver forum or GuardDuty forums, or contact AWS Support.

Want more AWS Security how-to content, news, and feature announcements? Follow us on Twitter.

Author

Akshay Karanth

Akshay is a senior solutions architect at AWS. He helps digital native businesses learn, build, and grow in the AWS Cloud. Before AWS, he worked at companies such as Juniper Networks and Microsoft in various customer facing roles across networking and security domains. When not at work, Akshay enjoys hiking up a hard trail or cooking a fulfilling meal with his family.

Author

Rohit Aswani

Rohit is a specialist solutions architect focussed on Networking at AWS, where he helps customers build and design scalable, highly-available, secure, resilient, and cost-effective networks. He holds an MS in telecommunication systems management from Northeastern University, specializing in computer networking.

Contributor

Special thanks to Fabrice Dall’ara who made significant contributions to this post.

Stream Amazon EMR on EKS logs to third-party providers like Splunk, Amazon OpenSearch Service, or other log aggregators

Post Syndicated from Matthew Tan original https://aws.amazon.com/blogs/big-data/stream-amazon-emr-on-eks-logs-to-third-party-providers-like-splunk-amazon-opensearch-service-or-other-log-aggregators/

Spark jobs running on Amazon EMR on EKS generate logs that are very useful in identifying issues with Spark processes and also as a way to see Spark outputs. You can access these logs from a variety of sources. On the Amazon EMR virtual cluster console, you can access logs from the Spark History UI. You also have flexibility to push logs into an Amazon Simple Storage Service (Amazon S3) bucket or Amazon CloudWatch Logs. In each method, these logs are linked to the specific job in question. The common practice of log management in DevOps culture is to centralize logging through the forwarding of logs to an enterprise log aggregation system like Splunk or Amazon OpenSearch Service (successor to Amazon Elasticsearch Service). This enables you to see all the applicable log data in one place. You can identify key trends, anomalies, and correlated events, and troubleshoot problems faster and notify the appropriate people in a timely fashion.

EMR on EKS Spark logs are generated by Spark and can be accessed via the Kubernetes API and kubectl CLI. Therefore, although it’s possible to install log forwarding agents in the Amazon Elastic Kubernetes Service (Amazon EKS) cluster to forward all Kubernetes logs, which include Spark logs, this can become quite expensive at scale because you get information that may not be important for Spark users about Kubernetes. In addition, from a security point of view, the EKS cluster logs and access to kubectl may not be available to the Spark user.

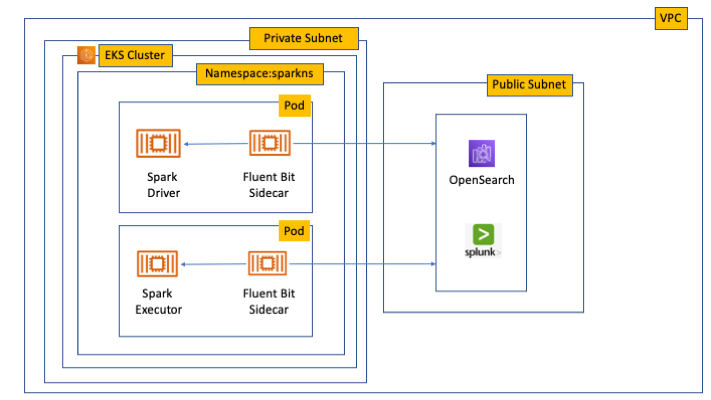
To solve this problem, this post proposes using pod templates to create a sidecar container alongside the Spark job pods. The sidecar containers are able to access the logs contained in the Spark pods and forward these logs to the log aggregator. This approach allows the logs to be managed separately from the EKS cluster and uses a small amount of resources because the sidecar container is only launched during the lifetime of the Spark job.

Implementing Fluent Bit as a sidecar container

Fluent Bit is a lightweight, highly scalable, and high-speed logging and metrics processor and log forwarder. It collects event data from any source, enriches that data, and sends it to any destination. Its lightweight and efficient design coupled with its many features makes it very attractive to those working in the cloud and in containerized environments. It has been deployed extensively and trusted by many, even in large and complex environments. Fluent Bit has zero dependencies and requires only 650 KB in memory to operate, as compared to FluentD, which needs about 40 MB in memory. Therefore, it’s an ideal option as a log forwarder to forward logs generated from Spark jobs.

When you submit a job to EMR on EKS, there are at least two Spark containers: the Spark driver and the Spark executor. The number of Spark executor pods depends on your job submission configuration. If you indicate more than one spark.executor.instances, you get the corresponding number of Spark executor pods. What we want to do here is run Fluent Bit as sidecar containers with the Spark driver and executor pods. Diagrammatically, it looks like the following figure. The Fluent Bit sidecar container reads the indicated logs in the Spark driver and executor pods, and forwards these logs to the target log aggregator directly.

Architecture of Fluent Bit sidecar

Pod templates in EMR on EKS

A Kubernetes pod is a group of one or more containers with shared storage, network resources, and a specification for how to run the containers. Pod templates are specifications for creating pods. It’s part of the desired state of the workload resources used to run the application. Pod template files can define the driver or executor pod configurations that aren’t supported in standard Spark configuration. That being said, Spark is opinionated about certain pod configurations and some values in the pod template are always overwritten by Spark. Using a pod template only allows Spark to start with a template pod and not an empty pod during the pod building process. Pod templates are enabled in EMR on EKS when you configure the Spark properties spark.kubernetes.driver.podTemplateFile and spark.kubernetes.executor.podTemplateFile. Spark downloads these pod templates to construct the driver and executor pods.

Forward logs generated by Spark jobs in EMR on EKS

A log aggregating system like Amazon OpenSearch Service or Splunk should always be available that can accept the logs forwarded by the Fluent Bit sidecar containers. If not, we provide the following scripts in this post to help you launch a log aggregating system like Amazon OpenSearch Service or Splunk installed on an Amazon Elastic Compute Cloud (Amazon EC2) instance.

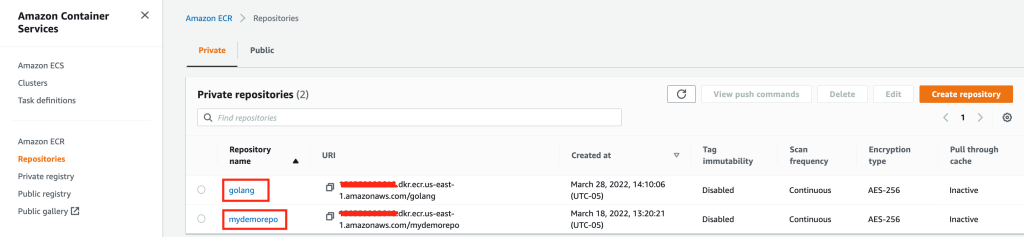
We use several services to create and configure EMR on EKS. We use an AWS Cloud9 workspace to run all the scripts and to configure the EKS cluster. To prepare to run a job script that requires certain Python libraries absent from the generic EMR images, we use Amazon Elastic Container Registry (Amazon ECR) to store the customized EMR container image.

Create an AWS Cloud9 workspace

The first step is to launch and configure the AWS Cloud9 workspace by following the instructions in Create a Workspace in the EKS Workshop. After you create the workspace, we create AWS Identity and Access Management (IAM) resources. Create an IAM role for the workspace, attach the role to the workspace, and update the workspace IAM settings.

Prepare the AWS Cloud9 workspace

Clone the following GitHub repository and run the following script to prepare the AWS Cloud9 workspace to be ready to install and configure Amazon EKS and EMR on EKS. The shell script prepare_cloud9.sh installs all the necessary components for the AWS Cloud9 workspace to build and manage the EKS cluster. These include the kubectl command line tool, eksctl CLI tool, jq, and to update the AWS Command Line Interface (AWS CLI).

$ sudo yum -y install git
$ cd ~ 
$ git clone https://github.com/aws-samples/aws-emr-eks-log-forwarding.git
$ cd aws-emr-eks-log-forwarding
$ cd emreks
$ bash prepare_cloud9.sh

All the necessary scripts and configuration to run this solution are found in the cloned GitHub repository.

Create a key pair

As part of this particular deployment, you need an EC2 key pair to create an EKS cluster. If you already have an existing EC2 key pair, you may use that key pair. Otherwise, you can create a key pair.

Install Amazon EKS and EMR on EKS

After you configure the AWS Cloud9 workspace, in the same folder (emreks), run the following deployment script:

$ bash deploy_eks_cluster_bash.sh 
Deployment Script -- EMR on EKS
-----------------------------------------------

Please provide the following information before deployment:
1. Region (If your Cloud9 desktop is in the same region as your deployment, you can leave this blank)
2. Account ID (If your Cloud9 desktop is running in the same Account ID as where your deployment will be, you can leave this blank)
3. Name of the S3 bucket to be created for the EMR S3 storage location
Region: [xx-xxxx-x]: < Press enter for default or enter region > 
Account ID [xxxxxxxxxxxx]: < Press enter for default or enter account # > 
EC2 Public Key name: < Provide your key pair name here >
Default S3 bucket name for EMR on EKS (do not add s3://): < bucket name >
Bucket created: XXXXXXXXXXX ...
Deploying CloudFormation stack with the following parameters...
Region: xx-xxxx-x | Account ID: xxxxxxxxxxxx | S3 Bucket: XXXXXXXXXXX

...

EKS Cluster and Virtual EMR Cluster have been installed.

The last line indicates that installation was successful.

Log aggregation options

There are several log aggregation and management tools on the market. This post suggests two of the more popular ones in the industry: Splunk and Amazon OpenSearch Service.

Option 1: Install Splunk Enterprise

To manually install Splunk on an EC2 instance, complete the following steps:

  1. Launch an EC2 instance.
  2. Install Splunk.
  3. Configure the EC2 instance security group to permit access to ports 22, 8000, and 8088.

This post, however, provides an automated way to install Spunk on an EC2 instance:

  1. Download the RPM install file and upload it to an accessible Amazon S3 location.
  2. Upload the following YAML script into AWS CloudFormation.
  3. Provide the necessary parameters, as shown in the screenshots below.
  4. Choose Next and complete the steps to create your stack.

Splunk CloudFormation screen - 1

Splunk CloudFormation screen - 2

Splunk CloudFormation screen - 3

Alternatively, run an AWS CLI script like the following:

aws cloudformation create-stack \
--stack-name "splunk" \
--template-body file://splunk_cf.yaml \
--parameters ParameterKey=KeyName,ParameterValue="< Name of EC2 Key Pair >" \
  ParameterKey=InstanceType,ParameterValue="t3.medium" \
  ParameterKey=LatestAmiId,ParameterValue="/aws/service/ami-amazon-linux-latest/amzn2-ami-hvm-x86_64-gp2" \
  ParameterKey=VPCID,ParameterValue="vpc-XXXXXXXXXXX" \
  ParameterKey=PublicSubnet0,ParameterValue="subnet-XXXXXXXXX" \
  ParameterKey=SSHLocation,ParameterValue="< CIDR Range for SSH access >" \
  ParameterKey=VpcCidrRange,ParameterValue="172.20.0.0/16" \
  ParameterKey=RootVolumeSize,ParameterValue="100" \
  ParameterKey=S3BucketName,ParameterValue="< S3 Bucket Name >" \
  ParameterKey=S3Prefix,ParameterValue="splunk/splunk-8.2.5-77015bc7a462-linux-2.6-x86_64.rpm" \
  ParameterKey=S3DownloadLocation,ParameterValue="/tmp" \
--region < region > \
--capabilities CAPABILITY_IAM
  1. After you build the stack, navigate to the stack’s Outputs tab on the AWS CloudFormation console and note the internal and external DNS for the Splunk instance.

You use these later to configure the Splunk instance and log forwarding.

Splunk CloudFormation output screen

  1. To configure Splunk, go to the Resources tab for the CloudFormation stack and locate the physical ID of EC2Instance.
  2. Choose that link to go to the specific EC2 instance.
  3. Select the instance and choose Connect.

Connect to Splunk Instance

  1. On the Session Manager tab, choose Connect.

Connect to Instance

You’re redirected to the instance’s shell.

  1. Install and configure Splunk as follows:
$ sudo /opt/splunk/bin/splunk start --accept-license
…
Please enter an administrator username: admin
Password must contain at least:
   * 8 total printable ASCII character(s).
Please enter a new password: 
Please confirm new password:
…
Done
                                                           [  OK  ]

Waiting for web server at http://127.0.0.1:8000 to be available......... Done
The Splunk web interface is at http://ip-xx-xxx-xxx-x.us-east-2.compute.internal:8000
  1. Enter the Splunk site using the SplunkPublicDns value from the stack outputs (for example, http://ec2-xx-xxx-xxx-x.us-east-2.compute.amazonaws.com:8000). Note the port number of 8000.
  2. Log in with the user name and password you provided.

Splunk Login

Configure HTTP Event Collector

To configure Splunk to be able to receive logs from Fluent Bit, configure the HTTP Event Collector data input:

  1. Go to Settings and choose Data input.
  2. Choose HTTP Event Collector.
  3. Choose Global Settings.
  4. Select Enabled, keep port number 8088, then choose Save.
  5. Choose New Token.
  6. For Name, enter a name (for example, emreksdemo).
  7. Choose Next.
  8. For Available item(s) for Indexes, add at least the main index.
  9. Choose Review and then Submit.
  10. In the list of HTTP Event Collect tokens, copy the token value for emreksdemo.

You use it when configuring the Fluent Bit output.

splunk-http-collector-list

Option 2: Set up Amazon OpenSearch Service

Your other log aggregation option is to use Amazon OpenSearch Service.

Provision an OpenSearch Service domain

Provisioning an OpenSearch Service domain is very straightforward. In this post, we provide a simple script and configuration to provision a basic domain. To do it yourself, refer to Creating and managing Amazon OpenSearch Service domains.

Before you start, get the ARN of the IAM role that you use to run the Spark jobs. If you created the EKS cluster with the provided script, go to the CloudFormation stack emr-eks-iam-stack. On the Outputs tab, locate the IAMRoleArn output and copy this ARN. We also modify the IAM role later on, after we create the OpenSearch Service domain.

iam_role_emr_eks_job

If you’re using the provided opensearch.sh installer, before you run it, modify the file.

From the root folder of the GitHub repository, cd to opensearch and modify opensearch.sh (you can also use your preferred editor):

[../aws-emr-eks-log-forwarding] $ cd opensearch
[../aws-emr-eks-log-forwarding/opensearch] $ vi opensearch.sh

Configure opensearch.sh to fit your environment, for example:

# name of our Amazon OpenSearch cluster
export ES_DOMAIN_NAME="emreksdemo"

# Elasticsearch version
export ES_VERSION="OpenSearch_1.0"

# Instance Type
export INSTANCE_TYPE="t3.small.search"

# OpenSearch Dashboards admin user
export ES_DOMAIN_USER="emreks"

# OpenSearch Dashboards admin password
export ES_DOMAIN_PASSWORD='< ADD YOUR PASSWORD >'

# Region
export REGION='us-east-1'

Run the script:

[../aws-emr-eks-log-forwarding/opensearch] $ bash opensearch.sh

Configure your OpenSearch Service domain

After you set up your OpenSearch service domain and it’s active, make the following configuration changes to allow logs to be ingested into Amazon OpenSearch Service:

  1. On the Amazon OpenSearch Service console, on the Domains page, choose your domain.

Opensearch Domain Console

  1. On the Security configuration tab, choose Edit.

Opensearch Security Configuration

  1. For Access Policy, select Only use fine-grained access control.
  2. Choose Save changes.

The access policy should look like the following code:

{
  "Version": "2012-10-17",
  "Statement": [
    {
      "Effect": "Allow",
      "Principal": {
        "AWS": "*"
      },
      "Action": "es:*",
      "Resource": "arn:aws:es:xx-xxxx-x:xxxxxxxxxxxx:domain/emreksdemo/*"
    }
  ]
}
  1. When the domain is active again, copy the domain ARN.

We use it to configure the Amazon EMR job IAM role we mentioned earlier.

  1. Choose the link for OpenSearch Dashboards URL to enter Amazon OpenSearch Service Dashboards.

Opensearch Main Console

  1. In Amazon OpenSearch Service Dashboards, use the user name and password that you configured earlier in the opensearch.sh file.
  2. Choose the options icon and choose Security under OpenSearch Plugins.

opensearch menu

  1. Choose Roles.
  2. Choose Create role.

opensearch-create-role-button

  1. Enter the new role’s name, cluster permissions, and index permissions. For this post, name the role fluentbit_role and give cluster permissions to the following:
    1. indices:admin/create
    2. indices:admin/template/get
    3. indices:admin/template/put
    4. cluster:admin/ingest/pipeline/get
    5. cluster:admin/ingest/pipeline/put
    6. indices:data/write/bulk
    7. indices:data/write/bulk*
    8. create_index

opensearch-create-role-button

  1. In the Index permissions section, give write permission to the index fluent-*.
  2. On the Mapped users tab, choose Manage mapping.
  3. For Backend roles, enter the Amazon EMR job execution IAM role ARN to be mapped to the fluentbit_role role.
  4. Choose Map.

opensearch-map-backend

  1. To complete the security configuration, go to the IAM console and add the following inline policy to the EMR on EKS IAM role entered in the backend role. Replace the resource ARN with the ARN of your OpenSearch Service domain.
{
    "Version": "2012-10-17",
    "Statement": [
        {
            "Sid": "VisualEditor0",
            "Effect": "Allow",
            "Action": [
                "es:ESHttp*"
            ],
            "Resource": "arn:aws:es:us-east-2:XXXXXXXXXXXX:domain/emreksdemo"
        }
    ]
}

The configuration of Amazon OpenSearch Service is complete and ready for ingestion of logs from the Fluent Bit sidecar container.

Configure the Fluent Bit sidecar container

We need to write two configuration files to configure a Fluent Bit sidecar container. The first is the Fluent Bit configuration itself, and the second is the Fluent Bit sidecar subprocess configuration that makes sure that the sidecar operation ends when the main Spark job ends. The suggested configuration provided in this post is for Splunk and Amazon OpenSearch Service. However, you can configure Fluent Bit with other third-party log aggregators. For more information about configuring outputs, refer to Outputs.

Fluent Bit ConfigMap

The following sample ConfigMap is from the GitHub repo:

apiVersion: v1
kind: ConfigMap
metadata:
  name: fluent-bit-sidecar-config
  namespace: sparkns
  labels:
    app.kubernetes.io/name: fluent-bit
data:
  fluent-bit.conf: |
    [SERVICE]
        Flush         1
        Log_Level     info
        Daemon        off
        Parsers_File  parsers.conf
        HTTP_Server   On
        HTTP_Listen   0.0.0.0
        HTTP_Port     2020

    @INCLUDE input-application.conf
    @INCLUDE input-event-logs.conf
    @INCLUDE output-splunk.conf
    @INCLUDE output-opensearch.conf

  input-application.conf: |
    [INPUT]
        Name              tail
        Path              /var/log/spark/user/*/*
        Path_Key          filename
        Buffer_Chunk_Size 1M
        Buffer_Max_Size   5M
        Skip_Long_Lines   On
        Skip_Empty_Lines  On

  input-event-logs.conf: |
    [INPUT]
        Name              tail
        Path              /var/log/spark/apps/*
        Path_Key          filename
        Buffer_Chunk_Size 1M
        Buffer_Max_Size   5M
        Skip_Long_Lines   On
        Skip_Empty_Lines  On

  output-splunk.conf: |
    [OUTPUT]
        Name            splunk
        Match           *
        Host            < INTERNAL DNS of Splunk EC2 Instance >
        Port            8088
        TLS             On
        TLS.Verify      Off
        Splunk_Token    < Token as provided by the HTTP Event Collector in Splunk >

  output-opensearch.conf: |
[OUTPUT]
        Name            es
        Match           *
        Host            < HOST NAME of the OpenSearch Domain | No HTTP protocol >
        Port            443
        TLS             On
        AWS_Auth        On
        AWS_Region      < Region >
        Retry_Limit     6

In your AWS Cloud9 workspace, modify the ConfigMap accordingly. Provide the values for the placeholder text by running the following commands to enter the VI editor mode. If preferred, you can use PICO or a different editor:

[../aws-emr-eks-log-forwarding] $  cd kube/configmaps
[../aws-emr-eks-log-forwarding/kube/configmaps] $ vi emr_configmap.yaml

# Modify the emr_configmap.yaml as above
# Save the file once it is completed

Complete either the Splunk output configuration or the Amazon OpenSearch Service output configuration.

Next, run the following commands to add the two Fluent Bit sidecar and subprocess ConfigMaps:

[../aws-emr-eks-log-forwarding/kube/configmaps] $ kubectl apply -f emr_configmap.yaml
[../aws-emr-eks-log-forwarding/kube/configmaps] $ kubectl apply -f emr_entrypoint_configmap.yaml

You don’t need to modify the second ConfigMap because it’s the subprocess script that runs inside the Fluent Bit sidecar container. To verify that the ConfigMaps have been installed, run the following command:

$ kubectl get cm -n sparkns
NAME                         DATA   AGE
fluent-bit-sidecar-config    6      15s
fluent-bit-sidecar-wrapper   2      15s

Set up a customized EMR container image

To run the sample PySpark script, the script requires the Boto3 package that’s not available in the standard EMR container images. If you want to run your own script and it doesn’t require a customized EMR container image, you may skip this step.

Run the following script:

[../aws-emr-eks-log-forwarding] $ cd ecr
[../aws-emr-eks-log-forwarding/ecr] $ bash create_custom_image.sh <region> <EMR container image account number>

The EMR container image account number can be obtained from How to select a base image URI. This documentation also provides the appropriate ECR registry account number. For example, the registry account number for us-east-1 is 755674844232.

To verify the repository and image, run the following commands:

$ aws ecr describe-repositories --region < region > | grep emr-6.5.0-custom
            "repositoryArn": "arn:aws:ecr:xx-xxxx-x:xxxxxxxxxxxx:repository/emr-6.5.0-custom",
            "repositoryName": "emr-6.5.0-custom",
            "repositoryUri": " xxxxxxxxxxxx.dkr.ecr.xx-xxxx-x.amazonaws.com/emr-6.5.0-custom",

$ aws ecr describe-images --region < region > --repository-name emr-6.5.0-custom | jq .imageDetails[0].imageTags
[
  "latest"
]

Prepare pod templates for Spark jobs

Upload the two Spark driver and Spark executor pod templates to an S3 bucket and prefix. The two pod templates can be found in the GitHub repository:

  • emr_driver_template.yaml – Spark driver pod template
  • emr_executor_template.yaml – Spark executor pod template

The pod templates provided here should not be modified.

Submitting a Spark job with a Fluent Bit sidecar container

This Spark job example uses the bostonproperty.py script. To use this script, upload it to an accessible S3 bucket and prefix and complete the preceding steps to use an EMR customized container image. You also need to upload the CSV file from the GitHub repo, which you need to download and unzip. Upload the unzipped file to the following location: s3://<your chosen bucket>/<first level folder>/data/boston-property-assessment-2021.csv.

The following commands assume that you launched your EKS cluster and virtual EMR cluster with the parameters indicated in the GitHub repo.

Variable Where to Find the Information or the Value Required
EMR_EKS_CLUSTER_ID Amazon EMR console virtual cluster page
EMR_EKS_EXECUTION_ARN IAM role ARN
EMR_RELEASE emr-6.5.0-latest
S3_BUCKET The bucket you create in Amazon S3
S3_FOLDER The preferred prefix you want to use in Amazon S3
CONTAINER_IMAGE The URI in Amazon ECR where your container image is
SCRIPT_NAME emreksdemo-script or a name you prefer

Alternatively, use the provided script to run the job. Change the directory to the scripts folder in emreks and run the script as follows:

[../aws-emr-eks-log-forwarding] cd emreks/scripts
[../aws-emr-eks-log-forwarding/emreks/scripts] bash run_emr_script.sh < S3 bucket name > < ECR container image > < script path>

Example: bash run_emr_script.sh emreksdemo-123456 12345678990.dkr.ecr.us-east-2.amazonaws.com/emr-6.5.0-custom s3://emreksdemo-123456/scripts/scriptname.py

After you submit the Spark job successfully, you get a return JSON response like the following:

{
    "id": "0000000305e814v0bpt",
    "name": "emreksdemo-job",
    "arn": "arn:aws:emr-containers:xx-xxxx-x:XXXXXXXXXXX:/virtualclusters/upobc00wgff5XXXXXXXXXXX/jobruns/0000000305e814v0bpt",
    "virtualClusterId": "upobc00wgff5XXXXXXXXXXX"
}

What happens when you submit a Spark job with a sidecar container

After you submit a Spark job, you can see what is happening by viewing the pods that are generated and the corresponding logs. First, using kubectl, get a list of the pods generated in the namespace where the EMR virtual cluster runs. In this case, it’s sparkns. The first pod in the following code is the job controller for this particular Spark job. The second pod is the Spark executor; there can be more than one pod depending on how many executor instances are asked for in the Spark job setting—we asked for one here. The third pod is the Spark driver pod.

$ kubectl get pods -n sparkns
NAME                                        READY   STATUS    RESTARTS   AGE
0000000305e814v0bpt-hvwjs                   3/3     Running   0          25s
emreksdemo-script-1247bf80ae40b089-exec-1   0/3     Pending   0          0s
spark-0000000305e814v0bpt-driver            3/3     Running   0          11s

To view what happens in the sidecar container, follow the logs in the Spark driver pod and refer to the sidecar. The sidecar container launches with the Spark pods and persists until the file /var/log/fluentd/main-container-terminated is no longer available. For more information about how Amazon EMR controls the pod lifecycle, refer to Using pod templates. The subprocess script ties the sidecar container to this same lifecycle and deletes itself upon the EMR controlled pod lifecycle process.

$ kubectl logs spark-0000000305e814v0bpt-driver -n sparkns  -c custom-side-car-container --follow=true

Waiting for file /var/log/fluentd/main-container-terminated to appear...
AWS for Fluent Bit Container Image Version 2.24.0Start wait: 1652190909
Elapsed Wait: 0
Not found count: 0
Waiting...
Fluent Bit v1.9.3
* Copyright (C) 2015-2022 The Fluent Bit Authors
* Fluent Bit is a CNCF sub-project under the umbrella of Fluentd
* https://fluentbit.io

[2022/05/10 13:55:09] [ info] [fluent bit] version=1.9.3, commit=9eb4996b7d, pid=11
[2022/05/10 13:55:09] [ info] [storage] version=1.2.0, type=memory-only, sync=normal, checksum=disabled, max_chunks_up=128
[2022/05/10 13:55:09] [ info] [cmetrics] version=0.3.1
[2022/05/10 13:55:09] [ info] [output:splunk:splunk.0] worker #0 started
[2022/05/10 13:55:09] [ info] [output:splunk:splunk.0] worker #1 started
[2022/05/10 13:55:09] [ info] [output:es:es.1] worker #0 started
[2022/05/10 13:55:09] [ info] [output:es:es.1] worker #1 started
[2022/05/10 13:55:09] [ info] [http_server] listen iface=0.0.0.0 tcp_port=2020
[2022/05/10 13:55:09] [ info] [sp] stream processor started
Waiting for file /var/log/fluentd/main-container-terminated to appear...
Last heartbeat: 1652190914
Elapsed Time since after heartbeat: 0
Found count: 0
list files:
-rw-r--r-- 1 saslauth 65534 0 May 10 13:55 /var/log/fluentd/main-container-terminated
Last heartbeat: 1652190918

…

[2022/05/10 13:56:09] [ info] [input:tail:tail.0] inotify_fs_add(): inode=58834691 watch_fd=6 name=/var/log/spark/user/spark-0000000305e814v0bpt-driver/stdout-s3-container-log-in-tail.pos
[2022/05/10 13:56:09] [ info] [input:tail:tail.1] inotify_fs_add(): inode=54644346 watch_fd=1 name=/var/log/spark/apps/spark-0000000305e814v0bpt
Outside of loop, main-container-terminated file no longer exists
ls: cannot access /var/log/fluentd/main-container-terminated: No such file or directory
The file /var/log/fluentd/main-container-terminated doesn't exist anymore;
TERMINATED PROCESS
Fluent-Bit pid: 11
Killing process after sleeping for 15 seconds
root        11     8  0 13:55 ?        00:00:00 /fluent-bit/bin/fluent-bit -e /fluent-bit/firehose.so -e /fluent-bit/cloudwatch.so -e /fluent-bit/kinesis.so -c /fluent-bit/etc/fluent-bit.conf
root       114     7  0 13:56 ?        00:00:00 grep fluent
Killing process 11
[2022/05/10 13:56:24] [engine] caught signal (SIGTERM)
[2022/05/10 13:56:24] [ info] [input] pausing tail.0
[2022/05/10 13:56:24] [ info] [input] pausing tail.1
[2022/05/10 13:56:24] [ warn] [engine] service will shutdown in max 5 seconds
[2022/05/10 13:56:25] [ info] [engine] service has stopped (0 pending tasks)
[2022/05/10 13:56:25] [ info] [input:tail:tail.1] inotify_fs_remove(): inode=54644346 watch_fd=1
[2022/05/10 13:56:25] [ info] [input:tail:tail.0] inotify_fs_remove(): inode=60917120 watch_fd=1
[2022/05/10 13:56:25] [ info] [input:tail:tail.0] inotify_fs_remove(): inode=60917121 watch_fd=2
[2022/05/10 13:56:25] [ info] [input:tail:tail.0] inotify_fs_remove(): inode=58834690 watch_fd=3
[2022/05/10 13:56:25] [ info] [input:tail:tail.0] inotify_fs_remove(): inode=58834692 watch_fd=4
[2022/05/10 13:56:25] [ info] [input:tail:tail.0] inotify_fs_remove(): inode=58834689 watch_fd=5
[2022/05/10 13:56:25] [ info] [input:tail:tail.0] inotify_fs_remove(): inode=58834691 watch_fd=6
[2022/05/10 13:56:25] [ info] [output:splunk:splunk.0] thread worker #0 stopping...
[2022/05/10 13:56:25] [ info] [output:splunk:splunk.0] thread worker #0 stopped
[2022/05/10 13:56:25] [ info] [output:splunk:splunk.0] thread worker #1 stopping...
[2022/05/10 13:56:25] [ info] [output:splunk:splunk.0] thread worker #1 stopped
[2022/05/10 13:56:25] [ info] [output:es:es.1] thread worker #0 stopping...
[2022/05/10 13:56:25] [ info] [output:es:es.1] thread worker #0 stopped
[2022/05/10 13:56:25] [ info] [output:es:es.1] thread worker #1 stopping...
[2022/05/10 13:56:25] [ info] [output:es:es.1] thread worker #1 stopped

View the forwarded logs in Splunk or Amazon OpenSearch Service

To view the forwarded logs, do a search in Splunk or on the Amazon OpenSearch Service console. If you’re using a shared log aggregator, you may have to filter the results. In this configuration, the logs tailed by Fluent Bit are in the /var/log/spark/*. The following screenshots show the logs generated specifically by the Kubernetes Spark driver stdout that were forwarded to the log aggregators. You can compare the results with the logs provided using kubectl:

kubectl logs < Spark Driver Pod > -n < namespace > -c spark-kubernetes-driver --follow=true

…
root
 |-- PID: string (nullable = true)
 |-- CM_ID: string (nullable = true)
 |-- GIS_ID: string (nullable = true)
 |-- ST_NUM: string (nullable = true)
 |-- ST_NAME: string (nullable = true)
 |-- UNIT_NUM: string (nullable = true)
 |-- CITY: string (nullable = true)
 |-- ZIPCODE: string (nullable = true)
 |-- BLDG_SEQ: string (nullable = true)
 |-- NUM_BLDGS: string (nullable = true)
 |-- LUC: string (nullable = true)
…

|02108|RETAIL CONDO           |361450.0            |63800.0        |5977500.0      |
|02108|RETAIL STORE DETACH    |2295050.0           |988200.0       |3601900.0      |
|02108|SCHOOL                 |1.20858E7           |1.20858E7      |1.20858E7      |
|02108|SINGLE FAM DWELLING    |5267156.561085973   |1153400.0      |1.57334E7      |
+-----+-----------------------+--------------------+---------------+---------------+
only showing top 50 rows

The following screenshot shows the Splunk logs.

splunk-result-driver-stdout

The following screenshots show the Amazon OpenSearch Service logs.

opensearch-result-driver-stdout

Optional: Include a buffer between Fluent Bit and the log aggregators

If you expect to generate a lot of logs because of high concurrent Spark jobs creating multiple individual connects that may overwhelm your Amazon OpenSearch Service or Splunk log aggregation clusters, consider employing a buffer between the Fluent Bit sidecars and your log aggregator. One option is to use Amazon Kinesis Data Firehose as the buffering service.

Kinesis Data Firehose has built-in delivery to both Amazon OpenSearch Service and Splunk. If using Amazon OpenSearch Service, refer to Loading streaming data from Amazon Kinesis Data Firehose. If using Splunk, refer to Configure Amazon Kinesis Firehose to send data to the Splunk platform and Choose Splunk for Your Destination.

To configure Fluent Bit to Kinesis Data Firehose, add the following to your ConfigMap output. Refer to the GitHub ConfigMap example and add the @INCLUDE under the [SERVICE] section:

     @INCLUDE output-kinesisfirehose.conf
…

  output-kinesisfirehose.conf: |
    [OUTPUT]
        Name            kinesis_firehose
        Match           *
        region          < region >
        delivery_stream < Kinesis Firehose Stream Name >

Optional: Use data streams for Amazon OpenSearch Service

If you’re in a scenario where the number of documents grows rapidly and you don’t need to update older documents, you need to manage the OpenSearch Service cluster. This involves steps like creating a rollover index alias, defining a write index, and defining common mappings and settings for the backing indexes. Consider using data streams to simplify this process and enforce a setup that best suits your time series data. For instructions on implementing data streams, refer to Data streams.

Clean up

To avoid incurring future charges, delete the resources by deleting the CloudFormation stacks that were created with this script. This removes the EKS cluster. However, before you do that, remove the EMR virtual cluster first by running the delete-virtual-cluster command. Then delete all the CloudFormation stacks generated by the deployment script.

If you launched an OpenSearch Service domain, you can delete the domain from the OpenSearch Service domain. If you used the script to launch a Splunk instance, you can go to the CloudFormation stack that launched the Splunk instance and delete the CloudFormation stack. This removes remove the Splunk instance and associated resources.

You can also use the following scripts to clean up resources:

Conclusion

EMR on EKS facilitates running Spark jobs on Kubernetes to achieve very fast and cost-efficient Spark operations. This is made possible through scheduling transient pods that are launched and then deleted the jobs are complete. To log all these operations in the same lifecycle of the Spark jobs, this post provides a solution using pod templates and Fluent Bit that is lightweight and powerful. This approach offers a decoupled way of log forwarding based at the Spark application level and not at the Kubernetes cluster level. It also avoids routing through intermediaries like CloudWatch, reducing cost and complexity. In this way, you can address security concerns and DevOps and system administration ease of management while providing Spark users with insights into their Spark jobs in a cost-efficient and functional way.

If you have questions or suggestions, please leave a comment.


About the Author

Matthew Tan is a Senior Analytics Solutions Architect at Amazon Web Services and provides guidance to customers developing solutions with AWS Analytics services on their analytics workloads.                       

How to Mitigate Docker Hub’s pull rate limit error through AWS Code build and ECR

Post Syndicated from Bijith Nair original https://aws.amazon.com/blogs/devops/how-to-mitigate-docker-hubs-pull-rate-limit-error-through-aws-code-build-and-ecr/

How to mitigate Docker Hub’s pull rate limit errors

Docker, Inc. has announced that its hosted repository service, Docker Hub, will begin limiting the rate at which the Docker images are being pulled. The pull rate limit will purely be based on the individual IP Address. The anonymous user can do 100 pulls per 6 hours per IP Address, while the authenticated user can do 200 pulls per 6 hours.

This post shows how you can overcome those errors while you’re working with AWS Developer Tools, such as AWS CodeCommit, AWS CodeBuild, and Amazon Elastic Container Registry (Amazon ECR).

Solution overview

The workflow and architecture of the solution work as follows:

  1. The developer will push the code, in this case (buildspec, Dockerfile, README.md) to CodeCommit by using Git client installed locally.
  2. CodeBuild will pull the latest commit id from CodeCommit.
  3. CodeBuild will build the base Docker image by going through the build steps listed in buildspec and Dockerfile.

Finally, Docker image will be pushed to Amazon ECR, and it can be used for future deployments.

AWS Services Overview:

Architectural Overview - Leverage AWS Developer tools to mitigate Docker hub's pull rate limit error

Figure 1. Architectural Overview – Leverage AWS Developer tools to mitigate Docker hub’s pull rate limit error.

For this post, we’ll be using the following AWS services

  • AWS CodeCommit – a fully-managed source control service that hosts secure Git-based repositories.
  • AWS CodeBuild – a fully managed continuous integration service that compiles source code, runs tests, and produces software packages that are ready to deploy.
  • Amazon ECR – an AWS managed container image registry service that is secure, scalable, and reliable.

Prerequisites

The prerequisites, before we build the pipeline, are as follows:

Setup Amazon ECR repositories

We’ll be setting up two Amazon ECR repositories. The first repository, “golang”, will hold the base image which we will be migrating from Docker hub. And the second repository, “mydemorepo”, will hold the final image for your sample application.

ECR Repositories with Source and Target image

Figure 2. ECR Repositories with Source and Target image.

Migrate your existing Docker image from Docker Hub to Amazon ECR

Note that for this post, I’ll be using golang:1.12-alpine as the base Docker image to be migrated to Amazon ECR.

Once you have your base repository setup, the next step is to pull the golang:1.12-alpine public image from docker hub to you laptop/Server.

To do that, log in to your local server where you have deployed all of the prerequisites. This includes the Docker engine, Git Client, AWS CLI, etc., and run the following command:

docker pull golang:1.12-alpine

Authenticate to your Amazon ECR private registry, and click here to learn more about private registry authentication.

aws ecr get-login-password --region us-east-1 | docker login --username AWS --password-stdin 12345678910.dkr.ecr.us-east-1.amazonaws.com

Apply the appropriate Tag to your image.

docker tag golang:1.12-alpine 12345678910.dkr.ecr.us-east-1.amazonaws.com/golang:1.12-alpine

Push your image to the Amazon ECR repository.

docker push 150359982618.dkr.ecr.us-east-1.amazonaws.com/golang:1.12-alpine

The Source Image

Figure 3. The Source Image.

Once your image gets pushed to Amazon ECR with all of the required tags, the next step is to use this base image as the source image to build our sample application. Furthermore, while going through the “Overview of the Solution” section, you might have noticed that we must have a source code repository for CodeBuild to fetch the latest code from, and to build a sample application. Let’s go through how to set up your source code repository.

Set up a source code repository using CodeCommit

Let’s start by setting up the repository name. In this case, let’s call it “mysampleapp”. Keep rest of the settings as is, and then select create.

Screenshot for creating a repository under AWS Code Commit

Figure 4. Screenshot for creating a repository under AWS Code Commit.

Once the repository gets created, go to the top-right corner. Under Clone URL, select Clone HTTPS.

Clone URL to copy the code Locally on your desktop or server

Figure 5. Clone URL to copy the code Locally on your desktop or server.

Go back to your local server or laptop where you want to clone the repo, and authenticate your repository. Learn more about how to HTTPS connections to AWS Codecommit repositories.

git clone https://git-codecommit.us-east-1.amazonaws.com/v1/repos/mysampleapp mysampleapp

Note that you have your empty repository cloned locally with a folder name “mysampleapp”. The next step is to set up Dockerfile and buildspec.

Set up a Dockerfile and buildspec for building the base image of your Sample Application

To build a Docker image, we’ll set up three files under the “mysampleapp” folder.

Buildspec.yml
Dockerfile
README.md

List out the base code pushed to AWS Code commit

Figure 6. List out the base code pushed to AWS Code commit.

Note that I have also listed the content inside of buildspec.yml, Dockerfile, and ReadME.md in case you want a sample code to test the scenario.

buildspec.yml

version: 0.2
phases:
pre_build:
commands:
- echo Logging in to Amazon ECR...
- REPOSITORY_URI=12345678910.dkr.ecr.us-east-1.amazonaws.com/mydemorepo
- AWS_DEFAULT_REGION=us-east-1
- AWS_ACCOUNT_ID=12345678910
- aws ecr get-login-password --region $AWS_DEFAULT_REGION | docker login --username AWS --password-stdin $AWS_ACCOUNT_ID.dkr.ecr.$AWS_DEFAULT_REGION.amazonaws.com
- IMAGE_REPO_NAME=mydemorepo
- COMMIT_HASH=$(echo $CODEBUILD_RESOLVED_SOURCE_VERSION | cut -c 1-7)
- IMAGE_TAG=build-$(echo $CODEBUILD_BUILD_ID | awk -F":" '{print $2}')
build:
commands:
- echo Build started on `date`
- echo Building the Docker image...
- docker build -t $REPOSITORY_URI:latest .
- docker images
- docker tag $REPOSITORY_URI:latest $REPOSITORY_URI:$IMAGE_TAG
post_build:
commands:
- echo Build completed on `date`
- echo Pushing the Docker image...
- docker push $REPOSITORY_URI:latest
- docker push $REPOSITORY_URI:$IMAGE_TAG

Dockerfile

Point your Dockfile to use Amazon ECR repository instead of Docker hub.

FROM golang:1.12-alpine AS build << Replace the public Image with ECR private image

FROM 150359982618.dkr.ecr.us-east-1.amazonaws.com/golang: 1.12-alpine

AS build

#Install git

RUN apk add --no-cache git

#Get the hello world package from a GitHub repository

RUN go get github.com/golang/example/hello

WORKDIR /go/src/github.com/golang/example/hello

#Build the project and send the output to /bin/HelloWorld

RUN go build -o /bin/HelloWorld

README.md

> Demo Repository has files related to CodeBuild spec and Dockerfile

* buildspec.yaml
* Dockerfile

Now, commit your changes locally, and push them to Amazon ECR. Note that to learn more about how to set up HTTPS users using Git Credentials, click here.

git add .
git commit -m "My First Commit - Sample App"
git push -u origin master

Now, go back to your AWS Management Console, and Under Developer Tools, select CodeCommit. Go to mysampleapp, and you should see three files with the latest commits.

Screenshot with buildspec, Dockerfile and README.

Figure 7. Screenshot with buildspec, Dockerfile and README

That concludes our setup to CodeCommit. Next, we’ll set up a build project.

Set up a CodeBuild project

Enter the project name, in this case let’s use “mysamplbuild”.

Setting up a Build Project.

Figure 8. Setting up a Build Project.

Select the provider as CodeCommit, followed by the repository and the branch that contains the latest commit.

Selecting the source code provider which is Code Commit and the source repository.

Figure 9.  Selecting the source code provider which is Code Commit and the source repository.

Select the runtime as standard, and then choose the latest Amazon Linux image. Make sure that the environment type is set to Linux. Privileged option should be checked. For the rest of the options, go with the defaults.

Required environment variables and attributes.

Figure 10.  Required environment variables and attributes.

Choose the buildspec.

Figure 11.  Choose the buildspec.

Once the project gets created, select the project, and select start Build.

Screenshot of the build project along with details.

Figure 12. Screenshot of the build project along with details.

Once you trigger the build, you will notice that CodeBuild is pulling the image from Amazon ECR instead of Docker hub.

The log file for the build.

Figure 13. The log file for the build.

Clean up

To avoid incurring future charges, delete the resources.

Conclusion

Developers can use AWS to host both their private and public container images. This decreases the need to use different public websites and registries. Public images will be geo-replicated for reliable availability around the world, and they’ll offer fast downloads to quickly serve up images on-demand. Anyone (with or without an AWS account) will be able to browse and pull containerized software for use in their own applications.

Author:

Bijith Nair

Bijith Nair is a Solutions Architect at Amazon Web Services, Based out of Dallas, Texas. He helps customers architect, develop, scalable and highly available solutions to support their business innovation.

Jenkins high availability and disaster recovery on AWS

Post Syndicated from James Bland original https://aws.amazon.com/blogs/devops/jenkins-high-availability-and-disaster-recovery-on-aws/

We often hear from customers about their challenges architecting Jenkins for scale and high availability (HA). Jenkins was originally built as a continuous integration (CI) system to test software before it was committed to a repository. Since its beginning, Jenkins has grown out of necessity versus grand master plan. Developers who extended Jenkins favored speed of creating functionality over performance or scalability of the entire system. This is not to say that it’s impossible to scale Jenkins, it’s only mentioned here to highlight the challenges and technical debt that has accumulated because of the prioritization of features versus developing towards a specific architecture. In this post, we discuss these challenges and our proposed solution.

Challenges with Jenkins at scale and HA

Business and customer demand are forcing organizations to increase the speed and agility at which they release features and functionality. As organizations make this transition, the usage of continuous integration and continuous delivery (CI/CD) increases, which drives the need to scale Jenkins. Overlay this with an organization that commits hundreds of changes per day and works around the clock, with developers dispersed globally, and you end up with an operational situation where there is no room for downtime. To mitigate the risk of impacting an organization’s ability to release when they need it, developers require a system that not only scales but is also highly available.

The ability to scale Jenkins and provide HA comes down to two problems. One is the ability to scale compute to handle additional jobs, and the second is storage. To scale compute, we typically do it in one of two ways, horizontally or vertically. Horizontally means we scale Jenkins to add additional compute nodes. Scaling vertically means we scale Jenkins by adding more resources to the compute node.

Let’s start with the storage problem. Jenkins is designed around the local file system. Anyone who has spent time around Jenkins is aware that logs, cloned repos, plugins, and build artifacts are stored into JENKINS_HOME. Local file systems, while good for single-server designs, tend to be a challenge when HA comes into the picture. In on-premises designs, administrators have often used Network File System (NFS) and Storage Area Networks (SAN) to achieve some scale and resiliency. This type of design comes with a trade-off of performance and doesn’t provide the true HA and inherent disaster recovery (DR) required to meet the demands of the business.

Because of the local file system constraint, there are two native families of storage available in AWS: Amazon Elastic Block Store (Amazon EBS) and Amazon Elastic File System (Amazon EFS). Amazon EBS is great for a single-server design in a single Availability Zone. The challenge is trying to scale a single-server design to support HA. Because of the requirement to assign an EBS volume to a specific Availability Zone, you can’t automatically transition the EBS volume to another Availability Zone and attach it to a Jenkins instance. If you don’t mind having an impact on Recovery Time Objective (RTO) and Recovery Point Objective (RPO), a solution using Amazon EBS snapshots copied to additional Availability Zones might work. Although EBS snapshot copy is possible, it’s not a recommended solution because it doesn’t scale and has complexities in building and maintaining this type of solution.

Amazon EFS as an alternative has worked well for customers that don’t have high usage patterns of Jenkins. All Jenkins instances within the Region can access the Amazon EFS file system and data durably stored in multiple Availability Zones. If a single Availability Zone experiences an outage, the Jenkins file system is still accessible from other Availability Zones providing HA for the storage layer. This solution is not recommended for high-usage systems due to the way that Jenkins reads and writes data. Jenkins’s access pattern is skewed towards writing data such as logs, cloned repos, and building artifacts versus reading data. Amazon EFS, on the other hand, is designed for workloads that read more than they write. On high-usage workloads, customers have experienced Jenkins build slowness and Jenkins page load latency. This is why Amazon EFS isn’t recommended for high-usage Jenkins systems.

Solution for Jenkins at scale and HA

Solving the compute problem is relatively straightforward by using Amazon Elastic Kubernetes Service (Amazon EKS). In the context of Jenkins, an organization would run Jenkins in an Amazon EKS cluster that spans multiple Availability Zones, as shown in the following diagram.

Diagram showing Jenkins deployment in Amazon EKS with three availability zones inside a VPC

Figure 1 –Jenkins deployment in Amazon EKS with multiple availability zones.

Jenkins Controller and Agent would run in an Availability Zone as a Kubernetes pod. Amazon EKS is designed around Desired State Configuration (DSC), which means that it continuously make sure that the running environment matches the configuration that has been applied to Amazon EKS. In practice, when Amazon EKS is told that you want a single pod of Jenkins running, it monitors and makes sure that pod is always running. If an Availability Zone is unavailable, Amazon EKS launches a new node in another Availability Zone and deploys all pods to meet any necessary constraints defined in Amazon EKS. With this option, we still need to have the data in other Availability Zones, which we cover later in this post.

The only option of scaling Jenkins controllers is vertical. Scaling Jenkins horizontally could lead to an undesirable state because the system wasn’t designed to have multiple instances of Jenkins attached to the same storage layer. There is no exclusive file locking mechanism to ensure data consistency. For organizations that have exhausted the limits with vertical scaling, the recommendation is to run multiple independent Jenkins controllers and separate them per team or group. Vertical scaling of Jenkins is simpler in Amazon EKS. Node sizes and container memory are controlled by configuration. Increasing memory size is as simple as changing a container’s memory setting. Due to the ease of changing configuration, it’s best to start with a lower memory setting, monitor performance, and increase as necessary. You want to find a good balance between price and performance.

For Jenkins agents, there are many options to scale the compute. In the context of scale and HA, the best options are to use AWS CodeBuild, AWS Fargate for Amazon EKS, or Amazon EKS managed node groups. With CodeBuild, you don’t need to provision, manage, or scale your build servers. CodeBuild scales continuously and processes multiple builds concurrently. You can use the Jenkins plugin for CodeBuild to integrate CodeBuild with Jenkins. Fargate is a good option but has some challenges if you’re trying to build container images within a container due to permissions necessary that aren’t exposed in Fargate. For additional information on how to overcome this challenge with Jenkins, refer to How to build container images with Amazon EKS on Fargate.

Now let’s look at the storage layer and see how LINBIT is helping organizations solve this problem with LINSTOR. LINBIT’s LINSTOR is an open-source management tool designed to manage block storage devices. Its primary use case is to provide Linux block storage for Kubernetes and other public and private cloud platforms. LINBIT also provides enterprise subscription for LINSTOR, which include technical support with SLA.

The following diagram illustrates a LINSTOR storage solution running on Amazon EKS using multiple Availability Zones and Amazon Simple Storage Service (Amazon S3) for snapshots.

Diagram showing LINSTOR storage solution running on Amazon EKS across three availability zone with snapshot stored in Amazon S3.

Figure 2. LINSTOR storage solution running on Amazon EKS using multiple availability zones and S3 for snapshot.

LINSTOR is composed of a control plane and a data plane. The control plane consists of a set of containers deployed into Amazon EKS and is responsible for managing the data plane. The data plane consists of a collection of open-source block storage software, most importantly LINBIT’s Distributed Replicated Storage System (DRBD) software. DRBD is responsible for provisioning and synchronously replicating storage between Amazon EKS worker instances in different Availability Zones.

LINSTOR is deployed via Helm into Amazon EKS, and the LINSTOR cluster is initialized by the LINSTOR Operator. Once deployed, LINSTOR volumes and volume snapshots are managed via Kubernetes Storage Classes and Snapshot Classes in a Kubernetes native fashion. LINSTOR volumes are backed by LINSTOR objects known as storage pools, which are composed of one or more EBS volumes attached to each Amazon EKS worker instance.

LINSTOR volumes layer DRBD on top of the worker’s attached EBS volume to enable synchronous replication between peers in the Amazon EKS cluster. This ensures that you have an identical copy of your persistent volume on the EBS volumes in each Availability Zone. In the event of an Availability Zone outage or planned migration, Amazon EKS moves the Jenkins deployment to another Availability Zone where the persistent volume copy is available. In terms of scaling, LINBIT DRDB supports up to 32 replicas per volume, with a maximum size of 1 PiB per volume. LINSTOR node itself can scale beyond hundreds of nodes, as shown in this case study.

LINSTOR also provides an HA Controller component in its control plane to speed up failover times during outages. LINSTOR’s HA Controller looks for pods with a specific label, and if LINSTOR’s persistent volumes replication network becomes interrupted (like during an Availability Zone outage), LINSTOR reschedules the pod sooner than the default Kubernetes pod-eviction-timeout.

LINBIT provides a detailed full installation for Jenkins HA in AWS. A sample of LINSTOR’s helm values supporting these features is as follows:

operator:
  satelliteSet:
    storagePools:
      lvmThinPools:
      - name: lvm-thin
        thinVolume: thinpool
        volumeGroup: ""
        devicePaths:
        - /dev/nvme1n1
    kernelModuleInjectionMode: Compile
stork:
  enabled: false
csi:
  enableTopology: true
etcd:
  replicas: 3
haController:
  replicas: 3

After LINSTOR is deployed, you create a Kubernetes StorageClass supporting persistent volumes with three replicas using the following example:

apiVersion: storage.k8s.io/v1
kind: StorageClass
metadata:
  name: "linstor-csi-lvm-thin-r3"
provisioner: linstor.csi.linbit.com
parameters:
  allowRemoteVolumeAccess: "false"
  autoPlace: "3"
  storagePool: "lvm-thin"
  DrbdOptions/Disk/disk-flushes: "no"
  DrbdOptions/Disk/md-flushes: "no"
  DrbdOptions/Net/max-buffers: "10000"
reclaimPolicy: Retain
allowVolumeExpansion: true
volumeBindingMode: WaitForFirstConsumer

Finally, Jenkins helm charts are deployed into Amazon EKS with the following Helm values to request a PV from the LINSTOR StorageClass:

persistence:
  storageClass: linstor-csi-lvm-thin-r3
  size: "200Gi"
controller:
  serviceType: LoadBalancer
  podLabels:
    linstor.csi.linbit.com/on-storage-lost: remove

To protect against entire AWS Region outages and provide disaster recovery, LINSTOR takes volume snapshots and replicates it cross-Region using Amazon S3. LINSTOR requires read and write access to the target S3 bucket using AWS credentials provided as Kubernetes secrets:

kind: Secret
apiVersion: v1
metadata:
  name: linstor-csi-s3-access
  namespace: default
type: linstor.csi.linbit.com/s3-credentials.v1
immutable: true
stringData:
  access-key: REDACTED
  secret-key: REDACTED

The target S3 bucket is referenced as a snapshot shipping target using a LINSTOR S3 VolumeSnapshotClass. The following example shows a VolumeSnapshotClass referencing the S3 bucket’s secret and additional configuration for the target S3 bucket:

kind: VolumeSnapshotClass
apiVersion: snapshot.storage.k8s.io/v1
metadata:
  name: linstor-csi-snapshot-class-s3
driver: linstor.csi.linbit.com
deletionPolicy: Delete
parameters:
  snap.linstor.csi.linbit.com/type: S3
  snap.linstor.csi.linbit.com/remote-name: s3-us-west-2
  snap.linstor.csi.linbit.com/allow-incremental: "false"
  snap.linstor.csi.linbit.com/s3-bucket: name-of-bucket-123
  snap.linstor.csi.linbit.com/s3-endpoint: http://s3.us-west-2.amazonaws.com
  snap.linstor.csi.linbit.com/s3-signing-region: us-west-2
  snap.linstor.csi.linbit.com/s3-use-path-style: "false"
  # Secret to store access credentials
  csi.storage.k8s.io/snapshotter-secret-name: linstor-csi-s3-access
  csi.storage.k8s.io/snapshotter-secret-namespace: default

Jenkins deployment persistent volume claim (PVC) is stored as a snapshot in Amazon S3 by using a standard Kubernetes volumeSnapshot definition with LINSTOR’s snapshot class for Amazon S3:

apiVersion: snapshot.storage.k8s.io/v1
kind: VolumeSnapshot
metadata:
  name: jenkins-dr-snapshot-0
spec:
  volumeSnapshotClassName: linstor-csi-snapshot-class-s3
  source:
    persistentVolumeClaimName: <jenkins-pvc-name>

Conclusion

In this post, we explained  the challenges to scale Jenkins for HA and DR. We also reviewed Jenkins storage architecture with Amazon EBS and Amazon EFS and where to apply these. We demonstrated how you can use Amazon EKS to scale Jenkins compute for HA and how AWS partner solutions such as LINBIT LINSTOR can help scale Jenkins storage for HA and DR. Combining both solutions can help organizations maintain their ability to deploy software with speed and agility. We hope you found this post useful as you think through building your CI/CD infrastructure in AWS. To learn more about running Jenkins in Amazon EKS, check out Orchestrate Jenkins Workloads using Dynamic Pod Autoscaling with Amazon EKS. To find out more information about LINBIT’s LINSTOR, check the Jenkins technical guide.

Authors:

James Bland

James is a 25+ year veteran in the IT industry helping organizations from startups to ultra large enterprises achieve their business objectives. He has held various leadership roles in software development, worldwide infrastructure automation, and enterprise architecture. James has been
practicing DevOps long before the term became popularized. He holds a doctorate in computer science with a focus on leveraging machine learning algorithms for scaling systems. In his current role at AWS as the APN Global Tech Lead for DevOps, he works with partners to help shape the future of technology.

Welly Siauw

Welly Siauw is a Sr. Partner Solution Architect at Amazon Web Services (AWS). He spends his day working with customers and partners, solving architectural challenges. He is passionate about service integration and orchestration, serverless and artificial intelligence (AI) and machine learning (ML). He authored several AWS blogs and actively leading AWS Immersion Days and Activation Days. Welly spends his free time tinkering with espresso machine and outdoor hiking.

Matt Kereczman

Matt Kereczman is a Solutions Architect at LINBIT with a long history of Linux System Administration and Linux System Engineering. Matt is a cornerstone in LINBIT’s technical team, and plays an important role in making LINBIT and LINBIT’s customer’s solutions great. Matt was President of the GNU/Linux Club at Northampton Area Community College prior to graduating with Honors from Pennsylvania College of Technology with a BS in Information Security. Open Source Software and Hardware are at the core of most of Matt’s hobbies.

Multi-Region Terraform Deployments with AWS CodePipeline using Terraform Built CI/CD

Post Syndicated from Lerna Ekmekcioglu original https://aws.amazon.com/blogs/devops/multi-region-terraform-deployments-with-aws-codepipeline-using-terraform-built-ci-cd/

As of February 2022, the AWS Cloud spans 84 Availability Zones within 26 geographic Regions, with announced plans for more Availability Zones and Regions. Customers can leverage this global infrastructure to expand their presence to their primary target of users, satisfying data residency requirements, and implementing disaster recovery strategy to make sure of business continuity. Although leveraging multi-Region architecture would address these requirements, deploying and configuring consistent infrastructure stacks across multi-Regions could be challenging, as AWS Regions are designed to be autonomous in nature. Multi-region deployments with Terraform and AWS CodePipeline can help customers with these challenges.

In this post, we’ll demonstrate the best practice for multi-Region deployments using HashiCorp Terraform as infrastructure as code (IaC), and AWS CodeBuild , CodePipeline as continuous integration and continuous delivery (CI/CD) for consistency and repeatability of deployments into multiple AWS Regions and AWS Accounts. We’ll dive deep on the IaC deployment pipeline architecture and the best practices for structuring the Terraform project and configuration for multi-Region deployment of multiple AWS target accounts.

You can find the sample code for this solution here

Solutions Overview

Architecture

The following architecture diagram illustrates the main components of the multi-Region Terraform deployment pipeline with all of the resources built using IaC.

DevOps engineer initially works against the infrastructure repo in a short-lived branch. Once changes in the short-lived branch are ready, DevOps engineer gets them reviewed and merged into the main branch. Then, DevOps engineer git tags the repo. For any future changes in the infra repo, DevOps engineer repeats this same process.

Git tags named “dev_us-east-1/research/1.0”, “dev_eu-central-1/research/1.0”, “dev_ap-southeast-1/research/1.0”, “dev_us-east-1/risk/1.0”, “dev_eu-central-1/risk/1.0”, “dev_ap-southeast-1/risk/1.0” corresponding to the version 1.0 of the code to release from the main branch using git tagging. Short-lived branch in between each version of the code, followed by git tags corresponding to each subsequent version of the code such as version 1.1 and version 2.0.”

Fig 1. Tagging to release from the main branch.

  1. The deployment is triggered from DevOps engineer git tagging the repo, which contains the Terraform code to be deployed. This action starts the deployment pipeline execution.
    Tagging with ‘dev_us-east-1/research/1.0’ triggers a pipeline to deploy the research dev account to us-east-1. In our example git tag ‘dev_us-east-1/research/1.0’ contains the target environment (i.e., dev), AWS Region (i.e. us-east-1), team (i.e., research), and a version number (i.e., 1.0) that maps to an annotated tag on a commit ID. The target workload account aliases (i.e., research dev, risk qa) are mapped to AWS account numbers in the environment configuration files of the infra repo in AWS CodeCommit.
The central tooling account contains the CodeCommit Terraform infra repo, where DevOps engineer has git access, along with the pipeline trigger, the CodePipeline dev pipeline consisting of the S3 bucket with Terraform infra repo and git tag, CodeBuild terraform tflint scan, checkov scan, plan and apply. Terraform apply points using the cross account role to VPC containing an Application Load Balancer (ALB) in eu-central-1 in the dev target workload account. A qa pipeline, a staging pipeline, a prod pipeline are included along with a qa target workload account, a staging target workload account, a prod target workload account. EventBridge, Key Management Service, CloudTrail, CloudWatch in us-east-1 Region are in the central tooling account along with Identity Access Management service. In addition, the dev target workload account contains us-east-1 and ap-southeast-1 VPC’s each with an ALB as well as Identity Access Management.

Fig 2. Multi-Region AWS deployment with IaC and CI/CD pipelines.

  1. To capture the exact git tag that starts a pipeline, we use an Amazon EventBridge rule. The rule is triggered when the tag is created with an environment prefix for deploying to a respective environment (i.e., dev). The rule kicks off an AWS CodeBuild project that takes the git tag from the AWS CodeCommit event and stores it with a full clone of the repo into a versioned Amazon Simple Storage Service (Amazon S3) bucket for the corresponding environment.
  2. We have a continuous delivery pipeline defined in AWS CodePipeline. To make sure that the pipelines for each environment run independent of each other, we use a separate pipeline per environment. Each pipeline consists of three stages in addition to the Source stage:
    1. IaC linting stage – A stage for linting Terraform code. For illustration purposes, we’ll use the open source tool tflint.
    2. IaC security scanning stage – A stage for static security scanning of Terraform code. There are many tooling choices when it comes to the security scanning of Terraform code. Checkov, TFSec, and Terrascan are the commonly used tools. For illustration purposes, we’ll use the open source tool Checkov.
    3. IaC build stage – A stage for Terraform build. This includes an action for the Terraform execution plan followed by an action to apply the plan to deploy the stack to a specific Region in the target workload account.
  1. Once the Terraform apply is triggered, it deploys the infrastructure components in the target workload account to the AWS Region based on the git tag. In turn, you have the flexibility to point the deployment to any AWS Region or account configured in the repo.
  2. The sample infrastructure in the target workload account consists of an AWS Identity and Access Management (IAM) role, an external facing Application Load Balancer (ALB), as well as all of the required resources down to the Amazon Virtual Private Cloud (Amazon VPC). Upon successful deployment, browsing to the external facing ALB DNS Name URL displays a very simple message including the location of the Region.

Architectural considerations

Multi-account strategy

Leveraging well-architected multi-account strategy, we have a separate central tooling account for housing the code repository and infrastructure pipeline, and a separate target workload account to house our sample workload infra-architecture. The clean account separation lets us easily control the IAM permission for granular access and have different guardrails and security controls applied. Ultimately, this enforces the separation of concerns as well as minimizes the blast radius.

A dev pipeline, a qa pipeline, a staging pipeline and, a prod pipeline in the central tooling account, each targeting the workload account for the respective environment pointing to the Regional resources containing a VPC and an ALB.

Fig 3. A separate pipeline per environment.

The sample architecture shown above contained a pipeline per environment (DEV, QA, STAGING, PROD) in the tooling account deploying to the target workload account for the respective environment. At scale, you can consider having multiple infrastructure deployment pipelines for multiple business units in the central tooling account, thereby targeting workload accounts per environment and business unit. If your organization has a complex business unit structure and is bound to have different levels of compliance and security controls, then the central tooling account can be further divided into the central tooling accounts per business unit.

Pipeline considerations

The infrastructure deployment pipeline is hosted in a central tooling account and targets workload accounts. The pipeline is the authoritative source managing the full lifecycle of resources. The goal is to decrease the risk of ad hoc changes (e.g., manual changes made directly via the console) that can’t be easily reproduced at a future date. The pipeline and the build step each run as their own IAM role that adheres to the principle of least privilege. The pipeline is configured with a stage to lint the Terraform code, as well as a static security scan of the Terraform resources following the principle of shifting security left in the SDLC.

As a further improvement for resiliency and applying the cell architecture principle to the CI/CD deployment, we can consider having multi-Region deployment of the AWS CodePipeline pipeline and AWS CodeBuild build resources, in addition to a clone of the AWS CodeCommit repository. We can use the approach detailed in this post to sync the repo across multiple regions. This means that both the workload architecture and the deployment infrastructure are multi-Region. However, it’s important to note that the business continuity requirements of the infrastructure deployment pipeline are most likely different than the requirements of the workloads themselves.

A dev pipeline in us-east-1, a dev pipeline in eu-central-1, a dev pipeline in ap-southeast-1, all in the central tooling account, each pointing respectively to the regional resources containing a VPC and an ALB for the respective Region in the dev target workload account.

Fig 4. Multi-Region CI/CD dev pipelines targeting the dev workload account resources in the respective Region.

Deeper dive into Terraform code

Backend configuration and state

As a prerequisite, we created Amazon S3 buckets to store the Terraform state files and Amazon DynamoDB tables for the state file locks. The latter is a best practice to prevent concurrent operations on the same state file. For naming the buckets and tables, our code expects the use of the same prefix (i.e., <tf_backend_config_prefix>-<env> for buckets and <tf_backend_config_prefix>-lock-<env> for tables). The value of this prefix must be passed in as an input param (i.e., “tf_backend_config_prefix”). Then, it’s fed into AWS CodeBuild actions for Terraform as an environment variable. Separation of remote state management resources (Amazon S3 bucket and Amazon DynamoDB table) across environments makes sure that we’re minimizing the blast radius.


-backend-config="bucket=${TF_BACKEND_CONFIG_PREFIX}-${ENV}" 
-backend-config="dynamodb_table=${TF_BACKEND_CONFIG_PREFIX}-lock-${ENV}"
A dev Terraform state files bucket named 

<prefix>-dev, a dev Terraform state locks DynamoDB table named <prefix>-lock-dev, a qa Terraform state files bucket named <prefix>-qa, a qa Terraform state locks DynamoDB table named <prefix>-lock-qa, a staging Terraform state files bucket named <prefix>-staging, a staging Terraform state locks DynamoDB table named <prefix>-lock-staging, a prod Terraform state files bucket named <prefix>-prod, a prod Terraform state locks DynamoDB table named <prefix>-lock-prod, in us-east-1 in the central tooling account” width=”600″ height=”456″>
 <p id=Fig 5. Terraform state file buckets and state lock tables per environment in the central tooling account.

The git tag that kicks off the pipeline is named with the following convention of “<env>_<region>/<team>/<version>” for regional deployments and “<env>_global/<team>/<version>” for global resource deployments. The stage following the source stage in our pipeline, tflint stage, is where we parse the git tag. From the tag, we derive the values of environment, deployment scope (i.e., Region or global), and team to determine the Terraform state Amazon S3 object key uniquely identifying the Terraform state file for the deployment. The values of environment, deployment scope, and team are passed as environment variables to the subsequent AWS CodeBuild Terraform plan and apply actions.

-backend-config="key=${TEAM}/${ENV}-${TARGET_DEPLOYMENT_SCOPE}/terraform.tfstate"

We set the Region to the value of AWS_REGION env variable that is made available by AWS CodeBuild, and it’s the Region in which our build is running.

-backend-config="region=$AWS_REGION"

The following is how the Terraform backend config initialization looks in our AWS CodeBuild buildspec files for Terraform actions, such as tflint, plan, and apply.

terraform init -backend-config="key=${TEAM}/${ENV}-
${TARGET_DEPLOYMENT_SCOPE}/terraform.tfstate" -backend-config="region=$AWS_REGION"
-backend-config="bucket=${TF_BACKEND_CONFIG_PREFIX}-${ENV}" 
-backend-config="dynamodb_table=${TF_BACKEND_CONFIG_PREFIX}-lock-${ENV}"
-backend-config="encrypt=true"

Using this approach, the Terraform states for each combination of account and Region are kept in their own distinct state file. This means that if there is an issue with one Terraform state file, then the rest of the state files aren’t impacted.

In the central tooling account us-east-1 Region, Terraform state files named “research/dev-us-east-1/terraform.tfstate”, “risk/dev-ap-southeast-1/terraform.tfstate”, “research/dev-eu-central-1/terraform.tfstate”, “research/dev-global/terraform.tfstate” are in S3 bucket named 

<prefix>-dev along with DynamoDB table for Terraform state locks named <prefix>-lock-dev. The Terraform state files named “research/qa-us-east-1/terraform.tfstate”, “risk/qa-ap-southeast-1/terraform.tfstate”, “research/qa-eu-central-1/terraform.tfstate” are in S3 bucket named <prefix>-qa along with DynamoDB table for Terraform state locks named <prefix>-lock-qa. Similarly for staging and prod.” width=”600″ height=”677″>
 <p id=Fig 6. Terraform state files per account and Region for each environment in the central tooling account

Following the example, a git tag of the form “dev_us-east-1/research/1.0” that kicks off the dev pipeline works against the research team’s dev account’s state file containing us-east-1 Regional resources (i.e., Amazon S3 object key “research/dev-us-east-1/terraform.tfstate” in the S3 bucket <tf_backend_config_prefix>-dev), and a git tag of the form “dev_ap-southeast-1/risk/1.0” that kicks off the dev pipeline works against the risk team’s dev account’s Terraform state file containing ap-southeast-1 Regional resources (i.e., Amazon S3 object key “risk/dev-ap-southeast-1/terraform.tfstate”). For global resources, we use a git tag of the form “dev_global/research/1.0” that kicks off a dev pipeline and works against the research team’s dev account’s global resources as they are at account level (i.e., “research/dev-global/terraform.tfstate).

Git tag “dev_us-east-1/research/1.0” pointing to the Terraform state file named “research/dev-us-east-1/terraform.tfstate”, git tag “dev_ap-southeast-1/risk/1.0 pointing to “risk/dev-ap-southeast-1/terraform.tfstate”, git tag “dev_eu-central-1/research/1.0” pointing to ”research/dev-eu-central-1/terraform.tfstate”, git tag “dev_global/research/1.0” pointing to “research/dev-global/terraform.tfstate”, in dev Terraform state files S3 bucket named <prefix>-dev along with <prefix>-lock-dev DynamoDB dev Terraform state locks table.” width=”600″ height=”318″>
 <p id=Fig 7. Git tags and the respective Terraform state files.

This backend configuration makes sure that the state file for one account and Region is independent of the state file for the same account but different Region. Adding or expanding the workload to additional Regions would have no impact on the state files of existing Regions.

If we look at the further improvement where we make our deployment infrastructure also multi-Region, then we can consider each Region’s CI/CD deployment to be the authoritative source for its local Region’s deployments and Terraform state files. In this case, tagging against the repo triggers a pipeline within the local CI/CD Region to deploy resources in the Region. The Terraform state files in the local Region are used for keeping track of state for the account’s deployment within the Region. This further decreases cross-regional dependencies.

A dev pipeline in the central tooling account in us-east-1, pointing to the VPC containing ALB in us-east-1 in dev target workload account, along with a dev Terraform state files S3 bucket named <prefix>-use1-dev containing us-east-1 Regional resources “research/dev/terraform.tfstate” and “risk/dev/terraform.tfstate” Terraform state files along with DynamoDB dev Terraform state locks table named <prefix>-use1-lock-dev. A dev pipeline in the central tooling account in eu-central-1, pointing to the VPC containing ALB in eu-central-1 in dev target workload account, along with a dev Terraform state files S3 bucket named <prefix>-euc1-dev containing eu-central-1 Regional resources “research/dev/terraform.tfstate” and “risk/dev/terraform.tfstate” Terraform state files along with DynamoDB dev Terraform state locks table named <prefix>-euc1-lock-dev. A dev pipeline in the central tooling account in ap-southeast-1, pointing to the VPC containing ALB in ap-southeast-1 in dev target workload account, along with a dev Terraform state files S3 bucket named <prefix>-apse1-dev containing ap-southeast-1 Regional resources “research/dev/terraform.tfstate” and “risk/dev/terraform.tfstate” Terraform state files along with DynamoDB dev Terraform state locks table named <prefix>-apse1-lock-dev” width=”700″ height=”603″>
 <p id=Fig 8. Multi-Region CI/CD with Terraform state resources stored in the same Region as the workload account resources for the respective Region

Provider

For deployments, we use the default Terraform AWS provider. The provider is parametrized with the value of the region passed in as an input parameter.

provider "aws" {
  region = var.region
   ...
}

Once the provider knows which Region to target, we can refer to the current AWS Region in the rest of the code.

# The value of the current AWS region is the name of the AWS region configured on the provider
# https://registry.terraform.io/providers/hashicorp/aws/latest/docs/data-sources/region
data "aws_region" "current" {} 

locals {
    region = data.aws_region.current.name # then use local.region where region is needed
}

Provider is configured to assume a cross account IAM role defined in the workload account. The value of the account ID is fed as an input parameter.

provider "aws" {
  region = var.region
  assume_role {
    role_arn     = "arn:aws:iam::${var.account}:role/InfraBuildRole"
    session_name = "INFRA_BUILD"
  }
}

This InfraBuildRole IAM role could be created as part of the account creation process. The AWS Control Tower Terraform Account Factory could be used to automate this.

Code

Minimize cross-regional dependencies

We keep the Regional resources and the global resources (e.g., IAM role or policy) in distinct namespaces following the cell architecture principle. We treat each Region as one cell, with the goal of decreasing cross-regional dependencies. Regional resources are created once in each Region. On the other hand, global resources are created once globally and may have cross-regional dependencies (e.g., DynamoDB global table with a replica table in multiple Regions). There’s no “global” Terraform AWS provider since the AWS provider requires a Region. This means that we pick a specific Region from which to deploy our global resources (i.e., global_resource_deploy_from_region input param). By creating a distinct Terraform namespace for Regional resources (e.g., module.regional) and a distinct namespace for global resources (e.g., module.global), we can target a deployment for each using pipelines scoped to the respective namespace (e.g., module.global or module.regional).

Deploying Regional resources: A dev pipeline in the central tooling account triggered via git tag “dev_eu-central-1/research/1.0” pointing to the eu-central-1 VPC containing ALB in the research dev target workload account corresponding to the module.regional Terraform namespace. Deploying global resources: a dev pipeline in the central tooling account triggered via git tag “dev_global/research/1.0” pointing to the IAM resource corresponding to the module.global Terraform namespace.

Fig 9. Deploying regional and global resources scoped to the Terraform namespace

As global resources have a scope of the whole account regardless of Region while Regional resources are scoped for the respective Region in the account, one point of consideration and a trade-off with having to pick a Region to deploy global resources is that this introduces a dependency on that region for the deployment of the global resources. In addition, in the case of a misconfiguration of a global resource, there may be an impact to each Region in which we deployed our workloads. Let’s consider a scenario where an IAM role has access to an S3 bucket. If the IAM role is misconfigured as a result of one of the deployments, then this may impact access to the S3 bucket in each Region.

There are alternate approaches, such as creating an IAM role per Region (myrole-use1 with access to the S3 bucket in us-east-1, myrole-apse1 with access to the S3 bucket in ap-southeast-1, etc.). This would make sure that if the respective IAM role is misconfigured, then the impact is scoped to the Region. Another approach is versioning our global resources (e.g., myrole-v1, myrole-v2) with the ability to move to a new version and roll back to a previous version if needed. Each of these approaches has different drawbacks, such as the duplication of global resources that may make auditing more cumbersome with the tradeoff of minimizing cross Regional dependencies.

We recommend looking at the pros and cons of each approach and selecting the approach that best suits the requirements for your workloads regarding the flexibility to deploy to multiple Regions.

Consistency

We keep one copy of the infrastructure code and deploy the resources targeted for each Region using this same copy. Our code is built using versioned module composition as the “lego blocks”. This follows the DRY (Don’t Repeat Yourself) principle and decreases the risk of code drift per Region. We may deploy to any Region independently, including any Regions added at a future date with zero code changes and minimal additional configuration for that Region. We can see three advantages with this approach.

  1. The total deployment time per Region remains the same regardless of the addition of Regions. This helps for restrictions, such as tight release windows due to business requirements.
  2. If there’s an issue with one of the regional deployments, then the remaining Regions and their deployment pipelines aren’t affected.
  3. It allows the ability to stagger deployments or the possibility of not deploying to every region in non-critical environments (e.g., dev) to minimize costs and remain in line with the Well Architected Sustainability pillar.

Conclusion

In this post, we demonstrated a multi-account, multi-region deployment approach, along with sample code, with a focus on architecture using IaC tool Terraform and CI/CD services AWS CodeBuild and AWS CodePipeline to help customers in their journey through multi-Region deployments.

Thanks to Welly Siauw, Kenneth Jackson, Andy Taylor, Rodney Bozo, Craig Edwards and Curtis Rissi for their contributions reviewing this post and its artifacts.

Author:

Lerna Ekmekcioglu

Lerna Ekmekcioglu is a Senior Solutions Architect with AWS where she helps Global Financial Services customers build secure, scalable and highly available workloads.
She brings over 17 years of platform engineering experience including authentication systems, distributed caching, and multi region deployments using IaC and CI/CD to name a few.
In her spare time, she enjoys hiking, sight seeing and backyard astronomy.

Jack Iu

Jack is a Global Solutions Architect at AWS Financial Services. Jack is based in New York City, where he works with Financial Services customers to help them design, deploy, and scale applications to achieve their business goals. In his spare time, he enjoys badminton and loves to spend time with his wife and Shiba Inu.

Create cross-account, custom Amazon Managed Grafana dashboards for Amazon Redshift

Post Syndicated from Tahir Aziz original https://aws.amazon.com/blogs/big-data/create-cross-account-custom-amazon-managed-grafana-dashboards-for-amazon-redshift/

Amazon Managed Grafana recently announced a new data source plugin for Amazon Redshift, enabling you to query, visualize, and alert on your Amazon Redshift data from Amazon Managed Grafana workspaces. With the new Amazon Redshift data source, you can now create dashboards and alerts in your Amazon Managed Grafana workspaces to analyze your structured and semi-structured data across data warehouses, operational databases, and data lakes. The Amazon Redshift plugin also comes with default out-of-the-box dashboards that make it simple to get started monitoring the health and performance of your Amazon Redshift clusters.

In this post, we present a step-by-step tutorial to use the Amazon Redshift data source plugin to visualize metrics from your Amazon Redshift clusters hosted in different AWS accounts using AWS Single Sign-On (AWS SSO) as well as how to create custom dashboards visualizing data from Amazon Redshift system tables in Amazon Managed Grafana.

Solution overview

Let’s look at the AWS services that we use in our tutorial:

Amazon Managed Grafana is a fully managed service for open-source Grafana developed in collaboration with Grafana Labs. Grafana is a popular open-source analytics platform that enables you to query, visualize, alert on, and understand your operational metrics. You can create, explore, and share observability dashboards with your team, and spend less time managing your Grafana infrastructure and more time improving the health, performance, and availability of your applications. Amazon Managed Grafana natively integrates with AWS services (like Amazon Redshift) so you can securely add, query, visualize, and analyze operational and performance data across multiple accounts and Regions for the underlying AWS service.

Amazon Redshift is a fully managed, petabyte-scale data warehouse service in the cloud. You can start with just a few hundred gigabytes of data and scale to a petabyte or more. This enables you to use your data to acquire new insights for your business and customers. Today, tens of thousands of AWS customers from Fortune 500 companies, startups, and everything in between use Amazon Redshift to run mission-critical business intelligence (BI) dashboards, analyze real-time streaming data, and run predictive analytics jobs. With the constant increase in generated data, Amazon Redshift customers continue to achieve successes in delivering better service to their end-users, improving their products, and running an efficient and effective business.

AWS SSO is where you create or connect your workforce identities in AWS and manage access centrally across your AWS organization. You can choose to manage access just to your AWS accounts or cloud applications. You can create user identities directly in AWS SSO, or you can bring them from your Microsoft Active Directory or a standards-based identity provider, such as Okta Universal Directory or Azure AD. With AWS SSO, you get a unified administration experience to define, customize, and assign fine-grained access. Your workforce users get a user portal to access all their assigned AWS accounts, Amazon Elastic Compute Cloud (Amazon EC2) Windows instances, or cloud applications. AWS SSO can be flexibly configured to run alongside or replace AWS account access management via AWS Identity and Access Management (IAM).

The following diagram illustrates the solution architecture.

The solution includes the following components:

  • Captured metrics from the Amazon Redshift clusters in the development and production AWS accounts.
  • Amazon Managed Grafana, with the Amazon Redshift data source plugin added to it. Amazon Managed Grafana communicates with the Amazon Redshift cluster via the Amazon Redshift Data Service API.
  • The Grafana web UI, with the Amazon Redshift dashboard using the Amazon Redshift cluster as the data source. The web UI communicates with Amazon Managed Grafana via an HTTP API.

We walk you through the following steps in this post:

  1. Create a user in AWS SSO for Amazon Managed Grafana workspace access.
  2. Configure an Amazon Managed Grafana workspace.
  3. Set up two Amazon Redshift clusters as the data sources in Grafana.
  4. Import the Amazon Redshift dashboard supplied with the data source.
  5. Create a custom Amazon Redshift dashboard to visualize metrics from the Amazon Redshift clusters.

Prerequisites

To follow along with this post, you should have the following prerequisites:

Set up AWS SSO

In this section, we set up AWS SSO and register users.

In addition to AWS SSO integration, Amazon Managed Grafana also supports direct SAML integration with SAML 2.0 identity providers.

  1. If you don’t have AWS SSO enabled, open the AWS SSO console and choose Enable AWS SSO.
  2. After AWS SSO is enabled, choose Users in the navigation pane.
  3. Choose Add user.
  4. Enter the user details and choose Next: Groups.
  5. Choose Add user.

Set up your Amazon Grafana workspace

In this section, we demonstrate how to set up a Grafana workspace using Amazon Managed Grafana. We set up authentication using AWS SSO, register data sources, and add administrative users for the workspace.

  1. On the Amazon Managed Grafana console, choose Create workspace.
  2. For Workspace name, enter a suitable name.
  3. Choose Next.
  4. For Authentication access, select AWS Single Sign-On.
  5. For Permission type, select Service managed.
  6. Choose Next.
  7. Select Current account.
  8. For Data sources, select Amazon Redshift.
  9. Choose Next.
  10. Review the details and choose Create workspace.

    Now we assign a user to the workspace.
  11. On the Workspaces page, choose the workspace you created.
  12. Note the IAM role attached to your workspace.
  13. Choose Assign new user or group.
  14. Select the user to assign to the workspace.
  15. Choose Assign users and groups.

    For the purposes of this post, we need an admin user.
  16. To change the permissions of the user you just assigned, select the user name and choose Make admin.

For the cross-account setup, we use two Amazon Redshift clusters: production and development. In the next section, we configure IAM roles in both the production and development accounts so that the Grafana in the production account is able to connect to the Amazon Redshift clusters in the production account as well as in the development account.

Configure an IAM role for the development account

In this section, we set up the IAM role in the AWS account hosting the development environment. This role is assumed by the Amazon Managed Grafana service from the production AWS account to establish the connection between Amazon Managed Grafana and Amazon Redshift cluster in the development account.

  1. On the IAM console, choose Roles in the navigation pane.
  2. Choose Create role.
  3. Select Custom trust policy.
  4. Use the following policy code (update the account number for your production account and the Grafana service role attached to the workspace):
    {
        "Version": "2012-10-17",
        "Statement": [
            {
                "Effect": "Allow",
                "Principal": {
                    "AWS": "arn:aws:iam::<production-account-number>:role/service-role/AmazonGrafanaServiceRole-xxxxxxxxxx",
                    "Service": "grafana.amazonaws.com"
                },
                "Action": "sts:AssumeRole"
            }
        ]
    }

  5. Choose Next.
  6. Attach the managed IAM policy AmazonGrafanaRedshiftAccess to this role. For instructions, refer to Modifying a role permissions policy (console).
  7. Provide a role name, description, and tags (optional), and create the role.

Configure an IAM role for the production account

Next, we configure the IAM role created by the Amazon Managed Grafana service in order to establish the connection between Amazon Managed Grafana and the Amazon Redshift cluster in the production account.

  1. On the IAM console, choose Roles in the navigation pane.
  2. Search for the AmazonGrafanaServiceRole-xxxxxxx role attached to your Grafana workspace.
  3. Create an inline IAM policy and attach it to this role with the following policy code:
    {
    	"Version": "2012-10-17",
    	"Statement": [{
    		"Sid": "VisualEditor0",
    		"Effect": "Allow",
    		"Action": [
    			"sts:AssumeRole"
    		],
    		"Resource":"arn:aws:iam::<dev-account-number>:role/<DevAccountRoleName>"
    	}]
    }

  4. Provide a role name, description, and tags (optional), and create the role.

Import the default dashboard

In this section, we connect to the Amazon Redshift clusters in the production and development accounts from the Amazon Managed Grafana console and import the default dashboard.

  1. On the Amazon Managed Grafana console, choose Workspaces in the navigation pane.
  2. Choose the workspace you just created (authenticate and sign in if needed).
  3. In the navigation pane, choose Settings and on the Configuration menu, choose Data sources.
  4. Choose Add data source.
  5. Search for and choose Amazon Redshift.
  6. On the Settings tab, for Authentication provider, choose Workspace IAM role.
  7. For Default Region, choose us-east-1.
  8. Under Redshift Details, choose Temporary credentials.
  9. Enter the cluster identifier and database name for your Amazon Redshift cluster in the development account.
  10. For Database user, enter redshift_data_api_user.
  11. Choose Save & test.
    When the connection is successfully established, a message appears that the data source is working. You can now move on to the next step.
  12. Repeat these steps to add another data source to connect to the Amazon Redshift cluster in the development account.
  13. On the Settings tab, for Authentication provider, choose Workspace IAM role.
  14. Enter the workspace role as the ARN of the IAM role you created earlier (arn:aws:iam::dev-account-number:role/cross-account-role-name).
  15. For Default Region, choose us-east-1.
  16. Under Redshift Details, choose Temporary credentials.
  17. Enter the cluster identifier and database name for your Amazon Redshift cluster in the development account.
  18. For Database user, enter redshift_data_api_user.
  19. Choose Save & test.
    When the connection is successfully established, a message appears that the data source is working.
  20. On the Dashboards tab, choose Import next to Amazon Redshift.

On the dashboard page, you can change the data source between your production and development clusters on a drop-down menu.

The default Amazon Redshift dashboard, as shown in the following screenshot, makes it easy to monitor the overall health of the cluster by showing different cluster metrics, like total storage capacity used, storage utilization per node, open and closed connections, WLM mode, AQUA status, and more.

Additionally, the default dashboard displays several table-level metrics such as size of the tables, total number of rows, unsorted rows percentage, and more, in the Schema Insights section.

Add a custom dashboard for Amazon Redshift

The Amazon Redshift data source plugin allows you to query and visualize Amazon Redshift data metrics from within Amazon Managed Grafana. It’s preconfigured with general metrics. To add a custom metric from the Amazon Redshift cluster, complete the following steps:

  1. On the Amazon Managed Grafana console, choose All workspaces in the navigation pane.
  2. Choose the Grafana workspace URL for the workspace you want to modify.
  3. Choose Sign in with AWS SSO and provide your credentials.
  4. On the Amazon Managed Grafana workspace page, choose the plus sign and on the Create menu, choose Dashboard.
  5. Choose Add a new panel.
  6. Add the following custom SQL to get the data from the Amazon Redshift cluster:
    select 
    p.usename,
    count(*) as Num_Query,
    SUM(DATEDIFF('second',starttime,endtime)) as Total_Execution_seconds from stl_query s 
    inner join pg_user p on s.userid= p.usesysid where starttime between $__timeFrom() and $__timeTo()
    and s.userid>1 group by 1

    For this post, we use the default settings, but you can control and link the time range using the $__timeFrom() and $__timeTo() macros; they’re bound with the time range control of your dashboard. For more information and details about the supported expressions, see Query Redshift data.

  7. To inspect the data, choose Query inspector to test the custom query outcome.
    Amazon Managed Grafana supports a variety of visualizations. For this post, we create a bar chart.
  8. On the Visualizations tab in the right pane, choose Bar chart.
  9. Enter a title and description for the custom chart, and leave all other properties as default.
    For more information about supported properties, see Visualizations.
  10. Choose Save.
  11. In the pop-up window, enter a dashboard name and choose Save.

    A new dashboard is created with a custom metric.
  12. To add more metrics, choose the Add panel icon, choose Add a new panel, and repeat the previous steps.

Clean up

To avoid incurring future charges, complete the following steps:

  1. Delete the Amazon Managed Grafana workspace.
  2. If you created a new Amazon Redshift cluster for this demonstration, delete the cluster.

Conclusion

In this post, we demonstrated how to use AWS SSO and Amazon Managed Grafana to create an operational view to monitor the health and performance of Amazon Redshift clusters. We learned how to extend your default dashboard by adding custom and insightful dashboards to your Grafana workspace.

We look forward to hearing from you about your experience. If you have questions or suggestions, please leave a comment.


About the Authors

Tahir Aziz is an Analytics Solution Architect at AWS. He has worked with building data warehouses and big data solutions for over 13 years. He loves to help customers design end-to-end analytics solutions on AWS. Outside of work, he enjoys traveling and cooking.

Shawn Sachdev is a Sr. Analytics Specialist Solutions Architect at AWS. He works with customers and provides guidance to help them innovate and build well-architected and high-performance data warehouses and implement analytics at scale on the AWS platform. Before AWS, he worked in several analytics and system engineering roles. Outside of work, he loves watching sports, and is an avid foodie and craft beer enthusiast.

Ekta Ahuja is an Analytics Specialist Solutions Architect at AWS. She is passionate about helping customers build scalable and robust data and analytics solutions. Before AWS, she worked in several different data engineering and analytics roles. Outside of work, she enjoys baking, traveling, and board games.

Build Health Aware CI/CD Pipelines

Post Syndicated from sangusah original https://aws.amazon.com/blogs/devops/build-health-aware-ci-cd-pipelines/

Everything fails all the time — Werner Vogels, AWS CTO

At the moment of imminent failure, you want to avoid an unlucky deployment. I’ll start here with a short story that demonstrates the purpose of this post.

The DevOps team has just started a database upgrade with a planned outage of 30 minutes. The team automated the entire upgrade flow, triggered a CI/CD pipeline with no human intervention, and the upgrade is progressing smoothly. Then, 20 minutes in, the pipeline is stuck, and your upgrade isn’t progressing. The maintenance window has expired and customers can’t transact. You’ve created a support case, and the AWS engineer confirmed that the upgrade is failing because of a running AWS Health incident in the us-west-2 Region. The engineer has directed the DevOps team to continue monitoring the status.aws.amazon.com page for updates regarding incident resolution. The event continued running for three hours, during which time customers couldn’t transact. Once resolved, the DevOps team retried the failed pipeline, and it completed successfully.

After the incident, the DevOps team explored the possibilities for avoiding these types of incidents in the future. The team was made aware of AWS Health API that provides programmatic access to AWS Health information. In this post, we’ll help the DevOps team make the most of the AWS Health API to proactively prevent unintended outages.

AWS provides Business and Enterprise Support customers with access to the AWS Health API. Customers can have access to running events in the AWS infrastructure that may impact their service usage. Incidents could be Regional, AZ-specific, or even account specific. During these incidents, it isn’t recommended to deploy or change services that are impacted by the event.

In this post, I will walk you through how to embed AWS Health API insights into your CI/CD pipelines to automatically stop deployments whenever an AWS Health event is reported in a Region that you’re operating in. Furthermore, I will demonstrate how you can automate detection and remediation.

The Demo

In this demo, I will use AWS CodePipeline to demonstrate the idea. I will build a simple pipeline that demonstrates the concept without going into the build, test, and deployment specifics.

CodePipeline Flow

The CodePipeline flow consists of three steps:

  1. Source stage that downloads a CloudFormation template from AWS CodeCommit. The template will be deployed in the last stage.
  2. Custom stage that invokes the AWS Lambda function to evaluate the AWS Health. The Lambda function calls the AWS Health API, evaluates the health risk, and calls back CodePipeline with the assessment result.
  3. Deploy stage that deploys the CloudFormation templates downloaded from CodeCommit in the first stage.
The CodePipeline flow consists of 3 steps. First, "source stage" that downloads a CloudFormation template from CodeCommit. The template will be deployed in the last stage. Step 2 is a "custom stage" that invokes the Lambda function to evaluate AWS Health. The Lambda function calls the AWS Health API, evaluates the health risk and calls back CodePipeline with the assessment result. Finally, step 3 is a "deploy stage" that deploys the CloudFormation template downloaded from CodeCommit in the first stage. If a health is detected in step 2, the workflow will retry after a predefined timeout.

Figure 1. CodePipeline workflow.

Lambda evaluation logic

The Lambda function evaluates whether or not a running AWS Health event may be impacted by the deployment. In this case, the following criteria must be met to consider it as safe to deploy:

  • Deployment will take place in the North Virginia Region and accordingly the Lambda function will filter on the us-east-1 Region.
  • A closed event is irrelevant. The Lambda function will filter events with only the open status.
  • AWS Health API can return different event types that may not be relevant, such as: Scheduled Maintenance, and Account and Billing notifications. The Lambda function will filter only “Issue” type events.

The AWS Health API follows a multi-Region application architecture and has two regional endpoints in an active-passive configuration. To support active-passive DNS failover, AWS Health provides a global endpoint. The Python code is available on GitHub with more information in the README on how to build the Lambda code package.

The Lambda function requires the following AWS Identity and Access Management (IAM) permissions to access AWS Health API, CodePipeline, and publish logs to CloudWatch:

{
  "Version": "2012-10-17", 
  "Statement": [
    {
      "Action": [ 
        "logs:CreateLogStream",
        "logs:CreateLogGroup",
        "logs:PutLogEvents"
      ],
      "Effect": "Allow", 
      "Resource": "arn:aws:logs:us-east-1:replaceWithAccountNumber:*"
    },
    {
      "Action": [
        "codepipeline:PutJobSuccessResult",
        "codepipeline:PutJobFailureResult"
        ],
        "Effect": "Allow",
        "Resource": "*"
     },
     {
        "Effect": "Allow",
        "Action": "health:DescribeEvents",
        "Resource": "*"
    }
  ]
}

Solution architecture

This is the solution architecture diagram. It involved three entities: AWS Code Pipeline, AWS Lambda and the AWS Health API. First, AWS Code Pipeline invoke the Lambda function asynchronously. Second, the Lambda function call the AWS Health API, DescribeEvents. Third, the DescribeEvents API will respond back with a list of health events. Finally, the Lambda function will respond with either a success response or a failed one through calling PutJobSuccessResult and PutJobFailureResults consecutively.

Figure 2. Solution architecture diagram.

In CodePipeline, create a new stage with a single action to asynchronously invoke a Lambda function. The function will call AWS Health DescribeEvents API to retrieve the list of active health incidents. Then, the function will complete the event analysis and decide whether or not it may impact the running deployment. Finally, the function will call back CodePipeline with the evaluation results through either PutJobSuccessResult or PutJobFailureResult API operations.

If the Lambda evaluation succeeds, then it will call back the pipeline with a PutJobSuccessResult API. In turn, the pipeline will mark the step as successful and complete the execution.

AWS Code Pipeline workflow execution snapshot from the AWS Console. The first step, Source is a success after completing source code download from AWS CodeCommit service. The second step, check the AWS service health is a success as well.

Figure 3. AWS Code Pipeline workflow successful execution.

If the Lambda evaluation fails, then it will call back the pipeline with a PutJobFailureResult API specifying a failure message. Once the DevOps team is made aware that the event has been resolved, select the Retry button to re-evaluate the health status.

AWS CodePipeline workflow execution snapshot from the AWS Console. The first step, Source is a success after completing source code download from AWS CodeCommit service. The second step, check the AWS service health has failed after detecting a running health event/incident in the operating AWS region.

Figure 4. AWS CodePipeline workflow failed execution.

Your DevOps team must be aware of failed deployments. Therefore, it’s a good idea to configure alerts to notify concerned stakeholders with failed stage executions. Create a notification rule that posts a Slack message if a stage fails. For detailed steps, see Create a notification rule – AWS CodePipeline. In case of failure, a Slack notification will be sent through AWS Chatbot.

A Slack UI snapshot showing the notification to be sent if a deployment fails to execute. The notification shows a title of "AWS CodePipeline Notification". The notification indicates that one action has failed in the stage aws-health-check. The notification also shows that the failure reason is that there is an Incident In Progress. The notification also mentions the Pipeline name as well as the failed stage name.

Figure 5. Slack UI snapshot notification for a failed deployment.

A more elegant solution involves pushing the notification to an SNS topic that in turns calls a Lambda function to retry the failed stage. The Lambda function extracts the pipeline failed stage identifier, and then calls the RetryStageExecution CodePipeline API.

Conclusion

We’ve learned how to create an automation that evaluates the risk associated with proceeding with a deployment in conjunction with a running AWS Health event. Then, the automation decides whether to proceed with the deployment or block the progress to avoid unintended downtime. Accordingly, this results in the improved availability of your application.

This solution isn’t exclusive to CodePipeline. However, the pattern can be applied to other CI/CD tools that your DevOps team uses.

Author:

Islam Ghanim

Islam Ghanim is a Senior Technical Account Manager at Amazon Web Services in Melbourne, Australia. He enjoys helping customers build resilient and cost-efficient architectures. Outside work, he plays squash, tennis and almost any other racket sport.

Correlate IAM Access Analyzer findings with Amazon Macie

Post Syndicated from Nihar Das original https://aws.amazon.com/blogs/security/correlate-iam-access-analyzer-findings-with-amazon-macie/

In this blog post, you’ll learn how to detect when unintended access has been granted to sensitive data in Amazon Simple Storage Service (Amazon S3) buckets in your Amazon Web Services (AWS) accounts.

It’s critical for your enterprise to understand where sensitive data is stored in your organization and how and why it is shared. The ability to efficiently find data that is shared with entities outside your account and the contents of that data is paramount. You need a process to quickly detect and report which accounts have access to sensitive data. Amazon Macie is an AWS service that can detect many sensitive data types. Macie is a fully managed data security and data privacy service that uses machine learning and pattern matching to discover and help protect your sensitive data in AWS.

AWS Identity and Access Management (IAM) Access Analyzer helps to identify resources in your organization and accounts, such as S3 buckets or IAM roles, that are shared with an external entity. When you enable IAM Access Analyzer, you create an analyzer for your entire organization or your account. The organization or account you choose is known as the zone of trust for the analyzer. The analyzer monitors the supported resources within your zone of trust. This analyzer enables IAM Access Analyzer to detect each instance of a resource shared outside the zone of trust and generates a finding about the resource and the external principals that have access to it.

Currently, you can use IAM Access Analyzer and Macie to detect external access and discover sensitive data as separate processes. You can join the findings from both to best evaluate the risk. The solution in this post integrates IAM Access Analyzer, Macie, and AWS Security Hub to automate the process of correlating findings between the services and presenting them in Security Hub.

How does the solution work?

First, IAM Access Analyzer discovers S3 buckets that are shared outside the zone of trust. Next, the solution schedules a Macie sensitive data discovery job for each of these buckets to determine if the bucket contains sensitive data. Upon discovery of shared sensitive data in S3, a custom high severity finding is created in Security Hub for review and incident response.

Solution architecture

This solution is based on a serverless architecture, and uses the following services:

Figure 1: Architecture diagram

Figure 1: Architecture diagram

Figure 1 depicts the following process flow:

  1. IAM Access Analyzer detects shared S3 buckets outside of the zone of trust—the organization or account you choose is known as a zone of trust for the analyzer—and creates the event Access Analyzer Finding in EventBridge.
  2. EventBridge triggers the Lambda function sda-aa-save-findings.
  3. The sda-aa-save-findings function records each finding in DynamoDB.
  4. An EventBridge scheduled event periodically starts a new cycle of the Step Function state machine, which immediately runs the Lambda function sda-macie-submit-scan. The template sets a 15-minute interval, but this is configurable.
  5. The sda-macie-submit-scan function reads the IAM Access Analyzer findings that were created by sda-aa-save-findings from DynamoDB.
  6. sda-macie-submit-scan launches a Macie classification job for each distinct S3 bucket that is related to one or more recent IAM Access Analyzer findings.
  7. Macie performs a sensitive discovery scan on each requested S3 bucket.
  8. The sda-macie-submit-scan function initiates the Lambda function sda-macie-check-status.
  9. sda-macie-check-status periodically checks the status of each Macie classification job, waiting for all the Macie jobs initiated by this solution to complete.
  10. Upon completion of the sda-macie-check-status function, the step function runs the Lambda function sda-sh-create-findings.
  11. sda-sh-create-findings joins the resulting IAM Access Analyzer and Macie datasets for each S3 bucket.
  12. sda-sh-create-findings publishes a finding to Security Hub for each bucket that has both external access and sensitive data.

    Note: The Macie scan is skipped if the S3 bucket is tagged to be excluded or if it was recently scanned by Macie. See the Cost considerations section for more information on custom configurations.

  13. Information security can review and act on the findings shown in Security Hub.

Sample Security Hub output

Figure 2 shows the sample findings that Security Hub will present. Each finding includes:

  • Severity
  • Workflow status
  • Record state
  • Company
  • Product
  • Title
  • Resource
Figure 2: Sample Security Hub findings

Figure 2: Sample Security Hub findings

The output to Security Hub will display a severity of HIGH with workflow NEW, because this is the first time the event has been observed. The record state is ACTIVE because the workflow state is NEW. The title explains the reason for the event.

For example, if potentially sensitive data is discovered in a bucket that is shared outside a zone of trust, selecting an event will display the resources involved in the finding so you can investigate. For more information, see the Security Hub User Guide.

Notes:

  • Detection of public S3 buckets by IAM Access Analyzer will still occur through Security Hub and will be marked as critical severity. This solution does not add to or augment this finding in Security Hub.
  • If a finding in IAM Access Analyzer is archived, the solution does not update the related finding in Security Hub.

Prerequisites

To use this solution, you need the following:

  • Permission to run AWS CloudFormation
  • Permission to create Lambda functions
  • Permission to create DynamoDB tables
  • Permission to create Step Function state machines
  • Permission to create EventBridge event rules
  • Permission to enable IAM Access Analyzer on the account where sensitive discovery is required
  • Permission to enable Macie on the account
  • Permission to enable Security Hub on the account

Deploy the solution

The solution is deployed through AWS CloudFormation, and you can review the template for options to best suit your specific needs.

  1. Sign in to your AWS account located at https://aws.amazon.com/console/.
  2. In the AWS Management Console, navigate to the AWS CloudFormation service, and then choose Create stack.
  3. Under Prerequisite – Prepare template, choose Template is ready.
  4. Under Specify template, choose Amazon S3 URL and provide the following URL:
    https://awsiammedia.s3.amazonaws.com/public/sample/936-correlating-aa-findings-macie/sda-cfn.yml
  5. Choose Next.
  6. Enter the stack name.
  7. The Application code location, S3 Bucket and S3 Key fields will be pre-filled.
  8. Under Service Activations, modify the activations based on the services you presently have running in your account.
  9. Modify the Logging and Monitoring settings if required.
  10. (Optional) Set an alert email address for errors.
  11. Choose Next, then choose Next again.
  12. Under Capabilities, select the check box.
  13. Choose Create Stack. The solution will begin deploying; watch for the CREATE_COMPLETE message.
Figure 3: Sample CloudFormation deployment status

Figure 3: Sample CloudFormation deployment status

The solution is now deployed and will start monitoring for sensitive data that is being shared. It will send the findings to Security Hub for your teams to investigate.

Cost considerations

When you scan large S3 buckets with sensitive data, remember that Macie cost is based on the amount of data scanned. For more information on Macie costs, see Amazon Macie pricing.

This solution allows the following options, which you can use to help manage costs:

  • Use environment variables in Lambda to skip specific tagged buckets
  • Skip recently scanned S3 buckets and reuse prior findings
Figure 4: Screen shot of configurable environment variable

Figure 4: Screen shot of configurable environment variable

Conclusion

In this post, we discussed how the solution uses Lambda, Step Functions and EventBridge to integrate IAM Access Analyzer with Macie discovery jobs. We reviewed the components of the application, deployed it by using CloudFormation, and reviewed the output a security team would use to take the appropriate actions. We also provided two ways that you can manage the costs associated with the solution.

After you deploy this project, you can modify it to meet your organization’s needs. For example, you can modify the tags to skip specific S3 buckets your organization has already classified to hold sensitive data. Customers who use multiple AWS accounts can designate a centralized Security Hub administrator account to receive the solution alerts from each member account. For more information on this option, see Designating a Security Hub administrator account.

If you have feedback about this post, please submit it in the Comments section below. If you have questions about this post, please start a new thread on the AWS Identity and Access Management forum.

Other resources

For more information on correlating security findings with AWS Security Hub and Amazon EventBridge, refer to this blog post.

Want more AWS Security news? Follow us on Twitter.

Nihar Das

Nihar Das

Nihar has over 20 years of experience in various business domains including financial services. As an AWS Senior Solutions Architect, he is passionate about solving challenges in the cloud and helps financial services customers to migrate to AWS and support the continued innovation.

Joe Dunn

Joe Dunn

Joe is an AWS Senior Solutions Architect in Financial Services with over 20 years of experience in infrastructure architecture and migration of business-critical loads to AWS. He helps financial services customers to innovate on the AWS Cloud by providing solutions using AWS products and services.

Armand Aquino

Armand Aquino

Armand is a solutions architect helping financial services organizations design their critical workloads on AWS. In his spare time, he enjoys exploring outdoors and learning Korean.

When and where to use IAM permissions boundaries

Post Syndicated from Umair Rehmat original https://aws.amazon.com/blogs/security/when-and-where-to-use-iam-permissions-boundaries/

Customers often ask for guidance on permissions boundaries in AWS Identity and Access Management (IAM) and when, where, and how to use them. A permissions boundary is an IAM feature that helps your centralized cloud IAM teams to safely empower your application developers to create new IAM roles and policies in Amazon Web Services (AWS). In this blog post, we cover this common use case for permissions boundaries, some best practices to consider, and a few things to avoid.

Background

Developers often need to create new IAM roles and policies for their applications because these applications need permissions to interact with AWS resources. For example, a developer will likely need to create an IAM role with the correct permissions for an Amazon Elastic Compute Cloud (Amazon EC2) instance to report logs and metrics to Amazon CloudWatch. Similarly, a role with accompanying permissions is required for an AWS Glue job to extract, transform, and load data to an Amazon Simple Storage Service (Amazon S3) bucket, or for an AWS Lambda function to perform actions on the data loaded to Amazon S3.

Before the launch of IAM permissions boundaries, central admin teams, such as identity and access management or cloud security teams, were often responsible for creating new roles and policies. But using a centralized team to create and manage all IAM roles and policies creates a bottleneck that doesn’t scale, especially as your organization grows and your centralized team receives an increasing number of requests to create and manage new downstream roles and policies. Imagine having teams of developers deploying or migrating hundreds of applications to the cloud—a centralized team won’t have the necessary context to manually create the permissions for each application themselves.

Because the use case and required permissions can vary significantly between applications and workloads, customers asked for a way to empower their developers to safely create and manage IAM roles and policies, while having security guardrails in place to set maximum permissions. IAM permissions boundaries are designed to provide these guardrails so that even if your developers created the most permissive policy that you can imagine, such broad permissions wouldn’t be functional.

By setting up permissions boundaries, you allow your developers to focus on tasks that add value to your business, while simultaneously freeing your centralized security and IAM teams to work on other critical tasks, such as governance and support. In the following sections, you will learn more about permissions boundaries and how to use them.

Permissions boundaries

A permissions boundary is designed to restrict permissions on IAM principals, such as roles, such that permissions don’t exceed what was originally intended. The permissions boundary uses an AWS or customer managed policy to restrict access, and it’s similar to other IAM policies you’re familiar with because it has resource, action, and effect statements. A permissions boundary alone doesn’t grant access to anything. Rather, it enforces a boundary that can’t be exceeded, even if broader permissions are granted by some other policy attached to the role. Permissions boundaries are a preventative guardrail, rather than something that detects and corrects an issue. To grant permissions, you use resource-based policies (such as S3 bucket policies) or identity-based policies (such as managed or in-line permissions policies).

The predominant use case for permissions boundaries is to limit privileges available to IAM roles created by developers (referred to as delegated administrators in the IAM documentation) who have permissions to create and manage these roles. Consider the example of a developer who creates an IAM role that can access all Amazon S3 buckets and Amazon DynamoDB tables in their accounts. If there are sensitive S3 buckets in these accounts, then these overly broad permissions might present a risk.

To limit access, the central administrator can attach a condition to the developer’s identity policy that helps ensure that the developer can only create a role if the role has a permissions boundary policy attached to it. The permissions boundary, which AWS enforces during authorization, defines the maximum permissions that the IAM role is allowed. The developer can still create IAM roles with permissions that are limited to specific use cases (for example, allowing specific actions on non-sensitive Amazon S3 buckets and DynamoDB tables), but the attached permissions boundary prevents access to sensitive AWS resources even if the developer includes these elevated permissions in the role’s IAM policy. Figure 1 illustrates this use of permissions boundaries.

Figure 1: Implementing permissions boundaries

Figure 1: Implementing permissions boundaries

  1. The central IAM team adds a condition to the developer’s IAM policy that allows the developer to create a role only if a permissions boundary is attached to the role.
  2. The developer creates a role with accompanying permissions to allow access to an application’s Amazon S3 bucket and DynamoDB table. As part of this step, the developer also attaches a permissions boundary that defines the maximum permissions for the role.
  3. Resource access is granted to the application’s resources.
  4. Resource access is denied to the sensitive S3 bucket.

You can use the following policy sample for your developers to allow the creation of roles only if a permissions boundary is attached to them. Make sure to replace <YourAccount_ID> with an appropriate AWS account ID; and the <DevelopersPermissionsBoundary>, with your permissions boundary policy.

   "Effect": "Allow",
   "Action": "iam:CreateRole",
   "Condition": {
      "StringEquals": {
         "iam:PermissionsBoundary": "arn:aws:iam::<YourAccount_ID&gh;:policy/<DevelopersPermissionsBoundary>"
      }
   }

You can also deny deletion of a permissions boundary, as shown in the following policy sample.

   "Effect": "Deny",
   "Action": "iam:DeleteRolePermissionsBoundary"

You can further prevent detaching, modifying, or deleting the policy that is your permissions boundary, as shown in the following policy sample.

   "Effect": "Deny", 
   "Action": [
      "iam:CreatePolicyVersion",
      "iam:DeletePolicyVersion",
	"iam:DetachRolePolicy",
"iam:SetDefaultPolicyVersion"
   ],

Put together, you can use the following permissions policy for your developers to get started with permissions boundaries. This policy allows your developers to create downstream roles with an attached permissions boundary. The policy further denies permissions to detach, delete, or modify the attached permissions boundary policy. Remember, nothing is implicitly allowed in IAM, so you need to allow access permissions for any other actions that your developers require. To learn about allowing access permissions for various scenarios, see Example IAM identity-based policies in the documentation.

{
   "Version": "2012-10-17",
   "Statement": [
      {
         "Sid": "AllowRoleCreationWithAttachedPermissionsBoundary",
   "Effect": "Allow",
   "Action": "iam:CreateRole",
   "Resource": "*",
   "Condition": {
      "StringEquals": {
         "iam:PermissionsBoundary": "arn:aws:iam::<YourAccount_ID>:policy/<DevelopersPermissionsBoundary>"
      }
         }
      },
      {
   "Sid": "DenyPermissionsBoundaryDeletion",
   "Effect": "Deny",
   "Action": "iam:DeleteRolePermissionsBoundary",
   "Resource": "*",
   "Condition": {
      "StringEquals": {
         "iam:PermissionsBoundary": "arn:aws:iam::<YourAccount_ID>:policy/<DevelopersPermissionsBoundary>"
      }
   }
      },
      {
   "Sid": "DenyPolicyChange",
   "Effect": "Deny", 
   "Action": [
      "iam:CreatePolicyVersion",
      "iam:DeletePolicyVersion",
      "iam:DetachRolePolicy",
      "iam:SetDefaultPolicyVersion"
   ],
   "Resource":
"arn:aws:iam::<YourAccount_ID>:policy/<DevelopersPermissionsBoundary>"
      }
   ]
}

Permissions boundaries at scale

You can build on these concepts and apply permissions boundaries to different organizational structures and functional units. In the example shown in Figure 2, the developer can only create IAM roles if a permissions boundary associated to the business function is attached to the IAM roles. In the example, IAM roles in function A can only perform Amazon EC2 actions and Amazon DynamoDB actions, and they don’t have access to the Amazon S3 or Amazon Relational Database Service (Amazon RDS) resources of function B, which serve a different use case. In this way, you can make sure that roles created by your developers don’t exceed permissions outside of their business function requirements.

Figure 2: Implementing permissions boundaries in multiple organizational functions

Figure 2: Implementing permissions boundaries in multiple organizational functions

Best practices

You might consider restricting your developers by directly applying permissions boundaries to them, but this presents the risk of you running out of policy space. Permissions boundaries use a managed IAM policy to restrict access, so permissions boundaries can only be up to 6,144 characters long. You can have up to 10 managed policies and 1 permissions boundary attached to an IAM role. Developers often need larger policy spaces because they perform so many functions. However, the individual roles that developers create—such as a role for an AWS service to access other AWS services, or a role for an application to interact with AWS resources—don’t need those same broad permissions. Therefore, it is generally a best practice to apply permissions boundaries to the IAM roles created by developers, rather than to the developers themselves.

There are better mechanisms to restrict developers, and we recommend that you use IAM identity policies and AWS Organizations service control policies (SCPs) to restrict access. In particular, the Organizations SCPs are a better solution here because they can restrict every principal in the account through one policy, rather than separately restricting individual principals, as permissions boundaries and IAM identity policies are confined to do.

You should also avoid replicating the developer policy space to a permissions boundary for a downstream IAM role. This, too, can cause you to run out of policy space. IAM roles that developers create have specific functions, and the permissions boundary can be tailored to common business functions to preserve policy space. Therefore, you can begin to group your permissions boundaries into categories that fit the scope of similar application functions or use cases (such as system automation and analytics), and allow your developers to choose from multiple options for permissions boundaries, as shown in the following policy sample.

"Condition": {
   "StringEquals": { 
      "iam:PermissionsBoundary": [
"arn:aws:iam::<YourAccount_ID>:policy/PermissionsBoundaryFunctionA",
"arn:aws:iam::<YourAccount_ID>:policy/PermissionsBoundaryFunctionB"
      ]
   }
}

Finally, it is important to understand the differences between the various IAM resources available. The following table lists these IAM resources, their primary use cases and managing entities, and when they apply. Even if your organization uses different titles to refer to the personas in the table, you should have separation of duties defined as part of your security strategy.

IAM resource Purpose Owner/maintainer Applies to
Federated roles and policies Grant permissions to federated users for experimentation in lower environments Central team People represented by users in the enterprise identity provider
IAM workload roles and policies Grant permissions to resources used by applications, services Developer IAM roles representing specific tasks performed by applications
Permissions boundaries Limit permissions available to workload roles and policies Central team Workload roles and policies created by developers
IAM users and policies Allowed only by exception when there is no alternative that satisfies the use case Central team plus senior leadership approval Break-glass access; legacy workloads unable to use IAM roles

Conclusion

This blog post covered how you can use IAM permissions boundaries to allow your developers to create the roles that they need and to define the maximum permissions that can be given to the roles that they create. Remember, you can use AWS Organizations SCPs or deny statements in identity policies for scenarios where permissions boundaries are not appropriate. As your organization grows and you need to create and manage more roles, you can use permissions boundaries and follow AWS best practices to set security guard rails and decentralize role creation and management. Get started using permissions boundaries in IAM.

 
If you have feedback about this post, submit comments in the Comments section below. If you have questions about this post, contact AWS Support.

Want more AWS Security news? Follow us on Twitter.

Umair Rehmat

Umair Rehmat

Umair is a cloud solutions architect and technologist based out of the Seattle WA area working on greenfield cloud migrations, solutions delivery, and any-scale cloud deployments. Umair specializes in telecommunications and security, and helps customers onboard, as well as grow, on AWS.

Automating detection of security vulnerabilities and bugs in CI/CD pipelines using Amazon CodeGuru Reviewer CLI

Post Syndicated from Akash Verma original https://aws.amazon.com/blogs/devops/automating-detection-of-security-vulnerabilities-and-bugs-in-ci-cd-pipelines-using-amazon-codeguru-reviewer-cli/

Watts S. Humphrey, the father of Software Quality, had famously quipped, “Every business is a software business”. Software is indeed integral to any industry. The engineers who create software are also responsible for making sure that the underlying code adheres to industry and organizational standards, are performant, and are absolved of any security vulnerabilities that could make them susceptible to attack.

Traditionally, security testing has been the forte of a specialized security testing team, who would conduct their tests toward the end of the Software Development lifecycle (SDLC). The adoption of DevSecOps practices meant that security became a shared responsibility between the development and security teams. Now, development teams can, on their own or as advised by their security team, setup and configure various code scanning tools to detect security vulnerabilities much earlier in the software delivery process (aka “Shift Left”). Meanwhile, the practice of Static code analysis and security application testing (SAST) has become a standard part of the SDLC. Furthermore, it’s imperative that the development teams expect SAST tools that are easy to set-up, seamlessly fit into their DevOps infrastructure, and can be configured without requiring assistance from security or DevOps experts.

In this post, we’ll demonstrate how you can leverage Amazon CodeGuru Reviewer Command Line Interface (CLI) to integrate CodeGuru Reviewer into your Jenkins Continuous Integration & Continuous Delivery (CI/CD) pipeline. Note that the solution isn’t limited to Jenkins, and it would be equally useful with any other build automation tool. Moreover, it can be integrated at any stage of your SDLC as part of the White-box testing. For example, you can integrate the CodeGuru Reviewer CLI as part of your software development process, as well as run it on your dev machine before committing the code.

Launched in 2020, CodeGuru Reviewer utilizes machine learning (ML) and automated reasoning to identify security vulnerabilities, inefficient uses of AWS APIs and SDKs, as well as other common coding errors. CodeGuru Reviewer employs a growing set of detectors for Java and Python to provide recommendations via the AWS Console. Customers that leverage the CodeGuru Reviewer CLI within a CI/CD pipeline also receive recommendations in a machine-readable JSON format, as well as HTML.

CodeGuru Reviewer offers native integration with Source Code Management (SCM) systems, such as GitHub, BitBucket, and AWS CodeCommit. However, it can be used with any SCM via its CLI. The CodeGuru Reviewer CLI is a shim layer on top of the AWS Command Line Interface (AWS CLI) that simplifies the interaction with the tool by handling the uploading of artifacts, triggering of the analysis, and fetching of the results, all in a single command.

Many customers, including Mastercard, are benefiting from this new CodeGuru Reviewer CLI.

“During one of our technical retrospectives, we noticed the need to integrate Amazon CodeGuru recommendations in our build pipelines hosted on Jenkins. Not all our developers can run or check CodeGuru recommendations through the AWS console. Incorporating CodeGuru CLI in our build pipelines acts as an important quality gate and ensures that our developers can immediately fix critical issues.”
                                           Claudio Frattari, Lead DevOps at Mastercard

Solution overview

The application deployment workflow starts by placing the application code on a GitHub SCM. To automate the scenario, we have added GitHub to the Jenkins project under the “Source Code” section. We chose the GitHub option, which would clone the chosen GitHub repository in the Jenkins local workspace directory.

In the build stage of the pipeline (see Figure 1), we configure the appropriate build tool to perform the code build and security analysis. In this example, we will be using Maven as the build tool.

Figure 1: Jenkins pipeline with Amazon CodeGuru Reviewer

Figure 1: Jenkins pipeline with Amazon CodeGuru Reviewer

In the post-build stage, we configure the CodeGuru Reviewer CLI to generate the recommendations based on the review.

Lastly, in the concluding stage of the pipeline, we’ll be analyzing the JSON results using jq – a lightweight and flexible command-line JSON processor, and then failing the Jenkins job if we encounter observations that are of a “Critical” severity.

Jenkins will trigger the “CodeGuru Reviewer” (see Figure 1) based review process in the post-build stage, i.e., after the build finishes. Furthermore, you can configure other stages, such as automated testing or deployment, after this stage. Additionally, passing the location of the build artifacts to the CLI lets CodeGuru Reviewer perform a more in-depth security analysis. Build artifacts are either directories containing jar files (e.g., build/lib for Gradle or /target for Maven) or directories containing class hierarchies (e.g., build/classes/java/main for Gradle).

Walkthrough

Now that we have an overview of the workflow, let’s dive deep and walk you through the following steps in detail:

  1. Installing the CodeGuru Reviewer CLI
  2. Creating a Jenkins pipeline job
  3. Reviewing the CodeGuru Reviewer recommendations
  4. Configuring CodeGuru Reviewer CLI’s additional options

1. Installing the CodeGuru CLI Wrapper

a. Prerequisites

To run the CLI, we must have Git, Java, Maven, and the AWS CLI installed. Verify that they’re installed on our machine by running the following commands:

java -version 
mvn --version 
aws --version 
git –-version

If they aren’t installed, then download and install Java here (Amazon Corretto is a no-cost, multiplatform, production-ready distribution of the Open Java Development Kit), Maven from here, and Git from here. Instructions for installing AWS CLI are available here.

We would need to create an Amazon Simple Storage Service (Amazon S3) bucket with the prefix codeguru-reviewer-. Note that the bucket name must begin with the mentioned prefix, since we have used the name pattern in the following AWS Identity and Access Management (IAM) permissions, and CodeGuru Reviewer expects buckets to begin with this prefix. Refer to the following section 4(a) “Specifying S3 bucket name” for more details.

Furthermore, we’ll need working credentials on our machine to interact with our AWS account. Learn more about setting up credentials for AWS here. You can find the minimal permissions to run the CodeGuru Reviewer CLI as follows.

b. Required Permissions

To use the CodeGuru Reviewer CLI, we need at least the following AWS IAM permissions, attached to an AWS IAM User or an AWS IAM role:

{
    "Version": "2012-10-17",
    "Statement": [
        {
            "Action": [
                "codeguru-reviewer:ListRepositoryAssociations",
                "codeguru-reviewer:AssociateRepository",
                "codeguru-reviewer:DescribeRepositoryAssociation",
                "codeguru-reviewer:CreateCodeReview",
                "codeguru-reviewer:DescribeCodeReview",
                "codeguru-reviewer:ListRecommendations",
                "iam:CreateServiceLinkedRole"
            ],
            "Resource": "*",
            "Effect": "Allow"
        },
        {
            "Action": [
                "s3:CreateBucket",
                "s3:GetBucket*",
                "s3:List*",
                "s3:GetObject",
                "s3:PutObject",
                "s3:DeleteObject"
            ],
            "Resource": [
                "arn:aws:s3:::codeguru-reviewer-*",
                "arn:aws:s3:::codeguru-reviewer-*/*"
            ],
            "Effect": "Allow"
        }
    ]
}

c.  CLI installation

Please download the latest version of the CodeGuru Reviewer CLI available at GitHub. Then, run the following commands in sequence:

curl -OL https://github.com/aws/aws-codeguru-cli/releases/download/0.0.1/aws-codeguru-cli.zip
unzip aws-codeguru-cli.zip
export PATH=$PATH:./aws-codeguru-cli/bin

d. Using the CLI

The CodeGuru Reviewer CLI only has one required parameter –root-dir (or just -r) to specify to the local directory that should be analyzed. Furthermore, the –src option can be used to specify one or more files in this directory that contain the source code that should be analyzed. In turn, for Java applications, the –build option can be used to specify one or more build directories.

For a demonstration, we’ll analyze the demo application. This will make sure that we’re all set for when we leverage the CLI in Jenkins. To proceed, first we download and install the sample application, as follows:

git clone https://github.com/aws-samples/amazon-codeguru-reviewer-sample-app
cd amazon-codeguru-reviewer-sample-app
mvn clean compile

Now that we have built our demo application, we can use the aws-codeguru-cli CLI command that we added to the path to trigger the code scan:

aws-codeguru-cli --root-dir ./ --build target/classes --src src --output ./output

For additional assistance on the CLI command, reference the readme here.

2.  Creating a Jenkins Pipeline job

CodeGuru Reviewer can be integrated in a Jenkins Pipeline as well as a Freestyle project. In this example, we’re leveraging a Pipeline.

a. Pipeline Job Configuration

  1.  Log in to Jenkins, choose “New Item”, then select “Pipeline” option.
  2. Enter a name for the project (for example, “CodeGuruPipeline”), and choose OK.
Figure 2: Creating a new Jenkins pipeline

Figure 2: Creating a new Jenkins pipeline

  1. On the “Project configuration” page, scroll down to the bottom and find your pipeline. In the pipeline script, paste the following script (or use your own Jenkinsfile). The following example is a valid Jenkinsfile to integrate CodeGuru Reviewer with a project built using Maven.
pipeline {
    agent any
    stages {
        stage('Build') {
            steps {
                // Get code from a GitHub repository
                git clone https://github.com/aws-samples/amazon-codeguru-reviewer-java-detectors.git

                // Run Maven on a Unix agent
                sh "mvn clean compile"

                // To run Maven on a Windows agent, use following
                // bat "mvn -Dmaven.test.failure.ignore=true clean package"
            }
        }
        stage('CodeGuru Reviewer') {
            steps{
                sh 'ls -lsa *'
                sh 'pwd'
                // Here we’re setting an absolute path, but we can 
                // also use JENKINS environment variables
                sh '''
                    export BASE=/var/jenkins_home/workspace/CodeGuruPipeline/amazon-codeguru-reviewer-java-detectors
                    export SRC=${BASE}/src
                    export OUTPUT = ./output
                    /home/codeguru/aws-codeguru-cli/bin/aws-codeguru-cli --root-dir $BASE --build $BASE/target/classes --src $SRC --output $OUTPUT -c $GIT_PREVIOUS_COMMIT:$GIT_COMMIT --no-prompt
                    '''
            }
        }    
        stage('Checking findings'){
            steps{
                // In this example we are stopping our pipline on  
                // detecting Critical findings. We are using jq 
                // to count occurrences of Critical severity 
                sh '''
                CNT = $(cat ./output/recommendations.json |jq '.[] | select(.severity=="Critical")|.severity' | wc -l)'
                if (( $CNT > 0 )); then
                  echo "Critical findings discovered. Failing."
                  exit 1
                fi
                '''
            }
        }
    }
}
  1. Save the configuration and select “Build now” on the side bar to trigger the build process (see Figure 3).
Figure 3: Jenkins pipeline in triggered state

Figure 3: Jenkins pipeline in triggered state

3. Reviewing the CodeGuru Reviewer recommendations

Once the build process is finished, you can view the review results from CodeGuru Reviewer by selecting the Jenkins build history for the most recent build job. Then, browse to Workspace output. The output is available in JSON and HTML formats (Figure 4).

Figure 4: CodeGuru CLI Output

Figure 4: CodeGuru CLI Output

Snippets from the HTML and JSON reports are displayed in Figure 5 and 6 respectively.

In this example, our pipeline analyzes the JSON results with jq based on severity equal to critical and failing the job if there are any critical findings. Note that this output path is set with the –output option. For instance, the pipeline will fail on noticing the “critical” finding at Line 67 of the EventHandler.java class (Figure 5), flagged due to use of an insecure code. Till the time the code is remediated, the pipeline would prevent the code deployment. The vulnerability could have gone to production undetected, in absence of the tool.

Figure 5: CodeGuru HTML Report

Figure 5: CodeGuru HTML Report

Figure 6: CodeGuru JSON recommendations

Figure 6: CodeGuru JSON recommendations

4.  Configuring CodeGuru Reviewer CLI’s additional options

a.  Specifying Amazon S3 bucket name and policy

CodeGuru Reviewer needs one Amazon S3 bucket for the CLI to store the artifacts while the analysis is running. The artifacts are deleted after the analysis is completed. The same bucket will be reused for all the repositories that are analyzed in the same account and region (unless specified otherwise by the user). Note that CodeGuru Reviewer expects the S3 bucket name to begin with codeguru-reviewer-. At this time, you can’t use a different naming pattern. However, if you want to use a different bucket name, then you can use the –bucket-name option.

Select the Permissions tab of your S3 bucket. Update the Block public access and add the following S3 bucket policy.

Figure 7: S3 bucket settings

Figure 7: S3 bucket settings

S3 bucket policy:

{
   "Version":"2012-10-17",
   "Statement":[
      {
         "Sid":"PublicRead",
         "Effect":"Allow",
         "Principal":"*",
         "Action":"s3:GetObject",
         "Resource":"[Change to ARN for your S3 bucket]/*"
      }
   ]
}

Note that if you must change the bucket’s name, then you can remove the associated S3 bucket in the AWS console under CodeGuru → CI workflows and select Disassociate Workflow.

b.  Analyzing a single commit

The CLI also lets us specify a specific commit range to analyze. This can lead to faster and more cost-effective scans for the incremental code changes, instead of a full repository scan. For example, if we just want to analyze the last commit, we can run:

aws-codeguru-cli -r ./ -s src/main/java -b build/libs -c HEAD^:HEAD --no-prompt

Here, we use the -c option to specify that we only want to analyze the commits between HEAD^ (the previous commit) and HEAD (the current commit). Moreover, we add the –no-prompt option to automatically answer questions by the CLI with yes. This option is useful if we plan to use the CLI in an automated way, such as in our CI/CD workflow.

c.  Encrypting artifacts

CodeGuru Reviewer lets us use a customer managed key to encrypt the content of the S3 bucket that is used to store the source and build artifacts. To achieve this, create a customer owned key in AWS Key Management Service (AWS KMS) (see Figure 8).

Figure 8: KMS settings

Figure 8: KMS settings

We must grant CodeGuru Reviewer the permission to decrypt artifacts with this key by adding the following Statement to your Key policy:

{
   "Sid":"Allow CodeGuru to use the key to decrypt artifact",
   "Effect":"Allow",
   "Principal":{
      "AWS":"*"
   },
   "Action":[
      "kms:Decrypt",
      "kms:DescribeKey"
   ],
   "Resource":"*",
   "Condition":{
      "StringEquals":{
         "kms:ViaService":"codeguru-reviewer.amazonaws.com",
         "kms:CallerAccount":[
            "YOUR AWS ACCOUNT ID"
         ]
      }
   }
}

Then, enable server-side encryption for the S3 bucket that we’re using with CodeGuru Reviewer (Figure 9).

S3 bucket settings:

Figure 9: S3 bucket encryption settings

Figure 9: S3 bucket encryption settings

After we enable encryption on the bucket, we must delete all the CodeGuru repository associations that use this bucket, and then recreate them by analyzing the repositories while providing the key (as in the following example, Figure 10):

Figure10: CodeGuru CI Workflow

Figure 10: CodeGuru CI Workflow

Note that the first time you check out your repository, it will always trigger a full repository scan. Consider setting the -c option, as this will allow a commit range.

Cleaning Up

At this stage, you may choose to delete the resources created while following this blog, to avoid incurring any unwanted costs.

  1. Delete Amazon S3 bucket.
  2. Delete AWS KMS key.
  3. Delete the Jenkins installation, if not required further.

Conclusion

In this post, we outlined how you can integrate Amazon CodeGuru Reviewer CLI with the Jenkins open-source build automation tool to perform code analysis as part of your code build pipeline and act as a quality gate. We showed you how to create a Jenkins pipeline job and integrate the CodeGuru Reviewer CLI to detect issues in your Java and Python code, as well as access the recommendations for remediating these issues. We presented an example where you can stop the build upon finding critical violations. Furthermore, we discussed how you can specify a commit range to avoid a full repo scan, and how the S3 bucket used by CodeGuru Reviewer to store artifacts can be encrypted using customer managed keys.

The CodeGuru Reviewer CLI offers you a one-line command to scan any code on your machine and retrieve recommendations. You can run the CLI anywhere where you can run AWS commands. In other words, you can use the CLI to integrate CodeGuru Reviewer into your favourite CI tool, as a pre-commit hook, or anywhere else in your workflow. In turn, you can combine CodeGuru Reviewer with Dynamic Application Security Testing (DAST) and Software Composition Analysis (SCA) tools to achieve a hybrid application security testing method that helps you combine the inside-out and outside-in testing approaches, cross-reference results, and detect vulnerabilities that both exist and are exploitable.

Hopefully, you have found this post informative, and the proposed solution useful. If you need helping hands, then AWS Professional Services can help implement this solution in your enterprise, as well as introduce you to our AWS DevOps services and offerings.

About the Authors

Akash Verma

Akash Verma

Akash is a Software Development Engineer 2 at Amazon India. He is passionate about writing clean code and building maintainable software. He also enjoys learning modern technologies. Outside of work, Akash loves to travel, interact with new people, and try different cuisines. He also relishes gardening and watching Stand-up comedy.

Debashish Chakrabarty

Debashish Chakrabarty

Debashish is a Sr. Engagement Manager at AWS Professional Services, India with over 21+ years of experience in various IT roles. At ProServe he leads engagements on Security, App Modernization and Migrations to help ProServe customers accelerate their cloud journey and achieve their business goals. Off work, Debashish has been a Hindi Blogger & Podcaster. He loves binge-watching OTT shows and spending time with family.

David Ernst

David Ernst

David is a Sr. Specialist Solution Architect – DevOps, with 20+ years of experience in designing and implementing software solutions for various industries. David is an automation enthusiast and works with AWS customers to design, deploy, and manage their AWS workloads/architectures.

How to use regional SAML endpoints for failover

Post Syndicated from Jonathan VanKim original https://aws.amazon.com/blogs/security/how-to-use-regional-saml-endpoints-for-failover/

Many Amazon Web Services (AWS) customers choose to use federation with SAML 2.0 in order to use their existing identity provider (IdP) and avoid managing multiple sources of identities. Some customers have previously configured federation by using AWS Identity and Access Management (IAM) with the endpoint signin.aws.amazon.com. Although this endpoint is highly available, it is hosted in a single AWS Region, us-east-1. This blog post provides recommendations that can improve resiliency for customers that use IAM federation, in the unlikely event of disrupted availability of one of the regional endpoints. We will show you how to use multiple SAML sign-in endpoints in your configuration and how to switch between these endpoints for failover.

How to configure federation with multi-Region SAML endpoints

AWS Sign-In allows users to log in into the AWS Management Console. With SAML 2.0 federation, your IdP portal generates a SAML assertion and redirects the client browser to an AWS sign-in endpoint, by default signin.aws.amazon.com/saml. To improve federation resiliency, we recommend that you configure your IdP and AWS federation to support multiple SAML sign-in endpoints, which requires configuration changes for both your IdP and AWS. If you have only one endpoint configured, you won’t be able to log in to AWS by using federation in the unlikely event that the endpoint becomes unavailable.

Let’s take a look at the Region code SAML sign-in endpoints in the AWS General Reference. The table in the documentation shows AWS regional endpoints globally. The format of the endpoint URL is as follows, where <region-code> is the AWS Region of the endpoint: https://<region-code>.signin.aws.amazon.com/saml

All regional endpoints have a region-code value in the DNS name, except for us-east-1. The endpoint for us-east-1 is signin.aws.amazon.com—this endpoint does not contain a Region code and is not a global endpoint. AWS documentation has been updated to reference SAML sign-in endpoints.

In the next two sections of this post, Configure your IdP and Configure IAM roles, I’ll walk through the steps that are required to configure additional resilience for your federation setup.

Important: You must do these steps before an unexpected unavailability of a SAML sign-in endpoint.

Configure your IdP

You will need to configure your IdP and specify which AWS SAML sign-in endpoint to connect to.

To configure your IdP

  1. If you are setting up a new configuration for AWS federation, your IdP will generate a metadata XML configuration file. Keep track of this file, because you will need it when you configure the AWS portion later.
  2. Register the AWS service provider (SP) with your IdP by using a regional SAML sign-in endpoint. If your IdP allows you to import the AWS metadata XML configuration file, you can find these files available for the public, GovCloud, and China Regions.
  3. If you are manually setting the Assertion Consumer Service (ACS) URL, we recommend that you pick the endpoint in the same Region where you have AWS operations.
  4. In SAML 2.0, RelayState is an optional parameter that identifies a specified destination URL that your users will access after signing in. When you set the ACS value, configure the corresponding RelayState to be in the same Region as the ACS. This keeps the Region configurations consistent for both ACS and RelayState. Following is the format of a Region-specific console URL.

    https://<region-code>.console.aws.amazon.com/

    For more information, refer to your IdP’s documentation on setting up the ACS and RelayState.

Configure IAM roles

Next, you will need to configure IAM roles’ trust policies for all federated human access roles with a list of all the regional AWS Sign-In endpoints that are necessary for federation resiliency. We recommend that your trust policy contains all Regions where you operate. If you operate in only one Region, you can get the same resiliency benefits by configuring an additional endpoint. For example, if you operate only in us-east-1, configure a second endpoint, such as us-west-2. Even if you have no workloads in that Region, you can switch your IdP to us-west-2 for failover. You can log in through AWS federation by using the us-west-2 SAML sign-in endpoint and access your us-east-1 AWS resources.

To configure IAM roles

  1. Log in to the AWS Management Console with credentials to administer IAM. If this is your first time creating the identity provider trust in AWS, follow the steps in Creating IAM SAML identity providers to create the identity providers.
  2. Next, create or update IAM roles for federated access. For each IAM role, update the trust policy that lists the regional SAML sign-in endpoints. Include at least two for increased resiliency.

    The following example is a role trust policy that allows the role to be assumed by a SAML provider coming from any of the four US Regions.

    {
        "Version": "2012-10-17",
        "Statement": [
            {
                "Effect": "Allow",
                "Principal": {
                    "Federated": "arn:aws:iam:::saml-provider/IdP"
                },
                "Action": "sts:AssumeRoleWithSAML",
                "Condition": {
                    "StringEquals": {
                        "SAML:aud": [
                            "https://us-east-2.signin.aws.amazon.com/saml",
                            "https://us-west-1.signin.aws.amazon.com/saml",
                            "https://us-west-2.signin.aws.amazon.com/saml",
                            "https://signin.aws.amazon.com/saml"
                        ]
                    }
                }
            }
        ]
    }

  3. When you use a regional SAML sign-in endpoint, the corresponding regional AWS Security Token Service (AWS STS) endpoint is also used when you assume an IAM role. If you are using service control policies (SCP) in AWS Organizations, check that there are no SCPs denying the regional AWS STS service. This will prevent the federated principal from being able to obtain an AWS STS token.

Switch regional SAML sign-in endpoints

In the event that the regional SAML sign-in endpoint your ACS is configured to use becomes unavailable, you can reconfigure your IdP to point to another regional SAML sign-in endpoint. After you’ve configured your IdP and IAM role trust policies as described in the previous two sections, you’re ready to change to a different regional SAML sign-in endpoint. The following high-level steps provide guidance on switching the regional SAML sign-in endpoint.

To switch regional SAML sign-in endpoints

  1. Change the configuration in the IdP to point to a different endpoint by changing the value for the ACS.
  2. Change the configuration for the RelayState value to match the Region of the ACS.
  3. Log in with your federated identity. In the browser, you should see the new ACS URL when you are prompted to choose an IAM role.
    Figure 1: New ACS URL

    Figure 1: New ACS URL

The steps to reconfigure the ACS and RelayState will be different for each IdP. Refer to the vendor’s IdP documentation for more information.

Conclusion

In this post, you learned how to configure multiple regional SAML sign-in endpoints as a best practice to further increase resiliency for federated access into your AWS environment. Check out the updates to the documentation for AWS Sign-In endpoints to help you choose the right configuration for your use case. Additionally, AWS has updated the metadata XML configuration for the public, GovCloud, and China AWS Regions to include all sign-in endpoints.

The simplest way to get started with SAML federation is to use AWS Single Sign-On (AWS SSO). AWS SSO helps manage your permissions across all of your AWS accounts in AWS Organizations.

If you have any questions, please post them in the Security Identity and Compliance re:Post topic or reach out to AWS Support.

Want more AWS Security news? Follow us on Twitter.

Jonathan VanKim

Jonathan VanKim

Jonathan VanKim is a Sr. Solutions Architect who specializes in Security and Identity for AWS. In 2014, he started working AWS Proserve and transitioned to SA 4 years later. His AWS career has been focused on helping customers of all sizes build secure AWS architectures. He enjoys snowboarding, wakesurfing, travelling, and experimental cooking.

Arynn Crow

Arynn Crow

Arynn Crow is a Manager of Product Management for AWS Identity. Arynn started at Amazon in 2012, trying out many different roles over the years before finding her happy place in security and identity in 2017. Arynn now leads the product team responsible for developing user authentication services at AWS.

Govern CI/CD best practices via AWS Service Catalog

Post Syndicated from César Prieto Ballester original https://aws.amazon.com/blogs/devops/govern-ci-cd-best-practices-via-aws-service-catalog/

Introduction

AWS Service Catalog enables organizations to create and manage Information Technology (IT) services catalogs that are approved for use on AWS. These IT services can include resources such as virtual machine images, servers, software, and databases to complete multi-tier application architectures. AWS Service Catalog lets you centrally manage deployed IT services and your applications, resources, and metadata , which helps you achieve consistent governance and meet your compliance requirements. In addition,  this configuration enables users to quickly deploy only approved IT services.

In large organizations, as more products are created, Service Catalog management can become exponentially complicated when different teams work on various products. The following solution simplifies Service Catalog products provisioning by considering elements such as shared accounts, roles, or users who can run portfolios or tags in the form of best practices via Continuous Integrations and Continuous Deployment (CI/CD) patterns.

This post demonstrates how Service Catalog Products can be delivered by taking advantage of the main benefits of CI/CD principles along with reducing complexity required to sync services. In this scenario, we have built a CI/CD Pipeline exclusively using AWS Services and the AWS Cloud Development Kit (CDK) Framework to provision the necessary Infrastructure.

Customers need the capability to consume services in a self-service manner, with services built on patterns that follow best practices, including focus areas such as compliance and security. The key tenants for these customers are: the use of infrastructure as code (IaC), and CI/CD. For these reasons, we built a scalable and automated deployment solution covered in this post.Furthermore, this post is also inspired from another post from the AWS community, Building a Continuous Delivery Pipeline for AWS Service Catalog.

Solution Overview

The solution is built using a unified AWS CodeCommit repository with CDK v1 code, which manages and deploys the Service Catalog Product estate. The solution supports the following scenarios: 1) making Products available to accounts and 2) provisioning these Products directly into accounts. The configuration provides flexibility regarding which components must be deployed in accounts as opposed to making a collection of these components available to account owners/users who can in turn build upon and provision them via sharing.

Figure shows the pipeline created comprised of stages

The pipeline created is comprised of the following stages:

  1. Retrieving the code from the repository
  2. Synthesize the CDK code to transform it into a CloudFormation template
  3. Ensure the pipeline is defined correctly
  4. Deploy and/or share the defined Portfolios and Products to a hub account or multiple accounts

Deploying and using the solution

Deploy the pipeline

We have created a Python AWS Cloud Development Kit (AWS CDK) v1 application hosted in a Git Repository. Deploying this application will create the required components described in this post. For a list of the deployment prerequisites, see the project README.

Clone the repository to your local machine. Then, bootstrap and deploy the CDK stack following the next steps.

git clone https://github.com/aws-samples/aws-cdk-service-catalog-pipeline
cd aws-cdk-service-catalog
pip install -r requirements.txt
cdk bootstrap aws://account_id/eu-west-1
cdk deploy

The infrastructure creation takes around 3-5 minutes to complete deploying the AWS CodePipelines and repository creation. Once CDK has deployed the components, you will have a new empty repository where we will define the target Service Catalog estate. To do so, clone the new repository and push our sample code into it:

git clone https://git-codecommit.eu-west-1.amazonaws.com/v1/repos/service-catalog-repo
git checkout -b main
cd service-catalog-repo
cp -aR ../cdk-service-catalog-pipeline/* .
git add .
git commit -am "First commit"
git push origin main

Review and update configuration

Our cdk.json file is used to manage context settings such as shared accounts, permissions, region to deploy, etc.

shared_accounts_ecs: AWS account IDs where the ECS portfolio will be shared
shared_accounts_storage: AWS account IDs where the Storage portfolio will be shared
roles: ARN for the roles who will have permissions to access to the Portfolio
users: ARN for the users who will have permissions to access to the Portfolio
groups: ARN for the groups who will have permissions to access to the Portfolio
hub_account: AWS account ID where the Portfolio will be created
pipeline_account: AWS account ID where the main Infrastructure Pipeline will be created
region: the AWS region to be used for the deployment of the account
"shared_accounts_ecs":["012345678901","012345678902"],
    "shared_accounts_storage":["012345678901","012345678902"],
    "roles":[],
    "users":[],
    "groups":[],
    "hub_account":"012345678901",
    "pipeline_account":"012345678901",
    "region":"eu-west-1"

There are two mechanisms that can be used to create Service Catalog Products in this solution: 1) providing a CloudFormation template or 2) declaring a CDK stack (that will be transformed as part of the pipeline). Our sample contains two Products, each demonstrating one of these options: an Amazon Elastic Container Services (ECS) deployment and an Amazon Simple Storage Service (S3) product.

These Products are automatically shared with accounts specified in the shared_accounts_storage variable. Each product is managed by a CDK Python file in the cdk_service_catalog folder.

Figure shows Pipeline stages that AWS CodePipeline runs through

Figure shows Pipeline stages that AWS CodePipeline runs through

Figure shows Pipeline stages that AWS CodePipeline runs through

The Pipeline stages that AWS CodePipeline runs through are as follows:

  1. Download the AWS CodeCommit code
  2. Synthesize the CDK code to transform it into a CloudFormation template
  3. Auto-modify the Pipeline in case you have made manual changes to it
  4. Display the different Portfolios and Products associated in a Hub account in a Region or in multiple accounts

Adding new Portfolios and Products

To add a new Portfolio to the Pipeline, we recommend creating a new class under cdk_service_catalog similar to cdk_service_catalog_ecs_stack.py from our sample. Once the new class is created with the products you wish to associate, we instantiate the new class inside cdk_pipelines.py, and then add it inside the wave in the stage. There are two ways to create portfolio products. The first one is by creating a CloudFormation template, as can be seen in the Amazon Elastic Container Service (ECS) example.  The second way is by creating a CDK stack that will be transformed into a template, as can be seen in the Storage example.

Product and Portfolio definition:

class ECSCluster(servicecatalog.ProductStack):
    def __init__(self, scope, id):
        super().__init__(scope, id)
        # Parameters for the Product Template
        cluster_name = cdk.CfnParameter(self, "clusterName", type="String", description="The name of the ECS cluster")
        container_insights_enable = cdk.CfnParameter(self, "container_insights", type="String",default="False",allowed_values=["False","True"],description="Enable Container Insights")
        vpc = cdk.CfnParameter(self, "vpc", type="AWS::EC2::VPC::Id", description="VPC")
        ecs.Cluster(self,"ECSCluster_template", enable_fargate_capacity_providers=True,cluster_name=cluster_name.value_as_string,container_insights=bool(container_insights_enable.value_as_string),vpc=vpc)
              cdk.Tags.of(self).add("key", "value")

Clean up

The following will help you clean up all necessary parts of this post: After completing your demo, feel free to delete your stack using the CDK CLI:

cdk destroy --all

Conclusion

In this post, we demonstrated how Service Catalog deployments can be accelerated by building a CI/CD pipeline using self-managed services. The Portfolio & Product estate is defined in its entirety by using Infrastructure-as-Code and automatically deployed based on your configuration. To learn more about AWS CDK Pipelines or AWS Service Catalog, visit the appropriate product documentation.

Authors:


César Prieto Ballester

César Prieto Ballester is a Senior DevOps Consultant at AWS. He enjoys automating everything and building infrastructure using code. Apart from work, he plays electric guitar and loves riding his mountain bike.

Daniel Mutale

Daniel Mutale is a Cloud Infrastructure Architect at AWS Professional Services. He enjoys creating cloud based architectures and building out the underlying infrastructure to support the architectures using code. Apart from work, he is an avid animal photographer and has a passion for interior design.

Raphael Sack

Raphael is a technical business development manager for Service Catalog & Control Tower. He enjoys tinkering with automation and code and active member of the management tools community.

Choosing the right certificate revocation method in ACM Private CA

Post Syndicated from Arthur Mnev original https://aws.amazon.com/blogs/security/choosing-the-right-certificate-revocation-method-in-acm-private-ca/

AWS Certificate Manager Private Certificate Authority (ACM PCA) is a highly available, fully managed private certificate authority (CA) service that allows you to create CA hierarchies and issue X.509 certificates from the CAs you create in ACM PCA. You can then use these certificates for scenarios such as encrypting TLS communication channels, cryptographically signing code, authenticating users, and more. But what happens if you decide to change your TLS endpoint or update your code signing entity? How do you revoke a certificate so that others no longer accept it?

In this blog post, we will cover two fully managed certificate revocation status checking mechanisms provided by ACM PCA: the Online Certificate Status Protocol (OCSP) and certificate revocation lists (CRLs). OCSP and CRLs both enable you to manage how you can notify services and clients about ACM PCA–issued certificates that you revoke. We’ll explain how these standard mechanisms work, we’ll highlight appropriate deployment use cases, and we’ll identify the advantages and downsides of each. We won’t cover configuration topics directly, but will provide you with links to that information as we go.

Certificate revocation

An X.509 certificate is a static, cryptographically signed document that represents a user, an endpoint, an IoT device, or a similar end entity. Because certificates provide a mechanism to authenticate these end entities, they are valid for a fixed period of time that you specify in the expiration date attribute when you generate a certificate. The expiration attribute is important, because it validates and regulates an end entity’s identity, and provides a means to schedule the termination of a certificate’s validity. However, there are situations where a certificate might need to be revoked before its scheduled expiration. These scenarios can include a compromised private key, the end of agreement between signed and signing organizations, user or configuration error when issuing certificates, and more. Although you can use certificates in many ways, we will refer to the predominant use case of TLS-based client-server implementations for the remainder of this blog post.

Certificate revocation can be used to identify certificates that are no longer trusted, and CRLs and OCSP are the standard mechanisms used to publish the revocation information. In addition, the special use case of OCSP stapling provides a more efficient mechanism that is supported in TLS 1.2 and later versions.

ACM PCA gives you the flexibility to use either of these mechanisms, or both. More importantly, as an ACM PCA administrator, the mechanism you choose to use is reflected in the certificate, and you must know how you want to manage revocation before you create the certificate. Therefore, you need to understand how the mechanisms work, select your strategy based on its appropriateness to your needs, and then create and deploy your certificates. Let’s look at how each mechanism works, the use cases for each, and issues to be aware of when you select a revocation strategy.

Certificate revocation using CRLs

As the name suggests, a CRL contains a list of revoked certificates. A CRL is cryptographically signed and issued by a CA, and made available for download by clients (for example, web browsers for TLS) through a CRL distribution point (CDP) such as a web server or a Lightweight Directory Access Point (LDAP) endpoint.

A CRL contains the revocation date and the serial number of revoked certificates. It also includes extensions, which specify whether the CA administrator temporarily suspended or irreversibly revoked the certificate. The CRL is signed and timestamped by the CA and can be verified by using the public key of the CA and the cryptographic algorithm included in the certificate. Clients download the CRL by using the address provided in the CDP extension and trust a certificate by verifying the signature, expiration date, and revocation status in the CRL.

CRLs provide an easy way to verify certificate validity. They can be cached and reused, which makes them resilient to network disruptions, and are an excellent choice for a server that is getting requests from many clients for the same CA. All major web browsers, OpenSSL, and other major TLS implementations support the CRL method of validating certificates.

However, the size of CRLs can lead to inefficiency for clients that are validating server identities. An example is the scenario of browsing multiple websites and downloading a CRL for each site that is visited. CRLs can also grow large over time as you revoke more certificates. Consider the World Wide Web and the number of invalidations that take place daily, which makes CRLs an inefficient choice for small-memory devices (for example, mobile, IoT, and similar devices). In addition, CRLs are not suited for real-time use cases. CRLs are downloaded periodically, a value that can be hours, days, or weeks, and cached for memory management. Many default TLS implementations, such as Mozilla, Chrome, Windows OS, and similar, cache CRLs for 24 hours, leaving a window of up to a day where an endpoint might incorrectly trust a revoked certificate. Cached CRLs also open opportunities for non-trusted sites to establish secure connections until the server refreshes the list, leading to security risks such as data breaches and identity theft.

Implementing CRLs by using ACM PCA

ACM PCA supports CRLs and stores them in an Amazon Simple Storage Service (Amazon S3) bucket for high availability and durability. You can refer to this blog post for an overview of how to securely create and store your CRLs for ACM PCA. Figure 1 shows how CRLs are implemented by using ACM PCA.

Figure 1: Certificate validation with a CRL

Figure 1: Certificate validation with a CRL

The workflow in Figure 1 is as follows:

  1. On certificate revocation, ACM PCA updates the Amazon S3 CRL bucket with a new CRL.

    Note: An update to the CRL may take up to 30 minutes after a certificate is revoked.

  2. The client requests a TLS connection and receives the server’s certificate.
  3. The client retrieves the current CRL file from the Amazon S3 bucket and validates it.

The refresh interval is the period between when an administrator revokes a certificate and when all parties consider that certificate revoked. The length of the refresh interval can depend on how quickly new information is published and how long clients cache revocation information to improve performance.

When you revoke a certificate, ACM PCA publishes a new CRL. ACM PCA waits 5 minutes after a RevokeCertificate API call before publishing a new CRL. This process exists to accommodate multiple revocation requests in a short time frame. An update to the CRL can take up to 30 minutes to propagate. If the CRL update fails, ACM PCA makes further attempts every 15 minutes.

CRLs also have a validity period, which you define as part of the CRL configuration by using ExpirationInDays. ACM PCA uses the value in the ExpirationInDays parameter to calculate the nextUpdate field in the CRL (the day and time when ACM PCA will publish the next CRL). If there are no changes to the CRL, the CRL is refreshed at half the interval of the next update. Clients may cache CRLs while they are still valid, so not all clients will have the updated CRL with the newly revoked certificates until the previous published CRL has expired.

Certificate revocation using OCSP

OCSP removes the burden of downloading the CRL from the client. With OCSP, clients provide the serial number and obtain the certificate status for a single certificate from an OCSP Responder. The OCSP Responder can be the CA or an endpoint managed by the CA. The certificate that is returned to the client contains an authorityInfoAccess extension, which provides an accessMethod (for example, OCSP), and identifies the OCSP Responder by a URL (for example, http://example-responder:<port>) in the accessLocation. You can also specify the OCSP Responder location manually in the CA profile. The certificate status response that is returned by the OCSP Responder can be good, revoked, or unknown, and is signed by using a process similar to the CRL for protection against forgery.

OCSP status checks are conducted in real time and are a good choice for time-sensitive devices, as well as mobile and IoT devices with limited memory.

However, the certificate status needs to be checked against the OCSP Responder for every connection, therefore requiring an extra hop. This can overwhelm the responder endpoint that needs to be designed for high availability, low latency, and protection against network and system failures. We will cover how ACM PCA addresses these availability and latency concerns in the next section.

Another thing to be mindful of is that the OCSP protocol implements OCSP status checks over unencrypted HTTP that poses privacy risks. When a client requests a certificate status, the CA receives information regarding the endpoint that is being connected to (for example, domain, IP address, and related information), which can easily be intercepted by a middle party. We will address how OCSP stapling can be used to address these privacy concerns in the OCSP stapling section.

Implementing OCSP by using ACM PCA

ACM PCA provides a highly available, fully managed OCSP solution to notify endpoints that certificates have been revoked. The OCSP implementation uses AWS managed OCSP responders and a globally available Amazon CloudFront distribution that caches OCSP responses closer to you, so you don’t need to set up and operate any infrastructure by yourself. You can enable OCSP on new or existing CAs using the ACM PCA console, the API, the AWS Command Line Interface (AWS CLI), or through AWS CloudFormation. Figure 2 shows how OCSP is implemented on ACM PCA.

Note: OCSP Responders, and the CloudFront distribution that caches the OCSP response for client requests, are managed by AWS.

Figure 2: Certificate validation with OCSP

Figure 2: Certificate validation with OCSP

The workflow in Figure 2 is as follows:

  1. On certificate revocation, the ACM PCA updates the OCSP Responder, which generates the OCSP response.
  2. The client requests a TLS connection and receives the server’s certificate.
  3. The client sends a query to the OCSP endpoint on CloudFront.

    Note: If the response is still valid in the CloudFront cache, it will be served to the client from the cache.

  4. If the response is invalid or missing in the CloudFront cache, the request is forwarded to the OCSP Responder.
  5. The OCSP Responder sends the OCSP response to the CloudFront cache.
  6. CloudFront caches the OCSP response and returns it to the client.

The ACM PCA OCSP Responder generates an OCSP response that gets cached by CloudFront for 60 minutes. When a certificate is revoked, ACM PCA updates the OCSP Responder to generate a new OCSP response. During the caching interval, clients continue to receive responses from the CloudFront cache. As with CRLs, clients may also cache OCSP responses, which means that not all clients will have the updated OCSP response for the newly revoked certificate until the previously published (client-cached) OCSP response has expired. Another thing to be mindful of is that while the response is cached, a compromised certificate can be used to spoof a client.

Certificate revocation using OCSP stapling

With both CRLs and OCSP, the client is responsible for validating the certificate status. OCSP stapling addresses the client validation overhead and privacy concerns that we mentioned earlier by having the server obtain status checks for certificates that the server holds, directly from the CA. These status checks are periodic (based on a user-defined value), and the responses are stored on the web server. During TLS connection establishment, the server staples the certificate status in the response that is sent to the client. This improves connection establishment speed by combining requests and reduces the number of requests that are sent to the OCSP endpoint. Because clients are no longer directly connecting to OCSP Responders or the CAs, the privacy risks that we mentioned earlier are also mitigated.

Implementing OCSP stapling by using ACM PCA

OCSP stapling is supported by ACM PCA. You simply use the OCSP Certificate Status Response passthrough to add the stapling extension in the TLS response that is sent from the server to the client. Figure 3 shows how OCSP stapling works with ACM PCA.

Figure 3: Certificate validation with OCSP stapling

Figure 3: Certificate validation with OCSP stapling

The workflow in Figure 3 is as follows:

  1. On certificate revocation, the ACM PCA updates the OCSP Responder, which generates the OCSP response.
  2. The client requests a TLS connection and receives the server’s certificate.
  3. In the case of server’s cache miss, the server will query the OCSP endpoint on CloudFront.

    Note: If the response is still valid in the CloudFront cache, it will be returned to the server from the cache.

  4. If the response is invalid or missing in the CloudFront cache, the request is forwarded to the OCSP Responder.
  5. The OCSP Responder sends the OCSP response to the CloudFront cache.
  6. CloudFront caches the OCSP response and returns it to the server, which also caches the response.
  7. The server staples the certificate status in its TLS connection response (for TLS 1.2 and later versions).

OCSP stapling is supported with TLS 1.2 and later versions.

Selecting the correct path with OCSP and CRLs

All certificate revocation offerings from AWS run on a highly available, distributed, and performance-optimized infrastructure. We strongly recommend that you enable a certificate validation and revocation strategy in your environment that best reflects your use case. You can opt to use CRLs, OCSP, or both. Without a revocation and validation process in place, you risk unauthorized access. We recommend that you review your business requirements and evaluate the risk profile of access with an invalid certificate versus the availability requirements for your application.

In the following sections, we’ll provide some recommendations on when to select which certificate validation and revocation strategy. We’ll cover client-server TLS communication, and also provide recommendations for mutual TLS (mTLS) authentication scenarios.

Recommended scenarios for OCSP stapling and OCSP Must-Staple

If your organization requires support for TLS 1.2 and later versions, you should use OCSP stapling. If you want to reduce the application availability risk for a client that is configured to fail the TLS connection establishment when it is unable to validate the certificate, you should consider using the OCSP Must-Staple extension.

OCSP stapling

If your organization requires support for TLS 1.2 and later versions, you should use OCSP stapling. With OCSP stapling, you reduce your client’s load and connectivity requirements, which helps if your network connectivity is unpredictable. For example, if your application client is a mobile device, you should anticipate network failures, low bandwidth, limited processing capacity, and impatient users. In this scenario, you will likely benefit the most from a system that relies on OCSP stapling.

Although the majority of web browsers support OCSP stapling, not all servers support it. OCSP stapling is, therefore, typically implemented together with CRLs that provide an alternate validation mechanism or as a passthrough for when the OCSP response fails or is invalid.

OCSP Must-Staple

If you want to rely on OCSP alone and avoid implementing CRLs, you can use the OCSP Must-Staple certificate extension, which tells the connecting client to expect a stapled response. You can then use OCSP Must-Staple as a flag for your client to fail the connection if the client does not receive a valid OCSP response during connection establishment.

Recommended scenarios for CRLs, OCSP (without stapling), and combinational strategies

If your application needs to support legacy, now deprecated protocols such as TLS 1.0 or 1.1, or if your server doesn’t support OCSP stapling, you could use a CRL, OCSP, or both together. To determine which option is best, you should consider your sensitivity to CA availability, recently revoked certificates, the processing capacity of your application client, and network latency.

CRLs

If your application needs to be available independent of your CA connectivity, you should consider using a CRL. CRLs are much larger files that, from a practical standpoint, require much longer cache times to be of use, but they will be present and available for verification on your system regardless of the status of your network connection. In addition, the lookup time of a certificate within a CRL is local and therefore shorter than a network round trip to an OCSP Responder, because there are no network connection or DNS lookup times.

OCSP (without stapling)

If you are sensitive to the processing capacity of your application client, you should use OCSP. The size of an OCSP message is much smaller compared to a CRL, which allows you to configure shorter caching times that are better suited for your risk profile. To optimize your OCSP and OCSP stapling process, you should review your DNS configuration because it plays a significant role in the amount of time your application will take to receive a response.

For example, if you’re building an application that will be hosted on infrastructure that doesn’t support OCSP stapling, you will benefit from clients making an OCSP request and caching it for a short period. In this scenario, your application client will make a single OCSP request during its connection setup, cache the response, and reuse the certificate state for the duration of its application session.

Combining CRLs and OCSP

You can also choose to implement both CRLs and OCSP for your certificate revocation and validation needs. For example, if your application needs to support legacy TLS protocols while providing resiliency to network failures, you can implement both CRLs and OCSP. When you use CRLs and OCSP together, you verify certificates primarily by using OCSP; however, in case your client is unable to reach the OCSP endpoint, you can fail over to an alternative validation method (for example, CRL). This approach of combining CRLs and OCSP gives you all the benefits of OCSP mentioned earlier, while providing a backup mechanism for failure scenarios such as an unreachable OCSP Responder, invalid response from the OCSP Responder, and similar. However, while this approach adds resilience to your application, it will add management overhead because you will need to set up CRL-based and OCSP-based revocation separately. Also, remember that clients with reduced computing power or poor network connectivity might struggle as they attempt to download and process the CRL.

Recommendations for mTLS authentication scenarios

You should consider network latency and revocation propagation delays when optimizing your server infrastructure for mTLS authentication. In a typical scenario, server certificate changes are infrequent, so caching an OCSP response or CRL on your client and an OCSP-stapled response on a server will improve performance. For mTLS, you can revoke a client certificate at any time; therefore, cached responses could introduce the risk of invalid access. You should consider designing your system such that a copy of a CRL for client certificates is maintained on the server and refreshed based on your business needs. For example, you can use S3 ETags to determine whether an object has changed, and flush the server’s cache in response.

Conclusion

This blog post covered two certificate revocation methods, OCSP and CRLs, that are available on ACM PCA. Remember, when you deploy CA hierarchies for public key infrastructure (PKI), it’s important to define how to handle certificate revocation. The certificate revocation information must be included in the certificate when it is issued, so the choice to enable either CRL or OCSP, or both, has to happen before the certificate is issued. It’s also important to have highly available CRL and OCSP endpoints for certificate lifecycle management. ACM PCA provides a highly available, fully managed CA service that you can use to meet your certificate revocation and validation requirements. Get started using ACM PCA.

 
If you have feedback about this post, submit comments in the Comments section below. If you have questions about this post, contact AWS Support.

Want more AWS Security news? Follow us on Twitter.
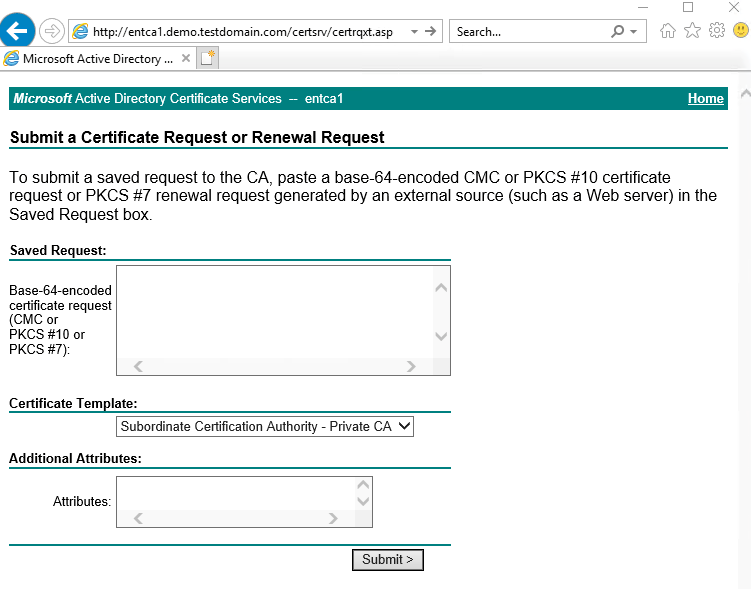
Author

Arthur Mnev

Arthur is a Senior Specialist Security Architect for Global Accounts. He spends his day working with customers and designing innovative approaches to help customers move forward with their initiatives, increase their security posture, and reduce security risks in their cloud journeys. Outside of work, Arthur enjoys being a father, skiing, scuba diving, and Krav Maga.

Basit Hussain

Basit Hussain

Basit is a Senior Security Specialist Solutions Architect based out of Seattle, focused on data protection in transit and at rest. In his almost 7 years at Amazon, Basit has diverse experience working across different teams. In his current role, he helps customers secure their workloads on AWS and provide innovative solutions to unblock customers in their cloud journey.

Trevor Freeman

Trevor Freeman

Trevor is an innovative and solutions-oriented Product Manager at Amazon Web Services, focusing on ACM PCA. With over 20 years of experience in software and service development, he became an expert in Cloud Services, Security, Enterprise Software, and Databases. Being adept in product architecture and quality assurance, Trevor takes great pride in providing exceptional customer service.

Umair Rehmat

Umair Rehmat

Umair is a cloud solutions architect and technologist based out of the Seattle WA area working on greenfield cloud migrations, solutions delivery, and any-scale cloud deployments. Umair specializes in telecommunications and security, and helps customers onboard, as well as grow, on AWS.

Leverage DevOps Guru for RDS to detect anomalies and resolve operational issues

Post Syndicated from Kishore Dhamodaran original https://aws.amazon.com/blogs/devops/leverage-devops-guru-for-rds-to-detect-anomalies-and-resolve-operational-issues/

The Relational Database Management System (RDBMS) is a popular choice among organizations running critical applications that supports online transaction processing (OLTP) use-cases. But managing the RDBMS database comes with its own challenges. AWS has made it easier for organizations to operate these databases in the cloud, thereby addressing the undifferentiated heavy lifting with managed databases (Amazon Aurora, Amazon RDS). Although using managed services has freed up engineering from provisioning hardware, database setup, patching, and backups, they still face the challenges that come with running a highly performant database. As applications scale in size and sophistication, it becomes increasingly challenging for customers to detect and resolve relational database performance bottlenecks and other operational issues quickly.

Amazon RDS Performance Insights is a database performance tuning and monitoring feature, that lets you quickly assess your database load and determine when and where to take action. Performance Insights lets non-experts in database administration diagnose performance problems with an easy-to-understand dashboard that visualizes database load. Furthermore, Performance Insights expands on the existing Amazon RDS monitoring features to illustrate database performance and help analyze any issues that affect it. The Performance Insights dashboard also lets you visualize the database load and filter the load by waits, SQL statements, hosts, or users.

On Dec 1st, 2021, we announced Amazon DevOps Guru for RDS, a new capability for Amazon DevOps Guru. It’s a fully-managed machine learning (ML)-powered service that detects operational and performance related issues for Amazon Aurora engines. It uses the data that it collects from Performance Insights, and then automatically detects and alerts customers of application issues, including database problems. When DevOps Guru detects an issue in an RDS database, it publishes an insight in the DevOps Guru dashboard. The insight contains an anomaly for the resource AWS/RDS. If DevOps Guru for RDS is turned on for your instances, then the anomaly contains a detailed analysis of the problem. DevOps Guru for RDS also recommends that you perform an investigation, or it provides a specific corrective action. For example, the recommendation might be to investigate a specific high-load SQL statement or to scale database resources.

In this post, we’ll deep-dive into some of the common issues that you may encounter while running your workloads against Amazon Aurora MySQL-Compatible Edition databases, with simulated performance issues. We’ll also look at how DevOps Guru for RDS can help identify and resolve these issues. Simulating a performance issue is resource intensive, and it will cost you money to run these tests. If you choose the default options that are provided, and clean up your resources using the following clean-up instructions, then it will cost you approximately $15 to run the first test only. If you wish to run all of the tests, then you can choose “all” in the Tests parameter choice. This will cost you approximately $28 to run all three tests.

Prerequisites

To follow along with this walkthrough, you must have the following prerequisites:

  • An AWS account with a role that has sufficient access to provision the required infrastructure. The account should also not have exceeded its quota for the resources being deployed (VPCs, Amazon Aurora, etc.).
  • Credentials that enable you to interact with your AWS account.
  • If you already have Amazon DevOps Guru turned on, then make sure that it’s tagged properly to detect issues for the resource being deployed.

Solution overview

You will clone the project from GitHub and deploy an AWS CloudFormation template, which will set up the infrastructure required to run the tests. If you choose to use the defaults, then you can run only the first test. If you would like to run all of the tests, then choose the “all” option under Tests parameter.

We simulate some common scenarios that your database might encounter when running enterprise applications. The first test simulates locking issues. The second test simulates the behavior when the AUTOCOMMIT property of the database driver is set to: True. This could result in statement latency. The third test simulates performance issues when an index is missing on a large table.

Solution walk through

Clone the repo and deploy resources

  1. Utilize the following command to clone the GitHub repository that contains the CloudFormation template and the scripts necessary to simulate the database load. Note that by default, we’ve provided the command to run only the first test.
    git clone https://github.com/aws-samples/amazon-devops-guru-rds.git
    cd amazon-devops-guru-rds
    
    aws cloudformation create-stack --stack-name DevOpsGuru-Stack \
        --template-body file://DevOpsGuruMySQL.yaml \
        --capabilities CAPABILITY_IAM \
        --parameters ParameterKey=Tests,ParameterValue=one \
    ParameterKey=EnableDevOpsGuru,ParameterValue=y

    If you wish to run all four of the tests, then flip the ParameterValue of the Tests ParameterKey to “all”.

    If Amazon DevOps Guru is already enabled in your account, then change the ParameterValue of the EnableDevOpsGuru ParameterKey to “n”.

    It may take up to 30 minutes for CloudFormation to provision the necessary resources. Visit the CloudFormation console (make sure to choose the region where you have deployed your resources), and make sure that DevOpsGuru-Stack is in the CREATE_COMPLETE state before proceeding to the next step.

  2. Navigate to AWS Cloud9, then choose Your environments. Next, choose DevOpsGuruMySQLInstance followed by Open IDE. This opens a cloud-based IDE environment where you will be running your tests. Note that in this setup, AWS Cloud9 inherits the credentials that you used to deploy the CloudFormation template.
  3. Open a new terminal window which you will be using to clone the repository where the scripts are located.

  1. Clone the repo into your Cloud9 environment, then navigate to the directory where the scripts are located, and run initial setup.
git clone https://github.com/aws-samples/amazon-devops-guru-rds.git
cd amazon-devops-guru-rds/scripts
sh setup.sh 
# NOTE: If you are running all test cases, use sh setup.sh all command instead. 
source ~/.bashrc
  1. Initialize databases for all of the test cases, and add random data into them. The script to insert random data takes approximately five hours to complete. Your AWS Cloud9 instance is set up to run for up to 24 hours before shutting down. You can exit the browser and return between 5–24 hours to validate that the script ran successfully, then continue to the next step.
source ./connect.sh test 1
USE devopsgurusource;
CREATE TABLE IF NOT EXISTS test1 (id int, filler char(255), timer timestamp);
exit;
python3 ct.py

If you chose to run all test cases, and you ran the sh setup.sh all command in Step 4, open two new terminal windows and run the following commands to insert random data for test cases 2 and 3.

# Test case 2 – Open a new terminal window to run the commands
cd amazon-devops-guru-rds/scripts
source ./connect.sh test 2
USE devopsgurusource;
CREATE TABLE IF NOT EXISTS test1 (id int, filler char(255), timer timestamp);
exit;
python3 ct.py
# Test case 3 - Open a new terminal window to run the commands
cd amazon-devops-guru-rds/scripts
source ./connect.sh test 3
USE devopsgurusource;
CREATE TABLE IF NOT EXISTS test1 (id int, filler char(255), timer timestamp);
exit;
python3 ct.py
  1. Return between 5-24 hours to run the next set of commands.
  1. Add an index to the first database.
source ./connect.sh test 1
CREATE UNIQUE INDEX test1_pk ON test1(id);
INSERT INTO test1 VALUES (-1, 'locker', current_timestamp);
exit;
  1. If you chose to run all test cases, and you ran the sh setup.sh all command in Step 4, add an index to the second database. NOTE: Do no add an index to the third database.
source ./connect.sh test 2
CREATE UNIQUE INDEX test1_pk ON test1(id);
INSERT INTO test1 VALUES (-1, 'locker', current_timestamp);
exit;

DevOps Guru for RDS uses Performance Insights, and it establishes a baseline for the database metrics. Baselining involves analyzing the database performance metrics over a period of time to establish a “normal” behavior. DevOps Guru for RDS then uses ML to detect anomalies against the established baseline. If your workload pattern changes, then DevOps Guru for RDS establishes a new baseline that it uses to detect anomalies against the new “normal”. For new database instances, DevOps Guru for RDS takes up to two days to establish an initial baseline, as it requires an analysis of the database usage patterns and establishing what is considered a normal behavior.

  1. Allow two days before you start running the following tests.

Scenario 1: Locking Issues

In this scenario, multiple sessions compete for the same (“locked”) record, and they must wait for each other.
In real life, this often happens when:

  • A database session gets disconnected due to a (i.e., temporary network) malfunction, while still holding a critical lock.
  • Other sessions become stuck while waiting for the lock to be released.
  • The problem is often exacerbated by the application connection manager that keeps spawning additional sessions (because the existing sessions don’t complete the work on time), thus creating a distinct “inclined slope” pattern that you’ll see in this scenario.

Here’s how you can reproduce it:

  1. Connect to the database.
cd amazon-devops-guru-rds/scripts
source ./connect.sh test 1
  1. In your MySQL, enter the following SQL, and don’t exit the shell.
START TRANSACTION;
UPDATE test1 SET timer=current_timestamp WHERE id=-1;
-- Do NOT exit!
  1. Open a new terminal, and run the command to simulate competing transactions. Give it approximately five minutes before you run the commands in this step.
cd amazon-devops-guru-rds/scripts
source ./connect.sh test 1
exit;
python3 locking_scenario.py 1 1200 2
  1. After the program completes its execution, navigate to the Amazon DevOps Guru console, choose Insights, and then choose RDS DB Load Anomalous. You’ll notice a summary of the insight under Description.

Shows navigation to Amazon DevOps Guru Insights and RDS DB Load Anomalous screen to find the summary description of the anomaly.

  1. Choose the View Recommendations link on the top right, and observe the databases for which it’s showing the recommendations.
  2. Next, choose View detailed analysis for database performance anomaly for the following resources.
  3. Under To view a detailed analysis, choose a resource name, choose the database associated with the first test.

 Shows the detailed analysis of the database performance anomaly. The database experiencing load is chosen, and a graphical representation of how the Average active sessions (AAS) spikes, which Amazon DevOps Guru is able to identify.

  1. Observe the recommendations under Analysis and recommendations. It provides you with analysis, recommendations, and links to troubleshooting documentation.

Shows a different section of the detailed analysis screen that provides Analysis and recommendations and links to the troubleshooting documentation.

In this example, DevOps Guru for RDS has detected a high and unusual spike of database load, and then marked it as “performance anomaly”.

Note that the relative size of the anomaly is significant: 490 times higher than the “typical” database load, which is why it’s deemed: “HIGH severity”.

In the analysis section, note that a single “wait event”, wait/synch/mutex/innodb/aurora_lock_thread_slot_futex, is dominating the entire spike. Moreover, a single SQL is “responsible” (or more precisely: “suffering”) from this wait event at the time of the problem. Select the wait event name and see a simple explanation of what’s happening in the database. For example, it’s “record locking”, where multiple sessions are competing for the same database records. Additionally, you can select the SQL hash and see the exact text of the SQL that’s responsible for the issue.

If you’re interested in why DevOps Guru for RDS detected this problem, and why these particular wait events and an SQL were selected, the Why is this a problem? and Why do we recommend this? links will provide the answer.

Finally, the most relevant part of this analysis is a View troubleshooting doc link. It references a document that contains a detailed explanation of the likely causes for this problem, as well as the actions that you can take to troubleshoot and address it.

Scenario 2: Autocommit: ON

In this scenario, we must run multiple batch updates, and we’re using a fairly popular driver setting: AUTOCOMMIT: ON.

This setting can sometimes lead to performance issues as it causes each UPDATE statement in a batch to be “encased” in its own “transaction”. This leads to data changes being frequently synchronized to disk, thus dramatically increasing batch latency.

Here’s how you can reproduce the scenario:

  1. On your Cloud9 terminal, run the following commands:
cd amazon-devops-guru-rds/scripts
source ./connect.sh test 2
exit;
python3 batch_autocommit.py 50 1200 1000 10000000
  1. Once the program completes its execution, or after an hour, navigate to the Amazon DevOps Guru console, choose Insights, and then choose RDS DB Load Anomalous. Then choose Recommendations and choose View detailed analysis for database performance anomaly for the following resources. Under To view a detailed analysis, choose a resource name, choose the database associated with the second test.

  1. Observe the recommendations under Analysis and recommendations. It provides you with analysis, recommendations, and links to troubleshooting documentation.

Shows a different section of the detailed analysis screen that provides Analysis and recommendations and links to the troubleshooting documentation.

Note that DevOps Guru for RDS detected a significant (and unusual) spike of database load and marked it as a HIGH severity anomaly.

The spike looks similar to the previous example (albeit, “smaller”), but it describes a different database problem (“COMMIT slowdowns”). This is because of a different database wait event that dominates the spike: wait/io/aurora_redo_log_flush.

As in the previous example, you can select the wait event name to see a simple description of what’s going on, and you can select the SQL hash to see the actual statement that is slow. Furthermore, just as before, the View troubleshooting doc link references the document that describes what you can do to troubleshoot the problem further and address it.

Scenario 3: Missing index

Have you ever wondered what would happen if you drop a frequently accessed index on a large table?

In this relatively simple scenario, we’re testing exactly that – an index gets dropped causing queries to switch from fast index lookups to slow full table scans, thus dramatically increasing latency and resource use.

Here’s how you can reproduce this problem and see it for yourself:

  1. On your Cloud9 terminal, run the following commands:
cd amazon-devops-guru-rds/scripts
source ./connect.sh test 3
exit;
python3 no_index.py 50 1200 1000 10000000
  1. Once the program completes its execution, or after an hour, navigate to the Amazon DevOps Guru console, choose Insights, and then choose RDS DB Load Anomalous. Then choose Recommendations and choose View detailed analysis for database performance anomaly for the following resources. Under To view a detailed analysis, choose a resource name, choose the database associated with the third test.

Shows the detailed analysis of the database performance anomaly. The database experiencing load is chosen and a graphical representation of how the Average active sessions (AAS) spikes which Amazon DevOps Guru is able to identify.

  1. Observe the recommendations under Analysis and recommendations. It provides you with analysis, recommendations, and links to troubleshooting documentation.

Shows a different section of the detailed analysis screen that provides Analysis and recommendations and links to the troubleshooting documentation.

As with the previous examples, DevOps Guru for RDS detected a high and unusual spike of database load (in this case, ~ 50 times larger than the “typical” database load). It also identified that a single wait event, wait/io/table/sql/handler, and a single SQL, are responsible for this issue.

The analysis highlights the SQL that you must pay attention to, and it links a detailed troubleshooting document that lists the likely causes and recommended actions for the problems that you see. While it doesn’t tell you that the “missing index” is the real root cause of the issue (this is planned in future versions), it does offer many relevant details that can help you come to that conclusion yourself.

Cleanup

On your terminal where you originally ran the AWS Command Line Interface (AWS CLI) command to create the CloudFormation resources, run the following command:

aws cloudformation delete-stack --stack-name DevOpsGuru-Stack

Conclusion

In this post, you learned how to leverage DevOps Guru for RDS to alert you of any operational issues with recommendations. You simulated some of the commonly encountered, real-world production issues, such as locking contentions, AUTOCOMMIT, and missing indexes. Moreover, you saw how DevOps Guru for RDS helped you detect and resolve these issues. Try this out, and let us know how DevOps Guru for RDS was able to address your use-case.

Authors:

Kishore Dhamodaran

Kishore Dhamodaran is a Senior Solutions Architect at AWS. Kishore helps strategic customers with their cloud enterprise strategy and migration journey, leveraging his years of industry and cloud experience.

Simsek Mert

Simsek Mert is a Cloud Application Architect with AWS Professional Services.
Simsek helps customers with their application architecture, containers, serverless applications, leveraging his over 20 years of experience.

Maxym Kharchenko

Maxym Kharchenko is a Principal Database Engineer at AWS. He builds automated monitoring tools that use machine learning to discover and explain performance problems in relational databases.

Jared Keating

Jared Keating is a Senior Cloud Consultant with Amazon Web Services Professional Services. Jared assists customers with their cloud infrastructure, compliance, and automation requirements drawing from his over 20 years of experience in IT.

Throttling a tiered, multi-tenant REST API at scale using API Gateway: Part 2

Post Syndicated from Nick Choi original https://aws.amazon.com/blogs/architecture/throttling-a-tiered-multi-tenant-rest-api-at-scale-using-api-gateway-part-2/

In Part 1 of this blog series, we demonstrated why tiering and throttling become necessary at scale for multi-tenant REST APIs, and explored tiering strategy and throttling with Amazon API Gateway.

In this post, Part 2, we will examine tenant isolation strategies at scale with API Gateway and extend the sample code from Part 1.

Enhancing the sample code

To enable this functionality in the sample code (Figure 1), we will make manual changes. First, create one API key for the Free Tier and five API keys for the Basic Tier. Currently, these API keys are private keys for your Amazon Cognito login, but we will make a further change in the backend business logic that will promote them to pooled resources. Note that all of these modifications are specific to this sample code’s implementation; the implementation and deployment of a production code may be completely different (Figure 1).

Cloud architecture of the sample code

Figure 1. Cloud architecture of the sample code

Next, in the business logic for thecreateKey(), find the AWS Lambda function in lambda/create_key.js.  It appears like this:

function createKey(tableName, key, plansTable, jwt, rand, callback) {
  const pool = getPoolForPlanId( key.planId ) 
  if (!pool) {
    createSiloedKey(tableName, key, plansTable, jwt, rand, callback);
  } else {
    createPooledKey(pool, tableName, key, jwt, callback);
  }
}

The getPoolForPlanId() function does a search for a pool of keys associated with the usage plan. If there is a pool, we “create” a kind of reference to the pooled resource, rather than a completely new key that is created by the API Gateway service directly. The lambda/api_key_pools.js should be empty.

exports.apiKeyPools = [];

In effect, all usage plans were considered as siloed keys up to now. To change that, populate the data structure with values from the six API keys that were created manually. You will have to look up the IDs of the API keys and usage plans that were created in API Gateway (Figures 2 and 3). Using the AWS console to navigate to API Gateway is the most intuitive.

A view of the AWS console when inspecting the ID for the Basic usage plan

Figure 2. A view of the AWS console when inspecting the ID for the Basic usage plan

A view of the AWS Console when looking up the API key value (not the ID)

Figure 3. A view of the AWS Console when looking up the API key value (not the ID)

When done, your code in lambda/api_key_pools.js should be the following, but instead of ellipses (…), the IDs for the user plans and API keys specific to your environment will appear.

exports.apiKeyPools = [{
    planName: "FreePlan"
    planId: "...",
    apiKeys: [ "..." ]
  },
 {
    planName: "BasicPlan"
    planId: "...",
    apiKeys: [ "...", "...", "...", "...", "..." ]
  }];

After making the code changes, run cdk deploy from the command line to update the Lambda functions. This change will only affect key creation and deletion because of the system implementation. Updates affect only the user’s specific reference to the key, not the underlying resource managed by API Gateway.

When the web application is run now, it will look similar to before—tenants should not be aware what tiering strategy they have been assigned to. The only way to notice the difference would be to create two Free Tier keys, test them, and note that the value of the X-API-KEY header is unchanged between the two.

Now, you have a virtually unlimited number of users who can have API keys in the Free or Basic Tier. By keeping the Premium Tier siloed, you are subject to the 10,000-API-key maximum (less any keys allocated for the lower tiers). You may consider additional techniques to continue to scale, such as replicating your service in another AWS account.

Other production considerations

The sample code is minimal, and it illustrates just one aspect of scaling a Software-as-a-service (SaaS) application. There are many other aspects be considered in a production setting that we explore in this section.

The throttled endpoint, GET /api rely only on API key for authorization for demonstration purpose. For any production implementation consider authentication options for your REST APIs. You may explore and extend to require authentication with Cognito similar to /admin/* endpoints in the sample code.

One API key for Free Tier access and five API keys for Basic Tier access are illustrative in a sample code but not representative of production deployments. Number of API keys with service quota into consideration, business and technical decisions may be made to minimize noisy neighbor effect such as setting blast radius upper threshold of 0.1% of all users. To satisfy that requirement, each tier would need to spread users across at least 1,000 API keys. The number of keys allocated to Basic or Premium Tier would depend on market needs and pricing strategies. Additional allocations of keys could be held in reserve for troubleshooting, QA, tenant migrations, and key retirement.

In the planning phase of your solution, you will decide how many tiers to provide, how many usage plans are needed, and what throttle limits and quotas to apply. These decisions depend on your architecture and business.

To define API request limits, examine the system API Gateway is protecting and what load it can sustain. For example, if your service will scale up to 1,000 requests per second, it is possible to implement three tiers with a 10/50/40 split: the lowest tier shares one common API key with a 100 request per second limit; an intermediate tier has a pool of 25 API keys with a limit of 20 requests per second each; and the highest tier has a maximum of 10 API keys, each supporting 40 requests per second.

Metrics play a large role in continuously evolving your SaaS-tiering strategy (Figure 4). They provide rich insights into how tenants are using the system. Tenant-aware and SaaS-wide metrics on throttling and quota limits can be used to: assess tiering in-place, if tenants’ requirements are being met, and if currently used tenant usage profiles are valid (Figure 5).

Tiering strategy example with 3 tiers and requests allocation per tier

Figure 4. Tiering strategy example with 3 tiers and requests allocation per tier

An example SaaS metrics dashboard

Figure 5. An example SaaS metrics dashboard

API Gateway provides options for different levels of granularity required, including detailed metrics, and execution and access logging to enable observability of your SaaS solution. Granular usage metrics combined with underlying resource consumption leads to managing optimal experience for your tenants with throttling levels and policies per method and per client.

Cleanup

To avoid incurring future charges, delete the resources. This can be done on the command line by typing:

cd ${TOP}/cdk
cdk destroy

cd ${TOP}/react
amplify delete

${TOP} is the topmost directory of the sample code. For the most up-to-date information, see the README.md file.

Conclusion

In this two-part blog series, we have reviewed the best practices and challenges of effectively guarding a tiered multi-tenant REST API hosted in AWS API Gateway. We also explored how throttling policy and quota management can help you continuously evaluate the needs of your tenants and evolve your tiering strategy to protect your backend systems from being overwhelmed by inbound traffic.

Further reading:

Throttling a tiered, multi-tenant REST API at scale using API Gateway: Part 1

Post Syndicated from Nick Choi original https://aws.amazon.com/blogs/architecture/throttling-a-tiered-multi-tenant-rest-api-at-scale-using-api-gateway-part-1/

Many software-as-a-service (SaaS) providers adopt throttling as a common technique to protect a distributed system from spikes of inbound traffic that might compromise reliability, reduce throughput, or increase operational cost. Multi-tenant SaaS systems have an additional concern of fairness; excessive traffic from one tenant needs to be selectively throttled without impacting the experience of other tenants. This is also known as “the noisy neighbor” problem. AWS itself enforces some combination of throttling and quota limits on nearly all its own service APIs. SaaS providers building on AWS should design and implement throttling strategies in all of their APIs as well.

In this two-part blog series, we will explore tiering and throttling strategies for multi-tenant REST APIs and review tenant isolation models with hands-on sample code. In part 1, we will look at why a tiering and throttling strategy is needed and show how Amazon API Gateway can help by showing sample code. In part 2, we will dive deeper into tenant isolation models as well as considerations for production.

We selected Amazon API Gateway for this architecture since it is a fully managed service that helps developers to create, publish, maintain, monitor, and secure APIs. First, let’s focus on how Amazon API Gateway can be used to throttle REST APIs with fine granularity using Usage Plans and API Keys. Usage Plans define the thresholds beyond which throttling should occur. They also enable quotas, which sets a maximum usage per a day, week, or month. API Keys are identifiers for distinguishing traffic and determining which Usage Plans to apply for each request. We limit the scope of our discussion to REST APIs because other protocols that API Gateway supports — WebSocket APIs and HTTP APIs — have different throttling mechanisms that do not employ Usage Plans or API Keys.

SaaS providers must balance minimizing cost to serve and providing consistent quality of service for all tenants. They also need to ensure one tenant’s activity does not affect the other tenants’ experience. Throttling and quotas are a key aspect of a tiering strategy and important for protecting your service at any scale. In practice, this impact of throttling polices and quota management is continuously monitored and evaluated as the tenant composition and behavior evolve over time.

Architecture Overview

Figure 1. Cloud Architecture of the sample code.

Figure 1 – Architecture of the sample code

To get a firm foundation of the basics of throttling and quotas with API Gateway, we’ve provided sample code in AWS-Samples on GitHub. Not only does it provide a starting point to experiment with Usage Plans and API Keys in the API Gateway, but we will modify this code later to address complexity that happens at scale. The sample code has two main parts: 1) a web frontend and, 2) a serverless backend. The backend is a serverless architecture using Amazon API Gateway, AWS Lambda, Amazon DynamoDB, and Amazon Cognito. As Figure I illustrates, it implements one REST API endpoint, GET /api, that is protected with throttling and quotas. There are additional APIs under the /admin/* resource to provide Read access to Usage Plans, and CRUD operations on API Keys.

All these REST endpoints could be tested with developer tools such as curl or Postman, but we’ve also provided a web application, to help you get started. The web application illustrates how tenants might interact with the SaaS application to browse different tiers of service, purchase API Keys, and test them. The web application is implemented in React and uses AWS Amplify CLI and SDKs.

Prerequisites

To deploy the sample code, you should have the following prerequisites:

For clarity, we’ll use the environment variable, ${TOP}, to indicate the top-most directory in the cloned source code or the top directory in the project when browsing through GitHub.

Detailed instructions on how to install the code are in ${TOP}/INSTALL.md file in the code. After installation, follow the ${TOP}/WALKTHROUGH.md for step-by-step instructions to create a test key with a very small quota limit of 10 requests per day, and use the client to hit that limit. Search for HTTP 429: Too Many Requests as the signal your client has been throttled.

Figure 2: The web application (with browser developer tools enabled) shows that a quick succession of API calls starts returning an HTTP 429 after the quota for the day is exceeded.

Figure 2: The web application (with browser developer tools enabled) shows that a quick succession of API calls starts returning an HTTP 429 after the quota for the day is exceeded.

Responsibilities of the Client to support Throttling

The Client must provide an API Key in the header of the HTTP request, labelled, “X-Api-Key:”. If a resource in API Gateway has throttling enabled and that header is missing or invalid in the request, then API Gateway will reject the request.

Important: API Keys are simple identifiers, not authorization tokens or cryptographic keys. API keys are for throttling and managing quotas for tenants only and not suitable as a security mechanism. There are many ways to properly control access to a REST API in API Gateway, and we refer you to the AWS documentation for more details as that topic is beyond the scope of this post.

Clients should always test for the response to any network call, and implement logic specific to an HTTP 429 response. The correct action is almost always “try again later.” Just how much later, and how many times before giving up, is application dependent. Common approaches include:

  • Retry – With simple retry, client retries the request up to defined maximum retry limit configured
  • Exponential backoff – Exponential backoff uses progressively larger wait time between retries for consecutive errors. As the wait time can become very long quickly, maximum delay and a maximum retry limits should be specified.
  • Jitter – Jitter uses a random amount of delay between retry to prevent large bursts by spreading the request rate.

AWS SDK is an example client-responsibility implementation. Each AWS SDK implements automatic retry logic that uses a combination of retry, exponential backoff, jitter, and maximum retry limit.

SaaS Considerations: Tenant Isolation Strategies at Scale

While the sample code is a good start, the design has an implicit assumption that API Gateway will support as many API Keys as we have number of tenants. In fact, API Gateway has a quota on available per region per account. If the sample code’s requirements are to support more than 10,000 tenants (or if tenants are allowed multiple keys), then the sample implementation is not going to scale, and we need to consider more scalable implementation strategies.

This is one instance of a general challenge with SaaS called “tenant isolation strategies.” We highly recommend reviewing this white paper ‘SasS Tenant Isolation Strategies‘. A brief explanation here is that the one-resource-per-customer (or “siloed”) model is just one of many possible strategies to address tenant isolation. While the siloed model may be the easiest to implement and offers strong isolation, it offers no economy of scale, has high management complexity, and will quickly run into limits set by the underlying AWS Services. Other models besides siloed include pooling, and bridged models. Again, we recommend the whitepaper for more details.

Figure 3. Tiered multi-tenant architectures often employ different tenant isolation strategies at different tiers. Our example is specific to API Keys, but the technique generalizes to storage, compute, and other resources.

Figure 3- Tiered multi-tenant architectures often employ different tenant isolation strategies at different tiers. Our example is specific to API Keys, but the technique generalizes to storage, compute, and other resources.

In this example, we implement a range of tenant isolation strategies at different tiers of service. This allows us to protect against “noisy-neighbors” at the highest tier, minimize outlay of limited resources (namely, API-Keys) at the lowest tier, and still provide an effective, bounded “blast radius” of noisy neighbors at the mid-tier.

A concrete development example helps illustrate how this can be implemented. Assume three tiers of service: Free, Basic, and Premium. One could create a single API Key that is a pooled resource among all tenants in the Free Tier. At the other extreme, each Premium customer would get their own unique API Key. They would protect Premium tier tenants from the ‘noisy neighbor’ effect. In the middle, the Basic tenants would be evenly distributed across a set of fixed keys. This is not complete isolation for each tenant, but the impact of any one tenant is contained within “blast radius” defined.

In production, we recommend a more nuanced approach with additional considerations for monitoring and automation to continuously evaluate tiering strategy. We will revisit these topics in greater detail after considering the sample code.

Conclusion

In this post, we have reviewed how to effectively guard a tiered multi-tenant REST API hosted in Amazon API Gateway. We also explored how tiering and throttling strategies can influence tenant isolation models. In Part 2 of this blog series, we will dive deeper into tenant isolation models and gaining insights with metrics.

If you’d like to know more about the topic, the AWS Well-Architected SaaS Lens Performance Efficiency pillar dives deep on tenant tiers and providing differentiated levels of performance to each tier. It also provides best practices and resources to help you design and reduce impact of noisy neighbors your SaaS solution.

To learn more about Serverless SaaS architectures in general, we recommend the AWS Serverless SaaS Workshop and the SaaS Factory Serverless SaaS reference solution that inspired it.