Tag Archives: Advanced (300)

Automate Amazon Redshift Serverless data warehouse management using AWS CloudFormation and the AWS CLI

Post Syndicated from Ranjan Burman original https://aws.amazon.com/blogs/big-data/automate-amazon-redshift-serverless-data-warehouse-management-using-aws-cloudformation-and-the-aws-cli/

Amazon Redshift Serverless makes it simple to run and scale analytics without having to manage the instance type, instance size, lifecycle management, pausing, resuming, and so on. It automatically provisions and intelligently scales data warehouse compute capacity to deliver fast performance for even the most demanding and unpredictable workloads, and you pay only for what you use. Just load your data and start querying right away in the Amazon Redshift Query Editor or in your favorite business intelligence (BI) tool and continue to enjoy the best price performance and familiar SQL features in an easy-to-use, zero administration environment.

Redshift Serverless separates compute and storage and introduces two abstractions:

  • Workgroup – A workgroup is a collection of compute resources. It groups together compute resources like RPUs, VPC subnet groups, and security groups.
  • Namespace – A namespace is a collection of database objects and users. It groups together data objects, such as databases, schemas, tables, users, or AWS Key Management Service (AWS KMS) keys for encrypting data.

Some organizations want to automate the creation of workgroups and namespaces for automated infrastructure management and consistent configuration across environments, and provide end-to-end self-service capabilities. You can automate the workgroup and namespace management operations using the Redshift Serverless API, the AWS Command Line Interface (AWS CLI), or AWS CloudFormation, which we demonstrate in this post.

Solution overview

In the following sections, we discuss the automation approaches for various tasks involved in Redshift Serverless data warehouse management using AWS CloudFormation (for more information, see RedshiftServerless resource type reference) and the AWS CLI (see redshift-serverless).

The following are some of the key use cases and appropriate automation approaches to use with AWS CloudFormation:

  • Enable end-to-end self-service from infrastructure setup to querying
  • Automate data consumer onboarding for data provisioned through AWS Data Exchange
  • Accelerate workload isolation by creating endpoints
  • Create a new data warehouse with consistent configuration across environments

The following are some of the main use cases and approaches for the AWS CLI:

  • Automate maintenance operations:
    • Backup and limits
    • Modify RPU configurations
    • Manage limits
  • Automate migration from provisioned to serverless

Prerequisites

To run the operations described in this post, make sure that this user or role has AWS Identity Access and Management (IAM) arn:aws:iam::aws:policy/AWSCloudFormationFullAccess, and either the administrator permission arn:aws:iam::aws:policy/AdministratorAccess or the full Amazon Redshift permission arn:aws:iam::aws:policy/AmazonRedshiftFullAccess policy attached. Refer to Security and connections in Amazon Redshift Serverless for further details.

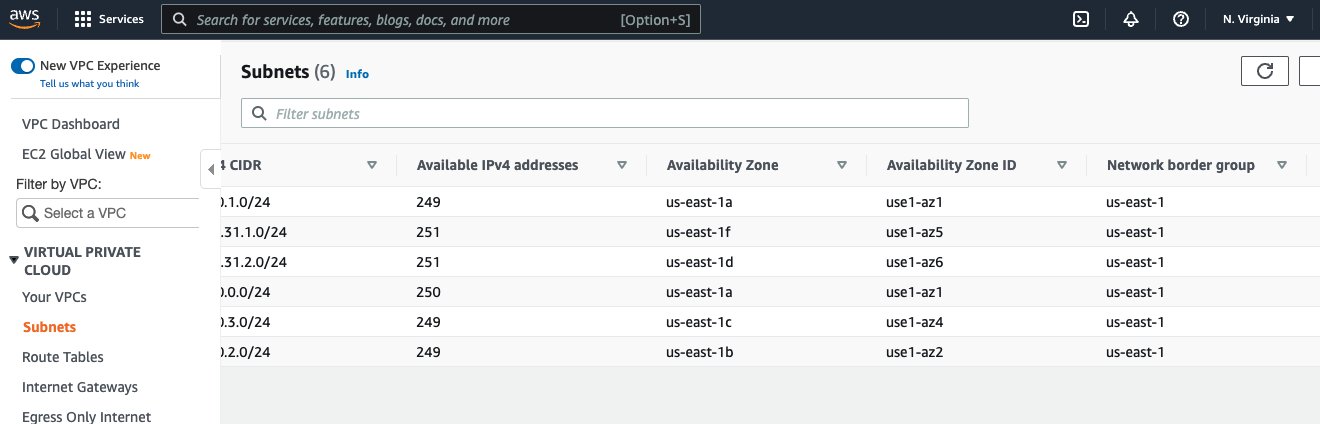
You should have at least three subnets, and they must span across three Availability Zones.It is not enough if just 3 subnets created in same availability zone. To create a new VPC and subnets, use the following CloudFormation template to deploy in your AWS account.

Create a Redshift Serverless namespace and workgroup using AWS CloudFormation

AWS CloudFormation helps you model and set up your AWS resources so that you can spend less time on infrastructure setup and more time focusing on your applications that run in AWS. You create a template that describes all the AWS resources that you want, and AWS CloudFormation takes care of provisioning and configuring those resources based on the given input parameters.

To create the namespace and workgroup for a Redshift Serverless data warehouse using AWS CloudFormation, complete the following steps:

  1. Choose Launch Stack to launch AWS CloudFormation in your AWS account with a template:
  2. For Stack name, enter a meaningful name for the stack, for example, rsserverless.
  3. Enter the parameters detailed in the following table.
Parameters Default Allowed Values Description
Namespace . N/A The name of the namespace of your choice to be created.
Database Name dev N/A The name of the first database in the Redshift Serverless environment.
Admin User Name admin N/A The administrator’s user name for the Redshift Serverless namespace being create.
Admin User Password . N/A The password associated with the admin user.
Associate IAM Role . Comma-delimited list of ARNs of IAM roles Associate an IAM role to your Redshift Serverless namespace (optional).
Log Export List userlog, connectionlog, useractivitylog userlog, connectionlog, useractivitylog Provide comma-separated values from the list. For example, userlog, connectionlog, useractivitylog. If left blank, LogExport is turned off.
Workgroup . N/A The workgroup name of your choice to be created.
Base RPU 128 Minimum value of 32 and maximum value of 512 The base RPU for the Redshift Serverless workgroup.
Publicly accessible false true, false Indicates if the Redshift Serverless instance is publicly accessible.
Subnet Ids . N/A You must have at least three subnets, and they must span across three Availability Zones.
Security Group Id . N/A The list of security group IDs in your VPC.
Enhanced VPC Routing false true, false The value that specifies whether to enable enhanced VPC routing, which forces Redshift Serverless to route traffic through your VPC.
  1. Pass the parameters provided to the AWS::RedshiftServerless::Namespace and AWS::RedshiftServerless::Workgroup resource types:
    Resources:
      RedshiftServerlessNamespace:
        Type: 'AWS::RedshiftServerless::Namespace'
        Properties:
          AdminUsername:
            Ref: AdminUsername
          AdminUserPassword:
            Ref: AdminUserPassword
          DbName:
            Ref: DatabaseName
          NamespaceName:
            Ref: NamespaceName
          IamRoles:
            Ref: IAMRole
          LogExports:
            Ref: LogExportsList        
      RedshiftServerlessWorkgroup:
        Type: 'AWS::RedshiftServerless::Workgroup'
        Properties:
          WorkgroupName:
            Ref: WorkgroupName
          NamespaceName:
            Ref: NamespaceName
          BaseCapacity:
            Ref: BaseRPU
          PubliclyAccessible:
            Ref: PubliclyAccessible
          SubnetIds:
            Ref: SubnetId
          SecurityGroupIds:
            Ref: SecurityGroupIds
          EnhancedVpcRouting:
            Ref: EnhancedVpcRouting        
        DependsOn:
          - RedshiftServerlessNamespace

Perform namespace and workgroup management operations using the AWS CLI

The AWS CLI is a unified tool to manage your AWS services. With just one tool to download and configure, you can control multiple AWS services from the command line and automate them through scripts.

To run the Redshift Serverless CLI commands, you need to install the latest version of AWS CLI. For instructions, refer to Installing or updating the latest version of the AWS CLI.

Now you’re ready to complete the following steps:

Use the following command to create a new namespace:

aws redshift-serverless create-namespace \
    --admin-user-password '<password>' \
    --admin-username cfn-blog-admin \
    --db-name cfn-blog-db \
    --namespace-name 'cfn-blog-ns'

The following screenshot shows an example output.

create-namespace

Use the following command to create a new workgroup mapped to the namespace you just created:

aws redshift-serverless create-workgroup \
    --base-capacity 128 \
    --namespace-name 'cfn-blog-ns' \
    --no-publicly-accessible \
    --security-group-ids "sg-0269bd680e0911ce7" \
    --subnet-ids "subnet-078eedbdd99398568" "subnet-05defe25a59c0e4c2" "subnet-0f378d07e02da3e48"\
    --workgroup-name 'cfn-blog-wg'

The following is an example output.

create workgroup

To allow instances and devices outside the VPC to connect to the workgroup, use the publicly-accessible option in the create-workgroup CLI command.

To verify the workgroup has been created and is in AVAILABLE status, use the following command:

aws redshift-serverless get-workgroup \
--workgroup-name 'cfn-blog-wg' \
--output text \
--query 'workgroup.status'

The following screenshot shows our output.

Regardless of whether your snapshot was made from a provisioned cluster or serverless workgroup, it can be restored into a new serverless workgroup. Restoring a snapshot replaces the namespace and workgroup with the contents of the snapshot.

Use the following command to restore from a snapshot:

aws redshift-serverless restore-from-snapshot \
--namespace-name 'cfn-blog-ns' \
--snapshot-arn arn:aws:redshift:us-east-1:<account-id>:snapshot:<cluster-identifier>/<snapshot-identifier> \
--workgroup-name 'cfn-blog-wg'

The following is an example output.

To check the workgroup status, run the following command:

aws redshift-serverless get-workgroup \
--workgroup-name 'cfn-blog-wg' \
--output text \
--query 'workgroup.status'

To create a snapshot from an existing namespace, run the following command:

aws redshift-serverless create-snapshot \
--namespace-name cfn-blog-ns \
--snapshot-name cfn-blog-snapshot-from-ns \
--retention-period 7

The following is an example output.

Redshift Serverless creates recovery points of your namespace that are available for 24 hours. To keep your recovery point longer than 24 hours, convert it to a snapshot.

To find the recovery points associated to your namespace, run the following command:

aws redshift-serverless list-recovery-points \
--namespace-name cfn-blog-ns \
--no-paginate

The following an example output with the list of all the recovery points.

list recovery points

Let’s take the latest recoveryPointId from the list and convert to snapshot.

To create a snapshot from a recovery point, run the following command:

aws redshift-serverless convert-recovery-point-to-snapshot \
--recovery-point-id f9eaf9ac-a98d-4809-9eee-869ef03e98b4 \
--retention-period 7 \
--snapshot-name cfn-blog-snapshot-from-rp

The following is an example output.

convert-recovery-point

In addition to restoring a snapshot to a serverless namespace, you can also restore from a recovery point.

  1. First, you need to find the recovery point identifier using the list-recovery-points command.
  2. Then use the following command to restore from a recovery point:
aws redshift-serverless restore-from-recovery-point \
--namespace-name cfn-blog-ns \
--recovery-point-id 15c55fb4-d973-4d8a-a8fe-4741e7911137 \
--workgroup-name cfn-blog-wg

The following is an example output.

restore from recovery point

The base RPU determines the starting capacity for your serverless environment.

Use the following command to modify the base RPU based on your workload requirements:

aws redshift-serverless update-workgroup \
--base-capacity 256 \
--workgroup-name 'cfn-blog-wg'

The following is an example output.

Run the following command to verify the workgroup base RPU capacity has been modified to 256:

aws redshift-serverless get-workgroup \
--workgroup-name 'cfn-blog-wg' \
--output text \
--query 'workgroup.baseCapacity'


To keep costs predictable for Redshift Serverless, you can set the maximum RPU hours used per day, per week, or per month. In addition, you can take action when the limit is reached. Actions include: write a log entry to a system table, receive an alert, or turn off user queries.

Use the following command to first get the workgroup ARN:

aws redshift-serverless get-workgroup --workgroup-name 'cfn-blog-wg' \
--output text \
--query 'workgroup.workgroupArn'

The following screenshot shows our output.

Use the workgroupArn output from the preceding command with the following command to set the daily RPU usage limit and set the action behavior to log:

aws redshift-serverless create-usage-limit \
--amount 256 \
--breach-action log \
--period daily \
--resource-arn arn:aws:redshift-serverless:us-east-1:<aws-account-id>:workgroup/1dcdd402-8aeb-432e-8833-b1f78a112a93 \
--usage-type serverless-compute

The following is an example output.

Conclusion

You have now learned how to automate management operations on Redshift Serverless namespaces and workgroups using AWS CloudFormation and the AWS CLI. To automate creation and management of Amazon Redshift provisioned clusters, refer to Automate Amazon Redshift Cluster management operations using AWS CloudFormation.


About the Authors

Ranjan Burman is a Analytics Specialist Solutions Architect at AWS. He specializes in Amazon Redshift and helps customers build scalable analytical solutions. He has more than 15 years of experience in different database and data warehousing technologies. He is passionate about automating and solving customer problems with the use of cloud solutions.

Satesh Sonti is a Sr. Analytics Specialist Solutions Architect based out of Atlanta, specialized in building enterprise data platforms, data warehousing, and analytics solutions. He has over 16 years of experience in building data assets and leading complex data platform programs for banking and insurance clients across the globe.

Urvish Shah is a Senior Database Engineer at Amazon Redshift. He has more than a decade of experience working on databases, data warehousing and in analytics space. Outside of work, he enjoys cooking, travelling and spending time with his daughter.

Ingest VPC flow logs into Splunk using Amazon Kinesis Data Firehose

Post Syndicated from Ranjit Kalidasan original https://aws.amazon.com/blogs/big-data/ingest-vpc-flow-logs-into-splunk-using-amazon-kinesis-data-firehose/

In September 2017, during the annual Splunk.conf, Splunk and AWS jointly announced Amazon Kinesis Data Firehose integration to support Splunk Enterprise and Splunk Cloud as a delivery destination. This native integration between Splunk Enterprise, Splunk Cloud, and Kinesis Data Firehose is designed to make AWS data ingestion setup seamless, while offering a secure and fault-tolerant delivery mechanism. We want to enable you to monitor and analyze machine data from any source and use it to deliver operational intelligence and optimize IT, security, and business performance.

With Kinesis Data Firehose, you can use a fully managed, reliable, and scalable data streaming solution to Splunk. In September 2022, AWS announced a new Amazon Virtual Private Cloud (Amazon VPC) feature that enables you to create VPC flow logs to send the flow log data directly into Kinesis Data Firehose as a destination. Previously, you could send VPC flow logs to either Amazon CloudWatch Logs or Amazon Simple Storage Service (Amazon S3) before it was ingested by other AWS or Partner tools. In this post, we show you how to use this feature to set up VPC flow logs for ingesting into Splunk using Kinesis Data Firehose.

Overview of solution

We deploy the following architecture to ingest data into Splunk.

We create a VPC flow log in an existing VPC to send the flow log data to a Kinesis Data Firehose delivery stream. This delivery stream has an AWS Lambda function enabled for data transformation and has destination settings to point to the Splunk endpoint along with an HTTP Event Collector (HEC) token.

Prerequisites

Before you begin, ensure that you have the following prerequisites:

  • AWS account – If you don’t have an AWS account, you can create one. For more information, see Setting Up for Amazon Kinesis Data Firehose.
  • Splunk AWS Add-on – Ensure you install the Splunk AWS Add-on app from Splunkbase in your Splunk deployment. This app provides the required source types and event types mapping to AWS machine data.
  • HEC token – In your Splunk deployment, set up an HEC token with the source type aws:cloudwatchlogs:vpcflow.

Create the transformation Lambda function

Integrating VPC flow logs with Kinesis Data Firehose requires a Lambda function to transform the flow log records. The data that VPC flow logs sends to the delivery stream is encoded as JSON records. However, Splunk expects this as raw flow log data. Therefore, when you create the delivery stream, you enable data transformation and configure a Lambda function to transform the flow log data to raw format. Kinesis Data Firehose then sends the data in raw format to Splunk.

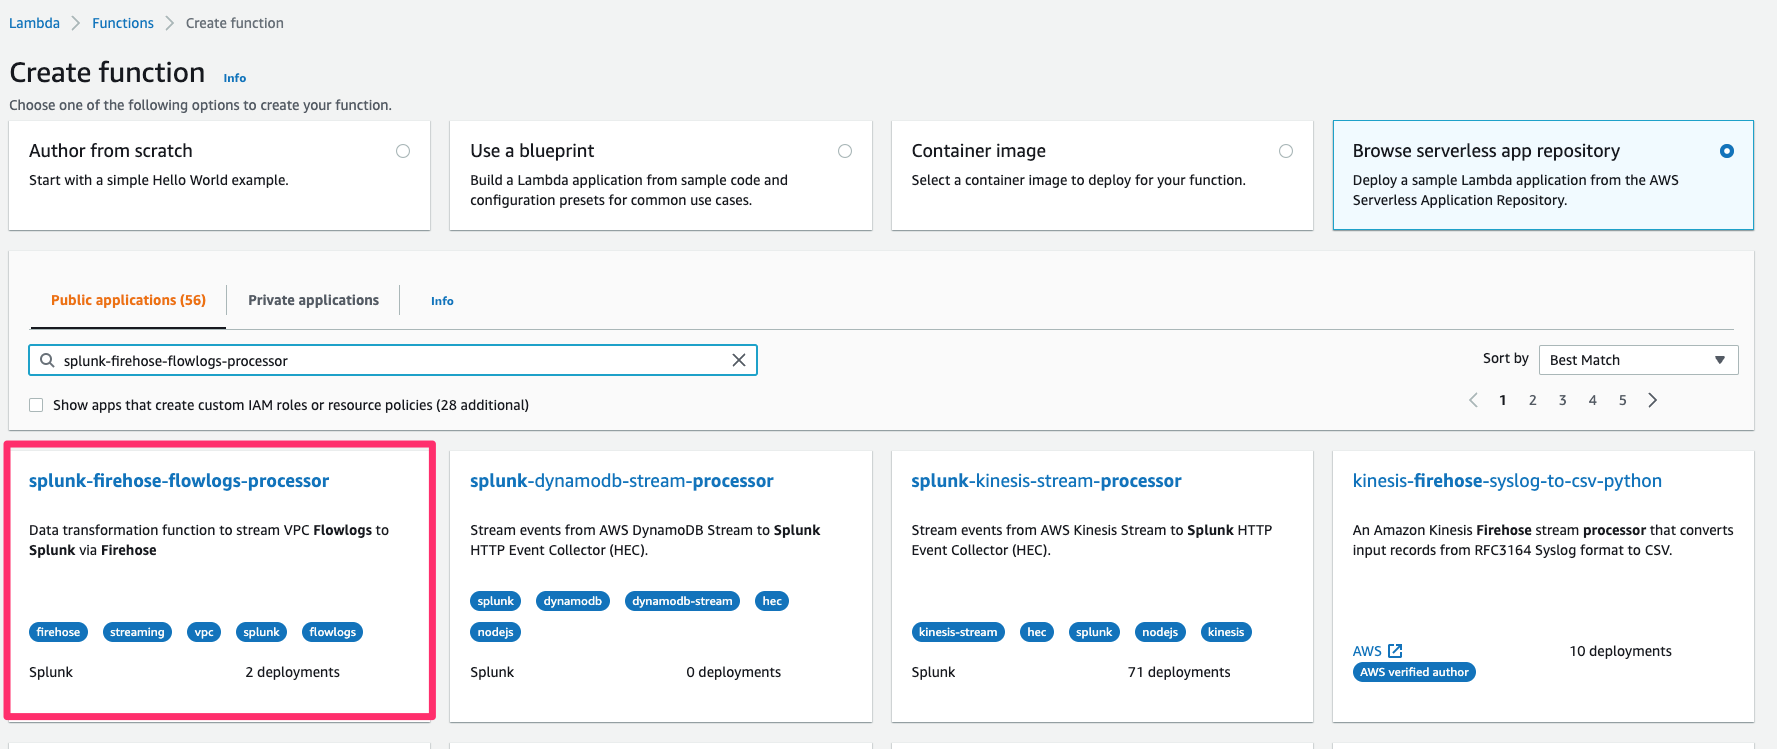
You can deploy this transformation Lambda function as a serverless application from the Lambda serverless app repository on the Lambda console. The name of this application is splunk-firehose-flowlogs-processor.

After it’s deployed, you can see a Lambda function and an AWS Identity and Access Management (IAM) role getting deployed on the console. Note the physical ID of the Lambda function; you use this when you create the Firehose delivery stream in the next step.

Create a Kinesis Data Firehose delivery stream

In this step, you create a Kinesis Data Firehose delivery stream to receive the VPC flow log data and deliver that data to Splunk.

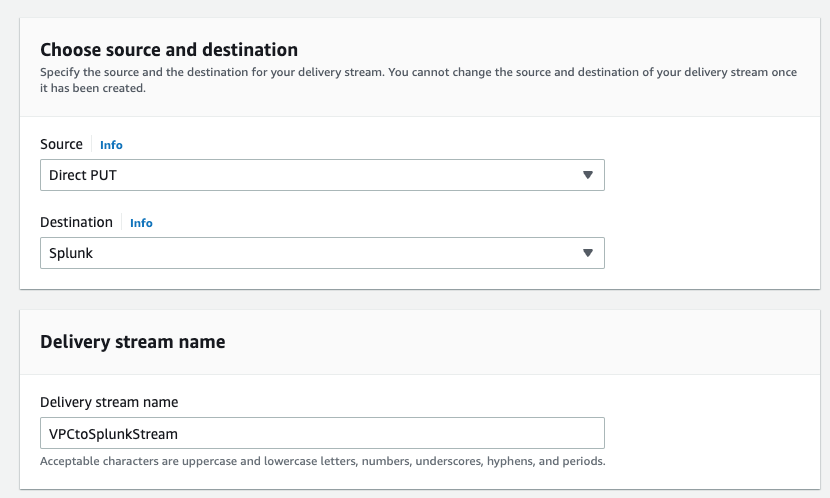
  1. On the Kinesis Data Firehose console, create a new delivery stream.
  2. For Source, choose Direct PUT.
  3. For Destination, choose Splunk.
  4. For Delivery stream name, enter a name (for example, VPCtoSplunkStream).
  5. In the Transform records section, for Data transformation, select Enabled.
  6. For AWS Lambda function, choose Browse.
  7. Select the function you created earlier by looking for the physical ID.
  8. Choose Choose.
  9. In the Destination settings section, for Splunk cluster endpoint, enter your endpoint.If you’re using a Splunk Cloud endpoint, refer to Configure Amazon Kinesis Firehose to send data to the Splunk platform for different Splunk cluster endpoint values.
  10. For Splunk endpoint type, select Raw endpoint.
  11. For Authentication token, enter the value of your Splunk HEC that you created as a prerequisite.
  12. In the Backup settings section, for Source record backup in Amazon S3, select Failed events only so you only save the data that fails to be ingested into Splunk.
  13. For S3 backup bucket, enter the path to an S3 bucket.
  14. Complete creating your delivery stream.

The creation process may take a few minutes to complete.

Create a VPC flow log

In this final step, you create a VPC flow log with Kinesis Data Firehose as destination type.

  1. On the Amazon VPC console, choose Your VPCs.
  2. Select the VPC for which to create the flow log.
  3. On the Actions menu, choose Create flow log.
  4. Provide the required settings for Filter:
    1. If you want to filter the flow logs, select Accept traffic or Reject traffic.
    2. Select All if you need all the information sent to Splunk.
  5. For Maximum aggregation interval, select a suitable interval for your use case.Select the minimum setting of 1 minute interval if you need the flow log data to be available for near-real-time analysis in Splunk.
  6. For Destination, select Send to Kinesis Firehose in the same account if the delivery stream is set up on the same account where you create the VPC flow logs.If you want to send the data to a different account, refer to Publish flow logs to Kinesis Data Firehose.
  7. For Log record format, if you leave it at AWS default format, the flow logs are sent as version 2 format. Alternatively, you can specify which fields you need to be captured and sent to Splunk.For more information on log format and available fields, refer to Flow log records.
  8. Review all the parameters and create the flow log.Within a few minutes, you should be able to see the data in Splunk.
  9. Open your Splunk console and navigate to the Search tab of the Search & Reporting app.
  10. Run the following SPL query to look at sample VPC flow log records:
    index=<index name> sourcetype="aws:cloudwatchlogs:vpcflow"

Clean up

To avoid incurring future charges, delete the resources you created in the following order:

  1. Delete the VPC flow log.
  2. Delete the Kinesis Data Firehose delivery stream.
  3. Delete the serverless application to delete the transformation Lambda function.
  4. If you created a new VPC and new resources in the VPC, then delete the resources and VPC.

Conclusion

You can use VPC flow log data in multiple Splunk solutions, like the Splunk App for AWS Security Dashboards for traffic analysis or Splunk Security Essentials, which uses the data to provide deeper insights into the security posture of your AWS environment. Using Kinesis Data Firehose to send VPC flow log data into Splunk provides many benefits. This managed service can automatically scale to meet the data demand and provide near-real-time data analysis. Try out this new quick and hassle-free way of sending your VPC flow logs to Splunk Enterprise or Splunk Cloud Platform using Kinesis Data Firehose.

You can deploy this solution today on your AWS account by following the Kinesis Data Firehose Immersion Day Lab for Splunk


About the authors

Ranjit Kalidasan is a Senior Solutions Architect with Amazon Web Services based in Boston, Massachusetts. He is Partner Solutions Architect helping security ISV partners to co-build and co-market solutions with AWS. He brings over 20 years of experience in Information technology helping global customers implement complex solutions for Security & Analytics. You can connect with Ranjit in Linkedin.

Introducing runtime roles for Amazon EMR steps: Use IAM roles and AWS Lake Formation for access control with Amazon EMR

Post Syndicated from Stefano Sandona original https://aws.amazon.com/blogs/big-data/introducing-runtime-roles-for-amazon-emr-steps-use-iam-roles-and-aws-lake-formation-for-access-control-with-amazon-emr/

You can use the Amazon EMR Steps API to submit Apache Hive, Apache Spark, and others types of applications to an EMR cluster. You can invoke the Steps API using Apache Airflow, AWS Steps Functions, the AWS Command Line Interface (AWS CLI), all the AWS SDKs, and the AWS Management Console. Jobs submitted with the Steps API use the Amazon Elastic Compute Cloud (Amazon EC2) instance profile to access AWS resources such as Amazon Simple Storage Service (Amazon S3) buckets, AWS Glue tables, and Amazon DynamoDB tables from the cluster.

Previously, if a step needed access to a specific S3 bucket and another step needed access to a specific DynamoDB table, the AWS Identity and Access Management (IAM) policy attached to the instance profile had to allow access to both the S3 bucket and the DynamoDB table. This meant that the IAM policies you assigned to the instance profile had to contain a union of all the permissions for every step that ran on an EMR cluster.

We’re happy to introduce runtime roles for EMR steps. A runtime role is an IAM role that you associate with an EMR step, and jobs use this role to access AWS resources. With runtime roles for EMR steps, you can now specify different IAM roles for the Spark and the Hive jobs, thereby scoping down access at a job level. This allows you to simplify access controls on a single EMR cluster that is shared between multiple tenants, wherein each tenant can be easily isolated using IAM roles.

The ability to specify an IAM role with a job is also available on Amazon EMR on EKS and Amazon EMR Serverless. You can also use AWS Lake Formation to apply table- and column-level permission for Apache Hive and Apache Spark jobs that are submitted with EMR steps. For more information, refer to Configure runtime roles for Amazon EMR steps.

In this post, we dive deeper into runtime roles for EMR steps, helping you understand how the various pieces work together, and how each step is isolated on an EMR cluster.

Solution overview

In this post, we walk through the following:

  1. Create an EMR cluster enabled to use the new role-based access control with EMR steps.
  2. Create two IAM roles with different permissions in terms of the Amazon S3 data and Lake Formation tables they can access.
  3. Allow the IAM principal submitting the EMR steps to use these two IAM roles.
  4. See how EMR steps running with the same code and trying to access the same data have different permissions based on the runtime role specified at submission time.
  5. See how to monitor and control actions using source identity propagation.

Set up EMR cluster security configuration

Amazon EMR security configurations simplify applying consistent security, authorization, and authentication options across your clusters. You can create a security configuration on the Amazon EMR console or via the AWS CLI or AWS SDK. When you attach a security configuration to a cluster, Amazon EMR applies the settings in the security configuration to the cluster. You can attach a security configuration to multiple clusters at creation time, but can’t apply them to a running cluster.

To enable runtime roles for EMR steps, we have to create a security configuration as shown in the following code and enable the runtime roles property (configured via EnableApplicationScopedIAMRole). In addition to the runtime roles, we’re enabling propagation of the source identity (configured via PropagateSourceIdentity) and support for Lake Formation (configured via LakeFormationConfiguration). The source identity is a mechanism to monitor and control actions taken with assumed roles. Enabling Propagate source identity allows you to audit actions performed using the runtime role. Lake Formation is an AWS service to securely manage a data lake, which includes defining and enforcing central access control policies for your data lake.

Create a file called step-runtime-roles-sec-cfg.json with the following content:

{
    "AuthorizationConfiguration": {
        "IAMConfiguration": {
            "EnableApplicationScopedIAMRole": true,
            "ApplicationScopedIAMRoleConfiguration": 
                {
                    "PropagateSourceIdentity": true
                }
        },
        "LakeFormationConfiguration": {
            "AuthorizedSessionTagValue": "Amazon EMR"
        }
    }
}

Create the Amazon EMR security configuration:

aws emr create-security-configuration \
--name 'iamconfig-with-iam-lf' \
--security-configuration file://step-runtime-roles-sec-cfg.json

You can also do the same via the Amazon console:

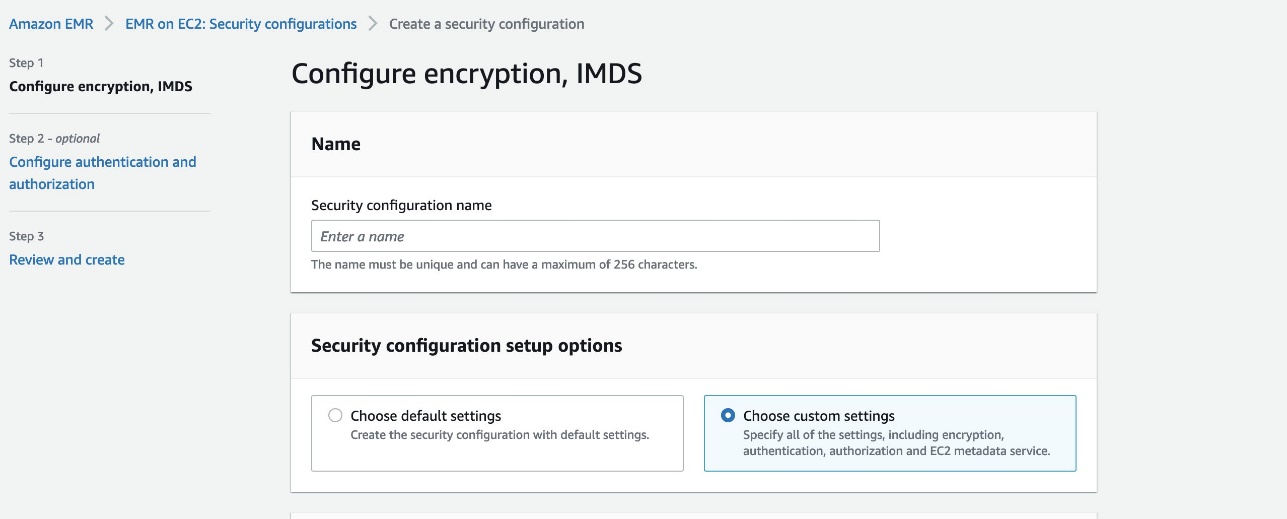
  1. On the Amazon EMR console, choose Security configurations in the navigation pane.
  2. Choose Create.
  3. Choose Create.
  4. For Security configuration name, enter a name.
  5. For Security configuration setup options, select Choose custom settings.
  6. For IAM role for applications, select Runtime role.
  7. Select Propagate source identity to audit actions performed using the runtime role.
  8. For Fine-grained access control, select AWS Lake Formation.
  9. Complete the security configuration.

The security configuration appears in your security configuration list. You can also see that the authorization mechanism listed here is the runtime role instead of the instance profile.

Launch the cluster

Now we launch an EMR cluster and specify the security configuration we created. For more information, refer to Specify a security configuration for a cluster.

The following code provides the AWS CLI command for launching an EMR cluster with the appropriate security configuration. Note that this cluster is launched on the default VPC and public subnet with the default IAM roles. In addition, the cluster is launched with one primary and one core instance of the specified instance type. For more details on how to customize the launch parameters, refer to create-cluster.

If the default EMR roles EMR_EC2_DefaultRole and EMR_DefaultRole don’t exist in IAM in your account (this is the first time you’re launching an EMR cluster with those), before launching the cluster, use the following command to create them:

aws emr create-default-roles

Create the cluster with the following code:

#Change with your Key Pair
KEYPAIR=<MY_KEYPAIR>
INSTANCE_TYPE="r4.4xlarge"
#Change with your Security Configuration Name
SECURITY_CONFIG="iamconfig-with-iam-lf"
#Change with your S3 log URI
LOG_URI="s3://mybucket/logs/"

aws emr create-cluster \
--name "iam-passthrough-cluster" \
--release-label emr-6.7.0 \
--use-default-roles \
--security-configuration $SECURITY_CONFIG \
--ec2-attributes KeyName=$KEYPAIR \
--instance-groups InstanceGroupType=MASTER,InstanceCount=1,InstanceType=$INSTANCE_TYPE  InstanceGroupType=CORE,InstanceCount=1,InstanceType=$INSTANCE_TYPE \
--applications Name=Spark Name=Hadoop Name=Hive \
--log-uri $LOG_URI

When the cluster is fully provisioned (Waiting state), let’s try to run a step on it with runtime roles for EMR steps enabled:

#Change with your EMR cluster ID
CLUSTER_ID=j-XXXXXXXXXXXXX
aws emr add-steps \
--cluster-id $CLUSTER_ID \
--steps '[{
            "Type": "CUSTOM_JAR",
            "ActionOnFailure": "CONTINUE",
            "Jar": "command-runner.jar",
            "Name": "Spark Example",
            "Args": [
              "spark-submit",
              "--class",
              "org.apache.spark.examples.SparkPi",
              "/usr/lib/spark/examples/jars/spark-examples.jar",
              "5"
            ]
        }]'

After launching the command, we receive the following as output:

An error occurred (ValidationException) when calling the AddJobFlowSteps operation: Runtime roles are required for this cluster. Please specify the role using the ExecutionRoleArn parameter.

The step failed, asking us to provide a runtime role. In the next section, we set up two IAM roles with different permissions and use them as the runtime roles for EMR steps.

Set up IAM roles as runtime roles

Any IAM role that you want to use as a runtime role for EMR steps must have a trust policy that allows the EMR cluster’s EC2 instance profile to assume it. In our setup, we’re using the default IAM role EMR_EC2_DefaultRole as the instance profile role. In addition, we create two IAM roles called test-emr-demo1 and test-emr-demo2 that we use as runtime roles for EMR steps.

The following code is the trust policy for both of the IAM roles, which lets the EMR cluster’s EC2 instance profile role, EMR_EC2_DefaultRole, assume these roles and set the source identity and LakeFormationAuthorizedCaller tag on the role sessions. The TagSession permission is needed so that Amazon EMR can authorize to Lake Formation. The SetSourceIdentity statement is needed for the propagate source identity feature.

Create a file called trust-policy.json with the following content (replace 123456789012 with your AWS account ID):

{
    "Version": "2012-10-17",
    "Statement": [
        {
            "Effect": "Allow",
            "Principal": {
                "AWS": "arn:aws:iam::123456789012:role/EMR_EC2_DefaultRole"
            },
            "Action": "sts:AssumeRole"
        },
        {
            "Effect": "Allow",
            "Principal": {
                "AWS": "arn:aws:iam::123456789012:role/EMR_EC2_DefaultRole"
            },
            "Action": "sts:SetSourceIdentity"
        },
        {
            "Effect": "Allow",
            "Principal": {
                "AWS": "arn:aws:iam::123456789012:role/EMR_EC2_DefaultRole"
            },
            "Action": "sts:TagSession",
            "Condition": {
                "StringEquals": {
                    "aws:RequestTag/LakeFormationAuthorizedCaller": "Amazon EMR"
                }
            }
        }
    ]
}

Use that policy to create the two IAM roles, test-emr-demo1 and test-emr-demo2:

aws iam create-role \
--role-name test-emr-demo1 \
--assume-role-policy-document file://trust-policy.json

aws iam create-role \
--role-name test-emr-demo2 \
--assume-role-policy-document file://trust-policy.json

Set up permissions for the principal submitting the EMR steps with runtime roles

The IAM principal submitting the EMR steps needs to have permissions to invoke the AddJobFlowSteps API. In addition, you can use the Condition key elasticmapreduce:ExecutionRoleArn to control access to specific IAM roles. For example, the following policy allows the IAM principal to only use IAM roles test-emr-demo1 and test-emr-demo2 as the runtime roles for EMR steps.

  1. Create the job-submitter-policy.json file with the following content (replace 123456789012 with your AWS account ID):
    {
        "Version": "2012-10-17",
        "Statement": [
            {
                "Sid": "AddStepsWithSpecificExecRoleArn",
                "Effect": "Allow",
                "Action": [
                    "elasticmapreduce:AddJobFlowSteps"
                ],
                "Resource": "*",
                "Condition": {
                    "StringEquals": {
                        "elasticmapreduce:ExecutionRoleArn": [
                            "arn:aws:iam::123456789012:role/test-emr-demo1",
                            "arn:aws:iam::123456789012:role/test-emr-demo2"
                        ]
                    }
                }
            },
            {
                "Sid": "EMRDescribeCluster",
                "Effect": "Allow",
                "Action": [
                    "elasticmapreduce:DescribeCluster"
                ],
                "Resource": "*"
            }
        ]
    }

  2. Create the IAM policy with the following code:
    aws iam create-policy \
    --policy-name emr-runtime-roles-submitter-policy \
    --policy-document file://job-submitter-policy.json

  3. Assign this policy to the IAM principal (IAM user or IAM role) you’re going to use to submit the EMR steps (replace 123456789012 with your AWS account ID and replace john with the IAM user you use to submit your EMR steps):
    aws iam attach-user-policy \
    --user-name john \
    --policy-arn "arn:aws:iam::123456789012:policy/emr-runtime-roles-submitter-policy"

IAM user john can now submit steps using arn:aws:iam::123456789012:role/test-emr-demo1 and arn:aws:iam::123456789012:role/test-emr-demo2 as the step runtime roles.

Use runtime roles with EMR steps

We now prepare our setup to show runtime roles for EMR steps in action.

Set up Amazon S3

To prepare your Amazon S3 data, complete the following steps:

  1. Create a CSV file called test.csv with the following content:
    1,a,1a
    2,b,2b

  2. Upload the file to Amazon S3 in three different locations:
    #Change this with your bucket name
    BUCKET_NAME="emr-steps-roles-new-us-east-1"
    
    aws s3 cp test.csv s3://${BUCKET_NAME}/demo1/
    aws s3 cp test.csv s3://${BUCKET_NAME}/demo2/
    aws s3 cp test.csv s3://${BUCKET_NAME}/nondemo/

    For our initial test, we use a PySpark application called test.py with the following contents:

    from pyspark.sql import SparkSession
    spark = SparkSession.builder.appName("my app").enableHiveSupport().getOrCreate()
    
    #Change this with your bucket name
    BUCKET_NAME="emr-steps-roles-new-us-east-1"
    
    try:
      spark.read.csv("s3://" + BUCKET_NAME + "/demo1/test.csv").show()
      print("Accessed demo1")
    except:
      print("Could not access demo1")
    
    try:
      spark.read.csv("s3://" + BUCKET_NAME + "/demo2/test.csv").show()
      print("Accessed demo2")
    except:
      print("Could not access demo2")
    
    try:
      spark.read.csv("s3://" + BUCKET_NAME + "/nondemo/test.csv").show()
      print("Accessed nondemo")
    except:
      print("Could not access nondemo")
    spark.stop()

    In the script, we’re trying to access the CSV file present under three different prefixes in the test bucket.

  3. Upload the Spark application inside the same S3 bucket where we placed the test.csv file but in a different location:
    #Change this with your bucket name
    BUCKET_NAME="emr-steps-roles-new-us-east-1"
    aws s3 cp test.py s3://${BUCKET_NAME}/scripts/

Set up runtime role permissions

To show how runtime roles for EMR steps works, we assign to the roles we created different IAM permissions to access Amazon S3. The following table summarizes the grants we provide to each role (emr-steps-roles-new-us-east-1 is the bucket you configured in the previous section).

S3 locations \ IAM Roles test-emr-demo1 test-emr-demo2
s3://emr-steps-roles-new-us-east-1/* No Access No Access
s3://emr-steps-roles-new-us-east-1/demo1/* Full Access No Access
s3://emr-steps-roles-new-us-east-1/demo2/* No Access Full Access
s3://emr-steps-roles-new-us-east-1/scripts/* Read Access Read Access
  1. Create the file demo1-policy.json with the following content (substitute emr-steps-roles-new-us-east-1 with your bucket name):
    {
        "Version": "2012-10-17",
        "Statement": [
            {
                "Effect": "Allow",
                "Action": [
                    "s3:*"
                ],
                "Resource": [
                    "arn:aws:s3:::emr-steps-roles-new-us-east-1/demo1",
                    "arn:aws:s3:::emr-steps-roles-new-us-east-1/demo1/*"
                ]                    
            },
            {
                "Effect": "Allow",
                "Action": [
                    "s3:Get*"
                ],
                "Resource": [
                    "arn:aws:s3:::emr-steps-roles-new-us-east-1/scripts",
                    "arn:aws:s3:::emr-steps-roles-new-us-east-1/scripts/*"
                ]                    
            }
        ]
    }

  2. Create the file demo2-policy.json with the following content (substitute emr-steps-roles-new-us-east-1 with your bucket name):
    {
        "Version": "2012-10-17",
        "Statement": [
            {
                "Effect": "Allow",
                "Action": [
                    "s3:*"
                ],
                "Resource": [
                    "arn:aws:s3:::emr-steps-roles-new-us-east-1/demo2",
                    "arn:aws:s3:::emr-steps-roles-new-us-east-1/demo2/*"
                ]                    
            },
            {
                "Effect": "Allow",
                "Action": [
                    "s3:Get*"
                ],
                "Resource": [
                    "arn:aws:s3:::emr-steps-roles-new-us-east-1/scripts",
                    "arn:aws:s3:::emr-steps-roles-new-us-east-1/scripts/*"
                ]                    
            }
        ]
    }

  3. Create our IAM policies:
    aws iam create-policy \
    --policy-name test-emr-demo1-policy \
    --policy-document file://demo1-policy.json
    
    aws iam create-policy \
    --policy-name test-emr-demo2-policy \
    --policy-document file://demo2-policy.json

  4. Assign to each role the related policy (replace 123456789012 with your AWS account ID):
    aws iam attach-role-policy \
    --role-name test-emr-demo1 \
    --policy-arn "arn:aws:iam::123456789012:policy/test-emr-demo1-policy"
    
    aws iam attach-role-policy \
    --role-name test-emr-demo2 \
    --policy-arn "arn:aws:iam::123456789012:policy/test-emr-demo2-policy"

    To use runtime roles with Amazon EMR steps, we need to add the following policy to our EMR cluster’s EC2 instance profile (in this example EMR_EC2_DefaultRole). With this policy, the underlying EC2 instances for the EMR cluster can assume the runtime role and apply a tag to that runtime role.

  5. Create the file runtime-roles-policy.json with the following content (replace 123456789012 with your AWS account ID):
    {
        "Version": "2012-10-17",
        "Statement": [{
                "Sid": "AllowRuntimeRoleUsage",
                "Effect": "Allow",
                "Action": [
                    "sts:AssumeRole",
                    "sts:TagSession",
                    "sts:SetSourceIdentity"
                ],
                "Resource": [
                    "arn:aws:iam::123456789012:role/test-emr-demo1",
                    "arn:aws:iam::123456789012:role/test-emr-demo2"
                ]
            }
        ]
    }

  6. Create the IAM policy:
    aws iam create-policy \
    --policy-name emr-runtime-roles-policy \
    --policy-document file://runtime-roles-policy.json

  7. Assign the created policy to the EMR cluster’s EC2 instance profile, in this example EMR_EC2_DefaultRole:
    aws iam attach-role-policy \
    --role-name EMR_EC2_DefaultRole \
    --policy-arn "arn:aws:iam::123456789012:policy/emr-runtime-roles-policy"

Test permissions with runtime roles

We’re now ready to perform our first test. We run the test.py script, previously uploaded to Amazon S3, two times as Spark steps: first using the test-emr-demo1 role and then using the test-emr-demo2 role as the runtime roles.

To run an EMR step specifying a runtime role, you need the latest version of the AWS CLI. For more details about updating the AWS CLI, refer to Installing or updating the latest version of the AWS CLI.

Let’s submit a step specifying test-emr-demo1 as the runtime role:

#Change with your EMR cluster ID
CLUSTER_ID=j-XXXXXXXXXXXXX
#Change with your AWS Account ID
ACCOUNT_ID=123456789012
#Change with your Bucket name
BUCKET_NAME=emr-steps-roles-new-us-east-1

aws emr add-steps \
--cluster-id $CLUSTER_ID \
--steps '[{
            "Type": "CUSTOM_JAR",
            "ActionOnFailure": "CONTINUE",
            "Jar": "command-runner.jar",
            "Name": "Spark Example",
            "Args": [
              "spark-submit",
              "s3://'"${BUCKET_NAME}"'/scripts/test.py"
            ]
        }]' \
--execution-role-arn arn:aws:iam::${ACCOUNT_ID}:role/test-emr-demo1

This command returns an EMR step ID. To check our step output logs, we can proceed two different ways:

  • From the Amazon EMR console – On the Steps tab, choose the View logs link related to the specific step ID and select stdout.
  • From Amazon S3 – While launching our cluster, we configured an S3 location for logging. We can find our step logs under $(LOG_URI)/steps/<stepID>/stdout.gz.

The logs could take a couple of minutes to populate after the step is marked as Completed.

The following is the output of the EMR step with test-emr-demo1 as the runtime role:

+---+---+---+
|_c0|_c1|_c2|
+---+---+---+
|  1|  a| 1a|
|  2|  b| 2b|
+---+---+---+

Accessed demo1
Could not access demo2
Could not access nondemo

As we can see, only the demo1 folder was accessible by our application.

Diving deeper into the step stderr logs, we can see that the related YARN application application_1656350436159_0017 was launched with the user 6GC64F33KUW4Q2JY6LKR7UAHWETKKXYL. We can confirm this by connecting to the EMR primary instance using SSH and using the YARN CLI:

[hadoop@ip-172-31-63-203]$ yarn application -status application_1656350436159_0017
...
Application-Id : application_1656350436159_0017
Application-Name : my app
Application-Type : SPARK
User : 6GC64F33KUW4Q2JY6LKR7UAHWETKKXYL
Queue : default
Application Priority : 0
...

Please note that in your case, the YARN application ID and the user will be different.

Now we submit the same script again as a new EMR step, but this time with the role test-emr-demo2 as the runtime role:

#Change with your EMR cluster ID
CLUSTER_ID=j-XXXXXXXXXXXXX
#Change with your AWS Account ID
ACCOUNT_ID=123456789012
#Change with your Bucket name
BUCKET_NAME=emr-steps-roles-new-us-east-1

aws emr add-steps \
--cluster-id $CLUSTER_ID \
--steps '[{
            "Type": "CUSTOM_JAR",
            "ActionOnFailure": "CONTINUE",
            "Jar": "command-runner.jar",
            "Name": "Spark Example",
            "Args": [
              "spark-submit",
              "s3://'"${BUCKET_NAME}"'/scripts/test.py"
            ]
        }]' \
--execution-role-arn arn:aws:iam::${ACCOUNT_ID}:role/test-emr-demo2

The following is the output of the EMR step with test-emr-demo2 as the runtime role:

Could not access demo1
+---+---+---+
|_c0|_c1|_c2|
+---+---+---+
|  1|  a| 1a|
|  2|  b| 2b|
+---+---+---+

Accessed demo2
Could not access nondemo

As we can see, only the demo2 folder was accessible by our application.

Diving deeper into the step stderr logs, we can see that the related YARN application application_1656350436159_0018 was launched with a different user 7T2ORHE6Z4Q7PHLN725C2CVWILZWYOLE. We can confirm this by using the YARN CLI:

[hadoop@ip-172-31-63-203]$ yarn application -status application_1656350436159_0018
...
Application-Id : application_1656350436159_0018
Application-Name : my app
Application-Type : SPARK
User : 7T2ORHE6Z4Q7PHLN725C2CVWILZWYOLE
Queue : default
Application Priority : 0
...

Each step was able to only access the CSV file that was allowed by the runtime role, so the first step was able to only access s3://emr-steps-roles-new-us-east-1/demo1/test.csv and the second step was only able to access s3://emr-steps-roles-new-us-east-1/demo2/test.csv. In addition, we observed that Amazon EMR created a unique user for the steps, and used the user to run the jobs. Please note that both roles need at least read access to the S3 location where the step scripts are located (for example, s3://emr-steps-roles-demo-bucket/scripts/test.py).

Now that we have seen how runtime roles for EMR steps work, let’s look at how we can use Lake Formation to apply fine-grained access controls with EMR steps.

Use Lake Formation-based access control with EMR steps

You can use Lake Formation to apply table- and column-level permissions with Apache Spark and Apache Hive jobs submitted as EMR steps. First, the data lake admin in Lake Formation needs to register Amazon EMR as the AuthorizedSessionTagValue to enforce Lake Formation permissions on EMR. Lake Formation uses this session tag to authorize callers and provide access to the data lake. The Amazon EMR value is referenced inside the step-runtime-roles-sec-cfg.json file we used earlier when we created the EMR security configuration, and inside the trust-policy.json file we used to create the two runtime roles test-emr-demo1 and test-emr-demo2.

We can do so on the Lake Formation console in the External data filtering section (replace 123456789012 with your AWS account ID).

On the IAM runtime roles’ trust policy, we already have the sts:TagSession permission with the condition “aws:RequestTag/LakeFormationAuthorizedCaller": "Amazon EMR". So we’re ready to proceed.

To demonstrate how Lake Formation works with EMR steps, we create one database named entities with two tables named users and products, and we assign in Lake Formation the grants summarized in the following table.

IAM Roles \ Tables entities
(DB)
users
(Table)
products
(Table)
test-emr-demo1 Full Read Access No Access
test-emr-demo2 Read Access on Columns: uid, state Full Read Access

Prepare Amazon S3 files

We first prepare our Amazon S3 files.

  1. Create the users.csv file with the following content:
    00005678,john,pike,england,london,Hidden Road 78
    00009039,paolo,rossi,italy,milan,Via degli Alberi 56A
    00009057,july,finn,germany,berlin,Green Road 90

  2. Create the products.csv file with the following content:
    P0000789,Bike2000,Sport
    P0000567,CoverToCover,Smartphone
    P0005677,Whiteboard X786,Home

  3. Upload these files to Amazon S3 in two different locations:
    #Change this with your bucket name
    BUCKET_NAME="emr-steps-roles-new-us-east-1"
    
    aws s3 cp users.csv s3://${BUCKET_NAME}/entities-database/users/
    aws s3 cp products.csv s3://${BUCKET_NAME}/entities-database/products/

Prepare the database and tables

We can create our entities database by using the AWS Glue APIs.

  1. Create the entities-db.json file with the following content (substitute emr-steps-roles-new-us-east-1 with your bucket name):
    {
        "DatabaseInput": {
            "Name": "entities",
            "LocationUri": "s3://emr-steps-roles-new-us-east-1/entities-database/",
            "CreateTableDefaultPermissions": []
        }
    }

  2. With a Lake Formation admin user, run the following command to create our database:
    aws glue create-database \
    --cli-input-json file://entities-db.json

    We also use the AWS Glue APIs to create the tables users and products.

  3. Create the users-table.json file with the following content (substitute emr-steps-roles-new-us-east-1 with your bucket name):
    {
        "TableInput": {
            "Name": "users",
            "StorageDescriptor": {
                "Columns": [{
                        "Name": "uid",
                        "Type": "string"
                    },
                    {
                        "Name": "name",
                        "Type": "string"
                    },
                    {
                        "Name": "surname",
                        "Type": "string"
                    },
                    {
                        "Name": "state",
                        "Type": "string"
                    },
                    {
                        "Name": "city",
                        "Type": "string"
                    },
                    {
                        "Name": "address",
                        "Type": "string"
                    }
                ],
                "Location": "s3://emr-steps-roles-new-us-east-1/entities-database/users/",
                "InputFormat": "org.apache.hadoop.mapred.TextInputFormat",
                "OutputFormat": "org.apache.hadoop.hive.ql.io.HiveIgnoreKeyTextOutputFormat",
                "Compressed": false,
                "SerdeInfo": {
                    "SerializationLibrary": "org.apache.hadoop.hive.serde2.lazy.LazySimpleSerDe",
                    "Parameters": {
                        "field.delim": ",",
                        "serialization.format": ","
                    }
                }
            },
            "TableType": "EXTERNAL_TABLE",
            "Parameters": {
                "EXTERNAL": "TRUE"
            }
        }
    }

  4. Create the products-table.json file with the following content (substitute emr-steps-roles-new-us-east-1 with your bucket name):
    {
        "TableInput": {
            "Name": "products",
            "StorageDescriptor": {
                "Columns": [{
                        "Name": "product_id",
                        "Type": "string"
                    },
                    {
                        "Name": "name",
                        "Type": "string"
                    },
                    {
                        "Name": "category",
                        "Type": "string"
                    }
                ],
                "Location": "s3://emr-steps-roles-new-us-east-1/entities-database/products/",
                "InputFormat": "org.apache.hadoop.mapred.TextInputFormat",
                "OutputFormat": "org.apache.hadoop.hive.ql.io.HiveIgnoreKeyTextOutputFormat",
                "Compressed": false,
                "SerdeInfo": {
                    "SerializationLibrary": "org.apache.hadoop.hive.serde2.lazy.LazySimpleSerDe",
                    "Parameters": {
                        "field.delim": ",",
                        "serialization.format": ","
                    }
                }
            },
            "TableType": "EXTERNAL_TABLE",
            "Parameters": {
                "EXTERNAL": "TRUE"
            }
        }
    }

  5. With a Lake Formation admin user, create our tables with the following commands:
    aws glue create-table \
        --database-name entities \
        --cli-input-json file://users-table.json
        
    aws glue create-table \
        --database-name entities \
        --cli-input-json file://products-table.json

Set up the Lake Formation data lake locations

To access our tables data in Amazon S3, Lake Formation needs read/write access to them. To achieve that, we have to register Amazon S3 locations where our data resides and specify for them which IAM role to obtain credentials from.

Let’s create our IAM role for the data access.

  1. Create a file called trust-policy-data-access-role.json with the following content:
    {
        "Version": "2012-10-17",
        "Statement": [
            {
                "Sid": "",
                "Effect": "Allow",
                "Principal": {
                    "Service": "lakeformation.amazonaws.com"
                },
                "Action": "sts:AssumeRole"
            }
        ]
    }

  2. Use the policy to create the IAM role emr-demo-lf-data-access-role:
    aws iam create-role \
    --role-name emr-demo-lf-data-access-role \
    --assume-role-policy-document file://trust-policy-data-access-role.json

  3. Create the file data-access-role-policy.json with the following content (substitute emr-steps-roles-new-us-east-1 with your bucket name):
    {
        "Version": "2012-10-17",
        "Statement": [
            {
                "Effect": "Allow",
                "Action": [
                    "s3:*"
                ],
                "Resource": [
                    "arn:aws:s3:::emr-steps-roles-new-us-east-1/entities-database",
                    "arn:aws:s3:::emr-steps-roles-new-us-east-1/entities-database/*"
                ]
            },
            {
                "Effect": "Allow",
                "Action": [
                    "s3:ListBucket"
                ],
                "Resource": [
                    "arn:aws:s3:::emr-steps-roles-new-us-east-1"
                ]
            }
        ]
    }

  4. Create our IAM policy:
    aws iam create-policy \
    --policy-name data-access-role-policy \
    --policy-document file://data-access-role-policy.json

  5. Assign to our emr-demo-lf-data-access-role the created policy (replace 123456789012 with your AWS account ID):
    aws iam attach-role-policy \
    --role-name emr-demo-lf-data-access-role \
    --policy-arn "arn:aws:iam::123456789012:policy/data-access-role-policy"

    We can now register our data location in Lake Formation.

  6. On the Lake Formation console, choose Data lake locations in the navigation pane.
  7. Here we can register our S3 location containing data for our two tables and choose the created emr-demo-lf-data-access-role IAM role, which has read/write access to that location.

For more details about adding an Amazon S3 location to your data lake and configuring your IAM data access roles, refer to Adding an Amazon S3 location to your data lake.

Enforce Lake Formation permissions

To be sure we’re using Lake Formation permissions, we should confirm that we don’t have any grants set up for the principal IAMAllowedPrincipals. The IAMAllowedPrincipals group includes any IAM users and roles that are allowed access to your Data Catalog resources by your IAM policies, and it’s used to maintain backward compatibility with AWS Glue.

To confirm Lake Formations permissions are enforced, navigate to the Lake Formation console and choose Data lake permissions in the navigation pane. Filter permissions by “Database”:“entities” and remove all the permissions given to the principal IAMAllowedPrincipals.

For more details on IAMAllowedPrincipals and backward compatibility with AWS Glue, refer to Changing the default security settings for your data lake.

Configure AWS Glue and Lake Formation grants for IAM runtime roles

To allow our IAM runtime roles to properly interact with Lake Formation, we should provide them the lakeformation:GetDataAccess and glue:Get* grants.

Lake Formation permissions control access to Data Catalog resources, Amazon S3 locations, and the underlying data at those locations. IAM permissions control access to the Lake Formation and AWS Glue APIs and resources. Therefore, although you might have the Lake Formation permission to access a table in the Data Catalog (SELECT), your operation fails if you don’t have the IAM permission on the glue:Get* API.

For more details about Lake Formation access control, refer to Lake Formation access control overview.

  1. Create the emr-runtime-roles-lake-formation-policy.json file with the following content:
    {
        "Version": "2012-10-17",
        "Statement": {
            "Sid": "LakeFormationManagedAccess",
            "Effect": "Allow",
            "Action": [
                "lakeformation:GetDataAccess",
                "glue:Get*",
                "glue:Create*",
                "glue:Update*"
            ],
            "Resource": "*"
        }
    }

  2. Create the related IAM policy:
    aws iam create-policy \
    --policy-name emr-runtime-roles-lake-formation-policy \
    --policy-document file://emr-runtime-roles-lake-formation-policy.json

  3. Assign this policy to both IAM runtime roles (replace 123456789012 with your AWS account ID):
    aws iam attach-role-policy \
    --role-name test-emr-demo1 \
    --policy-arn "arn:aws:iam::123456789012:policy/emr-runtime-roles-lake-formation-policy"
    
    aws iam attach-role-policy \
    --role-name test-emr-demo2 \
    --policy-arn "arn:aws:iam::123456789012:policy/emr-runtime-roles-lake-formation-policy"

Set up Lake Formation permissions

We now set up the permission in Lake Formation for the two runtime roles.

  1. Create the file users-grants-test-emr-demo1.json with the following content to grant SELECT access to all columns in the entities.users table to test-emr-demo1:
    {
        "Principal": {
            "DataLakePrincipalIdentifier": "arn:aws:iam::123456789012:role/test-emr-demo1"
        },
        "Resource": {
            "Table": {
                "DatabaseName": "entities",
                "Name": "users"
            }
        },
        "Permissions": [
            "SELECT"
        ]
    }

  2. Create the file users-grants-test-emr-demo2.json with the following content to grant SELECT access to the uid and state columns in the entities.users table to test-emr-demo2:
    {
        "Principal": {
            "DataLakePrincipalIdentifier": "arn:aws:iam::123456789012:role/test-emr-demo2"
        },
        "Resource": {
            "TableWithColumns": {
                "DatabaseName": "entities",
                "Name": "users",
                "ColumnNames": ["uid", "state"]
            }
        },
        "Permissions": [
            "SELECT"
        ]
    }

  3. Create the file products-grants-test-emr-demo2.json with the following content to grant SELECT access to all columns in the entities.products table to test-emr-demo2:
    {
        "Principal": {
            "DataLakePrincipalIdentifier": "arn:aws:iam::123456789012:role/test-emr-demo2"
        },
        "Resource": {
            "Table": {
                "DatabaseName": "entities",
                "Name": "products"
            }
        },
        "Permissions": [
            "SELECT"
        ]
    }

  4. Let’s set up our permissions in Lake Formation:
    aws lakeformation grant-permissions \
    --cli-input-json file://users-grants-test-emr-demo1.json
    
    aws lakeformation grant-permissions \
    --cli-input-json file://users-grants-test-emr-demo2.json
    
    aws lakeformation grant-permissions \
    --cli-input-json file://products-grants-test-emr-demo2.json

  5. Check the permissions we defined on the Lake Formation console on the Data lake permissions page by filtering by “Database”:“entities”.

Test Lake Formation permissions with runtime roles

For our test, we use a PySpark application called test-lake-formation.py with the following content:


from pyspark.sql import SparkSession
 
spark = SparkSession.builder.appName("Pyspark - TEST IAM RBAC with LF").enableHiveSupport().getOrCreate()

try:
    print("== select * from entities.users limit 3 ==\n")
    spark.sql("select * from entities.users limit 3").show()
except Exception as e:
    print(e)

try:
    print("== select * from entities.products limit 3 ==\n")
    spark.sql("select * from entities.products limit 3").show()
except Exception as e:
    print(e)

spark.stop()

In the script, we’re trying to access the tables users and products. Let’s upload our Spark application in the same S3 bucket that we used earlier:

#Change this with your bucket name
BUCKET_NAME="emr-steps-roles-new-us-east-1"

aws s3 cp test-lake-formation.py s3://${BUCKET_NAME}/scripts/

We’re now ready to perform our test. We run the test-lake-formation.py script first using the test-emr-demo1 role and then using the test-emr-demo2 role as the runtime roles.

Let’s submit a step specifying test-emr-demo1 as the runtime role:

#Change with your EMR cluster ID
CLUSTER_ID=j-XXXXXXXXXXXXX
#Change with your AWS Account ID
ACCOUNT_ID=123456789012
#Change with your Bucket name
BUCKET_NAME=emr-steps-roles-new-us-east-1

aws emr add-steps \
--cluster-id $CLUSTER_ID \
--steps '[{
            "Type": "CUSTOM_JAR",
            "ActionOnFailure": "CONTINUE",
            "Jar": "command-runner.jar",
            "Name": "Spark Lake Formation Example",
            "Args": [
              "spark-submit",
              "s3://'"${BUCKET_NAME}"'/scripts/test-lake-formation.py"
            ]
        }]' \
--execution-role-arn arn:aws:iam::${ACCOUNT_ID}:role/test-emr-demo1

The following is the output of the EMR step with test-emr-demo1 as the runtime role:

== select * from entities.users limit 3 ==

+--------+-----+-------+-------+------+--------------------+
|     uid| name|surname|  state|  city|             address|
+--------+-----+-------+-------+------+--------------------+
|00005678| john|   pike|england|london|      Hidden Road 78|
|00009039|paolo|  rossi|  italy| milan|Via degli Alberi 56A|
|00009057| july|   finn|germany|berlin|       Green Road 90|
+--------+-----+-------+-------+------+--------------------+

== select * from entities.products limit 3 ==

Insufficient Lake Formation permission(s) on products (...)

As we can see, our application was only able to access the users table.

Submit the same script again as a new EMR step, but this time with the role test-emr-demo2 as the runtime role:

#Change with your EMR cluster ID
CLUSTER_ID=j-XXXXXXXXXXXXX
#Change with your AWS Account ID
ACCOUNT_ID=123456789012
#Change with your Bucket name
BUCKET_NAME=emr-steps-roles-new-us-east-1

aws emr add-steps \
--cluster-id $CLUSTER_ID \
--steps '[{
            "Type": "CUSTOM_JAR",
            "ActionOnFailure": "CONTINUE",
            "Jar": "command-runner.jar",
            "Name": "Spark Lake Formation Example",
            "Args": [
              "spark-submit",
              "s3://'"${BUCKET_NAME}"'/scripts/test-lake-formation.py"
            ]
        }]' \
--execution-role-arn arn:aws:iam::${ACCOUNT_ID}:role/test-emr-demo2

The following is the output of the EMR step with test-emr-demo2 as the runtime role:

== select * from entities.users limit 3 ==

+--------+-------+
|     uid|  state|
+--------+-------+
|00005678|england|
|00009039|  italy|
|00009057|germany|
+--------+-------+

== select * from entities.products limit 3 ==

+----------+---------------+----------+
|product_id|           name|  category|
+----------+---------------+----------+
|  P0000789|       Bike2000|     Sport|
|  P0000567|   CoverToCover|Smartphone|
|  P0005677|Whiteboard X786|      Home|
+----------+---------------+----------+

As we can see, our application was able to access a subset of columns for the users table and all the columns for the products table.

We can conclude that the permissions while accessing the Data Catalog are being enforced based on the runtime role used with the EMR step.

Audit using the source identity

The source identity is a mechanism to monitor and control actions taken with assumed roles. The Propagate source identity feature similarly allows you to monitor and control actions taken using runtime roles by the jobs submitted with EMR steps.

We already configured EMR_EC2_defaultRole with "sts:SetSourceIdentity" on our two runtime roles. Also, both runtime roles let EMR_EC2_DefaultRole to SetSourceIdentity in their trust policy. So we’re ready to proceed.

We now see the Propagate source identity feature in action with a simple example.

Configure the IAM role that is assumed to submit the EMR steps

We configure the IAM role job-submitter-1, which is assumed specifying the source identity and which is used to submit the EMR steps. In this example, we allow the IAM user paul to assume this role and set the source identity. Please note you can use any IAM principal here.

  1. Create a file called trust-policy-2.json with the following content (replace 123456789012 with your AWS account ID):
    {
        "Version": "2012-10-17",
        "Statement": [
            {
                "Effect": "Allow",
                "Principal": {
                    "AWS": "arn:aws:iam::123456789012:user/paul"
                },
                "Action": "sts:AssumeRole"
            },
            {
                "Effect": "Allow",
                "Principal": {
                    "AWS": "arn:aws:iam::123456789012:user/paul"
                },
                "Action": "sts:SetSourceIdentity"
            }
        ]
    }

  2. Use it as the trust policy to create the IAM role job-submitter-1:
    aws iam create-role \
    --role-name job-submitter-1 \
    --assume-role-policy-document file://trust-policy-2.json

    We use now the same emr-runtime-roles-submitter-policy policy we defined before to allow the role to submit EMR steps using the test-emr-demo1 and test-emr-demo2 runtime roles.

  3. Assign this policy to the IAM role job-submitter-1 (replace 123456789012 with your AWS account ID):
    aws iam attach-role-policy \
    --role-name job-submitter-1 \
    --policy-arn "arn:aws:iam::123456789012:policy/emr-runtime-roles-submitter-policy"

Test the source identity with AWS CloudTrail

To show how propagation of source identity works with Amazon EMR, we generate a role session with the source identity test-ad-user.

With the IAM user paul (or with the IAM principal you configured), we first perform the impersonation (replace 123456789012 with your AWS account ID):

aws sts assume-role \
--role-arn arn:aws:iam::123456789012:role/job-submitter-1 \
--role-session-name demotest \
--source-identity test-ad-user

The following code is the output received:

{
"Credentials": {
    "SecretAccessKey": "<SECRET_ACCESS_KEY>",
    "SessionToken": "<SESSION_TOKEN>",
    "Expiration": "<EXPIRATION_TIME>",
    "AccessKeyId": "<ACCESS_KEY_ID>"
},
"AssumedRoleUser": {
    "AssumedRoleId": "AROAUVT2HQ3......:demotest",
    "Arn": "arn:aws:sts::123456789012:assumed-role/test-emr-role/demotest"
},
"SourceIdentity": "test-ad-user"
}

We use the temporary AWS security credentials of the role session, to submit an EMR step along with the runtime role test-emr-demo1:

export AWS_ACCESS_KEY_ID="<ACCESS_KEY_ID>"
export AWS_SECRET_ACCESS_KEY="<SECRET_ACCESS_KEY>"
export AWS_SESSION_TOKEN="<SESSION_TOKEN>" 

#Change with your EMR cluster ID
CLUSTER_ID=j-XXXXXXXXXXXXX
#Change with your AWS Account ID
ACCOUNT_ID=123456789012
#Change with your Bucket name
BUCKET_NAME=emr-steps-roles-new-us-east-1

aws emr add-steps \
--cluster-id $CLUSTER_ID \
--steps '[{
            "Type": "CUSTOM_JAR",
            "ActionOnFailure": "CONTINUE",
            "Jar": "command-runner.jar",
            "Name": "Spark Lake Formation Example",
            "Args": [
              "spark-submit",
              "s3://'"${BUCKET_NAME}"'/scripts/test-lake-formation.py"
            ]
        }]' \
--execution-role-arn arn:aws:iam::${ACCOUNT_ID}:role/test-emr-demo1

In a few minutes, we can see events appearing in the AWS CloudTrail log file. We can see all the AWS APIs that the jobs invoked using the runtime role. In the following snippet, we can see that the step performed the sts:AssumeRole and lakeformation:GetDataAccess actions. It’s worth noting how the source identity test-ad-user has been preserved in the events.

Clean up

You can now delete the EMR cluster you created.

  1. On the Amazon EMR console, choose Clusters in the navigation pane.
  2. Select the cluster iam-passthrough-cluster, then choose Terminate.
  3. Choose Terminate again to confirm.

Alternatively, you can delete the cluster by using the Amazon EMR CLI with the following command (replace the EMR cluster ID with the one returned by the previously run aws emr create-cluster command):

aws emr terminate-clusters --cluster-ids j-3KVXXXXXXX7UG

Conclusion

In this post, we discussed how you can control data access on Amazon EMR on EC2 clusters by using runtime roles with EMR steps. We discussed how the feature works, how you can use Lake Formation to apply fine-grained access controls, and how to monitor and control actions using a source identity. To learn more about this feature, refer to Configure runtime roles for Amazon EMR steps.


About the authors

Stefano Sandona is an Analytics Specialist Solution Architect with AWS. He loves data, distributed systems and security. He helps customers around the world architecting their data platforms. He has a strong focus on Amazon EMR and all the security aspects around it.

Sharad Kala is a senior engineer at AWS working with the EMR team. He focuses on the security aspects of the applications running on EMR. He has a keen interest in working and learning about distributed systems.

Get started with Apache Hudi using AWS Glue by implementing key design concepts – Part 1

Post Syndicated from Amit Maindola original https://aws.amazon.com/blogs/big-data/part-1-get-started-with-apache-hudi-using-aws-glue-by-implementing-key-design-concepts/

Many organizations build data lakes on Amazon Simple Storage Service (Amazon S3) using a modern architecture for a scalable and cost-effective solution. Open-source storage formats like Parquet and Avro are commonly used, and data is stored in these formats as immutable files. As the data lake is expanded to additional use cases, there are still some use cases that are very difficult with data lakes, such as CDC (change data capture), time travel (querying point-in-time data), privacy regulation requiring deletion of data, concurrent writes, and consistency regarding handling small file problems.

Apache Hudi is an open-source transactional data lake framework that greatly simplifies incremental data processing and streaming data ingestion. However, organizations new to data lakes may struggle to adopt Apache Hudi due to unfamiliarity with the technology and lack of internal expertise.

In this post, we show how to get started with Apache Hudi, focusing on the Hudi CoW (Copy on Write) table type on AWS using AWS Glue, and implementing key design concepts for different use cases. We expect readers to have a basic understanding of data lakes, AWS Glue, and Amazon S3. We walk you through common batch data ingestion use cases with actual test results using a TPC-DS dataset to show how the design decisions can influence the outcome.

Apache Hudi key concepts

Before diving deep into the design concepts, let’s review the key concepts of Apache Hudi, which is important to understand before you make design decisions.

Hudi table and query types

Hudi supports two table types: Copy on Write (CoW) and Merge on Read (MoR). You have to choose the table type in advance, which influences the performance of read and write operations.

The difference in performance depends on the volume of data, operations, file size, and other factors. For more information, refer to Table & Query Types.

When you use the CoW table type, committed data is implicitly compacted, meaning it’s updated to columnar file format during write operation. With the MoR table type, data isn’t compacted with every commit. As a result, for the MoR table type, compacted data lives in columnar storage (Parquet) and deltas are stored in a log (Avro) raw format until compaction merges changes the data to columnar file format. Hudi supports snapshot, incremental, and read-optimized queries for Hudi tables, and the output of the result depends on the query type.

Indexing

Indexing is another key concept for the design. Hudi provides efficient upserts and deletes with fast indexing for both CoW and MoR tables. For CoW tables, indexing enables fast upsert and delete operations by avoiding the need to join against the entire dataset to determine which files to rewrite. For MoR, this design allows Hudi to bound the amount of records any given base file needs to be merged against. Specifically, a given base file needs to be merged only against updates for records that are part of that base file. In contrast, designs without an indexing component could end up having to merge all the base files against all incoming update and delete records.

Solution overview

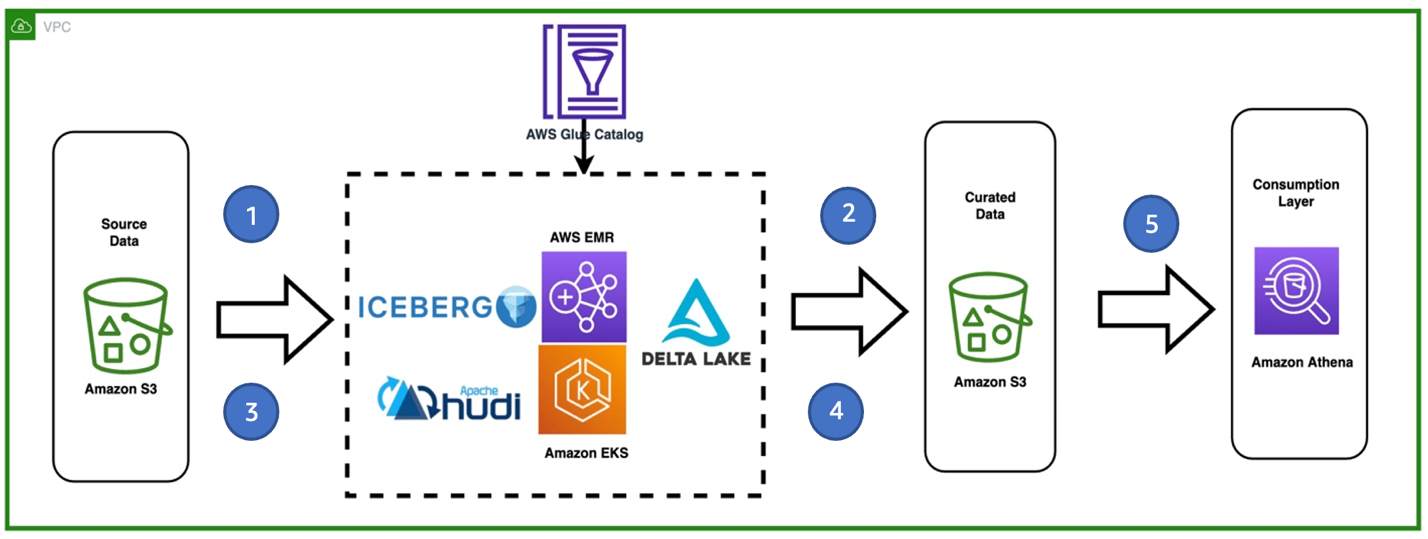
The following diagram describes the high-level architecture for our solution. We ingest the TPC-DS (store_sales) dataset from the source S3 bucket in CSV format and write it to the target S3 bucket using AWS Glue in Hudi format. We can query the Hudi tables on Amazon S3 using Amazon Athena and AWS Glue Studio Notebooks.

The following diagram illustrates the relationships between our tables.

For our post, we use the following tables from the TPC-DS dataset: one fact table, store_sales, and the dimension tables store, item, and date_dim. The following table summarizes the table row counts.

Table Approximate Row Counts
store_sales 2.8 billion
store 1,000
item 300,000
date_dim 73,000

Set up the environment

After you sign in to your test AWS account, launch the provided AWS CloudFormation template by choosing Launch Stack:

Launch Button

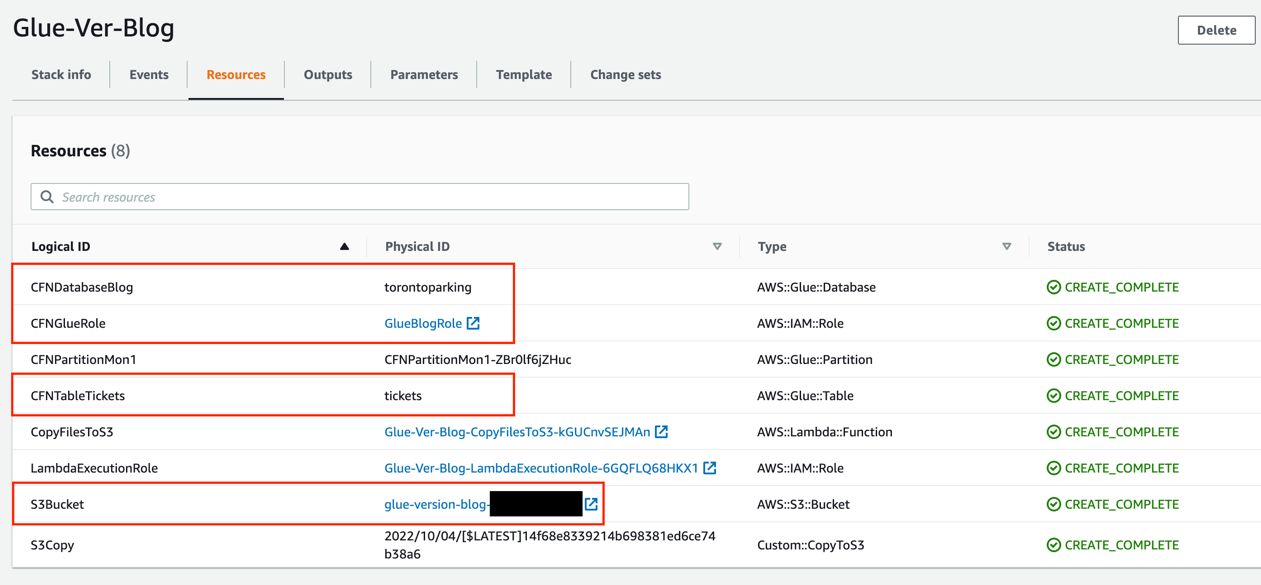
This template configures the following resources:

  • AWS Glue jobs hudi_bulk_insert, hudi_upsert_cow, and hudi_bulk_insert_dim. We use these jobs for the use cases covered in this post.
  • An S3 bucket to store the output of the AWS Glue job runs.
  • AWS Identity and Access Management (IAM) roles and policies with appropriate permissions.

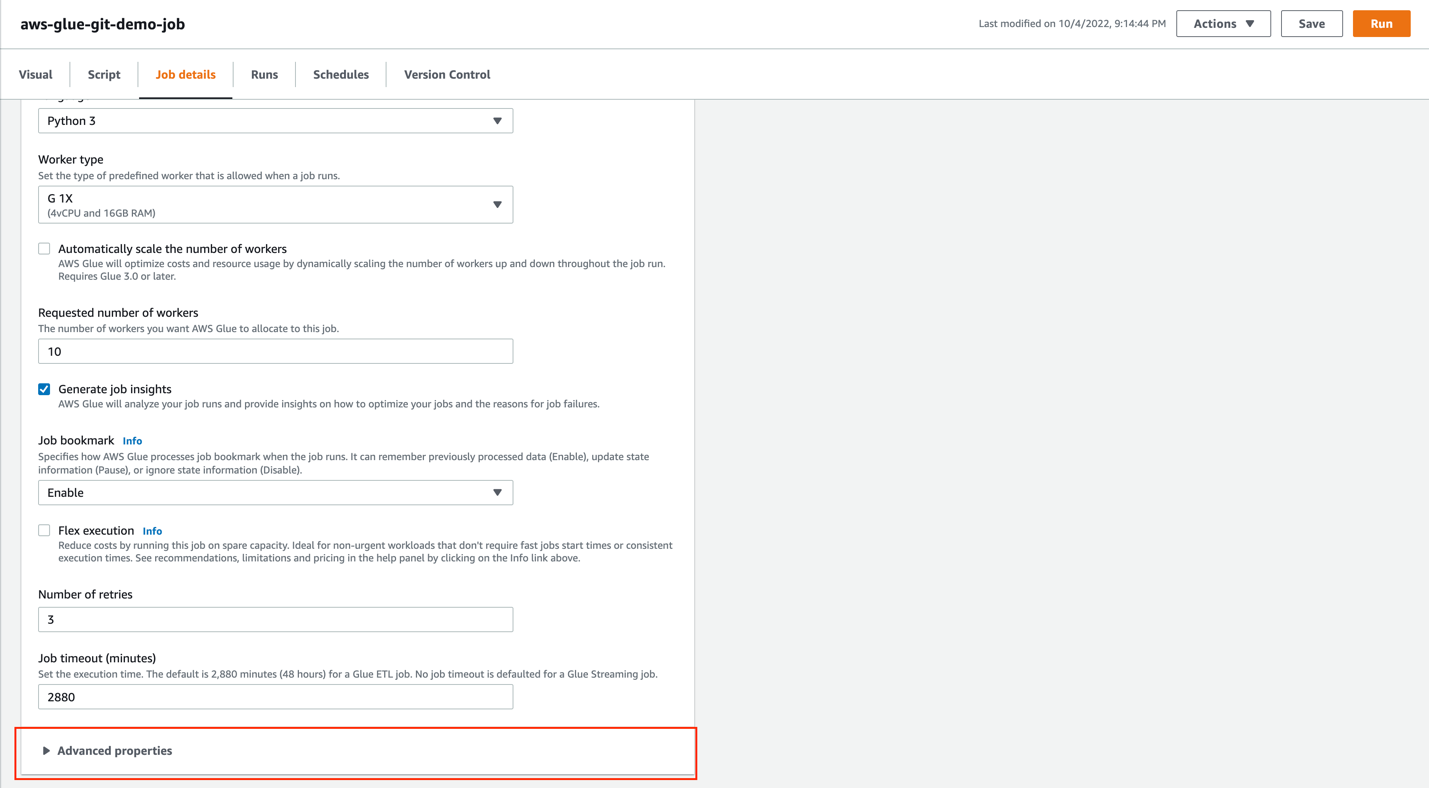
Before you run the AWS Glue jobs, you need to subscribe to the AWS Glue Apache Hudi Connector (latest version: 0.10.1). The connector is available on AWS Marketplace. Follow the connector installation and activation process from the AWS Marketplace link, or refer to Process Apache Hudi, Delta Lake, Apache Iceberg datasets at scale, part 1: AWS Glue Studio Notebook to set it up.

After you create the Hudi connection, add the connector name to all the AWS Glue scripts under Advanced properties.

Bulk insert job

To run the bulk insert job, choose the job hudi_bulk_insert on the AWS Glue console.

The job parameters as shown in the following screenshot are added as part of the CloudFormation stack setup. You can use different values to create CoW partitioned tables with different bulk insert options.

The parameters are as follows:

  • HUDI_DB_NAME – The database in the AWS Glue Data Catalog where the catalog table is created.
  • HUDI_INIT_SORT_OPTION – The options for bulk_insert include GLOBAL_SORT, which is the default. Other options include NONE and PARTITION_SORT.
  • HUDI_TABLE_NAME – The table name prefix that you want to use to identify the table created. In the code, we append the sort option to the name you specify in this parameter.
  • OUTPUT_BUCKET – The S3 bucket created through the CloudFormation stack where the Hudi table datasets are written. The bucket name format is <account number><bucket name>. The bucket name is the one given while creating the CloudFormation stack.
  • CATEGORY_ID – The default for this parameter is ALL, which processes categories of test data in a single AWS Glue job. To test the parallel on the same table, change the parameter value to one of categories from 3, 5, or 8 for the dataset that we use for each parallel AWS Glue job.

Upsert job for the CoW table

To run the upsert job, choose the job hudi_upsert_cow on the AWS Glue console.

The following job parameters are added as part of the CloudFormation stack setup. You can run upsert and delete operations on CoW partitioned tables with different bulk insert options based on the values provided for these parameters.

  • OUTPUT-BUCKET – The same value as the previous job parameter.
  • HUDI_TABLE_NAME – The name of the table created in your AWS Glue Data Catalog.
  • HUDI_DB_NAME – The same value as the previous job parameter. The default value is Default.

Bulk insert job for the Dimension tables

To test the queries on the CoW tables, the fact table that is created using the bulk insert operation needs supplemental dimensional tables. This AWS Glue job has to be run before you can test the TPC queries provided later in this post. To run this job, choose hudi_bulk_insert_dim on the AWS Glue console and use the parameters shown in the following screenshot.

The parameters are as follows:

  • OUTPUT-BUCKET – The same value as the previous job parameter.
  • HUDI_INIT_SORT_OPTION – The options for bulk_insert include GLOBAL_SORT, which is the default. Other available options are NONE and PARTITION_SORT.
  • HUDI_DB_NAME – The Hudi database name. Default is the default value.

Hudi design considerations

In this section, we walk you through a few use cases to demonstrate the difference in the outcome for different settings and operations.

Data migration use case

In Apache Hudi, you ingest the data into CoW or MoR tables types using either insert, upsert, or bulk insert operations. Data migration initiatives often involve one-time initial loads into the target datastore, and we recommend using the bulk insert operation for initial loads.

The bulk insert option provides the same semantics as insert, while implementing a sort-based data writing algorithm, which can scale very well for several hundred TBs of initial load. However, this just does a best-effort job at sizing files vs. guaranteeing file sizes like inserts and upserts do. Also, the primary keys aren’t sorted during the insert, therefore it’s not advised to use insert during the initial data load. By default, a Bloom index is created for the table, which enables faster lookups for upsert and delete operations.

Bulk insert has the following three sort options, which have different outcomes.

  • GLOAL_SORT – Sorts the record key for the entire dataset before writing.
  • PARTITION_SORT – Applies only to partitioned tables. In this option, the record key is sorted within each partition, and the insert time is faster than the default sort.
  • NONE – Doesn’t sort data before writing.

For testing the bulk insert with the three sort options, we use the following AWS Glue job configuration, which is part of the script hudi_bulk_insert:

  • AWS Glue version: 3.0
  • AWS Glue worker type: G1.X
  • Number of AWS Glue workers: 200
  • Input file: TPC-DS/2.13/1TB/store_sales
  • Input file format: CSV (TPC-DS)
  • Number of input files: 1,431
  • Number of rows in the input dataset: Approximately 2.8 billion

The following charts illustrate the behavior of the bulk insert operations with GLOBAL_SORT, PARTITION_SORT, and NONE as sort options for a CoW table. The statistics in the charts are created by using an average of 10 bulk insert operation runs for each sort option.

Because bulk insert does a best-effort job to pack the data in files, you see a different number of files created with different sort options.

We can observe the following:

  • Bulk insert with GLOBAL_SORT has the least number of files, because Hudi tried to create the optimal sized files. However, it takes the most time.
  • Bulk insert with NONE as the sort option has the fastest write time, but resulted in a greater number of files.
  • Bulk insert with PARTITION_SORT also has a faster write time compared to GLOBAL SORT, but also results in a greater number of files.

Based on these results, although GLOBAL_SORT takes more time to ingest the data, it creates a smaller number of files, which has better upsert and read performance.

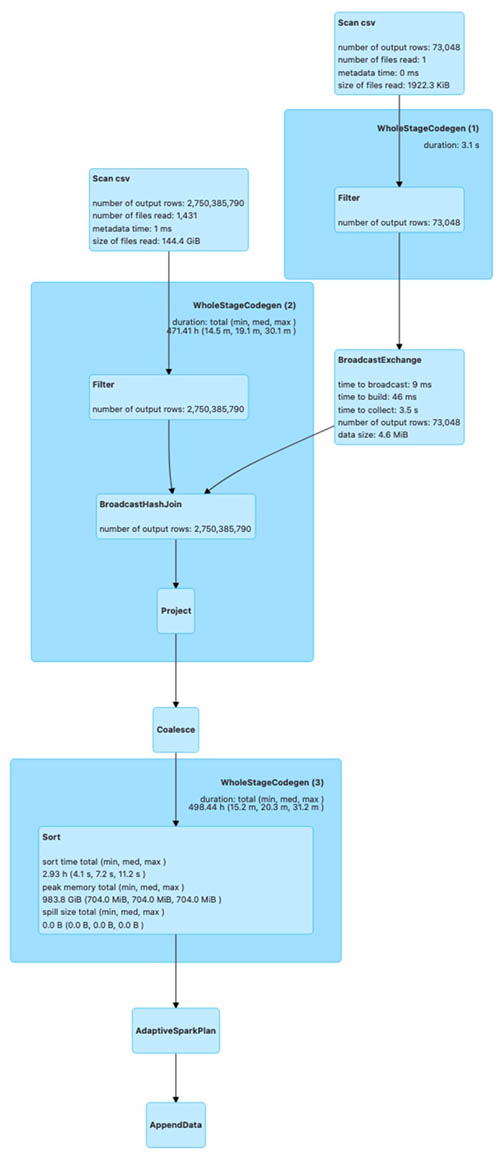
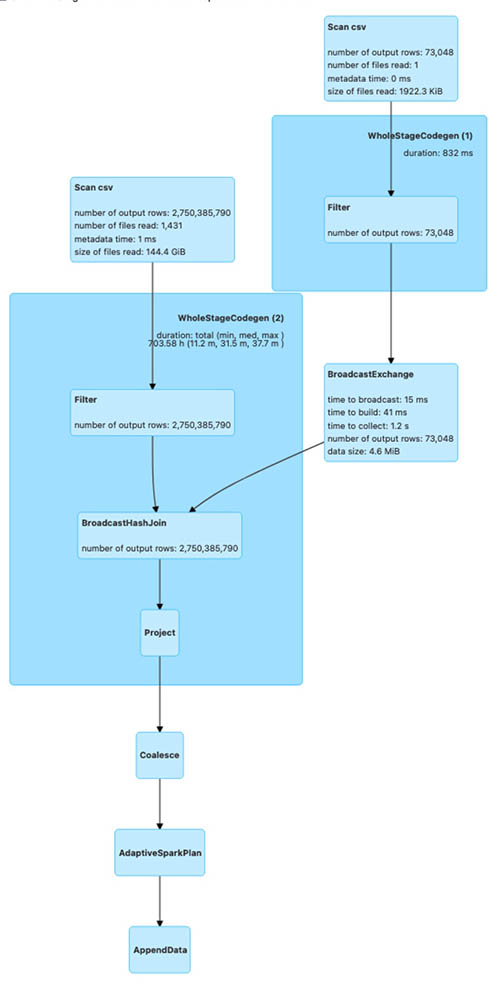
The following diagrams illustrate the Spark run plans for the bulk_insert operation using various sort options.

The first shows the Spark run plan for bulk_insert when the sort option is PARTITION_SORT.

The next is the Spark run plan for bulk_insert when the sort option is NONE.

The last is the Spark run plan for bulk_insert when the sort option is GLOBAL_SORT.

The Spark run plan for bulk_insert with GLOBAL_SORT involves shuffling of data to create optimal sized files. For the other two sort options, data shuffling isn’t involved. As a result, bulk_insert with GLOBAL_SORT takes more time compared to the other sort options.

To test the bulk insert with various bulk insert sort data options on a partitioned table, modify the Hudi AWS Glue job (hudi_bulk_insert) parameter --HUDI_INIT_SORT_OPTION.

We change the parameter --HUDI_INIT_SORT_OPTION to PARTITION_SORT or NONE to test the bulk insert with different data sort options. You need to run the job hudi_bulk_insert_dim, which loads the rest of the tables needed to test the SQL queries.

Now, look at the query performance difference between these three options. For query runtime, we ran two TPC-DS queries (q52.sql and q53.sql, as shown in the following query snippets) using interactive session with AWS Glue Studio Notebook with the following notebook configuration to compare the results.

  • AWS Glue version: 3.0
  • AWS Glue worker type: G1.X
  • Number of AWS Glue workers: 50

Before executing the following queries, replace the table names in the queries with the tables you generate in your account.
q52

SELECT
  dt.d_year,
  item.i_brand_id brand_id,
  item.i_brand brand,
  sum(ss_ext_sales_price) ext_price
FROM date_dim dt, store_sales, item
WHERE dt.d_date_sk = store_sales.ss_sold_date_sk
  AND store_sales.ss_item_sk = item.i_item_sk
  AND item.i_manager_id = 1
  AND dt.d_moy = 11
  AND dt.d_year = 2000
GROUP BY dt.d_year, item.i_brand, item.i_brand_id
ORDER BY dt.d_year, ext_price DESC, brand_id
LIMIT 100
SELECT *
FROM
  (SELECT
    i_manufact_id,
    sum(ss_sales_price) sum_sales,
    avg(sum(ss_sales_price))
    OVER (PARTITION BY i_manufact_id) avg_quarterly_sales
  FROM item, store_sales, date_dim, store
  WHERE ss_item_sk = i_item_sk AND
    ss_sold_date_sk = d_date_sk AND
    ss_store_sk = s_store_sk AND
    d_month_seq IN (1200, 1200 + 1, 1200 + 2, 1200 + 3, 1200 + 4, 1200 + 5, 1200 + 6,
                          1200 + 7, 1200 + 8, 1200 + 9, 1200 + 10, 1200 + 11) AND
    ((i_category IN ('Books', 'Children', 'Electronics') AND

As you can see in the following chart, the performance of the GLOBAL_SORT table outperforms NONE and PARTITION_SORT due to a smaller number of files created in the bulk insert operation.

Ongoing replication use case

For ongoing replication, updates and deletes usually come from transactional databases. As you saw in the previous section, the bulk operation with GLOBAL_SORT took the most time and the operation with NONE took the least time. When you anticipate a higher volume of updates and deletes on an ongoing basis, the sort option is critical for your write performance.

To illustrate the ongoing replication using Apache Hudi upsert and delete operations, we tested using the following configuration:

  • AWS Glue version: 3.0
  • AWS Glue worker type: G1.X
  • Number of AWS Glue workers: 100

To test the upsert and delete operations, we use the store_sales CoW table, which was created using the bulk insert operation in the previous section with all three sort options. We make the following changes:

  • Insert data into a new partition (month 1 and year 2004) using the existing data from month 1 of year 2002 with a new primary key; total of 32,164,890 records
  • Update the ss_list_price column by $1 for the existing partition (month 1 and year 2003); total of 5,997,571 records
  • Delete month 5 data for year 2001; total of 26,997,957 records

The following chart illustrates the runtimes for the upsert operation for the CoW table with different sort options used during the bulk insert.

As you can see from the test run, the runtime of the upsert is higher for NONE and PARTITION_SORT CoW tables. The Bloom index, which is created by default during the bulk insert operation, enables faster lookup for upsert and delete operations.

To test the upsert and delete operations on a CoW table for tables with different data sort options, modify the AWS Glue job (hudi_upsert_cow) parameter HUDI_TABLE_NAME to the desired table, as shown in the following screenshot.

For workloads where updates are performed on the most recent partitions, a Bloom index works fine. For workloads where the update volume is less but the updates are spread across partitions, a simple index is more efficient. You can specify the index type while creating the Hudi table by using the parameter hoodie.index.type. Both the Bloom index and simple index enforce uniqueness of table keys within a partition. If you need uniqueness of keys for the entire table, you must create a global Bloom index or global simple index based on the update workloads.

Multi-tenant partitioned design use case

In this section, we cover Hudi optimistic concurrency using a multi-tenant table design, where each tenant data is stored in a separate table partition. In a real-world scenario, you may encounter a business need to process different tenant data simultaneously, such as a strict SLA to make the data available for downstream consumption as quickly as possible. Without Hudi optimistic concurrency, you can’t have concurrent writes to the same Hudi table. In such a scenario, you can speed up the data writes using Hudi optimistic concurrency when each job operates on a different table dataset. In our multi-tenant table design using Hudi optimistic concurrency, you can run concurrent jobs, where each job writes data to a separate table partition.

For AWS Glue, you can implement Hudi optimistic concurrency using an Amazon DynamoDB lock provider, which was introduced with Apache Hudi 0.10.0. The initial bulk insert script has all the configurations needed to allow multiple writes. The role being used for AWS Glue needs to have DynamoDB permissions added to make it work. For more information about concurrency control and alternatives for lock providers, refer to Concurrency Control.

To simulate concurrent writes, we presume your tenant is based on the category field from the TPC DC test dataset and accordingly partitioned based on the category id field (i_category_id). Let’s modify the script hudi_bulk_insert to run an initial load for different categories. You need to configure your AWS Glue job to run concurrently based on the Maximum concurrency parameter, located under the advanced properties. We describe the Hudi configuration parameters that are needed in the appendix at the end of this post.

The TPC-DS dataset includes data from years 1998–2003. We use i_catagory_id as the tenant ID. The following screenshot shows the distribution of data for multiple tenants (i_category_id). In our testing, we load the data for i_category_id values 3, 5, and 8.

The AWS Glue job hudi_bulk_insert is designed to insert data into specific partitions based on the parameter CATEGORY_ID. If bulk insert job for dimension tables is not run before you need to run the job hudi_bulk_insert_dim, which loads the rest of the tables needed to test the SQL queries.

Now we run three concurrent jobs, each with respective values 3, 5, and 8 to simulate concurrent writes for multiple tenants. The following screenshot illustrates the AWS Glue job parameter to modify for CATEGORY_ID.

We used the following AWS Glue job configuration for each of the three parallel AWS Glue jobs:

  • AWS Glue version: 3.0
  • AWS Glue worker type: G1.X
  • Number of AWS Glue workers: 100
  • Input file: TPC-DS/2.13/1TB/store_sales
  • Input file format: CSV (TPC-DS)

The following screenshot shows all three concurrent jobs started around the same time for three categories, which loaded 867 million rows (50.1 GB of data) into the store_sales table. We used the GLOBAL_SORT option for all three concurrent AWS Glue jobs.

The following screenshot shows the data from the Hudi table where all three concurrent writers inserted data into different partitions, which is illustrated by different colors. All the AWS Glue jobs were run in US Central Time zone (UTC -5). The _hoodie_commit_time is in UTC.

The first two results highlighted in blue corresponds to the AWS Glue job CATEGORY_ID = 3, which had the start time of 09/27/2022 21:23:39 US CST (09/28/2022 02:23:39 UTC).

The next two results highlighted in green correspond to the AWS Glue job CATEGORY_ID = 8, which had the start time of 09/27/2022 21:23:50 US CST (09/28/2022 02:23:50 UTC).

The last two results highlighted in green correspond to the AWS Glue job CATEGORY_ID = 5, which had the start time of 09/27/2022 21:23:44 US CST (09/28/2022 02:23:44 UTC).

The sample data from the Hudi table has _hoodie_commit_time values corresponding to the AWS Glue job run times.

As you can see, we were able to load data into multiple partitions of the same Hudi table concurrently using Hudi optimistic concurrency.

Key findings

As the results show, bulk_insert with GLOBAL_SORT scales well for loading TBs of data in the initial load process. This option is recommended for use cases that require frequent changes after a large migration. Also, when query performance is critical in your use case, we recommend the GLOBAL_SORT option because of the smaller number of files being created with this option.

PARTITION_SORT has better performance for data load compared to GLOBAL_SORT, but it generates a significantly larger number of files, which negatively impacts query performance. You can use this option when the query involves a lot of joins between partitioned tables on record key columns.

The NONE option doesn’t sort the data, but it’s useful when you need the fastest initial load time and requires minimal updates, with the added capability of supporting record changes.

Clean up

When you’re done with this exercise, complete the following steps to delete your resources and stop incurring costs:

  1. On the Amazon S3 console, empty the buckets created by the CloudFormation stack.
  2. On the CloudFormation console, select your stack and choose Delete.

This cleans up all the resources created by the stack.

Conclusion

In this post, we covered some of the Hudi concepts that are important for design decisions. We used AWS Glue and the TPC-DS dataset to collect the results of different use cases for comparison. You can learn from the use cases covered in this post to make the key design decisions, particularly when you’re at the early stage of Apache Hudi adoption. You can go through the steps in this post to start a proof of concept using AWS Glue and Apache Hudi.

References

Appendix

The following table summarizes the Hudi configuration parameters that are needed.

Configuration Value Description Required
hoodie.write.
concurrency.mode
optimistic_concurrency_control Property to turn on optimistic concurrency control. Yes
hoodie.cleaner.
policy.failed.writes
LAZY Property to turn on optimistic concurrency control. Yes
hoodie.write.
lock.provider
org.apache.
hudi.client.
transaction.lock.
DynamoDBBasedLockProvider
Lock provider implementation to use. Yes
hoodie.write.
lock.dynamodb.table
<String> The DynamoDB table name to use for acquiring locks. If the table doesn’t exist, it will be created. You can use the same table across all your Hudi jobs operating on the same or different tables. Yes
hoodie.write.
lock.dynamodb.partition_key
<String> The string value to be used for the locks table partition key attribute. It must be a string that uniquely identifies a Hudi table, such as the Hudi table name. Yes: ‘tablename’
hoodie.write.
lock.dynamodb.region
<String> The AWS Region in which the DynamoDB locks table exists, or must be created. Yes:
Default: us-east-1
hoodie.write.
lock.dynamodb.billing_mode
<String> The DynamoDB billing mode to be used for the locks table while creating. If the table already exists, then this doesn’t have an effect. Yes: Default
PAY_PER_REQUEST
hoodie.write.
lock.dynamodb.endpoint_url
<String> The DynamoDB URL for the Region where you’re creating the table. Yes: dynamodb.us-east-1.amazonaws.com
hoodie.write.
lock.dynamodb.read_capacity
<Integer> The DynamoDB read capacity to be used for the locks table while creating. If the table already exists, then this doesn’t have an effect. No: Default 20
hoodie.write.
lock.dynamodb.
write_capacity
<Integer> The DynamoDB write capacity to be used for the locks table while creating. If the table already exists, then this doesn’t have an effect. No: Default 10

About the Authors

About the author Amit MaindolaAmit Maindola is a Data Architect focused on big data and analytics at Amazon Web Services. He helps customers in their digital transformation journey and enables them to build highly scalable, robust, and secure cloud-based analytical solutions on AWS to gain timely insights and make critical business decisions.

About the author Srinivas KandiSrinivas Kandi is a Data Architect with focus on data lake and analytics at Amazon Web Services. He helps customers to deploy data analytics solutions in AWS to enable them with prescriptive and predictive analytics.

About the author Amit MaindolaMitesh Patel is a Principal Solutions Architect at AWS. His main area of depth is application and data modernization. He helps customers to build scalable, secure and cost effective solutions in AWS.

Code versioning using AWS Glue Studio and GitHub

Post Syndicated from Leonardo Gomez original https://aws.amazon.com/blogs/big-data/code-versioning-using-aws-glue-studio-and-github/

AWS Glue now offers integration with Git, an open-source version control system widely used across the developer community. Thanks to this integration, you can incorporate your existing DevOps practices on AWS Glue jobs. AWS Glue is a serverless data integration service that helps you create jobs based on Apache Spark or Python to perform extract, transform, and load (ETL) tasks on datasets of almost any size.

Git integration in AWS Glue works for all AWS Glue job types, both visual and code-based. It offers built-in integration with both GitHub and AWS CodeCommit, and makes it easier to use automation tools like Jenkins and AWS CodeDeploy to deploy AWS Glue jobs. AWS Glue Studio’s visual editor now also supports parameterizing data sources and targets for transparent deployments between environments.

Overview of solution

To demonstrate how to integrate AWS Glue Studio with a code hosting platform for version control and collaboration, we use the Toronto parking tickets dataset, specifically the data about parking tickets issued in the city of Toronto in 2019. The goal is to create a job to filter parking tickets based on a specific category and push the code to a GitHub repo for version control. After the job is uploaded on the repository, we make some changes to the code and pull the changes back to the AWS Glue job.

Prerequisites

For this walkthrough, you should have the following prerequisites:

If the AWS account you use to follow this post uses AWS Lake Formation to manage permissions on the AWS Glue Data Catalog, make sure that you log in as a user with access to create databases and tables. For more information, refer to Implicit Lake Formation permissions.

Launch your CloudFormation stack

To create your resources for this use case, complete the following steps:

  1. Launch your CloudFormation stack in us-east-1:
  2. Under Parameters, for paramBucketName, enter a name for your S3 bucket (include your account number).
  3. Select I acknowledge that AWS CloudFormation might create IAM resources with custom names.
  4. Choose Create stack.
  5. Wait until the creation of the stack is complete, as shown on the AWS CloudFormation console.

Launching this stack creates AWS resources. You need the following resources from the Outputs tab for the next steps:

  • CFNGlueRole – The IAM role to run AWS Glue jobs
  • S3Bucket – The name of the S3 bucket to store solution-related files
  • CFNDatabaseBlog – The AWS Glue database to store the table related to this post
  • CFNTableTickets – The AWS Glue table to use as part of the sample job

Configure the GitHub repository

We use GitHub as the source control system for this post. In order to use it, you need a GitHub account. After the account is created, you need to create following components:

  • GitHub repository – Create a repository and name it glue-ver-log. For instructions, refer to Create a repo.
  • Branch – Create a branch and name it develop. For instructions, refer to Managing branches.
  • Personal access token – For instructions, refer to Creating a personal access token. Make sure to keep the personal access token handy because you use it in later steps.

Create an AWS Glue Studio job

Now that the infrastructure is set up, let’s author an AWS Glue job in our account. Complete the following steps:

  1. On the AWS Glue console, choose Jobs in the navigation pane.
  2. Select Visual job with blank canvas and choose Create.
  3. Enter a name for the job using the title editor. For example, aws-glue-git-demo-job.
  4. On the Visual tab, choose Source and then choose AWS Glue Data Catalog

  5. For Database, choose torontoparking and for Table, choose tickets.
  6. Choose Transform and then Filter.
  7. Add a filter by infraction_description and set the value to PARK ON PRIVATE PROPERTY.
  8. Choose Target and then choose Amazon S3.
  9. For Format, choose Parquet.
  10. For S3 Target Location, enter s3://glue-version-blog-YOUR ACOUNT NUMBER/output/.
  11. For Data Catalog update options, select Do not update the Data Catalog.
  12. Go to the Script tab to verify that a script has been generated.
  13. Go to the Job Details tab to make sure that the role GlueBlogRole is selected and leave everything else with the default values.

    Because the catalog table names in the production and development environment may be different, AWS Glue Studio now allows you to parameterize visual jobs. To do so, perform the following steps:
  14. On the Job details tab, scroll to the Job parameters section under Advanced properties.
  15. Create the --source.database.name parameter and set the value to torontoparking.
  16. Create the --souce.table.name parameter and set the value to tickets.
  17. Go to the Visual tab and choose the AWS Glue Data Catalog node.Notice that under each of the database and table selection options is a new expandable section called Use runtime parameters.
  18. The run time parameters are auto populated with the parameters previously created. Clicking on the Apply button will apply the default values for these parameters.
  19. Go to the Script tab to review the script.AWS Glue Studio code generation automatically picks up the parameters to resolve and then makes the appropriate references in the script so that the parameters can be used.
    Now the job is ready to be pushed into the develop branch of our version control system.
  20. On the Version Control tab, for Version control system, choose Github.
  21. For Personal access token, enter your GitHub token.
  22. For Repository owner, enter the owner of your GitHub account.
  23. In the Repository configuration section, for Repository, choose glue-ver-blog.
  24. For Branch, choose develop.
  25. For Folder, leave it blank.
  26. Choose Save to save the job.

Push to the repository

Now the job can be pushed to the remote repository.

  1. On the Actions menu, choose Push to repository.
  2. Choose Confirm to confirm the operation.

    After the operation succeeds, the page reloads to reflect the latest information from the version control system. A notification shows the latest available commit and links you to the commit on GitHub.
  3. Choose the commit link to go to the repository on GitHub.

You have successfully created your first commit to GitHub from AWS Glue Studio!

Pull from the repository

Now that we have committed the AWS Glue job to GitHub, it’s time to see how we can pull changes using AWS Glue Studio. For this demo, we make a small modification in our example job using the GitHub UI and then pull the changes using AWS Glue Studio.

  1. On GitHub, choose the develop branch.
  2. Choose the aws-glue-git-demo-job folder.
  3. Choose the aws-glue-git-demo-job.json file.
  4. Choose the edit icon.
  5. Set the MaxRetries parameter to 1.
  6. Choose Commit changes.
  7. Return to the AWS Glue console and on the Actions menu, choose Pull from repository.
  8. Choose Confirm.

Notice that the commit ID has changed.

On the Job details tab, you can see that the value for Number of retries is 1.

Clean up

To avoid incurring future charges, and to clean up unused roles and policies, delete the resources you created: the datasets, CloudFormation stack, S3 bucket, AWS Glue job, AWS Glue database, and AWS Glue table.

Conclusion

This post showed how to integrate AWS Glue with GitHub, but this is only the beginning—now you can use the most popular functionalities offered by Git.

To learn more and get started using the AWS Glue Studio Git integration, refer to Configuring Git integration in AWS Glue.


About the authors

Leonardo Gómez is a Senior Analytics Specialist Solutions Architect at AWS. Based in Toronto, Canada, he has over a decade of experience in data management, helping customers around the globe address their business and technical needs.

Daiyan Alamgir is a Principal Frontend Engineer on AWS Glue based in New York. He leads the AWS Glue UI team and is focused on building interactive web-based applications for data analysts and engineers to address their data integration use cases.

Split your monolithic Apache Kafka clusters using Amazon MSK Serverless

Post Syndicated from Ali Alemi original https://aws.amazon.com/blogs/big-data/split-your-monolithic-apache-kafka-clusters-using-amazon-msk-serverless/

Today, many companies are building real-time applications to improve their customer experience and get immediate insights from their data before it loses its value. As the result, companies have been facing increasing demand to provide data streaming services such as Apache Kafka for developers. To meet this demand, companies typically start with a small- or medium-sized, centralized Apache Kafka cluster to build a global streaming service. Over time, they scale the capacity of the cluster to match the demand for streaming. They choose to keep a monolithic cluster to simplify staffing and training by bringing all technical expertise in a single place. This approach also has cost benefits because it reduces the technical debt, overall operational costs, and complexity. In a monolithic cluster, the extra capacity is shared among all applications, therefore it usually reduces the overall streaming infrastructure cost.

In this post, I explain a few challenges with a centralized approach, and introduce two strategies for implementing a decentralized approach, using Amazon MSK Serverless. A decentralized strategy enables you to provision multiple Apache Kafka clusters instead of a monolithic one. I discuss how this strategy helps you optimize clusters per your application’s security, storage, and performance needs. I also discuss the benefits of a decentralized model and how to migrate from a monolithic cluster to a multi-cluster deployment model.

MSK Serverless can reduce the overhead and cost of managing Apache Kafka clusters. It automatically provisions and scales compute and storage resources for Apache Kafka clusters and automatically manages cluster capacity. It monitors how the partitions are distributed across the backend nodes and reassigns the partitions automatically when necessary. It integrates with other AWS services such as Amazon CloudWatch, where you can monitor the health of the cluster. The choice of MSK Serverless in this post is deliberate, even though the concepts can be applied to the Amazon MSK provisioned offering as well.

Overview of solution

Apache Kafka is an open-source, high-performance, fault-tolerant, and scalable platform for building real-time streaming data pipelines and applications. Apache Kafka simplifies producing and consuming streaming data by decoupling producers from the consumers. Producers simply interact with a single data store (Apache Kafka) to send their data. Consumers read the continuously flowing data, independent from the architecture or the programming language of the producers.

Apache Kafka is a popular choice for many use cases, such as:

  • Real-time web and log analytics
  • Transaction and event sourcing
  • Messaging
  • Decoupling microservices
  • Streaming ETL (extract, transform, and load)
  • Metrics and log aggregation

Challenges with a monolithic Apache Kafka cluster

Monolithic Apache Kafka saves companies from having to install and maintain multiple clusters in their data centers. However, this approach comes with common disadvantages:

  • The entire streaming capacity is consolidated in one place, making capacity planning difficult and complicated. You typically need more time to plan and reconfigure the cluster. For example, when preparing for sales or large campaign events, it’s hard to predict and calculate an aggregation of needed capacity across all applications. This can also inhibit the growth of your company because reconfiguring a large cluster for a new workload often takes longer than a small cluster.
  • Organizational conflicts may occur regarding the ownership and maintenance of the Apache Kafka cluster, because a monolithic cluster is a shared resource.
  • The Apache Kafka cluster becomes a single point of failure. Any downtime means the outage of all related applications.
  • If you choose to increase Apache Kafka’s resiliency with a multi-datacenter deployment, then you typically must have a cluster with the same size (as large) in the other data center, which is expensive.
  • Maintenance and operation activities, such as version upgrades or installing OS patches, take significantly longer for larger clusters due to the distributed nature of Apache Kafka architecture.
  • A faulty application can impact the reliability of the whole cluster and other applications.
  • Version upgrades have to wait until all applications are tested with the new Apache Kafka version. This limits any application from experimenting with Apache Kafka features quickly.
  • This model makes it difficult to attribute the cost of running the cluster to the applications for chargeback purposes.

The following diagram shows a monolithic Apache Kafka architecture.

diagram shows a monolithic Apache Kafka architecture.

Decentralized model

A decentralized Apache Kafka deployment model involves provisioning, configuring, and maintaining multiple clusters. This strategy generally isn’t preferred because managing multiple clusters requires heavy investments in operational excellence, advanced monitoring, infrastructure as code, security, and hardware procurement in on-premises environments.

However, provisioning decentralized Apache Kafka clusters using MSK Serverless doesn’t require those investments. It can scale the capacity and storage up and down instantly based on the application requirement, adding new workloads or scaling operations without the need for complex capacity planning. It also provides a throughput-based pricing model, and you pay for the storage and throughput that your applications use. Moreover, with MSK Serverless, you no longer need to perform standard maintenance tasks such as Apache Kafka version upgrade, partition reassignments, or OS patching.

With MSK Serverless, you benefit from a decentralized deployment without the operational burden that usually comes with a self-managed Apache Kafka deployment. In this strategy, the DevOps managers don’t have to spend time provisioning, configuring, monitoring, and operating multiple clusters. Instead, they invest more in building more operational tools to onboard more real-time applications.

In the remainder of this post, I discuss different strategies for implementing a decentralized model. Furthermore, I highlight the benefits and challenges of each strategy so you can decide what works best for your organization.

Write clusters and read clusters

In this strategy, write clusters are responsible for ingesting data from the producers. You can add new workloads by creating new topics or creating new MSK Serverless clusters. If you need to scale the size of current workloads, you simply increase the number of partitions of your topics if the ordering isn’t important. MSK Serverless manages the capacity instantly as per the new configuration.

Each MSK Serverless cluster provides up to 200 MBps of write throughput and 400 MBps of read throughput. It also allocates up to 5 MBps of write throughput and 10 MBps of read throughput per partition.

Data consumers within any organization can usually be divided to two main categories:

  • Time-sensitive workloads, which need data with very low latency (such as millisecond or subsecond) and can only tolerate a very short Recovery Time Objective (RTO)
  • Time-insensitive workloads, which can tolerate higher latency (sub-10 seconds to minute-level latency) and longer RTO

Each of these categories also can be further divided into subcategories based on certain conditions, such as data classification, regulatory compliance, or service level agreements (SLAs). Read clusters can be set up according to your business or technical requirements, or even organizational boundaries, which can be used by the specific group of consumers. Finally, the consumers are configured to run against the associated read cluster.

To connect the write clusters to read clusters, a data replication pipeline is necessary. You can build a data replication pipeline many ways. Because MSK Serverless supports the standard Apache Kafka APIs, you can use the standard Apache Kafka tools such as MirrorMaker 2 to set up replications between Apache Kafka clusters.

The following diagram shows the architecture for this strategy.

diagram shows the architecture for this strategy.

This approach has the following benefits:

  • Producers are isolated from the consumers; therefore, your write throughput can scale independently from your read throughput. For example, if you have reached your max read throughput with existing clusters and need to add a new consumer group, you can simply provision a new MSK Serverless cluster and set up replication between the write cluster and the new read cluster.
  • It helps enforce security and regulatory compliance. You can build streaming jobs that can mask or remove the sensitive fields of data events, such as personally identifiable information (PII), while replicating the data.
  • Different clusters can be configured differently in terms of retention. For example, read clusters can be configured with different maximum retention periods, to save on storage cost depending on their requirements.
  • You can prioritize your response time for outages for certain clusters over the others.
  • For implementing increased resiliency, you can have fewer clusters in the backup Region by only replicating the data from the write clusters. Other clusters such as read clusters can be provisioned when the workload failover is invoked. In this model, with the MSK Serverless pricing model, you pay additionally for what you use (lighter replica) in the backup Region.

There are a few important notes to keep in mind when choosing this strategy:

  • It requires setting up multiple replications between clusters, which comes with additional operational and maintenance complexity.
  • Replication tools such as MirrorMaker 2 only support at-least-once processing semantics. This means that during failures and restarts, data events can be duplicated. If you have consumers that can’t tolerate data duplication, I suggest building data pipelines that support the exactly-once processing semantic for replicating the data, such as Apache Flink, instead of using MirrorMaker 2.
  • Because consumers don’t consume data directly from the write clusters, the latency is increased between the writers and the readers.
  • In this strategy, even though there are multiple Apache Kafka clusters, ownership and control still reside with one team, and the resources are in a single AWS account.

Segregating clusters

For some companies, providing access to Apache Kafka through a central data platform can create scaling, ownership, and accountability challenges. Infrastructure teams may not understand the specific business needs of an application, such as data freshness or latency requirements, security, data schemas, or a specific method needed for data ingestion.

You can often reduce these challenges by giving ownership and autonomy to the team who owns the application. You allow them to build and manage their application and needed infrastructure, rather than only being able to use a common central platform. For instance, development teams are responsible for provisioning, configuring, maintaining, and operating their own Apache Kafka clusters. They’re the domain experts of their application requirements, and they can manage their cluster according to their application needs. This reduces overall friction and puts application teams accountable to their advertised SLAs.

As mentioned before, MSK Serverless minimizes the operation and maintenance work associated with Apache Kafka clusters. This enables the autonomous application teams to manage their clusters according to industry best practices, without needing to be an expert in running highly available Apache Kafka clusters on AWS. If the MSK Serverless cluster is provisioned within their AWS account, they also own all the costs associated with operating their applications and the data streaming services.

The following diagram shows the architecture for this strategy.

diagram shows the architecture for this strategy.

This approach has the following benefits:

  • MSK Serverless clusters are managed by different teams; therefore, the overall management work is minimized.
  • Applications are isolated from each other. A faulty application or downtime of a cluster doesn’t impact other applications.
  • Consumers read data directly with low latency from the same cluster where the data is written.
  • Each MSK Serverless cluster scales differently per its write and read throughput.
  • Simple cost attribution means that application teams own their infrastructure and its cost.
  • Total ownership of the streaming infrastructure allows developers to adopt streaming faster and deliver more functionalities. It may also help shorten their response time to failures and outages.

Compared to the previous strategy, this approach has the following disadvantages:

  • It’s difficult to enforce a unified security or regulatory compliance across many teams.
  • Duplicate copies of the same data may be ingested in multiple clusters. This increases the overall cost.
  • To increase resiliency, each team individually needs to set up replications between MSK Serverless clusters.

Moving from a centralized to decentralized strategy

MSK Serverless provides AWS Command Line Interface (AWS CLI) tools and support for AWS CloudFormation templates for provisioning clusters in minutes. You can implement any of the strategies that I mentioned earlier via the methods AWS provides, and migrate your producers and consumers when the new clusters are ready.

The following steps provide further guidance on implementation of these strategies:

  1. Begin by focusing on the current issues with the monolithic Apache Kafka. Next, compare the challenges with the benefits and disadvantages, as listed under each strategy. This helps you decide which strategy serves your company the best.
  2. Identify and document each application’s performance, resiliency, SLA, and ownership requirements separately.
  3. Attempt grouping applications that have similar requirements. For example, you may find a few applications that run batch analytics; therefore, they’re not sensitive to data freshness and also don’t need access to sensitive (or PII) data. If you decide segregating clusters is the right strategy for your company, you may choose to group applications by the team who owns them.
  4. Compare each group of applications’ storage and streaming throughput requirements against the MSK Serverless quotas. This helps you determine whether one MSK Serverless cluster can provide the needed aggregated streaming capacity. Otherwise, further divide larger groups to smaller ones.
  5. Create MSK Serverless clusters per each group you identified earlier via the AWS Management Console, AWS CLI, or CloudFormation templates.
  6. Identify the topics that correspond to each new MSK Serverless cluster.
  7. Choose the best migration pattern to Amazon MSK according to the replication requirements. For example, when you don’t need data transformation, and duplicate data events can be tolerated by applications, you can use Apache Kafka migration tools such as MirrorMaker 2.0.
  8. After you have verified the data is replicating correctly to the new clusters, first restart the consumers against the new cluster. This ensures no data will be lost as the result of the migration.
  9. After the consumers resume processing data, restart the producers against the new cluster, and shut down the replication pipeline you created earlier.

As of this writing, MSK Serverless only supports AWS Identity and Access Management (IAM) for authentication and access control. For more information, refer to Securing Apache Kafka is easy and familiar with IAM Access Control for Amazon MSK. If your applications use other methods supported by Apache Kafka, you need to modify your application code to use IAM Access Control instead or use the Amazon MSK provisioned offering.

Summary

MSK Serverless eliminates operational overhead, including the provisioning, configuration, and maintenance of highly available Apache Kafka. In this post, I showed how splitting Apache Kafka clusters helps improve the security, performance, scalability, and reliability of your overall data streaming services and applications. I also described two main strategies for splitting a monolithic Apache Kafka cluster using MSK Serverless. If you’re using Amazon MSK provisioned offering, these strategies are still relevant when considering moving from a centralized to a decentralized model. You can decide the right strategy depending on your company’s specific needs.

For further reading on Amazon MSK, visit the official product page.


About the Author

About the author Ali AlemiAli Alemi is a Streaming Specialist Solutions Architect at AWS. Ali advises AWS customers with architectural best practices and helps them design real-time analytics data systems that are reliable, secure, efficient, and cost-effective. He works backward from customers’ use cases and designs data solutions to solve their business problems. Prior to joining AWS, Ali supported several public sector customers and AWS consulting partners in their application modernization journey and migration to the cloud.

Use IAM Access Analyzer policy generation to grant fine-grained permissions for your AWS CloudFormation service roles

Post Syndicated from Joel Knight original https://aws.amazon.com/blogs/security/use-iam-access-analyzer-policy-generation-to-grant-fine-grained-permissions-for-your-aws-cloudformation-service-roles/

AWS Identity and Access Management (IAM) Access Analyzer provides tools to simplify permissions management by making it simpler for you to set, verify, and refine permissions. One such tool is IAM Access Analyzer policy generation, which creates fine-grained policies based on your AWS CloudTrail access activity—for example, the actions you use with Amazon Elastic Compute Cloud (Amazon EC2), AWS Lambda, and Amazon Simple Storage Service (Amazon S3). AWS has expanded policy generation capabilities to support the identification of actions used from over 140 services. New additions include services such as AWS CloudFormation, Amazon DynamoDB, and Amazon Simple Queue Service (Amazon SQS). When you request a policy, IAM Access Analyzer generates a policy by analyzing your CloudTrail logs to identify actions used from this group of over 140 services. The generated policy makes it efficient to grant only the required permissions for your workloads. For other services, Access Analyzer helps you by identifying the services used and guides you to add the necessary actions.

In this post, we will show how you can use Access Analyzer to generate an IAM permissions policy that restricts CloudFormation permissions to only those actions that are necessary to deploy a given template, in order to follow the principle of least privilege.

Permissions for AWS CloudFormation

AWS CloudFormation lets you create a collection of related AWS and third-party resources and provision them in a consistent and repeatable fashion. A common access management pattern is to grant developers permission to use CloudFormation to provision resources in the production environment and limit their ability to do so directly. This directs developers to make infrastructure changes in production through CloudFormation, using infrastructure-as-code patterns to manage the changes.

CloudFormation can create, update, and delete resources on the developer’s behalf by assuming an IAM role that has sufficient permissions. Cloud administrators often grant this IAM role broad permissions–in excess of what’s necessary to just create, update, and delete the resources from the developer’s template–because it’s not clear what the minimum permissions are for the template. As a result, the developer could use CloudFormation to create or modify resources outside of what’s required for their workload.

The best practice for CloudFormation is to acquire permissions by using the credentials from an IAM role you pass to CloudFormation. When you attach a least-privilege permissions policy to the role, the actions CloudFormation is allowed to perform can be scoped to only those that are necessary to manage the resources in the template. In this way, you can avoid anti-patterns such as assigning the AdministratorAccess or PowerUserAccess policies—both of which grant excessive permissions—to the role.

The following section will describe how to set up your account and grant these permissions.

Prepare your development account

Within your development account, you will configure the same method for deploying infrastructure as you use in production: passing a role to CloudFormation when you launch a stack. First, you will verify that you have the necessary permissions, and then you will create the role and the role’s permissions policy.

Get permissions to use CloudFormation and IAM Access Analyzer

You will need the following minimal permissions in your development account:

  • Permission to use CloudFormation, in particular to create, update, and delete stacks
  • Permission to pass an IAM role to CloudFormation
  • Permission to create IAM roles and policies
  • Permission to use Access Analyzer, specifically the GetGeneratedPolicy, ListPolicyGenerations, and StartPolicyGeneration actions

The following IAM permissions policy can be used to grant your identity these permissions.

{
    "Version": "2012-10-17",
    "Statement": [
        {
            "Sid": "DeveloperPermissions”,
            "Effect": "Allow",
            "Action": [
                "access-analyzer:GetGeneratedPolicy",
                "access-analyzer:ListPolicyGenerations",
                "access-analyzer:StartPolicyGeneration",
                "cloudformation:*",
                "iam:AttachRolePolicy",
                "iam:CreatePolicy",
                "iam:CreatePolicyVersion",
                "iam:CreateRole",
                "iam:DeletePolicyVersion",
                "iam:DeleteRolePolicy",
                "iam:DetachRolePolicy",
                "iam:GetPolicy",
                "iam:GetPolicyVersion",
                "iam:GetRole",
                "iam:GetRolePolicy",
                "iam:ListPolicies",
                "iam:ListPolicyTags",
                "iam:ListPolicyVersions",
                "iam:ListRolePolicies",
                "iam:ListRoleTags",
                "iam:ListRoles",
                "iam:PutRolePolicy",
                "iam:UpdateAssumeRolePolicy"
            ],
            "Resource": "*"
        },
        {
            "Sid": "AllowPassCloudFormationRole”,
            "Effect": "Allow",
            "Action": [
                "iam:PassRole"
            ]
            "Resource": "*",
            "Condition": {
                "StringEquals": {
                    "iam:PassedToService": "cloudformation.amazonaws.com"
                }
            }
        }
    ]
}

Note: If your identity already has these permissions through existing permissions policies, there is no need to apply the preceding policy to your identity.

Create a role for CloudFormation

Creating a service role for CloudFormation in the development account makes it less challenging to generate the least-privilege policy, because it becomes simpler to identify the actions CloudFormation is taking as it creates and deletes resources defined in the template. By identifying the actions CloudFormation has taken, you can create a permissions policy to match.

To create an IAM role in your development account for CloudFormation

  1. Open the IAM console and choose Roles, then choose Create role.
  2. For the trusted entity, choose AWS service. From the list of services, choose CloudFormation.
  3. Choose Next: Permissions.
  4. Select one or more permissions policies that align with the types of resources your stack will create. For example, if your stack creates a Lambda function and an IAM role, choose the AWSLambda_FullAccess and IAMFullAccess policies.

    Note: Because you have not yet created the least-privilege permissions policy, the role is granted broader permissions than required. You will use this role to launch your stack and evaluate the resulting actions that CloudFormation takes, in order to build a lower-privilege policy.

  5. Choose Next: Tags to proceed.
  6. Enter one or more optional tags, and then choose Next: Review.
  7. Enter a name for the role, such as CloudFormationDevExecRole.
  8. Choose Create role.

Create and destroy the stack

To have CloudFormation exercise the actions required by the stack, you will need to create and destroy the stack.

To create and destroy the stack

  1. Navigate to CloudFormation in the console, expand the menu in the left-hand pane, and choose Stacks.
  2. On the Stacks page, choose Create Stack, and then choose With new resources.
  3. Choose Template is ready, choose Upload a template file, and then select the file for your template. Choose Next.
  4. Enter a Stack name, and then choose Next.
  5. For IAM execution role name, select the name of the role you created in the previous section (CloudFormationDevExecRole). Choose Next.
  6. Review the stack configuration. If present, select the check box(es) in the Capabilities section, and then choose Create stack.
  7. Wait for the stack to reach the CREATE_COMPLETE state before continuing.
  8. From the list of stacks, select the stack you just created, choose Delete, and then choose Delete stack.
  9. Wait until the stack reaches the DELETE_COMPLETE state (at which time it will also disappear from the list of active stacks).

Note: It’s recommended that you also modify the CloudFormation template and update the stack to initiate updates to the deployed resources. This will allow Access Analyzer to capture actions that update the stack’s resources, in addition to create and delete actions. You should also review the API documentation for the resources that are being used in your stack and identify any additional actions that may be required.

Now that the development environment is ready, you can create the least-privilege permissions policy for the CloudFormation role.

Use Access Analyzer to generate a fine-grained identity policy

Access Analyzer reviews the access history in AWS CloudTrail to identify the actions an IAM role has used. Because CloudTrail delivers logs within an average of about 15 minutes of an API call, you should wait at least that long after you delete the stack before you attempt to generate the policy, in order to properly capture all of the actions.

Note: CloudTrail must be enabled in your AWS account in order for policy generation to work. To learn how create a CloudTrail trail, see Creating a trail for your AWS account in the AWS CloudTrail User Guide.

To generate a permissions policy by using Access Analyzer

  1. Open the IAM console and choose Roles. In the search box, enter CloudFormationDevExecRole and select the role name in the list.
  2. On the Permissions tab, scroll down and choose Generate policy based on CloudTrail events to expand this section. Choose Generate policy.
  3. Select the time period of the CloudTrail logs you want analyzed.
  4. Select the AWS Region where you created and deleted the stack, and then select the CloudTrail trail name in the drop-down list.
  5. If this is your first time generating a policy, choose Create and use a new service role to have an IAM role automatically created for you. You can view the permissions policy the role will receive by choosing View permission details. Otherwise, choose Use an existing service role and select a role in the drop-down list.

    The policy generation options are shown in Figure 1.

    Figure 1: Policy generation options

    Figure 1: Policy generation options

  6. Choose Generate policy.

You will be redirected back to the page that shows the CloudFormationDevExecRole role. The Status in the Generate policy based on CloudTrail events section will show In progress. Wait for the policy to be generated, at which time the status will change to Success.

Review the generated policy

You must review and save the generated policy before it can be applied to the role.

To review the generated policy

  1. While you are still viewing the CloudFormationDevExecRole role in the IAM console, under Generate policy based on CloudTrail events, choose View generated policy.
  2. The Generated policy page will open. The Actions included in the generated policy section will show a list of services and one or more actions that were found in the CloudTrail log. Review the list for omissions. Refer to the IAM documentation for a list of AWS services for which an action-level policy can be generated. An example list of services and actions for a CloudFormation template that creates a Lambda function is shown in Figure 2.
    Figure 2: Actions included in the generated policy

    Figure 2: Actions included in the generated policy

  3. Use the drop-down menus in the Add actions for services used section to add any necessary additional actions to the policy for the services that were identified by using CloudTrail. This might be needed if an action isn’t recorded in CloudTrail or if action-level information isn’t supported for a service.

    Note: The iam:PassRole action will not show up in CloudTrail and should be added manually if your CloudFormation template assigns an IAM role to a service (for example, when creating a Lambda function). A good rule of thumb is: If you see iam:CreateRole in the actions, you likely need to also allow iam:PassRole. An example of this is shown in Figure 3.

    Figure 3: Adding PassRole as an IAM action

    Figure 3: Adding PassRole as an IAM action

  4. When you’ve finished adding additional actions, choose Next.

Generated policies contain placeholders that need to be filled in with resource names, AWS Region names, and other variable data. The actual values for these placeholders should be determined based on the content of your CloudFormation template and the Region or Regions you plan to deploy the template to.

To replace placeholders with real values

  • In the generated policy, identify each of the Resource properties that use placeholders in the value, such as ${RoleNameWithPath} or ${Region}. Use your knowledge of the resources that your CloudFormation template creates to properly fill these in with real values.
    • ${RoleNameWithPath} is an example of a placeholder that reflects the name of a resource from your CloudFormation template. Replace the placeholder with the actual name of the resource.
    • ${Region} is an example of a placeholder that reflects where the resource is being deployed, which in this case is the AWS Region. Replace this with either the Region name (for example, us-east-1), or a wildcard character (*), depending on whether you want to restrict the policy to a specific Region or to all Regions, respectively.

For example, a statement from the policy generated earlier is shown following.

{
    "Effect": "Allow",
    "Action": [
        "lambda:CreateFunction",
        "lambda:DeleteFunction",
        "lambda:GetFunction",
        "lambda:GetFunctionCodeSigningConfig"
    ],
    "Resource": "arn:aws:lambda:${Region}:${Account}:function:${FunctionName}"
},

After substituting real values for the placeholders in Resource, it looks like the following.

{
    "Effect": "Allow",
    "Action": [
        "lambda:CreateFunction",
        "lambda:DeleteFunction",
        "lambda:GetFunction",
        "lambda:GetFunctionCodeSigningConfig"
    ],
    "Resource": "arn:aws:lambda:*:123456789012:function:MyLambdaFunction"
},

This statement allows the Lambda actions to be performed on a function named MyLambdaFunction in AWS account 123456789012 in any Region (*). Substitute the correct values for Region, Account, and FunctionName in your policy.

The IAM policy editor window will automatically identify security or other issues in the generated policy. Review and remediate the issues identified in the Security, Errors, Warnings, and Suggestions tabs across the bottom of the window.

To review and remediate policy issues

  1. Use the Errors tab at the bottom of the IAM policy editor window (powered by IAM Access Analyzer policy validation) to help identify any placeholders that still need to be replaced. Access Analyzer policy validation reviews the policy and provides findings that include security warnings, errors, general warnings, and suggestions for your policy. To find more information about the different checks, see Access Analyzer policy validation. An example of policy errors caused by placeholders still being present in the policy is shown in Figure 4.
    Figure 4: Errors identified in the generated policy

    Figure 4: Errors identified in the generated policy

  2. Use the Security tab at the bottom of the editor window to review any security warnings, such as passing a wildcard (*) resource with the iam:PassRole permission. Choose the Learn more link beside each warning for information about remediation. An example of a security warning related to PassRole is shown in Figure 5.
    Figure 5: Security warnings identified in the generated policy

    Figure 5: Security warnings identified in the generated policy

Remediate the PassRole With Star In Resource warning by modifying Resource in the iam:PassRole statement to list the Amazon Resource Name (ARN) of any roles that CloudFormation needs to pass to other services. Additionally, add a condition to restrict which service the role can be passed to. For example, to allow passing a role named MyLambdaRole to the Lambda service, the statement would look like the following.

        {
            "Effect": "Allow",
            "Action": [
                "iam:PassRole"
            ],
            "Resource": [
                "arn:aws:iam::123456789012:role/MyLambdaRole"
            ],
            "Condition": {
                "StringEquals": {
                    "iam:PassedToService": [
                        "lambda.amazonaws.com"
                    ]
                }
            }
        }

The generated policy can now be saved as an IAM policy.

To save the generated policy

  1. In the IAM policy editor window, choose Next.
  2. Enter a name for the policy and an optional description.
  3. Review the Summary section with the list of permissions in the policy.
  4. Enter optional tags in the Tags section.
  5. Choose Create and attach policy.

Test this policy by replacing the existing role policy with this newly generated policy. Then create and destroy the stack again so that the necessary permissions are granted. If the stack fails during creation or deletion, follow the steps to generate the policy again and make sure that the correct values are being used for any iam:PassRole statements.

Deploy the CloudFormation role and policy

Now that you have the least-privilege policy created, you can give this policy to the cloud administrator so that they can deploy the policy and CloudFormation service role into production.

To create a CloudFormation template that the cloud administrator can use

  1. Open the IAM console, choose Policies, and then use the search box to search for the policy you created. Select the policy name in the list.
  2. On the Permissions tab, make sure that the {}JSON button is activated. Select the policy document by highlighting from line 1 all the way to the last line in the policy, as shown in Figure 6.
    Figure 6: Highlighting the generated policy

    Figure 6: Highlighting the generated policy

  3. With the policy still highlighted, use your keyboard to copy the policy into the clipboard (Ctrl-C on Linux or Windows, Option-C on macOS).
  4. Paste the permissions policy JSON object into the following CloudFormation template, replacing the <POLICY-JSON-GOES-HERE> marker. Be sure to indent the left-most curly braces of the JSON object so that they are to the right of the PolicyDocument keyword.
    AWSTemplateFormatVersion: '2010-09-09'
    
    Parameters:
      PolicyName:
        Type: String
        Description: The name of the IAM policy that will be created
    
      RoleName:
        Type: String
        Description: The name of the IAM role that will be created
    
    Resources:
      CfnPolicy:
        Type: AWS::IAM::ManagedPolicy
        Properties:
          ManagedPolicyName: !Ref PolicyName
          Path: /
          PolicyDocument: >
            <POLICY-JSON-GOES-HERE>
    
      CfnRole:
        Type: AWS::IAM::Role
        Properties:
          RoleName: !Ref RoleName
          AssumeRolePolicyDocument:
            Version: '2012-10-17'
            Statement:
              - Action:
                - sts:AssumeRole
                Effect: Allow
                Principal:
                  Service:
                    - cloudformation.amazonaws.com
          ManagedPolicyArns:
            - !Ref CfnPolicy
          Path: /

    For example, after pasting the policy, the CfnPolicy resource in the template will look like the following.

    CfnPolicy:
        Type: AWS::IAM::ManagedPolicy
        Properties:
          ManagedPolicyName: !Ref PolicyName
          Path: /
          PolicyDocument: >
            {
                "Version": "2012-10-17",
                "Statement": [
                    {
                        "Effect": "Allow",
                        "Action": "ec2:DescribeNetworkInterfaces",
                        "Resource": [
                            "*"
                        ]
                    },
                    {
                        "Effect": "Allow",
                        "Action": [
                            "iam:AttachRolePolicy",
                            "iam:CreateRole",
                            "iam:DeleteRole",
                            "iam:DetachRolePolicy",
                            "iam:GetRole"
                        ],
                        "Resource": [
                            "arn:aws:iam::123456789012:role/MyLambdaRole"
                        ]
                    },
                    {
                        "Effect": "Allow",
                        "Action": [
                            "lambda:CreateFunction",
                            "lambda:DeleteFunction",
                            "lambda:GetFunction",
                            "lambda:GetFunctionCodeSigningConfig"
                        ],
                        "Resource": [
                            "arn:aws:lambda:*:123456789012:function:MyLambdaFunction"
                        ]
                    },
                    {
                        "Effect": "Allow",
                        "Action": [
                            "iam:PassRole"
                        ],
                        "Resource": [
                            "arn:aws:iam::123456789012:role/MyLambdaRole"
                        ],
                        "Condition": {
                            "StringEquals": {
                                "iam:PassedToService": [
                                    "lambda.amazonaws.com"
                                ]
                            }
                        }
                    }
                ]
            }

  5. Save the CloudFormation template and share it with the cloud administrator. They can use this template to create an IAM role and permissions policy that CloudFormation can use to deploy resources in the production account.

Note: Verify that in addition to having the necessary permissions to work with CloudFormation, your production identity also has permission to perform the iam:PassRole action with CloudFormation for the role that the preceding template creates.

As you continue to develop your stack, you will need to repeat the steps in the Use Access Analyzer to create a permissions policy and Deploy the CloudFormation role and policy sections of this post in order to make sure that the permissions policy remains up-to-date with the permissions required to deploy your stack.

Considerations

If your CloudFormation template uses custom resources that are backed by AWS Lambda, you should also run Access Analyzer on the IAM role that is created for the Lambda function in order to build an appropriate permissions policy for that role.

To generate a permissions policy for a Lambda service role

  1. Launch the stack in your development AWS account to create the Lamba function’s role.
  2. Make a note of the name of the role that was created.
  3. Destroy the stack in your development AWS account.
  4. Follow the instructions from the Use Access Analyzer to generate a fine-grained identity policy and Review the generated policy sections of this post to create the least-privilege policy for the role, substituting the Lambda function’s role name for CloudFormationDevExecRole.
  5. Build the resulting least-privilege policy into the CloudFormation template as the Lambda function’s permission policy.

Conclusion

IAM Access Analyzer helps generate fine-grained identity policies that you can use to grant CloudFormation the permissions it needs to create, update, and delete resources in your stack. By granting CloudFormation only the necessary permissions, you can incorporate the principle of least privilege, developers can deploy their stacks in production using reduced permissions, and cloud administrators can create guardrails for developers in production settings.

For additional information on applying the principle of least privilege to AWS CloudFormation, see How to implement the principle of least privilege with CloudFormation StackSets.

If you have feedback about this blog post, submit comments in the Comments section below. You can also start a new thread on AWS Identity and Access Management re:Post to get answers from the community.

Want more AWS Security news? Follow us on Twitter.

Author

Joel Knight

Joel is a Senior Consultant, Infrastructure Architecture, with AWS and is based in Calgary, Canada. When not wrangling infrastructure-as-code templates, Joel likes to spend time with his family and dabble in home automation.

Mathangi Ramesh

Mathangi Ramesh

Mathangi is the product manager for AWS Identity and Access Management. She enjoys talking to customers and working with data to solve problems. Outside of work, Mathangi is a fitness enthusiast and a Bharatanatyam dancer. She holds an MBA degree from Carnegie Mellon University.

Common streaming data enrichment patterns in Amazon Kinesis Data Analytics for Apache Flink

Post Syndicated from Ali Alemi original https://aws.amazon.com/blogs/big-data/common-streaming-data-enrichment-patterns-in-amazon-kinesis-data-analytics-for-apache-flink/

Stream data processing allows you to act on data in real time. Real-time data analytics can help you have on-time and optimized responses while improving overall customer experience.

Apache Flink is a distributed computation framework that allows for stateful real-time data processing. It provides a single set of APIs for building batch and streaming jobs, making it easy for developers to work with bounded and unbounded data. Apache Flink provides different levels of abstraction to cover a variety of event processing use cases.

Amazon Kinesis Data Analytics is an AWS service that provides a serverless infrastructure for running Apache Flink applications. This makes it easy for developers to build highly available, fault tolerant, and scalable Apache Flink applications without needing to become an expert in building, configuring, and maintaining Apache Flink clusters on AWS.

Data streaming workloads often require data in the stream to be enriched via external sources (such as databases or other data streams). For example, assume you are receiving coordinates data from a GPS device and need to understand how these coordinates map with physical geographic locations; you need to enrich it with geolocation data. You can use several approaches to enrich your real-time data in Kinesis Data Analytics depending on your use case and Apache Flink abstraction level. Each method has different effects on the throughput, network traffic, and CPU (or memory) utilization. In this post, we cover these approaches and discuss their benefits and drawbacks.

Data enrichment patterns

Data enrichment is a process that appends additional context and enhances the collected data. The additional data often is collected from a variety of sources. The format and the frequency of the data updates could range from once in a month to many times in a second. The following table shows a few examples of different sources, formats, and update frequency.

Data Format Update Frequency
IP address ranges by country CSV Once a month
Company organization chart JSON Twice a year
Machine names by ID CSV Once a day
Employee information Table (Relational database) A few times a day
Customer information Table (Non-relational database) A few times an hour
Customer orders Table (Relational database) Many times a second

Based on the use case, your data enrichment application may have different requirements in terms of latency, throughput, or other factors. The remainder of the post dives deeper into different patterns of data enrichment in Kinesis Data Analytics, which are listed in the following table with their key characteristics. You can choose the best pattern based on the trade-off of these characteristics.

Enrichment Pattern Latency Throughput Accuracy if Reference Data Changes Memory Utilization Complexity
Pre-load reference data in Apache Flink Task Manager memory Low High Low High Low
Partitioned pre-loading of reference data in Apache Flink state Low High Low Low Low
Periodic Partitioned pre-loading of reference data in Apache Flink state Low High Medium Low Medium
Per-record asynchronous lookup with unordered map Medium Medium High Low Low
Per-record asynchronous lookup from an external cache system Low or Medium (Depending on Cache storage and implementation) Medium High Low Medium
Enriching streams using the Table API Low High High Low – Medium (depending on the selected join operator) Low

Enrich streaming data by pre-loading the reference data

When the reference data is small in size and static in nature (for example, country data including country code and country name), it’s recommended to enrich your streaming data by pre-loading the reference data, which you can do in several ways.

To see the code implementation for pre-loading reference data in various ways, refer to the GitHub repo. Follow the instructions in the GitHub repository to run the code and understand the data model.

Pre-loading of reference data in Apache Flink Task Manager memory

The simplest and also fastest enrichment method is to load the enrichment data into each of the Apache Flink task managers’ on-heap memory. To implement this method, you create a new class by extending the RichFlatMapFunction abstract class. You define a global static variable in your class definition. The variable could be of any type, the only limitation is that it should extend java.io.Serializable—for example, java.util.HashMap. Within the open() method, you define a logic that loads the static data into your defined variable. The open() method is always called first, during the initialization of each task in Apache Flink’s task managers, which makes sure the whole reference data is loaded before the processing begins. You implement your processing logic by overriding the processElement() method. You implement your processing logic and access the reference data by its key from the defined global variable.

The following architecture diagram shows the full reference data load in each task slot of the task manager.

diagram shows the full reference data load in each task slot of the task manager.

This method has the following benefits:

  • Easy to implement
  • Low latency
  • Can support high throughput

However, it has the following disadvantages:

  • If the reference data is large in size, the Apache Flink task manager may run out of memory.
  • Reference data can become stale over a period of time.
  • Multiple copies of the same reference data are loaded in each task slot of the task manager.
  • Reference data should be small to fit in the memory allocated to a single task slot. In Kinesis Data Analytics, each Kinesis Processing Unit (KPU) has 4 GB of memory, out of which 3 GB can be used for heap memory. If ParallelismPerKPU in Kinesis Data Analytics is set to 1, one task slot runs in each task manager, and the task slot can use the whole 3 GB of heap memory. If ParallelismPerKPU is set to a value greater than 1, the 3 GB of heap memory is distributed across multiple task slots in the task manager. If you’re deploying Apache Flink in Amazon EMR or in a self-managed mode, you can tune taskmanager.memory.task.heap.size to increase the heap memory of a task manager.

Partitioned pre-loading of reference data in Apache Flink State

In this approach, the reference data is loaded and kept in the Apache Flink state store at the start of the Apache Flink application. To optimize the memory utilization, first the main data stream is divided by a specified field via the keyBy() operator across all task slots. Furthermore, only the portion of the reference data that corresponds to each task slot is loaded in the state store.

This is achieved in Apache Flink by creating the class PartitionPreLoadEnrichmentData, extending the RichFlatMapFunction abstract class. Within the open method, you override the ValueStateDescriptor method to create a state handle. In the referenced example, the descriptor is named locationRefData, the state key type is String, and the value type is Location. In this code, we use ValueState compared to MapState because we only hold the location reference data for a particular key. For example, when we query Amazon S3 to get the location reference data, we query for the specific role and get a particular location as a value.

In Apache Flink, ValueState is used to hold a specific value for a key, whereas MapState is used to hold a combination of key-value pairs.

This technique is useful when you have a large static dataset that is difficult to fit in memory as a whole for each partition.

The following architecture diagram shows the load of reference data for the specific key for each partition of the stream.

diagram shows the load of reference data for the specific key for each partition of the stream.

For example, our reference data in the sample GitHub code has roles which are mapped to each building. Because the stream is partitioned by roles, only the specific building information per role is required to be loaded for each partition as the reference data.

This method has the following benefits:

  • Low latency.
  • Can support high throughput.
  • Reference data for specific partition is loaded in the keyed state.
  • In Kinesis Data Analytics, the default state store configured is RocksDB. RocksDB can utilize a significant portion of 1 GB of managed memory and 50 GB of disk space provided by each KPU. This provides enough room for the reference data to grow.

However, it has the following disadvantages:

  • Reference data can become stale over a period of time

Periodic partitioned pre-loading of reference data in Apache Flink State

This approach is a fine-tune of the previous technique, where each partitioned reference data is reloaded on a periodic basis to refresh the reference data. This is useful if your reference data changes occasionally.

The following architecture diagram shows the periodic load of reference data for the specific key for each partition of the stream.

diagram shows the periodic load of reference data for the specific key for each partition of the stream.

In this approach, the class PeriodicPerPartitionLoadEnrichmentData is created, extending the KeyedProcessFunction class. Similar to the previous pattern, in the context of the GitHub example, ValueState is recommended here because each partition only loads a single value for the key. In the same way as mentioned earlier, in the open method, you define the ValueStateDescriptor to handle the value state and define a runtime context to access the state.

Within the processElement method, load the value state and attach the reference data (in the referenced GitHub example, buildingNo to the customer data). Also register a timer service to be invoked when the processing time passes the given time. In the sample code, the timer service is scheduled to be invoked periodically (for example, every 60 seconds). In the onTimer method, update the state by making a call to reload the reference data for the specific role.

This method has the following benefits:

  • Low latency.
  • Can support high throughput.
  • Reference data for specific partitions is loaded in the keyed state.
  • Reference data is refreshed periodically.
  • In Kinesis Data Analytics, the default state store configured is RocksDB. Also, 50 GB of disk space provided by each KPU. This provides enough room for the reference data to grow.

However, it has the following disadvantages:

  • If the reference data changes frequently, the application still has stale data depending on how frequently the state is reloaded
  • The application can face load spikes during reload of reference data

Enrich streaming data using per-record lookup

Although pre-loading of reference data provides low latency and high throughput, it may not be suitable for certain types of workloads, such as the following:

  • Reference data updates with high frequency
  • Apache Flink needs to make an external call to compute the business logic
  • Accuracy of the output is important and the application shouldn’t use stale data

Normally, for these types of use cases, developers trade-off high throughput and low latency for data accuracy. In this section, you learn about a few of common implementations for per-record data enrichment and their benefits and disadvantages.

Per-record asynchronous lookup with unordered map

In a synchronous per-record lookup implementation, the Apache Flink application has to wait until it receives the response after sending every request. This causes the processor to stay idle for a significant period of processing time. Instead, the application can send a request for other elements in the stream while it waits for the response for the first element. This way, the wait time is amortized across multiple requests and therefore it increases the process throughput. Apache Flink provides asynchronous I/O for external data access. While using this pattern, you have to decide between unorderedWait (where it emits the result to the next operator as soon as the response is received, disregarding the order of the element on the stream) and orderedWait (where it waits until all inflight I/O operations complete, then sends the results to the next operator in the same order as original elements were placed on the stream). Usually, when downstream consumers disregard the order of the elements in the stream, unorderedWait provides better throughput and less idle time. Visit Enrich your data stream asynchronously using Kinesis Data Analytics for Apache Flink to learn more about this pattern.

The following architecture diagram shows how an Apache Flink application on Kinesis Data Analytics does asynchronous calls to an external database engine (for example Amazon DynamoDB) for every event in the main stream.

diagram shows how an Apache Flink application on Kinesis Data Analytics does asynchronous calls to an external database engine (for example Amazon DynamoDB) for every event in the main stream.

This method has the following benefits:

  • Still reasonably simple and easy to implement
  • Reads the most up-to-date reference data

However, it has the following disadvantages:

  • It generates a heavy read load for the external system (for example, a database engine or an external API) that hosts the reference data
  • Overall, it might not be suitable for systems that require high throughput with low latency

Per-record asynchronous lookup from an external cache system

A way to enhance the previous pattern is to use a cache system to enhance the read time for every lookup I/O call. You can use Amazon ElastiCache for caching, which accelerates application and database performance, or as a primary data store for use cases that don’t require durability like session stores, gaming leaderboards, streaming, and analytics. ElastiCache is compatible with Redis and Memcached.

For this pattern to work, you must implement a caching pattern for populating data in the cache storage. You can choose between a proactive or reactive approach depending your application objectives and latency requirements. For more information, refer to Caching patterns.

The following architecture diagram shows how an Apache Flink application calls to read the reference data from an external cache storage (for example, Amazon ElastiCache for Redis). Data changes must be replicated from the main database (for example, Amazon Aurora) to the cache storage by implementing one of the caching patterns.

diagram shows how an Apache Flink application calls to read the reference data from an external cache storage (for example, Amazon ElastiCache for Redis). Data changes must be replicated from the main database (for example, Amazon Aurora) to the cache storage by implementing one of the caching patterns.

Implementation for this data enrichment pattern is similar to the per-record asynchronous lookup pattern; the only difference is that the Apache Flink application makes a connection to the cache storage, instead of connecting to the primary database.

This method has the following benefits:

  • Better throughput because caching can accelerate application and database performance
  • Protects the primary data source from the read traffic created by the stream processing application
  • Can provide lower read latency for every lookup call
  • Overall, might not be suitable for medium to high throughput systems that want to improve data freshness

However, it has the following disadvantages:

  • Additional complexity of implementing a cache pattern for populating and syncing the data between the primary database and the cache storage
  • There is a chance for the Apache Flink stream processing application to read stale reference data depending on what caching pattern is implemented
  • Depending on the chosen cache pattern (proactive or reactive), the response time for each enrichment I/O may differ, therefore the overall processing time of the stream could be unpredictable

Alternatively, you can avoid these complexities by using the Apache Flink JDBC connector for Flink SQL APIs. We discuss enrichment stream data via Flink SQL APIs in more detail later in this post.

Enrich stream data via another stream

In this pattern, the data in the main stream is enriched with the reference data in another data stream. This pattern is good for use cases in which the reference data is updated frequently and it’s possible to perform change data capture (CDC) and publish the events to a data streaming service such as Apache Kafka or Amazon Kinesis Data Streams. This pattern is useful in the following use cases, for example:

  • Customer purchase orders are published to a Kinesis data stream, and then join with customer billing information in a DynamoDB stream
  • Data events captured from IoT devices should enrich with reference data in a table in Amazon Relational Database Service (Amazon RDS)
  • Network log events should enrich with the machine name on the source (and the destination) IP addresses

The following architecture diagram shows how an Apache Flink application on Kinesis Data Analytics joins data in the main stream with the CDC data in a DynamoDB stream.

diagram shows how an Apache Flink application on Kinesis Data Analytics joins data in the main stream with the CDC data in a DynamoDB stream.

To enrich streaming data from another stream, we use a common stream to stream join patterns, which we explain in the following sections.

Enrich streams using the Table API

Apache Flink Table APIs provide higher abstraction for working with data events. With Table APIs, you can define your data stream as a table and attach the data schema to it.

In this pattern, you define tables for each data stream and then join those tables to achieve the data enrichment goals. Apache Flink Table APIs support different types of join conditions, like inner join and outer join. However, you want to avoid those if you’re dealing with unbounded streams because those are resource intensive. To limit the resource utilization and run joins effectively, you should use either interval or temporal joins. An interval join requires one equi-join predicate and a join condition that bounds the time on both sides. To better understand how to implement an interval join, refer to Get started with Apache Flink SQL APIs in Kinesis Data Analytics Studio.

Compared to interval joins, temporal table joins don’t work with a time period within which different versions of a record are kept. Records from the main stream are always joined with the corresponding version of the reference data at the time specified by the watermark. Therefore, fewer versions of the reference data remain in the state.

Note that the reference data may or may not have a time element associated with it. If it doesn’t, you may need to add a processing time element for the join with the time-based stream.

In the following example code snippet, the update_time column is added to the currency_rates reference table from the change data capture metadata such as Debezium. Furthermore, it’s used to define a watermark strategy for the table.

CREATE TABLE currency_rates (
    currency STRING,
    conversion_rate DECIMAL(32, 2),
    update_time TIMESTAMP(3) METADATA FROM `values.source.timestamp` VIRTUAL,
        WATERMARK FOR update_time AS update_time,
    PRIMARY KEY(currency) NOT ENFORCED
) WITH (
   'connector' = 'kafka',
   'value.format' = 'debezium-json',
   /* ... */
);

This method has the following benefits:
  • Easy to implement
  • Low latency
  • Can support high throughput when reference data is a data stream

SQL APIs provide higher abstractions over how the data is processed. For more complex logic around how the join operator should process, we recommend you always start with SQL APIs first and use DataStream APIs if you really need to.

Conclusion

In this post, we demonstrated different data enrichment patterns in Kinesis Data Analytics. You can use these patterns and find the one that addresses your needs and quickly develop a stream processing application.

For further reading on Kinesis Data Analytics, visit the official product page.


About the Authors

About the author Ali AlemiAli Alemi is a Streaming Specialist Solutions Architect at AWS. Ali advises AWS customers with architectural best practices and helps them design real-time analytics data systems that are reliable, secure, efficient, and cost-effective. He works backward from customers’ use cases and designs data solutions to solve their business problems. Prior to joining AWS, Ali supported several public sector customers and AWS consulting partners in their application modernization journey and migration to the cloud.

About the author Subham RakshitSubham Rakshit is a Streaming Specialist Solutions Architect for Analytics at AWS based in the UK. He works with customers to design and build search and streaming data platforms that help them achieve their business objective. Outside of work, he enjoys spending time solving jigsaw puzzles with his daughter.

About the author Dr. Sam MokhtariDr. Sam Mokhtari is a Senior Solutions Architect in AWS. His main area of depth is data and analytics, and he has published more than 30 influential articles in this field. He is also a respected data and analytics advisor who led several large-scale implementation projects across different industries, including energy, health, telecom, and transport.

Build, Test and Deploy ETL solutions using AWS Glue and AWS CDK based CI/CD pipelines

Post Syndicated from Puneet Babbar original https://aws.amazon.com/blogs/big-data/build-test-and-deploy-etl-solutions-using-aws-glue-and-aws-cdk-based-ci-cd-pipelines/

AWS Glue is a serverless data integration service that makes it easy to discover, prepare, and combine data for analytics, machine learning (ML), and application development. It’s serverless, so there’s no infrastructure to set up or manage.

This post provides a step-by-step guide to build a continuous integration and continuous delivery (CI/CD) pipeline using AWS CodeCommit, AWS CodeBuild, and AWS CodePipeline to define, test, provision, and manage changes of AWS Glue based data pipelines using the AWS Cloud Development Kit (AWS CDK).

The AWS CDK is an open-source software development framework for defining cloud infrastructure as code using familiar programming languages and provisioning it through AWS CloudFormation. It provides you with high-level components called constructs that preconfigure cloud resources with proven defaults, cutting down boilerplate code and allowing for faster development in a safe, repeatable manner.

Solution overview

The solution constructs a CI/CD pipeline with multiple stages. The CI/CD pipeline constructs a data pipeline using COVID-19 Harmonized Data managed by Talend / Stitch. The data pipeline crawls the datasets provided by neherlab from the public Amazon Simple Storage Service (Amazon S3) bucket, exposes the public datasets in the AWS Glue Data Catalog so they’re available for SQL queries using Amazon Athena, performs ETL (extract, transform, and load) transformations to denormalize the datasets to a table, and makes the denormalized table available in the Data Catalog.

The solution is designed as follows:

  • A data engineer deploys the initial solution. The solution creates two stacks:
    • cdk-covid19-glue-stack-pipeline – This stack creates the CI/CD infrastructure as shown in the architectural diagram (labeled Tool Chain).
    • cdk-covid19-glue-stack – The cdk-covid19-glue-stack-pipeline stack deploys the cdk-covid19-glue-stack stack to create the AWS Glue based data pipeline as shown in the diagram (labeled ETL).
  • The data engineer makes changes on cdk-covid19-glue-stack (when a change in the ETL application is required).
  • The data engineer pushes the change to a CodeCommit repository (generated in the cdk-covid19-glue-stack-pipeline stack).
  • The pipeline is automatically triggered by the push, and deploys and updates all the resources in the cdk-covid19-glue-stack stack.

At the time of publishing of this post, the AWS CDK has two versions of the AWS Glue module: @aws-cdk/aws-glue and @aws-cdk/aws-glue-alpha, containing L1 constructs and L2 constructs, respectively. At this time, the @aws-cdk/aws-glue-alpha module is still in an experimental stage. We use the stable @aws-cdk/aws-glue module for the purpose of this post.

The following diagram shows all the components in the solution.

BDB-2467-architecture-diagram

Figure 1 – Architecture diagram

The data pipeline consists of an AWS Glue workflow, triggers, jobs, and crawlers. The AWS Glue job uses an AWS Identity and Access Management (IAM) role with appropriate permissions to read and write data to an S3 bucket. AWS Glue crawlers crawl the data available in the S3 bucket, update the AWS Glue Data Catalog with the metadata, and create tables. You can run SQL queries on these tables using Athena. For ease of identification, we followed the naming convention for triggers to start with t_*, crawlers with c_*, and jobs with j_*. A CI/CD pipeline based on CodeCommit, CodeBuild, and CodePipeline builds, tests and deploys the solution. The complete infrastructure is created using the AWS CDK.

The following table lists the tables created by this solution that you can query using Athena.

Table Name Description Dataset Location Access Location
neherlab_case_counts Total number of cases s3://covid19-harmonized-dataset/covid19tos3/neherlab_case_counts/ Read Public
neherlab_country_codes Country code s3://covid19-harmonized-dataset/covid19tos3/neherlab_country_codes/ Read Public
neherlab_icu_capacity Intensive Care Unit (ICU) capacity s3://covid19-harmonized-dataset/covid19tos3/neherlab_icu_capacity/ Read Public
neherlab_population Population s3://covid19-harmonized-dataset/covid19tos3/neherlab_population/ Read Public
neherla_denormalized Denormalized table that combines all the preceding tables into one table s3://<your-S3-bucket-name>/neherlab_denormalized Read/Write Reader’s AWS account

Anatomy of the AWS CDK application

In this section, we visit key concepts and anatomy of the AWS CDK application, review the important sections of the code, and discuss how the AWS CDK reduces complexity of the solution as compared to AWS CloudFormation.

An AWS CDK app defines one or more stacks. Stacks (equivalent to CloudFormation stacks) contain constructs, each of which defines one or more concrete AWS resources. Each stack in the AWS CDK app is associated with an environment. An environment is the target AWS account ID and Region into which the stack is intended to be deployed.

In the AWS CDK, the top-most object is the AWS CDK app, which contains multiple stacks vs. the top-level stack in AWS CloudFormation. Given this difference, you can define all the stacks required for the application in the AWS CDK app. In AWS Glue based ETL projects, developers need to define multiple data pipelines by subject area or business logic. In AWS CloudFormation, we can achieve this by writing multiple CloudFormation stacks and often deploy them independently. In some cases, developers write nested stacks, which over time becomes very large and complicated to maintain. In the AWS CDK, all stacks are deployed from the AWS CDK app, increasing modularity of the code and allowing developers to identify all the data pipelines associated with an application easily.

Our AWS CDK application consists of four main files:

  • app.py – This is the AWS CDK app and the entry point for the AWS CDK application
  • pipeline.py – The pipeline.py stack, invoked by app.py, creates the CI/CD pipeline
  • etl/infrastructure.py – The etl/infrastructure.py stack, invoked by pipeline.py, creates the AWS Glue based data pipeline
  • default-config.yaml – The configuration file contains the AWS account ID and Region.

The AWS CDK application reads the configuration from the default-config.yaml file, sets the environment information (AWS account ID and Region), and invokes the PipelineCDKStack class in pipeline.py. Let’s break down the preceding line and discuss the benefits of this design.

For every application, we want to deploy in pre-production environments and a production environment. The application in all the environments will have different configurations, such as the size of the deployed resources. In the AWS CDK, every stack has a property called env, which defines the stack’s target environment. This property receives the AWS account ID and Region for the given stack.

Lines 26–34 in app.py show the aforementioned details:

# Initiating the CodePipeline stack
PipelineCDKStack(
app,
"PipelineCDKStack",
config=config,
env=env,
stack_name=config["codepipeline"]["pipelineStackName"]
)

The env=env line sets the target AWS account ID and Region for PipelieCDKStack. This design allows an AWS CDK app to be deployed in multiple environments at once and increases the parity of the application in all environment. For our example, if we want to deploy PipelineCDKStack in multiple environments, such as development, test, and production, we simply call the PipelineCDKStack stack after populating the env variable appropriately with the target AWS account ID and Region. This was more difficult in AWS CloudFormation, where developers usually needed to deploy the stack for each environment individually. The AWS CDK also provides features to pass the stage at the command line. We look into this option and usage in the later section.

Coming back to the AWS CDK application, the PipelineCDKStack class in pipeline.py uses the aws_cdk.pipeline construct library to create continuous delivery of AWS CDK applications. The AWS CDK provides multiple opinionated construct libraries like aws_cdk.pipeline to reduce boilerplate code from an application. The pipeline.py file creates the CodeCommit repository, populates the repository with the sample code, and creates a pipeline with the necessary AWS CDK stages for CodePipeline to run the CdkGlueBlogStack class from the etl/infrastructure.py file.

Line 99 in pipeline.py invokes the CdkGlueBlogStack class.

The CdkGlueBlogStack class in etl/infrastructure.py creates the crawlers, jobs, database, triggers, and workflow to provision the AWS Glue based data pipeline.

Refer to line 539 for creating a crawler using the CfnCrawler construct, line 564 for creating jobs using the CfnJob construct, and line 168 for creating the workflow using the CfnWorkflow construct. We use the CfnTrigger construct to stitch together multiple triggers to create the workflow. The AWS CDK L1 constructs expose all the available AWS CloudFormation resources and entities using methods from popular programing languages. This allows developers to use popular programing languages to provision resources instead of working with JSON or YAML files in AWS CloudFormation.

Refer to etl/infrastructure.py for additional details.

Walkthrough of the CI/CD pipeline

In this section, we walk through the various stages of the CI/CD pipeline. Refer to CDK Pipelines: Continuous delivery for AWS CDK applications for additional information.

  • Source – This stage fetches the source of the AWS CDK app from the CodeCommit repo and triggers the pipeline every time a new commit is made.
  • Build – This stage compiles the code (if necessary), runs the tests, and performs a cdk synth. The output of the step is a cloud assembly, which is used to perform all the actions in the rest of the pipeline. The pytest is run using the amazon/aws-glue-libs:glue_libs_3.0.0_image_01 Docker image. This image comes with all the required libraries to run tests for AWS Glue version 3.0 jobs using a Docker container. Refer to Develop and test AWS Glue version 3.0 jobs locally using a Docker container for additional information.
  • UpdatePipeline – This stage modifies the pipeline if necessary. For example, if the code is updated to add a new deployment stage to the pipeline or add a new asset to your application, the pipeline is automatically updated to reflect the changes.
  • Assets – This stage prepares and publishes all AWS CDK assets of the app to Amazon S3 and all Docker images to Amazon Elastic Container Registry (Amazon ECR). When the AWS CDK deploys an app that references assets (either directly by the app code or through a library), the AWS CDK CLI first prepares and publishes the assets to Amazon S3 using a CodeBuild job. This AWS Glue solution creates four assets.
  • CDKGlueStage – This stage deploys the assets to the AWS account. In this case, the pipeline deploys the AWS CDK template etl/infrastructure.py to create all the AWS Glue artifacts.

Code

The code can be found at AWS Samples on GitHub.

Prerequisites

This post assumes you have the following:

Deploy the solution

To deploy the solution, complete the following steps:

  • Download the source code from the AWS Samples GitHub repository to the client machine:
$ git clone [email protected]:aws-samples/aws-glue-cdk-cicd.git
  • Create the virtual environment:
$ cd aws-glue-cdk-cicd 
$ python3 -m venv .venv

This step creates a Python virtual environment specific to the project on the client machine. We use a virtual environment in order to isolate the Python environment for this project and not install software globally.

  • Activate the virtual environment according to your OS:
    • On MacOS and Linux, use the following code:
$ source .venv/bin/activate
    • On a Windows platform, use the following code:
% .venv\Scripts\activate.bat

After this step, the subsequent steps run within the bounds of the virtual environment on the client machine and interact with the AWS account as needed.

  • Install the required dependencies described in requirements.txt to the virtual environment:
$ pip install -r requirements.txt
  • Bootstrap the AWS CDK app:
cdk bootstrap

This step populates a given environment (AWS account ID and Region) with resources required by the AWS CDK to perform deployments into the environment. Refer to Bootstrapping for additional information. At this step, you can see the CloudFormation stack CDKToolkit on the AWS CloudFormation console.

  • Synthesize the CloudFormation template for the specified stacks:
$ cdk synth # optional if not default (-c stage=default)

You can verify the CloudFormation templates to identify the resources to be deployed in the next step.

  • Deploy the AWS resources (CI/CD pipeline and AWS Glue based data pipeline):
$ cdk deploy # optional if not default (-c stage=default)

At this step, you can see CloudFormation stacks cdk-covid19-glue-stack-pipeline and cdk-covid19-glue-stack on the AWS CloudFormation console. The cdk-covid19-glue-stack-pipeline stack gets deployed first, which in turn deploys cdk-covid19-glue-stack to create the AWS Glue pipeline.

Verify the solution

When all the previous steps are complete, you can check for the created artifacts.

CloudFormation stacks

You can confirm the existence of the stacks on the AWS CloudFormation console. As shown in the following screenshot, the CloudFormation stacks have been created and deployed by cdk bootstrap and cdk deploy.

BDB-2467-cloudformation-stacks

Figure 2 – AWS CloudFormation stacks

CodePipeline pipeline

On the CodePipeline console, check for the cdk-covid19-glue pipeline.

BDB-2467-code-pipeline-summary

Figure 3 – AWS CodePipeline summary view

You can open the pipeline for a detailed view.

BDB-2467-code-pipeline-detailed

Figure 4 – AWS CodePipeline detailed view

AWS Glue workflow

To validate the AWS Glue workflow and its components, complete the following steps:

  • On the AWS Glue console, choose Workflows in the navigation pane.
  • Confirm the presence of the Covid_19 workflow.
BDB-2467-glue-workflow-summary

Figure 5 – AWS Glue Workflow summary view

You can select the workflow for a detailed view.

BDB-2467-glue-workflow-detailed

Figure 6 – AWS Glue Workflow detailed view

  • Choose Triggers in the navigation pane and check for the presence of seven t-* triggers.
BDB-2467-glue-triggers

Figure 7 – AWS Glue Triggers

  • Choose Jobs in the navigation pane and check for the presence of three j_* jobs.
BDB-2467-glue-jobs

Figure 8 – AWS Glue Jobs

The jobs perform the following tasks:

    • etlScripts/j_emit_start_event.py – A Python job that starts the workflow and creates the event
    • etlScripts/j_neherlab_denorm.py – A Spark ETL job to transform the data and create a denormalized view by combining all the base data together in Parquet format
    • etlScripts/j_emit_ended_event.py – A Python job that ends the workflow and creates the specific event
  • Choose Crawlers in the navigation pane and check for the presence of five neherlab-* crawlers.
BDB-2467-glue-crawlers

Figure 9 – AWS Glue Crawlers

Execute the solution

  • The solution creates a scheduled AWS Glue workflow which runs at 10:00 AM UTC on day 1 of every month. A scheduled workflow can also be triggered on-demand. For the purpose of this post, we will execute the workflow on-demand using the following command from the AWS CLI. If the workflow is successfully started, the command returns the run ID. For instructions on how to run and monitor a workflow in Amazon Glue, refer to Running and monitoring a workflow in Amazon Glue.
aws glue start-workflow-run --name Covid_19
  • You can verify the status of a workflow run by execution the following command from the AWS CLI. Please use the run ID returned from the above command. A successfully executed Covid_19 workflow should return a value of 7 for SucceededActions  and 0 for FailedActions.
aws glue get-workflow-run --name Covid_19 --run-id <run_ID>
  • A sample output of the above command is provided below.
{
"Run": {
"Name": "Covid_19",
"WorkflowRunId": "wr_c8855e82ab42b2455b0e00cf3f12c81f957447abd55a573c087e717f54a4e8be",
"WorkflowRunProperties": {},
"StartedOn": "2022-09-20T22:13:40.500000-04:00",
"CompletedOn": "2022-09-20T22:21:39.545000-04:00",
"Status": "COMPLETED",
"Statistics": {
"TotalActions": 7,
"TimeoutActions": 0,
"FailedActions": 0,
"StoppedActions": 0,
"SucceededActions": 7,
"RunningActions": 0
}
}
}
  • (Optional) To verify the status of the workflow run using AWS Glue console, choose Workflows in the navigation pane, select the Covid_19 workflow, click on the History tab, select the latest row and click on View run details. A successfully completed workflow is marked in green check marks. Please refer to the Legend section in the below screenshot for additional statuses.

    BDB-2467-glue-workflow-success

    Figure 10 – AWS Glue Workflow successful run

Check the output

  • When the workflow is complete, navigate to the Athena console to check the successful creation and population of neherlab_denormalized table. You can run SQL queries against all 5 tables to check the data. A sample SQL query is provided below.
SELECT "country", "location", "date", "cases", "deaths", "ecdc-countries",
        "acute_care", "acute_care_per_100K", "critical_care", "critical_care_per_100K" 
FROM "AwsDataCatalog"."covid19db"."neherlab_denormalized"
limit 10;
BDB-2467-athena

Figure 10 – Amazon Athena

Clean up

To clean up the resources created in this post, delete the AWS CloudFormation stacks in the following order:

  • cdk-covid19-glue-stack
  • cdk-covid19-glue-stack-pipeline
  • CDKToolkit

Then delete all associated S3 buckets:

  • cdk-covid19-glue-stack-p-pipelineartifactsbucketa-*
  • cdk-*-assets-<AWS_ACCOUNT_ID>-<AWS_REGION>
  • covid19-glue-config-<AWS_ACCOUNT_ID>-<AWS_REGION>
  • neherlab-denormalized-dataset-<AWS_ACCOUNT_ID>-<AWS_REGION>

Conclusion

In this post, we demonstrated a step-by-step guide to define, test, provision, and manage changes to an AWS Glue based ETL solution using the AWS CDK. We used an AWS Glue example, which has all the components to build a complex ETL solution, and demonstrated how to integrate individual AWS Glue components into a frictionless CI/CD pipeline. We encourage you to use this post and associated code as the starting point to build your own CI/CD pipelines for AWS Glue based ETL solutions.


About the authors

Puneet Babbar is a Data Architect at AWS, specialized in big data and AI/ML. He is passionate about building products, in particular products that help customers get more out of their data. During his spare time, he loves to spend time with his family and engage in outdoor activities including hiking, running, and skating. Connect with him on LinkedIn.

Suvojit Dasgupta is a Sr. Lakehouse Architect at Amazon Web Services. He works with customers to design and build data solutions on AWS.

Justin Kuskowski is a Principal DevOps Consultant at Amazon Web Services. He works directly with AWS customers to provide guidance and technical assistance around improving their value stream, which ultimately reduces product time to market and leads to a better customer experience. Outside of work, Justin enjoys traveling the country to watch his two kids play soccer and spending time with his family and friends wake surfing on the lakes in Michigan.

Ensure availability of your data using cross-cluster replication with Amazon OpenSearch Service

Post Syndicated from Prashant Agrawal original https://aws.amazon.com/blogs/big-data/ensure-availability-of-your-data-using-cross-cluster-replication-with-amazon-opensearch-service/

Amazon OpenSearch Service is a fully managed service that you can use to deploy and operate OpenSearch and legacy Elasticsearch clusters, cost-effectively, at scale in the AWS Cloud. The service makes it easy for you to perform interactive log analytics, real-time application monitoring, website search, and more by offering the latest versions of OpenSearch, suppor300t for 19 versions of Elasticsearch (1.5 to 7.10 versions), and visualization capabilities powered by OpenSearch Dashboards and Kibana (1.5 to 7.10 versions).

OpenSearch Service announced the support of cross-cluster replication on October 5, 2021. With cross-cluster replication for OpenSearch Service, you can replicate indices at low latency from one domain to another in the same or different AWS Regions without needing additional technologies. Cross-cluster replication provides sequential consistency while continuously copying data from the leader index to the follower index. Sequential consistency ensures the leader and the follower return the same result set after operations are applied on the indices in the same order. Cross-cluster replication is designed to minimize delivery lag between the leader and the follower index. Typical delivery times are less than a minute. You can continuously monitor the replication status via APIs. Additionally, if you have indices that follow an index pattern, you can create automatic follow rules and they will be automatically replicated.

In this post, we show you how to use these features to ensure availability of your data using cross-cluster replication with OpenSearch Service.

Benefits of cross-cluster replication

Cross-cluster replication is helpful for use cases regarding data proximity, disaster recovery, and multi-cluster patterns.

Data proximity helps reduce latency and response time by bringing the data closer to your user or application server. For example, you can replicate data from one Region, us-west-2 (leader), to multiple Regions across the globe acting as followers, eu-west-1, ap-south-1, ca-central-1, and so on, where the follower can poll the leader to sync new or updated data in the leader. In the following diagram, data is replicated from one production cluster in us-west-2 to multiple locally available clusters near the user or application.

In the case of disaster recovery, you can have one or more follower clusters in the same Region or different Regions, and as long as you have one active cluster, you can serve read requests to the users. In the following diagram, data is replicated from one production cluster to two different disaster recovery clusters.

As of today, cross-cluster replication supports active/active read and active/passive write, as shown in the following diagram.

With this implementation, you can solve the problem of read if your leader goes down, but what about write? As of this writing, cross-cluster replication doesn’t support any kind of failover mechanism to make your follower the leader. In this scenario, you might need to do some extra housekeeping to make your follower domain become the leader and start accepting write requests. This post shows the steps to set up cross-cluster replication and minimize downtime by advancing your follower to be leader.

Set up cross-cluster replication

To set up cross-cluster replication, complete the following steps:

  1. Create two clusters across two Regions, for example leader-east (leader) and follower-west (follower).
    Cross-cluster replication works on a pull model, where the user creates an outbound connection at the follower domain, and the follower keeps polling the leader to sync with new or updated documents for an index.
  2. Go to the follower domain (follower-west) and create a request for an outbound connection. Specify the alias for this connection as follower-west.
  3. Go to the leader domain, locate the inbound connection, and approve the incoming connection from follower-west.
  4. Edit the security configuration and add the following access policy to allow ESCrossClusterGet in the leader domain, which is leader-east:
    {
          "Effect": "Allow",
          "Principal": {
            "AWS": "*"
          },
          "Action": "es:ESCrossClusterGet",
          "Resource": "arn:aws:es:us-east-2:xxx-accountidxx:domain/leader-east"
    }

  5. Create a leader index (on the leader domain), or ignore this step if you already have an index to replicate:
    PUT catalog

  6. Navigate to OpenSearch Dashboards for the follower-west domain.
  7. On the Dev Tools tab, run the following command (or use curl to connect directly):
    PUT _plugins/_replication/catalog-rep/_start
        {
           "leader_alias": "ccr-for-west",
           "leader_index": "catalog",
            "use_roles":{
              "leader_cluster_role": "cross_cluster_replication_leader_full_access",
              "follower_cluster_role": "cross_cluster_replication_follower_full_access"
           }
        }

  8. Confirm the replication:
    GET _plugins/_replication/catalog-rep/_status

  9. Index some documents in the leader index; the following command indexes documents to the catalog index with id:1:
    POST catalog/_doc
    {
      "id": "1"
    }

  10. Now go to follower domain and confirm the documents are replicated by running the following search query:
    Request:
    GET catalog/_search
    
    Response:
    {
    ...
       "hits" : [
          {
            "_index" : "catalog",
            "_type" : "_doc",
            "_id" : "hg3YsYIBcxKtCcyhNyp4",
            "_score" : 1.0,
            "_source" : {
              "id" : "1"
            }
          }
        ]
      }
    }

Pause and stop the replication

When your replication is running, you can use these steps to pause and stop the replication.

You can use the following API to pause the replication, for example, while you debug an issue or load on the leader. Make sure to add an empty body with the request.

POST _plugins/_replication/catalog-rep/_pause
    {}

If you pause the replication, you must resume it within 12 hours. If you fail to resume it within 12 hours, you must stop replication, delete the follower index, and restart replication of the leader.

Stopping the replication makes the follower index unfollow the leader and become a standard index. Use the following code to stop replication:

POST _plugins/_replication/catalog-rep/_stop
    {}    

Note that you can’t restart replication to this index after you stop it.

Auto-follow

You can define a set of replication rules against a single leader domain that automatically replicates indexes that match a specified pattern.

When an index on the leader domain matches one of the patterns (for example, logstash-*), a matching follower index is created on the follower domain. The following code is an example replication rule for auto-follow:

POST _plugins/_replication/_autofollow
    {
      "leader_alias" : "follower-west",
       "name": "rule-name",
       "pattern": "logstash-*",
      "use_roles":{
          "leader_cluster_role": "cross_cluster_replication_leader_full_access",
          "follower_cluster_role": "cross_cluster_replication_follower_full_access"
       }
    }

Delete the replication rule to stop replicating new indexes that match the pattern:

DELETE _plugins/_replication/_autofollow
    {
       "leader_alias" : "follower-west",
       "name": "rule-name"
    } 

Monitor cross-cluster replication metrics

OpenSearch Service provides metrics to monitor cross-cluster replication that can help you know the status of the replication along with its performance. For example, ReplicationRate can help you understand the average rate of replication operations per second, and ReplicationNumSyncingIndices can help you know the number of indexes with the replication status SYNCING. For more details about all the metrics provided by OpenSearch Service for cross-cluster replication, refer to Cross-cluster replication metrics.

Recovering from failure

At this point, we have two OpenSearch Service domains running in two different Regions. Let’s consider a scenario in which some disastrous event happens in the Region with your leader domain and the leader goes down. At this point, you can still serve read traffic from the follower domain, but no additional updates are applied because the follower can’t read from the leader. In this scenario, you can use the following steps to advance your follower to be leader:

  1. Go to your follower domain and stop replication:
    POST _plugins/_replication/catalog-rep/_stop
    {}

    After replication stops on the follower domain, your follower index acts as a normal index.

  2. At this point, you can start sending write traffic to the follower.

This way, you can advance your follower domain to become leader and route your write traffic to the follower, which helps avoid the data loss for new sets of changes and updates.

Keep in mind that there is a small lag (less than a minute) between the leader-follower sync. Additionally, there could be small amount of data loss in the follower domain that was indexed to the leader and not synced to the follower (especially when the leader went down and the follower didn’t have a chance to poll the changes and updates). For this scenario, you should have a mechanism in your ingest pipeline to replay the data to the follower when your leader goes down.

Now, what if the leader comes back online after a certain period of time. At this time, you can’t start the replication again from your follower to sync the delta to the leader. Even if you try to set up the replication from follower to leader, it will fail with an error. After you have used an index for a leader-follower connection, you can’t use same index again to create a new replication. So, what do you do now?

In this scenario, you can use the following steps to set up a leader-follower connection in the opposite direction:

  1. Delete the index from the old leader.
  2. Set up cross-Region replication in the opposite direction with your new leader (follower-west) and new follower (leader-east).
  3. Start the replication on the new follower (which was your old leader) and sync the data.

This runs the sync for all data again for that index, and may take time depending upon the size of the index because it will bootstrap the index and start the replication from scratch. Additionally, you will incur standard AWS data transfer costs for the data transferred with this replication. This way, you can advance your follower (follower-west) to be leader and make your leader (leader-east) the new follower.

Conclusion

In this post, we showed you how you can use cross-cluster replication to sync data between leader and follower indices. We also demonstrated how you can advance your follower to become leader in case your leader goes down. This can help you serve traffic in the event of any disaster scenarios.

If you have feedback about this post, submit your comments in the comments section. If you have questions about this post, start a new thread on the Amazon OpenSearch Service forum or contact AWS Support.


About the Author

Prashant Agrawal is a Search Specialist Solutions Architect with OpenSearch Service. He works closely with customers to help them migrate their workloads to the cloud and helps existing customers fine-tune their clusters to achieve better performance and save on cost. Before joining AWS, he helped various customers use OpenSearch and Elasticsearch for their search and log analytics use cases. When not working, you can find him traveling and exploring new places. In short, he likes doing Eat → Travel → Repeat.

Get a quick start with Apache Hudi, Apache Iceberg, and Delta Lake with Amazon EMR on EKS

Post Syndicated from Amir Shenavandeh original https://aws.amazon.com/blogs/big-data/get-a-quick-start-with-apache-hudi-apache-iceberg-and-delta-lake-with-amazon-emr-on-eks/

A data lake is a centralized repository that allows you to store all your structured and unstructured data at any scale. You can keep your data as is in your object store or file-based storage without having to first structure the data. Additionally, you can run different types of analytics against your loosely formatted data lake—from dashboards and visualizations to big data processing, real-time analytics, and machine learning (ML) to guide better decisions. Due to the flexibility and cost effectiveness that a data lake offers, it’s very popular with customers who are looking to implement data analytics and AI/ML use cases.

Due to the immutable nature of the underlying storage in the cloud, one of the challenges in data processing is updating or deleting a subset of identified records from a data lake. Another challenge is making concurrent changes to the data lake. Implementing these tasks is time consuming and costly.

In this post, we explore three open-source transactional file formats: Apache Hudi, Apache Iceberg, and Delta Lake to help us to overcome these data lake challenges. We focus on how to get started with these data storage frameworks via real-world use case. As an example, we demonstrate how to handle incremental data change in a data lake by implementing a Slowly Changing Dimension Type 2 solution (SCD2) with Hudi, Iceberg, and Delta Lake, then deploy the applications with Amazon EMR on EKS.

ACID challenge in data lakes

In analytics, the data lake plays an important role as an immutable and agile data storage layer. Unlike traditional data warehouses or data mart implementations, we make no assumptions on the data schema in a data lake and can define whatever schemas required by our use cases. It’s up to the downstream consumption layer to make sense of that data for their own purposes.

One of the most common challenges is supporting ACID (Atomicity, Consistency, Isolation, Durability) transactions in a data lake. For example, how do we run queries that return consistent and up-to-date results while new data is continuously being ingested or existing data is being modified?

Let’s try to understand the data problem with a real-world scenario. Assume we centralize customer contact datasets from multiple sources to an Amazon Simple Storage Service (Amazon S3)-backed data lake, and we want to keep all the historical records for analysis and reporting. We face the following challenges:

  • We keep creating append-only files in Amazon S3 to track the contact data changes (insert, update, delete) in near-real time.
  • Consistency and atomicity aren’t guaranteed because we just dump data files from multiple sources without knowing whether the entire operation is successful or not.
  • We don’t have an isolation guarantee whenever multiple workloads are simultaneously reading and writing to the same target contact table.
  • We track every single activity at source, including duplicates caused by the retry mechanism and accidental data changes that are then reverted. This leads to the creation of a large volume of append-only files. The performance of extract, transform, and load (ETL) jobs decreases as all the data files are read each time.
  • We have to shorten the file retention period to reduce the data scan and read performance.

In this post, we walk through a simple SCD2 ETL example designed for solving the ACID transaction problem with the help of Hudi, Iceberg, and Delta Lake. We also show how to deploy the ACID solution with EMR on EKS and query the results by Amazon Athena.

Custom library dependencies with EMR on EKS

By default, Hudi and Iceberg are supported by Amazon EMR as out-of-the-box features. For this demonstration, we use EMR on EKS release 6.8.0, which contains Apache Iceberg 0.14.0-amzn-0 and Apache Hudi 0.11.1-amzn-0. To find out the latest and past versions that Amazon EMR supports, check out the Hudi release history and the Iceberg release history tables. The runtime binary files of these frameworks can be found in the Spark’s class path location within each EMR on EKS image. See Amazon EMR on EKS release versions for the list of supported versions and applications.

As of this writing, Amazon EMR does not include Delta Lake by default. There are two ways to make it available in EMR on EKS:

  • At the application level – You install Delta libraries by setting a Spark configuration spark.jars or --jars command-line argument in your submission script. The JAR files will be downloaded and distributed to each Spark Executor and Driver pod when starting a job.
  • At the Docker container level – You can customize an EMR on EKS image by packaging Delta dependencies into a single Docker container that promotes portability and simplifies dependency management for each workload

Other custom library dependencies can be managed the same way as for Delta Lake—passing a comma-separated list of JAR files in the Spark configuration at job submission, or packaging all the required libraries into a Docker image.

Solution overview

The solution provides two sample CSV files as the data source: initial_contact.csv and update_contacts.csv. They were generated by a Python script with the Faker package. For more details, check out the tutorial on GitHub.

The following diagram describes a high-level architecture of the solution and different services being used.

The workflow steps are as follows:

  1. Ingest the first CSV file from a source S3 bucket. The data is being processed by running a Spark ETL job with EMR on EKS. The application contains either the Hudi, Iceberg, or Delta framework.
  2. Store the initial table in Hudi, Iceberg, or Delta file format in a target S3 bucket (curated). We use the AWS Glue Data Catalog as the hive metastore. Optionally, you can configure Amazon DynamoDB as a lock manager for the concurrency controls.
  3. Ingest a second CSV file that contains new records and some changes to the existing ones.
  4. Perform SCD2 via Hudi, Iceberg, or Delta in the Spark ETL job.
  5. Query the Hudi, Iceberg, or Delta table stored on the target S3 bucket in Athena

To simplify the demo, we have accommodated steps 1–4 into a single Spark application.

Prerequisites

Install the following tools:

curl -fsSL -o get_helm.sh \
https://raw.githubusercontent.com/helm/helm/master/scripts/get-helm-3

chmod 700 get_helm.sh
export DESIRED_VERSION=v3.8.2
./get_helm.sh 
helm version

For a quick start, you can use AWS CloudShell which includes the AWS CLI and kubectl already.

Clone the project

Download the sample project either to your computer or the CloudShell console:

git clone https://github.com/aws-samples/emr-on-eks-hudi-iceberg-delta
cd emr-on-eks-hudi-iceberg-delta

Set up the environment

Run the following blog_provision.sh script to set up a test environment. The infrastructure deployment includes the following resources:

  • A new S3 bucket to store sample data and job code.
  • An Amazon Elastic Kubernetes Service (Amazon EKS) cluster (version 1.21) in a new VPC across two Availability Zones.
  • An EMR virtual cluster in the same VPC, registered to the emr namespace in Amazon EKS.
  • An AWS Identity and Access Management (IAM) job execution role contains DynamoDB access, because we use DynamoDB to provide concurrency controls that ensure atomic transaction with the Hudi and Iceberg tables.
export AWS_REGION=us-east-1
export EKSCLUSTER_NAME=eks-quickstart
./blog_provision.sh
# Upload sample contact data to S3
export ACCOUNTID=$(aws sts get-caller-identity --query Account --output text)
aws s3 sync data s3://emr-on-eks-quickstart-${ACCOUNTID}-${AWS_REGION}/blog/data

Job execution role

The provisioning includes an IAM job execution role called emr-on-eks-quickstart-execution-role that allows your EMR on EKS jobs access to the required AWS services. It contains AWS Glue permissions because we use the Data Catalog as our metastore.

See the following code:

 {
    "Effect": "Allow",
    "Action": ["glue:Get*","glue:BatchCreatePartition","glue:UpdateTable","glue:CreateTable"],
    "Resource": [
        "arn:aws:glue:${AWS_REGION}:${ACCOUNTID}:catalog",
        "arn:aws:glue:${AWS_REGION}:${ACCOUNTID}:database/*",
        "arn:aws:glue:${AWS_REGION}:${ACCOUNTID}:table/*"
    ]
}

Additionally, the role contains DynamoDB permissions, because we use the service as the lock manager. It provides concurrency controls that ensure atomic transaction with our Hudi and Iceberg tables. If a DynamoDB table with the given name doesn’t exist, a new table is created with the billing mode set as pay-per-request. More details can be found in the following framework examples.

{
    "Sid": "DDBLockManager",
    "Effect": "Allow",
    "Action": [
        "dynamodb:DescribeTable",
        "dynamodb:CreateTable",
        "dynamodb:Query",
        "dynamodb:Scan",
        "dynamodb:PutItem",
        "dynamodb:UpdateItem",
        "dynamodb:DeleteItem",
        "dynamodb:BatchWriteItem",
        "dynamodb:GetItem",
        "dynamodb:BatchGetItem"
    ],
    "Resource": [
       "arn:aws:dynamodb:${AWS_REGION}:${ACCOUNTID}:table/myIcebergLockTable",
        "arn:aws:dynamodb:${AWS_REGION}:${ACCOUNTID}:table/myIcebergLockTable/index/*",
        "arn:aws:dynamodb:${AWS_REGION}:${ACCOUNTID}:table/myHudiLockTable"
        "arn:aws:dynamodb:${AWS_REGION}:${ACCOUNTID}:table/myHudiLockTable/index/*",
    ]
}

Example 1: Run Apache Hudi with EMR on EKS

The following steps provide a quick start for you to implement SCD Type 2 data processing with the Hudi framework. To learn more, refer to Build Slowly Changing Dimensions Type 2 (SCD2) with Apache Spark and Apache Hudi on Amazon EMR.

The following code snippet demonstrates the SCD type2 implementation logic. It creates Hudi tables in a default database in the Glue Data Catalog. The full version is in the script hudi_scd_script.py.

# Read incremental contact CSV file with extra SCD columns
delta_csv_df = spark.read.schema(contact_schema).format("csv")\
.load(f"s3://{S3_BUCKET_NAME}/.../update_contacts.csv")\
.withColumn("ts", lit(current_timestamp()).cast(TimestampType()))\
.withColumn("valid_from", lit(current_timestamp()).cast(TimestampType()))\
.withColumn("valid_to", lit("").cast(TimestampType()))\
.withColumn("checksum",md5(concat(col("name"),col("email"),col("state"))))\
.withColumn('iscurrent', lit(1).cast("int"))

## Find existing records to be expired
join_cond = [initial_hudi_df.checksum != delta_csv_df.checksum,
             initial_hudi_df.id == delta_csv_df.id,
             initial_hudi_df.iscurrent == 1]
contact_to_update_df = (initial_hudi_df.join(delta_csv_df, join_cond)
                      .select(initial_hudi_df.id,
                                ....
                              initial_hudi_df.valid_from,
                              delta_csv_df.valid_from.alias('valid_to'),
                              initial_hudi_df.checksum
                              )
                      .withColumn('iscurrent', lit(0).cast("int"))
                      )
                      
merged_contact_df = delta_csv_df.unionByName(contact_to_update_df)

# Upsert
merged_contact_df.write.format('org.apache.hudi')\
                    .option('hoodie.datasource.write.operation', 'upsert')\
                    .options(**hudiOptions) \
                    .mode('append')\
                    .save(TABLE_LOCATION)

In the job script, the hudiOptions were set to use the AWS Glue Data Catalog and enable the DynamoDB-based Optimistic Concurrency Control (OCC). For more information about concurrency control and alternatives for lock providers, refer to Concurrency Control.

hudiOptions = {
    ....
    # sync to Glue catalog
    "hoodie.datasource.hive_sync.mode":"hms",
    ....
    # DynamoDB based locking mechanisms
    "hoodie.write.concurrency.mode":"optimistic_concurrency_control", #default is SINGLE_WRITER
    "hoodie.cleaner.policy.failed.writes":"LAZY", #Hudi will delete any files written by failed writes to re-claim space
    "hoodie.write.lock.provider":"org.apache.hudi.aws.transaction.lock.DynamoDBBasedLockProvider",
    "hoodie.write.lock.dynamodb.table":"myHudiLockTable",
    "hoodie.write.lock.dynamodb.partition_key":"tablename",
    "hoodie.write.lock.dynamodb.region": REGION,
    "hoodie.write.lock.dynamodb.endpoint_url": f"dynamodb.{REGION}.amazonaws.com"
}
  1. Upload the job scripts to Amazon S3:
    export AWS_REGION=us-east-1
    export ACCOUNTID=$(aws sts get-caller-identity --query Account --output text)
    aws s3 sync hudi/ s3://emr-on-eks-quickstart-${ACCOUNTID}-${AWS_REGION}/blog/

  2. Submit Hudi jobs with EMR on EKS to create SCD2 tables:
    export EMRCLUSTER_NAME=emr-on-eks-quickstart
    export AWS_REGION=us-east-1
    
    ./hudi/hudi_submit_cow.sh
    ./hudi/hudi_submit_mor.sh

    Hudi supports two tables types: Copy on Write (CoW) and Merge on Read (MoR). The following is the code snippet to create a CoW table. For the complete job scripts for each table type, refer to hudi_submit_cow.sh and hudi_submit_mor.sh.

    aws emr-containers start-job-run \
      --virtual-cluster-id $VIRTUAL_CLUSTER_ID \
      --name em68-hudi-cow \
      --execution-role-arn $EMR_ROLE_ARN \
      --release-label emr-6.8.0-latest \
      --job-driver '{
      "sparkSubmitJobDriver": {
          "entryPoint": "s3://'$S3BUCKET'/blog/hudi_scd_script.py",
          "entryPointArguments":["'$AWS_REGION'","'$S3BUCKET'","COW"],
          "sparkSubmitParameters": "--jars local:///usr/lib/hudi/hudi-spark-bundle.jar,local:///usr/lib/spark/external/lib/spark-avro.jar --conf spark.executor.memory=2G --conf spark.executor.cores=2"}}' \
      --configuration-overrides '{
        "applicationConfiguration": [
          {
            "classification": "spark-defaults", 
            "properties": {
              "spark.serializer": "org.apache.spark.serializer.KryoSerializer",
              "spark.hadoop.hive.metastore.client.factory.class": "com.amazonaws.glue.catalog.metastore.AWSGlueDataCatalogHiveClientFactory"
             }}
        ]}'

  3. Check the job status on the EMR virtual cluster console.
  4. Query the output in Athena:

    select * from hudi_contact_cow where id=103

    select * from hudi_contact_mor_rt where id=103

Example 2: Run Apache Iceberg with EMR on EKS

Starting with Amazon EMR version 6.6.0, you can use Apache Spark 3 on EMR on EKS with the Iceberg table format. For more information on how Iceberg works in an immutable data lake, see Build a high-performance, ACID compliant, evolving data lake using Apache Iceberg on Amazon EMR.

The sample job creates an Iceberg table iceberg_contact in the default database of AWS Glue. The full version is in the iceberg_scd_script.py script. The following code snippet shows the SCD2 type of MERGE operation:

# Read incremental CSV file with extra SCD2 columns
spark.read.schema(contact_schema)\
.format("csv").options(header=False,delimiter=",")\
.load(f"s3://{S3_BUCKET_NAME}/blog/data/update_contacts.csv")\
.withColumn(……)\
.createOrReplaceTempView('iceberg_contact_update')

# Update existing records which are changed in the update file
contact_update_qry = """
    WITH contact_to_update AS (
          SELECT target.*
          FROM glue_catalog.default.iceberg_contact AS target
          JOIN iceberg_contact_update AS source 
          ON target.id = source.id
          WHERE target.checksum != source.checksum
            AND target.iscurrent = 1
        UNION
          SELECT * FROM iceberg_contact_update
    ),contact_updated AS (
        SELECT *, LEAD(valid_from) OVER (PARTITION BY id ORDER BY valid_from) AS eff_from
        FROM contact_to_update
    )
    SELECT id,name,email,state,ts,valid_from,
        CAST(COALESCE(eff_from, null) AS Timestamp) AS valid_to,
        CASE WHEN eff_from IS NULL THEN 1 ELSE 0 END AS iscurrent,
        checksum
    FROM contact_updated
"""
# Upsert
spark.sql(f"""
    MERGE INTO glue_catalog.default.iceberg_contact tgt
    USING ({contact_update_qry}) src
    ON tgt.id = src.id
    AND tgt.checksum = src.checksum
    WHEN MATCHED THEN UPDATE SET *
    WHEN NOT MATCHED THEN INSERT *
""")

As demonstrated earlier when discussing the job execution role, the role emr-on-eks-quickstart-execution-role granted access to the required DynamoDB table myIcebergLockTable, because the table is used to obtain locks on Iceberg tables, in case of multiple concurrent write operations against a single table. For more information on Iceberg’s lock manager, refer to DynamoDB Lock Manager.

  1. Upload the application scripts to the example S3 bucket:
    export AWS_REGION=us-east-1
    export ACCOUNTID=$(aws sts get-caller-identity --query Account --output text)
    aws s3 sync iceberg/ s3://emr-on-eks-quickstart-${ACCOUNTID}-${AWS_REGION}/blog/

  2. Submit the job with EMR on EKS to create an SCD2 Iceberg table:
    export EMRCLUSTER_NAME=emr-on-eks-quickstart
    export AWS_REGION=us-east-1
    
    ./iceberg/iceberg_submit.sh

    The full version code is in the iceberg_submit.sh script. The code snippet is as follows:

    aws emr-containers start-job-run \
    --virtual-cluster-id $VIRTUAL_CLUSTER_ID \
    --name em68-iceberg \
    --execution-role-arn $EMR_ROLE_ARN \
    --release-label emr-6.8.0-latest \
    --job-driver '{
        "sparkSubmitJobDriver": {
        "entryPoint": "s3://'$S3BUCKET'/blog/iceberg_scd_script.py",
        "entryPointArguments":["'$S3BUCKET'"],
        "sparkSubmitParameters": "--jars local:///usr/share/aws/iceberg/lib/iceberg-spark3-runtime.jar --conf spark.executor.memory=2G --conf spark.executor.cores=2"}}' \
    --configuration-overrides '{
        "applicationConfiguration": [
        {
        "classification": "spark-defaults",
        "properties": {
        "spark.sql.extensions": "org.apache.iceberg.spark.extensions.IcebergSparkSessionExtensions",
        "spark.sql.catalog.glue_catalog": "org.apache.iceberg.spark.SparkCatalog",
        "spark.sql.catalog.glue_catalog.catalog-impl": "org.apache.iceberg.aws.glue.GlueCatalog",
        "spark.sql.catalog.glue_catalog.warehouse": "s3://'$S3BUCKET'/iceberg/",
        "spark.sql.catalog.glue_catalog.io-impl": "org.apache.iceberg.aws.s3.S3FileIO",
        "spark.sql.catalog.glue_catalog.lock-impl": "org.apache.iceberg.aws.glue.DynamoLockManager",
        "spark.sql.catalog.glue_catalog.lock.table": "myIcebergLockTable"
        }}
    ]}'

  3. Check the job status on the EMR on EKS console.
  4. When the job is complete, query the table in Athena:
    select * from iceberg_contact where id=103

Example 3: Run open-source Delta Lake with EMR on EKS

Delta Lake 2.1.x is compatible with Apache Spark 3.3.x. Check out the compatibility list for other versions of Delta Lake and Spark. In this post, we use Amazon EMR release 6.8 (Spark 3.3.0) to demonstrate the SCD2 implementation in a data lake.

The following is the Delta code snippet to load initial dataset; the incremental load MERGE logic is highly similar to the Iceberg example. As a one-off task, there should be two tables set up on the same data:

  • The Delta table delta_table_contact – Defined on the TABLE_LOCATION at ‘s3://{S3_BUCKET_NAME}/delta/delta_contact’. The MERGE/UPSERT operation must be implemented on the Delta destination table. Athena can’t query this table directly, instead it reads from a manifest file stored in the same location, which is a text file containing a list of data files to read for querying a table. It is described as an Athena table below.
  • The Athena table delta_contact – Defined on the manifest location s3://{S3_BUCKET_NAME}/delta/delta_contact/_symlink_format_manifest/. All read operations from Athena must use this table.

The full version code is in the delta_scd_script.py  script. The code snippet is as follows:

# Read initial contact CSV file and create a Delta table with extra SCD2 columns
df_intial_csv = spark.read.schema(contact_schema)\
 .format("csv")\
 .options(header=False,delimiter=",")\
 .load(f"s3://{S3_BUCKET_NAME}/.../initial_contacts.csv")\
 .withColumn(.........)\
 .write.format("delta")\
 .mode("overwrite")\
 .save(TABLE_LOCATION)

spark.sql(f"""CREATE TABLE IF NOT EXISTS delta_table_contact USING DELTA LOCATION '{TABLE_LOCATION}'""")
spark.sql("GENERATE symlink_format_manifest FOR TABLE delta_table_contact")
spark.sql("ALTER TABLE delta_table_contact SET TBLPROPERTIES(delta.compatibility.symlinkFormatManifest.enabled=true)")

# Create a queriable table in Athena
spark.sql(f"""
    CREATE EXTERNAL TABLE IF NOT EXISTS default.delta_contact (
     ....
)
ROW FORMAT SERDE 'org.apache.hadoop.hive.ql.io.parquet.serde.ParquetHiveSerDe'
STORED AS INPUTFORMAT 'org.apache.hadoop.hive.ql.io.SymlinkTextInputFormat'
OUTPUTFORMAT 'org.apache.hadoop.hive.ql.io.HiveIgnoreKeyTextOutputFormat'
LOCATION '{TABLE_LOCATION}/_symlink_format_manifest/'""")

The SQL statement GENERATE symlink_format_manifest FOR TABLE ... is a required step to set up the Athena for Delta Lake. Whenever the data in a Delta table is updated, you must regenerate the manifests. Therefore, we use ALTER TABLE .... SET TBLPROPERTIES(delta.compatibility.symlinkFormatManifest.enabled=true) to automate the manifest refresh as a one-off setup.

  1. Upload the Delta sample scripts to the S3 bucket:
    export AWS_REGION=us-east-1
    export ACCOUNTID=$(aws sts get-caller-identity --query Account --output text)
    aws s3 sync delta/ s3://emr-on-eks-quickstart-${ACCOUNTID}-${AWS_REGION}/blog/

  2. Submit the job with EMR on EKS:
    export EMRCLUSTER_NAME=emr-on-eks-quickstart
    export AWS_REGION=us-east-1
    ./delta/delta_submit.sh

    The full version code is in the delta_submit.sh script. The open-source Delta JAR files must be included in the spark.jars. Alternatively, follow the instructions in How to customize Docker images and build a custom EMR on EKS image to accommodate the Delta dependencies.

    "spark.jars": "https://repo1.maven.org/maven2/io/delta/delta-core_2.12/2.0.0/delta-core_2.12-2.0.0.jar,https://repo1.maven.org/maven2/io/delta/delta-storage/2.0.0/delta-storage-2.0.0.jar"

    The code snippet is as follows:

    aws emr-containers start-job-run \
    --virtual-cluster-id $VIRTUAL_CLUSTER_ID \
    --name em68-delta \
    --execution-role-arn $EMR_ROLE_ARN \
    --release-label emr-6.8.0-latest \
    --job-driver '{
       "sparkSubmitJobDriver": {
       "entryPoint": "s3://'$S3BUCKET'/blog/delta_scd_script.py",
       "entryPointArguments":["'$S3BUCKET'"],
       "sparkSubmitParameters": "--conf spark.executor.memory=2G --conf spark.executor.cores=2"}}' \
    --configuration-overrides '{
       "applicationConfiguration": [
       {
        "classification": "spark-defaults",
        "properties": {
        "spark.sql.extensions": "io.delta.sql.DeltaSparkSessionExtension",
    "spark.sql.catalog.spark_catalog":"org.apache.spark.sql.delta.catalog.DeltaCatalog",
    "spark.serializer":"org.apache.spark.serializer.KryoSerializer",
    “spark.hadoop.hive.metastore.client.factory.class":"com.amazonaws.glue.catalog.metastore.AWSGlueDataCatalogHiveClientFactory",
    "spark.jars": "https://repo1.maven.org/maven2/io/delta/delta-core_2.12/2.1.0/delta-core_2.12-2.1.0.jar,https://repo1.maven.org/maven2/io/delta/delta-storage/2.1.0/delta-storage-2.1.0.jar"
        }}
    ]}‘

  3. Check the job status from the EMR on EKS console.
  4. When the job is complete, query the table in Athena:
    select * from delta_contact where id=103

Clean up

To avoid incurring future charges, delete the resources generated if you don’t need the solution anymore. Run the following cleanup script (change the Region if necessary):

export EMRCLUSTER_NAME=emr-on-eks-quickstart
export AWS_REGION=us-east-1
./clean_up.sh

Conclusion

Implementing an ACID-compliant data lake with EMR on EKS enables you focus more on delivering business value, instead of worrying about managing complexities and reliabilities at the data storage layer.

This post presented three different transactional storage frameworks that can meet your ACID needs. They ensure you never read partial data (Atomicity). The read/write isolation allows you to see consistent snapshots of the data, even if an update occurs at the same time (Consistency and Isolation). All the transactions are stored directly to the underlying Amazon S3-backed data lake, which is designed for 11 9’s of durability (Durability).

For more information, check out the sample GitHub repository used in this post and the EMR on EKS Workshop. They will get you started with running your familiar transactional framework with EMR on EKS. If you want dive deep into each storage format, check out the following posts:


About the authors

Amir Shenavandeh is a Sr Analytics Specialist Solutions Architect and Amazon EMR subject matter expert at Amazon Web Services. He helps customers with architectural guidance and optimisation. He leverages his experience to help people bring their ideas to life, focusing on distributed processing and big data architectures.

Melody Yang is a Senior Big Data Solutions Architect for Amazon EMR at AWS. She is an experienced analytics leader working with AWS customers to provide best practice guidance and technical advice in order to assist their success in data transformation. Her areas of interests are open-source frameworks and automation, data engineering, and DataOps.

Amit Maindola is a Data Architect focused on big data and analytics at Amazon Web Services. He helps customers in their digital transformation journey and enables them to build highly scalable, robust, and secure cloud-based analytical solutions on AWS to gain timely insights and make critical business decisions.

How to automatically build forensic kernel modules for Amazon Linux EC2 instances

Post Syndicated from Jonathan Nguyen original https://aws.amazon.com/blogs/security/how-to-automatically-build-forensic-kernel-modules-for-amazon-linux-ec2-instances/

In this blog post, we will walk you through the EC2 forensic module factory solution to deploy automation to build forensic kernel modules that are required for Amazon Elastic Compute Cloud (Amazon EC2) incident response automation.

When an EC2 instance is suspected to have been compromised, it’s strongly recommended to investigate what happened to the instance. You should look for activities such as:

  • Open network connections
  • List of running processes
  • Processes that contain injected code
  • Memory-resident infections
  • Other forensic artifacts

When an EC2 instance is compromised, it’s important to take action as quickly as possible. Before you shut down the EC2 instance, you first need to capture the contents of its volatile memory (RAM) in a memory dump because it contains the instance’s in-progress operations. This is key in determining the root cause of compromise.

In order to capture volatile memory in Linux, you can use a tool like Linux Memory Extractor (LiME). This requires you to have the kernel modules that are specific to the kernel version of the instance for which you want to capture volatile memory. We also recommend that you limit the actions you take on the instance where you are trying to capture the volatile memory in order to minimize the set of artifacts created as part of the capture process, so you need a method to build the tools for capturing volatile memory outside the instance under investigation. After you capture the volatile memory, you can use a tool like Volatility2 to analyze it in a dedicated forensics environment. You can use tools like LiME and Volatility2 on EC2 instances that use x86, x64, and Graviton instance types.

Prerequisites

This solution has the following prerequisites:

Solution overview

The EC2 forensic module factory solution consists of the following resources:

Figure 1 shows an overview of the EC2 forensic module factory solution workflow.

Figure 1: Automation to build forensic kernel modules for an Amazon Linux EC2 instance

Figure 1: Automation to build forensic kernel modules for an Amazon Linux EC2 instance

The EC2 forensic module factory solution workflow in Figure 1 includes the following numbered steps:

  1. A Step Functions workflow is started, which creates a Step Functions task token and invokes the first Lambda function, createEC2module, to create EC2 forensic modules.
    1. A Step Functions task token is used to allow long-running processes to complete and to avoid a Lambda timeout error. The createEC2module function runs for approximately 9 minutes. The run time for the function can vary depending on any customizations to the createEC2module function or the SSM document.
  2. The createEC2module function launches an EC2 instance based on the Amazon Machine Image (AMI) provided.
  3. Once the EC2 instance is running, an SSM document is run, which includes the following steps:
    1. If a specific kernel version is provided in step 1, this kernel version will be installed on the EC2 instance. If no kernel version is provided, the default kernel version on the EC2 instance will be used to create the modules.
    2. If a specific kernel version was selected and installed, the system is rebooted to use this kernel version.
    3. The prerequisite build tools are installed, as well as the LiME and Volatility2 packages.
    4. The LiME kernel module and the Volatility2 profile are built.
  4. The kernel modules for LiME and Volatility2 are put into the S3 bucket.
  5. Upon completion, the Step Functions task token is sent to the Step Functions workflow to invoke the second cleanupEC2module Lambda function to terminate the EC2 instance that was launched in step 2.

Solution deployment

You can deploy the EC2 forensic module factory solution by using either the AWS Management Console or the AWS Cloud Development Kit (AWS CDK).

Option 1: Deploy the solution with AWS CloudFormation (console)

Sign in to your preferred security tooling account in the AWS Management Console, and choose the following Launch Stack button to open the AWS CloudFormation console pre-loaded with the template for this solution. It will take approximately 10 minutes for the CloudFormation stack to complete.

Select this image to open a link that starts building the CloudFormation stack

Option 2: Deploy the solution by using the AWS CDK

You can find the latest code for the EC2 forensic module factory solution in the ec2-forensic-module-factory GitHub repository, where you can also contribute to the sample code. For instructions and more information on using the AWS CDK, see Get Started with AWS CDK.

To deploy the solution by using the AWS CDK

  1. To build the app when navigating to the project’s root folder, use the following commands.
    npm install -g aws-cdk
    npm install
  2. Run the following commands in your terminal while authenticated in your preferred security tooling AWS account. Be sure to replace <INSERT_AWS_ACCOUNT> with your account number, and replace <INSERT_REGION> with the AWS Region that you want the solution deployed to.
    cdk bootstrap aws://<INSERT_AWS_ACCOUNT>/<INSERT_REGION>
    cdk deploy

Run the solution to build forensic kernel objects

Now that you’ve deployed the EC2 forensic module factory solution, you need to invoke the Step Functions workflow in order to create the forensic kernel objects. The following is an example of manually invoking the workflow, to help you understand what actions are being performed. These actions can also be integrated and automated with an EC2 incident response solution.

To manually invoke the workflow to create the forensic kernel objects (console)

  1. In the AWS Management Console, sign in to the account where the solution was deployed.
  2. In the AWS Step Functions console, select the state machine named create_ec2_volatile_memory_modules.
  3. Choose Start execution.
  4. At the input prompt, enter the following JSON values.
    {
    "AMI_ID": "ami-0022f774911c1d690",
    "kernelversion":"kernel-4.14.104-95.84.amzn2.x86_64"
    }
  5. Choose Start execution to start the workflow, as shown in Figure 2.
    Figure 2: Step Functions step input example to build custom kernel version using Amazon Linux 2 AMI ID

    Figure 2: Step Functions step input example to build custom kernel version using Amazon Linux 2 AMI ID

Workflow progress

You can use the AWS Management Console to follow the progress of the Step Functions workflow. If the workflow is successful, you should see the image when you view the status of the Step Functions workflow, as shown in Figure 3.

Figure 3: Step Functions workflow success example

Figure 3: Step Functions workflow success example

Note: The Step Functions workflow run time depends on the commands that are being run in the SSM document. The example SSM document included in this post runs for approximately 9 minutes. For information about possible Step Functions errors, see Error handling in Step Functions.

To verify that the artifacts are built

  1. After the Step Functions workflow has successfully completed, go to the S3 bucket that was provisioned in the EC2 forensic module factory solution.
  2. Look for two prefixes in the bucket for LiME and Volatility2, as shown in Figure 4.
    Figure 4: S3 bucket prefix for forensic kernel modules

    Figure 4: S3 bucket prefix for forensic kernel modules

  3. Open each tool name prefix in S3 to find the actual module, such as in the following examples:
    • LiME example: lime-4.14.104-95.84.amzn2.x86_64.ko
    • Volatility2 example: 4.14.104-95.84.amzn2.x86_64.zip

Now that the objects have been created, the solution has successfully completed.

Incorporate forensic module builds into an EC2 AMI pipeline

Each organization has specific requirements for allowing application teams to use various EC2 AMIs, and organizations commonly implement an EC2 image pipeline using tools like EC2 Image Builder. EC2 Image Builder uses recipes to install and configure required components in the AMI before application teams can launch EC2 instances in their environment.

The EC2 forensic module factory solution we implemented here makes use of an existing EC2 instance AMI. As mentioned, the solution uses an SSM document to create forensic modules. The logic in the SSM document could be incorporated into your EC2 image pipeline to create the forensic modules and store them in an S3 bucket. S3 also allows additional layers of protection such as enforcing default bucket encryption with an AWS Key Management Service Customer Managed Key (CMK), verifying S3 object integrity with checksum, S3 Object Lock, and restrictive S3 bucket policies. These protections can help you to ensure that your forensic modules have not been modified and are only accessible by authorized entities.

It is important to note that incorporating forensic module creation into an EC2 AMI pipeline will build forensic modules for the specific kernel version used in that AMI. You would still need to employ this EC2 forensic module solution to build a specific forensic module version if it is missing from the S3 bucket where you are creating and storing these forensic modules. The need to do this can arise if the EC2 instance is updated after the initial creation of the AMI.

Incorporate the solution into existing EC2 incident response automation

There are many existing solutions to automate incident response workflow for quarantining and capturing forensic evidence for EC2 instances, but the majority of EC2 incident response automation solutions have a single dependency in common, which is the use of specific forensic modules for the target EC2 instance kernel version. The EC2 forensic module factory solution in this post enables you to be both proactive and reactive when building forensic kernel modules for your EC2 instances.

You can use the EC2 forensic module factory solution in two different ways:

  1. Ad-hoc – In this post, you walked through the solution by running the Step Functions workflow with specific parameters. You can do this to build a repository of kernel modules.
  2. Automated – Alternatively, you can incorporate this solution into existing automation by invoking the Step Functions workflow and passing the AMI ID and kernel version. An example could be the following:
    1. An existing EC2 incident response solution attempts to get the forensic modules to capture the volatile memory from an S3 bucket.
    2. If the specific kernel version is missing in the S3 bucket, the solution updates the automation to StartExecution on the create_ec2_volatile_memory_modules state machine.
    3. The Step Functions workflow builds the specific forensic modules.
    4. After the Step Functions workflow is complete, the EC2 incident response solution restarts its workflow to get the forensic modules to capture the volatile memory on the EC2 instance.

Now that you have the kernel modules, you can both capture the volatile memory by using LiME, and then conduct analysis on the memory dump by using a Volatility2 profile.

To capture and analyze volatile memory on the target EC2 instance (high-level steps)

  1. Copy the LiME module from the S3 bucket holding the module repository to the target EC2 instance.
  2. Capture the volatile memory by using the LiME module.
  3. Stream the volatile memory dump to a S3 bucket.
  4. Launch an EC2 forensic workstation instance, with Volatility2 installed.
  5. Copy the Volatility2 profile from the S3 bucket to the appropriate location.
  6. Copy the volatile memory dump to the EC2 forensic workstation.
  7. Run analysis on the volatile memory with Volatility2 by using the specific Volatility2 profile created for the target EC2 instance.

Automated self-service AWS solution

AWS has also released the Automated Forensics Orchestrator for Amazon EC2 solution that you can use to quickly set up and configure a dedicated forensics orchestration automation solution for your security teams. The Automated Forensics Orchestrator for Amazon EC2 allows you to capture and examine the data from EC2 instances and attached Amazon Elastic Block Store (Amazon EBS) volumes in your AWS environment. This data is collected as forensic evidence for analysis by the security team.

The Automated Forensics Orchestrator for Amazon EC2 creates the foundational components to enable the EC2 forensic module factory solution’s memory forensic acquisition workflow and forensic investigation and reporting service. Both the Automated Forensics Orchestrator for Amazon EC2, and the EC2 forensic module factory, are hosted in different GitHub projects. And you will need to reconcile the expected S3 bucket locations for the associated modules:

Customize the EC2 forensic module factory solution

The SSM document pulls open-source packages to build tools for the specific Linux kernel version. You can update the SSM document to your specific requirements for forensic analysis, including expanding support for other operating systems, versions, and tools.

You can also update the S3 object naming convention and object tagging, to allow external solutions to reference and copy the appropriate kernel module versions to enable the forensic workflow.

Clean up

If you deployed the EC2 forensic module factory solution by using the Launch Stack button in the AWS Management Console or the CloudFormation template ec2_module_factory_cfn, do the following to clean up:

  1. In the AWS CloudFormation console for the account and Region where you deployed the solution, choose the Ec2VolModules stack.
  2. Choose the option to Delete the stack.

If you deployed the solution by using the AWS CDK, run the following command.

cdk destroy

Conclusion

In this blog post, we walked you through the deployment and use of the EC2 forensic module factory solution to use AWS Step Functions, AWS Lambda, AWS Systems Manager, and Amazon EC2 to create specific versions of forensic kernel modules for Amazon Linux EC2 instances.

The solution provides a framework to create the foundational components required in an EC2 incident response automation solution. You can customize the solution to your needs to fit into an existing EC2 automation, or you can deploy this solution in tandem with the Automated Forensics Orchestrator for Amazon EC2.

If you have feedback about this post, submit comments in the Comments section below. If you have any questions about this post, start a thread on re:Post.

Want more AWS Security news? Follow us on Twitter.

Jonathan Nguyen

Jonathan Nguyen

Jonathan is a Shared Delivery Team Senior Security Consultant at AWS. His background is in AWS Security with a focus on threat detection and incident response. Today, he helps enterprise customers develop a comprehensive security strategy and deploy security solutions at scale, and he trains customers on AWS Security best practices.

David Hoang

David Hoang

David is a Shared Delivery Team Security Consultant at AWS. His background is in AWS security, with a focus on automation. David designs, builds, and implements scalable enterprise solutions with security guardrails that use AWS services.

Implementing long running deployments with AWS CloudFormation Custom Resources using AWS Step Functions

Post Syndicated from DAMODAR SHENVI WAGLE original https://aws.amazon.com/blogs/devops/implementing-long-running-deployments-with-aws-cloudformation-custom-resources-using-aws-step-functions/

AWS CloudFormation custom resource provides mechanisms to provision AWS resources that don’t have built-in support from CloudFormation. It lets us write custom provisioning logic for resources that aren’t supported as resource types under CloudFormation. This post focusses on the use cases where CloudFormation custom resource is used to implement a long running task/job. With custom resources, you can manage these custom tasks (which are one-off in nature) as deployment stack resources.

The routine pattern used for implementing custom resources is via AWS Lambda function. However, when using the Lambda function as the custom resource provider, you must consider its trade-offs, such as its 15 minute timeout. Tasks involved in the provisioning of certain AWS resources can be long running and could span beyond the Lambda timeout. In these scenarios, you must look beyond the conventional Lambda function-based approach for custom resources.

In this post, I’ll demonstrate how to use AWS Step Functions to implement custom resources using AWS Cloud Development Kit (AWS CDK). Step Functions allow complex deployment tasks to be orchestrated as a step-by-step workflow. It also offers direct integration with any AWS service via AWS SDK integrations. By default the CloudFormation stack waits for 1 hour before timing out. The timeout can be increased to maximum 12 hours using wait conditions. In this post, you’ll also see how to use wait conditions with custom resource to run long running deployment tasks as part of a CloudFormation stack.

Prerequisites

Before proceeding any further, you must identify and designate an AWS account required for the solution to work. You must also create an AWS account profile in ~/.aws/credentials for the designated AWS account, if you don’t already have one. The profile must have sufficient permissions to run an AWS CDK stack. It should be your private profile and only be used during the course of this post. Therefore, it should be fine if you want to use admin privileges. Don’t share the profile details, especially if it has admin privileges. I recommend removing the profile when you’re finished with this walkthrough. For more information about creating an AWS account profile, see Configuring the AWS CLI.

Services and frameworks used in the post include CloudFormation, Step Functions, Lambda, DynamoDB, Amazon S3, and AWS CDK.

Solution overview

The following architecture diagram shows the application of Step Functions to implement custom resources.

Architecture diagram

Figure 1. Architecture diagram

  1. The user deploys a CloudFormation stack that includes a custom resource implementation.
  2. The CloudFormation custom resource triggers a Lambda function with the appropriate event which can be CREATE/UPDATE/DELETE.
  3. The custom resource Lambda function invokes Step Functions workflow and offloads the event handling responsibility. The CloudFormation event and context are wrapped inside the Step Function input at the time of invocation.
  4. The custom resource Lambda function returns SUCCESS back to CloudFormation stack indicating that the custom resource provisioning has begun. CloudFormation stack then goes into waiting mode where it waits for a SUCCESS or FAILURE signal to continue.
  5. In the interim, Step Functions workflow handles the custom resource event through one or more steps.
  6. Step Functions workflow prepares the response to be sent back to CloudFormation stack.
  7. Send Response Lambda function sends a success/failure response back to CloudFormation stack. This propels CloudFormation stack out of the waiting mode and into completion.

Solution deep dive

In this section I will get into the details of several key aspects of the solution

Custom Resource Definition

Following code snippet shows the custom resource definition which can be found here. Please note that we also define AWS::CloudFormation::WaitCondition and AWS::CloudFormation::WaitConditionHandle alongside the custom resource. AWS::CloudFormation::WaitConditionHandle resource sets up a pre-signed URL which is passed into the CallbackUrl property of the Custom Resource.

The final completion signal for the custom resource i.e. SUCCESS/FAILURE is received over this CallbackUrl. To learn more about wait conditions please refer to its user guide here. Note that, when updating the custom resource, you cannot use the existing WaitCondition-WaitConditionHandle resource pair. You need to create a new pair for tracking each update/delete operation on the custom resource.

/************************** Custom Resource Definition *****************************/
// When you intend to update CustomResource make sure that a new WaitCondition and 
// a new WaitConditionHandle resource is created to track CustomResource update.
// The strategy we are using here is to create a hash of Custom Resource properties.
// The resource names for WaitCondition and WaitConditionHandle carry this hash.
// Anytime there is an update to the custom resource properties, a new hash is generated,
// which automatically leads to new WaitCondition and WaitConditionHandle resources.
const resourceName: string = getNormalizedResourceName('DemoCustomResource');
const demoData = {
    pk: 'demo-sfn',
    sk: resourceName,
    ts: Date.now().toString()
};
const dataHash = hash(demoData);
const wcHandle = new CfnWaitConditionHandle(
    this, 
    'WCHandle'.concat(dataHash)
)
const customResource = new CustomResource(this, resourceName, {
    serviceToken: customResourceLambda.functionArn,
    properties: {
        DDBTable: String(demoTable.tableName),
        Data: JSON.stringify(demoData),
        CallbackUrl: wcHandle.ref
    }
});
        
// Note: AWS::CloudFormation::WaitCondition resource type does not support updates.
new CfnWaitCondition(
    this,
    'WC'.concat(dataHash),
    {
        count: 1,
        timeout: '300',
        handle: wcHandle.ref
    }
).node.addDependency(customResource)
/**************************************************************************************/

Custom Resource Lambda

Following code snippet shows how the custom resource lambda function passes the CloudFormation event as an input into the StepFunction at the time of invocation. CloudFormation event contains the CallbackUrl resource property I discussed in the previous section.

private async startExecution() {
    const input = {
        cfnEvent: this.event,
        cfnContext: this.context
    };
    const params: StartExecutionInput = {
        stateMachineArn: String(process.env.SFN_ARN),
        input: JSON.stringify(input)
    };
    let attempt = 0;
    let retry = false;
    do {
        try {
            const response = await this.sfnClient.startExecution(params).promise();
            console.debug('Response: ' + JSON.stringify(response));
            retry = false;

Custom Resource StepFunction

The StepFunction handles the CloudFormation event based on the event type. The CloudFormation event containing CallbackUrl is passed down the stages of StepFunction all the way to the final step. The last step of the StepFunction sends back the response over CallbackUrl via send-cfn-response lambda function as shown in the following code snippet.

/**
 * Send response back to cloudformation
 * @param event
 * @param context
 * @param response
 */
export async function sendResponse(event: any, context: any, response: any) {
    const responseBody = JSON.stringify({
        Status: response.Status,
        Reason: "Success",
        UniqueId: response.PhysicalResourceId,
        Data: JSON.stringify(response.Data)
    });
    console.debug("Response body:\n", responseBody);
    const parsedUrl = url.parse(event.ResourceProperties.CallbackUrl);
    const options = {
        hostname: parsedUrl.hostname,
        port: 443,
        path: parsedUrl.path,
        method: "PUT",
        headers: {
            "content-type": "",
            "content-length": responseBody.length
        }
    };
    await new Promise(() => {
        const request = https.request(options, function(response: any) {
	    console.debug("Status code: " + response.statusCode);
	    console.debug("Status message: " + response.statusMessage);
	    context.done();
    	})
	request.on("error", function(error) {
	    console.debug("send(..) failed executing https.request(..): " + error);
	    context.done();
	});
	request.write(responseBody);
	request.end();
    });
    return;
}

Demo

Clone the GitHub repo cfn-custom-resource-using-step-functions and navigate to the folder cfn-custom-resource-using-step-functions. Now, execute the script script-deploy.sh by passing the name of the AWS profile that you created in the prerequisites section above. This should deploy the solution. The commands are shown as follows for your reference. Note that if you don’t pass the AWS profile name ‘default’ the profile will be used for deployment.

git clone 
cd cfn-custom-resource-using-step-functions
./script-deploy.sh "<AWS- ACCOUNT-PROFILE-NAME>"

The deployed solution consists of 2 stacks as shown in the following screenshot

  1. cfn-custom-resource-common-lib: Deploys common components
    • DynamoDB table that custom resources write to during their lifecycle events
    • Lambda layer used across the rest of the stacks
  2. cfn-custom-resource-sfn: Deploys Step Functions backed custom resource implementation
CloudFormation stacks deployed

Figure 2. CloudFormation stacks deployed

For demo purposes, I implemented a custom resource that inserts data into the DynamoDB table. When you deploy the solution for the first time, like you just did in the previous step, it initiates a CREATE event resulting in the creation of a new custom resource using Step Functions. You should see a new record with unix epoch timestamp in the DynamoDB table, indicating that the resource was created as shown in the following screenshot. You can find the DynamoDB table name/arn from the SSM Parameter Store /CUSTOM_RESOURCE_PATTERNS/DYNAMODB/ARN

DynamoDB record indicating custom resource creation

Figure 3. DynamoDB record indicating custom resource creation

Now, execute the script script-deploy.sh again. This should initiate an UPDATE event, resulting in the update of custom resources. The code also automatically creates new WaitConditionHandle and WaitCondition resources required to wait for the update event to finish. Now you should see that the records in the DynamoDb table have been updated with new values for lastOperation and ts attributes as follows.

DynamoDB record indicating custom resource update

Figure 4. DynamoDB record indicating custom resource update

Cleaning up

To remove all of the stacks, run the script script-undeploy.sh as follows.

./script-undeploy.sh "<AWS- ACCOUNT-PROFILE-NAME>"

Conclusion

In this post I showed how to look beyond the conventional approach of building CloudFormation custom resources using a Lambda function. I discussed implementing custom resources using Step Functions and CloudFormation wait conditions. Try this solution in scenarios where you must execute a long running deployment task/job as part of your CloudFormation stack deployment.


About the author:

Damodar Shenvi

Damodar Shenvi Wagle is a Cloud Application Architect at AWS Professional Services. His areas of expertise include architecting serverless solutions, CI/CD and automation.

Identify source schema changes using AWS Glue

Post Syndicated from Narendra Gupta original https://aws.amazon.com/blogs/big-data/identify-source-schema-changes-using-aws-glue/

In today’s world, organizations are collecting an unprecedented amount of data from all kinds of different data sources, such as transactional data stores, clickstreams, log data, IoT data, and more. This data is often in different formats, such as structured data or unstructured data, and is usually referred to as the three Vs of big data (volume, velocity, and variety). To extract information from the data, it’s usually stored in a data lake built on Amazon Simple Storage Service (S3). The data lake provides an important characteristic called schema on read, which allows you to bring data in the data lake without worrying about the schema or changes in the schema on the data source. This enables faster ingestion of data or building data pipelines.

However, you may be reading and consuming this data for other use cases, such as pointing to applications, building business intelligence (BI) dashboards in services like Amazon QuickSight, or doing data discovery using a serverless query engine like Amazon Athena. Additionally, you may have built an extract, transform, and load (ETL) data pipeline to populate your data store like a relational database, non-relational database, or data warehouse for further operational and analytical needs. In these cases, you need to define the schema upfront or even keep an account of the changes in the schema, such as adding new columns, deleting existing columns, changing the data type of existing columns, or renaming existing columns, to avoid any failures in your application or issues with your dashboard or reporting.

In many use cases, we have found that the data teams responsible for building the data pipeline don’t have any control of the source schema, and they need to build a solution to identify changes in the source schema in order to be able to build the process or automation around it. This might include sending notifications of changes to the teams dependent on the source schema, building an auditing solution to log all the schema changes, or building an automation or change request process to propagate the change in the source schema to downstream applications such as an ETL tool or BI dashboard. Sometimes, to control the number of schema versions, you may want to delete the older version of the schema when there are no changes detected between it and the newer schema.

For example, assume you’re receiving claim files from different external partners in the form of flat files, and you’ve built a solution to process claims based on these files. However, because these files were sent by external partners, you don’t have much control over the schema and data format. For example, columns such as customer_id and claim_id were changed to customerid and claimid by one partner, and another partner added new columns such as customer_age and earning and kept the rest of the columns the same. You need to identify such changes in advance so you can edit the ETL job to accommodate the changes, such as changing the column name or adding the new columns to process the claims.

In this solution, we showcase a mechanism that simplifies the capture of the schema changes in your data source using an AWS Glue crawler.

Solution overview

An AWS Glue data crawler is built to sync metadata based on existing data. After we identify the changes, we use Amazon CloudWatch to log the changes and Amazon Simple Notification Service (Amazon SNS) to notify the changes to the application team over email. You can expand this solution to solve for other use cases such as building an automation to propagate the changes to downstream applications or pipelines, which is out of scope for this post, to avoid any failures in downstream applications because of schema changes. We also show a way to delete older versions of the schema if there are no changes between the compared schema versions.

If you want to capture the change in an event-driven manner, you can do so by using Amazon EventBridge. However, if you want to capture the schema changes on multiple tables at the same time, based on a specific schedule, you can use the solution in this post.

In our scenario, we have two files, each with different schemas, simulating data that has undergone a schema change. We use an AWS Glue crawler to extract the metadata from data in an S3 bucket. Then we use an AWS Glue ETL job to extract the changes in the schema to the AWS Glue Data Catalog.

AWS Glue provides a serverless environment to extract, transform, and load a large number of datasets from several sources for analytic purposes. The Data Catalog is a feature within AWS Glue that lets you create a centralized data catalog of metadata by storing and annotating data from different data stores. Examples include object stores like Amazon S3, relational databases like Amazon Aurora PostgreSQL-Compatible Edition, and data warehouses like Amazon Redshift. You can then use that metadata to query and transform the underlying data. You use a crawler to populate the Data Catalog with tables. It can automatically discover new data, extract schema definitions, detect schema changes, and version tables. It can also detect Hive-style partitions on Amazon S3 (for example year=YYYY, month=MM, day=DD).

Amazon S3 serves as the storage for our data lake. Amazon S3 is an object storage service that offers industry-leading scalability, data availability, security, and performance.

The following diagram illustrates the architecture for this solution.

The workflow includes the following steps:

  1. Copy the first data file to the data folder of the S3 bucket and run the AWS Glue crawler to create a new table in the Data Catalog.
  2. Move the existing file from the data folder to the archived folder.
  3. Copy the second data file with the updated schema to the data folder, then rerun the crawler to create new version of table schema.
  4. Run the AWS Glue ETL job to check if there is a new version of the table schema.
  5. The AWS Glue job lists the changes in the schema with the previous version of the schema in CloudWatch Logs. If there are no changes in the schema and the flag to delete older versions is set to true, the job also deletes the older schema versions.
  6. The AWS Glue job notifies all changes in the schema to the application team over email using Amazon SNS.

To build the solution, complete the following steps:

  1. Create an S3 bucket with the data and archived folders to store the new and processed data files.
  2. Create an AWS Glue database and an AWS Glue crawler that crawls the data file in the data folder to create an AWS Glue table in the database.
  3. Create an SNS topic and add an email subscription.
  4. Create an AWS Glue ETL job to compare the two versions of the table schema, list the changes in the schema with the older version of schema, and delete older versions of schema if the flag to delete older versions is set to true. The job also publishes an event in Amazon SNS to notify the changes in the schema to the data teams.

For the purpose of this post, we manually perform the steps to move the data files from the data folder to the archive folder, triggering the crawler and ETL job. Depending on your application needs, you can automate and orchestrate this process through AWS Glue workflows.

Let’s set up the infrastructure required to go through the solution to compare an AWS Glue table version to a version updated with recent schema changes.

Create an S3 bucket and folders

To create an S3 bucket with the data and archived folders to store the new and processed data files, complete the following steps:

  1. On the Amazon S3 console, choose Buckets in the navigation pane.
  2. Choose Create bucket.
  3. For Bucket name, enter a DNS-compliant unique name (for example, aws-blog-sscp-ng-202202).
  4. For Region, choose the Region where you want the bucket to reside.
  5. Keep all other settings as default and choose Create bucket.
  6. On the Buckets page, choose the newly created bucket.
  7. Choose Create folder.
  8. For Folder name, enter data.
  9. Leave server-side encryption at its default (disabled).
  10. Choose Create folder.
  11. Repeat these steps to create the archived folder in the same bucket.

Create an AWS Glue database and crawler

Now we create an AWS Glue database and crawler that crawls the data file in the data bucket to create an AWS Glue table in the new database.

  1. On the AWS Glue console, choose Databases in the navigation pane.
  2. Choose Add database.
  3. Enter a name (for example, sscp-database) and description.
  4. Choose Create.
  5. Choose Crawlers in the navigation pane.
  6. Choose Add crawler.
  7. For Crawler name, enter a name (glue-crawler-sscp-sales-data).
  8. Choose Next.
  9. For the crawler source type¸ choose Data stores.
  10. To repeat crawls of the data stores, choose Crawl all folders.
  11. Choose Next.
  12. For Choose a data store, choose S3.
  13. For Include path, choose the S3 bucket and folder you created (s3://aws-blog-sscp-ng-202202/data).
  14. Choose Next.
  15. On the Add another data store page, choose No, then choose Next.
  16. Choose Create an IAM role and enter a name for the role (for example, sscp-blog).
  17. Choose Next.
  18. Choose Run on Demand, then choose Next.
  19. For Database, choose your AWS Glue database (sscp-database).
  20. For Prefix added to tables, enter a prefix (for example, sscp_sales_).
  21. Expand the Configuration options section and choose Update the table definition in the data catalog.
  22. Leave all other settings as default and choose Next.
  23. Choose Finish to create the crawler.

Create an SNS topic

To create an SNS topic and add an email subscription, complete the following steps:

  1. On the Amazon SNS console, choose Topics in the navigation pane.
  2. Choose Create topic.
  3. For Type, choose Standard.
  4. Enter a name for the topic (for example, NotifySchemaChanges).
  5. Leave all other settings as default and choose Create topic.
  6. In the navigation pane, choose Subscriptions.
  7. Choose Create subscription.
  8. For Topic ARN, choose the ARN of the created SNS topic.
  9. For Protocol, choose Email.
  10. For Endpoint, enter the email address to receive notifications.
  11. Leave all other defaults and choose Create subscription.You should receive an email to confirm the subscription.
  12. Choose the link in the email to confirm.
  13. Add the following permission policy to the AWS Glue service role created earlier as part of the crawler creation (AWSGlueServiceRole-sscp-blog) to allow publishing to the SNS topic. Make sure to change <$SNSTopicARN> in the policy with the actual ARN of the SNS topic.
{
    "Version": "2012-10-17",
    "Statement": [
        {
            "Sid": "AllowEventPublishing",
            "Effect": "Allow",
            "Action": "sns:Publish",
            "Resource": "<$SNSTopicARN>"
        }
    ]
}

Create an AWS Glue ETL job

Now you create an AWS Glue ETL job to compare two schema versions of a table and list the changes in schemas. If there are no changes in the schema and the flag to delete older versions is set to true, the job also deletes any older versions. If there are changes in schema, the job lists changes in the CloudWatch logs and publishes an event in Amazon SNS to notify changes to the data team.

  1. On the AWS Glue console, choose AWS Glue Studio.
  2. Choose Create and manage jobs.
  3. Choose the Python Shell script editor.
  4. Choose Create to create a Python Shell job.
  5. Enter the following code in the script editor field:
    import boto3
    import pandas as pd
    
    # Input Paramaters:  
    # catalog_id - Your AWS Glue Catalg Id - it is same as your AWS account ID
    # db_name - name of your AWS Glue Database in your Glue Data catalog_id
    # table_name - name of the table in your AWS Glue Database that you would like to check of change in schema
    # topic_arn - ARN of the SNS topic to publish the changes in table schema
    # versions_to_compare - Two versions that customer would want to compare. 0 is the lastes version and 1 in the version prior to the latest version
    # delete_old_versions - If True and there are no changes in the versions compared, job would delete all old versions except for the latest "number_of_versions_to_retain" versions 
    # number_of_versions_to_retain - if delete_old_versions is True and there are no changes in the versions compared, the job would delete all old versions except for the latest "number_of_versions_to_retain" versions
    
    catalog_id = '<$catalog_id>'
    db_name='<$db_name>'
    table_name='<$table_name>'
    topic_arn='<$sns_topic_ARN>'
    versions_to_compare=[0,1]
    delete_old_versions = False
    number_of_versions_to_retain = 2
    
    columns_modified = []
    
    # Function to compare the name and type of columns in new column list with old column list to 
    # find any newly added column and the columns with changed data type
    def findAddedUpdated(new_cols_df, old_cols_df, old_col_name_list):
        for index, row in new_cols_df.iterrows():
            new_col_name = new_cols_df.iloc[index]['Name']
            new_col_type = new_cols_df.iloc[index]['Type']
    
            # Check if a column with same name exist in old table but the data type has chaged
            if new_col_name in old_col_name_list:
                old_col_idx = old_cols_df.index[old_cols_df['Name']==new_col_name][0]
                old_col_type = old_cols_df.iloc[old_col_idx]['Type']
    
                if old_col_type != new_col_type:
                    columns_modified.append(f"Data type changed for '{new_col_name}' from '{old_col_type}' to '{new_col_type}'")
            # If a column is only in new column list, it a newly added column
            else:
                columns_modified.append(f"Added new column '{new_col_name}' with data type as '{new_col_type}'")
    
    # Function to iterate through the list of old columns and check if any column doesn't exist in new columns list to find out dropped columns
    def findDropped(old_cols_df, new_col_name_list):
        for index, row in old_cols_df.iterrows():
            old_col_name = old_cols_df.iloc[index]['Name']
            old_col_type = old_cols_df.iloc[index]['Type']
    
            #check if column doesn't exist in new column list  
            if old_col_name not in new_col_name_list:
                columns_modified.append(f"Dropped old column '{old_col_name}' with data type as '{old_col_type}'")
    
    # Function to publish changes in schema to a SNS topic that can be subscribed to receive email notifications when changes are detected
    def notifyChanges(message_to_send):
        sns = boto3.client('sns')
        # Publish a simple message to the specified SNS topic
        response = sns.publish(
            TopicArn=topic_arn,   
            Message=message_to_send,  
            Subject="DWH Notification: Changes in table schema"
        )
        
    # Function to convert version_id to int to use for sorting the versions
    def version_id(json):
        try:
            return int(json['VersionId'])
        except KeyError:
            return 0
    
    # Function to delete the table versions
    def delele_versions(glue_client, versions_list, number_of_versions_to_retain):
        print("deleting old versions...")
        if len(versions_list) > number_of_versions_to_retain:
            version_id_list = []
            for table_version in versions_list:
                version_id_list.append(int(table_version['VersionId']))
            # Sort the versions in descending order
            version_id_list.sort(reverse=True)
            versions_str_list = [str(x) for x in version_id_list]
            versions_to_delete = versions_str_list[number_of_versions_to_retain:]
            
            del_response = glue_client.batch_delete_table_version(
                DatabaseName=db_name,
                TableName=table_name,
                VersionIds=versions_to_delete
            )
            return del_response
    
    # Calling glue API to get the list of table versions. The solution assums that number of version in the table are less than 100. If you have more than 100 versions, you should use pagination and loop through each page.  
    glue = boto3.client('glue')
    response = glue.get_table_versions(
        CatalogId=catalog_id,
        DatabaseName=db_name,
        TableName=table_name,
        MaxResults=100
    )
    table_versions = response['TableVersions']
    table_versions.sort(key=version_id, reverse=True)
    
    version_count = len(table_versions)
    print(version_count)
    
    # checking if the version of table to compare exists. You would need pass the numbers of versions to compare to the job. 
    if version_count > max(versions_to_compare):
    
        new_columns = table_versions[versions_to_compare[0]]['Table']['StorageDescriptor']['Columns']
        new_cols_df = pd.DataFrame(new_columns)
    
        old_columns = table_versions[versions_to_compare[1]]['Table']['StorageDescriptor']['Columns']
        old_cols_df = pd.DataFrame(old_columns)
    
        new_col_name_list =  new_cols_df['Name'].tolist()
        old_col_name_list =  old_cols_df['Name'].tolist()
        findAddedUpdated(new_cols_df, old_cols_df, old_col_name_list)
        findDropped(old_cols_df, new_col_name_list)
        if len(columns_modified) > 0: 
            email_msg = f"Following changes are identified in '{table_name}' table of '{db_name}' database of your Datawarehouse. Please review.\n\n"
            print("Job completed! -- below is list of changes.")
            for column_modified in columns_modified:
                email_msg += f"\t{column_modified}\n"
    
            print(email_msg)
            notifyChanges(email_msg)
        else:
            if delete_old_versions:
                delele_versions(glue, table_versions,number_of_versions_to_retain)
            print("Job completed! -- There are no changes in table schema.")
    else:
        print("Job completed! -- Selected table doesn't have the number of versions selected to compare. Please verify the list passed in 'versions_to_compare'")

  6. Enter a name for the job (for example, find-change-job-sscp).
  7. For IAM Role, choose the AWS Glue service role (AWSGlueServiceRole-sscp-blog).
  8. Leave all other defaults and choose Save.

Test the solution

We’ve configured the infrastructure to run the solution. Let’s now see it in action. First we upload the first data file and run our crawler to create a new table in the Data Catalog.

  1. Create a CSV file called salesdata01.csv with the following contents:
    ordertime,region,rep,item,units,unitcost
    2022-01-06,US-West,Jones,Pencil,95,1.99
    2022-01-06,US-Central,Kivell,Binder,50,19.99
    2022-01-07,US-Central,Jardine,Pencil,36,4.99
    2022-01-07,US-Central,Gill,Pen,27,19.99
    2022-01-08,US-East,Sorvino,Pencil,56,2.99
    2022-01-08,US-West,Jones,Binder,60,4.99
    2022-01-09,US-Central,Andrews,Pencil,75,1.99
    2022-01-10,US-Central,Jardine,Pencil,90,4.99
    2022-01-11,US-East,Thompson,Pencil,32,1.99
    2022-01-20,US-West,Jones,Binder,60,8.99

  2. On the Amazon S3 console, navigate to the data folder and upload the CSV file.
  3. On the AWS Glue console, choose Crawlers in the navigation pane.
  4. Select your crawler and choose Run crawler.The crawler takes a few minutes to complete. It adds a table (sscp_sales_data) in the AWS Glue database (sscp-database).
  5. Verify the created table by choosing Tables in the navigation pane.Now we move the existing file in the data folder to the archived folder.
  6. On the Amazon S3 console, navigate to the data folder.
  7. Select the file you uploaded (salesdata01.csv) and on the Actions menu, choose Move.
  8. Move the file to the archived folder.Now we copy the second data file with the updated schema to the data folder and rerun the crawler.
  9. Create a CSV file called salesdata02.csv with the following code. It contains the following changes from the previous version:
    1. The data in the region column is changed from region names to some codes (for example, the data type is changed from string to BIGINT).
    2. The rep column is dropped.
    3. The new column total is added.
      ordertime,region,item,units,unitcost,total
      2022-02-01,01,Pencil,35,4.99,174.65
      2022-02-01,03,Desk,2,125,250
      2022-02-02,01,Pen Set,16,15.99,255.84
      2022-02-02,03,Binder,28,8.99,251.72
      2022-02-03,01,Pen,64,8.99,575.36
      2022-02-03,01,Pen,15,19.99,299.85
      2022-02-06,03,Pen Set,96,4.99,479.04
      2022-02-10,03,Pencil,67,1.29,86.43
      2022-02-11,01,Pen Set,74,15.99,183.26
      2022-02-11,03,Binder,46,8.99,413.54

  10. On the Amazon S3 bucket, upload the file to the data folder.
  11. On the AWS Glue console, choose Crawlers in the navigation pane.
  12. Select your crawler and choose Run crawler.The crawler takes approximately 2 minutes to complete. It updates the schema of the previously created table (sscp_sales_data).
  13. Verify the new version of the table is created on the Tables page.Now we run the AWS Glue ETL job to check if there is a new version of the table schema and list the changes in the schema with the previous version of the schema in CloudWatch Logs.
  14. On the AWS Glue console, choose Jobs in the navigation pane.
  15. Select your job (find-change-job-sscp) and on the Actions menu, choose Edit script.
  16. Change the following input parameters for the job in the script to match with your configuration:
  17. Choose Save.
  18. Close the script editor.
  19. Select the job again and on the Actions menu, choose Run job.
  20. Leave all default parameters and choose Run job.
  21. To monitor the job status, choose the job and review the History tab.
  22. When the job is complete, choose the Output link to open the CloudWatch logs for the job.

The log should show the changes identified by the AWS Glue job.

You should also receive an email with details on the changes in the schema. The following is an example of an email received.

We can now review the changes identified by the AWS Glue ETL job and make changes in the downstream data store accordingly before running the job to propagate the data from the S3 bucket to downstream applications. For example, if you have an Amazon Redshift table, after the job lists all the schema changes, you need to connect to the Amazon Redshift database and make these schema changes. Follow the change request process set by your organization before making schema changes in your production system.

The following table has a list of mappings for Apache Hive and Amazon Redshift data types. You can find similar mappings for other data stores and update your downstream data store.

The provided Python code takes care of the logic to compare the schema changes. The script takes in the parameters of the AWS Glue Data Catalog ID, AWS Glue database name, and AWS Glue table name.

Hive Data Types Description Amazon Redshift Data Types Description
TINYINT 1 byte integer . .
SMALLINT Signed two-byte integer SMALLINT Signed two-byte integer
INT Signed four-byte integer INT Signed four-byte integer
BIGINT Signed eight-byte integer BIGINT Signed eight-byte integer
DECIMAL . . .
DOUBLE . . .
STRING . VARCHAR, CHAR .
VARCHAR 1 to 65355, available starting with Hive 0.12.0 VARCHAR .
CHAR 255 length, available starting with Hive 0.13.0 CHAR .
DATE year/month/day DATE year/month/day
TIMESTAMP No timezone TIME Time without time zone
. . TIMETZ Time with time zone
ARRAY/STRUCTS . SUPER .
BOOLEAN . BOOLEAN .
BINARY . VARBYTE Variable-length binary value

Clean up

When you’re done exploring the solution, clean up the resources you created as part of this walkthrough:

  • AWS Glue ETL job (find-change-job-sscp)
  • AWS Glue crawler (glue-crawler-sscp-sales-data)
  • AWS Glue table (sscp_sales_data)
  • AWS Glue database (sscp-database)
  • IAM role for the crawler and ETL job (AWSGlueServiceRole-sscp-blog)
  • S3 bucket (aws-blog-sscp-ng-202202) with all the files in the data and archived folders
  • SNS topic and subscription (NotifySchemaChanges)

Conclusion

In this post, we showed you how to use AWS services together to detect schema changes in your source data, which you can then use to change your downstream data stores and run ETL jobs to avoid any failures in your data pipeline. We used AWS Glue to understand and catalog the source data schema, AWS Glue APIs to identify schema changes, and Amazon SNS to notify the team about the changes. We also showed you how to delete the older versions of your source data schema using AWS Glue APIs. We used Amazon S3 as our data lake storage tier.

Here you can learn more about AWS Glue.


About the authors

Narendra Gupta is a Specialist Solutions Architect at AWS, helping customers on their cloud journey with a focus on AWS analytics services. Outside of work, Narendra enjoys learning new technologies, watching movies, and visiting new places.

Navnit Shukla is AWS Specialist Solutions Architect in Analytics. He is passionate about helping customers uncover insights from their data. He has been building solutions to help organizations make data-driven decisions.

Implement step-up authentication with Amazon Cognito, Part 2: Deploy and test the solution

Post Syndicated from Salman Moghal original https://aws.amazon.com/blogs/security/implement-step-up-authentication-with-amazon-cognito-part-2-deploy-and-test-the-solution/

This solution consists of two parts. In the previous blog post Implement step-up authentication with Amazon Cognito, Part 1: Solution overview, you learned about the architecture and design of a step-up authentication solution that uses AWS services such as Amazon API Gateway, Amazon Cognito, Amazon DynamoDB, and AWS Lambda to protect privileged API operations. In this post, you will use a reference implementation to deploy and test the step-up authentication solution in your AWS account.

Solution deployment

The step-up authentication solution discussed in Part 1 uses a reference implementation that you can use for demonstration and learning purposes. You can also review the implementation code in the step-up-auth GitHub repository. The reference implementation includes a web application that you can use in the following sections to test the step-up implementation. Additionally, the implementation contains a sample privileged API action /transfer and a non-privileged API action /info, and two step-up authentication solution API operations /initiate-auth, and /respond-to-challenge. The web application invokes these API operations to demonstrate how to perform step-up authentication.

Deployment prerequisites

The following are prerequisites for deployment:

  1. The Node.js runtime and the node package manager (npm) are installed on your machine. You can use a package manager for your platform to install these. Note that the reference implementation code was tested using Node.js v16 LTS.
  2. The AWS Cloud Development Kit (AWS CDK) is installed in your environment.
  3. The AWS Command Line Interface (AWS CLI) is installed in your environment.
  4. You must have AWS credentials files that contain a profile with your account secret key and access key to perform the deployment. Make sure that your account has enough privileges to create, update, or delete the following resources:
  5. A two-factor authentication (2FA) mobile application, such as Google Authenticator, is installed on your mobile device.

Deploy the step-up solution

You can deploy the solution by using the AWS CDK, which will create a working reference implementation of the step-up authentication solution.

To deploy the solution

  1. Build the necessary resources by using the build.sh script in the deployment folder. Run the build script from a terminal window, using the following command:
    cd deployment && ./build.sh
  2. Deploy the solution by using the deploy.sh script that is present in the deployment folder, using the following command. Be sure to replace the required environment variables with your own values.
    export AWS_REGION=<your AWS Region of choice, for example us-east-2>
    export AWS_ACCOUNT=<your account number>
    export AWS_PROFILE=<a valid profile in .aws/credentials that contains the secret/access key to your account>
    export NODE_ENV=development
    export ENV_PREFIX=dev

    The account you specify in the AWS_ACCOUNT environment variable is used to bootstrap the AWS CDK deployment. Set AWS_PROFILE to point to your profile. Make sure that your account has sufficient privileges, as described in the prerequisites.

    The NODE_ENV environment variable can be set to development or production. This variable controls the log output that the Lambda functions generate. The ENV_PREFIX environment variable allows you to prefix all resources with a tag, which enables a multi-tenant deployment of this solution.

  3. Still in the deployment folder, deploy the stack by using the following command:
    ./deploy.sh
  4. Make note of the CloudFront distribution URL that follows Sample Web App URL, as shown in Figure 1. In the next section, you will use this CloudFront distribution URL to load the sample web app in a web browser and test the step-up solution
    Figure 1: The output of the deployment process

    Figure 1: The output of the deployment process

After the deployment script deploy.sh completes successfully, the AWS CDK creates the following resources in your account:

  • An Amazon Cognito user pool that is used as a user registry.
  • An Amazon API Gateway API that contains three resources:
    • A protected resource that requires step-up authentication.
    • An initiate-auth resource to start the step-up challenge response.
    • A respond-to-challenge resource to complete the step-up challenge.
  • An API Gateway Lambda authorizer that is used to protect API actions.
  • The following Amazon DynamoDB tables:
    • A setting table that holds the configuration mapping of the API operations that require elevated privileges.
    • A session table that holds temporary, user-initiated step-up sessions and their current status.
  • A React web UI that demonstrates how to invoke a privileged API action and go through step-up authentication.

Test the step-up solution

In order to test the step-up solution, you’ll use the sample web application that you deployed in the previous section. Here’s an overview of the actions you’ll perform to test the flow:

  1. In the AWS Management Console, create items in the setting DynamoDB table that point to privileged API actions. After the solution deployment, the setting DynamoDB table is called step-up-auth-setting-<ENV_PREFIX>. For more information about ENV_PREFIX variable usage in a multi-tenant environment, see Deploy the step-up solution earlier in this post.

    As discussed, in the Data design section in Part 1 of this series, the Lambda authorizer treats all API invocations as non-privileged (that is, they don’t require step-up authentication) unless there is a matching entry for the API action in the setting table. Additionally, you can switch a privileged API action to a non-privileged API action by simply changing the stepUpState attribute in the setting table. Create an item in the DynamoDB table for the sample /transfer API action and for the sample /info API action. The /transfer API action will require step-up authentication, whereas the /info API action will be a non-privileged invocation that does not require step-up authentication. Note that there is no need to define a non-privileged API action in the table; it is there for illustration purposes only.

  2. If you haven’t already, install Google Authenticator or a similar two-factor authentication (2FA) application on your mobile device.
  3. Using the sample web application, register a new user in Amazon Cognito.
  4. Log in to the sample web application by using the registered new user.
  5. Configure the preferred multi-factor authentication (MFA) settings for the logged in user in the application. This step is necessary so that Amazon Cognito can challenge the user with a one-time password (OTP).
  6. Using the sample web application, invoke the sample /transfer privileged API action that requires step-up authentication.
  7. The Lambda authorizer will intercept the API request and return a 401 Unauthorized response status code that the sample web application will handle. The application will perform step-up authentication by prompting you to provide additional security credentials, specifically the OTP. To complete the step-up authentication, enter the OTP, which is sent through short service message (SMS) or by using an authenticator mobile app.
  8. Invoke the sample /transfer privileged API action again in the sample web application, and verify that the API invocation is successful.

The following instructions assume that you’ve installed a 2FA mobile application, such as Google Authenticator, on your mobile device. You will configure the 2FA application in the following steps and use the OTP from this mobile application when prompted to enter the step-up challenge. You can configure Amazon Cognito to send you an SMS with the OTP. However, you must be aware of the Amazon Cognito throttling limits. See the Additional considerations section in Part 1 of this series. Read these limits carefully, especially if you set the user’s preferred MFA setting to SMS.

To test the step-up authentication solution

  1. Open the Amazon DynamoDB console and log in to your AWS account.
  2. On the left nav pane, under Tables, choose Explore items. In the right pane, choose the table named step-up-auth-setting* and choose Create item, as shown in Figure 2.
    Figure 2: Choose the step-up-auth-setting* table and choose Create item button

    Figure 2: Choose the step-up-auth-setting* table and choose Create item button

  3. In the Edit item screen as shown in Figure 3, ensure that JSON is selected, and the Attributes button for View DynamoDB JSON is off.
    Figure 3: Edit an item in the table - select JSON and turn off View DynamoDB JSON button

    Figure 3: Edit an item in the table – select JSON and turn off View DynamoDB JSON button

  4. To create an entry for the /info API action, copy the following JSON text:
    {
       "id": "/info",
       "lastUpdateTimestamp": "2021-08-23T08:25:29.023Z",
       "stepUpState": "STEP_UP_NOT_REQUIRED",
       "createTimestamp": "2021-08-23T08:25:29.023Z"
    }
  5. Paste the copied JSON text for the /info API action in the Attributes text area, as shown in Figure 4, and choose Create item.
    Figure 4: Create an entry for the /info API action

    Figure 4: Create an entry for the /info API action

  6. To create an entry for the /transfer API action, copy the following JSON text:
    {
       "id": "/transfer",
       "lastUpdateTimestamp": "2021-08-23T08:22:12.436Z",
       "stepUpState": "STEP_UP_REQUIRED",
       "createTimestamp": "2021-08-23T08:22:12.436Z"
    }
  7. Paste the copied JSON text for the /transfer API action in the Attributes text area, as shown in Figure 4, and choose Create item.
    Figure 5: Create an entry for the /transfer API action

    Figure 5: Create an entry for the /transfer API action

  8. Open your web browser and load the CloudFront URL that you made note of in step 4 of the Deploy the step-up solution procedure.
  9. On the login screen of the sample web application, enter the information for a new user. Make sure that the email address and phone numbers are valid. Choose Register. You will be prompted to enter a verification code. Check your email for the verification code, and enter it at the sample web application prompt.
  10. You will be sent back to the login screen. Log in as the user that you just registered. You will see the welcome screen, as shown in Figure 6.
    Figure 6: Welcome screen of the sample web application

    Figure 6: Welcome screen of the sample web application

  11. In the left nav pane choose Setting, choose the Configure button to the right of Software Token, as shown in Figure 7. Use your mobile device camera to capture the QR code on the screen in your 2FA application, for example Google Authenticator.
    Figure 7: Configure Software Token screen with QR code

    Figure 7: Configure Software Token screen with QR code

  12. Enter the temporary code from the 2FA application into the web application and choose Submit. You will see the message Software Token successfully configured!
  13. Still in the Setting menu, next to Select Preferred MFA, choose Software Token. You will see the message User preferred MFA set to Software Token, as shown in Figure 8.
    Figure 8: Completed Software Token setup

    Figure 8: Completed Software Token setup

  14. In the left nav pane choose StepUp Auth. In the right pane, choose Invoke Transfer API. You should see Response: 401 authorization challenge, as shown in Figure 9.
    Figure 9: The step-up API invocation returns an authorization challenge

    Figure 9: The step-up API invocation returns an authorization challenge

  15. On your mobile device, open the 2FA application, copy the OTP code from the 2FA application, and enter the code into the Enter OTP field, as shown in Figure 9. Choose Submit.
  16. This sends the OTP to the respond-to-challenge endpoint. After the OTP is verified, the endpoint will return a success or failure message. Figure 10 shows a successful OTP verification. You are prompted to invoke the /transfer privileged API action again.
    Figure 10: The OTP prompt during step-up API invocation

    Figure 10: The OTP prompt during step-up API invocation

  17. Invoke the transfer API action again by choosing Invoke Transfer API. You should see a success message as shown in Figure 11.
    Figure 11: A successful step-up API invocation

    Figure 11: A successful step-up API invocation

    Congratulations! You’ve successfully performed step-up authentication.

Conclusion

In the previous post in this series, Implement step-up authentication with Amazon Cognito, Part 1: Solution overview, you learned about the architecture and implementation details for the step-up authentication solution. In this blog post, you learned how to deploy and test the step-up authentication solution in your AWS account. You deployed the solution by using scripts from the step-up-auth GitHub repository that use the AWS CDK to create resources in your account for Amazon Cognito, Amazon API Gateway, a Lambda authorizer, and Amazon DynamoDB. Finally, you tested the end-to-end solution on a sample web application by invoking a privileged API action that required step-up authentication. Using the 2FA application, you were able to pass in an OTP to complete the step-up authentication and subsequently successfully invoke the privileged API action.

For more information about AWS Cognito user pools and the new console experience, watch the video Amazon Cognito User Pools New Console Walkthrough on the AWS channel on YouTube. And for more information about how to protect your API actions with fine-grained access controls, see the blog post Building fine-grained authorization using Amazon Cognito, API Gateway, and IAM.

If you have feedback about this post, submit comments in the Comments section below. If you have any questions about this post, start a thread on the Amazon Cognito forum.

Want more AWS Security news? Follow us on Twitter.

Salman Moghal

Salman Moghal

Salman is a Principal Consultant in AWS Professional Services, based in Toronto, Canada. He helps customers in architecting, developing, and reengineering data-driven applications at scale, with a sharp focus on security.

Thomas Ross

Thomas Ross

Thomas is a Software Engineering student at Carleton University. He worked at AWS as a Professional Services Intern and a Software Development Engineer Intern in Amazon Aurora. He has an interest in almost anything related to technology, especially systems at high scale, security, distributed systems, and databases.

Ozair Sheikh

Ozair Sheikh

Ozair is a senior product leader for Sponsored Display in Amazon ads, based in Toronto, Canada. He helps advertisers and Ad Tech API Partners build campaign management solutions to reach customers across the purchase journey. He has over 10 years of experience in API management and security, with an obsession for delivering highly secure API products.

Mahmoud Matouk

Mahmoud Matouk

Mahmoud is a Principal Solutions Architect with the Amazon Cognito team. He helps AWS customers build secure and innovative solutions for various identity and access management scenarios.

Implement step-up authentication with Amazon Cognito, Part 1: Solution overview

Post Syndicated from Salman Moghal original https://aws.amazon.com/blogs/security/implement-step-up-authentication-with-amazon-cognito-part-1-solution-overview/

In this blog post, you’ll learn how to protect privileged business transactions that are exposed as APIs by using multi-factor authentication (MFA) or security challenges. These challenges have two components: what you know (such as passwords), and what you have (such as a one-time password token). By using these multi-factor security controls, you can implement step-up authentication to obtain a higher level of security when you perform critical transactions. In this post, we show you how you can use AWS services such as Amazon API Gateway, Amazon Cognito, Amazon DynamoDB, and AWS Lambda functions to implement step-up authentication by using a simple rule-based security model for your API resources.

Previously, identity and access management solutions have attempted to deliver step-up authentication by retrofitting their runtimes with stateful server-side management, which doesn’t scale in the modern-day stateless cloud-centered application architecture. We’ll show you how to use a pluggable, stateless authentication implementation that integrates into your existing infrastructure without compromising your security or performance. The Amazon API Gateway Lambda authorizer is a pluggable serverless function that acts as an intermediary step before an API action is invoked. This Lambda authorizer, coupled with a small SDK library that runs in the authorizer, will provide step-up authentication.

This solution consists of two blog posts. This is Part 1, where you’ll learn about the step-up authentication solution architecture and design. In the next post, Implement step-up authentication with Amazon Cognito, Part 2: Deploy and test the solution, you’ll learn how to use a reference implementation to test the step-up authentication solution.

Prerequisites

The reference architecture in this post uses a purpose-built step-up authorization workflow engine, which uses a custom SDK. The custom SDK uses the DynamoDB service as a persistent layer. This workflow engine is generic and can be used across any API serving layers, such as API Gateway or Elastic Load Balancing (ELB) Application Load Balancer, as long as the API serving layers can intercept API requests to perform additional actions. The step-up workflow engine also relies on an identity provider that is capable of issuing an OAuth 2.0 access token.

There are three parts to the step-up authentication solution:

  1. An API serving layer with the capability to apply custom logic before applying business logic.
  2. An OAuth 2.0–capable identity provider system.
  3. A purpose-built step-up workflow engine.

The solution in this post uses Amazon Cognito as the identity provider, with an API Gateway Lambda authorizer to invoke the step-up workflow engine, and DynamoDB as a persistent layer used by the step-up workflow engine. You can see a reference implementation of the API Gateway Lambda authorizer in the step-up-auth GitHub repository. Additionally, the purpose-built step-up workflow engine provides two API endpoints (or API actions), /initiate-auth and /respond-to-challenge, which are realized using the API Gateway Lambda authorizer, to drive the API invocation step-up state.

Note: If you decide to use an API serving layer other than API Gateway, or use an OAuth 2.0 identity provider besides Amazon Cognito, you will have to make changes to the accompanying sample code in the step-up-auth GitHub repository.

Solution architecture

Figure 1 shows the high-level reference architecture.

Figure 1: Step-up authentication high-level reference architecture

Figure 1: Step-up authentication high-level reference architecture

First, let’s talk about the core components in the step-up authentication reference architecture in Figure 1.

Identity provider

In order for a client application or user to invoke a protected backend API action, they must first obtain a valid OAuth token or JSON web token (JWT) from an identity provider. The step-up authentication solution uses Amazon Cognito as the identity provider. The step-up authentication solution and the accompanying step-up API operations use the access token to make the step-up authorization decision.

Protected backend

The step-up authentication solution uses API Gateway to protect backend resources. API Gateway supports several different API integration types, and you can use any one of the supported API Gateway integration types. For this solution, the accompanying sample code in the step-up-auth GitHub repository uses Lambda proxy integration to simulate a protected backend resource.

Data design

The step-up authentication solution relies on two DynamoDB tables, a session table and a setting table. The session table contains the user’s step-up session information, and the setting table contains an API step-up configuration. The API Gateway Lambda authorizer (described in the next section) checks the setting table to determine whether the API request requires a step-up session. For more information about table structure and sample values, see the Step-up authentication data design section in the accompanying GitHub repository.

The session table has the DynamoDB Time to Live (TTL) feature enabled. An item stays in the session table until the TTL time expires, when DynamoDB automatically deletes the item. The TTL value can be controlled by using the environment variable SESSION_TABLE_ITEM_TTL. Later in this post, we’ll cover where to define this environment variable in the Step-up solution design details section; and we’ll cover how to set the optimal value for this environment variable in the Additional considerations section.

Authorizer

The step-up authentication solution uses a purpose-built request parameter-based Lambda authorizer (also called a REQUEST authorizer). This REQUEST authorizer helps protect privileged API operations that require a step-up session.

The authorizer verifies that the API request contains a valid access token in the HTTP Authorization header. Using the access token’s JSON web token ID (JTI) claim as a key, the authorizer then attempts to retrieve a step-up session from the session table. If a session exists and its state is set to either STEP_UP_COMPLETED or STEP_UP_NOT_REQUIRED, then the authorizer lets the API call through by generating an allow API Gateway Lambda authorizer policy. If the set-up state is set to STEP_UP_REQUIRED, then the authorizer returns a 401 Unauthorized response status code to the caller.

If a step-up session does not exist in the session table for the incoming API request, then the authorizer attempts to create a session. It first looks up the setting table for the API configuration. If an API configuration is found and the configuration status is set to STEP_UP_REQUIRED, it indicates that the user must provide additional authentication in order to call this API action. In this case, the authorizer will create a new session in the session table by using the access token’s JTI claim as a session key, and it will return a 401 Unauthorized response status code to the caller. If the API configuration in the setting table is set to STEP_UP_DENY, then the authorizer will return a deny API Gateway Lambda authorizer policy, therefore blocking the API invocation. The caller will receive a 403 Forbidden response status code.

The authorizer uses the purpose-built auth-sdk library to interface with both the session and setting DynamoDB tables. The auth-sdk library provides convenient methods to create, update, or delete items in tables. Internally, auth-sdk uses the DynamoDB v3 Client SDK.

Initiate auth endpoint

When you deploy the step-up authentication solution, you will get the following two API endpoints:

  1. The initiate step-up authentication endpoint (described in this section).
  2. The respond to step-up authentication challenge endpoint (described in the next section).

When a client receives a 401 Unauthorized response status code from API Gateway after invoking a privileged API operation, the client can start the step-up authentication flow by invoking the initiate step-up authentication endpoint (/initiate-auth).

The /initiate-auth endpoint does not require any extra parameters, it only requires the Amazon Cognito access_token to be passed in the Authorization header of the request. The /initiate-auth endpoint uses the access token to call the Amazon Cognito API actions GetUser and GetUserAttributeVerificationCode on behalf of the user.

After the /initiate-auth endpoint has determined the proper multi-factor authentication (MFA) method to use, it returns the MFA method to the client. There are three possible values for the MFA methods:

  • MAYBE_SOFTWARE_TOKEN_STEP_UP, which is used when the MFA method cannot be determined.
  • SOFTWARE_TOKEN_STEP_UP, which is used when the user prefers software token MFA.
  • SMS_STEP_UP, which is used when the user prefers short message service (SMS) MFA.

Let’s take a closer look at how /initiate-auth endpoint determines the type of MFA methods to return to the client. The endpoint calls Amazon Cognito GetUser API action to check for user preferences, and it takes the following actions:

  1. Determines what method of MFA the user prefers, either software token or SMS.
  2. If the user’s preferred method is set to software token, the endpoint returns SOFTWARE_TOKEN_STEP_UP code to the client.
  3. If the user’s preferred method is set to SMS, the endpoint sends an SMS message with a code to the user’s mobile device. It uses the Amazon Cognito GetUserAttributeVerificationCode API action to send the SMS message. After the Amazon Cognito API action returns success, the endpoint returns SMS_STEP_UP code to the client.
  4. When the user preferences don’t include either a software token or SMS, the endpoint checks if the response from Amazon Cognito GetUser API action contains UserMFASetting response attribute list with either SOFTWARE_TOKEN_MFA or SMS_MFA keywords. If the UserMFASetting response attribute list contains SOFTWARE_TOKEN_MFA, then the endpoint returns SOFTWARE_TOKEN_STEP_UP code to the client. If it contains SMS_MFA keyword, then the endpoint invokes the Amazon Cognito GetUserAttributeVerificationCode API action to send the SMS message (as in step 3). Upon successful response from the Amazon Cognito API action, the endpoint returns SMS_STEP_UP code to the client.
  5. If the UserMFASetting response attribute list from Amazon Cognito GetUser API action does not contain SOFTWARE_TOKEN_MFA or SMS_MFA keywords, then the endpoint looks for phone_number_verified attribute. If found, then the endpoint sends an SMS message with a code to the user’s mobile device with verified phone number. The endpoint uses the Amazon Cognito GetUserAttributeVerificationCode API action to send the SMS message (as in step 3). Otherwise, when no verified phone is found, the endpoint returns MAYBE_SOFTWARE_TOKEN_STEP_UP code to the client.

The flowchart shown in Figure 2 illustrates the full decision logic.

Figure 2: MFA decision flow chart

Figure 2: MFA decision flow chart

Respond to challenge endpoint

The respond to challenge endpoint (/respond-to-challenge) is called by the client after it receives an appropriate MFA method from the /initiate-auth endpoint. The user must respond to the challenge appropriately by invoking /respond-to-challenge with a code and an MFA method.

The /respond-to-challenge endpoint receives two parameters in the POST body, one indicating the MFA method and the other containing the challenge response. Additionally, this endpoint requires the Amazon Cognito access token to be passed in the Authorization header of the request.

If the MFA method is SMS_STEP_UP, the /respond-to-challenge endpoint invokes the Amazon Cognito API action VerifyUserAttribute to verify the user-provided challenge response, which is the code that was sent by using SMS.

If the MFA method is SOFTWARE_TOKEN_STEP_UP or MAYBE_SOFTWARE_TOKEN_STEP_UP, the /respond-to-challenge endpoint invokes the Amazon Cognito API action VerifySoftwareToken to verify the challenge response that was sent in the endpoint payload.

After the user-provided challenge response is verified, the /respond-to-challenge endpoint updates the session table with the step-up session state STEP_UP_COMPLETED by using the access_token JTI. If the challenge response verification step fails, no changes are made to the session table. As explained earlier in the Data design section, the step-up session stays in the session table until the TTL time expires, when DynamoDB will automatically delete the item.

Deploy and test the step-up authentication solution

If you want to test the step-up authentication solution at this point, go to the second part of this blog, Implement step-up authentication with Amazon Cognito, Part 2: Deploy and test the solution. That post provides instructions you can use to deploy the solution by using the AWS Cloud Development Kit (AWS CDK) in your AWS account, and test it by using a sample web application.

Otherwise, you can continue reading the rest of this post to review the details and code behind the step-up authentication solution.

Step-up solution design details

Now let’s dig deeper into the step-up authentication solution. Figure 3 expands on the high-level solution design in the previous section and highlights the sequence of events that must take place to perform step-up authentication. In this section, we’ll break down these sequences into smaller parts and discuss each by going over a detailed sequence diagram.

Figure 3: Step-up authentication detailed reference architecture

Figure 3: Step-up authentication detailed reference architecture

Let’s group the step-up authentication flow in Figure 3 into three parts:

  1. Create a step-up session (steps 1-6 in Figure 3)
  2. Initiate step-up authentication (steps 7-8 in Figure 3)
  3. Respond to the step-up challenge (steps 9-12 in Figure 3)

In the next sections, you’ll learn how the user’s API requests are handled by the step-up authentication solution, and how the user state is elevated by going through an additional challenge.

Create a step-up session

After the user successfully logs in, they create a step-up session when invoking a privileged API action that is protected with the step-up Lambda authorizer. This authorizer determines whether to start a step-up challenge based on the configuration within the DynamoDB setting table, which might create a step-up session in the DynamoDB session table. Let’s go over steps 1–6, shown in the architecture diagram in Figure 3, in more detail:

  • Step 1 – It’s important to note that the user must authenticate with Amazon Cognito initially. As a result, they must have a valid access token generated by the Amazon Cognito user pool.
  • Step 2 – The user then invokes a privileged API action and passes the access token in the Authorization header.
  • Step 3 – The API action is protected by using a Lambda authorizer. The authorizer first validates the token by invoking the Amazon Cognito user pool public key. If the token is invalid, a 401 Unauthorized response status code can be sent immediately, prompting the client to present a valid token.
  • Step 4 – The authorizer performs a lookup in the DynamoDB setting table to check whether the current request needs elevated privilege (also known as step-up privilege). In the setting table, you can define which API actions require elevated privilege. You can additionally bundle API operations into a group by defining the group attribute. This allows you to further isolate privileged API operations, especially in a large-scale deployment.
  • Step 5 – If an API action requires elevated privilege, the authorizer will check for an existing step-up session for this specific user in the session table. If a step-up session does not exist, the authorizer will create a new entry in the session table. The key for this table will be the JTI claim of the access_token (which can be obtained after token verification).
  • Step 6 – If a valid session exists, then authorization will be given. Otherwise an unauthorized access response (401 HTTP code) will be sent back from the Lambda authorizer, indicating that the user requires elevated privilege.

Figure 4 highlights these steps in a sequence diagram.

Figure 4: Sequence diagram for creating a step-up session

Figure 4: Sequence diagram for creating a step-up session

Initiate step-up authentication

After the user receives a 401 Unauthorized response status code from invoking the privileged API action in the previous step, the user must call the /initiate-auth endpoint to start step-up authentication. The endpoint will return the response to the user or the client application to supply the temporary code. Let’s go over steps 7 and 8, shown in the architecture diagram in Figure 3, in more detail:

  • Step 7 – The client application initiates a step-up action by calling the /initiate-auth endpoint. This action is protected by the API Gateway built-in Amazon Cognito authorizer, and the client needs to pass a valid access_token in the Authorization header.
  • Step 8 – The call is forwarded to a Lambda function that will initiate the step-up action with the end user. The function first calls the Amazon Cognito API action GetUser to find out the user’s MFA settings. Depending on which MFA type is enabled for the user, the function uses different Amazon Cognito API operations to start the MFA challenge. For more details, see the Initiate auth endpoint section earlier in this post.

Figure 5 shows these steps in a sequence diagram.

Figure 5: Sequence diagram for invoking /initiate-auth to start step-up authentication

Figure 5: Sequence diagram for invoking /initiate-auth to start step-up authentication

Respond to the step-up challenge

In the previous step, the user receives a challenge code from the /initiate-auth endpoint. Depending on the type of challenge code, user must respond by sending a one-time password (OTP) to the /respond-to-challenge endpoint. The /respond-to-challenge endpoint invokes an Amazon Cognito API action to verify the OTP. Upon successful verification, the /respond-to-challenge endpoint marks the step-up session in the session table to STEP_UP_COMPLETED, indicating that the user now has elevated privilege. At this point, the user can invoke the privileged API action again to perform the elevated business operation. Let’s go over steps 9–12, shown in the architecture diagram in Figure 3, in more detail:

  • Step 9 – The client application presents an appropriate screen to the user to collect a response to the step-up challenge. The client application calls the /respond-to-challenge endpoint that contains the following:
    1. An access_token in the Authorization header.
    2. A step-up challenge type.
    3. A response provided by the user to the step-up challenge.

    This endpoint is protected by the API Gateway built-in Amazon Cognito authorizer.

  • Step 10 – The call is forwarded to the Lambda function, which verifies the response by calling the Amazon Cognito API action VerifyUserAttribute (in the case of SMS_STEP_UP) or VerifySoftwareToken (in the case of SOFTWARE_TOKEN_STEP_UP), depending on the type of step-up action that was returned from the /initiate-auth API action. The Amazon Cognito response will indicate whether verification was successful.
  • Step 11 – If the Amazon Cognito response in the previous step was successful, the Lambda function associated with the /respond-to-challenge endpoint inserts a record in the session table by using the access_token JTI as key. This record indicates that the user has completed step-up authentication. The record is inserted with a time to live (TTL) equal to the lesser of these values: the remaining period in the access_token timeout, or the default TTL value that is set in the Lambda function as a configurable environment variable, SESSION_TABLE_ITEM_TTL. The /respond-to-challenge endpoint returns a 200 status code after successfully updating the session table. It returns a 401 Unauthorized response status code if the operation failed or if the Amazon Cognito API calls in the previous step failed. For more information about the optimal value for the SESSION_TABLE_ITEM_TTL variable, see the Additional considerations section later in this post.
  • Step 12 – The client application can re-try the original call (using the same access token) to the privileged API operations, and this call should now succeed because an active step-up session exists for the user. Calls to other privileged API operations that require step-up should also succeed, as long as the step-up session hasn’t expired.

Figure 6 shows these steps in a sequence diagram.

Figure 6: Invoke the /respond-to-challenge endpoint to complete step-up authentication

Figure 6: Invoke the /respond-to-challenge endpoint to complete step-up authentication

Additional considerations

This solution uses several Amazon Cognito API operations to provide step-up authentication functionality. Amazon Cognito applies rate limiting on all API operations categories, and rapid calls that exceed the assigned quota will be throttled.

The step-up flow for a single user can include multiple Amazon Cognito API operations such as GetUser, GetUserAttributeVerificationCode, VerifyUserAttribute, and VerifySoftwareToken. These Amazon Cognito API operations have different rate limits. The effective rate, in requests per second (RPS), that your privileged and protected API action can achieve will be equivalent to the lowest category rate limit among these API operations. When you use the default quota, your application can achieve 25 SMS_STEP_UP RPS or up to 50 SOFTWARE_TOKEN_STEP_UP RPS.

Certain Amazon Cognito API operations have additional security rate limits per user per hour. For example, the GetUserAttributeVerificationCode API action has a limit of five calls per user per hour. For that reason, we recommend 15 minutes as the minimum value for SESSION_TABLE_ITEM_TTL, as this will allow a single user to have up to four step-up sessions per hour if needed.

Conclusion

In this blog post, you learned about the architecture of our step-up authentication solution and how to implement this architecture to protect privileged API operations by using AWS services. You learned how to use Amazon Cognito as the identity provider to authenticate users with multi-factor security and API Gateway with an authorizer Lambda function to enforce access to API actions by using a step-up authentication workflow engine. This solution uses DynamoDB as a persistent layer to manage the security rules for the step-up authentication workflow engine, which helps you to efficiently manage your rules.

In the next part of this post, Implement step-up authentication with Amazon Cognito, Part 2: Deploy and test the solution, you’ll deploy a reference implementation of the step-up authentication solution in your AWS account. You’ll use a sample web application to test the step-up authentication solution you learned about in this post.

 
If you have feedback about this post, submit comments in the Comments section below. If you have any questions about this post, start a thread on the Amazon Cognito forum.

Want more AWS Security news? Follow us on Twitter.

Salman Moghal

Salman Moghal

Salman is a Principal Consultant in AWS Professional Services, based in Toronto, Canada. He helps customers in architecting, developing, and reengineering data-driven applications at scale, with a sharp focus on security.

Thomas Ross

Thomas Ross

Thomas is a Software Engineering student at Carleton University. He worked at AWS as a Professional Services Intern and a Software Development Engineer Intern in Amazon Aurora. He has an interest in almost anything related to technology, especially systems at high scale, security, distributed systems, and databases.

Ozair Sheikh

Ozair Sheikh

Ozair is a senior product leader for Sponsored Display in Amazon ads, based in Toronto, Canada. He helps advertisers and Ad Tech API Partners build campaign management solutions to reach customers across the purchase journey. He has over 10 years of experience in API management and security, with an obsession for delivering highly secure API products.

Mahmoud Matouk

Mahmoud Matouk

Mahmoud is a Principal Solutions Architect with the Amazon Cognito team. He helps AWS customers build secure and innovative solutions for various identity and access management scenarios.

Easily protect your AWS CDK-defined infrastructure with AWS WAFv2

Post Syndicated from Ramon Lopez Narvaez original https://aws.amazon.com/blogs/devops/easily-protect-your-aws-cdk-defined-infrastructure-with-aws-wafv2/

Security is a shared responsibility between AWS and the customer. When we use infrastructure as code (IaC) we want to describe workloads wholistically, and that includes the configuration of firewalls alongside the entrypoints to web applications. As we evolve the infrastructure that our application is built upon, we can adjust firewall rules in the same place.

In this post, you’ll learn how you can easily add a layer of protection to your web application that is defined in AWS Cloud Development Kit (AWS CDK) and built using Amazon CloudFront, Amazon API Gateway, Application Load Balancer, or AWS AppSync.

To accomplish this, we’ll use AWS WAFv2. Although it’s usually complex to write your own firewall rules, we can simply use AWS Managed Rules. No tedious setup required!

What is AWS WAFv2?

AWS WAFv2 is a managed web application firewall. It can be natively enabled on CloudFront, API Gateway, Application Load Balancer, or AWS AppSync and is deployed alongside these services. AWS services terminate the TCP/TLS connection, process incoming HTTP requests, and then pass the request to AWS WAF for inspection and filtering.

For example, you can use AWS WAFv2 to protect against attacks, such as cross-site request forgery (CSRF), cross-site scripting (XSS), and SQL injection (SQLi) among other threats in the OWASP Top 10.

AWS Managed Rules for AWS WAF is a set of AWS WAF rules curated and maintained by the AWS Threat Research Team that provides protection against common application vulnerabilities or other unwanted traffic, without having to write your own rules.

Prerequisites

For this walkthrough, you should have the following prerequisites:

  • An AWS account
  • An application fronted by one or more of the following services: Amazon Cloudfront, Amazon API Gateway, Application Load Balancer or AWS AppSync. From here on these are called ‘entrypoint’.
  • At least the above mentioned ‘entrypoint’ defined in AWS CDK.

Solution overview

When AWS WAF is applied to Amazon CloudFront, Amazon API Gateway, Application Load Balancer, or AWS AppSync, it inspects and filters requests before they’re forwarded to your compute infrastructure.

Figure 1. AWS WAFv2 can protect endpoints built by Amazon CloudFront, Amazon API Gateway, Application Load Balancer and AWS AppSync

Given that you have an existing web application defined in AWS CDK, we want to add a WAFv2 web ACL to its entrypoint. Instead of writing our own firewall rules to inspect and filter requests, we want to leverage an AWS Managed Rules rule group. Simultaneously, we must be able to disable or reconfigure some of the rules in the case that they cause undesirable behavior in the application.

A good first rule group to use is the core rule set (CRS) managed rule group, also named AWSManagedRulesCommonRuleSet. It contains rules that are generally applicable to web applications and provides protection against exploitation of various vulnerabilities, such as the ones described in the OWASP Top 10. You can later add more managed rule groups or write your own rules, which are specific to your application (e.g., for Windows, Linux, or WordPress).

Define the AWS WAFv2 web ACL

First, let’s give the AWS WAF module a nicely readable name:

import { aws_wafv2 as wafv2 } from 'aws-cdk-lib';

Then, we define the AWS WAFv2 web ACL in AWS CDK:

const cfnWebACL = new wafv2.CfnWebACL(this,'MyCDKWebAcl'
      defaultAction: {
        allow: {}
      },
      scope: 'REGIONAL',
      visibilityConfig: {
        cloudWatchMetricsEnabled: true,
        metricName:'MetricForWebACLCDK',
        sampledRequestsEnabled: true,
      },
      name:‘MyCDKWebAcl’,
      rules: [{
        name: 'CRSRule',
        priority: 0,
        statement: {
          managedRuleGroupStatement: {
            name:'AWSManagedRulesCommonRuleSet',
            vendorName:'AWS'
          }
        },
        visibilityConfig: {
          cloudWatchMetricsEnabled: true,
          metricName:'MetricForWebACLCDK-CRS',
          sampledRequestsEnabled: true,
        },
        overrideAction: {
          none: {}
        },
      }]
    });

The highlighted line references the CRS managed rule group as one Rule in the list. You could add more Rule elements, either referencing the managed rule groups or custom rules.

Note the scope attribute. If you want to attach this web ACL to an API Gateway, AWS AppSync API, or Application Load Balancer, then it will be REGIONAL. If you want to attach it to a CloudFront distribution, then make sure that your AWS WAFv2 web ACL is defined in the US East (N. Virginia) Region and the scope is CLOUDFRONT.

Attach the AWS WAFv2 web ACL to an Application Load Balancer, AWS AppSync API, or API Gateway

Now that we have a web ACL defined, we must attach it to a resource. This works exactly the same across API Gateway API’s, an AWS AppSync API, or an Application Load Balancer. We must create a CfnWebACLAssociation and point it to the previously created web ACL and the resource to protect:

const cfnWebACLAssociation = new wafv2.CfnWebACLAssociation(this,'MyCDKWebACLAssociation', {
      resourceArn:<ARN of resource to protect>,
      webAclArn:cfnWebACL.attrArn,
    });

Amazon Resource Names (ARNs) uniquely identify AWS resources. The highlighted line shows how AWS CDK lets you get the ARN of the previously defined CfnWebAcl.

Depending on what type of service you’re using, jump to one of the three following sections to learn how to retrieve the resourceArn of API Gateway, AWS AppSync, or Application Load Balancers.

Retrieving ARN for AWS AppSync API’s

To retrieve the ARN of an AWS AppSync API, call the .arn property:

const api = new appsync.GraphqlApi(…)
const cfnWebACLAssociation = new wafv2.CfnWebACLAssociation(this,'MyCDKWebACLAssociation', {
      resourceArn:api.arn,
      webAclArn: cfnWebACL.attrArn,
    });

Retrieving ARN for Amazon API Gateway REST API’s

In this case, we must specify which stage of the REST API we want to protect with the web ACL. Then, we reference the ARN of the stage:

const api = new apigateway.RestApi(…)
const deployment = new apigateway.Deployment(…)
const stage = apigateway.Stage(…)
const cfnWebACLAssociation = new wafv2.CfnWebACLAssociation(this,'MyCDKWebACLAssociation', {
      resourceArn:stage.stageArn,
      webAclArn: cfnWebACL.attrArn,
    });

Retrieving ARN for Application Load Balancers

If you’re dealing with an Application Load Balancer, then this is how you can retrieve its ARN:

const lb = new elbv2.ApplicationLoadBalancer(…)

const cfnWebACLAssociation = new wafv2.CfnWebACLAssociation(this,'MyCDKWebACLAssociation', {
      resourceArn:lb.loadBalancerArn,
      webAclArn: cfnWebACL.attrArn,
    });

Attach the AWS WAFv2 web ACL to a CloudFront distribution

Attaching a web ACL to CloudFront follows a different approach. Instead of defining a cfnWebACLAssociation, we reference the web ACL inside of the Distribution definition:

const distribution = new cloudfront.Distribution(this,'distro', {
      defaultBehavior: {
        origin: new origins.S3Origin(s3Bucket)
      },
     webAclId:cfnWebACL.attrArn
    });

Note that even though the property is called webAclId, because we’re using AWS WAFv2, we must supply the ARN of the web ACL.

Exclude rules from the web ACL

Lastly, let’s understand how we can customize the web ACL further. If a rule of the managed rule group causes undesired behavior in the application, then we can exclude it from the webACL. Assume that we want to exclude the SizeRestrictions_BODY rule, which limits the request body size to 8 KB.

Go back to the definition of the web ACL, and add the highlighted lines:

const cfnWebACL = new wafv2.CfnWebACL(this, 'MyCDKWebAcl', {
      defaultAction: {
        allow: {}
      },
      scope:'REGIONAL',
      visibilityConfig: {
        cloudWatchMetricsEnabled: true,
        metricName:'MetricForWebACLCDK',
        sampledRequestsEnabled: true,
      },
      name:'MyCDKWebAcl',
      rules: [{
        name:'CRSRule',
        priority: 0,
        statement: {
          managedRuleGroupStatement: {
            name: 'AWSManagedRulesCommonRuleSet',
            vendorName: 'AWS',
            excludedRules: [{
             ‘SizeRestrictions_BODY’ }]
          }
        },
        visibilityConfig: {
          cloudWatchMetricsEnabled: true,
          metricName:'MetricForWebACLCDK-CRS',
          sampledRequestsEnabled: true,
        },
        overrideAction: {
          none: {}
        },
      }]

    });

Other customizations you can do include pinning the version of the rule group and narrowing the scope of the request that the rule evaluates, using Scope-down statements.

Conclusion

In this post, you’ve seen how an AWS WAFv2 web ACL can be added to your existing infrastructure defined in AWS CDK. By using Managed Rules, your application benefits from a layer of protection that is curated and maintained by AWS security experts.

As a next step, you can learn how to include AWS WAFv2 metrics from Amazon CloudWatch into your application dashboards. This will give you perspective on how your web application is performing in conjunction with the AWS WAFv2 web ACL.

To learn more about AWS WAFv2 and how to manage web ACL’s, check out the official developer guide.

About the author:

Ramon Lopez

Ramon is a Senior Solutions Architect at AWS, where he guides, educates, and empowers customers of all sizes and industries to build successful businesses in the AWS cloud. He also built web services for 150+ million Amazon Prime customers and led a team of software engineers in a fast-paced global environment. After being immersed in one of the largest micro-service environments, he is a believer in the DevOps mantra of “You build it, you run it”.

How to set up and track SLAs for resolving Security Hub findings

Post Syndicated from Maisie Fernandes original https://aws.amazon.com/blogs/security/how-to-set-up-and-track-slas-for-resolving-security-hub-findings/

Your organization can use AWS Security Hub to gain a comprehensive view of your security and compliance posture across your Amazon Web Services (AWS) environment. Security Hub receives security findings from AWS security services and supported third-party products and centralizes them, providing a single view for identifying and analyzing security issues. Security Hub correlates findings and breaks them down into five severity categories: INFORMATIONAL, LOW, MEDIUM, HIGH, and CRITICAL. In this blog post, we provide step-by-step instructions for tracking Security Hub findings in each severity category against service-level agreements (SLAs) through visual dashboards.

SLAs are defined collaboratively by the Business, IT, and Security and Compliance teams within an organization. You can track Security Hub findings against your specific SLAs, and any findings that are in breach of an SLA can be escalated. You can also apply automation to alert the owners of the resources and remediate common security findings to improve your overall security posture.

Prerequisites

Security Hub uses service-linked AWS Config rules to perform security checks behind the scenes. To support these controls, you must enable AWS Config on all accounts, including the administrator and member accounts, in each AWS Region where Security Hub is enabled.

As a best practice, we recommend that you enable AWS Config and Security Hub across all of your accounts and Regions. For more information on how to do this, see Enabling and configuring AWS Config and Setting up Security Hub.

Solution overview

In this solution, you will learn two different ways to track your findings in Security Hub against the pre-defined SLA for each severity category.

Option 1: Use custom insights

Security Hub offers managed insights, which include a collection of related findings that identify a security issue that requires attention and intervention. You can view and take action on the insight findings. In addition to the managed insights, you can create custom insights to track issues and findings related to your resources in your environment.

Create a custom insight for SLA tracking

In this example, you set an SLA of 30 days for HIGH severity findings. This example will provide you with a view of the HIGH severity findings that were generated within the last 30 days and haven’t been resolved.

To create a custom insight to view HIGH severity findings from the last 30 days

  1. In the Security Hub console, in the left navigation pane, choose Insights.
  2. On the Insights page, choose Create insight, as shown in Figure 1.
    Figure 1: Create insight in the Security Hub console

    Figure 1: Create insight in the Security Hub console

  3. On the Create insight page, in the search box, leave the following default filters: Workflow status is NEW, Workflow status is NOTIFIED, and Record state is ACTIVE, as show in Figure 2.
  4. To select the required grouping attribute for the insight, choose the search box to display the filter options. In the search box, choose the following filters and settings:
    1. Choose the Group by filter, and select WorkflowStatus.
      Figure 2: Create insights using filters

      Figure 2: Create insights using filters

    2. Choose the Severity label filter and enter HIGH.
    3. Choose the Created at filter and enter 30 to indicate the number of days you want to set as your SLA.
  5. Choose Create insight again.
  6. For Insight name, enter a meaningful name (for this example, we entered UnresolvedHighSevFindings), and then choose Create insight again.

You can repeat the same steps for other finding severities – CRITICAL, MEDIUM, LOW, and INFORMATIONAL; you can change the number of days you specify for the Created at filter to meet your SLA requirements; or specify different workflow status settings. Note that the workflow status can have the following values:

  • NEW – The initial state of a finding before you review it.
  • NOTIFIED – Indicates that the resource owner has been notified about the security issue.
  • SUPPRESSED – Indicates that you have reviewed the finding and no action is required.
  • RESOLVED – Indicates that the finding has been reviewed and remediated.

Your custom insight will show the findings that meet the criteria you defined. For more information about creating custom insights, see Module 2: Custom Insights in the Security Hub Workshop.

Option 2: Build visualizations for Security Hub findings data by using Amazon QuickSight

We hear from our customers that your organizations are looking for a solution where you can quickly visualize the status of your Security Hub findings, to see which findings you need to take action on (NEW and NOTIFIED) and which you do not (SUPPRESSED and RESOLVED). You can achieve this by building a data analytics pipeline that uses Amazon EventBridge, Amazon Kinesis Data Firehose, Amazon Simple Storage Service (Amazon S3), Amazon Athena, and Amazon QuickSight. The data analytics pipeline enables you to detect, analyze, contain, and mitigate issues quickly.

This solution integrates Security Hub with EventBridge to set SLA rules to a specified period of your choice for each severity level. For example, you can set the SLA to 5 days for CRITICAL severity findings, 10 days for HIGH severity findings, 14 days for MEDIUM severity findings, 30 days for LOW severity findings, and 60 days for INFORMATIONAL severity findings.

Architecture overview

Figure 3 shows the architectural overview of the QuickSight solution workflow.

Figure 3: Architecture diagram for option 2, the QuickSight solution

Figure 3: Architecture diagram for option 2, the QuickSight solution

In the QuickSight solution, Security Hub publishes the findings to EventBridge, and then an EventBridge rule (based on the SLA) is configured to deliver the findings to Kinesis Data Firehose. For example, if the SLA is 14 days for all MEDIUM severity findings, then those findings will be filtered by the rule and sent to Kinesis Data Firehose. Security Hub findings follow the AWS Security Finding Format (ASFF).

The following is a sample EventBridge rule that filters the Security Hub findings for MEDIUM severity and workflow status NEW, before publishing the findings to Kinesis Data Firehose, and then finally to Amazon S3 for storage. A workflow status of NEW and NOTIFIED should be included to catch all findings that require action.

{
  "source": ["aws.securityhub"],
  "detail-type": ["Security Hub Findings - Imported"],
  "detail": {
    "findings": {
      "Severity": {
        "Label": ["MEDIUM"]
      },
      "Workflow": {
        "Status": ["NEW"]
      }
    }
  }
}

After the findings are exported and stored in Amazon S3, you can use Athena to run queries on the data and you can use Amazon QuickSight to display the findings that violate your organization’s SLA. With Athena, you can create views of the original table as a logical table. You can also create a view for CRITICAL, HIGH, MEDIUM, LOW, and INFORMATIONAL severity findings.

For details about how to export findings and build a dashboard, see the blog post How to build a multi-Region AWS Security Hub analytic pipeline and visualize Security Hub data.

Visualize an SLA by using QuickSight

The QuickSight dashboard shown in Figure 4 is an example that shows all the MEDIUM severity findings that should be resolved within a 14 day SLA.

Figure 4: QuickSight table showing medium severity findings over a 14-day SLA

Figure 4: QuickSight table showing medium severity findings over a 14-day SLA

Using QuickSight, you can create different types of data visualizations to represent the exported Security Hub findings, which enables the decision makers in your organization to explore and interpret information in an interactive visual environment. For example, Figure 5 shows findings categorized by service.

Figure 5: QuickSight visual showing MEDIUM severity findings for each service

Figure 5: QuickSight visual showing MEDIUM severity findings for each service

As another example, Figure 6 shows findings categorized by severity.

Figure 6: QuickSight visual showing findings by severity

Figure 6: QuickSight visual showing findings by severity

For more information about visualizing Security Hub findings by using Amazon OpenSearch Service and Kibana, see the blog post Visualize Security Hub Findings using Analytics and Business Intelligence Tools.

Changing a finding’s severity

Over time, your organization might discover that there are certain findings that should be tracked at a lower or higher severity level than what is auto-generated from Security Hub. You can implement EventBridge rules with AWS Lambda functions to automatically update the severity of the findings as soon as they are generated.

To automate the finding severity change

  1. On the EventBridge console, create an EventBridge rule. For detailed instructions, see Getting started with Amazon EventBridge.
    Figure 7: Create an EventBridge rule in the console

    Figure 7: Create an EventBridge rule in the console

  2. Define the event pattern, including the finding generator ID or any other identifying fields for which you want to redefine the severity. Review the fields in the format, and choose your desired filters. The following is a sample of the event pattern.
    {
      "source": ["aws.securityhub"],
      "detail-type": ["Security Hub Findings - Imported"],
      "detail": {
        "findings": {
            "GeneratorId": [
            "aws-foundational-security-best-practices/v/1.0.0/S3.4"
                        ],
          "RecordState": ["ACTIVE"],
          "Workflow": {
            "Status": ["NEW"]
          }
        }
      }
    }

  3. Specify the target as a Lambda function that will host the code to update the finding severity.
    Figure 8: Select a target Lambda function

    Figure 8: Select a target Lambda function

  4. In the Lambda function, use the BatchUpdateFindings API action to update the severity label as desired.

    The following example Lambda code will update finding severity to INFORMATIONAL. This function requires Amazon CloudWatch write permissions, and requires permissions to invoke the Security Hub API action BarchUpdateFindings.

    import logging
    import json, boto3
    import botocore.exceptions as boto3exceptions
    
    logger = logging.getLogger()
    logger.setLevel(os.environ.get('LOGLEVEL', 'INFO').upper())
    
    def lambda_handler(event, context):
        
        finding_id = ""
        product_arn = ""
        
        logger.info(event)
        
        for finding in event['detail']['findings']:
            
            #determine and log this Finding's ID
            finding_id = finding["Id"]
            product_arn = finding["ProductArn"]
            logger.info("Finding ID: " + finding_id)
            
        
            #determine and log this Finding's resource type
            resource_type = finding["Resources"][0]["Type"]
            logger.info("Resource Type is: " + resource_type)
    
            try:
                sec_hub_client = boto3.client('securityhub')
                response = sec_hub_client.batch_update_findings(
                    FindingIdentifiers=[
                    {
                        'Id': finding_id,
                        'ProductArn': product_arn
                    }
                    ],
                        Severity={"Label": "INFORMATIONAL"}
        
                    )
    
            except boto3exceptions.ClientError as error:
                logger.exception(f"Client error invoking batch update findings {error}")
            except boto3exceptions.ParamValidationError as error:
                logger.exception(f"The parameters you provided are incorrect: {error}")
    
        return {"statusCode": 200}

  5. The finding is generated with a new severity level, as updated in the Lambda function. For example, Figure 9 shows a finding that is generated as MEDIUM by default, but the configured EventBridge rule and Lambda function update the severity level to INFORMATIONAL.
    Figure 9: Security Hub findings generated with updated severity level

    Figure 9: Security Hub findings generated with updated severity level

Conclusion

This blog post walked you through two different solutions for setting up and tracking the SLAs for the findings generated by Security Hub. Reporting Security Hub findings for a given SLA in a dashboard view can help you prioritize findings and track whether findings are being remediated on time. This post also provided example code that you can use to modify the Security Hub severity for a specific finding. To further extend the solution and enable custom actions to remediate the findings, see the following:

 
If you have feedback about this post, submit comments in the Comments section below. If you have questions about this post, contact AWS Support.

Want more AWS Security news? Follow us on Twitter.

Maisie Fernandes

Maisie Fernandes

Maisie is a Senior Solutions Architect at AWS based in London. She is focused on helping public sector customers design, build, and secure scalable applications on AWS. Outside of work, Maisie enjoys traveling, running, and gardening.

Krati Singh

Krati Singh

Krati is a Senior Solutions Architect at AWS based in San Francisco Bay Area. She collaborates with small and medium business customers on their cloud journey and is passionate about security in the cloud. Outside of work, Krati enjoys reading, and an occasional hike on a nice weather day.

Reduce network traffic costs of your Amazon MSK consumers with rack awareness

Post Syndicated from Todd McGrath original https://aws.amazon.com/blogs/big-data/reduce-network-traffic-costs-of-your-amazon-msk-consumers-with-rack-awareness/

Amazon Managed Streaming for Apache Kafka (Amazon MSK) runs Apache Kafka clusters for you in the cloud. Although using cloud services means you don’t have to manage racks of servers any more, we take advantage of rack aware features in Apache Kafka to spread risk across AWS Availability Zones and increase availability of Amazon MSK services. Apache Kafka brokers have been rack aware since version 0.10. As the name implies, rack awareness provides a mechanism by which brokers can be configured to be aware of where they are physically located. We can use the broker.rack configuration variable to assign each broker a rack ID.

Why would a broker want to know where it’s physically located? Let’s explore two primary reasons. The first original reason revolves around designing for high availability (HA) and resiliency in Apache Kafka. The next reason, starting in Apache Kafka 2.4, can be utilized for cutting costs of your cross-Availability Zone traffic from consumer applications.

In this post, we review the HA and resiliency reason in Apache Kafka and Amazon MSK, then we dive deeper into how to reduce the costs of cross-Availability Zone traffic with rack aware consumers.

Rack awareness overview

The design decision for implementing rack awareness is actually quite simple, so let’s start with the key concepts. Because Apache Kafka is a distributed system, resiliency is a foundational construct that must be addressed. In other words, in a distributed system, one or more broker nodes going offline is a given and must be accounted for when running in production.

In Apache Kafka, one way to plan for this inevitability is through data replication. You can configure Apache Kafka with the topic replication factor. This setting indicates how many copies of the topic’s partition data should be maintained across brokers. A replication factor of 3 indicates the topic’s partitions should be stored on at least three brokers, as illustrated in the following diagram.

For more information on replication in Apache Kafka, including relevant terminology such as leader, replica, and followers, see Replication.

Now let’s take this a step further.

With rack awareness, Apache Kafka can choose to balance the replication of partitions on brokers across different racks according to the replication factor value. For example, in a cluster with six brokers configured with three racks (two brokers in each rack), and a topic replication factor of 3, replication is attempted across all three racks—a leader partition is on a broker in one rack, with replication to the other two brokers in each of the other two racks.

This feature becomes especially interesting when disaster planning for an Availability Zone going offline. How do we plan for HA in this case? Again, the answer is found in rack awareness. If we configure our broker’s broker.rack config setting based on the Availability Zone (or data center location) in which it resides for example, we can be resilient to Availability Zone failures. How does this work? We can build upon the previous example—in a six-node Kafka cluster deployed across three Availability Zones, two nodes are in each Availability Zone and configured with a broker.rack according to their respective Availability Zone. Therefore, a replication factor of 3 is attempted to store a copy of partition data in each Availability Zone. This means a copy of your topic’s data resides in each Availability Zone, as illustrated in the following diagram.

One of the many benefits of choosing to run your Apache Kafka workloads in Amazon MSK is the broker.rack variable on each broker is set automatically according to the Availability Zone in which it is deployed. For example, when you deploy a three-node MSK cluster across three Availability Zones, each node has a different broker.rack setting. Or, when you deploy a six-node MSK cluster across three Availability Zones, you have a total of three unique broker.rack values.

Additionally, a noteworthy benefit of choosing Amazon MSK is that replication traffic across Availability Zones is included with service. You’re not charged for broker replication traffic that crosses Availability Zone boundaries!

In this section, we covered the first reason for being Availability Zone aware: data produced is spread across all the Availability Zones for the cluster, improving durability and availability when there are issues at the Availability Zone level.

Next, let’s explore a second use of rack awareness—how to use it to cut network traffic costs of Kafka consumers.

Starting in Apache Kafka 2.4, KIP-392 was implemented to allow consumers to fetch from the closest replica.

Before closest replica fetching was allowed, all consumer traffic went to the leader of a partition, which could be in a different rack, or Availability Zone, than the client consuming data. But with capability from KIP-392 starting in Apache Kafka 2.4, we can configure our Kafka consumers to read from the closest replica brokers rather than the partition leader. This opens up the potential to avoid cross-Availability Zone traffic costs if a replica follower resides in the same Availability Zone as the consuming application. How does this happen? It’s built on the previously described rack awareness functionality in Apache Kafka brokers and extended to consumers.

Let’s cover a specific example of how to implement this in Amazon MSK and Kafka consumers.

Implement fetch from closest replica in Amazon MSK

In addition to needing to deploy Apache Kafka 2.4 or above (Amazon MSK 2.4.1.1 or above), we need to set two configurations.

In this example, I’ve deployed a three-broker MSK cluster across three Availability Zones, which means one broker resides in each Availability Zone. In addition, I’ve deployed an Amazon Elastic Compute Cloud (Amazon EC2) instance in one of these Availability Zones. On this EC2 instance, I’ve downloaded and extracted Apache Kafka, so I can use the command line tools available such as kafka-configs.sh and kafka-topics.sh in the bin/ directory. It’s important to keep this in mind as we progress through the following sections of configuring Amazon MSK, and configuring and verifying the Kafka consumer.

For your convenience, I’ve provided an AWS CloudFormation template for this setup in the Resources section at the end of this post.

Amazon MSK configuration

There is one broker configuration and one consumer configuration that we need to modify in order to allow consumers to fetch from the closest replica. These are broker.rack on the consumers and replica.selector.class on the brokers.

As previously mentioned, Amazon MSK automatically sets a broker’s broker.rack setting according to Availability Zone. Because we’re using Amazon MSK in this example, this means the broker.rack configuration on each broker is already configured for us, but let’s verify that.

We can confirm the broker.rack setting in a few different ways. As one example, we can use the kafka-configs.sh script from my previously mentioned EC2 instance:

bin/kafka-configs.sh —broker 1 —all —describe —bootstrap-server $BOOTSTRAP | grep rack

Depending on our environment, we should receive something similar to the following result:

broker.rack=use1-az4 sensitive=false synonyms={STATIC_BROKER_CONFIG:broker.rack=use1-az4}

Note that BOOTSTRAP is just an environment variable set to my cluster’s bootstrap server connection string. I set it previously with export BOOTSTRAP=<cluster specific>;

For example: export BOOTSTRAP=b-1.myTestCluster.123z8u.c2.kafka.us-east-1.amazonaws.com:9092,b-2.myTestCluster.123z8u.c2.kafka.us-east-1.amazonaws.com:9092

For more information on bootstrap servers, refer to Getting the bootstrap brokers for an Amazon MSK cluster.

From the command results, we can see broker.rack is set to use1-az4 for broker 1. The value use1-az4 is determined from Availability Zone to Availability Zone ID mapping. You can view this mapping on the Amazon Virtual Private Cloud (Amazon VPC) console on the Subnets page, as shown in the following screenshot.

In the preceding screenshot, we can see the Availability Zone ID use1-az4. We note this value for later use in our consumer configuration changes.

The broker setting we need to set is replica.selector.class. In this case, the default value for the configuration in Amazon MSK is null. See the following code:

bin/kafka-configs.sh —broker 1 —all —describe —bootstrap-server $BOOTSTRAP | grep replica.selector

This results in the following:

replica.selector.class=null sensitive=false synonyms={}

That’s ok, because Amazon MSK allows replica.selector.class to be overridden. For more information, refer to Custom MSK configurations.

To override this setting, we need to associate a cluster configuration with this key set to org.apache.kafka.common.replica.RackAwareReplicaSelector. For example, I’ve updated and applied the configuration of the MSK cluster used in this post with the following:

auto.create.topics.enable = true
delete.topic.enable = true
log.retention.hours = 8
replica.selector.class = org.apache.kafka.common.replica.RackAwareReplicaSelector

The following screenshot shows the configuration.

To learn more about applying cluster configurations, see Amazon MSK configuration.

After updating the cluster’s configuration with this configuration, we can verify it’s active in the brokers with the following code:

bin/kafka-configs.sh —broker 1 —all —describe —bootstrap-server $BOOTSTRAP | grep replica.selector

We get the following results:

replica.selector.class=org.apache.kafka.common.replica.RackAwareReplicaSelector sensitive=false synonyms={STATIC_BROKER_CONFIG:replica.selector.class=org.apache.kafka.common.replica.RackAwareReplicaSelector}

With these two broker settings in place, we’re ready to move on to the consumer configuration.

Kafka consumer configuration and verification

In this section, we cover an example of running a consumer that is rack aware vs. one that is not. We verify by examining log files in order to compare the results of different configuration settings.

To perform this comparison, let’s create a topic with six partitions and replication factor of 3:

bin/kafka-topics.sh —create —topic order —partitions 6 —replication-factor 3 —bootstrap-server $BOOTSTRAP

A replication factor of 3 means the leader partition is in one Availability Zone, while the two replicas are distributed across each remaining Availability Zone. This provides a convenient setup to test and verify our consumer because the consumer is deployed in one of these Availability Zones. This allows us to test and confirm that the consumer never crosses Availability Zone boundaries to fetch because either the leader partition or replica copy is always available from the broker in the same Availability Zone as the consumer.

Let’s load sample data into the order topic using the MSK Data Generator with the following configuration:

{
"name": "msk-data-generator",
    "config": {
    "connector.class": "com.amazonaws.mskdatagen.GeneratorSourceConnector",
    "genkp.order.with": "#{Internet.uuid}",
    "genv.order.product_id.with": "#{number.number_between '101','200'}",
    "genv.order.quantity.with": "#{number.number_between '1','5'}",
    "genv.order.customer_id.with": "#{number.number_between '1','5000'}"
    }
}

How to use the MSK Data Generator is beyond the scope of this post, but we generate sample data to the order topic with a random key (Internet.uuid) and key pair values of product_id, quantity, and customer_id. For our purposes, it’s important the generated key is random enough to ensure the data is evenly distributed across partitions.

To verify our consumer is reading from the closest replica, we need to turn up the logging. Because we’re using the bin/kafka-console-consumer.sh script included with Apache Kafka distribution, we can update the config/tools-log4j.properties file to influence the logging of scripts run in the bin/ directory, including kafka-console-consumer.sh. We just need to add one line:

log4j.logger.org.apache.kafka.clients.consumer.internals.Fetcher=DEBUG

The following code is the relevant portion from my config/tools-log4j.properties file:

log4j.rootLogger=WARN, stderr
log4j.logger.org.apache.kafka.clients.consumer.internals.Fetcher=DEBUG

log4j.appender.stderr=org.apache.log4j.ConsoleAppender
log4j.appender.stderr.layout=org.apache.log4j.PatternLayout
log4j.appender.stderr.layout.ConversionPattern=[%d] %p %m (%c)%n
log4j.appender.stderr.Target=System.err

Now we’re ready to test and verify from a consumer.

Let’s consume without rack awareness first:

bin/kafka-console-consumer.sh —topic order —bootstrap-server $BOOTSTRAP

We get results such as the following:

[2022-04-27 17:58:23,232] DEBUG [Consumer clientId=consumer-console-consumer-51138-1, groupId=console-consumer-51138] Handling ListOffsetResponse response for order-0. Fetched offset 30, timestamp -1 (org.apache.kafka.clients.consumer.internals.Fetcher)
[2022-04-27 17:58:23,215] DEBUG [Consumer clientId=consumer-console-consumer-51138-1, groupId=console-consumer-51138] Sending ListOffsetRequest (type=ListOffsetRequest, replicaId=-1, partitionTimestamps={order-3={timestamp: -1, maxNumOffsets: 1, currentLeaderEpoch: Optional[0]}, order-0={timestamp: -1, maxNumOffsets: 1, currentLeaderEpoch: Optional[0]}}, isolationLevel=READ_UNCOMMITTED) to broker b-1.mskcluster-msk.jcojml.c23.kafka.us-east-1.amazonaws.com:9092 (id: 1 rack: use1-az2) (org.apache.kafka.clients.consumer.internals.Fetcher)
[2022-04-27 17:58:23,216] DEBUG [Consumer clientId=consumer-console-consumer-51138-1, groupId=console-consumer-51138] Sending ListOffsetRequest (type=ListOffsetRequest, replicaId=-1, partitionTimestamps={order-4={timestamp: -1, maxNumOffsets: 1, currentLeaderEpoch: Optional[0]}, order-1={timestamp: -1, maxNumOffsets: 1, currentLeaderEpoch: Optional[0]}}, isolationLevel=READ_UNCOMMITTED) to broker b-2.mskcluster-msk.jcojml.c23.kafka.us-east-1.amazonaws.com:9092 (id: 2 rack: use1-az4) (org.apache.kafka.clients.consumer.internals.Fetcher)
[2022-04-27 17:58:23,216] DEBUG [Consumer clientId=consumer-console-consumer-51138-1, groupId=console-consumer-51138] Sending ListOffsetRequest (type=ListOffsetRequest, replicaId=-1, partitionTimestamps={order-5={timestamp: -1, maxNumOffsets: 1, currentLeaderEpoch: Optional[0]}, order-2={timestamp: -1, maxNumOffsets: 1, currentLeaderEpoch: Optional[0]}}, isolationLevel=READ_UNCOMMITTED) to broker b-3.mskcluster-msk.jcojml.c23.kafka.us-east-1.amazonaws.com:9092 (id: 3 rack: use1-az1) (org.apache.kafka.clients.consumer.internals.Fetcher)
[2022-04-27 17:58:23,230] DEBUG [Consumer clientId=consumer-console-consumer-51138-1, groupId=console-consumer-51138] Handling ListOffsetResponse response for order-5. Fetched offset 31, timestamp -1 (org.apache.kafka.clients.consumer.internals.Fetcher)
[2022-04-27 17:58:23,231] DEBUG [Consumer clientId=consumer-console-consumer-51138-1, groupId=console-consumer-51138] Handling ListOffsetResponse response for order-2. Fetched offset 20, timestamp -1 (org.apache.kafka.clients.consumer.internals.Fetcher)
[2022-04-27 17:58:23,232] DEBUG [Consumer clientId=consumer-console-consumer-51138-1, groupId=console-consumer-51138] Handling ListOffsetResponse response for order-3. Fetched offset 18, timestamp -1 (org.apache.kafka.clients.consumer.internals.Fetcher)

We get rack: values as use1-az2, use1-az4, and use1-az1. This will vary for each cluster.

This is expected because we’re generating data evenly across the order topic partitions and haven’t configured kafka-console-consumer.sh to fetch from followers yet.

Let’s stop this consumer and rerun it to fetch from the closest replica this time. The EC2 instance in this example is located in Availability Zone us-east-1, which means the Availability Zone ID is use1-az1, as previously discussed. To set this in our consumer, we need to set the client.rack configuration property as shown when running the following command:

bin/kafka-console-consumer.sh --topic order --bootstrap-server $BOOTSTRAP --consumer-property client.rack=use1-az1

Now, the log results show a difference:

[2022-04-27 18:04:18,200] DEBUG [Consumer clientId=consumer-console-consumer-99846-1, groupId=console-consumer-99846] Added READ_UNCOMMITTED fetch request for partition order-2 at position FetchPosition{offset=30, offsetEpoch=Optional[0], currentLeader=LeaderAndEpoch{leader=Optional[b-3.mskcluster-msk.jcojml.c23.kafka.us-east-1.amazonaws.com:9092 (id: 3 rack: use1-az1)], epoch=0}} to node b-3.mskcluster-msk.jcojml.c23.kafka.us-east-1.amazonaws.com:9092 (id: 3 rack: use1-az1) (org.apache.kafka.clients.consumer.internals.Fetcher)
[2022-04-27 18:04:18,200] DEBUG [Consumer clientId=consumer-console-consumer-99846-1, groupId=console-consumer-99846] Added READ_UNCOMMITTED fetch request for partition order-1 at position FetchPosition{offset=19, offsetEpoch=Optional.empty, currentLeader=LeaderAndEpoch{leader=Optional[b-2.mskcluster-msk.jcojml.c23.kafka.us-east-1.amazonaws.com:9092 (id: 2 rack: use1-az4)], epoch=0}} to node b-3.mskcluster-msk.jcojml.c23.kafka.us-east-1.amazonaws.com:9092 (id: 3 rack: use1-az1) (org.apache.kafka.clients.consumer.internals.Fetcher)
[2022-04-27 18:04:18,200] DEBUG [Consumer clientId=consumer-console-consumer-99846-1, groupId=console-consumer-99846] Added READ_UNCOMMITTED fetch request for partition order-0 at position FetchPosition{offset=39, offsetEpoch=Optional[0], currentLeader=LeaderAndEpoch{leader=Optional[b-1.mskcluster-msk.jcojml.c23.kafka.us-east-1.amazonaws.com:9092 (id: 1 rack: use1-az2)], epoch=0}} to node b-3.mskcluster-msk.jcojml.c23.kafka.us-east-1.amazonaws.com:9092 (id: 3 rack: use1-az1) (org.apache.kafka.clients.consumer.internals.Fetcher)

For each log line, we now have two rack: values. The first rack: value shows the current leader, the second rack: shows the rack that is being used to fetch messages.

For a specific example, consider the following line from the preceding example code:

[2022-04-27 18:04:18,200] DEBUG [Consumer clientId=consumer-console-consumer-99846-1, groupId=console-consumer-99846] Added READ_UNCOMMITTED fetch request for partition order-0 at position FetchPosition{offset=39, offsetEpoch=Optional[0], currentLeader=LeaderAndEpoch{leader=Optional[b-1.mskcluster-msk.jcojml.c23.kafka.us-east-1.amazonaws.com:9092 (id: 1 rack: use1-az2)], epoch=0}} to node b-3.mskcluster-msk.jcojml.c23.kafka.us-east-1.amazonaws.com:9092 (id: 3 rack: use1-az1) (org.apache.kafka.clients.consumer.internals.Fetcher)

The leader is identified as rack: use1-az2, but the fetch request is sent to use1-az1 as indicated by to node b-3.mskcluster-msk.jcojml.c23.kafka.us-east-1.amazonaws.com:9092 (id: 3 rack: use1-az1) (org.apache.kafka.clients.consumer.internals.Fetcher).

You’ll see something similar in all other log lines. The fetch is always to the broker in use1-az1.

And there we have it! We’re consuming from the closest replica.

Conclusion

With closest replica fetch, you can save as much as two-thirds of your cross-Availability Zone traffic charges when consuming from Kafka topics, because your consumers can read from replicas in the same Availability Zone instead of having to cross Availability Zone boundaries to read from the leader. In this post, we provided a background on Apache Kafka rack awareness and how Amazon MSK automatically sets brokers to be rack aware according to Availability Zone deployment. Then we demonstrated how to configure your MSK cluster and consumer clients to take advantage of rack awareness and avoid cross-Availability Zone network charges.

Resources

You can use the following CloudFormation template to create the example MSK cluster and EC2 instance with Apache Kafka downloaded and extracted. Note that this template requires the described WorkshopMSKConfig custom MSK configuration to be pre-created before running the template.


About the author

Todd McGrath is a data streaming specialist at Amazon Web Services where he advises customers on their streaming strategies, integration, architecture, and solutions. On the personal side, he enjoys watching and supporting his 3 teenagers in their preferred activities as well as following his own pursuits such as fishing, pickleball, ice hockey, and happy hour with friends and family on pontoon boats. Connect with him on LinkedIn.

Identifying publicly accessible resources with Amazon VPC Network Access Analyzer

Post Syndicated from Patrick Duffy original https://aws.amazon.com/blogs/security/identifying-publicly-accessible-resources-with-amazon-vpc-network-access-analyzer/

Network and security teams often need to evaluate the internet accessibility of all their resources on AWS and block any non-essential internet access. Validating who has access to what can be complicated—there are several different controls that can prevent or authorize access to resources in your Amazon Virtual Private Cloud (Amazon VPC). The recently launched Amazon VPC Network Access Analyzer helps you understand potential network paths to and from your resources without having to build automation or manually review security groups, network access control lists (network ACLs), route tables, and Elastic Load Balancing (ELB) configurations. You can use this information to add security layers, such as moving instances to a private subnet behind a NAT gateway or moving APIs behind AWS PrivateLink, rather than use public internet connectivity. In this blog post, we show you how to use Network Access Analyzer to identify publicly accessible resources.

What is Network Access Analyzer?

Network Access Analyzer allows you to evaluate your network against your design requirements and network security policy. You can specify your network security policy for resources on AWS through a Network Access Scope. Network Access Analyzer evaluates the configuration of your Amazon VPC resources and controls, such as security groups, elastic network interfaces, Amazon Elastic Compute Cloud (Amazon EC2) instances, load balancers, VPC endpoint services, transit gateways, NAT gateways, internet gateways, VPN gateways, VPC peering connections, and network firewalls.

Network Access Analyzer uses automated reasoning to produce findings of potential network paths that don’t meet your network security policy. Network Access Analyzer reasons about all of your Amazon VPC configurations together rather than in isolation. For example, it produces findings for paths from an EC2 instance to an internet gateway only when the following conditions are met: the security group allows outbound traffic, the network ACL allows outbound traffic, and the instance’s route table has a route to an internet gateway (possibly through a NAT gateway, network firewall, transit gateway, or peering connection). Network Access Analyzer produces actionable findings with more context such as the entire network path from the source to the destination, as compared to the isolated rule-based checks of individual controls, such as security groups or route tables.

Sample environment

Let’s walk through a real-world example of using Network Access Analyzer to detect publicly accessible resources in your environment. Figure 1 shows an environment for this evaluation, which includes the following resources:

  • An EC2 instance in a public subnet allowing inbound public connections on port 80/443 (HTTP/HTTPS).
  • An EC2 instance in a private subnet allowing connections from an Application Load Balancer on port 80/443.
  • An Application Load Balancer in a public subnet with a Target Group connected to the private web server, allowing public connections on port 80/443.
  • An Amazon Aurora database in a public subnet allowing public connections on port 3306 (MySQL).
  • An Aurora database in a private subnet.
  • An EC2 instance in a public subnet allowing public connections on port 9200 (OpenSearch/Elasticsearch).
  • An Amazon EMR cluster allowing public connections on port 8080.
  • A Windows EC2 instance in a public subnet allowing public connections on port 3389 (Remote Desktop Protocol).
Figure 1: Example environment of web servers hosted on EC2 instances, remote desktop servers hosted on EC2, Relational Database Service (RDS) databases, Amazon EMR cluster, and OpenSearch cluster on EC2

Figure 1: Example environment of web servers hosted on EC2 instances, remote desktop servers hosted on EC2, Relational Database Service (RDS) databases, Amazon EMR cluster, and OpenSearch cluster on EC2

Let us assume that your organization’s security policy requires that your databases and analytics clusters not be directly accessible from the internet, whereas certain workload such as instances for web services can have internet access only through an Application Load Balancer over ports 80 and 443. Network Access Analyzer allows you to evaluate network access to resources in your VPCs, including database resources such as Amazon RDS and Amazon Aurora clusters, and analytics resources such as Amazon OpenSearch Service clusters and Amazon EMR clusters. This allows you to govern network access to your resources on AWS, by identifying network access that does not meet your security policies, and creating exclusions for paths that do have the appropriate network controls in place.

Configure Network Access Analyzer

In this section, you will learn how to create network scopes, analyze the environment, and review the findings produced. You can create network access scopes by using the AWS Command Line Interface (AWS CLI) or AWS Management Console. When creating network access scopes using the AWS CLI, you can supply the scope by using a JSON document. This blog post provides several network access scopes as JSON documents that you can deploy to your AWS accounts.

To create a network scope (AWS CLI)

  1. Verify that you have the AWS CLI installed and configured.
  2. Download the network-scopes.zip file, which contains JSON documents that detect the following publicly accessible resources:
    • OpenSearch/Elasticsearch clusters
    • Databases (MySQL, PostgreSQL, MSSQL)
    • EMR clusters
    • Windows Remote Desktop
    • Web servers that can be accessed without going through a load balancer

    Make note of the folder where you save the JSON scopes because you will need it for the next step.

  3. Open a systems shell, such as Bash, Zsh, or cmd.
  4. Navigate to the folder where you saved the preceding JSON scopes.
  5. Run the following commands in the shell window:
    aws ec2 create-network-insights-access-scope 
    --cli-input-json file://detect-public-databases.json 
    --tag-specifications 'ResourceType="network-insights-access-scope",
    Tags=[{Key="Name",Value="detect-public-databases"},{Key="Description",
    		   Value="Detects publicly accessible databases."}]' 
    --region us-east-1
    
    aws ec2 create-network-insights-access-scope 
    --cli-input-json file://detect-public-elastic.json 
    --tag-specifications 'ResourceType="network-insights-access-scope",
    Tags=[{Key="Name",Value="detect-public-opensearch"},{Key="Description",
    		   Value="Detects publicly accessible OpenSearch/Elasticsearch endpoints."}]' 
    --region us-east-1
    
    aws ec2 create-network-insights-access-scope 
    --cli-input-json file://detect-public-emr.json 
    --tag-specifications 'ResourceType="network-insights-access-scope",
    Tags=[{Key="Name",Value="detect-public-emr"},{Key="Description",
    		   Value="Detects publicly accessible Amazon EMR endpoints."}]'
    --region us-east-1
    
    aws ec2 create-network-insights-access-scope 
    --cli-input-json file://detect-public-remotedesktop.json 
    --tag-specifications 'ResourceType="network-insights-access-scope",
    Tags=[{Key="Name",Value="detect-public-remotedesktop"},{Key="Description",
    		   Value="Detects publicly accessible Microsoft Remote Desktop servers."}]' 
    --region us-east-1
    
    aws ec2 create-network-insights-access-scope 
    --cli-input-json file://detect-public-webserver-noloadbalancer.json 
    --tag-specifications 'ResourceType="network-insights-access-scope",
    Tags=[{Key="Name",Value="detect-public-webservers"},{Key="Description",
    		   Value="Detects publicly accessible web servers that can be accessed without using a load balancer."}]' 
    --region us-east-1


Now that you’ve created the scopes, you will analyze them to find resources that match your match conditions.

To analyze your scopes (console)

  1. Open the Amazon VPC console.
  2. In the navigation pane, under Network Analysis, choose Network Access Analyzer.
  3. Under Network Access Scopes, select the checkboxes next to the scopes that you want to analyze, and then choose Analyze, as shown in Figure 2.
    Figure 2: Custom network scopes created for Network Access Analyzer

    Figure 2: Custom network scopes created for Network Access Analyzer

If Network Access Analyzer detects findings, the console indicates the status Findings detected for each scope, as shown in Figure 3.

Figure 3: Network Access Analyzer scope status

Figure 3: Network Access Analyzer scope status

To review findings for a scope (console)

  1. On the Network Access Scopes page, under Network Access Scope ID, select the link for the scope that has the findings that you want to review. This opens the latest analysis, with the option to review past analyses, as shown in Figure 4.
    Figure 4: Finding summary identifying Amazon Aurora instance with public access to port 3306

    Figure 4: Finding summary identifying Amazon Aurora instance with public access to port 3306

  2. To review the path for a specific finding, under Findings, select the radio button to the left of the finding, as shown in Figure 4. Figure 5 shows an example of a path for a finding.
    Figure 5: Finding details showing access to the Amazon Aurora instance from the internet gateway to the elastic network interface, allowed by a network ACL and security group.

    Figure 5: Finding details showing access to the Amazon Aurora instance from the internet gateway to the elastic network interface, allowed by a network ACL and security group.

  3. Choose any resource in the path for detailed information, as shown in Figure 6.
    Figure 6: Resource detail within a finding outlining a specific security group allowing access on port 3306

    Figure 6: Resource detail within a finding outlining a specific security group allowing access on port 3306

How to remediate findings

After deploying network scopes and reviewing findings for publicly accessible resources, you should next limit access to those resources and remove public access. Use cases vary, but the scopes outlined in this post identify resources that you should share publicly in a more secure manner or remove public access entirely. The following techniques will help you align to the Protecting Networks portion of the AWS Well-Architected Framework Security Pillar.

If you have a need to share a database with external entities, consider using AWS PrivateLink, VPC peering, or use AWS Site-to-Site VPN to share access. You can remove public access by modifying the security group attached to the RDS instance or EC2 instance serving the database, but you should migrate the RDS database to a private subnet as well.

When creating web servers in EC2, you should not place web servers directly in a public subnet with security groups allowing HTTP and HTTPS ports from all internet addresses. Instead, you should place your EC2 instances in private subnets and use Application Load Balancers in a public subnet. From there, you can attach a security group that allows HTTP/HTTPS access from public internet addresses to your Application Load Balancer, and attach a security group that allows HTTP/HTTPS from your Load Balancer security group to your web server EC2 instances. You can also associate AWS WAF web ACLs to the load balancer to protect your web applications or APIs against common web exploits and bots that may affect availability, compromise security, or consume excessive resources.

Similarly, if you have OpenSearch/Elasticsearch running on EC2 or Amazon OpenSearch Service, or are using Amazon EMR, you can share these resources using PrivateLink. Use the Amazon EMR block public access configuration to verify that your EMR clusters are not shared publicly.

To connect to Remote Desktop on EC2 instances, you should use AWS Systems Manager to connect using Fleet Manager. Connecting with Fleet Manager only requires your Windows EC2 instances to be a managed node. When connecting using Fleet Manager, the security group requires no inbound ports, and the instance can be in a private subnet. For more information, see the Systems Manager prerequisites.

Conclusion

This blog post demonstrates how you can identify and remediate publicly accessible resources. Amazon VPC Network Access Analyzer helps you identify available network paths by using automated reasoning technology and user-defined access scopes. By using these scopes, you can define non-permitted network paths, identify resources that have those paths, and then take action to increase your security posture. To learn more about building continuous verification of network compliance at scale, see the blog post Continuous verification of network compliance using Amazon VPC Network Access Analyzer and AWS Security Hub. Take action today by deploying the Network Access Analyzer scopes in this post to evaluate your environment and add layers of security to best fit your needs.

 
If you have feedback about this post, submit comments in the Comments section below. If you have questions about this post, contact AWS Support.

Want more AWS Security news? Follow us on Twitter.

Author

Patrick Duffy

Patrick is a Solutions Architect in the Small Medium Business (SMB) segment at AWS. He is passionate about raising awareness and increasing security of AWS workloads. Outside work, he loves to travel and try new cuisines and enjoys a match in Magic Arena or Overwatch.

Peter Ticali

Peter Ticali

Peter is a Solutions Architect focused on helping Media & Entertainment customers transform and innovate. With over three decades of professional experience, he’s had the opportunity to contribute to architecture that stream live video to millions, including two Super Bowls, PPVs, and even a Royal Wedding. Previously he held Director, and CTO roles in the EdTech, advertising & public relations space. Additionally, he is a published photo journalist.

John Backes

John Backes

John is a Senior Applied Scientist in AWS Networking. He is passionate about applying Automated Reasoning to network verification and synthesis problems.

Vaibhav Katkade

Vaibhav Katkade

Vaibhav is a Senior Product Manager in the Amazon VPC team. He is interested in areas of network security and cloud networking operations. Outside of work, he enjoys cooking and the outdoors.