Post Syndicated from Manjunath Arakere original https://aws.amazon.com/blogs/security/perform-continuous-vulnerability-scanning-of-aws-lambda-functions-with-amazon-inspector/
This blog post demonstrates how you can activate Amazon Inspector within one or more AWS accounts and be notified when a vulnerability is detected in an AWS Lambda function.
Amazon Inspector is an automated vulnerability management service that continually scans workloads for software vulnerabilities and unintended network exposure. Amazon Inspector scans mixed workloads like Amazon Elastic Compute Cloud (Amazon EC2) instances and container images located in Amazon Elastic Container Registry (Amazon ECR). At re:Invent 2022, we announced Amazon Inspector support for Lambda functions and Lambda layers to provide a consolidated solution for compute types.
Only scanning your functions for vulnerabilities before deployment might not be enough since vulnerabilities can appear at any time, like the widespread Apache Log4j vulnerability. So it’s essential that workloads are continuously monitored and rescanned in near real time as new vulnerabilities are published or workloads are changed.
Amazon Inspector scans are intelligently initiated based on the updates to Lambda functions or when new Common Vulnerabilities and Exposures (CVEs) are published that are relevant to your function. No agents are needed for Amazon Inspector to work, which means you don’t need to install a library or agent in your Lambda functions or layers. When Amazon Inspector discovers a software vulnerability or network configuration issue, it creates a finding which describes the vulnerability, identifies the affected resource, rates the severity of the vulnerability, and provides remediation guidance.
In addition, Amazon Inspector integrates with several AWS services, such as Amazon EventBridge and AWS Security Hub. You can use EventBridge to build automation workflows like getting notified for a specific vulnerability finding or performing an automatic remediation with the help of Lambda or AWS Systems Manager.
In this blog post, you will learn how to do the following:
- Activate Amazon Inspector in a single AWS account and AWS Region.
- See how Amazon Inspector automated discovery and continuous vulnerability scanning works by deploying a new Lambda function with a vulnerable package dependency.
- Receive a near real-time notification when a vulnerability with a specific severity is detected in a Lambda function with the help of EventBridge and Amazon Simple Notification Service (Amazon SNS).
- Remediate the vulnerability by using the recommendation provided in the Amazon Inspector dashboard.
- Activate Amazon Inspector in multiple accounts or Regions through AWS Organizations.
Solution architecture
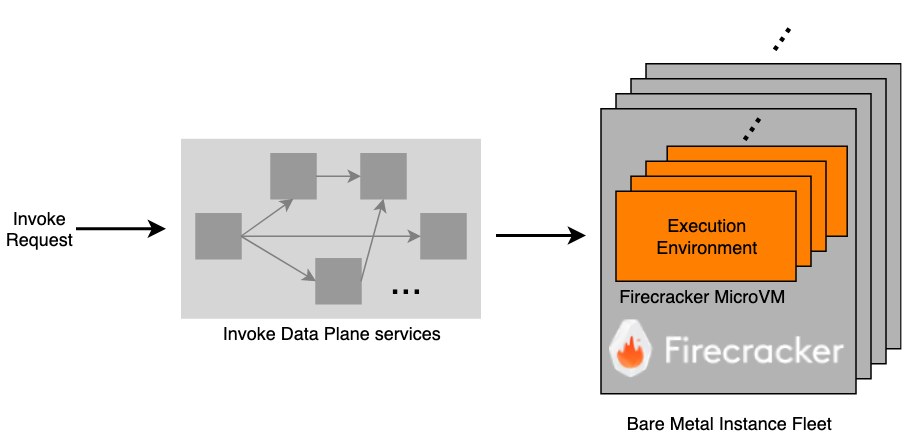
Figure 1 shows the AWS services used in the solution and how they are integrated.
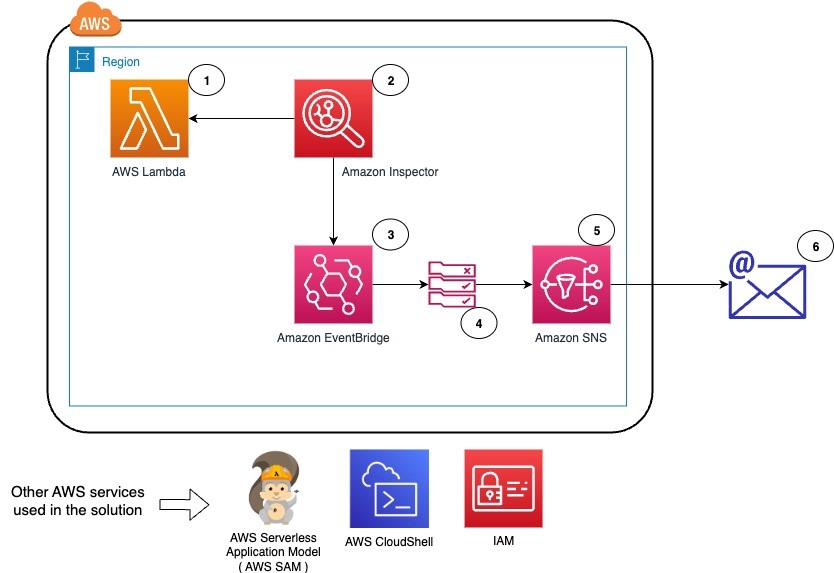
Figure 1: Solution architecture overview
The workflow for the solution is as follows:
- Deploy a new Lambda function by using the AWS Serverless Application Model (AWS SAM).
- Amazon Inspector scans when a new vulnerability is published or when an update to an existing Lambda function or a new Lambda function is deployed. Vulnerabilities are identified in the deployed Lambda function.
- Amazon EventBridge receives the events from Amazon Inspector and checks against the rules for specific events or filter conditions.
- In this case, an EventBridge rule exists for the Amazon Inspector findings, and the target is defined as an SNS topic to send an email to the system operations team.
- The EventBridge rule invokes the target SNS topic with the event data, and an email is sent to the confirmed subscribers in the SNS topic.
- The system operations team receives an email with detailed information on the vulnerability, the fixed package versions, the Amazon Inspector score to prioritize, and the impacted Lambda functions. By using the remediation information from Amazon Inspector, the team can now prioritize actions and remediate.
Prerequisites
To follow along with this demo, we recommend that you have the following in place:
- An AWS account.
- A command line interface: AWS CloudShell or AWS CLI. In this post, we recommend the use of CloudShell because it already has Python and AWS SAM. However, you can also use your CLI with AWS CLI, SAM, and Python.
- An AWS Region where Amazon Inspector Lambda code scanning is available.
- An IAM role in that account with administrator privileges.
The solution in this post includes the following AWS services: Amazon Inspector, AWS Lambda, Amazon EventBridge, AWS Identity and Access Management (IAM), Amazon SNS, AWS CloudShell and AWS Organizations for activating Amazon Inspector at scale (multi-accounts).
Step 1: Activate Amazon Inspector in a single account in the Region
The first step is to activate Amazon Inspector in your account in the Region you are using.
To activate Amazon Inspector
- Sign in to the AWS Management Console.
- Open AWS CloudShell. CloudShell inherits the credentials and permissions of the IAM principal who is signed in to the AWS Management Console. CloudShell comes with the CLIs and runtimes that are needed for this demo (AWS CLI, AWS SAM, and Python).
- Use the following command in CloudShell to get the status of the Amazon Inspector activation.
- Use the following command to activate Inspector in the default Region for resource type LAMBDA. Other allowed values for resource types are EC2, ECR and LAMDA_CODE.
- Use the following command to verify the status of the Amazon Inspector activation.
You should see a response that shows that Amazon Inspector is enabled for Lambda resources, as shown in Figure 2.
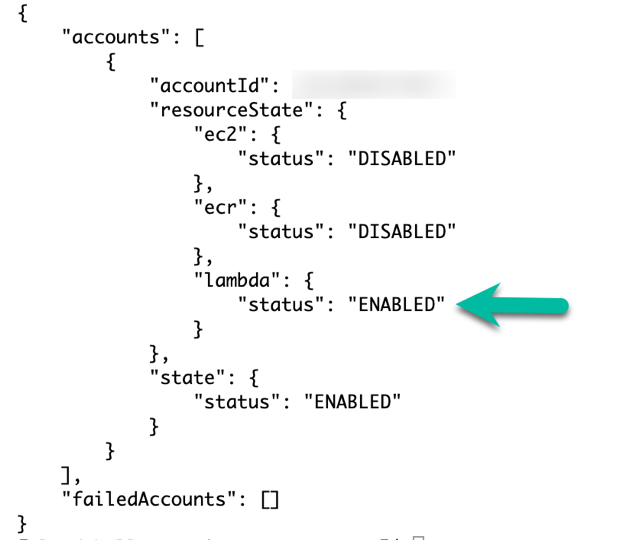
Figure 2: Amazon Inspector status after you enable Lambda scanning
Step 2: Create an SNS topic and subscription for notification
Next, create the SNS topic and the subscription so that you will be notified of each new Amazon Inspector finding.
To create the SNS topic and subscription
- Use the following command in CloudShell to create the SNS topic and its subscription and replace <REGION_NAME>, <AWS_ACCOUNTID> and <[email protected]> by the relevant values.
- Check the email inbox you entered for <[email protected]>, and in the email from Amazon SNS, choose Confirm subscription.
- In the CloudShell console, use the following command to list the subscriptions, to verify the topic and email subscription.
You should see a response that shows subscription details like the email address and ARN, as shown in Figure 3.

Figure 3: Subscribed email address and SNS topic
- Use the following command to send a test message to your subscribed email and verify that you receive the message by replacing <REGION_NAME> and <AWS_ACCOUNTID>.

Step 3: Set up Amazon EventBridge with a custom rule and the SNS topic as target
Create an EventBridge rule that will invoke your previously created SNS topic whenever Amazon Inspector finds a new vulnerability with a critical severity.
To set up the EventBridge custom rule
- In the CloudShell console, use the following command to create an EventBridge rule named amazon-inspector-findings with filters InspectorScore greater than 8 and severity state set to CRITICAL.
Refer to the topic Amazon EventBridge event schema for Amazon Inspector events to customize the event pattern for your application needs.
- To verify the rule creation, go to the EventBridge console and in the left navigation bar, choose Rules.
- Choose the rule with the name amazon-inspector-findings. You should see the event pattern as shown in Figure 4.
Figure 4: Event pattern for the EventBridge rule to filter on CRITICAL vulnerabilities.
- Add the SNS topic you previously created as the target to the EventBridge rule. Replace <REGION_NAME>, <AWS_ACCOUNTID>, and <RANDOM-UNIQUE-IDENTIFIER-VALUE> with the relevant values. For RANDOM-UNIQUE-IDENTIFIER-VALUE, create a memorable and unique string.
Important: Save the target ID. You will need this in order to delete the target in the last step.
- Provide permission to enable Amazon EventBridge to publish to SNS topic amazon-inspector-findings-notifier

Step 4: Deploy the Lambda function to the AWS account by using AWS SAM
In this step, you will use Serverless Application Manager (SAM) quick state templates to build and deploy a Lambda function with a vulnerable library, in order to generate findings. Learn more about AWS SAM.
To deploy the Lambda function with a vulnerable library
- In the CloudShell console, use a prebuilt “hello-world” AWS SAM template to deploy the Lambda function.
- Use the following command to add the vulnerable package python-jwt==3.3.3 to the Lambda function.
- Use the following command to build the application.
- Use the following command to deploy the application with the guided option.
This command packages and deploys the application to your AWS account. It provides a series of prompts. You may respond to the prompts with the:
- Stack name you want
- Set the default options, except for the
- HelloWorldFunction may not have authorization defined, Is this okay? [y/N]: prompt. Here, input y and press Enter and
- Deploy this changeset? [y/N]: prompt. Here, input y and press Enter.
Step 5: View Amazon Inspector findings
Amazon Inspector will automatically generate findings when scanning the Lambda function previously deployed. To view those findings, follow the steps below.
To view Amazon Inspector findings for the vulnerability
- Navigate to the Amazon Inspector console.
- In the left navigation menu, choose All findings to see all of the Active findings, as shown in Figure 5.
Due to the custom event pattern rule in Amazon EventBridge, even though there are multiple findings for the vulnerable package python-jwt==3.3.3, you will be notified only for the finding that has InspectorScore greater than 8 and severity CRITICAL.
- Choose the title of each finding to see detailed information about the vulnerability.
Figure 5: Example of findings from the Amazon Inspector console

Step 6: Remediate the vulnerability by applying the fixed package version
Now you can remediate the vulnerability by updating the package version as suggested by Amazon Inspector.
To remediate the vulnerability
- In the Amazon Inspector console, in the left navigation menu, choose All Findings.
- Choose the title of the vulnerability to see the finding details and the remediation recommendations.
Figure 6: Amazon Inspector finding for python-jwt, with the associated remediation
- To remediate, use the following command to update the package version to the fixed version as suggested by Amazon Inspector.
- Use the following command to build the application.
- Use the following command to deploy the application with the guided option.
This command packages and deploys the application to your AWS account. It provides a series of prompts. You may respond to the prompts with the
- Stack name you want
- Set the default options, except for the
- HelloWorldFunction may not have authorization defined, Is this okay? [y/N]: prompt. Here, input y and press Enter and
- Deploy this changeset? [y/N]: prompt. Here, input y and press Enter.
- Amazon Inspector automatically rescans the function after its deployment and reevaluates the findings. At this point, you can navigate back to the Amazon Inspector console, and in the left navigation menu, choose All findings. In the Findings area, you can see that the vulnerabilities are moved from Active to Closed status.
Due to the custom event pattern rule in Amazon EventBridge, you will be notified by email with finding status as CLOSED.
Figure 7: Inspector rescan results, showing no open findings after remediation


(Optional) Step 7: Activate Amazon Inspector in multiple accounts and Regions
To benefit from Amazon Inspector scanning capabilities across the accounts that you have in AWS Organizations and in your selected Regions, use the following steps:
To activate Amazon Inspector in multiple accounts and Regions
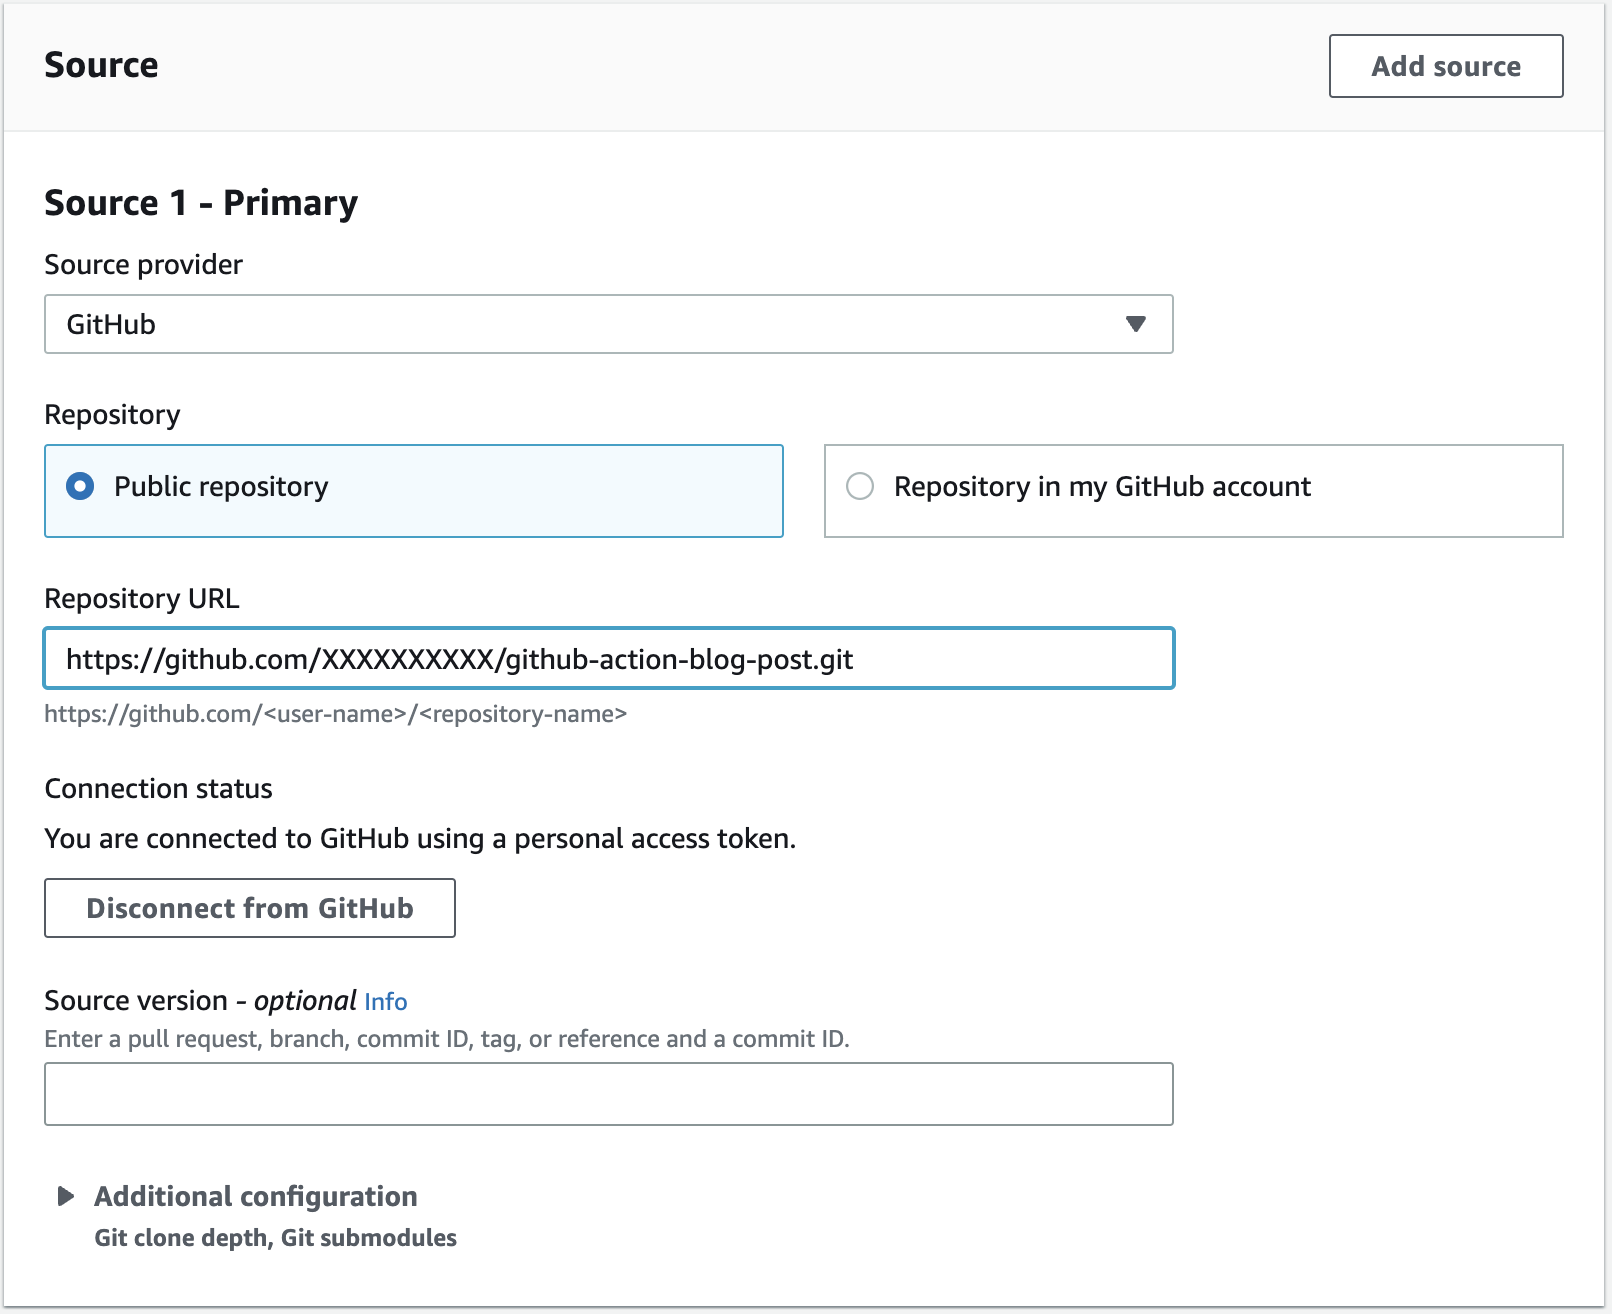
- In the CloudShell console, use the following command to clone the code from the aws-samples inspector2-enablement-with-cli GitHub repo.
- Follow the instructions from the README.md file.
- Configure the file param_inspector2.json with the relevant values, as follows:
- inspector2_da: The delegated administrator account ID for Amazon Inspector to manage member accounts.
- scanning_type: The resource types (EC2, ECR, LAMBDA) to be enabled by Amazon Inspector.
- auto_enable: The resource types to be enabled on every account that is newly attached to the delegated administrator.
- regions: Because Amazon Inspector is a regional service, provide the list of AWS Regions to enable.
- Select the AWS account that would be used as the delegated administrator account (<DA_ACCOUNT_ID>).
- Delegate an account as the admin for Amazon Inspector by using the following command.
- Activate the delegated admin by using the following command:
- Associate the member accounts by using the following command:
- Wait five minutes.
- Enable the resource types (EC2, ECR, LAMBDA) on your member accounts by using the following command:
- Enable Amazon Inspector on the new member accounts that are associated with the organization by using the following command:
- Check the Amazon Inspector status in your accounts and in multiple selected Regions by using the following command:
There are other options you can use to enable Amazon Inspector in multiple accounts, like AWS Control Tower and Terraform. For the reference architecture for Control Tower, see the AWS Security Reference Architecture Examples on GitHub. For more information on the Terraform option, see the Terraform aws_inspector2_enabler resource page.
Step 8: Delete the resources created in the previous steps
AWS offers a 15-day free trial for Amazon Inspector so that you can evaluate the service and estimate its cost.
To avoid potential charges, delete the AWS resources that you created in the previous steps of this solution (Lambda function, EventBridge target, EventBridge rule, and SNS topic), and deactivate Amazon Inspector.
To delete resources
- In the CloudShell console, enter the sam-app folder.
- Delete the Lambda function and confirm by typing “y” when prompted for confirmation.
- Remove the SNS target from the Amazon EventBridge rule.
Note: If you don’t remember the target ID, navigate to the Amazon EventBridge console, and in the left navigation menu, choose Rules. Select the rule that you want to delete. Choose CloudFormation, and copy the ID.
- Delete the EventBridge rule.
- Delete the SNS topic.
- Disable Amazon Inspector.
Follow the new few steps to roll back changes only if you have performed the activities listed in Step 7: Activate Amazon Inspector in multiple accounts and Regions.
- In the CloudShell console, enter the folder inspector2-enablement-with-cli.
- Deactivate the resource types (EC2, ECR, LAMBDA) on your member accounts.
- Disassociate the member accounts.
- Deactivate the delegated admin account.
- Remove the delegated account as the admin for Amazon Inspector.
Conclusion
In this blog post, we discussed how you can use Amazon Inspector to continuously scan your Lambda functions, and how to configure an Amazon EventBridge rule and SNS to send out notification of Lambda function vulnerabilities in near real time. You can then perform remediation activities by using AWS Lambda or AWS Systems Manager. We also showed how to enable Amazon Inspector at scale, activating in both single and multiple accounts, in default and multiple Regions.
As of the writing this post, a new feature to perform code scans for Lambda functions is available. Amazon Inspector can now also scan the custom application code within a Lambda function for code security vulnerabilities such as injection flaws, data leaks, weak cryptography, or missing encryption, based on AWS security best practices. You can use this additional scanning functionality to further protect your workloads.
If you have feedback about this blog post, submit comments in the Comments section below. If you have question about this blog post, start a new thread on the Amazon Inspector forum or contact AWS Support.
Want more AWS Security news? Follow us on Twitter.


 Ajay Vohra is a Principal Prototyping Architect specializing in perception machine learning for autonomous vehicle development. Prior to Amazon, Ajay worked in the area of massively parallel grid-computing for financial risk modeling.
 Jaswanth Kumar is a customer-obsessed Cloud Application Architect at AWS in NY. Jaswanth excels in application refactoring and migration, with expertise in containers and serverless solutions, coupled with a Masters Degree in Applied Computer Science.
 Aneel Murari is a Sr. Serverless Specialist Solution Architect at AWS based in the Washington, D.C. area. He has over 18 years of software development and architecture experience and holds a graduate degree in Computer Science. Aneel helps AWS customers orchestrate their workflows on Amazon Managed Apache Airflow (MWAA) in a secure, cost effective and performance optimized manner.
 Parnab Basak is a Solutions Architect and a Serverless Specialist at AWS. He specializes in creating new solutions that are cloud native using modern software development practices like serverless, DevOps, and analytics. Parnab works closely in the analytics and integration services space helping customers adopt AWS services for their workflow orchestration needs.


 Rajdip Chaudhuri is a Senior Solutions Architect with Amazon Web Services specializing in data and analytics. He enjoys working with AWS customers and partners on data and analytics requirements. In his spare time, he enjoys soccer and movies.
 Dhiraj Thakur is a Solutions Architect with Amazon Web Services. He works with AWS customers and partners to provide guidance on enterprise cloud adoption, migration, and strategy. He is passionate about technology and enjoys building and experimenting in the analytics and AI/ML space.


