Tag Archives: AWS Lambda

Automate Lambda code signing with Amazon CodeCatalyst and AWS Signer

Post Syndicated from Vineeth Nair original https://aws.amazon.com/blogs/devops/automate-lambda-code-signing-with-amazon-codecatalyst-and-aws-signer/

Amazon CodeCatalyst is an integrated service for software development teams adopting continuous integration and deployment practices into their software development process. CodeCatalyst puts the tools you need all in one place. You can plan work, collaborate on code build, test, and deploy applications with continuous integration/continuous delivery (CI/CD) tools. You can also integrate AWS resources with your projects by connecting your AWS accounts to your CodeCatalyst space. By managing all of the stages and aspects of your application lifecycle in one tool, you can deliver software quickly and confidently.

Introduction

In this post we will focus on how development teams can use Amazon CodeCatalyst with AWS Signer to fully manage the code signing process to ensure the trust and integrity of code assets. We will describe the process of building the AWS Lambda code using a CodeCatalyst workflow, we will then demonstrate the process of signing the code using a signer profile and deploying the signed code to our Lambda function.

In the Develop stage, the engineer commits the code to the Amazon CodeCatalyst repository using the Cloud 9 IDE. The CodeCatalyst workflow sends the index.py file from the repository and puts it into the S3 source bucket after compressing it. AWS Signer signs this content and pushes it to the S3 destination bucket. In the deploy stage, the signed zip file will be deployed into the AWS Lambda function.

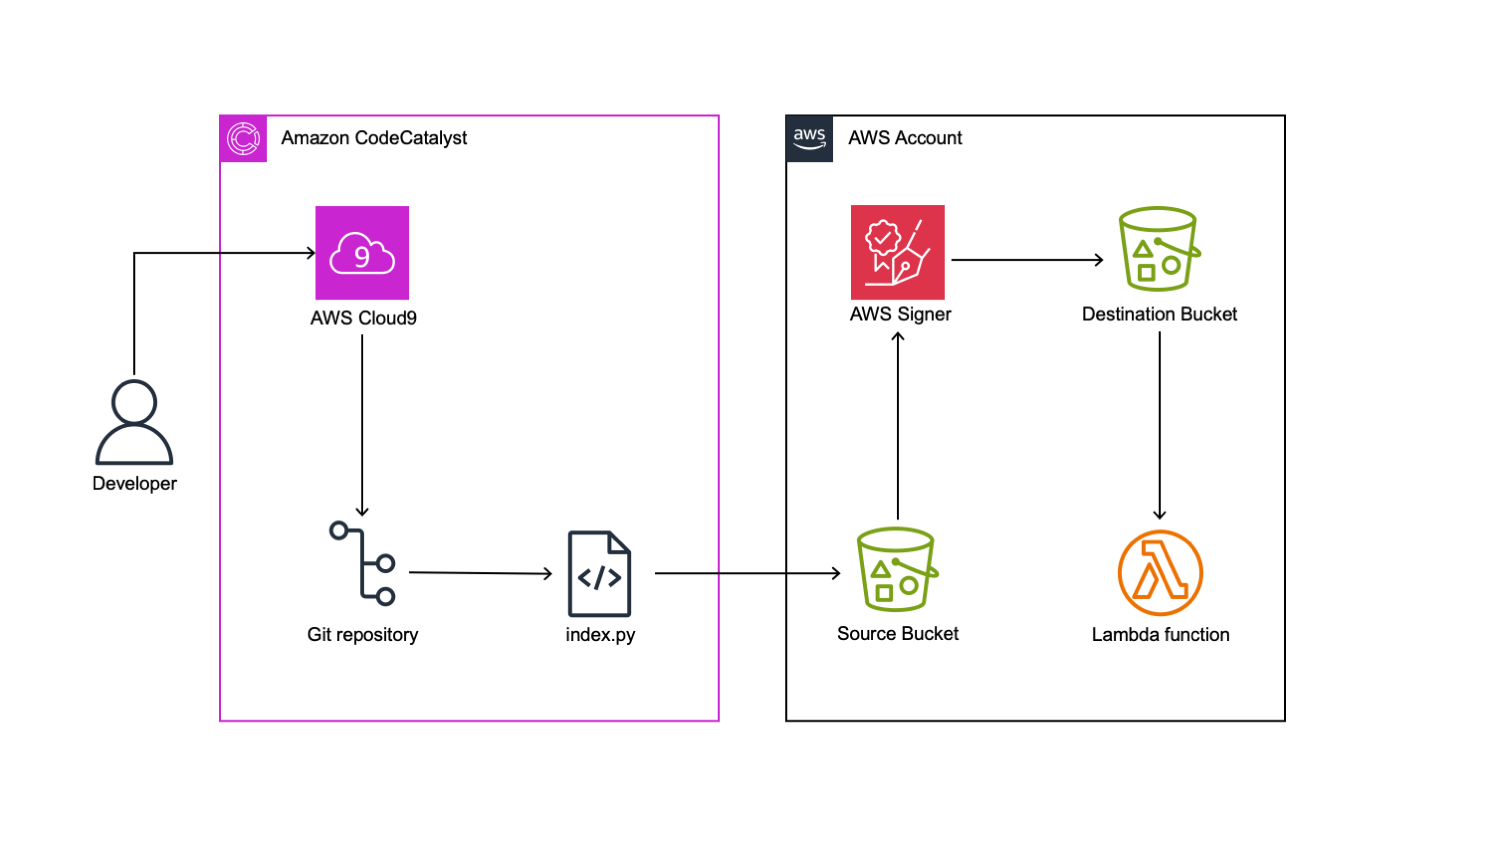
Figure 1: Architecture Diagram.

Prerequisites

To follow along with the post, you will need the following items:

Walkthrough

During this tutorial, we will create a step-by-step guide to constructing a workflow utilizing CodeCatalyst. The objective is to employ the AWS Signer service to retrieve Python code from a specified source Amazon S3 bucket, compress and sign the code, and subsequently store it in a destination S3 bucket. Finally, we will utilize the signed code to deploy a secure Lambda function.

Create the base workflow

To begin we will create our workflow in the CodeCatalyst project.

Select CI/CD → Workflows → Create workflow:


Figure 2: Create workflow.

Leave the defaults for the Source Repository and Branch, select Create. We will have an empty workflow:


Figure 3: Empty workflow.

We can edit the workflow from the CodeCatalyst console, or use a Dev Environment. Initially, we will create an initial commit of this workflow file, ignore any validation errors at this stage:

In Commit workflow page, we can add the workflow file name, commit message. Repository name and Branch name can be selected from the drop-down option.
Figure 4: Commit workflow with workflow file name, message repository and branch name.

Connect to CodeCatalyst Dev Environment

We will use an AWS Cloud9 Dev Environment. Our first step is to connect to the dev environment.

Select Code → Dev Environments. If you do not already a Dev Instance you can create an instance by selecting Create Dev Environment.

My Dev Environment tab shows all Environment available.
Figure 5: Create Dev Environment.

We already have a Dev Environment, so will go ahead and select Resume Instance. A new browser tab opens for the IDE and will be available in less than one minute. Once the IDE is ready, we can go ahead and start building our workflow. First, open a terminal. You can then change into the source repository directory and pull the latest changes. In our example, our Git source repository name is lambda-signer

cd lambda-signer && git pull. We can now edit this file in our IDE.

Initially, we will create a basic Lambda code under artifacts directory:

mkdir artifacts
cat <<EOF > artifacts/index.py
def lambda_handler(event, context):
    print('Testing Lambda Code Signing using Signer') 
EOF

The previous command block creates our index.py file which will go inside the AWS Lambda function. When we testing the Lambda Function, we should see message “Testing Lambda Code Signing using Signer” in the console log.

As a next step, we will create the CDK directory and initiate it:

mkdir cdk;
cd cdk && cdk init --language python cdk

The previous command will create a directory called ‘cdk’ and then initiate cdk inside this directory. As a result, we will see another directory named ‘cdk’. We then need to update files inside this directory as per the following screenshot.

Shows the cdk directory structure. Inside this directory, there is a file called app.py. Also there is a subdirectory called cdk. Inside this subdirectory, there are 2 files named cdk_stack.py and lambda_stack.py.
Figure 6: Repository file structure.

Update the content of the files as per the code following snippets:

(Note: Update your region name by replacing the placeholder <Region Name> )

cdk_stack.py:

import os
from constructs import Construct
from aws_cdk import (
    Duration,
    Stack,
    aws_lambda as lambda_,
    aws_signer as signer,
    aws_s3 as s3,
    Aws as aws,
    CfnOutput
)


class CdkStack(Stack):

    def __init__(self, scope: Construct, construct_id: str, **kwargs) -> None:
        super().__init__(scope, construct_id, **kwargs)
        
         # Set the AWS region
        os.environ["AWS_DEFAULT_REGION"] = "<Region Name>"

        # Create the signer profile
        signer_profile_name = "my-signer-profile-" + aws.ACCOUNT_ID
        print(f"signer_profile_name: {signer_profile_name}")
        
        signing_profile = signer.SigningProfile(self, "SigningProfile",
            platform=signer.Platform.AWS_LAMBDA_SHA384_ECDSA,
            signing_profile_name='my-signer-profile' + aws.ACCOUNT_ID,
            signature_validity=Duration.days(365)
        )

        self.code_signing_config = lambda_.CodeSigningConfig(self, "CodeSigningConfig",
            signing_profiles=[signing_profile]
        )
        

        source_bucket_name = "source-signer-bucket-" + aws.ACCOUNT_ID
        source_bucket = s3.Bucket(self, "SourceBucket",
            bucket_name=source_bucket_name,
            block_public_access=s3.BlockPublicAccess.BLOCK_ALL,
            encryption=s3.BucketEncryption.S3_MANAGED,
            versioned=True
        )

        destination_bucket_name = "dest-signer-bucket-" + aws.ACCOUNT_ID
        self.destination_bucket = s3.Bucket(self, "DestinationBucket",
            bucket_name=destination_bucket_name,
            block_public_access=s3.BlockPublicAccess.BLOCK_ALL,
            encryption=s3.BucketEncryption.S3_MANAGED,
            versioned=True
        )
        resolved_signing_profile_name = self.resolve(signing_profile.signing_profile_name)

        CfnOutput(self,"signer-profile",value=signing_profile.signing_profile_name)
        CfnOutput(self,"src-bucket",value=source_bucket.bucket_name)
        CfnOutput(self,"dst-bucket",value=self.destination_bucket.bucket_name)

lambda_stack.py:

from constructs import Construct
from aws_cdk import (
    Duration,
    Stack,
    aws_lambda as lambda_,
    aws_signer as signer,
    aws_s3 as s3,
    Aws as aws,
    CfnOutput
)


class LambdaStack(Stack):

    def __init__(self, scope: Construct, construct_id: str, dst_bucket:s3.Bucket,codesigning_config: lambda_.CodeSigningConfig, **kwargs) -> None:
        super().__init__(scope, construct_id, **kwargs)
        
         # Set the AWS region
        # Get the code from action inputs
        bucket_name = self.node.try_get_context("bucket_name")
        key = self.node.try_get_context("key")

        lambda_function = lambda_.Function(
            self,
            "Function",
		 function_name=’sample-signer-function’,
            code_signing_config=codesigning_config,
            runtime=lambda_.Runtime.PYTHON_3_9,
            handler="index.Lambda_handler",
            code=lambda_.Code.from_bucket(dst_bucket, key)
        )

app.py:

#!/usr/bin/env python3

import aws_cdk as cdk

from cdk.cdk_stack import CdkStack
from cdk.lambda_stack import LambdaStack


app = cdk.App()
signer_stack = CdkStack(app, "cdk")
lambda_stack = LambdaStack(app, "LambdaStack", dst_bucket=signer_stack.destination_bucket,codesigning_config=signer_stack.code_signing_config)

app.synth()

Finally, we will work on Workflow:

In our example, our workflow is Workflow_d892. We will locate Workflow_d892.yaml in the .codecatalyst\workflows directory in our repository.


Figure 7: Workflow yaml file.

Update workflow with remaining steps

We can assign our workflow a name and configure the action. We have five stages in this workflow:

  • CDKBootstrap: Prepare AWS Account for CDK deployment.
  • CreateSignerResources: Deploys Signer resources into AWS Account
  • ZipLambdaCode: Compresses the index.py file and store it in the source S3 bucket
  • SignCode: Sign the compressed python file and push it to the destination S3 bucket
  • Createlambda: Creates the Lambda Function using the signed code from destination S3 bucket.

Please insert the following values for your environment into the workflow file. The environment configuration will be as per the pre-requisite configuration for CodeCatalyst environment setup:

  • <Name of your Environment>: The Name of your CodeCatalyst environment
  • <AWS Account>: The AWS Account connection ID
  • <Role Name>: The CodeCatalyst role that is configured for the environment

(Note: Feel free to update the region configuration to meet your deployment requirements. Supported regions are listed here)

Name: Workflow_d892
SchemaVersion: "1.0"

# Optional - Set automatic triggers.
Triggers:
  - Type: Push
    Branches:
      - main

# Required - Define action configurations.
Actions:
  CDKBootstrap:
    # Identifies the action. Do not modify this value.
    Identifier: aws/[email protected]

    # Specifies the source and/or artifacts to pass to the action as input.
    Inputs:
      # Optional
      Sources:
        - WorkflowSource # This specifies that the action requires this Workflow as a source

    # Required; You can use an environment, AWS account connection, and role to access AWS resources.
    Environment:
      Name: <Name of your Environment>
      Connections:
        - Name: <AWS Account>
          Role: <Role Name> # Defines the action's properties.
    Configuration:
      # Required; type: string; description: AWS region to bootstrap
      Region: <Region Name>
  CreateSignerResources:
    # Identifies the action. Do not modify this value.
    Identifier: aws/[email protected]
    DependsOn:
      - CDKBootstrap
      # Specifies the source and/or artifacts to pass to the action as input.
    Inputs:
      # Optional
      Sources:
        - WorkflowSource # This specifies that the action requires this Workflow as a source

    # Required; You can use an environment, AWS account connection, and role to access AWS resources.
    Environment:
      Name: <Name of your Environment>
      Connections:
        - Name: <AWS Account>
          Role: <Role Name> 
    Configuration:
      # Required; type: string; description: Name of the stack to deploy
      StackName: cdk
      CdkRootPath: cdk
      Region: <Region Name>
      CfnOutputVariables: '["signerprofile","dstbucket","srcbucket"]'
      Context: '{"key": "placeholder"}'
  ZipLambdaCode:
    Identifier: aws/build@v1
    DependsOn:
    - CreateSignerResources
    Inputs:
      Sources:
        - WorkflowSource
    Environment:
      Name: <Name of your Environment>
      Connections:
        - Name: <AWS Account>
          Role: <Role Name> 
#
    Configuration:
      Steps:
        - Run: sudo yum install zip -y
        - Run: cd artifacts && zip lambda-${WorkflowSource.CommitId}.zip index.py
        - Run: aws s3 cp lambda-${WorkflowSource.CommitId}.zip s3://${CreateSignerResources.srcbucket}/tobesigned/lambda-${WorkflowSource.CommitId}.zip
        - Run: S3VER=$(aws s3api list-object-versions --output text --bucket ${CreateSignerResources.srcbucket} --prefix 'tobesigned/lambda-${WorkflowSource.CommitId}.zip' --query 'Versions[*].VersionId')
    Outputs:
      Variables:
      - S3VER
           
  SignCode:
    Identifier: aws/build@v1
    DependsOn:
    - ZipLambdaCode
    Inputs:
      Sources:
        - WorkflowSource
    Environment:
      Name: <Name of your Environment>
      Connections:
        - Name: AWS Account>
          Role: <Role Name> #
    Configuration:
      Steps:
        - Run: export AWS_REGION=<Region Name>
        - Run: SIGNER_JOB=$(aws signer start-signing-job --source --output text --query 'jobId' 's3={bucketName=${CreateSignerResources.srcbucket},key=tobesigned/lambda-${WorkflowSource.CommitId}.zip,version=${ZipLambdaCode.S3VER}}' --destination 's3={bucketName=${CreateSignerResources.dstbucket},prefix=signed-}' --profile-name ${CreateSignerResources.signerprofile})
    Outputs:
      Variables:
        - SIGNER_JOB
  CreateLambda:
    # Identifies the action. Do not modify this value.
    Identifier: aws/[email protected]
    DependsOn:
      - SignCode
      # Specifies the source and/or artifacts to pass to the action as input.
    Inputs:
      # Optional
      Sources:
        - WorkflowSource # This specifies that the action requires this Workflow as a source

    # Required; You can use an environment, AWS account connection, and role to access AWS resources.
    Environment:
      Name: <Name of your Environment>
      Connections:
        - Name: AWS Account>
          Role: <Role Name>
            # Defines the action's properties.
    Configuration:
      # Required; type: string; description: Name of the stack to deploy
      StackName: LambdaStack
      CdkRootPath: cdk
      Region: <Region Name>
      Context: '{"key": "signed-${SignCode.SIGNER_JOB}.zip"}'

We can copy/paste this code into our workflow. To save our changes, we select File -> Save. We can then commit these to our git repository by typing the following at the terminal:

git add . && git commit -m ‘adding workflow’ && git push

The previous command will commit and push the changes that we have made to the CodeCatalyst source repository. As we have a branch trigger for main defined, this will trigger a run of the workflow. We can monitor the status of the workflow in the CodeCatalyst console by selecting CICD -> Workflows. Locate your workflow and click on Runs to view the status.

CodeCatalyst CICD pipeline stage starts with CDKBootstrap stage. Stage 2 is CreateSignerResources. Stage3 is ZipLambdaCode. Stage4 is SignCode and Final Stage is CreateLambda.
Figure 8: Successful workflow execution.

To validate that our newly created Lambda function is using AWS Signed code, we can open the AWS Console in our target region > Lambda > click on the sample-signer-function to inspect the properties.

When open the AWS Lambda function, code tab shows a text message “Your function has signed code and can’t be edited inline"
Figure 9: AWS Lambda function with signed code.

Under the Code Source configuration property, you should see an informational message advising that ‘Your function has signed cofde and can’t be edited inline’. This confirms that the Lambda function is successfully using signed code.

Cleaning up

If you have been following along with this workflow, you should delete the resources that you have deployed to avoid further chargers. In the AWS Console > CloudFormation, locate the LambdaStack, then select and click Delete to remove the stack. Complete the same steps for the CDK stack.

Conclusion

In this post, we explained how development teams can easily get started signing code with AWS Signer and deploying it to Lambda Functions using Amazon CodeCatalyst. We outlined the stages in our workflow that enabled us to achieve the end-to-end release cycle. We also demonstrated how to enhance the developer experience of integrating CodeCatalyst with our AWS Cloud9 Dev Environment and leveraging the power of AWS CDK to use familiar programming languages such as Python to define our infrastructure as code resources.

Richard Merritt

Richard Merritt is a DevOps Consultant at Amazon Web Services (AWS), Professional Services. He works with AWS customers to accelerate their journeys to the cloud by providing scalable, secure and robust DevOps solutions.

Vineeth Nair

Vineeth Nair is a DevOps Architect at Amazon Web Services (AWS), Professional Services. He collaborates closely with AWS customers to support and accelerate their journeys to the cloud and within the cloud ecosystem by building performant, resilient, scalable, secure and cost efficient solutions.


Automating multi-AZ high availability for WebLogic administration server

Post Syndicated from Jack Zhou original https://aws.amazon.com/blogs/architecture/automating-multi-az-high-availability-for-weblogic-administration-server/

Oracle WebLogic Server is used by enterprises to power production workloads, including Oracle E-Business Suite (EBS) and Oracle Fusion Middleware applications.

Customer applications are deployed to WebLogic Server instances (managed servers) and managed using an administration server (admin server) within a logical organization unit, called a domain. Clusters of managed servers provide application availability and horizontal scalability, while the single-instance admin server does not host applications.

There are various architectures detailing WebLogic-managed server high availability (HA). In this post, we demonstrate using Availability Zones (AZ) and a floating IP address to achieve a “stretch cluster” (Oracle’s terminology).

Overview of a WebLogic domain

Figure 1. Overview of a WebLogic domain

Overview of problem

The WebLogic admin server is important for domain configuration, management, and monitoring both application performance and system health. Historically, WebLogic was configured using IP addresses, with managed servers caching the admin server IP to reconnect if the connection was lost.

This can cause issues in a dynamic Cloud setup, as replacing the admin server from a template changes its IP address, causing two connectivity issues:

  1. Communication­ within the domain: the admin and managed servers communicate via the T3 protocol, which is based on Java RMI.
  2. Remote access to admin server console: allowing internet admin access and what additional security controls may be required is beyond the scope of this post.

Here, we will explore how to minimize downtime and achieve HA for your admin server.

Solution overview

For this solution, there are three approaches customers tend to follow:

  1. Use a floating virtual IP to keep the address static. This solution is familiar to WebLogic administrators as it replicates historical on-premise HA implementations. The remainder of this post dives into this practical implementation.
  2. Use DNS to resolve the admin server IP address. This is also a supported configuration.
  3. Run in a “headless configuration” and not (normally) run the admin server.
    • Use WebLogic Scripting Tool to issues commands
    • Collect and observe metrics through other toolsRunning “headless” requires a high level of operational maturity. It may not be compatible for certain vendor packaged applications deployed to WebLogic.

Using a floating IP address for WebLogic admin server

Here, we discuss the reference WebLogic deployment architecture on AWS, as depicted in Figure 2.

Reference WebLogic deployment with multi-AZ admin HA capability

Figure 2. Reference WebLogic deployment with multi-AZ admin HA capability

In this example, a WebLogic domain resides in a virtual private cloud’s (VPC) private subnet. The admin server is on its own Amazon Elastic Compute Cloud (Amazon EC2) instance. It’s bound to the private IP 10.0.11.8 that floats across AZs within the VPC. There are two ways to achieve this:

  1. Create a “dummy” subnet in the VPC (in any AZ), with the smallest allowed subnet size of /28. Excluding the first “4” and the last IP of the subnet because they’re reserved, choose an address. For a 10.0.11.0/28 subnet, we will use 10.0.11.8 and configure WebLogic admin server to bind to that.
  2. Use an IP outside of the VPC. We discuss this second way and compare both processes in the later section “Alternate solution for multi-AZ floating IP”.

This example Amazon Web Services stretch architecture with one WebLogic domain and one admin server:

  • Create a VPC across two or more AZs, with one private subnet in each AZ for managed servers and an additional “dummy” subnet.
  • Create two EC2 instances, one for each of the WebLogic Managed Servers (distributed across the private subnets).
  • Use an Auto Scaling group to ensure a single admin server running.
    • Create an Amazon EC2 launch template for the admin server.
    • Associate the launch template and an Auto Scaling group with minimum, maximum, and desired capacity of 1. The Auto Scaling Group (ASG) detects EC2 and/or AZ degradation and launches a new instance in a different AZ if the current fails.
    • Create an AWS Lambda function (example to follow) to be called by the Auto Scale group lifecycle hook to update the route tables.
    • Update the user data commands (example to follow) of the launch template to:
      • Add the floating IP address to the network interface
      • Start the admin server using the floating IP

To route traffic to the floating IP, we update route tables for both public and private subnets.

We create a Lambda function launched by the Auto Scale group lifecycle hook pending:InService when a new admin instance is created. This Lambda code updates routing rules in both route tables mapping the dummy subnet CIDR (10.0.11.0/28) of the “floating” IP to the admin Amazon EC2. This updates routes in both the public and private subnets for the dynamically launched admin server, enabling managed servers to connect.

Enabling internet access to the admin server

If enabling internet access to the admin server, create an internet-facing Application Load Balancer (ALB) attached to the public subnets. With the route to the admin server, the ALB can forward traffic to it.

  • Create an IP-based target group that points to the floating IP.
  • Add a forwarding rule in the ALB to route WebLogic admin traffic to the admin server.

User data commands in the launch template to make admin server accessible upon ASG scale out

In the admin server EC2 launch template, add user data code to monitor the ASG lifecycle state. When it reaches InService state, a Lambda function is invoked to update route tables. Then, the script starts the WebLogic admin server Java process (and associated NodeManager, if used).

The admin server instance’s SourceDestCheck attribute needs to be set to false, enabling it to bind to the logical IP. This change can also be done in the Lambda function.

When a user accesses the admin server from the internet:

  1. Traffic flows to the elastic IP address associated to the internet-facing ALB.
  2. The ALB forwards to the configured target group.
  3. The ALB uses the updated routes to reach 10.0.11.8 (admin server).

When managed servers communicate with the admin server, they use the updated route table to reach 10.0.11.8 (admin server).

The Lambda function

Here, we present a Lambda function example that sets the EC2 instance SourceDeskCheck attribute to false and updates the route rules for the dummy subnet CIDR (the “floating” IP on the admin server EC2) in both public and private route tables.

import { AutoScalingClient, CompleteLifecycleActionCommand } from "@aws-sdk/client-auto-scaling";
import { EC2Client, DeleteRouteCommand, CreateRouteCommand, ModifyInstanceAttributeCommand } from "@aws-sdk/client-ec2";
export const handler = async (event, context, callback) => {
console.log('LogAutoScalingEvent');
console.log('Received event:', JSON.stringify(event, null, 2));

// IMPORTANT: replace with your dummy subnet CIDR that the floating IP resides in
const destCIDR = "10.0.11.0/28";
// IMPORTANT: replace with your route table IDs
const rtTables = ["rtb-**************ff0", "rtb-**************af5"];

const asClient = new AutoScalingClient({region: event.region});
const eventDetail = event.detail;

const ec2client = new EC2Client({region: event.region});

const inputModifyAttr = {
"SourceDestCheck": {
"Value": false
},
"InstanceId": eventDetail['EC2InstanceId'],
};

const commandModifyAttr = new ModifyInstanceAttributeCommand(inputModifyAttr);
await ec2client.send(commandModifyAttr);

// modify route in two route tables
for (const rt of rtTables) {
const inputDelRoute = { // DeleteRouteRequest
DestinationCidrBlock: destCIDR,
DryRun: false,
RouteTableId: rt, // required
};
const cmdDelRoute = new DeleteRouteCommand(inputDelRoute);
try {
const response = await ec2client.send(cmdDelRoute);
console.log(response);
} catch (error) {
console.log(error);
}

const inputCreateRoute = { // addRouteRequest
DestinationCidrBlock: destCIDR,
DryRun: false,
InstanceId: eventDetail['EC2InstanceId'],
RouteTableId: rt, // required
};

const cmdCreateRoute = new CreateRouteCommand(inputCreateRoute);
await ec2client.send(cmdCreateRoute);
}

// continue on ASG lifecycle
const params = {
AutoScalingGroupName: eventDetail['AutoScalingGroupName'], /* required */
LifecycleActionResult: 'CONTINUE', /* required */
LifecycleHookName: eventDetail['LifecycleHookName'], /* required */
InstanceId: eventDetail['EC2InstanceId'],
LifecycleActionToken: eventDetail['LifecycleActionToken']
};
const cmdCompleteLifecycle = new CompleteLifecycleActionCommand(params);
const response = await asClient.send(cmdCompleteLifecycle);
console.log(response);
return response;
};

Amazon EC2 user data

The following code in Amazon EC2 user data shows how to add logical secondary IP address to the Amazon EC2 primary ENI, keep polling the ASG lifecycle state, and start the admin server Java process upon Amazon EC2 entering the InService state.

Content-Type: text/x-shellscript; charset="us-ascii"
MIME-Version: 1.0
Content-Transfer-Encoding: 7bit
Content-Disposition: attachment; filename="userdata.txt"
#!/bin/bash

ip addr add 10.0.11.8/28 br 10.0.11.255 dev eth0
TOKEN=$(curl -X PUT "http://169.254.169.254/latest/api/token" -H "X-aws-ec2-metadata-token-ttl-seconds: 21600")
for x in {1..30}
do 
  target_state=$(curl -H "X-aws-ec2-metadata-token: $TOKEN" -v http://169.254.169.254/latest/meta-data/autoscaling/target-lifecycle-state)
  if [ \"$target_state\" = \"InService\" ]; then
    su -c 'nohup /mnt/efs/wls/fmw/install/Oracle/Middleware/Oracle_Home/user_projects/domains/domain1/bin/startWebLogic.sh &' ec2-user 
    break
  fi
  sleep 10
done

Alternate solution for multi-AZ floating IP

An alternative solution for the floating IP is to use an IP external to the VPC. The configurations for ASG, Amazon EC2 launch template, and ASG lifecycle hook Lambda function remain the same. However, the ALB cannot access the WebLogic admin console webapp from the internet due to its requirement for a VPC-internal subnet. To access the webapp in this scenario, stand up a bastion host in a public subnet.

While this approach “saves” 16 VPC IP addresses by avoiding a dummy subnet, there are disadvantages:

  • Bastion hosts are not AZ-failure resilient.
  • Missing true multi-AZ resilience like the first solution.
  • Requires additional cost and complexity in managing multiple bastion hosts across AZs or a VPN.

Conclusion

AWS has a track record of efficiently running Oracle applications, Oracle EBS, PeopleSoft, and mission critical JEE workloads. In this post, we delved into a HA solution using a multi-AZ floating IP for the WebLogic admin server, and using ASG to ensure a singular admin server. We showed how to use ASG lifecycle hooks and Lambda to automate route updates for the floating IP and configuring an ALB to allow Internet access for the admin server. This solution achieves multi-AZ resilience for WebLogic admin server with automated recovery, transforming a traditional WebLogic admin server from a pet to cattle.

Centralizing management of AWS Lambda layers across multiple AWS Accounts

Post Syndicated from James Beswick original https://aws.amazon.com/blogs/compute/centralizing-management-of-aws-lambda-layers-across-multiple-aws-accounts/

This post is written by Debasis Rath, Sr. Specialist SA-Serverless, Kanwar Bajwa, Enterprise Support Lead, and Xiaoxue Xu, Solutions Architect (FSI).

Enterprise customers often manage an inventory of AWS Lambda layers, which provide shared code and libraries to Lambda functions. These Lambda layers are then shared across AWS accounts and AWS Organizations to promote code uniformity, reusability, and efficiency. However, as enterprises scale on AWS, managing shared Lambda layers across an increasing number of functions and accounts is best handled with automation.

This blog post centralizes the management of Lambda layers to ensure compliance with your enterprise’s governance standards, and promotes consistency across your infrastructure. This centralized management uses a detective configuration approach to identify non-compliant Lambda functions systematically using outdated Lambda layer versions, and corrective measures to remediate these Lambda functions by updating them with the right layer version.

This solution uses AWS services such as AWS Config, Amazon EventBridge Scheduler, AWS Systems Manager (SSM) Automation, and AWS CloudFormation StackSets.

Solution overview

This solution offers two parts for layers management:

  1. On-demand visibility into outdated Lambda functions.
  2. Automated remediation of the affected Lambda functions.

1.	On-demand visibility into outdated Lambda functions

This is the architecture for the first part. Users with the necessary permissions can use AWS Config advanced queries to obtain a list of outdated Lambda functions.

The current configuration state of any Lambda function is captured by the configuration recorder within the member account. This data is then aggregated by the AWS Config Aggregator within the management account. The aggregated data can be accessed using queries.

2.	Automated remediation of the affected Lambda functions

This diagram depicts the architecture for the second part. Administrators must manually deploy CloudFormation StackSets to initiate the automatic remediation of outdated Lambda functions.

The manual remediation trigger is used instead of a fully automated solution. Administrators schedule this manual trigger as part of a change request to minimize disruptions to the business. All business stakeholders owning affected Lambda functions should receive this change request notification and have adequate time to perform unit tests to assess the impact.

Upon receiving confirmation from the business stakeholders, the administrator deploys the CloudFormation StackSets, which in turn deploy the CloudFormation stack to the designated member account and Region. After the CloudFormation stack deployment, the EventBridge scheduler invokes an AWS Config custom rule evaluation. This rule identifies the non-compliant Lambda functions, and later updates them using SSM Automation runbooks.

Centralized approach to layer management

The following walkthrough deploys the two-part architecture described, using a centralized approach to layer management as in the preceding diagram. A decentralized approach scatters management and updates of Lambda layers across accounts, making enforcement more difficult and error-prone.

This solution is also available on GitHub.

Prerequisites

For the solution walkthrough, you should have the following prerequisites:

Writing an on-demand query for outdated Lambda functions

First, you write and run an AWS Config advanced query to identify the accounts and Regions where the outdated Lambda functions reside. This is helpful for end users to determine the scope of impact, and identify the responsible groups to inform based on the affected Lambda resources.

Follow these procedures to understand the scope of impact using the AWS CLI:

  1. Open CloudShell in your AWS account.
  2. Run the following AWS CLI command. Replace YOUR_AGGREGATOR_NAME with the name of your AWS Config aggregator, and YOUR_LAYER_ARN with the outdated Lambda layer Amazon Resource Name (ARN).
    aws configservice select-aggregate-resource-config \
    --expression "SELECT accountId, awsRegion, configuration.functionName, configuration.version WHERE resourceType = 'AWS::Lambda::Function' AND configuration.layers.arn = 'YOUR_LAYER_ARN'" \
    --configuration-aggregator-name 'YOUR_AGGREGATOR_NAME' \
    --query "Results" \
    --output json | \
    jq -r '.[] | fromjson | [.accountId, .awsRegion, .configuration.functionName, .configuration.version] | @csv' > output.csv
    
  3. The results are saved to a CSV file named output.csv in the current working directory. This file contains the account IDs, Regions, names, and versions of the Lambda functions that are currently using the specified Lambda layer ARN. Refer to the documentation on how to download a file from AWS CloudShell.

To explore more configuration data and further improve visualization using services like Amazon Athena and Amazon QuickSight, refer to Visualizing AWS Config data using Amazon Athena and Amazon QuickSight.

Deploying automatic remediation to update outdated Lambda functions

Next, you deploy the automatic remediation CloudFormation StackSets to the affected accounts and Regions where the outdated Lambda functions reside. You can use the query outlined in the previous section to obtain the account IDs and Regions.

Updating Lambda layers may affect the functionality of existing Lambda functions. It is essential to notify affected development groups, and coordinate unit tests to prevent unintended disruptions before remediation.

To create and deploy CloudFormation StackSets from your management account for automatic remediation:

  1. Run the following command in CloudShell to clone the GitHub repository:
    git clone https://github.com/aws-samples/lambda-layer-management.git
  2. Run the following CLI command to upload your template and create the stack set container.
    aws cloudformation create-stack-set \
      --stack-set-name layers-remediation-stackset \
      --template-body file://lambda-layer-management/layer_manager.yaml
    
  3. Run the following CLI command to add stack instances in the desired accounts and Regions to your CloudFormation StackSets. Replace the account IDs, Regions, and parameters before you run this command. You can refer to the syntax in the AWS CLI Command Reference. “NewLayerArn” is the ARN for your updated Lambda layer, while “OldLayerArn” is the original Lambda layer ARN.
    aws cloudformation create-stack-instances \
    --stack-set-name layers-remediation-stackset \
    --accounts <LIST_OF_ACCOUNTS> \
    --regions <YOUR_REGIONS> \
    --parameter-overrides ParameterKey=NewLayerArn,ParameterValue='<NEW_LAYER_ARN>' ParameterKey=OldLayerArn,ParameterValue='=<OLD_LAYER_ARN>'
    
  4. Run the following CLI command to verify that the stack instances are created successfully. The operation ID is returned as part of the output from step 3.
    aws cloudformation describe-stack-set-operation \
      --stack-set-name layers-remediation-stackset \
      --operation-id <OPERATION_ID>

This CloudFormation StackSet deploys an EventBridge Scheduler that immediately triggers the AWS Config custom rule for evaluation. This rule, written in AWS CloudFormation Guard, detects all the Lambda functions in the member accounts currently using the outdated Lambda layer version. By using the Auto Remediation feature of AWS Config, the SSM automation document is run against each non-compliant Lambda function to update them with the new layer version.

Other considerations

The provided remediation CloudFormation StackSet uses the UpdateFunctionConfiguration API to modify your Lambda functions’ configurations directly. This method of updating may lead to drift from your original infrastructure as code (IaC) service, such as the CloudFormation stack that you used to provision the outdated Lambda functions. In this case, you might need to add an additional step to resolve drift from your original IaC service.

Alternatively, you might want to update your IaC code directly, referencing the latest version of the Lambda layer, instead of deploying the remediation CloudFormation StackSet as described in the previous section.

Cleaning up

Refer to the documentation for instructions on deleting all the created stack instances from your account. After, proceed to delete the CloudFormation StackSet.

Conclusion

Managing Lambda layers across multiple accounts and Regions can be challenging at scale. By using a combination of AWS Config, EventBridge Scheduler, AWS Systems Manager (SSM) Automation, and CloudFormation StackSets, it is possible to streamline the process.

The example provides on-demand visibility into affected Lambda functions and allows scheduled remediation of impacted functions. AWS SSM Automation further simplifies maintenance, deployment, and remediation tasks. With this architecture, you can efficiently manage updates to your Lambda layers and ensure compliance with your organization’s policies, saving time and reducing errors in your serverless applications.

To learn more about using Lambda layer, visit the AWS documentation. For more serverless learning resources, visit Serverless Land.

Implementing idempotent AWS Lambda functions with Powertools for AWS Lambda (TypeScript)

Post Syndicated from Pascal Vogel original https://aws.amazon.com/blogs/compute/implementing-idempotent-aws-lambda-functions-with-powertools-for-aws-lambda-typescript/

This post is written by Alexander Schüren, Sr Specialist SA, Powertools.

One of the design principles of AWS Lambda is to “develop for retries and failures”. If your function fails, the Lambda service will retry and invoke your function again with the same event payload. Therefore, when your function performs tasks such as processing orders or making reservations, it is necessary for your Lambda function to handle requests idempotently to avoid duplicate payment or order processing, which can result in a poor customer experience.

This article explains what idempotency is and how to make your Lambda functions idempotent using the idempotency utility for Powertools for AWS Lambda (TypeScript). The Powertools idempotency utility for TypeScript was co-developed with Vanguard and is now generally available.

Understanding idempotency

Idempotency is the property of an operation that can be applied multiple times without changing the result beyond the initial execution. You can safely run an idempotent operation multiple times without side effects, such as duplicate records or data inconsistencies. This is especially relevant for payment and order processing or third-party API integrations.

There are key concepts to consider when implementing idempotency in AWS Lambda. For each invocation, you specify which subset of the event payload you want to use to identify an idempotent request. This is called the idempotency key. This key can be a single field such as transactionId, a combination of multiple fields such as customerId and requestId, or the entire event payload.

Because timestamps, dates, and other generated values within the payload affect the idempotency key, we recommend that you define specific fields rather than using the entire event payload.

By evaluating the idempotency key, you can then decide if the function needs to run again or send an existing response to the client. To do this, you need to store the following information for each request in a persistence layer (i.e., Amazon DynamoDB):

  • Status: IN_PROGRESS, EXPIRED, COMPLETE
  • Response data: the response to send back to the client instead of executing the function again
  • Expiration timestamp: when the idempotency record becomes invalid for reuse

The following diagram shows a successful request flow for this idempotency scenario:

Request flow for idempotent Lambda function

When you invoke a Lambda function with a particular event for the first time, it stores a record with a unique idempotency key tied to an event payload in the persistence layer.

The function then executes its code and updates the record in the persistence layer with the function response. For subsequent invocations with the same payload, you must check if the idempotency key exists in the persistence layer. If it exists, the function returns the same response to the client. This prevents multiple invocations of the function, making it idempotent.

There are more edge cases to be mindful of, such as when the idempotency record has expired, or handling of failures between the client, the Lambda function, and the persistence layer. The Powertools for AWS Lambda (TypeScript) documentation covers all request flows in detail.

Idempotency with Powertools for AWS Lambda (TypeScript)

Powertools for AWS Lambda, available in PythonJava, .NET, and TypeScript, provides utilities for Lambda functions to ease the adoption of best practices and to reduce the amount of code needed to perform recurring tasks. In particular, it provides a module to handle idempotency.

This post shows examples using the TypeScript version of Powertools. To get started with the Powertools idempotency module, you must install the library and configure it within your build process. For more details, follow the Powertools for AWS Lambda documentation.

Getting started

Powertools for AWS Lambda (TypeScript) is modular, meaning you can install the idempotency utility independently from the Logger, Tracing, Metrics, or other packages. Install the idempotency utility library and the AWS SDK v3 client for DynamoDB in your project using npm:

npm i @aws-lambda-powertools/idempotency @aws-sdk/client-dynamodb @aws-sdk/lib-dynamodb

Before getting started, you need to create a persistent storage layer where the idempotency utility can store its state. Your Lambda function AWS Identity and Access Management (IAM) role must have dynamodb:GetItem, dynamodb:PutItem, dynamodb:UpdateItem and dynamodb:DeleteItem permissions.

Currently, DynamoDB is the only supported persistent storage layer, so you’ll need to create a table first. Use the AWS Cloud Development Kit (CDK), AWS CloudFormation, AWS Serverless Application Model (SAM) or any Infrastructure as Code tool of your choice that supports DynamoDB resources.

The following sections illustrate how to instrument your Lambda function code to make it idempotent using a wrapper function or using middy middleware.

Using the function wrapper

Assuming you have created a DynamoDB table with the name IdempotencyTable, create a persistence layer in your Lambda function code:

import { makeIdempotent } from "@aws-lambda-powertools/idempotency";
import { DynamoDBPersistenceLayer } from "@aws-lambda-powertools/idempotency/dynamodb";

const persistenceStore = new DynamoDBPersistenceLayer({
  tableName: "IdempotencyTable",
});

Now, apply the makeIdempotent function wrapper to your Lambda function handler to make it idempotent and use the previously configured persistence store.

import { makeIdempotent } from '@aws-lambda-powertools/idempotency';
import { DynamoDBPersistenceLayer } from '@aws-lambda-powertools/idempotency/dynamodb';
import type { Context } from 'aws-lambda';
import type { Request, Response, SubscriptionResult } from './types';

export const handler = makeIdempotent(
  async (event: Request, _context: Context): Promise<Response> => {
    try {
      const payment = … // create payment
	  
      return {
        paymentId: payment.id,
        message: 'success',
        statusCode: 200,
      };

    } catch (error) {
      throw new Error('Error creating payment');
    }
  },
  {
    persistenceStore,
  }
);

The function processes the incoming event to create a payment and return the paymentId, message, and status back to the client. Making the Lambda function handler idempotent ensures that payments are only processed once, despite multiple Lambda invocations with the same event payload. You can also apply the makeIdempotent function wrapper to any other function outside of your handler.

Use the following type definitions for this example by adding a types.ts file to your source folder:

type Request = {
  user: string;
  productId: string;
};

type Response = {
  [key: string]: unknown;
};

type SubscriptionResult = {
  id: string;
  productId: string;
};

Using middy middleware

If you are using middy middleware, Powertools provides makeHandlerIdempotent middleware to make your Lambda function handler idempotent:

import { makeHandlerIdempotent } from '@aws-lambda-powertools/idempotency/middleware';
import { DynamoDBPersistenceLayer } from '@aws-lambda-powertools/idempotency/dynamodb';
import middy from '@middy/core';
import type { Context } from 'aws-lambda';
import type { Request, Response, SubscriptionResult } from './types';

const persistenceStore = new DynamoDBPersistenceLayer({
  tableName: 'IdempotencyTable',
});

export const handler = middy(
  async (event: Request, _context: Context): Promise<Response> => {
    try {
      const payment = … // create payment object
	  
      return {
        paymentId: payment.id,
        message: 'success',
        statusCode: 200,
      };
    } catch (error) {
      throw new Error('Error creating payment');
    }
  }
).use(
    makeHandlerIdempotent({
      persistenceStore,
  })
);

Configuration options

The Powertools idempotency utility comes with several configuration options to change the idempotency behavior that will fit your use case scenario. This section highlights the most common configurations. You can find all available customization options in the AWS Powertools for Lambda (TypeScript) documentation.

Persistence layer options

When you create a DynamoDBPersistenceLayer object, only the tableName attribute is required. Powertools will expect the table with a partition key id and will create other attributes with default values.

You can change these default values if needed by passing the options parameter:

import { DynamoDBPersistenceLayer } from '@aws-lambda-powertools/idempotency/dynamodb';

const persistenceStore = new DynamoDBPersistenceLayer({
  tableName: 'idempotencyTableName',
  keyAttr: 'idempotencyKey', // default: id
  expiryAttr: 'expiresAt', // default: expiration
  inProgressExpiryAttr: 'inProgressExpiresAt', // default: in_progress_expiration
  statusAttr: 'currentStatus', // default: status
  dataAttr: 'resultData', // default: data
  validationKeyAttr: 'validationKey', .// default validation
});

Using a subset of the event payload

When you configure idempotency for your Lambda function handler, Powertools will use the entire event payload for idempotency handling by hashing the object.

However, events from AWS services such as Amazon API Gateway or Amazon Simple Queue Service (Amazon SQS) often have generated fields, such as timestamp or requestId. This results in Powertools treating each event payload as unique.

To prevent that, create an IdempotencyConfig and configure which part of the payload should be hashed for the idempotency logic.

Create the IdempotencyConfig and set eventKeyJmespath to a key within your event payload:

import { IdempotencyConfig } from '@aws-lambda-powertools/idempotency';

// Extract the idempotency key from the request headers
const config = new IdempotencyConfig({
  eventKeyJmesPath: 'headers."X-Idempotency-Key"',
});

Use the X-Idempotency-Key header for your idempotency key. Subsequent invocations with the same header value will be idempotent.

You can then add the configuration to the makeIdempotent function wrapper from the previous example:

export const handler = makeIdempotent(
  async (event: Request, _context: Context): Promise<Response> => {
    try {
      const payment = … // create payment
      
	  return {
        paymentId: payment.id,
        message: 'success',
        statusCode: 200,
      };
    } catch (error) {
      throw new Error('Error creating payment');
    }
  },
  {
    persistenceStore,
    config
  }
);

The event payload should contain X-Idempotency-Key in the headers, so Powertools can use this field to handle idempotency:

{
  "version": "2.0",
  "routeKey": "ANY /createpayment",
  "rawPath": "/createpayment",
  "rawQueryString": "",
  "headers": {
    "Header1": "value1",
    "X-Idempotency-Key": "abcdefg"
  },
  "requestContext": {
    "accountId": "123456789012",
    "apiId": "api-id",
    "domainName": "id.execute-api.us-east-1.amazonaws.com",
    "domainPrefix": "id",
    "http": {
      "method": "POST",
      "path": "/createpayment",
      "protocol": "HTTP/1.1",
      "sourceIp": "ip",
      "userAgent": "agent"
    },
    "requestId": "id",
    "routeKey": "ANY /createpayment",
    "stage": "$default",
    "time": "10/Feb/2021:13:40:43 +0000",
    "timeEpoch": 1612964443723
  },
  "body": "{\"user\":\"xyz\",\"productId\":\"123456789\"}",
  "isBase64Encoded": false
}

There are other configuration options you can apply, such as payload validation, expiration duration, local caching, and others. See the Powertools for AWS Lambda (TypeScript) documentation for more information.

Customizing the AWS SDK configuration

The DynamoDBPersistenceLayer is built-in and allows you to store the idempotency data for all your requests. Under the hood, Powertools uses the AWS SDK for JavaScript v3. Change the SDK configuration by passing a clientConfig object.

The following sample sets the region to eu-west-1:

import { DynamoDBPersistenceLayer } from '@aws-lambda-powertools/idempotency/dynamodb';

const persistenceStore = new DynamoDBPersistenceLayer({
  tableName: 'IdempotencyTable',
  clientConfig: {
    region: 'eu-west-1',
  },
});

If you are using your own client, you can pass it the persistence layer:

import { DynamoDBPersistenceLayer } from '@aws-lambda-powertools/idempotency/dynamodb';
import { DynamoDBClient } from '@aws-sdk/client-dynamodb';

const ddbClient = new DynamoDBClient({ region: 'eu-west-1' });

const dynamoDBPersistenceLayer = new DynamoDBPersistenceLayer({
  tableName: 'IdempotencyTable',
  awsSdkV3Client: ddbClient,
});

Conclusion

Making your Lambda functions idempotent can be a challenge and, if not done correctly, can lead to duplicate data, inconsistencies, and a bad customer experience. This post shows how to use Powertools for AWS Lambda (TypeScript) to process your critical transactions only once when using AWS Lambda.

For more details on the Powertools idempotency feature and its configuration options, see the full documentation.

For more serverless learning resources, visit Serverless Land.

Manage roles and entitlements with PBAC using Amazon Verified Permissions

Post Syndicated from Abhishek Panday original https://aws.amazon.com/blogs/devops/manage-roles-and-entitlements-with-pbac-using-amazon-verified-permissions/

Traditionally, customers have used role-based access control (RBAC) to manage entitlements within their applications. The application controls what users can do, based on the roles they are assigned. But, the drive for least privilege has led to an exponential growth in the number of roles. Customers can address this role explosion by moving authorization logic out of the application code, and implementing a policy-based access control (PBAC) model that augments RBAC with attribute-based access control (ABAC).

In this blog post, we cover roles and entitlements, how they are applicable in apps authorization decisions, how customers implement roles and authorization in their app today, and how to shift to a centralized PBAC model by using Amazon Verified Permissions.

Describing roles and entitlements, approaches and challenges of current implementations

In RBAC models, a user’s entitlements are assigned based on job role. This role could be that of a developer, which might grant permissions to affect code in the pipeline of an app. Entitlements represent the features, functions, and resources a user has permissions to access. For example, a customer might be able to place orders or view pets in a pet store application, or a store owner might be entitled to review orders made from their store.

The combination of roles assigned to a user and entitlements granted to these roles determines what a human user can do within your application. Traditionally, application access has all been handled in code by hard coding roles that users can be assigned and mapping those roles directly to a set of actions on resources. However, as the need to apply more granular access control grows (as with least privilege), so do the number of required hard-coded roles that are assigned to users to obtain this level of granularity. This problem is frequently called role explosion, where role definitions grow exponentially which requires additional overhead from your teams to manage and audit roles effectively. For example, the code to authorize request to get details of an order has multiple if/else statements, as shown in the following sample.


boolean userAuthorizedForOrder (Order order, User user){
    if (user.storeId == user.storeID) {
        if (user.roles.contains("store-owner-roles") {            // store owners can only access orders for their own stores  
            return true; 
        } else if (user.roles.contains("store-employee")) {
            if (isStoreOpen(current_time)) {                      // Only allow access for the order to store-employees when
                return true                                       // store is open 
            }
        }
    } else {
        if (user.roles("customer-service-associate") &amp;&amp;           // Only allow customer service associates to orders for cases 
                user.assignedShift(current_time)) &amp;&amp;              // they are assinged and only during their assigned shift
                user.currentCase.order.orderId == order.orderId
         return true;
    }
    return false; 
}

This problem introduces several challenges. First, figuring out why a permission was granted or denied requires a closer look at the code. Second, adding a permission requires code changes. Third, audits can be difficult because you either have to run a battery of tests or explore code across multiple files to demonstrate access controls to auditors. Though there might be additional considerations, these three challenges have led many app owners to begin looking at PBAC methods to address the granularity problem. You can read more about the foundations of PBAC models in Policy-based access control in application development with Amazon Verified Permissions. By shifting to a PBAC model, you can reduce role growth to meet your fine-grained permissions needs. You can also externalize authorization logic from code, develop granular permissions based on roles and attributes, and reduce the time that you spend refactoring code for changes to authorization decisions or reading through the code to audit authorization logic.

In this blog, we demonstrate implementing permissions in a PBAC model through a demo application. The demo application uses Cognito groups to manage role assignment, Verified Permissions to implement entitlements for the roles. The approach restricts the resources that a role can access using attribute-based conditions. This approach works well in usecases when you already have a system in place to manage role assignment and you can define resources that a user may access by matching attributes of the user with attributes of the resource.

Demo app

Let’s look at a sample pet store app. The app is used by 2 types of users – end users and store owners. The app enables end users to search and order pets. The app allows store owners to list orders for the store. This sample app is available for download and local testing on the aws-samples/avp-petstore-sample Github repository. The app is a web app built by using AWS Amplify, Amazon API-Gateway, Amazon Cognito, and Amazon Verified Permissions. The following diagram is a high-level illustration of the app’s architecture.

Architectural Diagram

Steps

  1. The user logs in to the application, and is re-directed to Amazon Cognito to sign-in and obtain a JWT token.
  2. When user take an action (eg. ListOrders) in the application, the application calls Amazon API-Gateway to process the request.
  3. Amazon API-Gateway forwards the request to a lambda function, that call Amazon Verified Permissions to authorize the action. If the authorization results in deny, the lambda returns Unauthorized back to the application.
  4. If the authorization succeed, the application continues to execute the action.

RBAC policies in action

In this section, we focus on building RBAC permissions for the sample pet store app. We will guide you through building RBAC by using Verified Permissions and by focusing on a role for store owners, who are allowed to view all orders for a store. We use Verified Permissions to manage the permissions granted to this role and Amazon Cognito to manage role assignments.

We model the store owner role in Amazon Cognito as a user group called Store-Owner-Role. When a user is assigned the store owner role, the user is added to the “Store-Owner-Role” user group. You can create the users and users groups required to follow along with the sample application by visiting managing users and groups in Amazon Cognito.

After users are assigned to the store owner role, you can enforce that they can list all orders in the store by using the following RBAC policy. The policy provides access to any user in the Store-Owner-Role to perform the ListOrders and GetStoreInventory actions on any resource.

permit (
         principal in MyApplication::Group::"Store-Owner-Role",
         action in [
              MyApplication::Action::"GetStoreInventory",
              MyApplication::Action::"ListOrders"
         ],
         resource
);

Based on the policy we reviewed – the store owner will receive a Success! when they attempt to list existing orders.

Eve is permitted to list orders

This example further demonstrates the division of responsibility between the identity provider (Amazon Cognito) and Verified Permissions. The identity provider (IdP) is responsible for managing roles and memberships in roles. Verified Permissions is responsible for managing policies that describe what those roles are permitted to do. As demonstrated above, you can use this process to add roles without needing to change code.

Using PBAC to help reduce role explosion

Up until the point of role explosion, RBAC has worked well as the sole authorization model. Unfortunately, we have heard from customers that this model does not scale well because of the challenge of role explosion. Role explosion happens when you have hundreds or thousands of roles, and managing and auditing those roles becomes challenging. In extreme cases, you might have more roles than the number of users in your organization. This happens primarily because organizations keep creating more roles, with each role granting access to a smaller set of resources in an effort to follow the principle of least privilege.

Let’s understand the problem of role explosion through our sample pet store app. The pet store app is now being sold as a SaaS product to pet stores in other locations. As a result, the app needs additional access controls to ensure that each store owner can view only the orders from their own store. The most intuitive way to implement these access controls was to create an additional role for each location, which would restrict the scope of access for a store owner to their respective store’s orders. For example, a role named petstore-austin would allow access only to resources in the Austin, Texas store. RBAC models allow developers to predefine sets of permissions that can be used in an application, and ABAC models allow developers to adapt those permissions to the context of the request (such as the client, the resource, and the method used). The adoption of both RBAC and ABAC models leads to an explosion of either roles or attribute-based rules as the number of store locations increases.

To solve this problem, you can combine RBAC and ABAC policies into a PBAC model. RBAC policies determines the actions the user can take. Augmenting these policies with ABAC policies allows you to control the resouces they can take those actions on. For example, you can scope down the resources a user can access based on identity attributes, such as department or business unit, region, and management level. This approach mitigates role explosion because you need to have only a small number of predefined roles, and access is controlled based on attributes. You can use Verified Permissions to combine RBAC and ABAC models in the form of Cedar policies to build this PBAC solution.

We can demonstrate this solution in the sample pet store app by modifying the policy we created earlier and adding ABAC conditions. The conditions specify that users can only ListOrders of the store they own. The store a store owner owns is represented in Amazon Cognito by employmentStoreCode. This policy now expands on the granularity of access of the original RBAC policy without leading to numerous RBAC policies.

permit (
         principal in MyApplication::Group::"Store-Owner-Role",
         action in [
              MyApplication::Action::"GetStoreInventory",
              MyApplication::Action::"ListOrders"
          ],
          resource
) when { 
          principal.employmentStoreCode == resource.storeId 
};

We demonstrate that our policy restricts access for store owners to the store they own, by creating a user – eve – who is assigned the Store-Owner-Role and owns petstore-london. When Eve lists orders for the petstore-london store, she gets a success response, indicating she has permissions to list orders.
Eve is permitted to list orders for petstore-london

Next, when even tries to list orders for the petstore-seattle store, she gets a Not Authorized response. She is denied access as she does not own petstore-seattle.

Eve is not permitted to list orders for petstore-seattle

Step-by-step walkthrough of trying the Demo App

If you want to go through the demo of our sample pet store app, we recommend forking it from aws-samples/avp-petstore-sample Github repo and going through this process in README.md to ensure hands-on familiarity.

We will first walk through setting up permissions using only RBAC for the sample pet store application. Next, we will see how you can use PBAC to implement least priveledge as the application scales.

Implement RBAC based Permissions

We describe setting up policies to implement entitlements for the store owner role in Verified Permissions.

    1. Navigate to the AWS Management Console, search for Verified Permissions, and select the service to go to the service page.
    2. Create new policy store to create a container for your policies. You can create an Empty Policy Store for the purpose of the walk-through.
    3. Navigate to Policies in the navigation pane and choose Create static policy.
    4. Select Next and paste in the following Cedar policy and select Save.
permit (
        principal in MyApplication::Group::"Store-Owner-Role",
        action in [
               MyApplication::Action::"GetStoreInventory",
               MyApplication::Action::"ListOrders"
         ],
         resource
);
  1. You need to get users and assign the Store-Owner-Role to them. In this case, you will use Amazon Cognito as the IdP and the role can be assigned there. You can create users and groups in Cognito by following the below steps.
    1. Navigate to Amazon Cognito from the AWS Management Console, and select the user group created for the pet store app.
    2. Creating a user by clicking create user and create a user with user name eve
    3. Navigate to the Groups section and create a group called Store-Owner-Role .
    4. Add eve to the Store-Owner-Role group by clicking Add user to Group, selecting eve and clicking the Add.
  2. Now that you have assigned the Store-Owner-Role to the user, and Verified Permissions has a permit policy granting entitlements based on role membership, you can log in to the application as the user – eve – to test functionality. When choosing List All Orders, you can see the approval result in the app’s output.

Implement PBAC based Permissions

As the company grows, you want to be able to limit GetOrders access to a specific store location so that you can follow least privilege. You can update your policy to PBAC by adding an ABAC condition to the existing permit policy. You can add a condition in the policy that restricts listing orders to only those stores the user owns.

Below is the walk-though of updating the application

    1. Navigate to the Verified Permissions console and update the policy to the below.
permit (
         principal in MyApplication::Group::"Store-Owner-Role",
         action in [
              MyApplication::Action::"GetStoreInventory",
              MyApplication::Action::"ListOrders"
          ],
          resource
) when { 
          principal.employmentStoreCode == resource.storeId 
};
  1. Navigate to the Amazon Cognito console, select the user eve and click “Edit” in the user attributes section to update the “custom:employmentStoreCode”. Set the attribute value to “petstore-london” as eve owns the petstore-london location
  2. You can demonstrate that eve can only list orders of “petstore-london” by following the below steps
    1. We want to make sure that latest changes to the user attributed are passed to the application in the identity token. We will refresh the identity token, by logging out of the app and logging in again as Eve. Navigate back to the application and logout as eve.
    2. In the application, we set the Pet Store Identifier as petstore-london and click the List All Orders. The result is success!, as Eve is authorized to list orders of the store she owns.
    3. Next, we change the Pet Store Identifier to petstore-seattle and and click the List All Orders. The result is Not Authorized, as Eve is authorized to list orders of stores she does not owns.

Clean Up section

You can cleanup the resources that were created in this blog by following these steps.

Conclusion

In this post, we reviewed what roles and entitlements are as well as how they are used to manage user authorization in your app. We’ve also covered RBAC and ABAC policy examples with respect to the demo application, avp-petstore-sample, that is available to you via AWS Samples for hands-on testing. The walk-through also covered our example architecture using Amazon Cognito as the IdP and Verified Permissions as the centralized policy store that assessed authorization results based on the policies set for the app. By leveraging Verified Permissions, we could use PBAC model to define fine-grained access while preventing role explosion. For more information about Verified Permissions, see the Amazon Verified Permissions product details page and Resources page.

Abhishek Panday

Abhishek is a product manager in the Amazon Verified Permissions team. He has been working with the AWS for more than two years, and has been at Amazon for more than five years. Abhishek enjoys working with customers to understand the customer’s challenges and building products to solve those challenges. Abhishek currently lives in Seattle and enjoys playing soccer, hiking, and cooking Indian cuisines.

Jeremy Ware

Jeremy is a Security Specialist Solutions Architect focused on Identity and Access Management. Jeremy and his team enable AWS customers to implement sophisticated, scalable, and secure IAM architecture and Authentication workflows to solve business challenges. With a background in Security Engineering, Jeremy has spent many years working to raise the Security Maturity gap at numerous global enterprises. Outside of work, Jeremy loves to explore the mountainous outdoors participate in sports such as Snowboarding, Wakeboarding, and Dirt bike riding.

Building resilient serverless applications using chaos engineering

Post Syndicated from Marcia Villalba original https://aws.amazon.com/blogs/compute/building-resilient-serverless-applications-using-chaos-engineering/

This post is written by Suranjan Choudhury (Head of TME and ITeS SA) and Anil Sharma (Sr PSA, Migration) 

Chaos engineering is the process of stressing an application in testing or production environments by creating disruptive events, such as outages, observing how the system responds, and implementing improvements. Chaos engineering helps you create the real-world conditions needed to uncover hidden issues and performance bottlenecks that are challenging to find in distributed applications.

You can build resilient distributed serverless applications using AWS Lambda and test Lambda functions in real world operating conditions using chaos engineering.  This blog shows an approach to inject chaos in Lambda functions, making no change to the Lambda function code. This blog uses the AWS Fault Injection Simulator (FIS) service to create experiments that inject disruptions for Lambda based serverless applications.

AWS FIS is a managed service that performs fault injection experiments on your AWS workloads. AWS FIS is used to set up and run fault experiments that simulate real-world conditions to discover application issues that are difficult to find otherwise. You can improve application resilience and performance using results from FIS experiments.

The sample code in this blog introduces random faults to existing Lambda functions, like an increase in response times (latency) or random failures. You can observe application behavior under introduced chaos and make improvements to the application.

Approaches to inject chaos in Lambda functions

AWS FIS currently does not support injecting faults in Lambda functions. However, there are two main approaches to inject chaos in Lambda functions: using external libraries or using Lambda layers.

Developers have created libraries to introduce failure conditions to Lambda functions, such as chaos_lambda and failure-Lambda. These libraries allow developers to inject elements of chaos into Python and Node.js Lambda functions. To inject chaos using these libraries, developers must decorate the existing Lambda function’s code. Decorator functions wrap the existing Lambda function, adding chaos at runtime. This approach requires developers to change the existing Lambda functions.

You can also use Lambda layers to inject chaos, requiring no change to the function code, as the fault injection is separated. Since the Lambda layer is deployed separately, you can independently change the element of chaos, like latency in response or failure of the Lambda function. This blog post discusses this approach.

Injecting chaos in Lambda functions using Lambda layers

A Lambda layer is a .zip file archive that contains supplementary code or data. Layers usually contain library dependencies, a custom runtime, or configuration files. This blog creates an FIS experiment that uses Lambda layers to inject disruptions in existing Lambda functions for Java, Node.js, and Python runtimes.

The Lambda layer contains the fault injection code. It is invoked prior to invocation of the Lambda function and injects random latency or errors. Injecting random latency simulates real world unpredictable conditions. The Java, Node.js, and Python chaos injection layers provided are generic and reusable. You can use them to inject chaos in your Lambda functions.

The Chaos Injection Lambda Layers

Java Lambda Layer for Chaos Injection

Java Lambda Layer for Chaos Injection

The chaos injection layer for Java Lambda functions uses the JAVA_TOOL_OPTIONS environment variable. This environment variable allows specifying the initialization of tools, specifically the launching of native or Java programming language agents. The JAVA_TOOL_OPTIONS has a javaagent parameter that points to the chaos injection layer. This layer uses Java’s premain method and the Byte Buddy library for modifying the Lambda function’s Java class during runtime.

When the Lambda function is invoked, the JVM uses the class specified with the javaagent parameter and invokes its premain method before the Lambda function’s handler invocation. The Java premain method injects chaos before Lambda runs.

The FIS experiment adds the layer association and the JAVA_TOOL_OPTIONS environment variable to the Lambda function.

Python and Node.js Lambda Layer for Chaos Injection

Python and Node.js Lambda Layer for Chaos Injection

When injecting chaos in Python and Node.js functions, the Lambda function’s handler is replaced with a function in the respective layers by the FIS aws:ssm:start-automation-execution action. The automation, which is an SSM document, saves the original Lambda function’s handler to in AWS Systems Manager Parameter Store, so that the changes can be rolled back once the experiment is finished.

The layer function contains the logic to inject chaos. At runtime, the layer function is invoked, injecting chaos in the Lambda function. The layer function in turn invokes the Lambda function’s original handler, so that the functionality is fulfilled.

The result in all runtimes (Java, Python, or Node.js), is invocation of the original Lambda function with latency or failure injected. The observed changes are random latency or failure injected by the layer.

Once the experiment is completed, an SSM document is provided. This rolls back the layer’s association to the Lambda function and removes the environment variable, in the case of the Java runtime.

Sample FIS experiments using SSM and Lambda layers

In the sample code provided, Lambda layers are provided for Python, Node.js and Java runtimes along with sample Lambda functions for each runtime.

The sample deploys the Lambda layers and the Lambda functions, FIS experiment template, AWS Identity and Access Management (IAM) roles needed to run the experiment, and the AWS Systems Manger (SSM) Documents. AWS CloudFormation template is provided for deployment.

Step 1: Complete the prerequisites

  • To deploy the sample code, clone the repository locally:
    git clone https://github.com/aws-samples/chaosinjection-lambda-samples.git
  • Complete the prerequisites documented here.

Step 2: Deploy using AWS CloudFormation

The CloudFormation template provided along with this blog deploys sample code. Execute runCfn.sh.

When this is complete, it returns the StackId that CloudFormation created:

Step 3: Run the chaos injection experiment

By default, the experiment is configured to inject chaos in the Java sample Lambda function. To change it to Python or Node.js Lambda functions, edit the experiment template and configure it to inject chaos using steps from here.

Step 4: Start the experiment

From the FIS Console, choose Start experiment.

 Start experiment

Wait until the experiment state changes to “Completed”.

Step 5: Run your test

At this stage, you can inject chaos into your Lambda function. Run the Lambda functions and observe their behavior.

1. Invoke the Lambda function using the command below:

aws lambda invoke --function-name NodeChaosInjectionExampleFn out --log-type Tail --query 'LogResult' --output text | base64 -d

2. The CLI commands output displays the logs created by the Lambda layers showing latency introduced in this invocation.

In this example, the output shows that the Lambda layer injected 1799ms of random latency to the function.

The experiment injects random latency or failure in the Lambda function. Running the Lambda function again results in a different latency or failure. At this stage, you can test the application, and observe its behavior under conditions that may occur in the real world, like an increase in latency or Lambda function’s failure.

Step 6: Roll back the experiment

To roll back the experiment, run the SSM document for rollback. This rolls back the Lambda function to the state before chaos injection. Run this command:

aws ssm start-automation-execution \
--document-name “InjectLambdaChaos-Rollback” \
--document-version “\$DEFAULT” \
--parameters \
‘{“FunctionName”:[“FunctionName”],”LayerArn”:[“LayerArn”],”assumeRole”:[“RoleARN
”]}’ \
--region eu-west-2

Cleaning up

To avoid incurring future charges, clean up the resources created by the CloudFormation template by running the following CLI command. Update the stack name to the one you provided when creating the stack.

aws cloudformation delete-stack --stack-name myChaosStack

Using FIS Experiments results

You can use FIS experiment results to validate expected system behavior. An example of expected behavior is: “If application latency increases by 10%, there is less than a 1% increase in sign in failures.” After the experiment is completed, evaluate whether the application resiliency aligns with your business and technical expectations.

Conclusion

This blog explains an approach for testing reliability and resilience in Lambda functions using chaos engineering. This approach allows you to inject chaos in Lambda functions without changing the Lambda function code, with clear segregation of chaos injection and business logic. It provides a way for developers to focus on building business functionality using Lambda functions.

The Lambda layers that inject chaos can be developed and managed separately. This approach uses AWS FIS to run experiments that inject chaos using Lambda layers and test serverless application’s performance and resiliency. Using the insights from the FIS experiment, you can find, fix, or document risks that surface in the application while testing.

For more serverless learning resources, visit Serverless Land.

Best Practices for Writing Step Functions Terraform Projects

Post Syndicated from Patrick Guha original https://aws.amazon.com/blogs/devops/best-practices-for-writing-step-functions-terraform-projects/

Terraform by HashiCorp is one of the most popular infrastructure-as-code (IaC) platforms. AWS Step Functions is a visual workflow service that helps developers use AWS services to build distributed applications, automate processes, orchestrate microservices, and create data and machine learning (ML) pipelines. In this blog, we showcase best practices for users leveraging Terraform to deploy workflows, also known as Step Functions state machines. We will create a state machine using Workflow Studio for AWS Step Functions, deploy the state machine with Terraform, and introduce best operating practices on topics such as project structure, modules, parameter substitution, and remote state.

We recommend that you have a working understanding of both Terraform and Step Functions before going through this blog. If you are brand new to Step Functions and/or Terraform, please visit the Introduction to Terraform on AWS Workshop and the Terraform option in the Managing State Machines with Infrastructure as Code section of The AWS Step Functions Workshop to learn more.

Step Functions and Terraform Project Structure

One of the most important parts of any software project is its structure. It must be clear and well-organized for yourself or any member of your team to pick up and start coding efficiently. A Step Functions project using Terraform can potentially have many moving parts and components, so it is especially important to modularize and label wherever possible. Let’s take a look at a project structure that will allow for modularization, re-usability, and extensibility:

mkdir sfn-tf-example
cd sfn-tf-example
mkdir -p -- statemachine modules functions/first-function/src
touch main.tf outputs.tf variables.tf .gitignore functions/first-function/src/lambda.py
tree

Before moving forward, let’s analyze the directory, subdirectories, and files created above:

  • /statemachine will hold our Amazon States Language (ASL) JSON code describing the Step Functions state machine definition. This is where the orchestration logic will reside, so it is prudent to keep it separated from the infrastructure code. If you are deploying multiple state machines in your project, each definition will have its own JSON file. If you prefer, you can specify separate folders for each state machine to further modularize and isolate the logic.
  • /functions subdirectory includes the actual code for AWS Lambda functions used in our state machine. Keeping this code here will be much easier to read than writing it inline in our main.tf file.
  • The last subdirectory we have is /modules. Terraform modules are higher level abstracts explaining new concepts in your architecture. However, do not fall into the trap of making a custom module for everything. Doing so will make your code harder to maintain, and AWS provider resources will often suffice. There are also very popular modules that you can use from the Terraform Registry, such as Terraform AWS modules. Whenever possible, one should re-use modules to avoid code duplication in your project.
  • The remaining files in the root of the project are common to all Terraform projects. There are going to be hidden files created by your Terraform project after running terraform init, so we will include a .gitignore. What you include in .gitignore is largely dependent on your codebase and what your tools silently create in the background. In a later section, we will explicitly call out *.tfstate files in our .gitignore, and go over best practices for managing Terraform state securely and remotely.

Initial Code and Project Setup

We are going to create a simple Step Functions state machine that will only execute a single Lambda function. However, we will need to create the Lambda function that the state machine will reference. We first need to create our Lambda function code and save it in the following the directory structure and file mentioned above: functions/first-function/src/lambda.py.

import boto3

def lambda_handler(event, context):
# Minimal function for demo purposes
	return True

In Terraform, the main configuration file is named main.tf. This is the file that the Terraform CLI will look for in the local directory. Although you can break down your template into multiple .tf files, main.tf must be one of them. In this file, we will define the required providers and their minimum version, along with the resource definition of our template. In the example below, we define the minimum resources needed for a simple state machine that only executes a Lambda function. We define the two AWS Identity and Access Management (IAM) roles that our Lambda function and state machine will use, respectively. We define a data resource that zips the Lambda function code, which is then used in the Lambda function definition. Also notice that we use the aws_iam_policy_document data source throughout. Using the official IAM policy document means both your integrated development environment (IDE) and Terraform can see if your policy is malformed before running terraform apply. Finally, we define an Amazon CloudWatch Log group that will be used by the Lambda function to store its execution logs.

Terraform {
  required_providers {
    aws = {
      source  = "hashicorp/aws"
      version = "~>4.0"
    }
  }
}

provider "aws" {}

provider "random" {}

data "aws_caller_identity" "current_account" {}

data "aws_region" "current_region" {}

resource "random_string" "random" {
  length  = 4
  special = false
}

data "aws_iam_policy_document" "lambda_assume_role_policy" {
  statement {
    effect = "Allow"

    principals {
      type        = "Service"
      identifiers = ["lambda.amazonaws.com"]
    }

    actions = [
      "sts:AssumeRole",
    ]
  }
}

resource "aws_iam_role" "function_role" {
  assume_role_policy  = data.aws_iam_policy_document.lambda_assume_role_policy.json
  managed_policy_arns = ["arn:aws:iam::aws:policy/service-role/AWSLambdaBasicExecutionRole"]
}

# Create the function
data "archive_file" "lambda" {
  type        = "zip"
  source_file = "functions/first-function/src/lambda.py"
  output_path = "functions/first-function/src/lambda.zip"
}

resource "aws_kms_key" "log_group_key" {}

resource "aws_kms_key_policy" "log_group_key_policy" {
  key_id = aws_kms_key.log_group_key.id
  policy = jsonencode({
    Id = "log_group_key_policy"
    Statement = [
      {
        Action = "kms:*"
        Effect = "Allow"
        Principal = {
          AWS = "arn:aws:iam::${data.aws_caller_identity.current_account.account_id}:root"
        }

        Resource = "*"
        Sid      = "Enable IAM User Permissions"
      },
      {
        Effect = "Allow",
        Principal = {
          Service : "logs.${data.aws_region.current_region.name}.amazonaws.com"
        },
        Action = [
          "kms:Encrypt*",
          "kms:Decrypt*",
          "kms:ReEncrypt*",
          "kms:GenerateDataKey*",
          "kms:Describe*"
        ],
        Resource = "*"
      }
    ]
    Version = "2012-10-17"
  })
}

resource "aws_lambda_function" "test_lambda" {
  function_name    = "HelloFunction-${random_string.random.id}"
  role             = aws_iam_role.function_role.arn
  handler          = "lambda.lambda_handler"
  runtime          = "python3.9"
  filename         = "functions/first-function/src/lambda.zip"
  source_code_hash = data.archive_file.lambda.output_base64sha256
}

# Explicitly create the function’s log group to set retention and allow auto-cleanup
resource "aws_cloudwatch_log_group" "lambda_function_log" {
  retention_in_days = 1
  name              = "/aws/lambda/${aws_lambda_function.test_lambda.function_name}"
  kms_key_id        = aws_kms_key.log_group_key.arn
}

# Create an IAM role for the Step Functions state machine
data "aws_iam_policy_document" "state_machine_assume_role_policy" {
  statement {
    effect = "Allow"

    principals {
      type        = "Service"
      identifiers = ["states.amazonaws.com"]
    }

    actions = [
      "sts:AssumeRole",
    ]
  }
}

resource "aws_iam_role" "StateMachineRole" {
  name               = "StepFunctions-Terraform-Role-${random_string.random.id}"
  assume_role_policy = data.aws_iam_policy_document.state_machine_assume_role_policy.json
}

data "aws_iam_policy_document" "state_machine_role_policy" {
  statement {
    effect = "Allow"

    actions = [
      "logs:CreateLogStream",
      "logs:PutLogEvents",
      "logs:DescribeLogGroups"
    ]

    resources = ["${aws_cloudwatch_log_group.MySFNLogGroup.arn}:*"]
  }

  statement {
    effect = "Allow"
    actions = [
      "cloudwatch:PutMetricData",
      "logs:CreateLogDelivery",
      "logs:GetLogDelivery",
      "logs:UpdateLogDelivery",
      "logs:DeleteLogDelivery",
      "logs:ListLogDeliveries",
      "logs:PutResourcePolicy",
      "logs:DescribeResourcePolicies",
    ]
    resources = ["*"]
  }

  statement {
    effect = "Allow"

    actions = [
      "lambda:InvokeFunction"
    ]

    resources = ["${aws_lambda_function.test_lambda.arn}"]
  }

}

# Create an IAM policy for the Step Functions state machine
resource "aws_iam_role_policy" "StateMachinePolicy" {
  role   = aws_iam_role.StateMachineRole.id
  policy = data.aws_iam_policy_document.state_machine_role_policy.json
}

# Create a Log group for the state machine
resource "aws_cloudwatch_log_group" "MySFNLogGroup" {
  name_prefix       = "/aws/vendedlogs/states/MyStateMachine-"
  retention_in_days = 1
  kms_key_id        = aws_kms_key.log_group_key.arn
}

Workflow Studio and Terraform Integration

It is important to understand the recommended steps given the different tools we have available for creating Step Functions state machines. You should use a combination of Workflow Studio and local development with Terraform. This workflow assumes you will define all resources for your application within the same Terraform project, and that you will be leveraging Terraform for managing your AWS resources.

Workflow for creating Step Functions state machine via Terraform

Figure 1 – Workflow for creating Step Functions state machine via Terraform

  1. You will write the Terraform definition for any resources you intend to call with your state machine, such as Lambda functions, Amazon Simple Storage Service (Amazon S3) buckets, or Amazon DynamoDB tables, and deploy them using the terraform apply command. Doing this prior to using Workflow Studio will be useful in designing the first version of the state machine. You can define additional resources after importing the state machine into your local Terraform project.
  2. You can use Workflow Studio to visually design the first version of the state machine. Given that you should have created the necessary resources already, you can drag and drop all of the actions and states, link them, and see how they look. Finally, you can execute the state machine for testing purposes.
  3. Once your initial design is ready, you will export the ASL file and save it in your Terraform project. You can use the Terraform resource type aws_sfn_state_machine and reference the saved ASL file in the definition field.
  4. You will then need to parametrize the ASL file given that Terraform will dynamically name the resources, and the Amazon Resource Name (ARN) may eventually change. You do not want to hardcode an ARN in your ASL file, as this will make updating and refactoring your code more difficult.
  5. Finally, you deploy the state machine via Terraform by running terraform apply.

Simple changes should be made directly in the parametrized ASL file in your Terraform project instead of going back to Workflow Studio. Having the ASL file versioned as part of your project ensures that no manual changes break the state machine. Even if there is a breaking change, you can easily roll back to a previous version. One caveat to this is if you are making major changes to the state machine. In this case, taking advantage of Workflow Studio in the console is preferable.

However, you will most likely want to continue seeing a visual representation of the state machine while developing locally. The good news is that you have another option directly integrated into Visual Studio Code (VS Code) that visually renders the state machine, similar to Workflow Studio. This functionality is part of the AWS Toolkit for VS Code. You can learn more about the state machine integration with the AWS Toolkit for VS Code here. Below is an example of a parametrized ASL file and its rendered visualization in VS Code.

Step Functions state machine displayed visually in VS Code

Figure 2 – Step Functions state machine displayed visually in VS Code

Parameter Substitution

In the Terraform template, when you define the Step Functions state machine, you can either include the definition in the template or in an external file. Leaving the definition in the template can cause the template to be less readable and difficult to manage. As a best practice, it is recommended to keep the definition of the state machine in a separate file. This raises the question of how to pass parameters to the state machine. In order to do this, you can use the templatefile function of Terraform. The templatefile function reads a file and renders its content with the supplied set of variables. As shown in the code snippet below, we will use the templatefile function to render the state machine definition file with the Lambda function ARN and any other parameters to pass to the state machine.

resource "aws_sfn_state_machine" "sfn_state_machine" {
  name     = "MyStateMachine-${random_string.random.id}"
  role_arn = aws_iam_role.StateMachineRole.arn
  definition = templatefile("${path.module}/statemachine/statemachine.asl.json", {
    ProcessingLambda = aws_lambda_function.test_lambda.arn
    }
  )
  logging_configuration {
    log_destination        = "${aws_cloudwatch_log_group.MySFNLogGroup.arn}:*"
    include_execution_data = true
    level                  = "ALL"
  }
}

Inside the state machine definition, you have to specify a string template using the interpolation sequences delimited with ${}. Similar to the code snippet below, you will define the state machine with the variable name that will be passed by the templatefile function.

"Lambda Invoke": {
    "Type": "Task",
    "Resource": "arn:aws:states:::lambda:invoke",
    "Parameters": {
        "Payload.$": "$",
        "FunctionName": "${ProcessingLambda}"
    },
    "End": true
}

After the templatefile function runs, it will replace the variable ${ProcessingLambda} with the actual Lambda function ARN generated when the template is deployed.

Remote Terraform State Management

Every time you run Terraform, it stores information about the managed infrastructure and configuration in a state file. By default, Terraform creates the state file called terraform.tfstate in the local directory. As mentioned earlier, you will want to include any .tfstate files in your .gitignore file. This will ensure you do not commit it to source control, which could potentially expose secrets and would most likely lead to errors in state. If you accidentally delete this local file, Terraform cannot track the infrastructure that was previously created. In that case, if you run terraform apply on an updated configuration, Terraform will create it from scratch, which will lead to conflicts. It is recommended that you store the Terraform state remotely in secure storage to enable versioning, encryption, and sharing. Terraform supports storing state in S3 buckets by using the backend configuration block. In order to configure Terraform to write the state file to an S3 bucket, you need to specify the bucket name, the region, and the key name.

It is also recommended that you enable versioning in the S3 bucket and MFA delete to protect the state file from accidental deletion. In addition, you need to make sure that Terraform has the right IAM permissions on the target S3 bucket. In case you have multiple developers working with the same infrastructure simultaneously, Terraform can also use state locking to prevent concurrent runs against the same state. You can use a DynamoDB table to control locking. The DynamoDB table you use must have a partition key named LockID with type String, and Terraform must have the right IAM permissions on the table.

terraform {
    backend "s3" {
        bucket         = "mybucket"
        key            = "path/to/state/file"
        region         = "us-east-1"
        attach_deny_insecure_transport_policy = true # only allow HTTPS connections 
        encrypt        = true
        dynamodb_table = "Table-Name"
    }
}

With this remote state configuration, you will maintain the state securely stored in S3. With every change you apply to your infrastructure, Terraform will automatically pull the latest state from the S3 bucket, lock it using the DynamoDB table, apply the changes, push the latest state again to the S3 bucket and then release the lock.

Cleanup

If you were following along and deployed resources such as the Lambda function, the Step Functions state machine, the S3 bucket for backend state storage, or any of the other associated resources by running terraform apply, to avoid incurring charges on your AWS account, please run terraform destroy to tear these resources down and clean up your environment.

Conclusion

In conclusion, this blog provides a comprehensive guide to leveraging Terraform for deploying AWS Step Functions state machines. We discussed the importance of a well-structured project, initial code setup, integration between Workflow Studio and Terraform, parameter substitution, and remote state management. By following these best practices, developers can create and manage their state machines more effectively while maintaining clean, modular, and reusable code. Embracing infrastructure-as-code and using the right tools, such as Workflow Studio, VS Code, and Terraform, will enable you to build scalable and maintainable distributed applications, automate processes, orchestrate microservices, and create data and ML pipelines with AWS Step Functions.

If you would like to learn more about using Step Functions with Terraform, please check out the following patterns and workflows on Serverless Land and view the Step Functions Developer Guide.

About the authors

Ahmad Aboushady

Ahmad Aboushady is a Senior Technical Account Manager at AWS based in UAE. He works with Enterprise Support customers across the region to help them optimize their workloads on AWS and make the best out of their cloud journey.

Patrick Guha

Patrick Guha is a Solutions Architect at AWS based in Austin, TX. He supports non-profit, research customers focused on genomics, healthcare, and high-performance compute workloads in the cloud. Patrick has a BS in Electrical and Computer Engineering, and is currently working towards an MS in Engineering Management.

Aryam Gutierrez

Aryam Gutierrez is a Senior Partner Solutions Architect at AWS based in Madrid. He supports strategic partners to either build highly-scalable solutions or navigate through the various partner programs to differentiate their business, with the ultimate goal of growing business with AWS.

Building a secure webhook forwarder using an AWS Lambda extension and Tailscale

Post Syndicated from James Beswick original https://aws.amazon.com/blogs/compute/building-a-secure-webhook-forwarder-using-an-aws-lambda-extension-and-tailscale/

This post is written by Duncan Parsons, Enterprise Architect, and Simon Kok, Sr. Consultant.

Webhooks can help developers to integrate with third-party systems or devices when building event based architectures.

However, there are times when control over the target’s network environment is restricted or targets change IP addresses. Additionally, some endpoints lack sufficient security hardening, requiring a reverse proxy and additional security checks to inbound traffic from the internet.

It can be complex to set up and maintain highly available secure reverse proxies to inspect and send events to these backend systems for multiple endpoints. This blog shows how to use AWS Lambda extensions to build a cloud native serverless webhook forwarder to meet this need with minimal maintenance and running costs.

The custom Lambda extension forms a secure WireGuard VPN connection to a target in a private subnet behind a stateful firewall and NAT Gateway. This example sets up a public HTTPS endpoint to receive events, selectively filters, and proxies requests over the WireGuard connection. This example uses a serverless architecture to minimize maintenance overhead and running costs.

Example overview

The sample code to deploy the following architecture is available on GitHub. This example uses AWS CodePipeline and AWS CodeBuild to build the code artifacts and deploys this using AWS CloudFormation via the AWS Cloud Development Kit (CDK). It uses Amazon API Gateway to manage the HTTPS endpoint and the Lambda service to perform the application functions. AWS Secrets Manager stores the credentials for Tailscale.

To orchestrate the WireGuard connections, you can use a free account on the Tailscale service. Alternatively, set up your own coordination layer using the open source Headscale example.

Reference architecture

  1. The event producer sends an HTTP request to the API Gateway URL.
  2. API Gateway proxies the request to the Lambda authorizer function. It returns an authorization decision based on the source IP of the request.
  3. API Gateway proxies the request to the Secure Webhook Forwarder Lambda function running the Tailscale extension.
  4. On initial invocation, the Lambda extension retrieves the Tailscale Auth key from Secrets Manager and uses that to establish a connection to the appropriate Tailscale network. The extension then exposes the connection as a local SOCKS5 port to the Lambda function.
  5. The Lambda extension maintains a connection to the Tailscale network via the Tailscale coordination server. Through this coordination server, all other devices on the network can be made aware of the running Lambda function and vice versa. The Lambda function is configured to refuse incoming WireGuard connections – read more about the --shields-up command here.
  6. Once the connection to the Tailscale network is established, the Secure Webhook Forwarder Lambda function proxies the request over the internet to the target using a WireGuard connection. The connection is established via the Tailscale Coordination server, traversing the NAT Gateway to reach the Amazon EC2 instance inside a private subnet. The EC2 instance responds with an HTML response from a local Python webserver.
  7. On deployment and every 60 days, Secrets Manager rotates the Tailscale Auth Key automatically. It uses the Credential Rotation Lambda function, which retrieves the OAuth Credentials from Secrets Manager and uses these to create a new Tailscale Auth Key using the Tailscale API and stores the new key in Secrets Manager.

To separate the network connection layer logically from the application code layer, a Lambda extension encapsulates the code required to form the Tailscale VPN connection and make this available to the Lambda function application code via a local SOCK5 port. You can reuse this connectivity across multiple Lambda functions for numerous use cases by attaching the extension.

To deploy the example, follow the instructions in the repository’s README. Deployment may take 20–30 minutes.

How the Lambda extension works

The Lambda extension creates the network tunnel and exposes it to the Lambda function as a SOCKS5 server running on port 1055. There are three stages of the Lambda lifecycle: init, invoke, and shutdown.

Lambda extension deep dive

With the Tailscale Lambda extension, the majority of the work is performed in the init phase. The webhook forwarder Lambda function has the following lifecycle:

  1. Init phase:
    1. Extension Init – Extension connects to Tailscale network and exposes WireGuard tunnel via local SOCKS5 port.
    2. Runtime Init – Bootstraps the Node.js runtime.
    3. Function Init – Imports required Node.js modules.
  2. Invoke phase:
    1. The extension intentionally doesn’t register to receive any invoke events. The Tailscale network is kept online until the function is instructed to shut down.
    2. The Node.js handler function receives the request from API Gateway in 2.0 format which it then proxies to the SOCKS5 port to send the request over the WireGuard connection to the target. The invoke phase ends once the function receives a response from the target EC2 instance and optionally returns that to API Gateway for onward forwarding to the original event source.
  3. Shutdown phase:
    1. The extension logs out of the Tailscale network and logs the receipt of the shutdown event.
    2. The function execution environment is shut down along with the Lambda function’s execution environment.

Extension file structure

The extension code exists as a zip file along with some metadata set at the time the extension is published as an AWS Lambda layer. The zip file holds three folders:

  1. /extensions – contains the extension code and is the directory that the Lambda service looks for code to run when the Lambda extension is initialized.
  2. /bin –includes the executable dependencies. For example, within the tsextension.sh script, it runs the tailscale, tailscaled, curl, jq, and OpenSSL binaries.
  3. /ssl –stores the certificate authority (CA) trust store (containing the root CA certificates that are trusted to connect with). OpenSSL uses these to verify SSL and TLS certificates.

The tsextension.sh file is the core of the extension. Most of the code is run in the Lambda function’s init phase. The extension code is split into three stages. The first two stages relate to the Lambda function init lifecycle phase, with the third stage covering invoke and shutdown lifecycle phases.

Extension phase 1: Initialization

In this phase, the extension initializes the Tailscale connection and waits for the connection to become available.

The first step retrieves the Tailscale auth key from Secrets Manager. To keep the size of the extension small, the extension uses a series of Bash commands instead of packaging the AWS CLI to make the Sigv4 requests to Secrets Manager.

The temporary credentials of the Lambda function are made available as environment variables by the Lambda execution environment, which the extension uses to authenticate the Sigv4 request. The IAM permissions to retrieve the secret are added to the Lambda execution role by the CDK code. To optimize security, the secret’s policy restricts reading permissions to (1) this Lambda function and (2) Lambda function that rotates it every 60 days.

The Tailscale agent starts using the Tailscale Auth key. Both the tailscaled and tailscale binaries start in userspace networking mode, as each Lambda function runs in its own container on its own virtual machine. More information about userspace networking mode can be found in the Tailscale documentation.

With the Tailscale processes running, the process must wait for the connection to the Tailnet (the name of a Tailscale network) to be established and for the SOCKS5 port to be available to accept connections. To accomplish this, the extension simply waits for the ‘tailscale status’ command not to return a message with ‘stopped’ in it and then moves on to phase 2.

Extension phase 2: Registration

The extension now registers itself as initialized with the Lambda service. This is performed by sending a POST request to the Lambda service extension API with the events that should be forwarded to the extension.

The runtime init starts next (this initializes the Node.js runtime of the Lambda function itself), followed by the function init (the code outside the event handler). In the case of the Tailscale Lambda extension, it only registers the extension to receive ‘SHUTDOWN’ events. Once the SOCKS5 service is up and available, there is no action for the extension to take on each subsequent invocation of the function.

Extension phase 3: Event processing

To signal the extension is ready to receive an event, a GET request is made to the ‘next’ endpoint of the Lambda runtime API. This blocks the extension script execution until a SHUTDOWN event is sent (as that is the only event registered for this Lambda extension).

When this is sent, the extension logs out of the Tailscale service and the Lambda function shuts down. If INVOKE events are also registered, the extension processes the event. It then signals back to the Lambda runtime API that the extension is ready to receive another event by sending a GET request to the ‘next’ endpoint.

Access control

A sample Lambda authorizer is included in this example. Note that it is recommended to use the AWS Web Application Firewall service to add additional protection to your public API endpoint, as well as hardening the sample code for production use.

For the purposes of this demo, the implementation demonstrates a basic source IP CIDR range restriction, though you can use any property of the request to base authorization decisions on. Read more about Lambda authorizers for HTTP APIs here. To use the source IP restriction, update the CIDR range of the IPs you want to accept on the Lambda authorizer function AUTHD_SOURCE_CIDR environment variable.

Costs

You are charged for all the resources used by this project. The NAT Gateway and EC2 instance are destroyed by the pipeline once the final pipeline step is manually released to minimize costs. The AWS Lambda Power Tuning tool can help find the balance between performance and cost while it polls the demo EC2 instance through the Tailscale network.

The following result shows that 256 MB of memory is the optimum for the lowest cost of execution. The cost is estimated at under $3 for 1 million requests per month, once the demo stack is destroyed.

Power Tuning results

Conclusion

Using Lambda extensions can open up a wide range of options to extend the capability of serverless architectures. This blog shows a Lambda extension that creates a secure VPN tunnel using the WireGuard protocol and the Tailscale service to proxy events through to an EC2 instance inaccessible from the internet.

This is set up to minimize operational overhead with an automated deployment pipeline. A Lambda authorizer secures the endpoint, providing the ability to implement custom logic on the basis of the request contents and context.

For more serverless learning resources, visit Serverless Land.

Simplify operational data processing in data lakes using AWS Glue and Apache Hudi

Post Syndicated from Ravi Itha original https://aws.amazon.com/blogs/big-data/simplify-operational-data-processing-in-data-lakes-using-aws-glue-and-apache-hudi/

The Analytics specialty practice of AWS Professional Services (AWS ProServe) helps customers across the globe with modern data architecture implementations on the AWS Cloud. A modern data architecture is an evolutionary architecture pattern designed to integrate a data lake, data warehouse, and purpose-built stores with a unified governance model. It focuses on defining standards and patterns to integrate data producers and consumers and move data between data lakes and purpose-built data stores securely and efficiently. Out of the many data producer systems that feed data to a data lake, operational databases are most prevalent, where operational data is stored, transformed, analyzed, and finally used to enhance business operations of an organization. With the emergence of open storage formats such as Apache Hudi and its native support from AWS Glue for Apache Spark, many AWS customers have started adding transactional and incremental data processing capabilities to their data lakes.

AWS has invested in native service integration with Apache Hudi and published technical contents to enable you to use Apache Hudi with AWS Glue (for example, refer to Introducing native support for Apache Hudi, Delta Lake, and Apache Iceberg on AWS Glue for Apache Spark, Part 1: Getting Started). In AWS ProServe-led customer engagements, the use cases we work on usually come with technical complexity and scalability requirements. In this post, we discuss a common use case in relation to operational data processing and the solution we built using Apache Hudi and AWS Glue.

Use case overview

AnyCompany Travel and Hospitality wanted to build a data processing framework to seamlessly ingest and process data coming from operational databases (used by reservation and booking systems) in a data lake before applying machine learning (ML) techniques to provide a personalized experience to its users. Due to the sheer volume of direct and indirect sales channels the company has, its booking and promotions data are organized in hundreds of operational databases with thousands of tables. Of those tables, some are larger (such as in terms of record volume) than others, and some are updated more frequently than others. In the data lake, the data to be organized in the following storage zones:

  1. Source-aligned datasets – These have an identical structure to their counterparts at the source
  2. Aggregated datasets – These datasets are created based on one or more source-aligned datasets
  3. Consumer-aligned datasets – These are derived from a combination of source-aligned, aggregated, and reference datasets enriched with relevant business and transformation logics, usually fed as inputs to ML pipelines or any consumer applications

The following are the data ingestion and processing requirements:

  1. Replicate data from operational databases to the data lake, including insert, update, and delete operations.
  2. Keep the source-aligned datasets up to date (typically within the range of 10 minutes to a day) in relation to their counterparts in the operational databases, ensuring analytics pipelines refresh consumer-aligned datasets for downstream ML pipelines in a timely fashion. Moreover, the framework should consume compute resources as optimally as possible per the size of the operational tables.
  3. To minimize DevOps and operational overhead, the company wanted to templatize the source code wherever possible. For example, to create source-aligned datasets in the data lake for 3,000 operational tables, the company didn’t want to deploy 3,000 separate data processing jobs. The smaller the number of jobs and scripts, the better.
  4. The company wanted the ability to continue processing operational data in the secondary Region in the rare event of primary Region failure.

As you can guess, the Apache Hudi framework can solve the first requirement. Therefore, we will put our emphasis on the other requirements. We begin with a Data lake reference architecture followed by an overview of operational data processing framework. By showing you our open-source solution on GitHub, we delve into framework components and walk through their design and implementation aspects. Finally, by testing the framework, we summarize how it meets the aforementioned requirements.

Data lake reference architecture

Let’s begin with a big picture: a data lake solves a variety of analytics and ML use cases dealing with internal and external data producers and consumers. The following diagram represents a generic data lake architecture. To ingest data from operational databases to an Amazon Simple Storage Service (Amazon S3) staging bucket of the data lake, either AWS Database Migration Service (AWS DMS) or any AWS partner solution from AWS Marketplace that has support for change data capture (CDC) can fulfill the requirement. AWS Glue is used to create source-aligned and consumer-aligned datasets and separate AWS Glue jobs to do feature engineering part of ML engineering and operations. Amazon Athena is used for interactive querying and AWS Lake Formation is used for access controls.

Data Lake Reference Architecture

Operational data processing framework

The operational data processing (ODP) framework contains three components: File Manager, File Processor, and Configuration Manager. Each component runs independently to solve a portion of the operational data processing use case. We have open-sourced this framework on GitHub—you can clone the code repo and inspect it while we walk you through the design and implementation of the framework components. The source code is organized in three folders, one for each component, and if you customize and adopt this framework for your use case, we recommend promoting these folders as separate code repositories in your version control system. Consider using the following repository names:

  1. aws-glue-hudi-odp-framework-file-manager
  2. aws-glue-hudi-odp-framework-file-processor
  3. aws-glue-hudi-odp-framework-config-manager

With this modular approach, you can independently deploy the components to your data lake environment by following your preferred CI/CD processes. As illustrated in the preceding diagram, these components are deployed in conjunction with a CDC solution.

Component 1: File Manager

File Manager detects files emitted by a CDC process such as AWS DMS and tracks them in an Amazon DynamoDB table. As shown in the following diagram, it consists of an Amazon EventBridge event rule, an Amazon Simple Queue Service (Amazon SQS) queue, an AWS Lambda function, and a DynamoDB table. The EventBridge rule uses Amazon S3 Event Notifications to detect the arrival of CDC files in the S3 bucket. The event rule forwards the object event notifications to the SQS queue as messages. The File Manager Lambda function consumes those messages, parses the metadata, and inserts the metadata to the DynamoDB table odpf_file_tracker. These records will then be processed by File Processor, which we discuss in the next section.

ODPF Component: File Manager

Component 2: File Processor

File Processor is the workhorse of the ODP framework. It processes files from the S3 staging bucket, creates source-aligned datasets in the raw S3 bucket, and adds or updates metadata for the datasets (AWS Glue tables) in the AWS Glue Data Catalog.

We use the following terminology when discussing File Processor:

  1. Refresh cadence – This represents the data ingestion frequency (for example, 10 minutes). It usually goes with AWS Glue worker type (one of G.1X, G.2X, G.4X, G.8X, G.025X, and so on) and batch size.
  2. Table configuration – This includes the Hudi configuration (primary key, partition key, pre-combined key, and table type (Copy on Write or Merge on Read)), table data storage mode (historical or current snapshot), S3 bucket used to store source-aligned datasets, AWS Glue database name, AWS Glue table name, and refresh cadence.
  3. Batch size – This numeric value is used to split tables into smaller batches and process their respective CDC files in parallel. For example, a configuration of 50 tables with a 10-minute refresh cadence and a batch size of 5 results in a total of 10 AWS Glue job runs, each processing CDC files for 5 tables.
  4. Table data storage mode – There are two options:
    • Historical – This table in the data lake stores historical updates to records (always append).
    • Current snapshot – This table in the data lake stores latest versioned records (upserts) with the ability to use Hudi time travel for historical updates.
  5. File processing state machine – It processes CDC files that belong to tables that share a common refresh cadence.
  6. EventBridge rule association with the file processing state machine – We use a dedicated EventBridge rule for each refresh cadence with the file processing state machine as target.
  7. File processing AWS Glue job – This is a configuration-driven AWS Glue extract, transform, and load (ETL) job that processes CDC files for one or more tables.

File Processor is implemented as a state machine using AWS Step Functions. Let’s use an example to understand this. The following diagram illustrates running File Processor state machine with a configuration that includes 18 operational tables, a refresh cadence of 10 minutes, a batch size of 5, and an AWS Glue worker type of G.1X.

ODP framework component: File Processor

The workflow includes the following steps:

  1. The EventBridge rule triggers the File Processor state machine every 10 minutes.
  2. Being the first state in the state machine, the Batch Manager Lambda function reads configurations from DynamoDB tables.
  3. The Lambda function creates four batches: three of them will be mapped to five operational tables each, and the fourth one is mapped to three operational tables. Then it feeds the batches to the Step Functions Map state.
  4. For each item in the Map state, the File Processor Trigger Lambda function will be invoked, which in turn runs the File Processor AWS Glue job.
  5. Each AWS Glue job performs the following actions:
    • Checks the status of an operational table and acquires a lock when it is not processed by any other job. The odpf_file_processing_tracker DynamoDB table is used for this purpose. When a lock is acquired, it inserts a record in the DynamoDB table with the status updating_table for the first time; otherwise, it updates the record.
    • Processes the CDC files for the given operational table from the S3 staging bucket and creates a source-aligned dataset in the S3 raw bucket. It also updates technical metadata in the AWS Glue Data Catalog.
    • Updates the status of the operational table to completed in the odpf_file_processing_tracker table. In case of processing errors, it updates the status to refresh_error and logs the stack trace.
    • It also inserts this record into the odpf_file_processing_tracker_history DynamoDB table along with additional details such as insert, update, and delete row counts.
    • Moves the records that belong to successfully processed CDC files from odpf_file_tracker to the odpf_file_tracker_history table with file_ingestion_status set to raw_file_processed.
    • Moves to the next operational table in the given batch.
    • Note: a failure to process CDC files for one of the operational tables of a given batch does not impact the processing of other operational tables.

Component 3: Configuration Manager

Configuration Manager is used to insert configuration details to the odpf_batch_config and odpf_raw_table_config tables. To keep this post concise, we provide two architecture patterns in the code repo and leave the implementation details to you.

Solution overview

Let’s test the ODP framework by replicating data from 18 operational tables to a data lake and creating source-aligned datasets with 10-minute refresh cadence. We use Amazon Relational Database Service (Amazon RDS) for MySQL to set up an operational database with 18 tables, upload the New York City Taxi – Yellow Trip Data dataset, set up AWS DMS to replicate data to Amazon S3, process the files using the framework, and finally validate the data using Amazon Athena.

Create S3 buckets

For instructions on creating an S3 bucket, refer to Creating a bucket. For this post, we create the following buckets:

  1. odpf-demo-staging-EXAMPLE-BUCKET – You will use this to migrate operational data using AWS DMS
  2. odpf-demo-raw-EXAMPLE-BUCKET – You will use this to store source-aligned datasets
  3. odpf-demo-code-artifacts-EXAMPLE-BUCKET – You will use this to store code artifacts

Deploy File Manager and File Processor

Deploy File Manager and File Processor by following instructions from this README and this README, respectively.

Set up Amazon RDS for MySQL

Complete the following steps to set up Amazon RDS for MySQL as the operational data source:

  1. Provision Amazon RDS for MySQL. For instructions, refer to Create and Connect to a MySQL Database with Amazon RDS.
  2. Connect to the database instance using MySQL Workbench or DBeaver.
  3. Create a database (schema) by running the SQL command CREATE DATABASE taxi_trips;.
  4. Create 18 tables by running the SQL commands in the ops_table_sample_ddl.sql script.

Populate data to the operational data source

Complete the following steps to populate data to the operational data source:

  1. To download the New York City Taxi – Yellow Trip Data dataset for January 2021 (Parquet file), navigate to NYC TLC Trip Record Data, expand 2021, and choose Yellow Taxi Trip records. A file called yellow_tripdata_2021-01.parquet will be downloaded to your computer.
  2. On the Amazon S3 console, open the bucket odpf-demo-staging-EXAMPLE-BUCKET and create a folder called nyc_yellow_trip_data.
  3. Upload the yellow_tripdata_2021-01.parquet file to the folder.
  4. Navigate to the bucket odpf-demo-code-artifacts-EXAMPLE-BUCKET and create a folder called glue_scripts.
  5. Download the file load_nyc_taxi_data_to_rds_mysql.py from the GitHub repo and upload it to the folder.
  6. Create an AWS Identity and Access Management (IAM) policy called load_nyc_taxi_data_to_rds_mysql_s3_policy. For instructions, refer to Creating policies using the JSON editor. Use the odpf_setup_test_data_glue_job_s3_policy.json policy definition.
  7. Create an IAM role called load_nyc_taxi_data_to_rds_mysql_glue_role. Attach the policy created in the previous step.
  8. On the AWS Glue console, create a connection for Amazon RDS for MySQL. For instructions, refer to Adding a JDBC connection using your own JDBC drivers and Setting up a VPC to connect to Amazon RDS data stores over JDBC for AWS Glue. Name the connection as odpf_demo_rds_connection.
  9. In the navigation pane of the AWS Glue console, choose Glue ETL jobs, Python Shell script editor, and Upload and edit an existing script under Options.
  10. Choose the file load_nyc_taxi_data_to_rds_mysql.py and choose Create.
  11. Complete the following steps to create your job:
    • Provide a name for the job, such as load_nyc_taxi_data_to_rds_mysql.
    • For IAM role, choose load_nyc_taxi_data_to_rds_mysql_glue_role.
    • Set Data processing units to 1/16 DPU.
    • Under Advanced properties, Connections, select the connection you created earlier.
    • Under Job parameters, add the following parameters:
      • input_sample_data_path = s3://odpf-demo-staging-EXAMPLE-BUCKET/nyc_yellow_trip_data/yellow_tripdata_2021-01.parquet
      • schema_name = taxi_trips
      • table_name = table_1
      • rds_connection_name = odpf_demo_rds_connection
    • Choose Save.
  12. On the Actions menu, run the job.
  13. Go back to your MySQL Workbench or DBeaver and validate the record count by running the SQL command select count(1) row_count from taxi_trips.table_1. You will get an output of 1369769.
  14. Populate the remaining 17 tables by running the SQL commands from the populate_17_ops_tables_rds_mysql.sql script.
  15. Get the row count from the 18 tables by running the SQL commands from the ops_data_validation_query_rds_mysql.sql script. The following screenshot shows the output.
    Record volumes (for 18 Tables) in Operational Database

Configure DynamoDB tables

Complete the following steps to configure the DynamoDB tables:

  1. Download file load_ops_table_configs_to_ddb.py from the GitHub repo and upload it to the folder glue_scripts in the S3 bucket odpf-demo-code-artifacts-EXAMPLE-BUCKET.
  2. Create an IAM policy called load_ops_table_configs_to_ddb_ddb_policy. Use the odpf_setup_test_data_glue_job_ddb_policy.json policy definition.
  3. Create an IAM role called load_ops_table_configs_to_ddb_glue_role. Attach the policy created in the previous step.
  4. On the AWS Glue console, choose Glue ETL jobs, Python Shell script editor, and Upload and edit an existing script under Options.
  5. Choose the file load_ops_table_configs_to_ddb.py and choose Create.
  6. Complete the following steps to create a job:
    • Provide a name, such as load_ops_table_configs_to_ddb.
    • For IAM role, choose load_ops_table_configs_to_ddb_glue_role.
    • Set Data processing units to 1/16 DPU.
    • Under Job parameters, add the following parameters
      • batch_config_ddb_table_name = odpf_batch_config
      • raw_table_config_ddb_table_name = odpf_demo_taxi_trips_raw
      • aws_region = e.g., us-west-1
    • Choose Save.
  7. On the Actions menu, run the job.
  8. On the DynamoDB console, get the item count from the tables. You will find 1 item in the odpf_batch_config table and 18 items in the odpf_demo_taxi_trips_raw table.

Set up a database in AWS Glue

Complete the following steps to create a database:

  1. On the AWS Glue console, under Data catalog in the navigation pane, choose Databases.
  2. Create a database called odpf_demo_taxi_trips_raw.

Set up AWS DMS for CDC

Complete the following steps to set up AWS DMS for CDC:

  1. Create an AWS DMS replication instance. For Instance class, choose dms.t3.medium.
  2. Create a source endpoint for Amazon RDS for MySQL.
  3. Create target endpoint for Amazon S3. To configure the S3 endpoint settings, use the JSON definition from dms_s3_endpoint_setting.json.
  4. Create an AWS DMS task.
    • Use the source and target endpoints created in the previous steps.
    • To create AWS DMS task mapping rules, use the JSON definition from dms_task_mapping_rules.json.
    • Under Migration task startup configuration, select Automatically on create.
  5. When the AWS DMS task starts running, you will see a task summary similar to the following screenshot.
    DMS Task Summary
  6. In the Table statistics section, you will see an output similar to the following screenshot. Here, the Full load rows and Total rows columns are important metrics whose counts should match with the record volumes of the 18 tables in the operational data source.
    DMS Task Statistics
  7. As a result of successful full load completion, you will find Parquet files in the S3 staging bucket—one Parquet file per table in a dedicated folder, similar to the following screenshot. Similarly, you will find 17 such folders in the bucket.
    DMS Output in S3 Staging Bucket for Table 1

File Manager output

The File Manager Lambda function consumes messages from the SQS queue, extracts metadata for the CDC files, and inserts one item per file to the odpf_file_tracker DynamoDB table. When you check the items, you will find 18 items with file_ingestion_status set to raw_file_landed, as shown in the following screenshot.

CDC Files in File Tracker DynamoDB Table

File Processor output

  1. On the subsequent tenth minute (since the activation of the EventBridge rule), the event rule triggers the File Processor state machine. On the Step Functions console, you will notice that the state machine is invoked, as shown in the following screenshot.
    File Processor State Machine Run Summary
  2. As shown in the following screenshot, the Batch Generator Lambda function creates four batches and constructs a Map state for parallel running of the File Processor Trigger Lambda function.
    File Processor State Machine Run Details
  3. Then, the File Processor Trigger Lambda function runs the File Processor Glue Job, as shown in the following screenshot.
    File Processor Glue Job Parallel Runs
  4. Then, you will notice that the File Processor Glue Job runs create source-aligned datasets in Hudi format in the S3 raw bucket. For Table 1, you will see an output similar to the following screenshot. There will be 17 such folders in the S3 raw bucket.
    Data in S3 raw bucket
  5. Finally, in AWS Glue Data Catalog, you will notice 18 tables created in the odpf_demo_taxi_trips_raw database, similar to the following screenshot.
    Tables in Glue Database

Data validation

Complete the following steps to validate the data:

  1. On the Amazon Athena console, open the query editor, and select a workgroup or create a new workgroup.
  2. Choose AwsDataCatalog for Data source and odpf_demo_taxi_trips_raw for Database.
  3. Run the raw_data_validation_query_athena.sql SQL query. You will get an output similar to the following screenshot.
    Raw Data Validation via Amazon Athena

Validation summary: The counts in Amazon Athena match with the counts of the operational tables and it proves that the ODP framework has processed all the files and records successfully. This concludes the demo. To test additional scenarios, refer to Extended Testing in the code repo.

Outcomes

Let’s review how the ODP framework addressed the aforementioned requirements.

  1. As discussed earlier in this post, by logically grouping tables by refresh cadence and associating them to EventBridge rules, we ensured that the source-aligned tables are refreshed by the File Processor AWS Glue jobs. With the AWS Glue worker type configuration setting, we selected the appropriate compute resources while running the AWS Glue jobs (the instances of the AWS Glue job).
  2. By applying table-specific configurations (from odpf_batch_config and odpf_raw_table_config) dynamically, we were able to use one AWS Glue job to process CDC files for 18 tables.
  3. You can use this framework to support a variety of data migration use cases that require quicker data migration from on-premises storage systems to data lakes or analytics platforms on AWS. You can reuse File Manager as is and customize File Processor to work with other storage frameworks such as Apache Iceberg, Delta Lake, and purpose-built data stores such as Amazon Aurora and Amazon Redshift.
  4. To understand how the ODP framework met the company’s disaster recovery (DR) design criterion, we first need to understand the DR architecture strategy at a high level. The DR architecture strategy has the following aspects:
    • One AWS account and two AWS Regions are used for primary and secondary environments.
    • The data lake infrastructure in the secondary Region is kept in sync with the one in the primary Region.
    • Data is stored in S3 buckets, metadata data is stored in the AWS Glue Data Catalog, and access controls in Lake Formation are replicated from the primary to secondary Region.
    • The data lake source and target systems have their respective DR environments.
    • CI/CD tooling (version control, CI server, and so on) are to be made highly available.
    • The DevOps team needs to be able to deploy CI/CD pipelines of analytics frameworks (such as this ODP framework) to either the primary or secondary Region.
    • As you can imagine, disaster recovery on AWS is a vast subject, so we keep our discussion to the last design aspect.

By designing the ODP framework with three components and externalizing operational table configurations to DynamoDB global tables, the company was able to deploy the framework components to the secondary Region (in the rare event of a single-Region failure) and continue to process CDC files from the point it last processed in the primary Region. Because the CDC file tracking and processing audit data is replicated to the DynamoDB replica tables in the secondary Region, the File Manager microservice and File Processor can seamlessly run.

Clean up

When you’re finished testing this framework, you can delete the provisioned AWS resources to avoid any further charges.

Conclusion

In this post, we took a real-world operational data processing use case and presented you the framework we developed at AWS ProServe. We hope this post and the operational data processing framework using AWS Glue and Apache Hudi will expedite your journey in integrating operational databases into your modern data platforms built on AWS.


About the authors

Ravi-IthaRavi Itha is a Principal Consultant at AWS Professional Services with specialization in data and analytics and generalist background in application development. Ravi helps customers with enterprise data strategy initiatives across insurance, airlines, pharmaceutical, and financial services industries. In his 6-year tenure at Amazon, Ravi has helped the AWS builder community by publishing approximately 15 open-source solutions (accessible via GitHub handle), four blogs, and reference architectures. Outside of work, he is passionate about reading India Knowledge Systems and practicing Yoga Asanas.

srinivas-kandiSrinivas Kandi is a Data Architect at AWS Professional Services. He leads customer engagements related to data lakes, analytics, and data warehouse modernizations. He enjoys reading history and civilizations.

AWS SAM support for HashiCorp Terraform now generally available

Post Syndicated from Eric Johnson original https://aws.amazon.com/blogs/compute/aws-sam-support-for-hashicorp-terraform-now-generally-available/

In November 2022, AWS announced the public preview of AWS Serverless Application Model (AWS SAM) support for HashiCorp Terraform. The public preview introduces a subset of features to help Terraform users test serverless applications locally. Today, AWS is announcing the general availability of Terraform support in AWS SAM. This GA release expands AWS SAM’s feature set to enhance the local development of serverless applications.

Terraform and AWS SAM are both open-source frameworks allowing developers to define infrastructure as code (IaC). Developers can version and share infrastructure definitions in the same way they share code. However, because AWS SAM is specifically designed for serverless, it includes a command line interface (CLI) designed for serverless development. The CLI enables developers to create, debug, and deploy serverless applications using local emulators along with build and deployment tools. In this release, AWS SAM is making a subset of those tools to Terraform users as well.

Terraform support

The public preview blog demonstrated the initial support for Terraform. This blog demonstrates AWS SAM’s expanded feature set for local development. The blog also simplifies the implementation by using the Serverless.tf modules for AWS Lambda functions and layers rather than the native Terraform resources.

Modules can build the deployment artifacts for the Lambda functions and layers. Additionally, the module automatically generates the metadata required by AWS SAM to interface with the Terraform resources. To use the native Terraform resources, refer to the preview blog for metadata configuration.

Downloading the code

To explore AWS SAM’s support for Terraform, visit the aws-sam-terraform-examples repository. Clone the repository and change to the ga directory to get started:

git clone https://github.com/aws-samples/aws-sam-terraform-examples

cd ga

In this directory, there are two demo applications. Both of the applications are identical except for api_gateway_v1 uses an Amazon API Gateway REST API (v1) and api_gateway_v2 uses an Amazon API Gateway HTTP API (v2). Choose one and change to the tf-resources folder in that directory.

cd api_gateway_v1/tf-resources

Unless indicated otherwise, examples in this post reference the api_gateway_v1 application.

Code structure

Code structure diagram

Code structure diagram

Terraform supports spreading IaC across multiple files. Because of this, developers often collect all the Terraform files in a single directory and keep the resource files elsewhere. The example applications are configured this way.

Any Terraform or AWS SAM command must run from the location of the main.tf file, in this case, the tf-resources directory. Because AWS SAM commands are generally run from the project root, AWS SAM has a command to support nested structures. If running the sam build command from a nested folder, pass the flag terraform-project-root-path with a relative or absolute path to the root of the project.

Local invoke

The preview version of Terraform supported local invocation but the team simplified the experience with support for Serverless.tf. The demonstration applications have two functions in them. A responder function is the backend integration for the API Gateway endpoints and the Auth function is a custom authorizer. Find both module definitions in the functions.tf file.

Responder function

module "lambda_function_responder" {
  source        = "terraform-aws-modules/lambda/aws"
  version       = "~> 6.0"
  timeout       = 300
  source_path   = "${path.module}/src/responder/"
  function_name = "responder"
  handler       = "app.open_handler"
  runtime       = "python3.9"
  create_sam_metadata = true
  publish       = true
  allowed_triggers = {
    APIGatewayAny = {
      service    = "apigateway"
      source_arn = "${aws_api_gateway_rest_api.api.execution_arn}/*/*"
    }
  }
}

There are two important parameters:

  • source_path, which points to a local folder. Because this is not a zip file, Serverless.tf builds the artifacts as needed.
  • create_sam_data, which generates the metadata required for AWS SAM to locate the necessary files and modules.

To invoke the function locally, run the following commands:

  1. Run build to run any build scripts
    sam build --hook-name terraform --terraform-project-root-path ../
  2. Run local invoke to invoke the desired Lambda function
    sam local invoke --hook-name terraform --terraform-project-root-path ../ 'module.lambda_function_responder.aws_lambda_function.this[0]’

Because the project is Terraform, the hook-name parameter with the value terraform is required to let AWS SAM know how to proceed. The function name is a combination of the module name and the resource type that it becomes. If you are unsure of the name, run the command without the name:

sam local invoke --hook-name terraform

AWS SAM evaluates the template. If there is only one function, AWS SAM proceeds to invoke it. If there are more than one, as is the case here, AWS SAM asks you which one and provides a list of options.

Example error text

Example error text

Auth function

The authorizer function requires some input data as a mock event. To generate a mock event for the api_gateway_v1 project:

sam local generate-event apigateway authorizer

For the api_gateway_v2 project use:

sam local generate-event apigateway request-authorizer

The resulting events are different because API Gateway REST and HTTP APIs can handle custom authorizers differently. In these examples, REST uses a standard token authorizer and returns the proper AWS Identity and Access Management (IAM) role. The HTTP API example uses a simple pass or fail option.

Each of the examples already has the properly formatted event for testing included at events/auth.json. To invoke the Auth function, run the following:

sam local invoke --hook-name terraform 'module.lambda_function_auth.aws_lambda_function.this[0]' -e events/auth.json

There is no need to run the sam build command again because the application has not changed.

Local start-api

You can now emulate a local version of API Gateway with the generally available release. Each of these examples have two endpoints. One endpoint is open and a custom authorizer secures the other. Both return the same response:

{
  “message”: “Hello TF World”,
  “location”: “ip address”
}

To start the local emulator, run the following:

sam local start-api –hook-name terraform

AWS SAM starts the emulator and exposes the two endpoints for local testing.

Open endpoint

Using curl, test the open endpoint:

curl --location http://localhost:3000/open

The local emulator processes the request and provides a response in the terminal window. The emulator also includes logs from the Lambda function.

Open endpoint example output

Open endpoint example output

Auth endpoint

Test the secure endpoint and pass the extra required header, myheader:

curl -v --location http://localhost:3000/secure --header 'myheader: 123456789'

The endpoint returns an authorized response with the “Hello TF World” messaging. Try the endpoint again with an invalid header value:

curl --location http://localhost:3000/secure --header 'myheader: IamInvalid'

The endpoint returns an unauthenticated response.

Unauthenticated response

Unauthenticated response

Parameters

There are several options when using AWS SAM with Terraform:

  • Hook-name: required for every command when working with Terraform. This informs AWS SAM that the project is a Terraform application.
  • Skip-prepare-infra: AWS SAM uses the terraform plan command identify and process all the required artifacts. However, it should only be run when new resources are added or modified. This option keeps AWS SAM from running the terraform plan command. If this flag is passed and a plan does not exist, AWS SAM ignores the flag and run the terraform plan command anyway.
  • Prepare-infra: forces AWS SAM to run the terraform plan command.
  • Terraform-project-root-path: overrides the current directory as the root of the project. You can use an absolute path (/path/to/project/root) or relative path (../ or ../../).
  • Terraform-plan-file: allows a developer to specify a specific Terraform plan file. This command also enables Terraform users to use local commands.

Combining these options can create long commands:

sam build --hook-name terraform --terraform-project-root-path ../

or

sam local invoke –hook-name terraform –skip-prepare-infra 'module.lambda_function_responder.aws_lambda_function.this[0]'

You can use the samconfig file to set defaults, shorten commands, and optimize the development process. Using the new samconfig YAML support, the file looks like this:

version: 0.1
default:
  global:
    parameters:
      hook_name: terraform
      skip_prepare_infra: true
  build:
    parameters:
      terraform_project_root_path: ../

By setting these defaults, the command is now shorter:

sam local invoke 'module.lambda_function_responder.aws_lambda_function.this[0]'

AWS SAM now knows it is a Terraform project and skips the preparation task unless the Terraform plan is missing. If a plan refresh is required, add the –prepare-infra flag to override the default setting.

Deployment and remote debugging

The applications in these projects are regular Terraform applications. Deploy them as any other Terraform project.

terraform plan
terraform apply

Currently, AWS SAM accelerate does not support Terraform projects. However, because Terraform deploys using the API method, serverless applications deploy quickly. Use a third party watch and the terraform apply –auto-approve command to approximate this experience.

For logging, take advantage of the sam logs command. Refer to the deploy output of the projects for an example of tailing the logs for one or all of the resources.

HashiCorp Cloud Platform

HashiCorp Cloud Platform allows developers to run deployments using a centralized location to maintain security and state. When developers run builds in the cloud, a local plan file is not available for AWS SAM to use in local testing and debugging. However, developers can generate a plan in the cloud and use the plan locally for development. For instructions, refer to the documentation.

Conclusion

HashiCorp Terraform is a popular IaC framework for building applications in the AWS Cloud. AWS SAM is an IaC framework and the CLI is specifically designed to help developers build serverless applications.

This blog covers the new AWS SAM support for Terraform and how developers can use them together to maximize the development experience. The blog covers locally invoking a single function, emulating API Gateway endpoints locally, and testing a Lambda authorizer locally before deploying. Finally, the blog deploys the application and uses AWS SAM to monitor the deployed resources.

For more serverless learning resources, visit Serverless Land.

Let’s Architect! Cost-optimizing AWS workloads

Post Syndicated from Luca Mezzalira original https://aws.amazon.com/blogs/architecture/lets-architect-cost-optimizing-aws-workloads/

Every software component built by engineers and architects is designed with a purpose: to offer particular functionalities and, ultimately, contribute to the generation of business value. We should consider fundamental factors, such as the scalability of the software and the ease of evolution during times of business changes. However, performance and cost are important factors as well since they can impact the business profitability.

This edition of Let’s Architect! follows a similar series post from 2022, which discusses optimizing the cost of an architecture. Today, we focus on architectural patterns, services, and best practices to design cost-optimized cloud workloads. We also want to identify solutions, such as the use of Graviton processors, for increased performance at lower price. Cost optimization is a continuous process that requires the identification of the right tools for each job, as well as the adoption of efficient designs for your system.

AWS re:Invent 2022 – Manage and control your AWS costs

Govern cloud usage and avoid cost surprises without slowing down innovation within your organization. In this re:Invent 2022 session, you can learn how to set up guardrails and operationalize cost control within your organizations using services, such as AWS Budgets and AWS Cost Anomaly Detection, and explore the latest enhancements in the AWS cost control space. Additionally, Mercado Libre shares how they automate their cloud cost control through central management and automated algorithms.

Take me to this re:Invent 2022 video!

Work backwards from team needs to define/deploy cloud governance in AWS environments

Work backwards from team needs to define/deploy cloud governance in AWS environments

Compute optimization

When it comes to optimizing compute workloads, there are many tools available, such as AWS Compute Optimizer, Amazon EC2 Spot Instances, Amazon EC2 Reserved Instances, and Graviton instances. Modernizing your applications can also lead to cost savings, but you need to know how to use the right tools and techniques in an effective and efficient way.

For AWS Lambda functions, you can use the AWS Lambda Cost Optimization video to learn how to optimize your costs. The video covers topics, such as understanding and graphing performance versus cost, code optimization techniques, and avoiding idle wait time. If you are using Amazon Elastic Container Service (Amazon ECS) and AWS Fargate, you can watch a Twitch video on cost optimization using Amazon ECS and AWS Fargate to learn how to adjust your costs. The video covers topics like using spot instances, choosing the right instance type, and using Fargate Spot.

Finally, with Amazon Elastic Kubernetes Service (Amazon EKS), you can use Karpenter, an open-source Kubernetes cluster auto scaler to help optimize compute workloads. Karpenter can help you launch right-sized compute resources in response to changing application load, help you adopt spot and Graviton instances. To learn more about Karpenter, read the post How CoStar uses Karpenter to optimize their Amazon EKS Resources on the AWS Containers Blog.

Take me to Cost Optimization using Amazon ECS and AWS Fargate!
Take me to AWS Lambda Cost Optimization!
Take me to How CoStar uses Karpenter to optimize their Amazon EKS Resources!

Karpenter launches and terminates nodes to reduce infrastructure costs

Karpenter launches and terminates nodes to reduce infrastructure costs

AWS Lambda general guidance for cost optimization

AWS Lambda general guidance for cost optimization

AWS Graviton deep dive: The best price performance for AWS workloads

The choice of the hardware is a fundamental driver for performance, cost, as well as resource consumption of the systems we build. Graviton is a family of processors designed by AWS to support cloud-based workloads and give improvements in terms of performance and cost. This re:Invent 2022 presentation introduces Graviton and addresses the problems it can solve, how the underlying CPU architecture is designed, and how to get started with it. Furthermore, you can learn the journey to move different types of workloads to this architecture, such as containers, Java applications, and C applications.

Take me to this re:Invent 2022 video!

AWS Graviton processors are specifically designed by AWS for cloud workloads to deliver the best price performance

AWS Graviton processors are specifically designed by AWS for cloud workloads to deliver the best price performance

AWS Well-Architected Labs: Cost Optimization

The Cost Optimization section of the AWS Well Architected Workshop helps you learn how to optimize your AWS costs by using features, such as AWS Compute Optimizer, Spot Instances, and Reserved Instances. The workshop includes hands-on labs that walk you through the process of optimizing costs for different types of workloads and services, such as Amazon Elastic Compute Cloud, Amazon ECS, and Lambda.

Take me to this AWS Well-Architected lab!

Savings Plans is a flexible pricing model that can help reduce expenses compared with on-demand pricing

Savings Plans is a flexible pricing model that can help reduce expenses compared with on-demand pricing

See you next time!

Thanks for joining us to discuss cost optimization! In 2 weeks, we’ll talk about in-memory databases and caching systems.

To find all the blogs from this series, visit the Let’s Architect! list of content on the AWS Architecture Blog.

AWS Weekly Roundup – AWS Dedicated Zones, Events and More – August 28, 2023

Post Syndicated from Sébastien Stormacq original https://aws.amazon.com/blogs/aws/aws-weekly-roundup-aws-dedicated-zones-events-and-more-august-28-2023/

This week, I will meet our customers and partners at the AWS Summit Mexico. If you are around, please come say hi at the community lounge and at the F1 Game Day where I will spend most of my time. I would love to discuss your developer experience on AWS and listen to your stories about building on AWS.

Last Week’s Launches
I am amazed at how quickly service teams are deploying services to the new il-central-1 Region, aka AWS Israel (Tel-Aviv) Region. I counted no fewer than 25 new service announcements since we opened the Region on August 1, including ten just for last week!

In addition to these developments in the new Region, here are some launches that got my attention during the previous week.

AWS Dedicated Local Zones – Just like Local Zones, Dedicated Local Zones are a type of AWS infrastructure that is fully managed by AWS. Unlike Local Zones, they are built for exclusive use by you or your community and placed in a location or data center specified by you to help comply with regulatory requirements. I think about them as a portion of AWS infrastructure dedicated to my exclusive usage.

Enhanced search on AWS re:Post – AWS re:Post is a cloud knowledge service. The enhanced search experience helps you locate answers and discover articles more quickly. Search results are now presenting a consolidated view of all AWS knowledge on re:Post. The view shows AWS Knowledge Center articles, question and answers, and community articles that are relevant to the user’s search query.

Amazon QuickSight supports scheduled programmatic export to Microsoft ExcelAmazon QuickSight now supports scheduled generation of Excel workbooks by selecting multiple tables and pivot table visuals from any sheet of a dashboard. Snapshot Export APIs will now also support programmatic export to Excel format, in addition to Paginated PDF and CSV.

Amazon WorkSpaces announced a new client to support Ubuntu 20.04 and 22.04 – The new client, powered by WorkSpaces Streaming Protocol (WSP), improves the remote desktop experience by offering enhanced web conferencing functionality, better multi-monitor support, and a more user-friendly interface. To get started, simply download the new Linux client versions from Amazon WorkSpaces client download website.

Amazon Sagemaker CPU/GPU profiler – We launched the preview of Amazon SageMaker Profiler, an advanced observability tool for large deep learning workloads. With this new capability, you are able to access granular compute hardware-related profiling insights for optimizing model training performance.

Amazon Sagemaker rolling deployments strategy – You can now update your Amazon SageMaker Endpoints using a rolling deployment strategy. Rolling deployment makes it easier for you to update fully-scaled endpoints that are deployed on hundreds of popular accelerated compute instances.

For a full list of AWS announcements, be sure to keep an eye on the What’s New at AWS page.

Other AWS News
Some other updates and news that you might have missed:

On-demand Container Loading in AWS Lambda – This one is not new from this week, but I spotted it while I was taking a few days of holidays. Marc Brooker and team were awarded Best Paper by USENIX Association for On-demand Container Loading in AWS Lambda (pdf). They explained in detail the challenges of loading (huge) container images in AWS Lambda. A must-read if you’re curious how Lambda functions work behind the scenes (pdf).

The Official AWS Podcast – Listen each week for updates on the latest AWS news and deep dives into exciting use cases. There are also official AWS podcasts in several languages. Check out the ones in FrenchGermanItalian, and Spanish.

AWS Open Source News and Updates – This is a newsletter curated by my colleague Ricardo to bring you the latest open source projects, posts, events, and more.

Upcoming AWS Events
Check your calendars and sign up for these AWS events:

AWS Hybrid Cloud & Edge Day (August 30) – Join a free-to-attend one-day virtual event to hear the latest hybrid cloud and edge computing trends, emerging technologies, and learn best practices from AWS leaders, customers, and industry analysts. To learn more, see the detail agenda and register now.

AWS Global SummitsAWS Summits – The 2023 AWS Summits season is almost ending with the last two in-person events in Mexico City (August 30) and Johannesburg (September 26).

AWS re:Invent – But don’t worry because re:Invent season (November 27–December 1) is coming closer. Join us to hear the latest from AWS, learn from experts, and connect with the global cloud community. Registration is now open.

AWS Community Days AWS Community Day– Join a community-led conference run by AWS user group leaders in your region: Aotearoa (September 6), Lebanon (September 9), Munich (September 14), Argentina (September 16), Spain (September 23), and Chile (September 30). Visit the landing page to check out all the upcoming AWS Community Days.

CDK Day (September 29) – A community-led fully virtual event with tracks in English and Spanish about CDK and related projects. Learn more at the website.

That’s all for this week. Check back next Monday for another Week in Review!

This post is part of our Week in Review series. Check back each week for a quick roundup of interesting news and announcements from AWS!

— seb

Protecting an AWS Lambda function URL with Amazon CloudFront and Lambda@Edge

Post Syndicated from James Beswick original https://aws.amazon.com/blogs/compute/protecting-an-aws-lambda-function-url-with-amazon-cloudfront-and-lambdaedge/

This post is written by Jerome Van Der Linden, Senior Solutions Architect Builder.

A Lambda function URL is a dedicated HTTPs endpoint for an AWS Lambda function. When configured, you can invoke the function directly with an HTTP request. You can choose to make it public by setting the authentication type to NONE for an open API. Or you can protect it with AWS IAM, setting the authentication type to AWS_IAM. In that case, only authenticated users and roles are able to invoke the function via the function URL.

Lambda@Edge is a feature of Amazon CloudFront that can run code closer to the end user of an application. It is generally used to manipulate incoming HTTP requests or outgoing HTTP responses between the user client and the application’s origin. In particular, it can add extra headers to the request (‘Authorization’, for example).

This blog post shows how to use CloudFront and Lambda@Edge to protect a Lambda function URL configured with the AWS_IAM authentication type by adding the appropriate headers to the request before it reaches the origin.

Overview

There are four main components in this example:

  • Lambda functions with function URLs enabled: This is the heart of the ‘application’, the functions that contain the business code exposed to the frontend. The function URL is configured with AWS_IAM authentication type, so that only authenticated users/roles can invoke it.
  • A CloudFront distribution: CloudFront is a content delivery network (CDN) service used to deliver content to users with low latency. It also improves the security with traffic encryption and built-in DDoS protection. In this example, using CloudFront in front of the Lambda URL can add this layer of security and potentially cache content closer to the users.
  • A Lambda function at the edge: CloudFront also provides the ability to run Lambda functions close to the users: Lambda@Edge. This example does this to sign the request made to the Lambda function URL and adds the appropriate headers to the request so that invocation of the URL is authenticated with IAM.
  • A web application that invokes the Lambda function URLs: The example also contains a single page application built with React, from which the users make requests to one or more Lambda function URLs. The static assets (for example, HTML and JavaScript files) are stored in Amazon S3 and also exposed and cached by CloudFront.

This is the example architecture:

Architecture

The request flow is:

  1. The user performs requests via the client to reach static assets from the React application or Lambda function URLs.
  2. For a static asset, CloudFront retrieves it from S3 or its cache and returns it to the client.
  3. If the request is for a Lambda function URL, it first goes to a Lambda@Edge. The Lambda@Edge function has the lambda:InvokeFunctionUrl permission on the target Lambda function URL and uses this to sign the request with the signature V4. It adds the Authorization, X-Amz-Security-Token, and X-Amz-Date headers to the request.
  4. After the request is properly signed, CloudFront forwards it to the Lambda function URL.
  5. Lambda triggers the execution of the function that performs any kind of business logic. The current solution is handling books (create, get, update, delete).
  6. Lambda returns the response of the function to CloudFront.
  7. Finally, CloudFront returns the response to the client.

There are several types of events where a Lambda@Edge function can be triggered:

Lambda@Edge events

  • Viewer request: After CloudFront receives a request from the client.
  • Origin request: Before the request is forwarded to the origin.
  • Origin response: After CloudFront receives the response from the origin.
  • Viewer response: Before the response is sent back to the client.

The current example, to update the request before it is sent to the origin (the Lambda function URL), uses the “Origin Request” type.

You can find the complete example, based on the AWS Cloud Development Kit (CDK), on GitHub.

Backend stack

The backend contains the different Lambda functions and Lambda function URLs. It uses the AWS_IAM auth type and the CORS (Cross Origin Resource Sharing) definition when adding the function URL to the Lambda function. Use a more restrictive allowedOrigins for a real application.

const getBookFunction = new NodejsFunction(this, 'GetBookFunction', {
    runtime: Runtime.NODEJS_18_X,  
    memorySize: 256,
    timeout: Duration.seconds(30),
    entry: path.join(__dirname, '../functions/books/books.ts'),
    environment: {
      TABLE_NAME: bookTable.tableName
    },
    handler: 'getBookHandler',
    description: 'Retrieve one book by id',
});
bookTable.grantReadData(getBookFunction);
const getBookUrl = getBookFunction.addFunctionUrl({
    authType: FunctionUrlAuthType.AWS_IAM,
    cors: {
        allowedOrigins: ['*'],
        allowedMethods: [HttpMethod.GET],
        allowedHeaders: ['*'],
        allowCredentials: true,
    }
});

Frontend stack

The Frontend stack contains the CloudFront distribution and the Lambda@Edge function. This is the Lambda@Edge definition:

const authFunction = new cloudfront.experimental.EdgeFunction(this, 'AuthFunctionAtEdge', {
    handler: 'auth.handler',
    runtime: Runtime.NODEJS_16_X,  
    code: Code.fromAsset(path.join(__dirname, '../functions/auth')),
 });

The following policy allows the Lambda@Edge function to sign the request with the appropriate permission and to invoke the function URLs:

authFunction.addToRolePolicy(new PolicyStatement({
    sid: 'AllowInvokeFunctionUrl',
    effect: Effect.ALLOW,
    actions: ['lambda:InvokeFunctionUrl'],
    resources: [getBookArn, getBooksArn, createBookArn, updateBookArn, deleteBookArn],
    conditions: {
        "StringEquals": {"lambda:FunctionUrlAuthType": "AWS_IAM"}
    }
}));

The function code uses the AWS JavaScript SDK and more precisely the V4 Signature part of it. There are two important things here:

  • The service for which we want to sign the request: Lambda
  • The credentials of the function (with the InvokeFunctionUrl permission)
const request = new AWS.HttpRequest(new AWS.Endpoint(`https://${host}${path}`), region);
// ... set the headers, body and method ...
const signer = new AWS.Signers.V4(request, 'lambda', true);
signer.addAuthorization(AWS.config.credentials, AWS.util.date.getDate());

You can get the full code of the function here.

CloudFront distribution and behaviors definition

The CloudFront distribution has a default behavior with an S3 origin for the static assets of the React application.

It also has one behavior per function URL, as defined in the following code. You can notice the configuration of the Lambda@Edge function with the type ORIGIN_REQUEST and the behavior referencing the function URL:

const getBehaviorOptions: AddBehaviorOptions  = {
    viewerProtocolPolicy: ViewerProtocolPolicy.HTTPS_ONLY,
    cachePolicy: CachePolicy.CACHING_DISABLED,
    originRequestPolicy: OriginRequestPolicy.CORS_CUSTOM_ORIGIN,
    responseHeadersPolicy: ResponseHeadersPolicy.CORS_ALLOW_ALL_ORIGINS_WITH_PREFLIGHT,
    edgeLambdas: [{
        functionVersion: authFunction.currentVersion,
        eventType: LambdaEdgeEventType.ORIGIN_REQUEST,
        includeBody: false, // GET, no body
    }],
    allowedMethods: AllowedMethods.ALLOW_GET_HEAD_OPTIONS,
}
this.distribution.addBehavior('/getBook/*', new HttpOrigin(Fn.select(2, Fn.split('/', getBookUrl)),), getBehaviorOptions);

Regional consideration

The Lambda@Edge function must be in the us-east-1 Region (N. Virginia), as does the frontend stack. If you deploy the backend stack in another Region, you’ll must pass the Lambda function URLs (and ARNs) to the frontend. Using a custom resource in CDK, it’s possible to create parameters in AWS Systems Manager Parameter Store in the us-east-1 Region containing this information. For more details, review the code in the GitHub repo.

Walkthrough

Before deploying the solution, follow the README in the GitHub repo and make sure to meet the prerequisites.

Deploying the solution

  1. From the solution directory, install the dependencies:
    npm install
  2. Start the deployment of the solution (it can take up to 15 minutes):
    cdk deploy --all
  3. Once the deployment succeeds, the outputs contain both the Lambda function URLs and the URLs “protected” behind the CloudFront distribution:Outputs

Testing the solution

  1. Using cURL, query the Lambda Function URL to retrieve all books (GetBooksFunctionURL in the CDK outputs):
    curl -v https://qwertyuiop1234567890.lambda-url.eu-west-1.on.aws/
    

    You should get the following output. As expected, it’s forbidden to directly access the Lambda function URL without the proper IAM authentication:

    Output

  2. Now query the “protected” URL to retrieve all books (GetBooksURL in the CDK outputs):
    curl -v https://q1w2e3r4t5y6u.cloudfront.net/getBooks
    

    This time you should get a HTTP 200 OK with an empty list as a result.

    Output

The logs of the Lambda@Edge function (search for “AuthFunctionAtEdge” in CloudWatch Logs in the closest Region) show:

  • The incoming request:Incoming request
  • The signed request, with the additional headers (Authorization, X-Amz-Security-Token, and X-Amz-Date). These headers make the difference when the Lambda URL receives the request and validates it with IAM.Headers

You can test the complete solution throughout the frontend, using the FrontendURL in the CDK outputs.

Cleaning up

The Lambda@Edge function is replicated in all Regions where you have users. You must delete the replicas before deleting the rest of the solution.

To delete the deployed resources, run the cdk destroy --all command from the solution directory.

Conclusion

This blog post shows how to protect a Lambda Function URL, configured with IAM authentication, using a CloudFront distribution and Lambda@Edge. CloudFront helps protect from DDoS, and the function at the edge adds appropriate headers to the request to authenticate it for Lambda.

Lambda function URLs provide a simpler way to invoke your function using HTTP calls. However, if you need more advanced features like user authentication with Amazon Cognito, request validation or rate throttling, consider using Amazon API Gateway.

For more serverless learning resources, visit Serverless Land.

Implementing automatic drift detection in CDK Pipelines using Amazon EventBridge

Post Syndicated from DAMODAR SHENVI WAGLE original https://aws.amazon.com/blogs/devops/implementing-automatic-drift-detection-in-cdk-pipelines-using-amazon-eventbridge/

The AWS Cloud Development Kit (AWS CDK) is a popular open source toolkit that allows developers to create their cloud infrastructure using high level programming languages. AWS CDK comes bundled with a construct called CDK Pipelines that makes it easy to set up continuous integration, delivery, and deployment with AWS CodePipeline. The CDK Pipelines construct does all the heavy lifting, such as setting up appropriate AWS IAM roles for deployment across regions and accounts, Amazon Simple Storage Service (Amazon S3) buckets to store build artifacts, and an AWS CodeBuild project to build, test, and deploy the app. The pipeline deploys a given CDK application as one or more AWS CloudFormation stacks.

With CloudFormation stacks, there is the possibility that someone can manually change the configuration of stack resources outside the purview of CloudFormation and the pipeline that deploys the stack. This causes the deployed resources to be inconsistent with the intent in the application, which is referred to as “drift”, a situation that can make the application’s behavior unpredictable. For example, when troubleshooting an application, if the application has drifted in production, it is difficult to reproduce the same behavior in a development environment. In other cases, it may introduce security vulnerabilities in the application. For example, an AWS EC2 SecurityGroup that was originally deployed to allow ingress traffic from a specific IP address might potentially be opened up to allow traffic from all IP addresses.

CloudFormation offers a drift detection feature for stacks and stack resources to detect configuration changes that are made outside of CloudFormation. The stack/resource is considered as drifted if its configuration does not match the expected configuration defined in the CloudFormation template and by extension the CDK code that synthesized it.

In this blog post you will see how CloudFormation drift detection can be integrated as a pre-deployment validation step in CDK Pipelines using an event driven approach.

Services and frameworks used in the post include CloudFormation, CodeBuild, Amazon EventBridge, AWS Lambda, Amazon DynamoDB, S3, and AWS CDK.

Solution overview

Amazon EventBridge is a serverless AWS service that offers an agile mechanism for the developers to spin up loosely coupled, event driven applications at scale. EventBridge supports routing of events between services via an event bus. EventBridge out of the box supports a default event bus for each account which receives events from AWS services. Last year, CloudFormation added a new feature that enables event notifications for changes made to CloudFormation-based stacks and resources. These notifications are accessible through Amazon EventBridge, allowing users to monitor and react to changes in their CloudFormation infrastructure using event-driven workflows. Our solution leverages the drift detection events that are now supported by EventBridge. The following architecture diagram depicts the flow of events involved in successfully performing drift detection in CDK Pipelines.

Architecture diagram

Architecture diagram

The user starts the pipeline by checking code into an AWS CodeCommit repo, which acts as the pipeline source. We have configured drift detection in the pipeline as a custom step backed by a lambda function. When the drift detection step invokes the provider lambda function, it first starts the drift detection on the CloudFormation stack Demo Stack and then saves the drift_detection_id along with pipeline_job_id in a DynamoDB table. In the meantime, the pipeline waits for a response on the status of drift detection.

The EventBridge rules are set up to capture the drift detection state change events for Demo Stack that are received by the default event bus. The callback lambda is registered as the intended target for the rules. When drift detection completes, it triggers the EventBridge rule which in turn invokes the callback lambda function with stack status as either DRIFTED or IN SYNC. The callback lambda function pulls the pipeline_job_id from DynamoDB and sends the appropriate status back to the pipeline, thus propelling the pipeline out of the wait state. If the stack is in the IN SYNC status, the callback lambda sends a success status and the pipeline continues with the deployment. If the stack is in the DRIFTED status, callback lambda sends failure status back to the pipeline and the pipeline run ends up in failure.

Solution Deep Dive

The solution deploys two stacks as shown in the above architecture diagram

  1. CDK Pipelines stack
  2. Pre-requisite stack

The CDK Pipelines stack defines a pipeline with a CodeCommit source and drift detection step integrated into it. The pre-requisite stack deploys following resources that are required by the CDK Pipelines stack.

  • A Lambda function that implements drift detection step
  • A DynamoDB table that holds drift_detection_id and pipeline_job_id
  • An Event bridge rule to capture “CloudFormation Drift Detection Status Change” event
  • A callback lambda function that evaluates status of drift detection and sends status back to the pipeline by looking up the data captured in DynamoDB.

The pre-requisites stack is deployed first, followed by the CDK Pipelines stack.

Defining drift detection step

CDK Pipelines offers a mechanism to define your own step that requires custom implementation. A step corresponds to a custom action in CodePipeline such as invoke lambda function. It can exist as a pre or post deployment action in a given stage of the pipeline. For example, your organization’s policies may require its CI/CD pipelines to run a security vulnerability scan as a prerequisite before deployment. You can build this as a custom step in your CDK Pipelines. In this post, you will use the same mechanism for adding the drift detection step in the pipeline.

You start by defining a class called DriftDetectionStep that extends Step and implements ICodePipelineActionFactory as shown in the following code snippet. The constructor accepts 3 parameters stackName, account, region as inputs. When the pipeline runs the step, it invokes the drift detection lambda function with these parameters wrapped inside userParameters variable. The function produceAction() adds the action to invoke drift detection lambda function to the pipeline stage.

Please note that the solution uses an SSM parameter to inject the lambda function ARN into the pipeline stack. So, we deploy the provider lambda function as part of pre-requisites stack before the pipeline stack and publish its ARN to the SSM parameter. The CDK code to deploy pre-requisites stack can be found here.

export class DriftDetectionStep
    extends Step
    implements pipelines.ICodePipelineActionFactory
{
    constructor(
        private readonly stackName: string,
        private readonly account: string,
        private readonly region: string
    ) {
        super(`DriftDetectionStep-${stackName}`);
    }

    public produceAction(
        stage: codepipeline.IStage,
        options: ProduceActionOptions
    ): CodePipelineActionFactoryResult {
        // Define the configuraton for the action that is added to the pipeline.
        stage.addAction(
            new cpactions.LambdaInvokeAction({
                actionName: options.actionName,
                runOrder: options.runOrder,
                lambda: lambda.Function.fromFunctionArn(
                    options.scope,
                    `InitiateDriftDetectLambda-${this.stackName}`,
                    ssm.StringParameter.valueForStringParameter(
                        options.scope,
                        SSM_PARAM_DRIFT_DETECT_LAMBDA_ARN
                    )
                ),
                // These are the parameters passed to the drift detection step implementaton provider lambda
                userParameters: {
                    stackName: this.stackName,
                    account: this.account,
                    region: this.region,
                },
            })
        );
        return {
            runOrdersConsumed: 1,
        };
    }
}

Configuring drift detection step in CDK Pipelines

Here you will see how to integrate the previously defined drift detection step into CDK Pipelines. The pipeline has a stage called DemoStage as shown in the following code snippet. During the construction of DemoStage, we declare drift detection as the pre-deployment step. This makes sure that the pipeline always does the drift detection check prior to deployment.

Please note that for every stack defined in the stage; we add a dedicated step to perform drift detection by instantiating the class DriftDetectionStep detailed in the prior section. Thus, this solution scales with the number of stacks defined per stage.

export class PipelineStack extends BaseStack {
    constructor(scope: Construct, id: string, props?: StackProps) {
        super(scope, id, props);

        const repo = new codecommit.Repository(this, 'DemoRepo', {
            repositoryName: `${this.node.tryGetContext('appName')}-repo`,
        });

        const pipeline = new CodePipeline(this, 'DemoPipeline', {
            synth: new ShellStep('synth', {
                input: CodePipelineSource.codeCommit(repo, 'main'),
                commands: ['./script-synth.sh'],
            }),
            crossAccountKeys: true,
            enableKeyRotation: true,
        });
        const demoStage = new DemoStage(this, 'DemoStage', {
            env: {
                account: this.account,
                region: this.region,
            },
        });
        const driftDetectionSteps: Step[] = [];
        for (const stackName of demoStage.stackNameList) {
            const step = new DriftDetectionStep(stackName, this.account, this.region);
            driftDetectionSteps.push(step);
        }
        pipeline.addStage(demoStage, {
            pre: driftDetectionSteps,
        });

Demo

Here you will go through the deployment steps for the solution and see drift detection in action.

Deploy the pre-requisites stack

Clone the repo from the GitHub location here. Navigate to the cloned folder and run script script-deploy.sh You can find detailed instructions in README.md

Deploy the CDK Pipelines stack

Clone the repo from the GitHub location here. Navigate to the cloned folder and run script script-deploy.sh. This deploys a pipeline with an empty CodeCommit repo as the source. The pipeline run ends up in failure, as shown below, because of the empty CodeCommit repo.

First run of the pipeline

Next, check in the code from the cloned repo into the CodeCommit source repo. You can find detailed instructions on that in README.md  This triggers the pipeline and pipeline finishes successfully, as shown below.

Pipeline run after first check in

The pipeline deploys two stacks DemoStackA and DemoStackB. Each of these stacks creates an S3 bucket.

CloudFormation stacks deployed after first run of the pipeline

Demonstrate drift detection

Locate the S3 bucket created by DemoStackA under resources, navigate to the S3 bucket and modify the tag aws-cdk:auto-delete-objects from true to false as shown below

DemoStackA resources

DemoStackA modify S3 tag

Now, go to the pipeline and trigger a new execution by clicking on Release Change

Run pipeline via Release Change tab

The pipeline run will now end in failure at the pre-deployment drift detection step.

Pipeline run after Drift Detection failure

Cleanup

Please follow the steps below to clean up all the stacks.

  1. Navigate to S3 console and empty the buckets created by stacks DemoStackA and DemoStackB.
  2. Navigate to the CloudFormation console and delete stacks DemoStackA and DemoStackB, since deleting CDK Pipelines stack does not delete the application stacks that the pipeline deploys.
  3. Delete the CDK Pipelines stack cdk-drift-detect-demo-pipeline
  4. Delete the pre-requisites stack cdk-drift-detect-demo-drift-detection-prereq

Conclusion

In this post, I showed how to add a custom implementation step in CDK Pipelines. I also used that mechanism to integrate a drift detection check as a pre-deployment step. This allows us to validate the integrity of a CloudFormation Stack before its deployment. Since the validation is integrated into the pipeline, it is easier to manage the solution in one place as part of the overarching pipeline. Give the solution a try, and then see if you can incorporate it into your organization’s delivery pipelines.

About the author:

Damodar Shenvi Wagle

Damodar Shenvi Wagle is a Senior Cloud Application Architect at AWS Professional Services. His areas of expertise include architecting serverless solutions, CI/CD, and automation.

How SeatGeek uses AWS Serverless to control authorization, authentication, and rate-limiting in a multi-tenant SaaS application

Post Syndicated from Umesh Kalaspurkar original https://aws.amazon.com/blogs/architecture/how-seatgeek-uses-aws-to-control-authorization-authentication-and-rate-limiting-in-a-multi-tenant-saas-application/

SeatGeek is a ticketing platform for web and mobile users, offering ticket purchase and reselling for sports games, concerts, and theatrical productions. In 2022, SeatGeek had an average of 47 million daily tickets available, and their mobile app was downloaded 33+ million times.

Historically, SeatGeek used multiple identity and access tools internally. Applications were individually managing authorization, leading to increased overhead and a need for more standardization. SeatGeek sought to simplify the API provided to customers and partners by abstracting and standardizing the authorization layer. They were also looking to introduce centralized API rate-limiting to prevent noisy neighbor problems in their multi-tenant SaaS application.

In this blog, we will take you through SeatGeek’s journey and explore the solution architecture they’ve implemented. As of the publication of this post, many B2B customers have adopted this solution to query terabytes of business data.

Building multi-tenant SaaS environments

Multi-tenant SaaS environments allow highly performant and cost-efficient applications by sharing underlying resources across tenants. While this is a benefit, it is important to implement cross-tenant isolation practices to adhere to security, compliance, and performance objectives. With that, each tenant should only be able to access their authorized resources. Another consideration is the noisy neighbor problem that occurs when one of the tenants monopolizes excessive shared capacity, causing performance issues for other tenants.

Authentication, authorization, and rate-limiting are critical components of a secure and resilient multi-tenant environment. Without these mechanisms in place, there is a risk of unauthorized access, resource-hogging, and denial-of-service attacks, which can compromise the security and stability of the system. Validating access early in the workflow can help eliminate the need for individual applications to implement similar heavy-lifting validation techniques.

SeatGeek had several criteria for addressing these concerns:

  1. They wanted to use their existing Auth0 instance.
  2. SeatGeek did not want to introduce any additional infrastructure management overhead; plus, they preferred to use serverless services to “stitch” managed components together (with minimal effort) to implement their business requirements.
  3. They wanted this solution to scale as seamlessly as possible with demand and adoption increases; concurrently, SeatGeek did not want to pay for idle or over-provisioned resources.

Exploring the solution

The SeatGeek team used a combination of Amazon Web Services (AWS) serverless services to address the aforementioned criteria and achieve the desired business outcome. Amazon API Gateway was used to serve APIs at the entry point to SeatGeek’s cloud environment. API Gateway allowed SeatGeek to use a custom AWS Lambda authorizer for integration with Auth0 and defining throttling configurations for their tenants. Since all the services used in the solution are fully serverless, they do not require infrastructure management, are scaled up and down automatically on-demand, and provide pay-as-you-go pricing.

SeatGeek created a set of tiered usage plans in API Gateway (bronze, silver, and gold) to introduce rate-limiting. Each usage plan had a pre-defined request-per-second rate limit configuration. A unique API key was created by API Gateway for each tenant. Amazon DynamoDB was used to store the association of existing tenant IDs (managed by Auth0) to API keys (managed by API Gateway). This allowed us to keep API key management transparent to SeatGeek’s tenants.

Each new tenant goes through an onboarding workflow. This is an automated process managed with Terraform. During new tenant onboarding, SeatGeek creates a new tenant ID in Auth0, a new API key in API Gateway, and stores association between them in DynamoDB. Each API key is also associated with one of the usage plans.

Once onboarding completes, the new tenant can start invoking SeatGeek APIs (Figure 1).

SeatGeek's fully serverless architecture

Figure 1. SeatGeek’s fully serverless architecture

  1. Tenant authenticates with Auth0 using machine-to-machine authorization. Auth0 returns a JSON web token representing tenant authentication success. The token includes claims required for downstream authorization, such as tenant ID, expiration date, scopes, and signature.
  2. Tenant sends a request to the SeatGeak API. The request includes the token obtained in Step 1 and application-specific parameters, for example, retrieving the last 12 months of booking data.
  3. API Gateway extracts the token and passes it to Lambda authorizer.
  4. Lambda authorizer retrieves the token validation keys from Auth0. The keys are cached in the authorizer, so this happens only once for each authorizer launch environment. This allows token validation locally without calling Auth0 each time, reducing latency and preventing an excessive number of requests to Auth0.
  5. Lambda authorizer performs token validation, checking tokens’ structure, expiration date, signature, audience, and subject. In case validation succeeds, Lambda authorizer extracts the tenant ID from the token.
  6. Lambda authorizer uses tenant ID extracted in Step 5 to retrieve the associated API key from DynamoDB and return it back to API Gateway.
  7. The API Gateway uses API key to check if the client making this particular request is above the rate-limit threshold, based on the usage plan associated with API key. If the rate limit is exceeded, HTTP 429 (“Too Many Requests”) is returned to the client. Otherwise, the request will be forwarded to the backend for further processing.
  8. Optionally, the backend can perform additional application-specific token validations.

Architecture benefits

The architecture implemented by SeatGeek provides several benefits:

  • Centralized authorization: Using Auth0 with API Gateway and Lambda authorizer allows for standardization the API authentication and removes the burden of individual applications having to implement authorization.
  • Multiple levels of caching: Each Lambda authorizer launch environment caches token validation keys in memory to validate tokens locally. This reduces token validation time and helps to avoid excessive traffic to Auth0. In addition, API Gateway can be configured with up to 5 minutes of caching for Lambda authorizer response, so the same token will not be revalidated in that timespan. This reduces overall cost and load on Lambda authorizer and DynamoDB.
  • Noisy neighbor prevention: Usage plans and rate limits prevent any particular tenant from monopolizing the shared resources and causing a negative performance impact for other tenants.
  • Simple management and reduced total cost of ownership: Using AWS serverless services removed the infrastructure maintenance overhead and allowed SeatGeek to deliver business value faster. It also ensured they didn’t pay for over-provisioned capacity, and their environment could scale up and down automatically and on demand.

Conclusion

In this blog, we explored how SeatGeek used AWS serverless services, such as API Gateway, Lambda, and DynamoDB, to integrate with external identity provider Auth0, and implemented per-tenant rate limits with multi-tiered usage plans. Using AWS serverless services allowed SeatGeek to avoid undifferentiated heavy-lifting of infrastructure management and accelerate efforts to build a solution addressing business requirements.

Use a reusable ETL framework in your AWS lake house architecture

Post Syndicated from Ashutosh Dubey original https://aws.amazon.com/blogs/architecture/use-a-reusable-etl-framework-in-your-aws-lake-house-architecture/

Data lakes and lake house architectures have become an integral part of a data platform for any organization. However, you may face multiple challenges while developing a lake house platform and integrating with various source systems. In this blog, we will address these challenges and show how our framework can help mitigate these issues.

Lake house architecture using AWS

Figure 1 shows a typical lake house implementation in an Amazon Web Services (AWS) environment.

Typical lake house implementation in AWS

Figure 1. Typical lake house implementation in AWS

In this diagram we have five layers. The number of layers and names can vary per environmental requirements, so check recommended data layers for more details.

  1. Landing layer. This is where all source files are dropped in their original format.
  2. Raw layer. This is where all source files are converted and stored in a common parquet format.
  3. Stage layer. This is where we maintain a history of dimensional tables as Slowly Changing Dimension Type 2 (SCD2). Apache Hudi is used for SCD2 in the Amazon Simple Storage Service (Amazon S3) bucket, and an AWS Glue job is used to write to Hudi tables. AWS Glue is used to perform any extract, transform, and load (ETL) job to move, cleanse, validate, or transform files between any two layers. For details, see using the Hudi framework in AWS Glue.
  4. Presentation layer. This is where data is being cleansed, validated, and transformed, using an AWS Glue job, in accordance with business requirements.
  5. Data warehouse layer. Amazon Redshift is being used as the data warehouse where the curated or cleansed data resides. We can either copy the data using an AWS Glue python shell job, or create a Spectrum table out of the Amazon S3 location.

The data lake house architecture shows two types of data ingestion patterns, push and pull. In the pull-based ingestion, services like AWS Glue or AWS Lambda are used to pull data from sources like databases, APIs, or flat files into the data lake. In the push-based pattern, third-party sources can directly upload files into a landing Amazon S3 bucket in the data lake. Amazon Managed Workflows for Apache Airflow (Amazon MWAA) is used to orchestrate data pipelines that move data from the source systems into a data warehouse. Amazon EventBridge is used to schedule the Airflow directed acyclic graph (DAG) data pipelines. Amazon RDS for PostgreSQL is used to store metadata for configuration of the data pipelines. A data lake architecture with these capabilities provides a scalable, reliable, and efficient solution for data pipelines.

Data pipeline challenges

Maintaining data pipelines in a large lake house environment can be quite challenging. There are a number of hurdles one faces regularly. Creating individual AWS Glue jobs for each task in every Airflow DAG can lead to hundreds of AWS Glue jobs to manage. Error handling and job restarting gets increasingly more complex as the number of pipelines grows. Developing a new data pipeline from scratch takes time, due to the boilerplate code involved. The production support team can find it challenging to monitor and support such a large number of data pipelines. Data platform monitoring becomes arduous at that scale. Ensuring overall maintainability, robustness, and governability of data pipelines in a lake house is a constant struggle.

The benefits of a data pipeline framework

Having a data pipeline framework can significantly reduce the effort required to build data pipelines. This framework should be able to create a lake house environment that is easy to maintain and manage. It should also increase the reusability of code across data pipelines. Effective error handling and recovery mechanisms in the framework should make the data pipelines robust. Support for various data ingestion patterns like batch, micro batch, and streaming should make the framework versatile. A framework with such capabilities will help you build scalable, reliable, and flexible data pipelines, with reduced time and effort.

Reusable ETL framework

In a metadata-driven reusable framework, we have pre-created templates for different purposes. Metadata tables are used to configure the data pipelines.

Figure 2 shows the architecture of this framework:

Reusable ETL framework architecture

Figure 2. Reusable ETL framework architecture

In this framework, there are pre-created AWS Glue templates for different purposes, like copying files from SFTP to landing bucket, fetching rows from a database, converting file formats in landing to parquet in the raw layer, writing to Hudi tables, copying parquet files to Redshift tables, and more.

These templates are stored in a template bucket, and details of all templates are maintained in a template config table with a template_id in Amazon Relational Database Service (Amazon RDS). Each data pipeline (Airflow DAG) is represented as a flow_id in the main job config table. Each flow_id can have one or more tasks, and each task refers to a template_id. This framework can support both the type of ingestions—pull-based (scheduled pipelines) and push-based (initiated pipelines). The following steps show the detailed flow of the pipeline in Figure 2.

  1. To schedule a pipeline, the “Scheduled DAG Invoker Lambda” is scheduled in EventBridge, with flow_id of the pipeline as the parameter.
  2. The source drops files in a landing bucket.
  3. An event is initiated and calls the “Triggered DAG Invoker” Lambda. This Lambda function gets the file name from the event to call the Airflow API.
  4. A Lambda function queries an RDS metadata table with the parameter to get the DAG name.
  5. Both of the Lambda functions call the Airflow API to start the DAG.
  6. The Airflow webserver locates the DAG from the S3 location and passes it to the executor.
  7. The DAG is initiated.
  8. The DAG calls the functions in the common util python script with all required parameters.
  9. For any pipeline, the util script gets all the task details from the metadata table, along with the AWS Glue template name and location.
  10. For any database or API connectivity, the util function gets the secret credentials from AWS Secrets Manager based on the secret_id.
  11. The AWS Glue template file from the S3 location starts the AWS Glue job using Boto3 API by passing the required parameters. Once the AWS Glue job completes successfully, it deletes the job.
  12. If the pipeline contains any Lambda calls, the util script calls the Lambda function as per the configuration parameter.
  13. If the AWS Glue job fails due to any error in Step #11, the script captures the error message and sends an Amazon Simple Notification Service (Amazon SNS) notification.

For developing any new pipeline, the developer must identify the number of tasks that need to be created for the DAG. Identify which template can be used for which task, and insert configuration entries to the metadata tables accordingly. If there is no template available, create a new template to reuse later. Finally, create the Airflow DAG script and place it in the DAG location.

Conclusion

The proposed framework leverages AWS native services to provide a scalable and cost-effective solution. It allows faster development due to reusable components. You can dynamically generate and delete AWS Glue jobs as needed. This framework enables jobs tracking by configuration tables, supports error handling, and provides email notification. You can create scheduled and event-driven data pipelines to ingest data from various sources in different formats. And you can tune the performance and cost of AWS Glue jobs, by updating configuration parameters without changing any code.

A reusable framework is a great practice for any development project, as it improves time to market and standardizes development patterns in a team. This framework can be used in any AWS data lake or lake house environments with any number of data layers. This makes pipeline development faster, and error handing and support easier. You can enhance and customize even further to have more features like data reconciliation, micro-batch pipelines, and more.

Further reading:

Monitor data pipelines in a serverless data lake

Post Syndicated from Virendhar Sivaraman original https://aws.amazon.com/blogs/big-data/monitor-data-pipelines-in-a-serverless-data-lake/

AWS serverless services, including but not limited to AWS Lambda, AWS Glue, AWS Fargate, Amazon EventBridge, Amazon Athena, Amazon Simple Notification Service (Amazon SNS), Amazon Simple Queue Service (Amazon SQS), and Amazon Simple Storage Service (Amazon S3), have become the building blocks for any serverless data lake, providing key mechanisms to ingest and transform data without fixed provisioning and the persistent need to patch the underlying servers. The combination of a data lake in a serverless paradigm brings significant cost and performance benefits. The advent of rapid adoption of serverless data lake architectures—with ever-growing datasets that need to be ingested from a variety of sources, followed by complex data transformation and machine learning (ML) pipelines—can present a challenge. Similarly, in a serverless paradigm, application logs in Amazon CloudWatch are sourced from a variety of participating services, and traversing the lineage across logs can also present challenges. To successfully manage a serverless data lake, you require mechanisms to perform the following actions:

  • Reinforce data accuracy with every data ingestion
  • Holistically measure and analyze ETL (extract, transform, and load) performance at the individual processing component level
  • Proactively capture log messages and notify failures as they occur in near-real time

In this post, we will walk you through a solution to efficiently track and analyze ETL jobs in a serverless data lake environment. By monitoring application logs, you can gain insights into job execution, troubleshoot issues promptly to ensure the overall health and reliability of data pipelines.

Overview of solution

The serverless monitoring solution focuses on achieving the following goals:

  • Capture state changes across all steps and tasks in the data lake
  • Measure service reliability across a data lake
  • Quickly notify operations of failures as they happen

To illustrate the solution, we create a serverless data lake with a monitoring solution. For simplicity, we create a serverless data lake with the following components:

  • Storage layer – Amazon S3 is the natural choice, in this case with the following buckets:
    • Landing – Where raw data is stored
    • Processed – Where transformed data is stored
  • Ingestion layer – For this post, we use Lambda and AWS Glue for data ingestion, with the following resources:
    • Lambda functions – Two Lambda functions that run to simulate a success state and failure state, respectively
    • AWS Glue crawlers – Two AWS Glue crawlers that run to simulate a success state and failure state, respectively
    • AWS Glue jobs – Two AWS Glue jobs that run to simulate a success state and failure state, respectively
  • Reporting layer – An Athena database to persist the tables created via the AWS Glue crawlers and AWS Glue jobs
  • Alerting layer – Slack is used to notify stakeholders

The serverless monitoring solution is devised to be loosely coupled as plug-and-play components that complement an existing data lake. The Lambda-based ETL tasks state changes are tracked using AWS Lambda Destinations. We have used an SNS topic for routing both success and failure states for the Lambda-based tasks. In the case of AWS Glue-based tasks, we have configured EventBridge rules to capture state changes. These event changes are also routed to the same SNS topic. For demonstration purposes, this post only provides state monitoring for Lambda and AWS Glue, but you can extend the solution to other AWS services.

The following figure illustrates the architecture of the solution.

The architecture contains the following components:

  • EventBridge rules – EventBridge rules that capture the state change for the ETL tasks—in this case AWS Glue tasks. This can be extended to other supported services as the data lake grows.
  • SNS topic – An SNS topic that serves to catch all state events from the data lake.
  • Lambda function – The Lambda function is the subscriber to the SNS topic. It’s responsible for analyzing the state of the task run to do the following:
    • Persist the status of the task run.
    • Notify any failures to a Slack channel.
  • Athena database – The database where the monitoring metrics are persisted for analysis.

Deploy the solution

The source code to implement this solution uses AWS Cloud Development Kit (AWS CDK) and is available on the GitHub repo monitor-serverless-datalake. This AWS CDK stack provisions required network components and the following:

  • Three S3 buckets (the bucket names are prefixed with the AWS account name and Regions, for example, the landing bucket is <aws-account-number>-<aws-region>-landing):
    • Landing
    • Processed
    • Monitor
  • Three Lambda functions:
    • datalake-monitoring-lambda
    • lambda-success
    • lambda-fail
  • Two AWS Glue crawlers:
    • glue-crawler-success
    • glue-crawler-fail
  • Two AWS Glue jobs:
    • glue-job-success
    • glue-job-fail
  • An SNS topic named datalake-monitor-sns
  • Three EventBridge rules:
    • glue-monitor-rule
    • event-rule-lambda-fail
    • event-rule-lambda-success
  • An AWS Secrets Manager secret named datalake-monitoring
  • Athena artifacts:
    • monitor database
    • monitor-table table

You can also follow the instructions in the GitHub repo to deploy the serverless monitoring solution. It takes about 10 minutes to deploy this solution.

Connect to a Slack channel

We still need a Slack channel to which the alerts are delivered. Complete the following steps:

  1. Set up a workflow automation to route messages to the Slack channel using webhooks.
  2. Note the webhook URL.

The following screenshot shows the field names to use.

The following is a sample message for the preceding template.

  1. On the Secrets Manager console, navigate to the datalake-monitoring secret.
  2. Add the webhook URL to the slack_webhook secret.

Load sample data

The next step is to load some sample data. Copy the sample data files to the landing bucket using the following command:

aws s3 cp --recursive s3://awsglue-datasets/examples/us-legislators s3://<AWS_ACCCOUNT>-<AWS_REGION>-landing/legislators

In the next sections, we show how Lambda functions, AWS Glue crawlers, and AWS Glue jobs work for data ingestion.

Test the Lambda functions

On the EventBridge console, enable the rules that trigger the lambda-success and lambda-fail functions every 5 minutes:

  • event-rule-lambda-fail
  • event-rule-lambda-success

After a few minutes, the failure events are relayed to the Slack channel. The following screenshot shows an example message.

Disable the rules after testing to avoid repeated messages.

Test the AWS Glue crawlers

On the AWS Glue console, navigate to the Crawlers page. Here you can start the following crawlers:

  • glue-crawler-success
  • glue-crawler-fail

In a minute, the glue-crawler-fail crawler’s status changes to Failed, which triggers a notification in Slack in near-real time.

Test the AWS Glue jobs

On the AWS Glue console, navigate to the Jobs page, where you can start the following jobs:

  • glue-job-success
  • glue-job-fail

In a few minutes, the glue-job-fail job status changes to Failed, which triggers a notification in Slack in near-real time.

Analyze the monitoring data

The monitoring metrics are persisted in Amazon S3 for analysis and can be used of historical analysis.

On the Athena console, navigate to the monitor database and run the following query to find the service that failed the most often:

SELECT service_type, count(*) as "fail_count"
FROM "monitor"."monitor"
WHERE event_type = 'failed'
group by service_type
order by fail_count desc;

Over time with rich observability data – time series based monitoring data analysis will yield interesting findings.

Clean up

The overall cost of the solution is less than one dollar but to avoid future costs, make sure to clean up the resources created as part of this post.

Summary

The post provided an overview of a serverless data lake monitoring solution that you can configure and deploy to integrate with enterprise serverless data lakes in just a few hours. With this solution, you can monitor a serverless data lake, send alerts in near-real time, and analyze performance metrics for all ETL tasks operating in the data lake. The design was intentionally kept simple to demonstrate the idea; you can further extend this solution with Athena and Amazon QuickSight to generate custom visuals and reporting. Check out the GitHub repo for a sample solution and further customize it for your monitoring needs.


About the Authors

Virendhar (Viru) Sivaraman is a strategic Senior Big Data & Analytics Architect with Amazon Web Services. He is passionate about building scalable big data and analytics solutions in the cloud. Besides work, he enjoys spending time with family, hiking & mountain biking.

Vivek Shrivastava is a Principal Data Architect, Data Lake in AWS Professional Services. He is a Bigdata enthusiast and holds 14 AWS Certifications. He is passionate about helping customers build scalable and high-performance data analytics solutions in the cloud. In his spare time, he loves reading and finds areas for home automation.

How Thomson Reuters monitors and tracks AWS Health alerts at scale

Post Syndicated from Srinivasa Shaik original https://aws.amazon.com/blogs/architecture/how-thomson-reuters-monitors-and-tracks-aws-health-alerts-at-scale/

Thomson Reuters Corporation is a leading provider of business information services. The company’s products include highly specialized information-enabled software and tools for legal, tax, accounting and compliance professionals combined with the world’s most trusted global news service: Reuters.

Thomson Reuters is committed to a cloud first strategy on AWS, with thousands of applications hosted on AWS that are critical to its customers, with a growing number of AWS accounts that are used by different business units to deploy the applications. Service Management in Thomson Reuters is a centralized team, who needs an efficient way to measure, monitor and track the health of AWS services across the AWS environment. AWS Health provides the required visibility to monitor the performance and availability of AWS services and scheduled changes or maintenance that may impact their applications.

With approximately 16,000 AWS Health events received in 2022 alone due to the scale at which Thomson Reuters is operating on AWS, manually tracking AWS Health events is challenging. This necessitates a solution to provide centralized visibility of Health alerts across the organization, and an efficient way to track and monitor the Health events across the AWS accounts. Thomson Reuters requires retaining AWS Health event history for a minimum of 2 years to derive indicators affecting performance and availability of applications in the AWS environment and thereby ensuring high service levels to customers. Thomson Reuters utilizes ServiceNow for tracking IT operations and Datadog for infrastructure monitoring which is integrated with AWS Health to measure and track all the events and estimate the health performance with key indicators. Before this solution, Thomson Reuters didn’t have an efficient way to track scheduled events, and no metrics to identify the applications impacted by these Health events.

In this post, we will discuss how Thomson Reuters has implemented a solution to track and monitor AWS Health events at scale, automate notifications, and efficiently track AWS scheduled changes. This gives Thomson Reuters visibility into the health of AWS resources using Health events, and allows them to take proactive measures to minimize impact to their applications hosted on AWS.

Solution overview

Thomson Reuters leverages AWS Organizations to centrally govern their AWS environment. AWS Organization helps to centrally manage accounts and resources, optimize the cost, and simplify billing. The AWS environment in Thomson Reuters has a dedicated organizational management account to create Organizational Units (OUs), and policies to manage the organization’s member accounts. Thomson Reuters enabled organizational view within AWS Health, which once activated provides an aggregated view of AWS Health events across all their accounts (Figure 1).

Architecture to track and monitor AWS Health events

Figure 1. Architecture to track and monitor AWS Health events

Let us walk through the architecture of this solution:

  1. Amazon CloudWatch Scheduler invokes AWS Lambda every 10 minutes to fetch AWS Health API data from the Organization Management account.
  2. Lambda leverages execution role permissions to connect to the AWS Health API and send events to Amazon EventBridge. The loosely coupled architecture of Amazon EventBridge allows for storing and routing of the events to various targets based upon the AWS Health Event Type category.
  3. AWS Health Event is matched against the EventBridge rules to identify the event category and route to the target AWS Lambda functions that process specific AWS Health Event types.
  4. The AWS Health events are routed to ServiceNow and Datadog based on the AWS Health Event Type category.
  5. If the Health Event Type category is “Scheduled change“ or ” Issues“ then it is routed to ServiceNow.
    • The event is stored in a DynamoDB table to track the AWS Health events beyond the 90 days history available in AWS Health.
    • If the entity value of the affected AWS resource exists inside the Health Event, then tags associated with that entity value are used to identify the application and resource owner to notify. One of the internal policies mandates the owners to include AWS resource tags for every AWS resource provisioned. The DynamoDB table is updated with additional details captured based on entity value.
    • Events that are not of interest are excluded from tracking.
    • A ServiceNow ticket is created containing the details of the AWS Health event and includes additional details regarding the application and resource owner that are captured in the DynamoDB table. The ServiceNow credentials to connect are stored securely in AWS Secrets Manager. The ServiceNow ticket details are also updated back in DynamoDB table to correlate AWS Health event with a ServiceNow tickets.
  6. If the Health Event Type category is “Account Notification”, then it is routed to Datadog.
    • All account notifications including public notifications are routed to Datadog for tracking.
    • Datadog monitors are created to help derive more meaningful information from the account notifications received from the AWS Health events.

AWS Health Event Type “Account Notification” provides information about the administration or security of AWS accounts and services. These events are mostly informative, but some of them need urgent action, and tracking each of these events within Thomson Reuters incident management is substantial. Thomson Reuters has decided to route these events to Datadog, which is monitored by the Global Command Center from the centralized Service Management team. All other AWS Health Event types are tracked using ServiceNow.

ServiceNow to track scheduled changes and issues

Thomson Reuters leverages ServiceNow for incident management and change management across the organization, including both AWS cloud and on-premises applications. This allows Thomson Reuters to continue using the existing proven process to track scheduled changes in AWS through the ServiceNow change management process and AWS Health issues and investigations by using ServiceNow incident management, notify relevant teams, and monitor until resolution. Any AWS service maintenance or issues reported through AWS Health are tracked in ServiceNow.

One of the challenges while processing thousands of AWS Health events every month is also to identify and track events that has the potential to cause significant impact to the applications. Thomson Reuters decided to exclude events that are not relevant for Thomson Reuters hosted Regions, or specific AWS services. The process of identifying events to include is a continuous iterative effort, relying on the data captured in DynamoDB tables and from experiences of different teams. AWS EventBridge simplifies the process of filtering out events by eliminating the need to develop a custom application.

ServiceNow is used to create various dashboards which are important to Thomson Reuters leadership to view the health of the AWS environment in a glance, and detailed dashboards for individual application, business units and AWS Regions are also curated for specific requirements. This solution allows Thomson Reuters to capture metrics which helps to understand the scheduled changes that AWS performs and identify the underlying resources that are impacted in different AWS accounts. The ServiceNow incidents created from Health events are used to take real-time actions to mitigate any potential issues.

Thomson Reuters has a business requirement to persist AWS Health event history for a minimum of 2 years, and a need for customized dashboards for leadership to view performance and availability metrics across applications. This necessitated the creation of dashboards in ServiceNow. Figures 2, 3, and 4 are examples of dashboards that are created to provide a comprehensive view of AWS Health events across the organization.

ServiceNow dashboard with a consolidated view of AWS Health events

Figure 2. ServiceNow dashboard with a consolidated view of AWS Health events

ServiceNow dashboard with a consolidated view of AWS Health events

Figure 3. ServiceNow dashboard with a consolidated view of AWS Health events

ServiceNow dashboard showing AWS Health events

Figure 4. ServiceNow dashboard showing AWS Health events

Datadog for account notifications

Thomson Reuters leverages Datadog as its strategic platform to observe, monitor, and track the infrastructure, applications and more. Health events with the category type Account Notification are forwarded to Datadog and are monitored by Thomson Reuters Global Command Center part of the Service Management. Account notifications are important to track as they contain information about administration or security of AWS accounts. Like ServiceNow, Datadog is also used to curate separate dashboards with unique Datadog monitors for monitoring and tracking these events (Figure 5). Currently, the Thomson Reuters Service Management team are the main consumers of these Datadog alerts, but in the future the strategy would be to route relevant and important notifications only to the concerned application team by ensuring a mandatory and robust tagging standards on the existing AWS accounts for all AWS resource types.

Datadog dashboard for AWS Health event type account notification

Figure 5. Datadog dashboard for AWS Health event type account notification

What’s next?

Thomson Reuters will continue to enhance the logic for identifying important Health events that require attention, reducing noise by filtering out unimportant ones. Thomson Reuters plan to develop a self-service subscription model, allowing application teams to opt into the Health events related to their applications.

The next key focus will also be to look at automating actions for specific AWS Health scheduled events wherever possible, such as responding to maintenance with AWS System Manager Automation documents.

Conclusion

By using this solution, Thomson Reuters can effectively monitor and track AWS Health events at scale using the preferred internal tools ServiceNow and Datadog. Integration with ServiceNow allowed Thomson Reuters to measure and track all the events and estimate the health performance with key indicators that can be generated from ServiceNow. This architecture provided an efficient way to track the AWS scheduled changes, capture metrics to understand the various schedule changes that AWS is doing and resources that are getting impacted in different AWS accounts. This solution provides actionable insights from the AWS Health events, allowing Thomson Reuters to take real-time actions to mitigate impacts to the applications and thus offer high Service levels to Thomson Reuters customers.

Build a serverless retail solution for endless aisle on AWS

Post Syndicated from Sandeep Mehta original https://aws.amazon.com/blogs/architecture/building-serverless-endless-aisle-retail-architectures-on-aws/

In traditional business models, retailers handle order-fulfillment processes from start to finish—including inventory management, owning or leasing warehouses, and managing supply chains. But many retailers aren’t set up to carry additional inventory.

The “endless aisle” business model is an alternative solution for lean retailers that are carrying enough in-store inventory while wanting to avoid revenue loss. Endless aisle is also known as drop-shipping, or fulfilling orders through automated integration with product partners. Such automation results in a customer’s ability to place an order on a tablet or kiosk when they cannot find a specific product of their choice on in-store shelves.

Why is the endless aisle concept important for businesses and customers alike? It means that:

  • Businesses no longer need to stock products more than shelf deep.
  • End customers can easily place an order at the store and get it shipped directly to their home or place of choice.

Let’s explore these concepts further.

Solution overview

When customers are in-store and looking to order items that are not available on shelves, a store associate can scan the SKU code on a tablet. The kiosk experience is similar, where the customer can search for the item themselves by typing in its name.

For example, if a customer visits a clothing store that only stocks the items on shelves and finds the store is out of a product in their size, preferred color, or both, the associate can scan the SKU and check whether the item is available to ship. The application then raises a request with a store’s product partner. The request returns the available products the associate can show to the customer, who can then choose to place an order. When the order is processed, it is directly fulfilled by the partner.

Serverless endless aisle reference architecture

Figure 1 illustrates how to architect a serverless endless aisle architecture for order processing.

Building endless aisle architecture for order processing

Figure 1. Building endless aisle architecture for order processing

Website hosting and security

We’ll host the endless aisle website on Amazon Simple Storage Service (Amazon S3) with Amazon CloudFront for better response time. CloudFront is a content delivery network (CDN) service built for high performance and security. CloudFront can reduce the latency to other AWS services by providing access at the edge and by caching the static content, while dynamic content is provided by Amazon API Gateway integration for our use case. A Web Application Firewall (WAF) is used after CloudFront for protection against internet threats, such as cross-site scripting (XSS) and SQL injection.

Amazon Cognito is used for managing the application user pool, and provides security for who can then access the application.

Solution walkthrough

Let’s review the architecture steps in detail.

Step 1. The store associate logs into the application with their username and password. When the associate or customer scans the bar code/SKU, the following process flow is executed.

Step 2. The front-end application translates the SKU code into a product number and invokes the Get Item API.

Step 3. An invoked getItem AWS Lambda function handles the API call.

This architecture’s design pattern supports multiple partner integration and allows reusability of the code. The design can be integrated with any partner with the ability to integrate using APIs, and the partner-specific transformation is built separately using Lambda functions.

We’ll use Amazon DynamoDB for storing partner information metadata—for example, partner_id, partner_name, partner APIs.

Step 4. The getItem Lambda function fetches partner information from an DynamoDB table. It transforms the request body using a Transformation Lambda function.

Step 5. The getItem Lambda function calls the right partner API. Upon receiving a request, the partner API returns the available product (based on SKU code) with details such as size, color, and any other variable parameter, along with images.

It can also provide links to similar available products the customer may be interested in based on the selected product. This helps retail clients increase their revenue and offer products that aren’t available at a given time on their shelves.

The customer then selects from the available products. Having selected the right product with specific details on parameters such as color, size, quantity, and more, they add them to the cart and begin the check-out process. The customer enters their shipping address and payment information to place an order.

Step 6. The orders are pushed to an Amazon Simple Queue Service (Amazon SQS) queue named create-order-queue. Amazon SQS provides a straightforward and reliable way for customers to decouple and connect micro-services together using queues.

Step 7. Amazon SQS ensures that there is no data loss and orders are processed from the queue by the orders API. The createOrder Lambda function pulls the messages from Amazon SQS and processes them.

Step 8. The orders API body is then transformed into the message format expected by the partner API. This transformation can be done by a Lambda function defined in the configuration in the ‘partners-table’ DynamoDB table.

Step 9. A partner API is called using the endpoint URL, which is obtained from the partners-table. When the order is placed, a confirmation will be returned by the partner API response. With this confirmation, order details are entered in another DynamoDB table called orders-table.

Step 10. With DynamoDB stream, you can track any insert or update to the DynamoDB table.

Step 11. A notifier Lambda function invokes Amazon Simple Email Service (Amazon SES) to notify the store about order activity.

Step 12. The processed orders are integrated with the customer’s ERP application for the reconciliation process. This can be achieved by Amazon Eventbridge rule that invokes a dataSync Lambda function.

Prerequisites

For this walkthrough, you’ll need the following prerequisites:

Build

Locally install CDK library:

npm install -g aws-cdk

Build an Infrastructure package to create deployable assets, which will be used in CloudFormation template.

cd serverless-partner-integration-endless-aisle && sh build.sh

Synthesize CloudFormation template

To see the CloudFormation template generated by the CDK, execute the below steps.

cd serveless-partner-integration-endless-aisle/infrastructure

cdk bootstrap && cdk synth

Check the output files in the “cdk.out” directory. AWS CloudFormation template is created for deployment in your AWS account.

Deploy

Use CDK to deploy/redeploy your stack to an AWS Account.

Set store email address for notifications. If a store wants to get updates about customer orders, they can set STORE_EMAIL value with store email. You will receive a verification email in this account, after which SES can send you order updates.

export STORE_EMAIL=”[email protected]” - Put your email here.

Set up AWS credentials with the information found in this developer guide.

Now run:

cdk deploy

Testing

After the deployment, CDK will output Amazon Cloudfront URL to use for testing.

  • If you have provided STORE_EMAIL address during the set up, then approve the email link received from Amazon SES in your inbox. This will allow order notifications to your inbox.
  • Create a sample user by using the following command, that you can use to login to the website.
    aws cognito-idp admin-create-user --user-pool-id <REACT_APP_USER_POOL_ID> --username <UserName> --user-attributes Name="email",Value="<USER_EMAIL>" Name="email_verified",Value=true
  • The user will receive password in their email.
  • Open CloudFront URL in a web browser. Login to the website with the username and password. It will ask you to reset your password.
  • Explore different features such as Partner Lookup, Product search, Placing an order, and Order Lookup.

Cleaning up

To avoid incurring future charges, delete the resources, delete the cloud formation stack when not needed.

The following command will delete the infrastructure and website stack created in your AWS account:

cdk destroy

Conclusion

In this blog, we demonstrated how to build an in-store digital channel for retail customers. You can now build your endless aisle application using the architecture described in this blog and integrate with your partners, or reach out to accelerate your retail business.

Further reading

Using response streaming with AWS Lambda Web Adapter to optimize performance

Post Syndicated from James Beswick original https://aws.amazon.com/blogs/compute/using-response-streaming-with-aws-lambda-web-adapter-to-optimize-performance/

This post is written by Harold Sun, Senior Serverless SSA, AWS GCR, Xue Jiaqing, Solutions Architect, AWS GCR, and Su Jie, Associate Solution Architect, AWS GCR.

AWS Lambda now supports Lambda response streaming, which introduces a new invocation mode accessible through the Lambda Function URLs. This feature enables Lambda functions to send response content in sequential chunks to the client. It is available for Lambda’s Node.js runtime, custom runtimes, and can be accessed using the InvokeWithResponseStream API in Lambda.

The Lambda Web Adapter, written in Rust, serves as a universal adapter for Lambda Runtime API and HTTP API. It allows developers to package familiar HTTP 1.1/1.0 web applications, such as Express.js, Next.js, Flask, SpringBoot, or Laravel, and deploy them on AWS Lambda. This replaces the need to modify the web application to accommodate Lambda’s input and output formats, reducing the complexity of adapting code to meet Lambda’s requirements.

When using other managed runtimes such as Java, Go, Python, or Ruby, developers can use the Lambda Web Adapter to build applications that support Lambda response streaming more easily.

Implementing response streaming with Lambda Web Adapter

In general, you can regard Lambda Web Adapter as an extension of Lambda, which is integrated into Lambda’s runtime environment using the Lambda Extension API. It operates within an independent process space when the Lambda function is invoked and serves as a custom runtime. When the function is run, the Web Adapter starts alongside the packaged web application.

After initialization, it performs a readiness check on the configured web application’s port every 10ms (the default is 8080, but you can configure other ports using environment variables). Once it receives an HTTP response with an “200 OK” status from the web application, it encapsulates the received Lambda invocation parameters according to the HTTP protocol and sends a request to the running web application.

Once the web application responds to this request, the Web Adapter formats the response content according to the function’s response format and sends it to the client, completing one invocation of the function.

Web adapter architecture

Similarly, the Lambda Web Adapter uses the Custom Runtime API to implement response streaming. When implementing a function using response streaming:

  1. The Web Adapter sends a POST request to the Lambda Runtime’s Response API, including the Lambda-Runtime-Function-Response-Mode HTTP header with the value streaming and the Transfer-Encoding HTTP header with the value chunked:
    POST http://${AWS_LAMBDA_RUNTIME_API}/runtime/invocation/${AwsRequestId}/response
    Lambda-Runtime-Function-Response-Mode: streaming
    Transfer-Encoding: chunked
  2. It encodes the response data according to the HTTP/1.1 Chunked Transfer Encoding protocol specification and sends it as the “Body” to the Lambda Runtime’s Response API.
  3. After assembling the response and completing the data transmission, the Web Adapter closes the underlying network connection.

Under normal circumstances, completing these steps enables Lambda response streaming in a function. However, this is not sufficient for web application scenarios. Web applications must often send custom HTTP response status codes, custom HTTP headers, and some cookie data to the client. The previous steps only achieve streaming of the response body, and cannot add content to the response’s HTTP headers.

To add these, when sending the response content to the Response API, you must:

  1. Add a Content-Type HTTP Header to specify the MIME type (original media type) of the response as application/vnd.awslambda.http-integration-response.
  2. Send the custom response headers, such as HTTP status code, customer headers, and cookies, in JSON format.
  3. Send 8 NULL characters as separators.
  4. Send the response content encoded using the HTTP 1.1 Chunked Transfer Encoding protocol.

Here is an example of the response format:

POST http://${AWS_LAMBDA_RUNTIME_API}/runtime/invocation/${AwsRequestId}/response
Lambda-Runtime-Function-Response-Mode: streaming
Transfer-Encoding: chunked
Content-Type: application/vnd.awslambda.http-integration-response
{
    "statusCode":200,
    "headers":{
        "Content-Type":"text/html",
        "custom-header":"outer space"
    },
    "cookies":[
        "language=xxx",
        "theme=abc"
    ]
}
8 NULL characters
Chunked response body

In Lambda Function URLs, multi-value HTTP headers are not supported. As a result, you cannot implement responses with multi-value HTTP headers in the Lambda Web Adapter.

Using response streaming with Lambda Web Adapter

When packaging Lambda functions using the zip format, you must attach the Lambda Web Adapter as a layer and configure the environment variable AWS_LAMBDA_EXEC_WRAPPER with the value /opt/bootstrap.

After that, you can configure the startup script of the web application as the Lambda function’s handler. By doing this, the function is able to use the Lambda Web Adapter, and the web application can be launched and run within the Lambda runtime environment.

The AWS_LAMBDA_EXEC_WRAPPER environment variable points to the bootstrap script provided by the Web Adapter to ensure the proper execution of the web application.

When using a Docker Image or OCI Image to package the Lambda function, you only need to include the Lambda Web Adapter binary package in the Dockerfile by copying it to the /opt/extensions directory within the image. Additionally, you should specify the port on which the web application listens by setting the PORT environment variable:

COPY --from=public.ecr.aws/awsguru/aws-lambda-adapter:0.7.0 /lambda-adapter /opt/extensions/lambda-adapter

ENV PORT=3000

By default, the Web Adapter is invoked using the buffered mode. To use response streaming as the invocation mode in the function, you must configure an environment variable. Specify the function’s Web Adapter invocation mode as response_stream:

ENV AWS_LWA_INVOKE_MODE=response_stream

Due to the different data formats between the buffered and response stream invocation modes, you must configure the AWS_LWA_INVOKE_MODE to have the same behavior as the InvokeMode specified in the Lambda Function URLs. Otherwise, the client may not process the response content correctly.

Lambda response streaming example

Server-side rendering (SSR) can accelerate the loading time of a React application. With SSR, the the server generates the HTML pages and sends them to the client, which renders the content. The browser executes the hydration process, which “wakes up” the static components from the received HTML and mounts them into the React application. This allows for a faster response to user interactions and improves the overall user experience.

By using Lambda response streaming, your application can achieve a faster TTFB by processing response content in sequential chunks. This helps to reduce the time it takes for the initial data to be sent from the server to the client, enhancing overall performance.

The hydration process can introduce delays as the client-side JavaScript must re-render and rehydrate the page after the initial load. Lambda response streaming minimizes the need for full page hydration, leading to an improved user experience.

Next.js 13’s support for streaming with suspense complements the Lambda response streaming feature, allowing you to use both SSR and selective hydration. This combination can lead to greater improvements in performance and user experience for your Next.js applications.

This GitHub repo demonstrates a Next.js application that supports Lambda response streaming using the Web Adapter and the streaming with suspense feature. Use AWS Serverless Application Model (AWS SAM) to deploy the application to test these optimizations:

git clone [email protected]:aws-samples/lwa-nextjs-response-streaming-example.git
cd lwa-nextjs-response-streaming-example.git

sam build
sam deploy -g --stack-name lambda-web-adapter-nextjs-response-streaming-example

After the sam deploy process is completed, you can access the Lambda Function URLs endpoint provided in the output. Here is the output of the Lambda response streaming Next.js application demo:

Example output

Quotas and pricing

Web Adapter is an enhancement to Lambda and does not incur additional costs. You are only charged for the Lambda function usage based on the resources consumed.

However, response streaming may result in additional network costs. You are billed for any part of the response that exceeds 6MB. For more information, refer to the pricing page.

There is a maximum response size limit of 20MB for Lambda response streaming. This is a soft limit, and you can request to increase this limit by creating a support ticket.

The response speed of Lambda response streaming depends on the size of the response body. The transfer rate for the first 6MB is not limited, but any part of the response beyond 6MB has a maximum throughput of 2MB/s. For more detailed information, refer to Bandwidth limits for response streaming.

Conclusion

Lambda response streaming can improve the TTFB for web pages. With the support of AWS Lambda Web Adapter, developers can more easily package web applications that support Lambda response streaming, enhancing the user experience and performance metrics of their web applications.

For more serverless learning resources, visit Serverless Land.