Post Syndicated from James Beswick original https://aws.amazon.com/blogs/compute/estimating-cost-for-amazon-sqs-message-processing-using-aws-lambda/
This post was written by Sabha Parameswaran, Senior Solutions Architect.
AWS Lambda enables fully managed asynchronous messaging processing through integration with Amazon SQS. This blog post helps estimate the cost and performance benefits when using Lambda to handle millions of messages per day by using a simulated setup.
Overview
Lambda supports asynchronous handling of messages using SQS integration as an event source and can scale for handling millions of messages per day. Customers often ask about the cost of implementing a Lambda-based messaging solution.
There are multiple variables like Lambda function runtime, individual message size, batch size for consuming from SQS, processing latency per message (depending on the backend services invoked), and function memory size settings. These can determine the overall performance and associated cost of a Lambda-based messaging solution.
This post provides cost estimation using these variables, along with guidance around optimization. The estimates focus on consuming from standard queues and not FIFO queues.
SQS event source
The Lambda event source mapping supports integration for SQS. Lambda users specify the SQS queue to consume messages. Lambda internally polls the queue and invokes the function synchronously with an event containing the queue messages.
The configuration controls in Lambda for consuming messages from an SQS queue are:
- Batch size: The maximum number of records that can be batched as one event delivered to the consuming Lambda function. The maximum batch size is 10,000 records.
- Batch window: The maximum time (in seconds) to gather records as a single batch. A larger batch window size means waiting longer for a larger SQS batch of messages before passing to the Lambda function.
- SQS content filtering: Selecting only the messages that match a defined content criteria. This can reduce cost by removing unwanted or irrelevant messages. Lambda now supports content filtering (for SQS, Kinesis, and DynamoDB) and developers can use the filtering capabilities to avoid processing SQS messages, reducing unnecessary invocations and associated cost.
Lambda sends as many records in a single batch as allowed by the batch size, as long as it’s earlier than the batch window value, and smaller than the maximum payload size of 6 MB. Having large batch sizes means that a single Lambda invocation can handle more messages rather than multiple Lambda invocations to handle smaller batches (which translates to setting higher concurrency limits).
The cost and time to process might vary based on the actual number of messages in the batch. A larger batch size can imply longer processing but requires lower concurrency (number of concurrent Lambda invocations).
Lambda configurations
Lambda function costs are calculated based on memory used and time spent (in GB-second) in execution of a function. Aside from the event source configuration, there are several other Lambda function configurations that impact cost and performance:
- Processor type: Lambda functions provide options to choose between x86 and Arm/Graviton processors. The newer Arm/Graviton processors can yield a higher performance and lower cost compared to x86 based on the workload. Compare the options and run tests before selecting.
- Memory allotted: This is directly proportional to the CPU allotted to the function and translates to price for each invocation. Higher memory can lead to faster execution but also higher cost. The optimal memory required for a small batch versus large batch can vary based on the workload, size of incoming messages, transformations, requirements to store intermediate, or final results. Optimal tuning of the memory configurations is key to ensuring right cost versus performance. See the AWS Lambda Power Tuning documentation for more details on identifying the optimal memory versus performance for a fixed batch size and then extrapolate the memory settings for larger batch sizes.
- Lambda function runtime: Some runtimes have a smaller memory footprint and may be more cost effective than others that are memory intensive. Choosing the runtime affects the memory allocation.
- Function performance: This can be considered as TPS – total number of requests completed per second. Or conversely measured as time to complete one request. The performance – time to finish a function execution can be dependent on the event containing the batch of messages; bigger batches mean more time to complete an event and complexity and dependencies (performance of the backend that needs to be invoked) of the message processing. The calculations are based on the assumption that the Lambda function and related dependencies have been optimized and tuned to scale linearly with various batch sizes and number of invocations.
- Concurrency: Number of concurrent Lambda function executions. Concurrency is important for scaling of Lambda functions, allowing users to delegate the capacity planning and scaling to thee Lambda service.
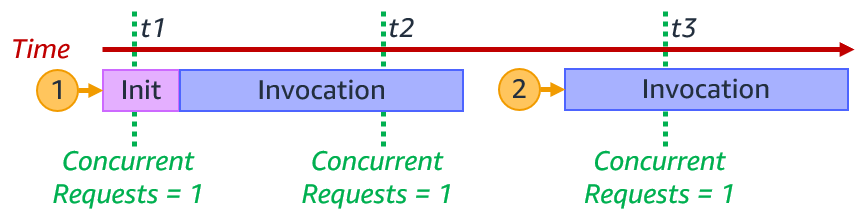
The higher the concurrency, the more workloads it can process in a shorter time, allowing better performance, but this does not change the overall cost. Concurrency is not equivalent to TPS: it is more of a scaling factor in overall TPS. For example, a workload comprised of a set of messages takes 20 seconds to complete. 100 workloads would mean 2000 seconds to complete. With a concurrency of 10, it takes 200 seconds. With a concurrency of 100, the time drops to 20 seconds as each of the 100 workloads are handled concurrently. But each function essentially runs for the same duration and memory, regardless of concurrency. So the cost remains the same, as it is measured in GB-hours (memory multiplied by time). But the performance view differs. So, the cost estimations do not consider the concurrency settings of Lambda functions as the workloads have to be processed either sequential or concurrently.
Assumptions
The cost estimation tool presented helps users estimate monthly Lambda function costs for processing SQS standard queue messages based on the following assumptions:
- The system has reached steady state and has millions of messages available to be consumed per day in standard queues. The number of messages per day remains constant throughout the entire month.
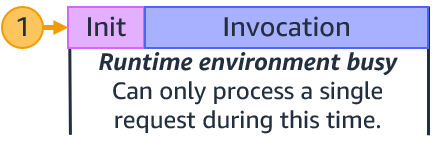
- Since it’s a steady state, there are no associated Lambda function cold start delays.
- All SQS messages that need to be processed successfully have already met the filter criteria. Also, no poison messages that have to be re-tried repeatedly. Messages are not going to be rejected, unacknowledged, or reprocessed.
- The workload scales linearly in performance versus batch size. All the associated dependencies can scale linearly and a batch of N messages should take the same time as N x a single message with a fixed overhead per function invocation irrespective of the batch size. For example, a function’s overhead is 50 ms irrespective of the batch size. Processing a single message takes 20 ms. So a batch of 20 messages should take 490 ms (50 + 20*20) versus a batch of 5 messages takes 150 ms (50 + 5*20).
- Function memory increases in steps, based on increasing the batch size. For example, 100 messages uses a 256 MB of baseline memory. Every additional 500 messages require additional 128 MB of memory. A sliding window of memory to batch size:
| Batch size | Memory |
| 1–100 | 256 MB |
| 100–600 | 384 MB |
| 600–1100 | 512 MB |
| 1100–1600 | 640 MB |
Lambda uses SQS APIs internally to poll and dequeue the messages. The costs for the polling and dequeue operations using SQS APIs are not included as part of the estimations. The internal SQS dequeue portion is outside the control of the Lambda developer and the cost estimates only cover the message processing using Lambda. Also, the tool does not consider any reprocessing or duplicate processing of messages due to exceptions or errors that can vary the cost.
Using the cost estimation tool
The estimator tool is a Python-based command line program that takes in an input properties file that specifies the various input parameters to come up with Lambda function cost versus performance estimations for various batch sizes, messages per day, etc. The tool does take into account the eligible monthly free tier for Lambda function executions.
Pre-requisites: Running the tool requires Python 3.9 and installation of Plotly package (5.7.+) or creating and using Docker images.
To run the tool:
- Clone the repo:
git clone https://github.com/aws-samples/aws-lambda-sqs-cost-estimator - Install the tool:
cd aws-lambda-sqs-cost-estimator/code pip3 install -r requirements.txt - Edit the input.prop file and run the tool to generate cost estimations:
python3 LambdaPlotly.py
This shows the cost estimates on a local browser instance. Running the code as a Docker image is also supported. Refer to the GitHub repo for additional instructions.
- Clone the repo and build the Docker container:
git clone https://github.com/aws-samples/aws-lambda-sqs-cost-estimator cd aws-lambda-sqs-cost-estimator/code docker build -t lambda-dash . - Edit the input.prop file and run the tool to generate cost estimations:
docker run -it -v `pwd`:/app -p 8080:8080 lambda-dash - Navigate to http://0.0.0.0:8080/app in a browser to view the generated cost estimate plot.
There are various input parameters for the cost estimations specified inside the input.prop file. Tune the input parameters as needed:
| Parameter | Description | Sample value (units not included) |
| base_lambda_memory_mb | Baseline memory for the Lambda function (in MB) | 128 |
| warm_latency_ms | Invocation time for Lambda handler method (going with warm start) irrespective of batch size in the incoming event payload in ms | 20 |
| process_per_message_ms | Time to process a single message (linearly scales with number of messages per batch in event payload) in ms | 10 |
| max_batch_size | Maximum batch size per event payload processed by a single Lambda instance | 1000 (max is 10000) |
| batch_memory_overhead_mb | Additional memory for processing increments in batch size (in MB) | 128 |
| batch_increment | Increments of batch size for increased memory | 300 |
The following is sample input.prop file content:
The tool generates a page with plot graphs and tables with 3 sections:
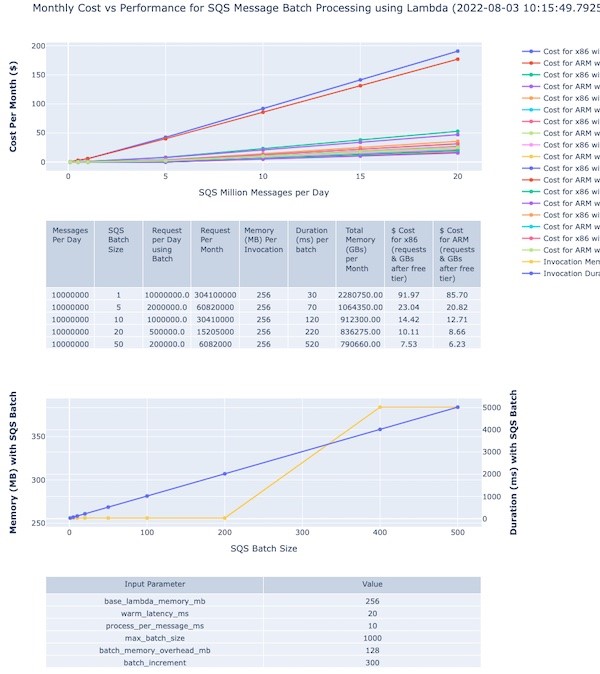
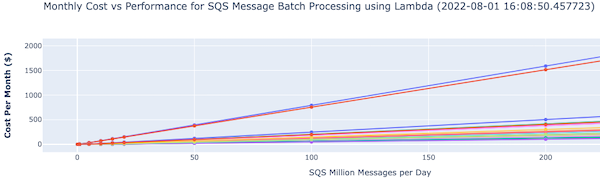
There is an accompanying interactive legend showing cost and batch size. The top section shows a graph of cost versus message volumes versus batch size:
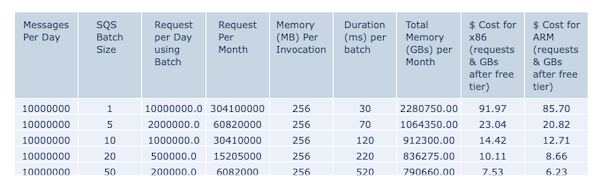
The second section shows the actual cost variation for different batch sizes for 10 million messages:
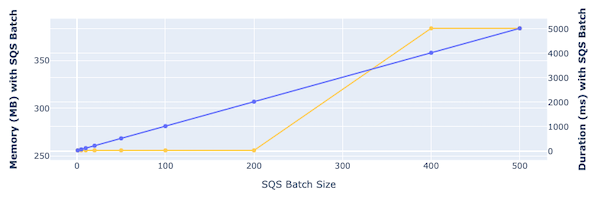
The third section shows the memory and time required to process with different batch sizes:
The various control input parameters used for graph generation are shown at the bottom of the page.
Double-clicking on a specific batch size or line on the right-hand legend displays that specific plot with its pricing details.

You can modify the input parameters with different settings for memory, batch sizes, memory for increased batches and rerun the program to create different cost estimations. You can also export the generated graphs as PNG image files for reference.
Conclusion
You can use Lambda functions to handle fully managed asynchronous processing of SQS messages. Estimating the cost and optimal setup depends on leveraging the various configurations of SQS and Lambda functions. The cost estimator tool presented in this blog should help you understand these configurations and their impact on the overall cost and performance of the Lambda function-based messaging solutions.
For more serverless learning resources, visit Serverless Land.