Post Syndicated from Alex Bocharov original http://blog.cloudflare.com/scalable-machine-learning-at-cloudflare/


In this post, we will take you through the advancements we've made in our machine learning capabilities. We'll describe the technical strategies that have enabled us to expand the number of machine learning features and models, all while substantially reducing the processing time for each HTTP request on our network. Let's begin.
Background
For a comprehensive understanding of our evolved approach, it's important to grasp the context within which our machine learning detections operate. Cloudflare, on average, serves over 46 million HTTP requests per second, surging to more than 63 million requests per second during peak times.
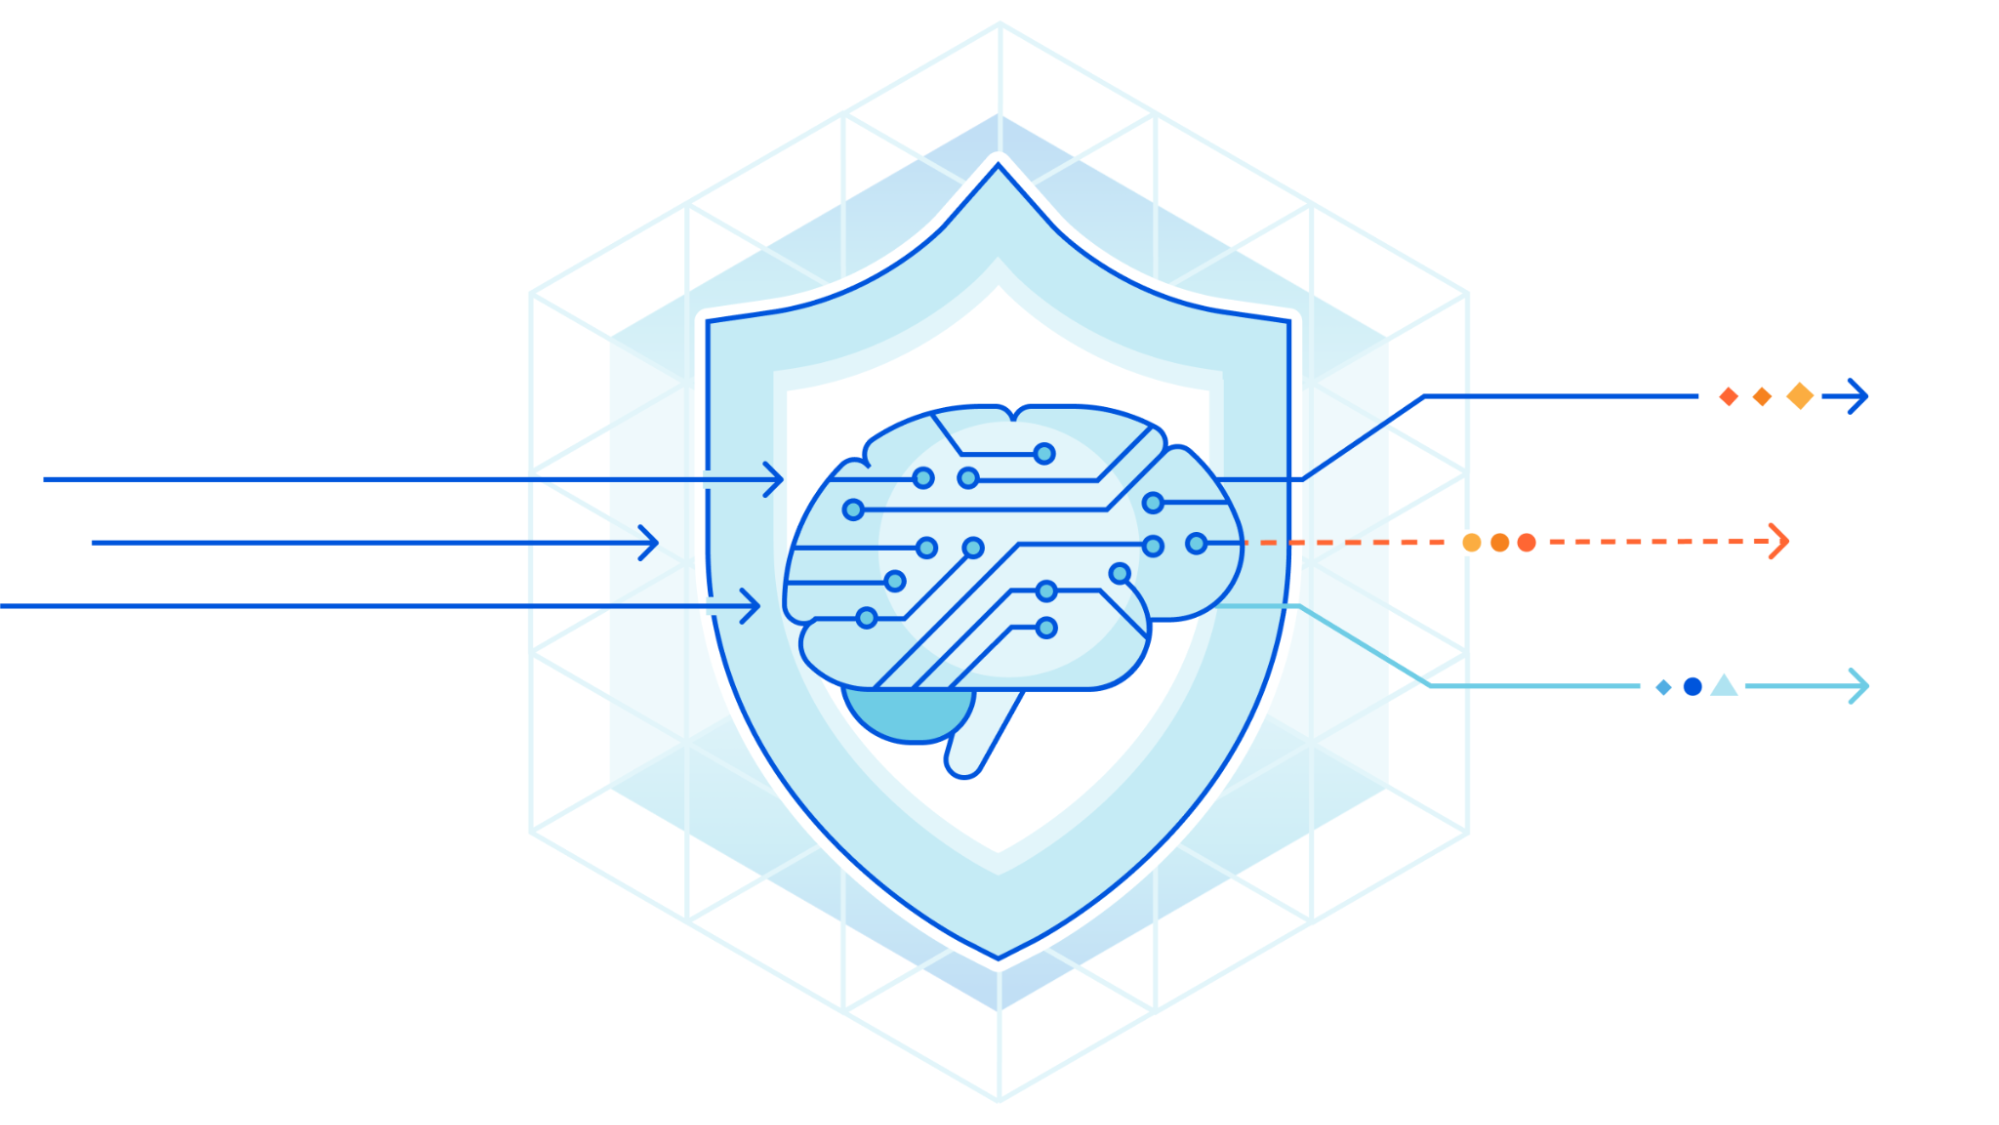
Machine learning detection plays a crucial role in ensuring the security and integrity of this vast network. In fact, it classifies the largest volume of requests among all our detection mechanisms, providing the final Bot Score decision for over 72% of all HTTP requests. Going beyond, we run several machine learning models in shadow mode for every HTTP request.
At the heart of our machine learning infrastructure lies our reliable ally, CatBoost. It enables ultra low-latency model inference and ensures high-quality predictions to detect novel threats such as stopping bots targeting our customers' mobile apps. However, it's worth noting that machine learning model inference is just one component of the overall latency equation. Other critical components include machine learning feature extraction and preparation. In our quest for optimal performance, we've continuously optimized each aspect contributing to the overall latency of our system.
Initially, our machine learning models relied on single-request features, such as presence or value of certain headers. However, given the ease of spoofing these attributes, we evolved our approach. We turned to inter-request features that leverage aggregated information across multiple dimensions of a request in a sliding time window. For example, we now consider factors like the number of unique user agents associated with certain request attributes.
The extraction and preparation of inter-request features were handled by Gagarin, a Go-based feature serving platform we developed. As a request arrived at Cloudflare, we extracted dimension keys from the request attributes. We then looked up the corresponding machine learning features in the multi-layered cache. If the desired machine learning features were not found in the cache, a memcached "get" request was made to Gagarin to fetch those. Then machine learning features were plugged into CatBoost models to produce detections, which were then surfaced to the customers via Firewall and Workers fields and internally through our logging pipeline to ClickHouse. This allowed our data scientists to run further experiments, producing more features and models.
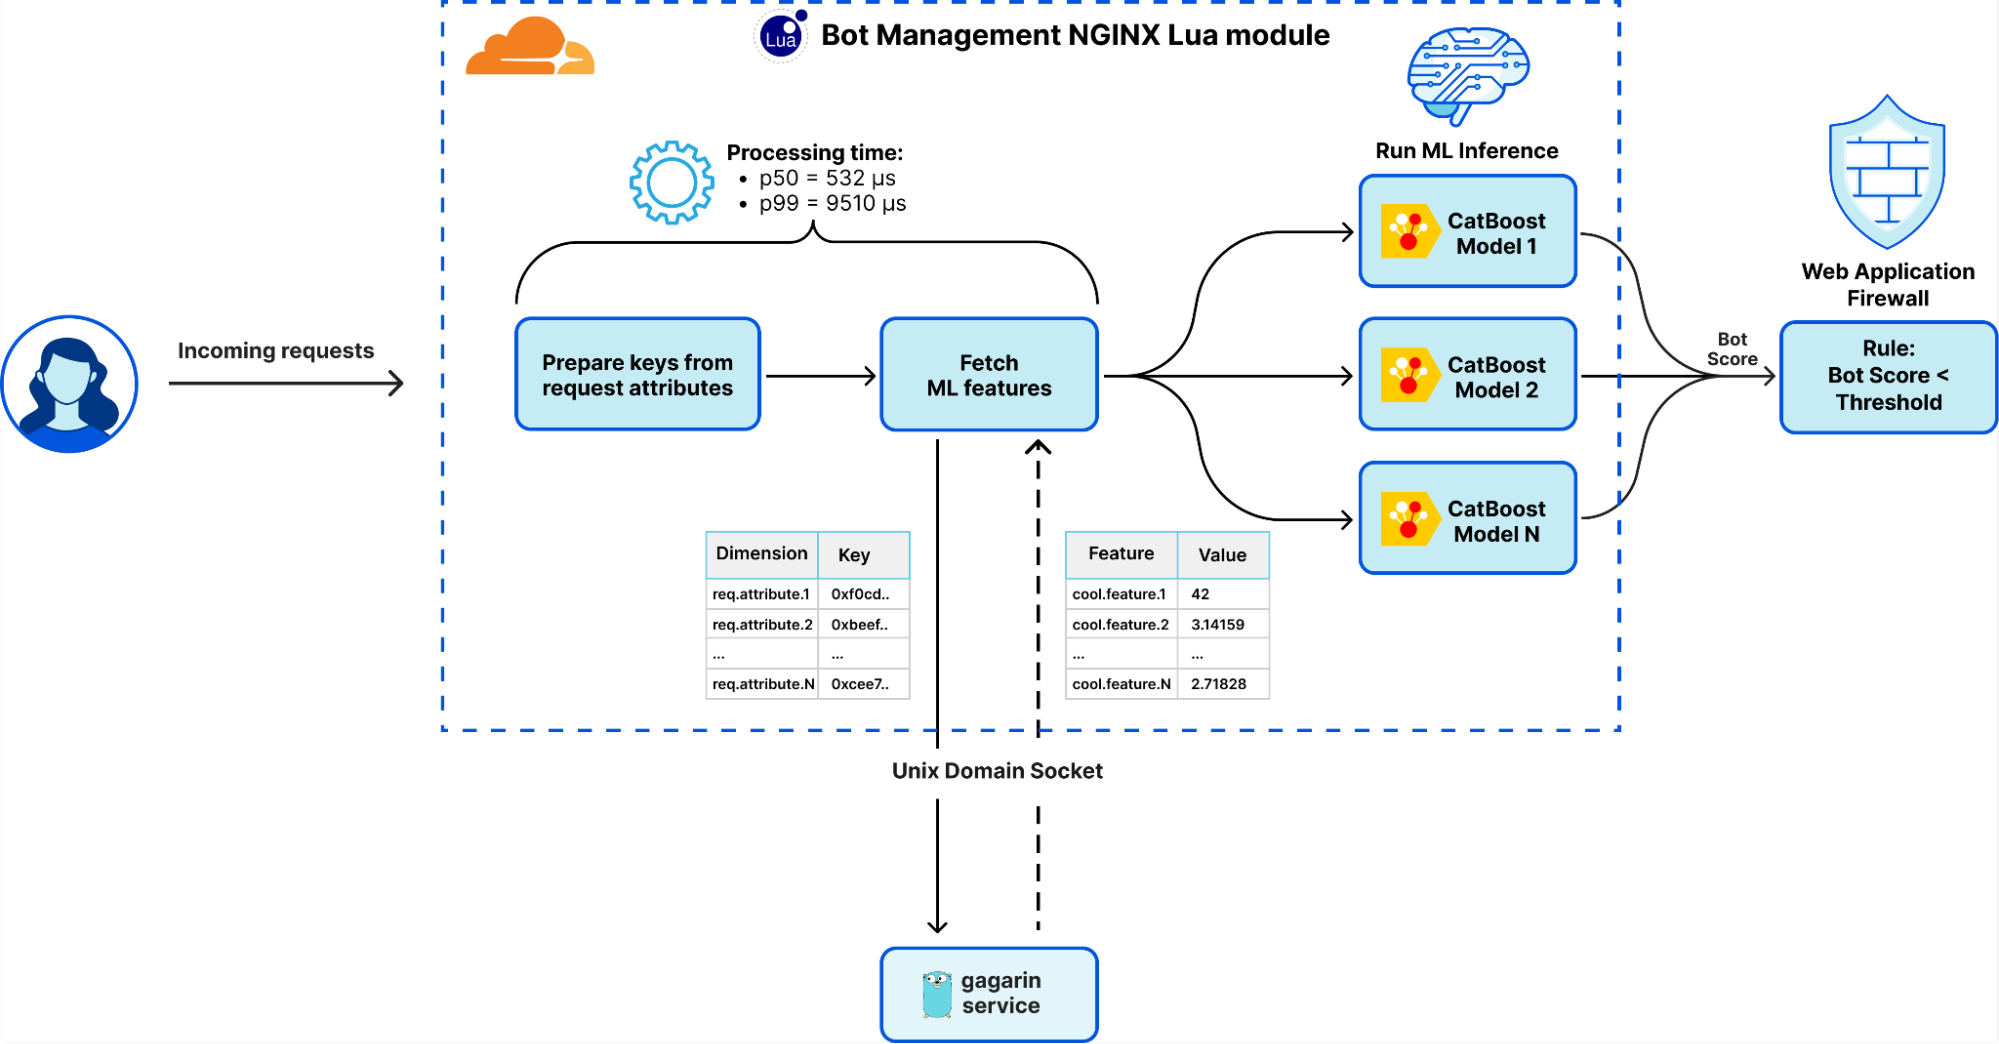
Initially, Gagarin exhibited decent latency, with a median latency around 200 microseconds to serve all machine learning features for given keys. However, as our system evolved and we introduced more features and dimension keys, coupled with increased traffic, the cache hit ratio began to wane. The median latency had increased to 500 microseconds and during peak times, the latency worsened significantly, with the p99 latency soaring to roughly 10 milliseconds. Gagarin underwent extensive low-level tuning, optimization, profiling, and benchmarking. Despite these efforts, we encountered the limits of inter-process communication (IPC) using Unix Domain Socket (UDS), among other challenges, explored below.
Problem definition
In summary, the previous solution had its drawbacks, including:
- High tail latency: during the peak time, a portion of requests experienced increased latency caused by CPU contention on the Unix socket and Lua garbage collector.
- Suboptimal resource utilization: CPU and RAM utilization was not optimized to the full potential, leaving less resources for other services running on the server.
- Machine learning features availability: decreased due to memcached timeouts, which resulted in a higher likelihood of false positives or false negatives for a subset of the requests.
- Scalability constraints: as we added more machine learning features, we approached the scalability limit of our infrastructure.
Equipped with a comprehensive understanding of the challenges and armed with quantifiable metrics, we ventured into the next phase: seeking a more efficient way to fetch and serve machine learning features.
Exploring solutions
In our quest for more efficient methods of fetching and serving machine learning features, we evaluated several alternatives. The key approaches included:
Further optimizing Gagarin: as we pushed our Go-based memcached server to its limits, we encountered a lower bound on latency reductions. This arose from IPC over UDS synchronization overhead and multiple data copies, the serialization/deserialization overheads, as well as the inherent latency of garbage collector and the performance of hashmap lookups in Go.
Considering Quicksilver: we contemplated using Quicksilver, but the volume and update frequency of machine learning features posed capacity concerns and potential negative impacts on other use cases. Moreover, it uses a Unix socket with the memcached protocol, reproducing the same limitations previously encountered.
Increasing multi-layered cache size: we investigated expanding cache size to accommodate tens of millions of dimension keys. However, the associated memory consumption, due to duplication of these keys and their machine learning features across worker threads, rendered this approach untenable.
Sharding the Unix socket: we considered sharding the Unix socket to alleviate contention and improve performance. Despite showing potential, this approach only partially solved the problem and introduced more system complexity.
Switching to RPC: we explored the option of using RPC for communication between our front line server and Gagarin. However, since RPC still requires some form of communication bus (such as TCP, UDP, or UDS), it would not significantly change the performance compared to the memcached protocol over UDS, which was already simple and minimalistic.
After considering these approaches, we shifted our focus towards investigating alternative Inter-Process Communication (IPC) mechanisms.
IPC mechanisms
Adopting a first principles design approach, we questioned: "What is the most efficient low-level method for data transfer between two processes provided by the operating system?" Our goal was to find a solution that would enable the direct serving of machine learning features from memory for corresponding HTTP requests. By eliminating the need to traverse the Unix socket, we aimed to reduce CPU contention, improve latency, and minimize data copying.
To identify the most efficient IPC mechanism, we evaluated various options available within the Linux ecosystem. We used ipc-bench, an open-source benchmarking tool specifically designed for this purpose, to measure the latencies of different IPC methods in our test environment. The measurements were based on sending one million 1,024-byte messages forth and back (i.e., ping pong) between two processes.
| IPC method | Avg duration, μs | Avg throughput, msg/s |
|---|---|---|
| eventfd (bi-directional) | 9.456 | 105,533 |
| TCP sockets | 8.74 | 114,143 |
| Unix domain sockets | 5.609 | 177,573 |
| FIFOs (named pipes) | 5.432 | 183,388 |
| Pipe | 4.733 | 210,369 |
| Message Queue | 4.396 | 226,421 |
| Unix Signals | 2.45 | 404,844 |
| Shared Memory | 0.598 | 1,616,014 |
| Memory-Mapped Files | 0.503 | 1,908,613 |
Based on our evaluation, we found that Unix sockets, while taking care of synchronization, were not the fastest IPC method available. The two fastest IPC mechanisms were shared memory and memory-mapped files. Both approaches offered similar performance, with the former using a specific tmpfs volume in /dev/shm and dedicated system calls, while the latter could be stored in any volume, including tmpfs or HDD/SDD.
Missing ingredients
In light of these findings, we decided to employ memory-mapped files as the IPC mechanism for serving machine learning features. This choice promised reduced latency, decreased CPU contention, and minimal data copying. However, it did not inherently offer data synchronization capabilities like Unix sockets. Unlike Unix sockets, memory-mapped files are simply files in a Linux volume that can be mapped into memory of the process. This sparked several critical questions:
- How could we efficiently fetch an array of hundreds of float features for given dimension keys when dealing with a file?
- How could we ensure safe, concurrent and frequent updates for tens of millions of keys?
- How could we avert the CPU contention previously encountered with Unix sockets?
- How could we effectively support the addition of more dimensions and features in the future?
To address these challenges we needed to further evolve this new approach by adding a few key ingredients to the recipe.
Augmenting the Idea
To realize our vision of memory-mapped files as a method for serving machine learning features, we needed to employ several key strategies, touching upon aspects like data synchronization, data structure, and deserialization.
Wait-free synchronization
When dealing with concurrent data, ensuring safe, concurrent, and frequent updates is paramount. Traditional locks are often not the most efficient solution, especially when dealing with high concurrency environments. Here's a rundown on three different synchronization techniques:
With-lock synchronization: a common approach using mechanisms like mutexes or spinlocks. It ensures only one thread can access the resource at a given time, but can suffer from contention, blocking, and priority inversion, just as evident with Unix sockets.
Lock-free synchronization: this non-blocking approach employs atomic operations to ensure at least one thread always progresses. It eliminates traditional locks but requires careful handling of edge cases and race conditions.
Wait-free synchronization: a more advanced technique that guarantees every thread makes progress and completes its operation without being blocked by other threads. It provides stronger progress guarantees compared to lock-free synchronization, ensuring that each thread completes its operation within a finite number of steps.
| Disjoint Access Parallelism | Starvation Freedom | Finite Execution Time | |
|---|---|---|---|
| With lock | |||
| Lock-free | |||
| Wait-free |
Our wait-free data access pattern draws inspiration from Linux kernel's Read-Copy-Update (RCU) pattern and the Left-Right concurrency control technique. In our solution, we maintain two copies of the data in separate memory-mapped files. Write access to this data is managed by a single writer, with multiple readers able to access the data concurrently.
We store the synchronization state, which coordinates access to these data copies, in a third memory-mapped file, referred to as "state". This file contains an atomic 64-bit integer, which represents an InstanceVersion and a pair of additional atomic 32-bit variables, tracking the number of active readers for each data copy. The InstanceVersion consists of the currently active data file index (1 bit), the data size (39 bits, accommodating data sizes up to 549 GB), and a data checksum (24 bits).
Zero-copy deserialization
To efficiently store and fetch machine learning features, we needed to address the challenge of deserialization latency. Here, zero-copy deserialization provides an answer. This technique reduces the time and memory required to access and use data by directly referencing bytes in the serialized form.
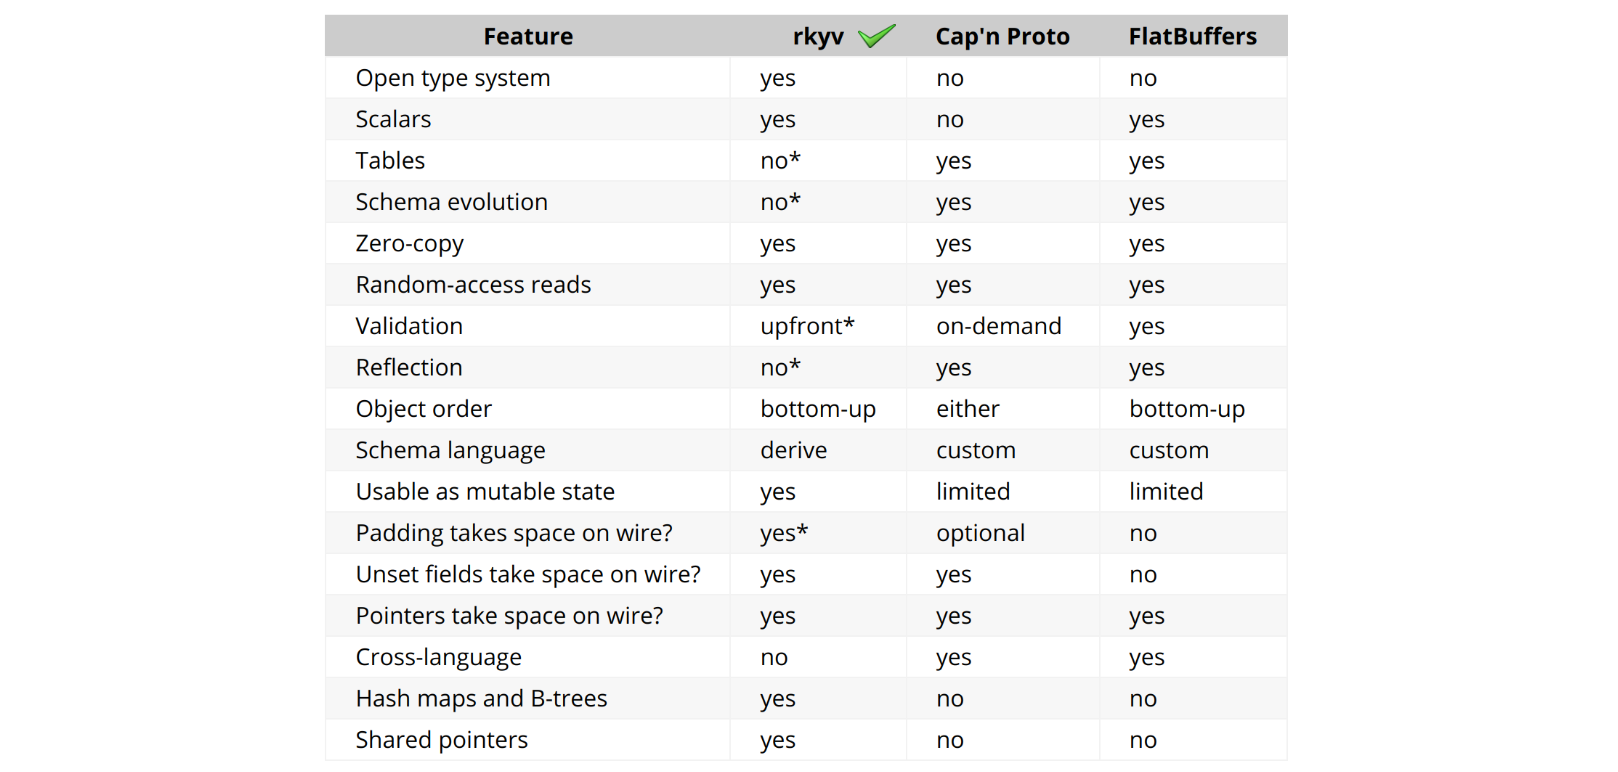
We turned to rkyv, a zero-copy deserialization framework in Rust, to help us with this task. rkyv implements total zero-copy deserialization, meaning no data is copied during deserialization and no work is done to deserialize data. It achieves this by structuring its encoded representation to match the in-memory representation of the source type.
One of the key features of rkyv that our solution relies on is its ability to access HashMap data structures in a zero-copy fashion. This is a unique capability among Rust serialization libraries and one of the main reasons we chose rkyv for our implementation. It also has a vibrant Discord community, eager to offer best-practice advice and accommodate feature requests.
Enter mmap-sync crate
Leveraging the benefits of memory-mapped files, wait-free synchronization and zero-copy deserialization, we've crafted a unique and powerful tool for managing high-performance, concurrent data access between processes. We've packaged these concepts into a Rust crate named mmap-sync, which we're thrilled to open-source for the wider community.
At the core of the mmap-sync package is a structure named Synchronizer. It offers an avenue to read and write any data expressible as a Rust struct. Users simply have to implement or derive a specific Rust trait surrounding struct definition – a task requiring just a single line of code. The Synchronizer presents an elegantly simple interface, equipped with "write" and "read" methods.
impl Synchronizer {
    /// Write a given `entity` into the next available memory mapped file.
    pub fn write<T>(&mut self, entity: &T, grace_duration: Duration) -> Result<(usize, bool), SynchronizerError> {
        …
    }

    /// Reads and returns `entity` struct from mapped memory wrapped in `ReadResult`
    pub fn read<T>(&mut self) -> Result<ReadResult<T>, SynchronizerError> {
        …
    }
}

/// FeaturesMetadata stores features along with their metadata
#[derive(Archive, Deserialize, Serialize, Debug, PartialEq)]
#[archive_attr(derive(CheckBytes))]
pub struct FeaturesMetadata {
    /// Features version
    pub version: u32,
    /// Features creation Unix timestamp
    pub created_at: u32,
    /// Features represented by vector of hash maps
    pub features: Vec<HashMap<u64, Vec<f32>>>,
}
A read operation through the Synchronizer performs zero-copy deserialization and returns a "guarded" Result encapsulating a reference to the Rust struct using RAII design pattern. This operation also increments the atomic counter of active readers using the struct. Once the Result is out of scope, the Synchronizer decrements the number of readers.
The synchronization mechanism used in mmap-sync is not only "lock-free" but also "wait-free". This ensures an upper bound on the number of steps an operation will take before it completes, thus providing a performance guarantee.
The data is stored in shared mapped memory, which allows the Synchronizer to “write” to it and “read” from it concurrently. This design makes mmap-sync a highly efficient and flexible tool for managing shared, concurrent data access.
Now, with an understanding of the underlying mechanics of mmap-sync, let's explore how this package plays a key role in the broader context of our Bot Management platform, particularly within the newly developed components: the bliss service and library.
System design overhaul
Transitioning from a Lua-based module that made memcached requests over Unix socket to Gagarin in Go to fetch machine learning features, our new design represents a significant evolution. This change pivots around the introduction of mmap-sync, our newly developed Rust package, laying the groundwork for a substantial performance upgrade. This development led to a comprehensive system redesign and introduced two new components that form the backbone of our Bots Liquidation Intelligent Security System – or BLISS, in short: the bliss service and the bliss library.
Bliss service
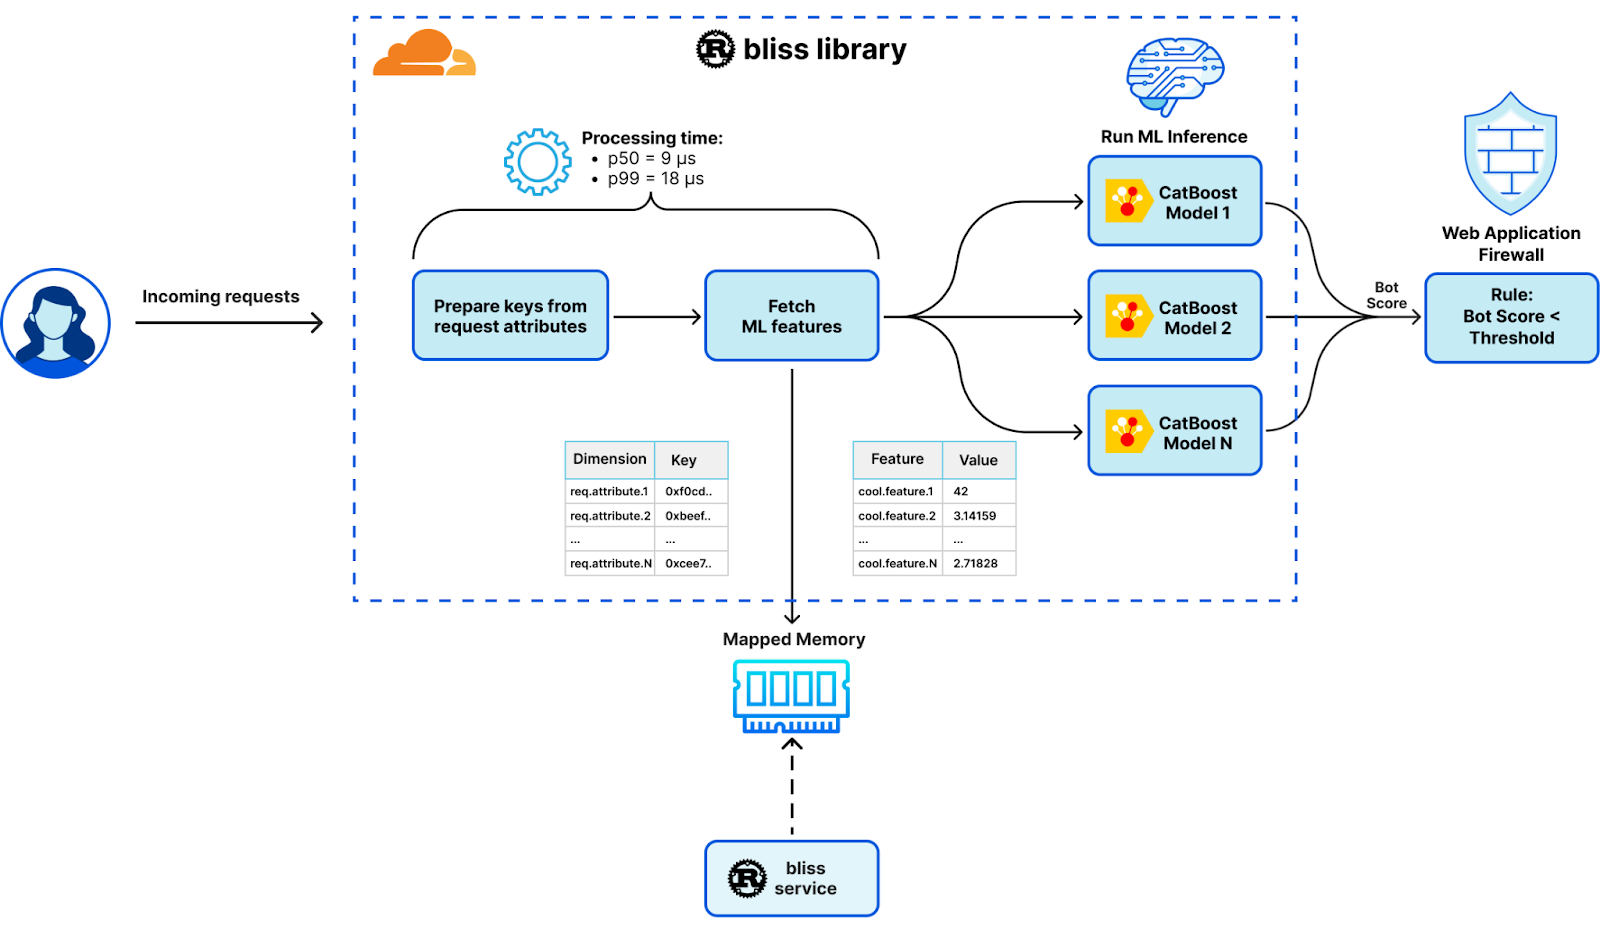
The bliss service operates as a Rust-based, multi-threaded sidecar daemon. It has been designed for optimal batch processing of vast data quantities and extensive I/O operations. Among its key functions, it fetches, parses, and stores machine learning features and dimensions for effortless data access and manipulation. This has been made possible through the incorporation of the Tokio event-driven platform, which allows for efficient, non-blocking I/O operations.
Bliss library
Operating as a single-threaded dynamic library, the bliss library seamlessly integrates into each worker thread using the Foreign Function Interface (FFI) via a Lua module. Optimized for minimal resource usage and ultra-low latency, this lightweight library performs tasks without the need for heavy I/O operations. It efficiently serves machine learning features and generates corresponding detections.
In addition to leveraging the mmap-sync package for efficient machine learning feature access, our new design includes several other performance enhancements:
- Allocations-free operation: bliss library re-uses pre-allocated data structures and performs no heap allocations, only low-cost stack allocations. To enforce our zero-allocation policy, we run integration tests using the dhat heap profiler.
- SIMD optimizations: wherever possible, the bliss library employs vectorized CPU instructions. For instance, AVX2 and SSE4 instruction sets are used to expedite hex-decoding of certain request attributes, enhancing speed by tenfold.
- Compiler tuning: We compile both the bliss service and library with the following flags for superior performance:
[profile.release]
codegen-units = 1
debug = true
lto = "fat"
opt-level = 3
- Benchmarking & profiling: We use Criterion for benchmarking every major feature or component within bliss. Moreover, we are also able to use the Go pprof profiler on Criterion benchmarks to view flame graphs and more:
cargo bench -p integration -- --verbose --profile-time 100

go tool pprof -http=: ./target/criterion/process_benchmark/process/profile/profile.pb
This comprehensive overhaul of our system has not only streamlined our operations but also has been instrumental in enhancing the overall performance of our Bot Management platform. Stay tuned to witness the remarkable changes brought about by this new architecture in the next section.
Rollout results
Our system redesign has brought some truly "blissful" dividends. Above all, our commitment to a seamless user experience and the trust of our customers have guided our innovations. We ensured that the transition to the new design was seamless, maintaining full backward compatibility, with no customer-reported false positives or negatives encountered. This is a testament to the robustness of the new system.
As the old adage goes, the proof of the pudding is in the eating. This couldn't be truer when examining the dramatic latency improvements achieved by the redesign. Our overall processing latency for HTTP requests at Cloudflare improved by an average of 12.5% compared to the previous system.
This improvement is even more significant in the Bot Management module, where latency improved by an average of 55.93%.

More specifically, our machine learning features fetch latency has improved by several orders of magnitude:
| Latency metric | Before (μs) | After (μs) | Change |
|---|---|---|---|
| p50 | 532 | 9 | -98.30% or x59 |
| p99 | 9510 | 18 | -99.81% or x528 |
| p999 | 16000 | 29 | -99.82% or x551 |
To truly grasp this impact, consider this: with Cloudflare’s average rate of 46 million requests per second, a saving of 523 microseconds per request equates to saving over 24,000 days or 65 years of processing time every single day!
In addition to latency improvements, we also reaped other benefits from the rollout:
- Enhanced feature availability: thanks to eliminating Unix socket timeouts, machine learning feature availability is now a robust 100%, resulting in fewer false positives and negatives in detections.
- Improved resource utilization: our system overhaul liberated resources equivalent to thousands of CPU cores and hundreds of gigabytes of RAM – a substantial enhancement of our server fleet's efficiency.
- Code cleanup: another positive spin-off has been in our Lua and Go code. Thousands of lines of less performant and less memory-safe code have been weeded out, reducing technical debt.
- Upscaled machine learning capabilities: last but certainly not least, we've significantly expanded our machine learning features, dimensions, and models. This upgrade empowers our machine learning inference to handle hundreds of machine learning features and dozens of dimensions and models.
Conclusion
In the wake of our redesign, we've constructed a powerful and efficient system that truly embodies the essence of 'bliss'. Harnessing the advantages of memory-mapped files, wait-free synchronization, allocation-free operations, and zero-copy deserialization, we've established a robust infrastructure that maintains peak performance while achieving remarkable reductions in latency. As we navigate towards the future, we're committed to leveraging this platform to further improve our Security machine learning products and cultivate innovative features. Additionally, we're excited to share parts of this technology through an open-sourced Rust package mmap-sync.
As we leap into the future, we are building upon our platform's impressive capabilities, exploring new avenues to amplify the power of machine learning. We are deploying a new machine learning model built on BLISS with select customers. If you are a Bot Management subscriber and want to test the new model, please reach out to your account team.
Separately, we are on the lookout for more Cloudflare customers who want to run their own machine learning models at the edge today. If you’re a developer considering making the switch to Workers for your application, sign up for our Constellation AI closed beta. If you’re a Bot Management customer and looking to run an already trained, lightweight model at the edge, we would love to hear from you. Let's embark on this path to bliss together.


 Jeremy Ber has been working in the telemetry data space for the past 9 years as a Software Engineer, Machine Learning Engineer, and most recently a Data Engineer. At AWS, he is a Streaming Specialist Solutions Architect, supporting both Amazon Managed Streaming for Apache Kafka (Amazon MSK) and AWS’s managed offering for Apache Flink.
 Deepthi Mohan is a Principal Product Manager for Amazon Kinesis Data Analytics, AWS’s managed offering for Apache Flink.
 Gaurav Rele is a Data Scientist at the Amazon ML Solution Lab, where he works with AWS customers across different verticals to accelerate their use of machine learning and AWS Cloud services to solve their business challenges.