Tag Archives: serverless

Introducing new Event Source Mapping (ESM) metrics for AWS Lambda

Post Syndicated from Chris McPeek original https://aws.amazon.com/blogs/compute/introducing-new-event-source-mapping-esm-metrics-for-aws-lambda/

This post is written by Tarun Rai Madan, Principal Product Manager –  Serverless, and Rajesh Kumar Pandey, Principal Software Engineer, Serverless

Today, AWS is announcing new opt-in Amazon CloudWatch metrics for AWS Lambda Event Source Mappings that subscribe to Amazon Simple Queue Service (Amazon SQS), Amazon Kinesis, and Amazon DynamoDB event sources. These metrics include PolledEventCount, InvokedEventCount, FilteredOutEventCount, FailedInvokeEventCount, DeletedEventCount, DroppedEventCount, and OnFailureDestinationDeliveredEventCount. The new metrics enable customers to monitor the processing state of events read by Event Source Mappings (ESMs), and helps them diagnose processing issues.

Previously, customers found it challenging to monitor the processing state of events read by an ESM. An ESM is a resource that polls events from an event source and invokes a Lambda function. With the new metrics for ESMs, you can count events by their processing state, which includes events that were polled, invoked, filtered out, deleted, dropped, failed, or sent to on-failure destination.

Overview

Customers building modern event-driven applications use services like SQS, Kinesis, and DynamoDB as fundamental building blocks for developing decoupled architectures, and use a Lambda function as a consumer to benefit from its simplicity, auto-scaling and cost effectiveness. To subscribe to an event source, customers configure a Lambda Event Source Mapping (ESM). An ESM is a fully-managed Lambda resource that runs an event poller which polls, processes (e.g., filters and batches), and delivers the events to a Lambda function. Due to the processing that happens on an ESM, for example, filtering, batching, and delivery to on-failure destinations, events can end up in varying terminal states. As a result, some polled events may not invoke a Lambda function. Previously, the count of polled, filtered, invoked, deleted or dropped events was not visible to customers. This made it challenging for customers to diagnose processing issues with their ESM, resulting from faulty permissions, misconfiguration, or function errors.

What’s new

With today’s announcement, customers can opt-in to CloudWatch metrics to monitor the processing state of events that are read by an ESM configured with SQS, Kinesis and DynamoDB as event sources.

PolledEventCount metric counts the number of events read by an ESM from the event source.

InvokedEventCount metric counts the number of events that invoked your Lambda function. For an event that experiences function errors, this metric may increase the count multiple times for the same polled event, due to retries.

FilteredOutEventCount metric counts the number of events filtered out by your ESM, based on the Filter Criteria defined by you.

FailedInvokeEventCount metric counts the number of events that attempted to invoke a Lambda function, but encountered partial or complete failure.

DeletedEventCount metric counts the events that have been deleted from the SQS queue by Lambda upon successful processing.

DroppedEventCount metric counts the number of events dropped due to event expiry or exhaustion of retry attempts, for Kinesis and DynamoDB ESMs configured with MaximumRecordAgeInSeconds or MaximumRetryAttempts.

OnFailureDestinationDeliveredEventCount metric counts the events sent to an on-failure destination upon reaching the MaximumRecordAgeInSeconds or MaximumRetryAttempts, for ESMs configured with DestinationConfig.

How to use the new ESM metrics

Once an ESM is created and reaches enabled state, it continuously polls the event source for new events. You can monitor the PolledEventCount metric to catch issues with polling due to misconfigured or deleted event source, misconfigured or deleted Lambda function execution role, incorrect permissions, or throttles from the event source. This metric typically increases when there is an increase in traffic in the event source. You can observe the InvokedEventCount metric to catch issues with the Lambda function, and whether the events are properly invoking your Lambda function. In case of Lambda function errors, InvokedEventCount could be more than PolledEventCount due to retries. This metric would also increase when there is an increase in events processed by an ESM. For ESMs that have filter criteria configured, you can monitor the FilteredOutEventCount to count events that were not sent to a Lambda function because they were filtered out per the defined filter criteria.

You can monitor the FailedInvokeEventCount metric to observe the number of events that failed processing when Lambda service tried to invoke your Lambda function. Invocations can fail due to network configuration issues, incorrect permissions, or a deleted Lambda function, version, or alias. If your event source mapping has partial batch responses enabled, this metric includes any event with a non-empty BatchItemFailures in the response. If all events in a batch are successfully processed by your Lambda function, Lambda service emits a 0 value for this metric. You can use the DeletedEventCount metric to ensure that processed events have been successfully deleted from your SQS queue after being processed by the Lambda function. You can use the DroppedEventCount metric to identify issues with message backlogs or misconfigured event expiry rules. You can use the OnFailureDestinationDeliveredEventCount metric to monitor issues such as failed events caused by Lambda function invocation errors.

The classification for available Lambda ESM metrics by event source is presented below:

CloudWatch metric SQS DynamoDB Kinesis Data Stream
PolledEventCount
InvokedEventCount
FilteredOutEventCount
FailedInvokeEventCount
DeletedEventCount
DroppedEventCount
OnFailureDestinationDeliveredEventCount

Activating and testing the new ESM metrics

You can enable the new ESM metrics using AWS Lambda Console, AWS Command Line Interface (CLI), Lambda ESM API, AWS SDK, AWS CloudFormation, and AWS Serverless Application Model (SAM). The metrics will be published under the AWS/Lambda namespace and EventSourceMappingUUID dimension in the CloudWatch console. To learn more, see CloudWatch metrics for Lambda.

Using AWS CLI

To turn on the new metrics using AWS CLI, use the –metrics-config parameter.

aws lambda create-event-source-mapping \
    --region <region-name> \
    --function-name <function-name> \
    --event-source-arn <event-source-arn> \
    --metrics-config '{"Metrics": ["EventCount"]}'

Using AWS Lambda Console

To turn on the new metrics using AWS Lambda Console, click on “Enable metrics” while adding the trigger for your function.

Enabling ESM metrics in AWS Console.

Figure 1: Enabling ESM metrics in AWS Console

A typical scenario where the new ESM metrics can help with better observability is an ESM that uses event filtering. To test the ESM metrics, you can deploy a sample Lambda application with Kinesis as an event source using this serverless pattern, which uses event filtering with a certain criteria to control which events are sent to Lambda. Use this pattern for both the example scenarios; please follow the setup guidelines for this pattern and continue with testing for the scenarios. Running this sample project in your account may incur charges. See AWS Lambda pricing and Amazon Kinesis pricing.

Configuring Lambda function with Kinesis event source.

Figure 2: Configuring Lambda function with Kinesis event source

Example scenario 1: ESM metrics with event filtering configured

The following diagram shows the results for the test scenario with Kinesis ESM, where the total polled events, filtered events, invoked events, and failed events are represented by PolledEventCount, FilteredOutEventCount, InvokedEventCount and FailedInvokeEventCount.

Image of ESM metrics for scenario 1.

Figure 3: ESM metrics for scenario 1

Example Scenario 2: ESM metrics with event filtering and On-Failure Destination configured

Another common scenario is where you want to have visibility around the number of events delivered to Lambda function, events filtered, and additionally, the count of events routed to on-failure destination upon failure. To test this scenario, follow a setup similar to the one in scenario 1. Create or update the ESM with an on-failure destination, and set MaximumRetryCount to 1, as shown below.

aws lambda update-event-source-mapping \
    --uuid <event-source-mapping-uuid> \
    --maximum-retry-attempts 1 \
    --filter-criteria '{"Filters": [{"Pattern": "{\"data\": { \"tire_pressure\": [ { \"numeric\": [ \"<\", 32 ] } ] } }"}]}' \
    --destination-config '{"OnFailure": {"Destination": "<your_SQS_queue_ARN>"}}' \
    --function-name <lambda-function-name>

Publish a sample payload which matches the FilterCriteria defined above. Also generate sample data with different “tire_pressure” < 32 to match the event and invoke the Lambda function.

Sample Data:

{
    "time": "2021-11-09 13:32:04",
    "fleet_id": "fleet-452",
    "vehicle_id": "a42bb15c-43eb-11ec-81d3-0242ac130003",
    "lat": 47.616226213162406,
    "lon": -122.33989110734133,
    "speed": 43,
    "odometer": 43519,
    "tire_pressure": [41, 40, 31, 41],
    "weather_temp": 76,
    "weather_pressure": 1013,
    "weather_humidity": 66,
    "weather_wind_speed": 8,
    "weather_wind_dir": "ne"
}

Once you have published these records to the stream, you should be able to see the CloudWatch metrics under AWS/Lambda namespace with the EventSourceMappingUUID dimension, as shown below. Note that if an event experiences a function error, InvokedEventCount may increase multiple times for the same polled event due to automatic retries.

Image of ESM metrics for scenario 2.

Figure 4: ESM metrics for scenario 2

Available Now

The new ESM metrics are generally available in all commercial regions that Lambda service is available in. Support is also available through AWS Lambda partners like Datadog, Elastic, and Lumigo. The Lambda service sends these new metrics to CloudWatch at no additional cost to you. However, charges apply for CloudWatch metrics at standard CloudWatch metrics pricing for these opt-in metrics, in addition to your AWS Lambda pricing and event source pricing.

Conclusion

With these new CloudWatch metrics, you can gain visibility into the processing state of your events that are polled by Lambda Event Source Mapping (ESM) for queue-based or stream-based applications. The blog explains the new metrics PolledEventCount, InvokedEventCount, FilteredOutEventCount, FailedInvokeEventCount, DeletedEventCount, DroppedEventCount, and OnFailureDestinationDeliveredEventCount, and how to use them to troubleshoot event processing issues for Lambda functions. These metrics help you track the invocation requests sent to Lambda via an ESM, monitor any delays or issues in processing, and take corrective actions if required. To learn more about these metrics, visit Lambda developer guide.

For more serverless learning resources, visit Serverless Land.

Node.js 22 runtime now available in AWS Lambda

Post Syndicated from Julian Wood original https://aws.amazon.com/blogs/compute/node-js-22-runtime-now-available-in-aws-lambda/

This post is written by Julian Wood, Principal Developer Advocate, and Andrea Amorosi, Senior SA Engineer.

You can now develop AWS Lambda functions using the Node.js 22 runtime, which is in active LTS status and ready for production use. Node.js 22 includes a number of additions to the language, including require()ing ES modules, as well as changes to the runtime implementation and the standard library. With this release, Node.js developers can take advantage of these new features and enhancements when creating serverless applications on Lambda.

You can develop Node.js 22 Lambda functions using the AWS Management ConsoleAWS Command Line Interface (AWS CLI)AWS SDK for JavaScriptAWS Serverless Application Model (AWS SAM)AWS Cloud Development Kit (AWS CDK), and other infrastructure as code tools.

To use this new version, specify a runtime parameter value of nodejs22.x when creating or updating functions or by using the appropriate container base image.

You can use Node.js 22 with Powertools for AWS Lambda (TypeScript), a developer toolkit to implement serverless best practices and increase developer velocity. Powertools for AWS Lambda includes libraries to support common tasks such as observability, AWS Systems Manager Parameter Store integration, idempotency, batch processing, and more. You can also use Node.js 22 with Lambda@Edge to customize low-latency content delivered through Amazon CloudFront.

This blog post highlights important changes to the Node.js runtime, notable Node.js language updates, and how you can use the new Node.js 22 runtime in your serverless applications.

Node.js 22 language updates

Node.js 22 introduces several language updates and features that enhance developer productivity and improve application performance.

This release adds support for loading ECMAScript modules (ESM) using require(). You can enable this feature using the --experimental-require-module flag by configuring the NODE_OPTIONS environment variable. require() support for synchronous ESM graphs bridges the gap between CommonJS and ESM, providing more flexibility in module loading. It is important to note that this feature is currently experimental and may change in future releases.

WebSocket support which was previously available behind the --experimental-websocket flag is now enabled by default in Node.js 22. This brings a browser-compatible WebSocket client implementation to Node.js with no need for external dependencies. Native support simplifies building real-time applications and enhances the overall WebSocket experience in Node.js environments.

The new runtime also includes performance improvements to AbortSignal creation. This makes network operations faster and more efficient for the Fetch API and test runner. The Fetch API is also now considered stable in Node.js 22.

For TypeScript users, Node.js 22 introduces experimental support for transforming TypeScript-only syntax into JavaScript code. By using the --experimental-transform-types flag, you can enable this feature to support TypeScript syntax such as Enum and namespace directly. While you can enable the feature in Lambda, your function entrypoint (i.e. index.mjs or app.cjs) cannot currently be written using TypeScript as the runtime expects a file with a JavaScript extension. You can use TypeScript for any other module imported within your codebase.

For a detailed overview of Node.js 22 language features, see the Node.js 22 release blog post and the Node.js 22 changelog.

Experimental features that are unavailable

Node.js 22 includes an experimental feature to detect the module syntax automatically (CommonJS or ES Modules). This feature must be enabled when the Node.js runtime is compiled. Since the Lambda-provided Node.js 22 runtime is intended for production workloads, this experimental feature is not enabled in the Lambda build and cannot be enabled via an execution-time flag. To use this feature in Lambda, you need to deploy your own Node.js runtime using a custom runtime or container image with experimental module syntax detection enabled.

Performance considerations

At launch, new Lambda runtimes receive less usage than existing established runtimes. This can result in longer cold start times due to reduced cache residency within internal Lambda sub-systems. Cold start times typically improve in the weeks following launch as usage increases. As a result, AWS recommends not drawing conclusions from side-by-side performance comparisons with other Lambda runtimes until the performance has stabilized. Since performance is highly dependent on workload, customers with performance-sensitive workloads should conduct their own testing, instead of relying on generic test benchmarks.

Builders should continue to measure and test function performance and optimize function code and configuration for any impact. To learn more about how to optimize Node.js performance in Lambda, see Performance optimization in the Lambda Operator Guide, and our blog post Optimizing Node.js dependencies in AWS Lambda.

Migration from earlier Node.js runtimes

AWS SDK for JavaScript

Up until Node.js 16, Lambda’s Node.js runtimes included the AWS SDK for JavaScript version 2. This has since been superseded by the AWS SDK for JavaScript version 3, which was released in December 2022. Starting with Node.js 18, and continuing with Node.js 22, the Lambda Node.js runtimes include version 3. When upgrading from Node.js 16 or earlier runtimes and using the included version 2, you must upgrade your code to use the v3 SDK.

For optimal performance, and to have full control over your code dependencies, we recommend bundling and minifying the AWS SDK in your deployment package, rather than using the SDK included in the runtime. For more information, see Optimizing Node.js dependencies in AWS Lambda.

Amazon Linux 2023

The Node.js 22 runtime is based on the provided.al2023 runtime, which is based on the Amazon Linux 2023 minimal container image. The Amazon Linux 2023 minimal image uses microdnf as a package manager, symlinked as dnf. This replaces the yum package manager used in Node.js 18 and earlier AL2-based images. If you deploy your Lambda function as a container image, you must update your Dockerfile to use dnf instead of yum when upgrading to the Node.js 22 base image from Node.js 18 or earlier.

Additionally AL2 includes curl and gnupg2 as their minimal versions curl-minimal and gnupg2-minimal.

Learn more about the provided.al2023 runtime in the blog post Introducing the Amazon Linux 2023 runtime for AWS Lambda and the Amazon Linux 2023 launch blog post.

Using the Node.js 22 runtime in AWS Lambda

AWS Management Console

To use the Node.js 22 runtime to develop your Lambda functions, specify a runtime parameter value Node.js 22.x when creating or updating a function. The Node.js 22 runtime version is now available in the Runtime dropdown on the Create function page in the AWS Lambda console:

Creating Node.js function in AWS Management Console

Creating Node.js function in AWS Management Console

To update an existing Lambda function to Node.js 22, navigate to the function in the Lambda console, then choose Node.js 22.x in the Runtime settings panel. The new version of Node.js is available in the Runtime dropdown:

Changing a function to Node.js 22

Changing a function to Node.js 22

AWS Lambda container image

Change the Node.js base image version by modifying the FROM statement in your Dockerfile.

FROM public.ecr.aws/lambda/nodejs:22
# Copy function code
COPY lambda_handler.xx ${LAMBDA_TASK_ROOT}

AWS Serverless Application Model (AWS SAM)

In AWS SAM, set the Runtime attribute to node22.x to use this version:

AWSTemplateFormatVersion: "2210-09-09"
Transform: AWS::Serverless-2216-10-31

Resources:
  MyFunction:
    Type: AWS::Serverless::Function
    Properties:
      Handler: lambda_function.lambda_handler
      Runtime: nodejs22.x
      CodeUri: my_function/.
      Description: My Node.js Lambda Function

When you add function code directly in an AWS SAM or AWS CloudFormation template as an inline function, it is seen as common.js.

AWS SAM supports generating this template with Node.js 22 for new serverless applications using the sam init command. Refer to the AWS SAM documentation.

AWS Cloud Development Kit (AWS CDK)

In AWS CDK, set the runtime attribute to Runtime.NODEJS_22_X to use this version.

import * as cdk from "aws-cdk-lib";
import * as lambda from "aws-cdk-lib/aws-lambda";
import * as path from "path";
import { Construct } from "constructs";

export class CdkStack extends cdk.Stack {
  constructor(scope: Construct, id: string, props?: cdk.StackProps) {
    super(scope, id, props);

    // The code that defines your stack goes here

    // The Node.js 22 enabled Lambda Function
    const lambdaFunction = new lambda.Function(this, "node22LambdaFunction", {
      runtime: lambda.Runtime.NODEJS_22_X,
      code: lambda.Code.fromAsset(path.join(__dirname, "/../lambda")),
      handler: "index.handler",
    });
  }
}


Conclusion

Lambda now supports Node.js 22 as a managed language runtime. This release uses the Amazon Linux 2023 OS as well as other improvements detailed in this blog post.

You can build and deploy functions using Node.js 22 using the AWS Management Console, AWS CLI, AWS SDK, AWS SAM, AWS CDK, or your choice of infrastructure as code tool. You can also use the Node.js 22 container base image if you prefer to build and deploy your functions using container images.

The Node.js 22 runtime helps developers build more efficient, powerful, and scalable serverless applications. Read about the Node.js programming model in the Lambda documentation to learn more about writing functions in Node.js 22. Try the Node.js runtime in Lambda today.

For more serverless learning resources, visit Serverless Land.

Track performance of serverless applications built using AWS Lambda with Application Signals

Post Syndicated from Veliswa Boya original https://aws.amazon.com/blogs/aws/track-performance-of-serverless-applications-built-using-aws-lambda-with-application-signals/

In November 2023, we announced Amazon CloudWatch Application Signals, an AWS built-in application performance monitoring (APM) solution, to solve the complexity associated with monitoring performance of distributed systems for applications hosted on Amazon EKS, Amazon ECS, and Amazon EC2. Application Signals automatically correlates telemetry across metrics, traces, and logs, to speed up troubleshooting and reduce application disruption. By providing an integrated experience for analyzing performance in the context of your applications, Application Signals gives you improved productivity focusing on the applications that support your most critical business functions.

Today we’re announcing the availability of Application Signals for AWS Lambda to eliminate the complexities of manual setup and performance issues required to assess application health for Lambda functions. With CloudWatch Application Signals for Lambda, you can now collect application golden metrics (the incoming and outgoing volume of requests, latency, faults, and errors).

AWS Lambda abstracts away the complexity of the underlying infrastructure, enabling you to focus on building your application without having to monitor server health. This allows you to shift your focus toward monitoring the performance and health of your applications, which is necessary to operate your applications at peak performance and availability. This requires deep visibility into performance insights such as volume of transactions, latency spikes, availability drops, and errors for your critical business operations and application programming interfaces (APIs).

Previously, you had to spend significant time correlating disjointed logs, metrics, and traces across multiple tools to establish the root cause of anomalies, increasing mean time to recovery (MTTR) and operational costs. Additionally, building your own APM solutions with custom code or manual instrumentation using open source (OSS) libraries was time-consuming, complex, operationally expensive, and often resulted in increased cold start times and deployment challenges when managing large fleets of Lambda functions. Now, you can use Application Signals to seamlessly monitor and troubleshoot health and performance issues in serverless applications, without requiring any manual instrumentation or code changes from your application developers.

How it works
Using the pre-built, standardized dashboards of Application Signals, you can identify the root cause of performance anomalies in just a few clicks by drilling down into performance metrics for critical business operations and APIs. This helps you visualize application topology which shows interactions between the function and its dependencies. In addition, you can define Service Level Objectives (SLOs) on your applications to monitor specific operations that matter most to you. An example of an SLO could be to set a goal that a webpage should render within 2000 ms 99.9 percent of the time in a rolling 28-day interval.

Application Signals auto-instruments your Lambda function using enhanced AWS Distro for OpenTelemetry (ADOT) libraries. This delivers better performance such as lower cold start latency,
memory consumption, and function invocation duration, so you can quickly monitor your applications.

I have an existing Lambda function appsignals1 and I will configure Application Signals in the Lambda Console to collect various telemetry on this application.

In the Configuration tab of the function I select Monitoring and operations tools to enable both the Application signals and the Lambda service traces.

I have an application myAppSignalsApp that has this Lambda function attached as a resource. I’ve defined an SLO for my application to monitor specific operations that matter most to me. I’ve defined a goal that states that the application executes within 10 ms 99.9 percent of the time in a rolling 1-day interval.

It can take 5-10 minutes for Application Signals to discover the function after it’s been invoked. As a result you’ll need to refresh the Services page before you can see the service.

Now I’m in the Services page and I can see a list of all my Lambda functions that have been discovered by Application Signals. Any telemetry that is emitted will be displayed here.

I can then visualize the complete application topology from the Service Map and quickly spot anomalies across my service’s individual operations and dependencies, using the newly collected metrics of volume of requests, latency, faults, and errors. To troubleshoot, I can click into any point in time for any application metric graph to discover correlated traces and logs related to that metric, to quickly identify if issues impacting end users are isolated to an individual task or deployment.

Available now
Amazon CloudWatch Application Signals for Lambda is now generally available and you can start using it today in all AWS Regions where Lambda and Application Signals are available. Today, Application Signals is available for Lambda functions that use Python and Node.js managed runtimes. We’ll continue to add support for other Lambda runtimes in near future.

To learn more, visit the AWS Lambda developer guide and Application Signals developer guide. You can submit your questions to AWS re:Post for Amazon CloudWatch, or through your usual AWS Support contacts.

Veliswa.

Implementing custom domain names for private endpoints with Amazon API Gateway

Post Syndicated from Chris McPeek original https://aws.amazon.com/blogs/compute/implementing-custom-domain-names-for-private-endpoints-with-amazon-api-gateway/

This post is written by Heeki Park, Principal Solutions Architect

Amazon API Gateway is introducing custom domain name support for private REST API endpoints. Customers choose private REST API endpoints when they want endpoints that are only callable from within their Amazon VPC. Custom domain names are simpler and more intuitive URLs that you can use with your applications and were previously only supported with public REST API endpoints. Now you can use custom domain names to map to private REST APIs and share those custom domain names across accounts using AWS Resource Access Manager (AWS RAM).

Overview of API Gateway connectivity

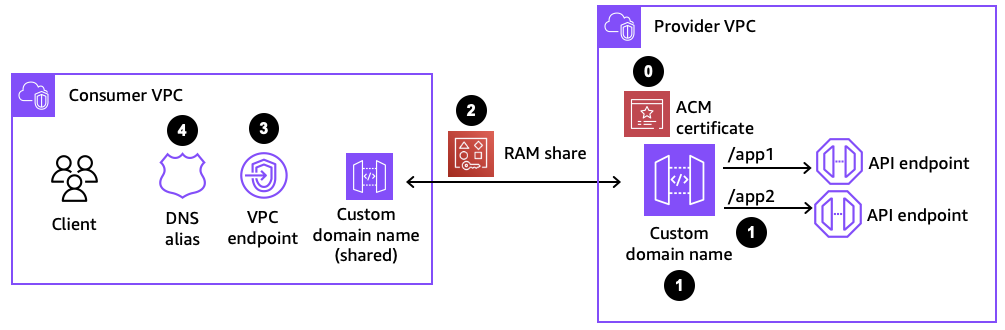
When considering network connectivity with API Gateway, two aspects are important to keep in mind: the integration type and the connectivity type. The following diagram shows examples of those considerations.

Overall architecture diagram showing custom domains for private endpoints.

Figure 1: Overall architecture

The first aspect is the distinction between frontend integrations and backend integrations. Frontend integrations are how API clients like mobile devices, web browsers, or client applications connect to the API endpoint. Backend integrations are the API services to which your API Gateway endpoint proxies requests, like applications running on Amazon Elastic Compute Cloud (EC2) instances, Amazon Elastic Kubernetes Service (EKS) or Amazon Elastic Container Service (ECS) containers, or as AWS Lambda functions. The second aspect is whether that connectivity is via the public internet or via your private VPC.

Calling private REST API endpoints

In order to send requests to a private REST API endpoint, clients must operate within a VPC that is configured with a VPC endpoint. Once a VPC endpoint is configured, a client has three different options within the VPC for connecting to the API endpoint, depending on how the VPC and the VPC endpoint are configured.

If the VPC endpoint has private DNS enabled, the client can send requests to the standard endpoint URL: https://{api-id}.execute-api.{region}.amazonaws.com/{stage}. These requests resolve to the VPC endpoint, which then get routed to the appropriate API Gateway endpoint.

VPC endpoint configured with private DNS names enabled.

Figure 2: VPC endpoint configured with private DNS names enabled

Alternatively, if the VPC endpoint has private DNS disabled, the client can send requests to the VPC endpoint URL: https://{vpce-id}.execute-api.{region}.amazonaws.com/{stage}. One of the following headers also needs to be sent along with that request.

Host: {api-id}.execute-api.us-east-1.amazonaws.com
x-apigw-api-id: {api-id}

Finally, if the VPC endpoint has private DNS disabled and the private REST API endpoint is associated with the VPC endpoint, the client can send requests to the following URL: https://{api-id}-{vpce-id}.execute-api.{region}.amazonaws.com/{stage}. To associate a VPC endpoint with a private API, the following property configures that association.

      EndpointConfiguration:
        Type: PRIVATE
        VPCEndpointIds:
          - !Ref vpcEndpointId

You can see that configuration in the console, as follows.

Optional VPC endpoint configuration with private REST API endpoints.

Figure 3: Optional VPC endpoint configuration with private REST API endpoints

To simplify access to your private REST API endpoints, you can now also configure custom domain names, which functions as a stable vanity URL for your private APIs.

Implementing custom domain names for private endpoints

Before setting up a custom domain name for your private REST API endpoints, a VPC endpoint for API Gateway, an AWS Certificate Manager (ACM) certificate, an Amazon Route 53 private hosted zone, and one or more private REST API endpoints need to be configured.

Once those pre-requisites are set up, a custom domain name can be setup with the following steps:

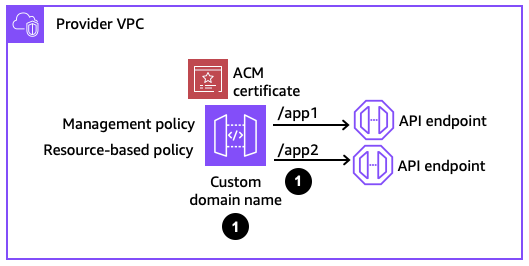
  1. In the API provider account, create a custom domain name and base path mapping.
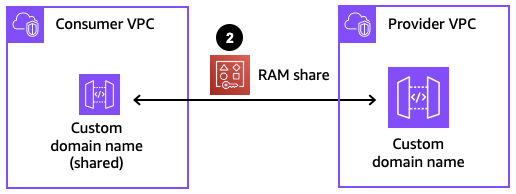
  2. In the provider account, use AWS RAM to create a resource share for the custom domain name. In the consumer account, accept the resource share request. This step is only required if the provider and consumer are in different AWS accounts.
  3. In the consumer account, associate the custom domain name to a VPC endpoint.
  4. In the consumer account, create a Route 53 alias to map the custom domain to the VPC endpoint.

Components for configuring a custom domain name.

Figure 4: Components for configuring a custom domain name

Step 1: Creating a private custom domain name

When configuring a custom domain name, two policies are used to manage permissions to the private custom domain name resource. Management policies specify which principals are allowed to associate a private custom domain name to a VPC endpoint. Resource-based policies specify which API consumers are allowed to invoke your private custom domain name.

Creating a private custom domain name.
Figure 5: Creating a private custom domain name

This is an example CloudFormation definition for a private custom domain name.

  DomainName:
    DependsOn: Certificate
    Type: AWS::ApiGateway::DomainNameV2
    Properties:
      CertificateArn: !Ref certificateArn
      DomainName: api.internal.example.com
      EndpointConfiguration:
        Types:
          - PRIVATE
      ManagementPolicy:
        Fn::ToJsonString:
          Statement:
            - Effect: Allow
              Principal:
                AWS:
                  - '123456789012'
              Action: apigateway:CreateAccessAssociation
              Resource: 'arn:aws:apigateway:us-east-1::/domainnames/*'
      Policy:
        Fn::ToJsonString:
          Statement:
            - Effect: Deny
              Principal: '*'
              Action: execute-api:Inovke
              Resource:
                - execute-api:/*
              Condition:
                StringNotEquals:
                  aws:SourceVpce: !Ref vpceEndpointId
            - Effect: Allow
              Principal:
                AWS:
                  - '123456789012'
              Action: execute-api:Invoke
              Resource:
                - execute-api:/*
      SecurityPolicy: TLS_1_2

In this example, the management policy specifies that the account 123456789012 is allowed to associate a private custom domain name with a VPC endpoint. The resource-based policy then denies any request that does not come from a particular VPC endpoint and only allows invoke requests that come from that same account 123456789012.

The private custom domain name then needs to be mapped to a private REST API.

  Mapping:
    DependsOn: DomainName
    Type: AWS::ApiGateway::BasePathMappingV2
    Properties:
      BasePath: app1
      DomainName: api.internal.example.com
      DomainNameId: abcde12345
      RestApiId: !Ref apiId
      Stage: !Ref stageName

In this example, the BasePath is set to app1. If the Stage is set as dev, then the private endpoint can be accessed via https://api.internal.example.com/app1/dev. The domain id is the identifier for the private custom domain name.

Note that with public custom domain names, the domain name has to be unique in the region, since they are resolved publicly. With private custom domain names, since they are resolved within a VPC, a private custom domain name with the same name can be created in different accounts. The private custom domain name is then resolved to the VPC endpoint in that account’s VPC.

Step 2: Sharing the private custom domain name using AWS RAM

In order for API consumers to access the private custom domain name from another account, the custom domain name needs to be shared with the consumer accounts using RAM. If the API provider and API consumer are in the same account, this step with RAM can be skipped.

Sharing the private custom domain name.
Figure 6: Sharing the private custom domain name

The following CloudFormation definition creates a resource share in the provider account.

  Share:
    Type: AWS::RAM::ResourceShare
    Properties:
      Name: private-custom-domain-name
      Principals: 
        - '123456789012'
      ResourceArns: 
        - 'arn:aws:apigateway:us-east-1::/domainnames/api.internal.example.com+abcde12345'

The allowed Principals for the resource share specifies the consumer account ids. The ResourceArns specify the ARN of the private custom domain name.

In the consumer account, an administrator receives a notification to accept the resource share. This request must be accepted to allow the consumer account to see the private custom domain name. This handshake acts as a mutual agreement between the accounts to allow the private custom domain name to be exposed from the provider account to the consumer account. If the provider and consumer accounts are in the same AWS Organization, the share is automatically accepted on behalf of consumers.

Step 3: Associating the private custom domain name to a VPC endpoint

The private custom domain name is now visible in the consumer account. Next, associate the private custom domain name with a VPC endpoint in the consumer account and in the VPC where the client applications reside.

Associating the private custom domain name to a VPC endpoint.
Figure 7: Associating the private custom domain name to a VPC endpoint

  Association:
    DependsOn: DomainName
    Type: AWS::ApiGateway::DomainNameAccessAssociation
    Properties:
      AccessAssociationSource: vpce-abcdefgh123456789
      AccessAssociationSourceType: VPCE
      DomainNameArn: 'arn:aws:apigateway:us-east-1::/domainnames/api.internal.example.com+abcde12345'

The AccessAssociationSource is the VPC endpoint id, and the DomainNameArn is the same ARN that is used in the RAM resource share.

Step 4: Creating a Route 53 alias for the custom domain name

The final step before being able to test the custom domain name in the consumer account is setting up a Route 53 alias. That alias is configured in a private hosted zone that is associated with the VPC where the VPC endpoint and client applications reside. The alias resolves the fully qualified domain name (FQDN) to the VPC endpoint DNS name.

Creating a Route 53 alias.
Figure 8: Creating a Route 53 alias

The following CloudFormation definition creates that alias.

  Alias:
    Type: AWS::Route53::RecordSet
    Properties:
      HostedZoneId: !Ref privateZoneId
      Name: api.internal.example.com
      ResourceRecords:
        - vpce-abcdefgh123456789-abcd1234.execute-api.us-east-1.vpce.amazonaws.com
      TTL: 300
      Type: CNAME

The ResourceRecords point to the FQDN of the VPC endpoint to which our private custom domain name is associated. Once this alias is created, your client applications can test if it can successfully send requests to the private custom domain name.

Optional: Cleaning up the resources

If you’ve configured a test environment with these resources, you can clean up the deployment by following the steps in reverse order.

  1. In the consumer account, delete the Route 53 alias.
  2. In the consumer account, delete the association.
  3. In both the consumer and provider account, remove the RAM resource share.
  4. In the provider account, delete the custom domain name and base path mapping.

Conclusion

In this post, you learned about how clients can connect to private REST API endpoints with API Gateway. With custom domain names, your applications connect to stable URLs that can forward requests to many different private API backends. Furthermore, your application teams can deploy resources in separate line of business AWS accounts and access the private custom domain name as a central shared resource, using AWS RAM resource sharing. This allows your application teams to build secure, private API applications and expose them to API consumers securely and across multiple AWS accounts.

For more details, refer to the API Gateway documentation and check out patterns with API Gateway on Serverless Land.

Introducing Point in Time queries and SQL/PPL support in Amazon OpenSearch Serverless

Post Syndicated from Jagadish Kumar original https://aws.amazon.com/blogs/big-data/introducing-point-in-time-queries-and-sql-ppl-support-in-amazon-opensearch-serverless/

Today we announced support for three new features for Amazon OpenSearch Serverless: Point in Time (PIT) search, which enables you to maintain stable sorting for deep pagination in the presence of updates, and Piped Processing Language (PPL) and Structured Query Language (SQL), which give you new ways to query your data. Querying with SQL or PPL is useful if you’re already familiar with the language or want to integrate your domain with an application that uses them.

OpenSearch Serverless is a powerful and scalable search and analytics engine that enables you to store, search, and analyze large volumes of data while reducing the burden of manual infrastructure provisioning and scaling as you ingest, analyze, and visualize your time series and search data, simplifying data management and enabling you to derive actionable insights from data. The vector engine for OpenSearch Serverless also makes it easy for you to build modern machine learning (ML) augmented search experiences and generative artificial intelligence (generative AI) applications without needing to manage the underlying vector database infrastructure.

PIT search

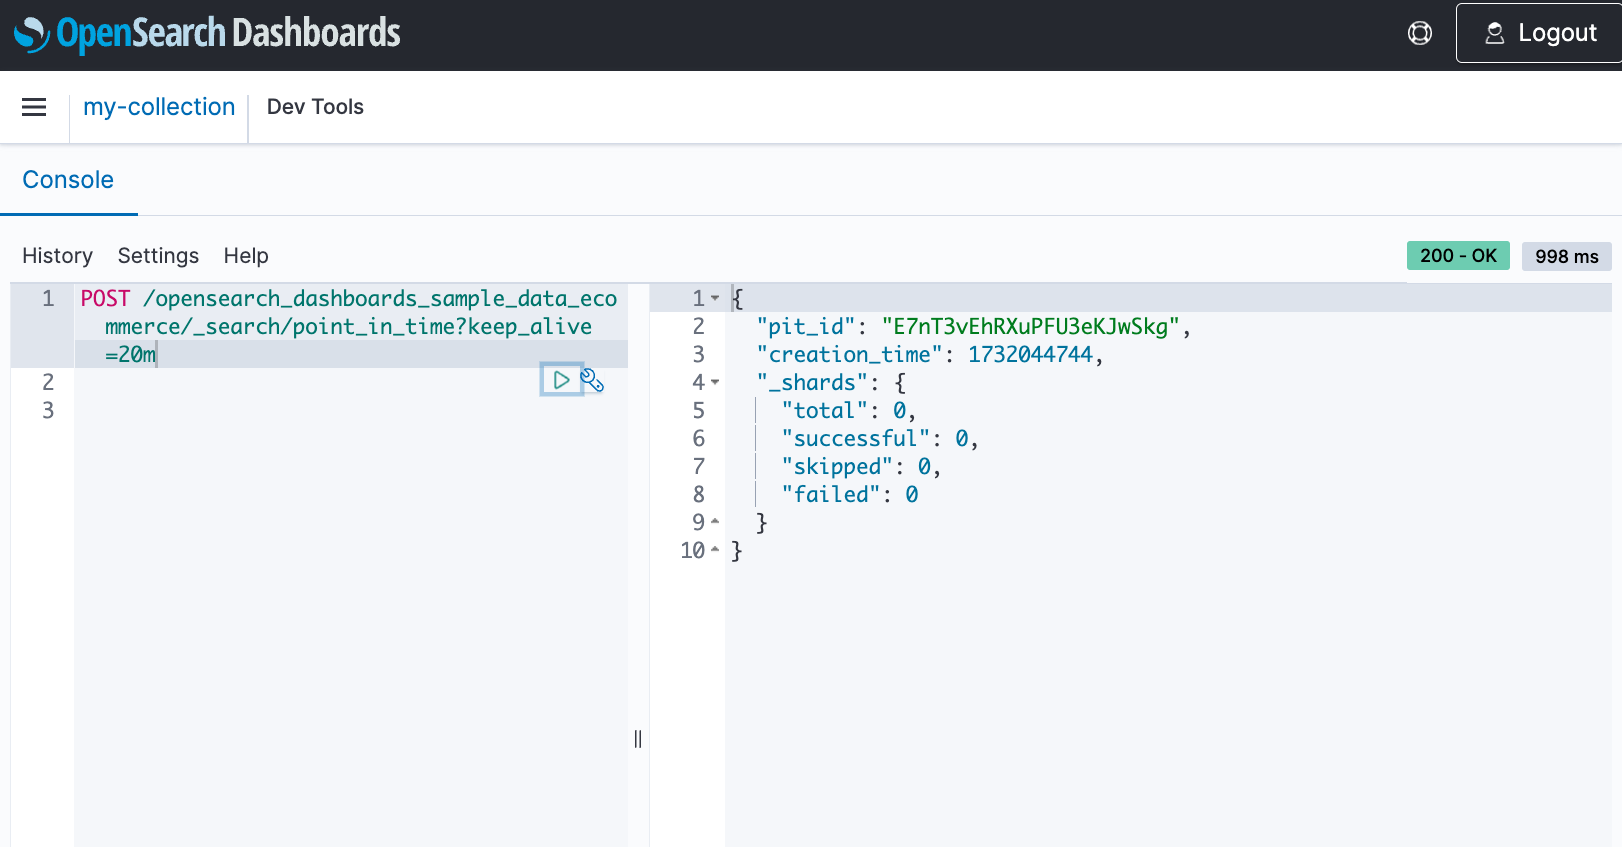
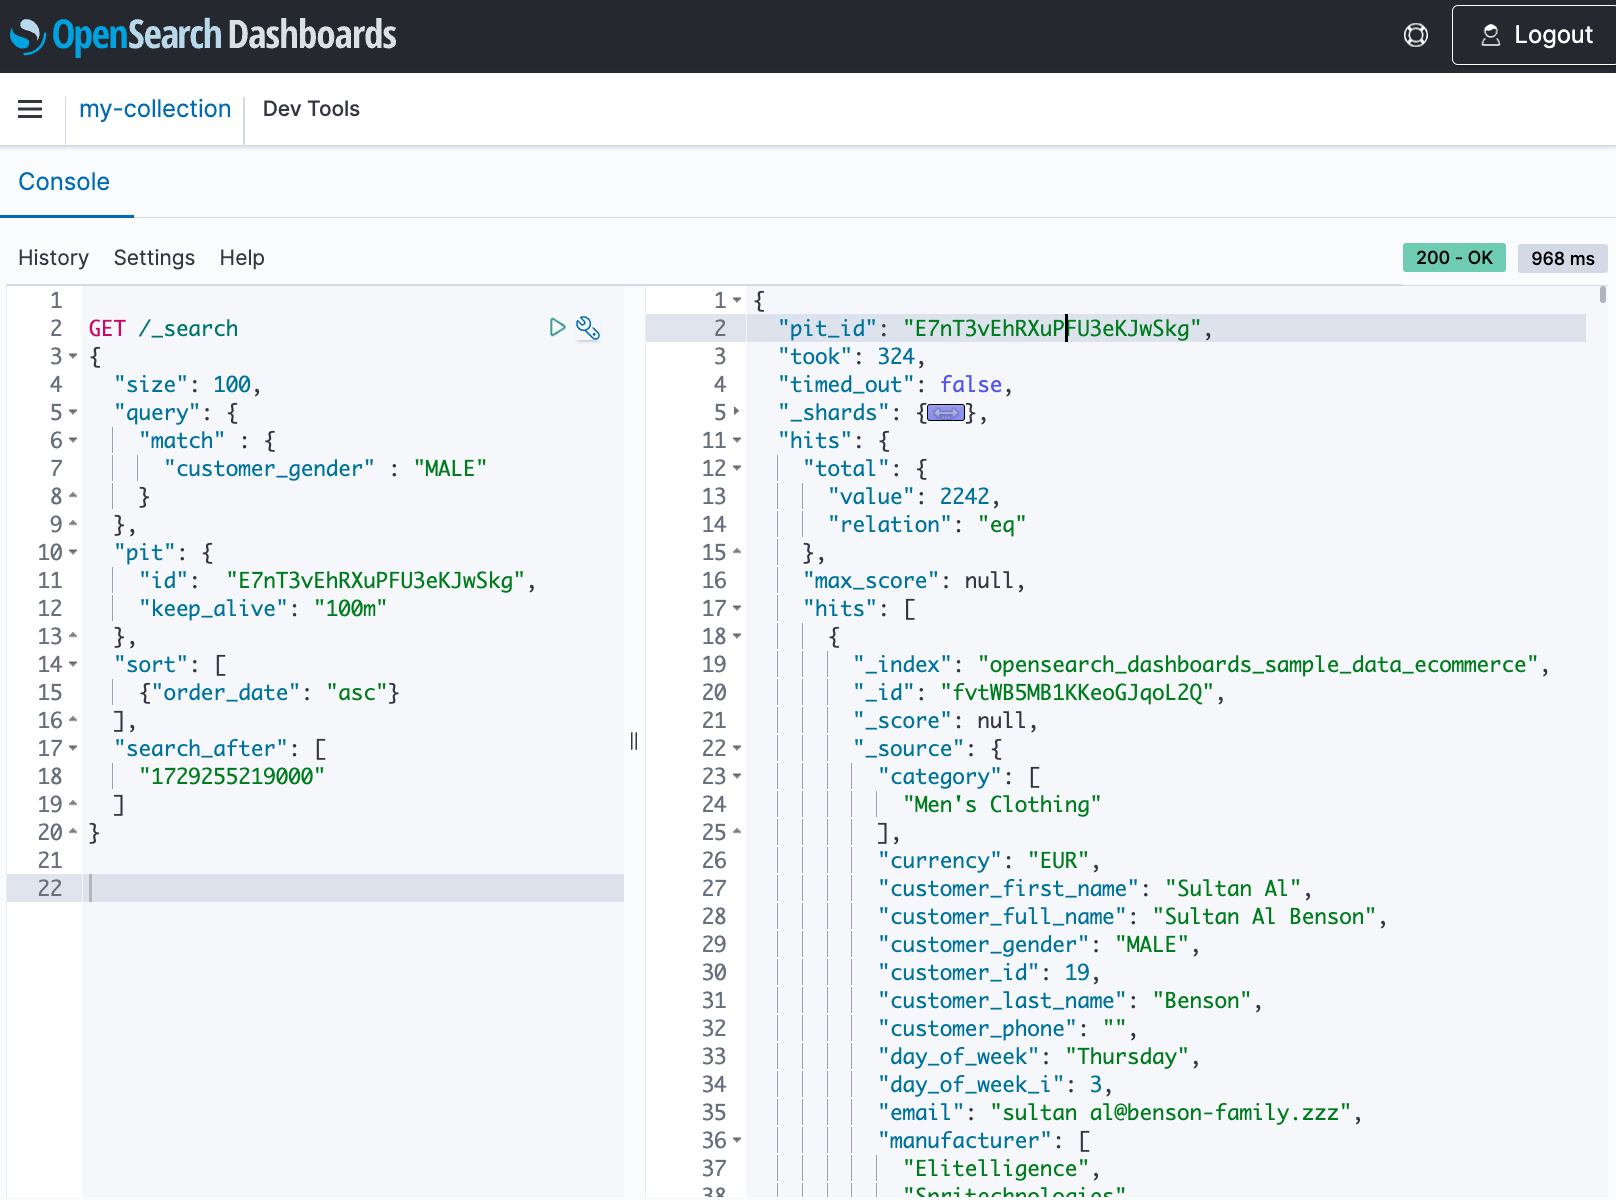
Point in Time (PIT) search lets you run different queries against a dataset that’s fixed in time. Typically, when you run the same query on the same index at different points in time, you receive different results because documents are constantly indexed, updated, and deleted. With PIT, you can query against a state of your dataset for a point in time. Although OpenSearch still supports other ways of paginating results, PIT search provides superior capabilities and performance because it isn’t bound to a query and supports consistent pagination. When you create a PIT for a set of indexes, OpenSearch creates contexts to access data at that point in time and when you use a query with a PIT ID, it searches the contexts that are frozen in time to provide consistent results.

Using PIT involves the following high-level steps:

  1. Create a PIT.
  2. Run search queries with a PIT ID and use the search_after parameter for the next page of results.
  3. Close the PIT.

Create a PIT

When you create a PIT, OpenSearch Serverless provides a PIT ID, which you can use to run multiple queries on the frozen dataset. Even though the indexes continue to ingest data and modify or delete documents, the PIT references the data that hasn’t changed since the PIT creation.

Run a search query with the PIT ID

PIT search isn’t bound to a query, so you can run different queries on the same dataset, which is frozen in time.

When you run a query with a PIT ID, you can use the search_after parameter to retrieve the next page of results. This gives you control over the order of documents in the pages of results.

The following response contains the first 100 documents that match the query. To get the next set of documents, you can run the same query with the last document’s sort values as the search_after parameter, keeping the same sort and pit.id. You can use the optional keep_alive parameter to extend the PIT time.

Close the PIT

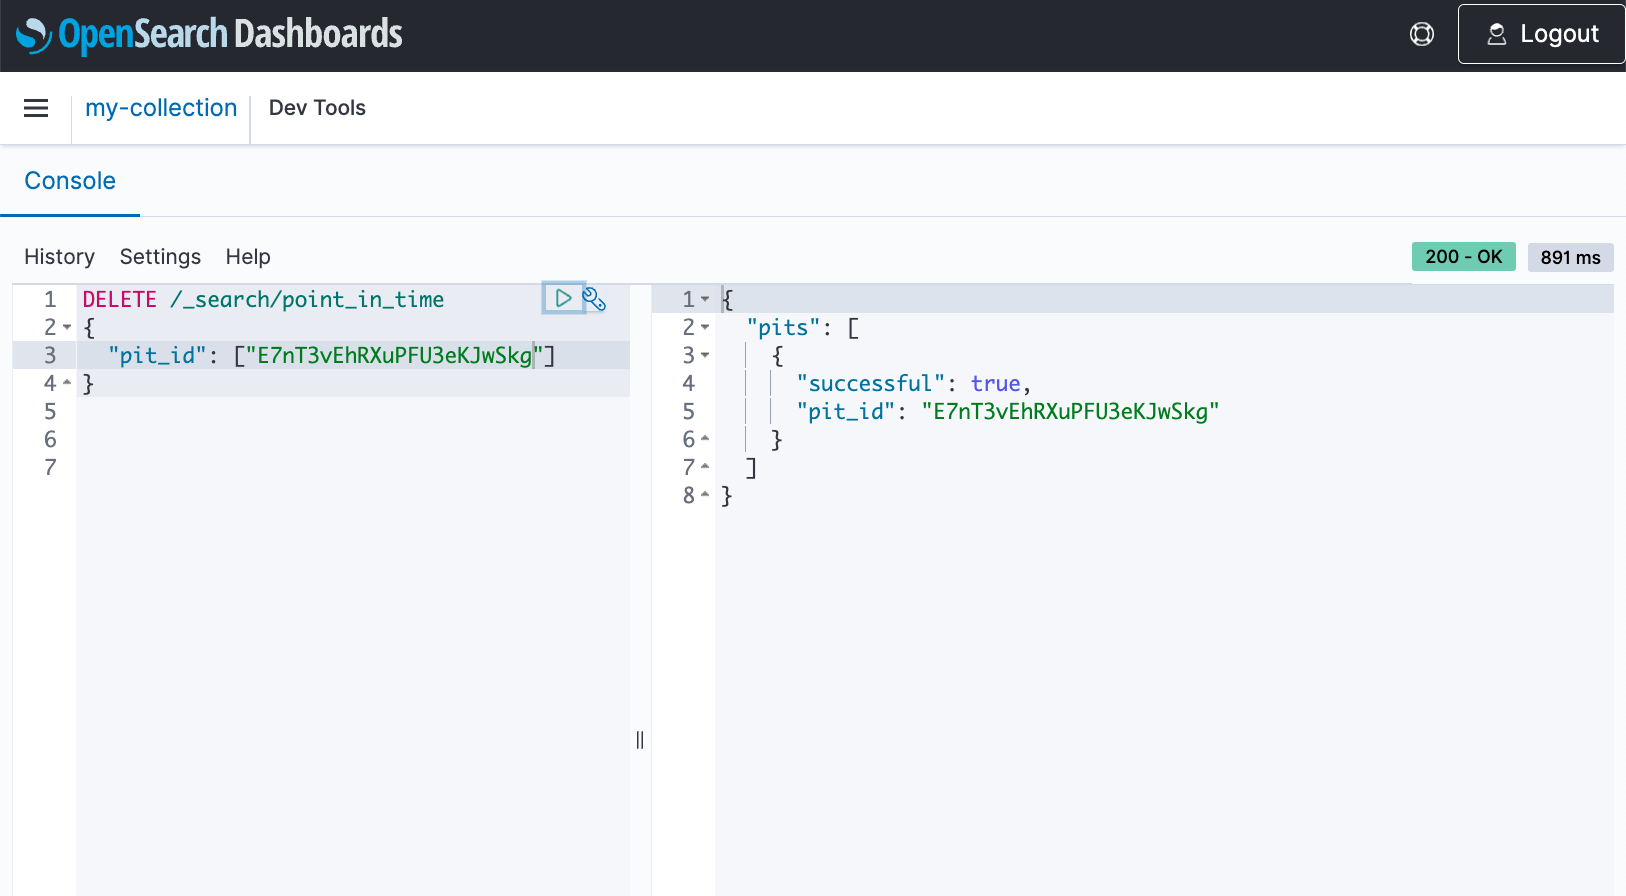
When your queries on the dataset are complete, you can delete the PIT using the DELETE operation. PITs automatically expire after the keep_alive duration.

Considerations and limitations

Keep in mind the following limitations when using this feature:

SQL and PPL support

OpenSearch Serverless provides a primary query interface called query DSL that you can use to search your data. Query DSL is a flexible language with a JSON interface. In addition to DSL, you can now extract insights out of OpenSearch Serverless using the familiar SQL query syntax.

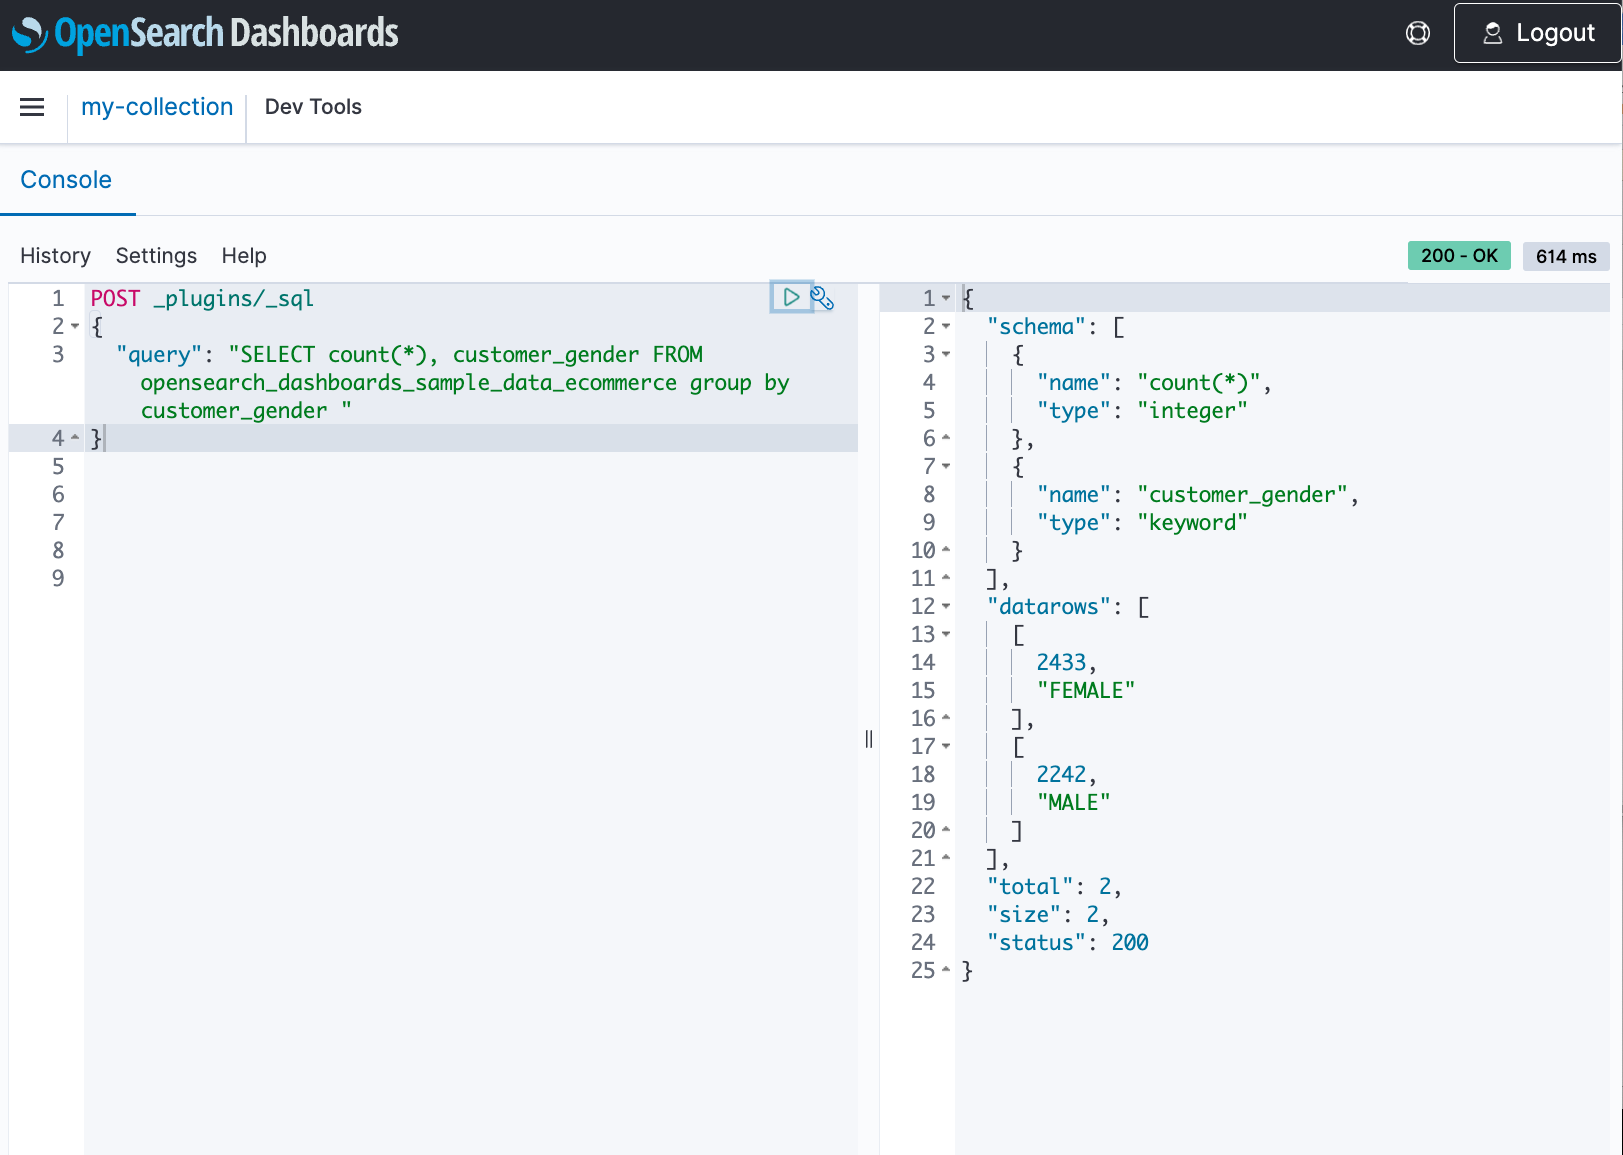
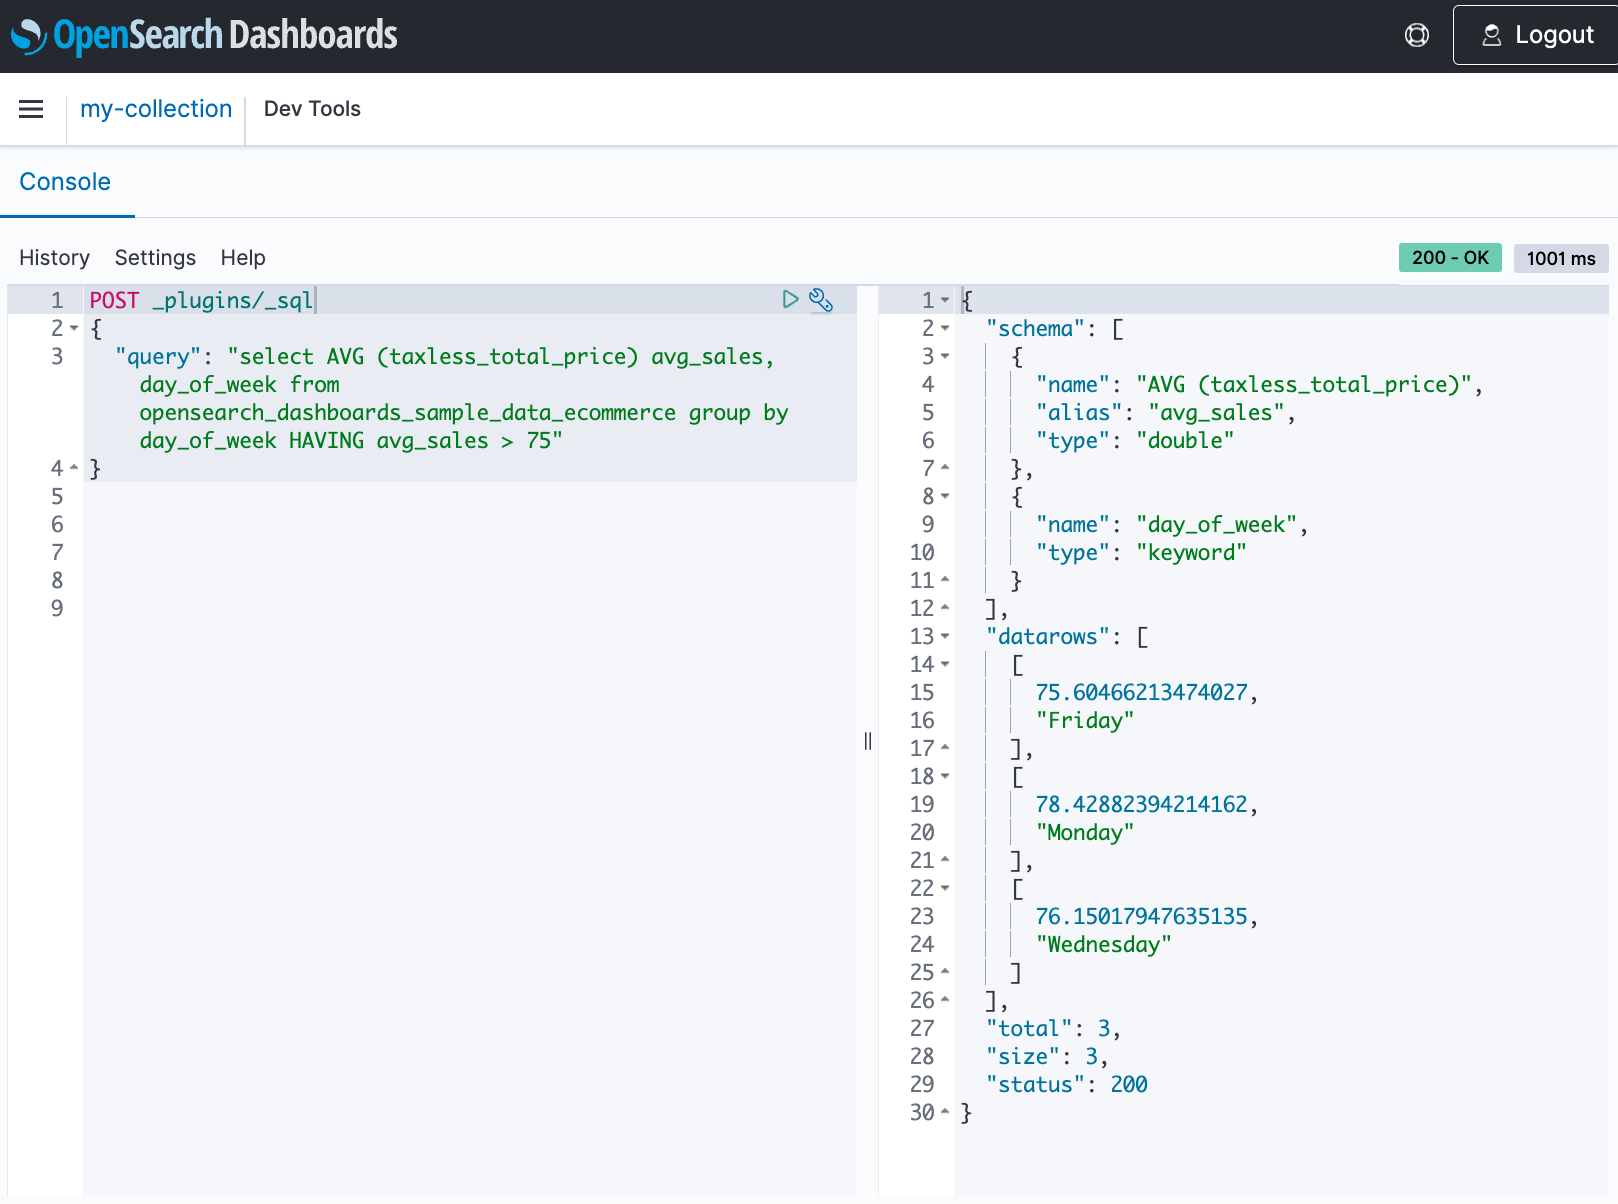
You can use the SQL and PPL API, the /plugins/_sql and /plugins/_ppl endpoints respectively, to search the data. You can use aggregations, group by, and where clauses to investigate your data and read your data as JSON documents or CSV tables, so you have the flexibility to use the format that works best for you. By default, queries return data in JDBC format. You can specify the response format as JDBC, standard OpenSearch JSON, CSV, or raw.

Use the /plugins/_sql endpoint to send SQL queries to the SQL plugin, as shown in the following example.

Besides basic filtering and aggregation, OpenSearch SQL also supports complex queries, such as querying semi-structured data, set operations, sub-queries and limited JOINs. Beyond the standard functions, OpenSearch functions are provided for better analytics and visualization.

For PPL queries, use the /plugins/_ppl endpoint to send queries to the SQL plugin.

Considerations and limitations

Keep in mind the following:

  • Query Workbench is not supported for SQL and PPL queries
  • The SQL and PPL CLI is supported and can be used to issue SQL and PPL queries
  • DELETE statements are not supported
  • SQL plugin data sources are not supported
  • The SQL query stats API is not supported

Summary

In this post, we discussed new features in OpenSearch Serverless. PIT is a useful feature when you need to maintain a consistent view of your data for pagination during search operations. SQL in OpenSearch Service bridges the gap between traditional relational database concepts and the flexibility of OpenSearch’s document-oriented data storage. You can send SQL and PPL queries to the _sql and _ppl endpoints, respectively, and use aggregations, group by, and where clauses to analyze their data.

For more information, refer to :


About the Authors

Jagadish Kumar (Jag) is a Senior Specialist Solutions Architect at AWS focused on Amazon OpenSearch Service. He is deeply passionate about Data Architecture and helps customers build analytics solutions at scale on AWS.

Frank Dattalo is a Software Engineer with Amazon OpenSearch Service. He focuses on the search and plugin experience in Amazon OpenSearch Serverless. He has an extensive background in search, data ingestion, and AI/ML. In his free time, he likes to explore Seattle’s coffee landscape.

Milav Shah is an Engineering Leader with Amazon OpenSearch Service. He focuses on the search experience for OpenSearch customers. He has extensive experience building highly scalable solutions in databases, real-time streaming, and distributed computing. He also possesses functional domain expertise in verticals like Internet of Things, fraud protection, gaming, and ML/AI. In his free time, he likes to ride his bicycle, hike, and play chess.

The serverless attendee’s guide to AWS re:Invent 2024

Post Syndicated from Julian Wood original https://aws.amazon.com/blogs/compute/the-serverless-attendees-guide-to-aws-reinvent-2024/

AWS re:Invent 2024 offers an extensive selection of serverless and application integration content.

AWS re:Invent Banner

AWS re:Invent Banner

For detailed descriptions and schedule, visit the AWS re:Invent Session Catalog.

Join AWS serverless experts and community members at the AWS Modern Apps and Open Source Zone in the AWS Expo Village. This serves as a hub for serverless discussions at re:Invent. While you are there, enjoy a free coffee and learn about serverless architectures at the Serverlesspresso booth. There are two this year, another one at the Certificate Lounge. The AWS Expo Village also includes Serverless and Serverless Containers booths.

Don’t have a ticket yet? Join us in Las Vegas from November 28-December 2, 2022 by registering for re:Invent 2024.

This guide organizes the sessions into categories to help you find the content this is most relevant to you.

Session Types

  • Breakout Sessions are lecture-style presentations covering architecture, best practices, and deep dives into AWS services.
  • Workshops are 2-hour hands-on sessions where you work through tasks in AWS accounts using AWS services. Laptops are required and AWS credits are provided.
  • Chalk Talks are highly interactive 60-minute sessions with smaller audiences, focused on technical deep dives with whiteboards for architectural discussions.
  • Builders’ Sessions are 60-minute small-group sessions led by an AWS expert who guides you through a technical problem using AWS services.
  • Code Talks are 60-minute live coding sessions where AWS experts show how to build solutions using AWS services.

Leadership session: Nick Coult, Usman Khalid, Kathleen deValk

  • SVS211: Celebrating 10 years of pioneering serverless and containers – Breakout.
    • Explore how serverless has evolved to help organizations drive the highest performance, availability, and security at low costs.

Getting started sessions

Are you new to serverless or taking your first steps? Hear from AWS experts and customers on best practices and strategies for building serverless workloads. Get hands-on with services by attending a workshop or builders session. Create the next great “to do” app or add a new customer experience for a theme park.

  • SVS202: Thinking serverless – Chalk Talk
    • Learn how to approach building solutions with a serverless mindset by breaking down business problems into serverless building blocks.
  • SVS205: Building a serverless web application for a theme park – Workshop
    • Learn how to build a complete serverless web application for a theme park called Innovator Island.
  • SVS201: Getting started with serverless patterns – Workshop
    • Learn how to recognize and apply common serverless patterns by building production-ready code for a serverless application.
  • SVS204: Write less code: Building applications with a serverless mindset – Builders Session
    • Get more value by using built-in integrations between AWS services through configuration rather than writing glue code.
  • SVS207: Effectively model costs for your serverless applications – Chalk Talk
    • Gain insights into modeling the cost of serverless applications on AWS by considering request loads, payload sizes, and service pricing.
  • API201: The AWS Step Functions workshop – Workshop
    • Learn about the features of AWS Step Functions through hands-on interactive modules.
  • API204: Building event-driven architectures – Workshop
    • Learn about the basics of event-driven design using examples involving Amazon SNS, Amazon SQS, AWS Lambda, Amazon EventBridge, and more.
  • API205: Unlock the power of an exceptional serverless developer experience – Code Talk
    • Learn how to accelerate your serverless development with AWS tools, including Amazon Q Developer integrated into IDEs.
  • SEG209: Getting started building serverless SaaS architectures
    • Discover how to build your first serverless application, and learn how to handle multi-tenant architectures for SaaS applications.

Understanding serverless architectures

  • SVS208: Balance consistency and developer freedom with platform engineering – Breakout
    • Learn how platform teams can provide opinionated security, cost, observability, reliability, and sustainability patterns while maintaining developer flexibility.
  • SVS209: Containers or serverless functions: A path for cloud-native success – Breakout
    • Explore the fundamental differences between containers and serverless functions through real-world scenarios and insights into choosing the right approach.
  • OPN301: Level up your serverless applications with Powertools for AWS Lambda – Workshop
    • Learn why Powertools for AWS Lambda can be the developer toolkit of choice for serverless workloads.
  • DEV341: From single to multi-tenant: Scaling a mission-critical serverless app
    • Explore how to transition a mission-critical application from a single-tenant to a multi-tenant architecture
  • DEV337: Zero to production serverless in 8 weeks
    • Hear about a real-world project journey, from concept to production in only eight weeks. Expect practical insights, mistakes, tips, and how using the right technologies and development process can deliver results fast.

Building event-driven applications

  • API204: Building event-driven architectures – Workshop
    • Learn about the basics of event-driven design using examples involving Amazon SNS, Amazon SQS, AWS Lambda, Amazon EventBridge, and more.
  • API206: How event-driven architectures can go wrong and how to fix them – Chalk Talk
    • Explore common event-driven pitfalls including YOLO events, god events, observability soup, event loops, and surprise bills.
  • DEV321: Choosing the right serverless compute services
    • Learn when to use AWS serverless compute services like AWS Lambda and Amazon ECS on AWS Fargate and how to integrate them into your application architectures.
  • API307: Event-driven architectures at scale: Manage millions of events – Breakout
    • Discover proven patterns for building high-scale event-driven systems that can be effectively managed across a distributed organization with Amazon EventBridge.
  • SVS206: Building an event sourcing system using AWS serverless technologies – Chalk Talk
    • Explore strategies for building effective event sourcing architectures using AWS serverless technologies to store application state as an append-only event log.
  • COP408: Coding for serverless observability
    • Join this code talk to learn best practices for collecting signals from your serverless applications. Dive deep into techniques to effectively instrument your applications to provide you with optimal observability.

Incorporating orchestration

  • API201: The AWS Step Functions workshop – Workshop
    • Learn about the features of AWS Step Functions through hands-on interactive modules.
  • API203: Building common orchestrated workflows with AWS Step Functions – Builders Session
    • Build three orchestrated workflows, including streamlined data processing with Distributed Map state, external system integration using callback, and implementing the saga pattern.
  • API207: Optimize data processing with built-in AWS Step Functions features – Chalk Talk
    • Learn to optimize your serverless data processing workflows at scale using AWS Step Functions features, including intrinsic functions and Distributed Map state.
  • API402: Building advanced workflows with AWS Step Functions – Breakout
    • Learn how you can use generative AI to generate state machines automatically from textual descriptions and chat with your workflow to optimize it.

Understanding integration patterns

  • API208: Building an integration strategy for the future – Breakout
    • Boost productivity and create better customer experiences by building a modern integration strategy using AWS application, data, and file integration services.
  • API306: Integration patterns for distributed systems – Breakout
    • Learn about common design trade-offs for distributed systems and how to navigate them with design patterns, illustrated with real-world examples.
  • API311: Application integration for platform builders – Breakout
    • Explore the implementation of application integration using serverless components in enterprise environments.

Building APIs and frontends

  • SVS203: Create your first API from scratch with OpenAPI and Amazon API Gateway – Builders Session
    • Learn how to design and provision complete APIs using infrastructure as code following the OpenAPI specification.
  • API303: Building modern API architectures: Which front door should I use? – Chalk Talk
    • Explore options for building modern APIs including REST, GraphQL, and real-time APIs along with their benefits and drawbacks.
  • API304: Building rate-limited solutions on AWS – Chalk Talk
    • Learn some of the best ways to build rate limiting into your systems for improved reliability.
  • API305: Asynchronous frontends: Building seamless event-driven experiences – Breakout
    • Explore patterns to enable asynchronous, event-driven integrations with the frontend designed for architects and frontend, backend, and full-stack engineers.

Diving deep into advanced topics

  • SVS401: Best practices for serverless developers – Breakout
    • Discover architectural best practices, optimizations, and useful shortcuts for building production-ready serverless workloads.
  • SVS403: From serverful to serverless Java – Workshop
    • Learn how to bring your traditional Java Spring application to AWS Lambda with minimal effort and iteratively apply optimizations.
  • SVS406: Scale streaming workloads with AWS Lambda – Chalk Talk
    • Learn how to implement parallel processing techniques for ordered and unordered use cases to address throughput limitations in streaming data processing.

Processing data

  • SVS404: Building serverless distributed data processing workloads – Workshop
    • Learn how serverless technologies like AWS Step Functions and AWS Lambda can help you simplify management and scaling of distributed data processing.
  • API401: Multi-tenant Amazon SQS queues: Mitigating noisy neighbors – Chalk Talk
    • Explore advanced strategies for managing multi-tenant Amazon SQS queues and effective mitigation techniques, including shuffle sharding and overflow queues.
  • SVS321: AWS Lambda and Apache Kafka for real-time data processing applications – Breakout
    • Gain practical insights into building scalable, serverless data processing applications by integrating AWS Lambda with Apache Kafka.

Incorporating generative AI

  • API209: Generative AI at scale: Serverless workflows for enterprise-ready apps – Workshop
    • Learn to build enterprise-ready, scalable generative AI applications that can scale from serving 100 to 100,000 users.
  • API310: Build a meeting summarization solution with generative AI & serverless – Code Talk
    • See live coding of a serverless application for producing meeting summaries with generative AI using Amazon Transcribe and Amazon Bedrock, orchestrated with AWS Step Functions.
  • SVS319: Unlock the power of generative AI with AWS Serverless – Breakout
    • Learn to harness AWS Serverless to build robust, cost-effective generative AI applications. Explore using AWS Step Functions to orchestrate complex AI workflows.
  • SVS325: Secure access to enterprise generative AI with serverless AI gateway – Chalk Talk
    • Explore how to architect a serverless AI gateway on AWS to securely integrate and consume large language models from multiple providers.

Additional resources

For social activities see the Unofficial list of AWS re:Invent Conference and Vendor Parties.

If you are attending re:Invent, connect at our AWS Modern Apps and Open Source Zone in the AWS Expo Village. The AWS Expo Village also includes Serverless and Serverless Containers booths.

If you can not join us in-person, breakout sessions will be available via our YouTube channel after the event.

We look forward to seeing you at re:Invent 2024! For more serverless learning resources, visit Serverless Land.

Python 3.13 runtime now available in AWS Lambda

Post Syndicated from Julian Wood original https://aws.amazon.com/blogs/compute/python-3-13-runtime-now-available-in-aws-lambda/

This post is written by Julian Wood, Principal Developer Advocate, and Leandro Cavalcante Damascena, Senior Solutions Architect Engineer.

AWS Lambda now supports Python 3.13 as both a managed runtime and container base image. Python is a popular language for building serverless applications. The Python 3.13 release includes a number of changes to the language, the implementation, and the standard library. With this release, Python developers can now take advantage of these new features and enhancements when creating serverless applications on Lambda. Python 3.13 also includes experimental support for a number of features, which are not available in Lambda.

You can develop Lambda functions in Python 3.13 using the AWS Management ConsoleAWS Command Line Interface (AWS CLI)AWS SDK for Python (Boto3)AWS Serverless Application Model (AWS SAM)AWS Cloud Development Kit (AWS CDK), and other infrastructure as code tools.

The Python 3.13 runtime allows you to implement serverless best practices using Powertools for AWS Lambda (Python). This is a developer toolkit that includes observability, batch processing, AWS Systems Manager Parameter Store integration, idempotency, feature flags, Amazon CloudWatch Metrics, structured logging, and more.

Lambda@Edge allows you to use Python 3.13 to customize low-latency content delivered through Amazon CloudFront.

Lambda runtime changes

Amazon Linux 2023

As with the Python 3.12 runtime, the Python 3.13 runtime is based on the provided.al2023 runtime, which is based on the Amazon Linux 2023 minimal container image. The Amazon Linux 2023 minimal image uses microdnf as a package manager, symlinked as dnf. This replaces the yum package manager used in Python 3.11 and earlier AL2-based images. If you deploy your Lambda functions as container images, you must update your Dockerfiles to use dnf instead of yum when upgrading to the Python 3.13 base image from Python 3.11 or earlier base images.

Learn more about the provided.al2023 runtime in the blog post Introducing the Amazon Linux 2023 runtime for AWS Lambda and the Amazon Linux 2023 launch blog post.

New Python features

Data model improvements

There are improvements to the Python data model. __static_attributes__ stores the names of attributes accessed through self.X in any function in a class body.

Typing changes

With the implementation of PEP 702, you can now use the new warnings.deprecated() decorator to mark deprecations in the type system and at runtime.

Python 3.13 also adds PEP 696, which introduces default values for type parameters. This enhancement allows developers to specify default types for TypeVar, ParamSpec, and TypeVarTuple when omitting type arguments.

Standard library

The standard library includes improvements for a new PythonFinalizationError exception, raised when an operation is blocked during finalization.

The new functions base64.z85encode() and base64.z85decode() support encoding and decoding Z85 data.

The copy module now has a copy.replace() function, with support for many built-in types and any class defining the __replace__() method.

The os module has a suite of new functions for working with Linux’s timer notification file descriptors.

There is a change to the defined mutation semantics for locals().

Experimental features that are unavailable

Python 3.13 includes a number of experimental features which are not enabled for the Lambda managed runtime or base images. These features must be enabled when the Python runtime is compiled. Since the Lambda-provided Python 3.13 runtime is intended for production workloads, these features are not enabled in the Lambda build of Python 3.13 and cannot be enabled via an execution-time flag. To use these features in Lambda, you can deploy your own Python runtime using a custom runtime or container image with these features enabled.

Free-threaded CPython

You can not enable the experimental support for running Python in a free-threaded mode, with the global interpreter lock (GIL) disabled.

Just-in-time (JIT) compiler

You can also not enable the experimental JIT compiler within the Lambda managed runtime or base image.

Performance considerations

At launch, new Lambda runtimes receive less usage than existing established runtimes. This can result in longer cold start times due to reduced cache residency within internal Lambda sub-systems. Cold start times typically improve in the weeks following launch as usage increases. As a result, AWS recommends not drawing conclusions from side-by-side performance comparisons with other Lambda runtimes until the performance has stabilized. Since performance is highly dependent on workload, customers with performance-sensitive workloads should conduct their own testing, instead of relying on generic test benchmarks.

Using Python 3.13 in Lambda

AWS Management Console

To use the Python 3.13 runtime to develop your Lambda functions, specify a runtime parameter value Python 3.13 when creating or updating a function. The Python 3.13 version is available in the Runtime dropdown in the Create Function page:

Creating Python function in AWS Management Console

Creating Python function in AWS Management Console

To update an existing Lambda function to Python 3.13, navigate to the function in the Lambda console and choose Edit in the Runtime settings panel. The new version of Python is available in the Runtime dropdown.

Changing a function to Python 3.13

Changing a function to Python 3.13

You may need to check your code and dependencies for compatibility with Python 3.13, and update as necessary.

AWS Lambda container image

Change the Python base image version by modifying the FROM statement in your Dockerfile

FROM public.ecr.aws/lambda/python:3.13
# Copy function code
COPY lambda_handler.py ${LAMBDA_TASK_ROOT}

AWS Serverless Application Model (AWS SAM)

In AWS SAM set the Runtime attribute to python3.13 to use this version.

AWSTemplateFormatVersion: '2010-09-09'
Transform: AWS::Serverless-2016-10-31
Description: Simple Lambda Function
  MyFunction:
    Type: AWS::Serverless::Function
    Properties:
      Description: My Python Lambda Function
      CodeUri: my_function/
      Handler: lambda_function.lambda_handler
      Runtime: python3.13

AWS SAM supports generating this template with Python 3.13 for new serverless applications using the sam init command. Refer to the AWS SAM documentation.

AWS Cloud Development Kit (AWS CDK)

In AWS CDK, set the runtime attribute to Runtime.PYTHON_3_13 to use this version. In Python CDK:

from constructs import Construct 
from aws_cdk import ( App, Stack, aws_lambda as _lambda )

class SampleLambdaStack(Stack):
    def __init__(self, scope: Construct, id: str, **kwargs) -> None:
        super().__init__(scope, id, **kwargs)
        
        base_lambda = _lambda.Function(self, 'python313LambdaFunction', 
                                       handler='lambda_handler.handler', 
                                    runtime=_lambda.Runtime.PYTHON_3_13, 
                                 code=_lambda.Code.from_asset('lambda'))

In TypeScript CDK:

import * as cdk from 'aws-cdk-lib';
import * as lambda from 'aws-cdk-lib/aws-lambda'
import * as path from 'path';
import { Construct } from 'constructs';

export class SampleLambdaStack extends cdk.Stack {
  constructor(scope: Construct, id: string, props?: cdk.StackProps) {
    super(scope, id, props);

    // The code that defines your stack goes here

    // The python3.13 enabled Lambda Function
    const lambdaFunction = new lambda.Function(this, 'python313LambdaFunction', {
      runtime: lambda.Runtime.PYTHON_3_13,
      memorySize: 512,
      code: lambda.Code.fromAsset(path.join(__dirname, '/../lambda')),
      handler: 'lambda_handler.handler'
    })
  }
}

Conclusion

Lambda now supports Python 3.13 as a managed language runtime. This release uses the Amazon Linux 2023 OS and includes Python 3.13 language additions including data model improvements, typing changes, and updates to the standard library. This release does not support the experimental option to disable the global interpreter lock or the experimental JIT compiler.

You can build and deploy functions using Python 3.13 using the AWS Management Console, AWS CLI, AWS SDK, AWS SAM, AWS CDK, or your choice of infrastructure as code tool. You can also use the Python 3.13 container base image if you prefer to build and deploy your functions using container images.

Python 3.13 runtime support helps developers to build more efficient, powerful, and scalable serverless applications. Try the Python 3.13 runtime in Lambda today and experience the benefits of this updated language version.

For more serverless learning resources, visit Serverless Land.

Introducing an enhanced local IDE experience for AWS Lambda developers

Post Syndicated from Julian Wood original https://aws.amazon.com/blogs/compute/introducing-an-enhanced-local-ide-experience-for-aws-lambda-developers/

AWS Lambda is introducing an enhanced local IDE experience to simplify Lambda-based application development. The new features help developers to author, build, debug, test, and deploy Lambda applications more efficiently in their local IDE when using Visual Studio Code (VS Code).

Overview

The IDE experience is part of the AWS Toolkit for Visual Studio Code. A new guided walkthrough helps developers set up their local environment and install required tools. The toolkit includes a set of sample applications which show you how to iterate on your code locally and in the cloud. You can configure and save build settings to speed up application builds. Generate a configuration file to set up the debugging environment for VS Code to attach and launch the step-through debugger. Iterate faster by choosing to sync local application changes quickly to the cloud or perform a full application deploy. Test functions locally and in the cloud and create and share test events to speed up local and cloud testing. There are quick action buttons for build, deploy to cloud, and local or remote invoke. The toolkit integrates with AWS Infrastructure Composer, providing a visual application building experience directly from the IDE.

Using the new features

Installing the extension

To use the updated IDE experience, ensure you have the AWS Toolkit minimum version 3.31.0 installed as a VS Code Extension.

The AWS Toolkit now includes an additional section called Application Builder within the AWS extension side-bar. This allows you to view template resources and create, build, debug, and test serverless applications.

Using Application Builder for existing applications

You can open an existing local application template using Open Folder.

Lambda’s enhanced in-console editing experience allows you to download existing function code and an AWS Serverless Application Model (AWS SAM) template. This allows you to start in the console and more easily move to using infrastructure as code, which is a serverless best practice.

Using the guided walkthrough

The guided walkthrough helps you install dependencies, select an application template, and explains how to use Application Builder to iterate locally and deploy to the cloud.

  1. Choose Open Walkthrough which opens the walkthrough.
  2. Complete installation takes you through a wizard to install required dependencies and select application templates.
  3. The wizard provides download links to install the three dependencies:

    If you have installed the dependencies, selecting the links recognizes the installations.

  4. Select Choose your application template, which allows you to create example applications in VS Code.
  5. The Iterate locally tile provides guidance on how to use Application Builder to build and invoke the function, and how to view the results.
  6. Deploy to the cloud provides a link to Configure credentials and explains how to deploy your function to the cloud, remote invoke from your IDE, and view the results.

Creating an application from the samples

The following steps show how to create a function locally from an included template. You build the code artifact, locally test and debug, deploy, and remotely invoke and view results and logs, all without leaving your IDE.

  1. Navigate back to Choose your application template.
  2. New template with visual builder allows you to use Infrastructure Composer to create a new application using a visual canvas.
  3. See more application examples provides additional sample applications across a number of managed runtimes.

There are also two specific example applications to explore Lambda functionality.

  • Rest API: Learn how to build a synchronous Lambda function behind an API.
  • File processing.: Learn how to build an asynchronous Amazon S3 file processing application.

Building a synchronous Rest API application

  1. Select Rest API and chose Initialize your project.
  2. Select a language runtime. Select Python for this example.
  3. Open the file explorer, create a folder to download the example application and choose Create Project.
  4. Application Builder downloads the application. This includes the function code hello_world\app.py, with dependencies in requirements.txt, an AWS SAM template, template.yaml file, and an example event trigger, event.json. A README.md file explains the application structure and provides build and deploy instructions.

    The Application Builder section populates with the template resources.

  5. The icons provide shortcuts to view, build, and deploy the application.
  6. You can also use the Command Pallete to initiate the AWS SAM commands.
  7. Selecting the Open Template File icon opens the AWS SAM template in Infrastructure Composer.
  8. View the application resources and select Details to edit the template using the visual canvas.
  9. Navigate to the function resource and select Open Function Handler to show the function code.

Building the application

The build step helps you build artifacts from the files in your application project directory.

  1. Select the Build SAM template icon.
  2. Specify build flags allows you to configure AWS SAM builds settings.
  3. Select build settings particular to your configuration. Cached and parallel are useful to speed up future builds. Use container builds your function in a Lambda-like container. This allows you to build applications without having the language runtime and build tools installed locally.
  4. Save parameters adds the default build options in samconfig.toml.
  5. version = 0.1
    [default.build.parameters]
    template_file = "c:\\Code\\lambda-dx\\Rest-API\\template.yaml"
    cached = true
    parallel = true
    use_container = true

    AWS SAM builds the application. It downloads the build container image, installs the dependencies, and copies the function code.

  6. Press any key to close the additional terminal.

Iterate locally: invoke and debug

You can locally invoke and debug your serverless application before uploading it to the cloud. This helps you to test the logic of your function faster. Step-through debugging allows you to identify and fix issues in your application one instruction at a time in your local environment.

Local invoke

  1. In the Application Builder section, navigate to the function and select Local Invoke and Debug Configuration.
  2. Initiating Local Invoke and Debug Configuration

    Initiating Local Invoke and Debug Configuration

  3. This brings up another window which allows you to configure how to invoke the function locally and set up a debug configuration.
  4. Viewing Local Invoke and Debug Configuration Options

    Viewing Local Invoke and Debug Configuration Options

  5. You can create sample event payloads to test your function. Select an event provides a list of common trigger event payloads you can use and customize.
  6. Selecting an example event template

    Selecting an example event template

    This example application has an included sample event.

  7. Select Local file and choose the events\event.json file.
  8. Select the Invoke button.
  9. This builds the application and locally invokes the function within a Lambda emulation environment, using the event input file.

  10. View the function output within the IDE Output pane.
Viewing function output

Viewing function output

Local debugging

You can also debug the function locally using VS Code’s built-in debugger.

  1. Add a breakpoint to the function code.
  2. Adding a breakpoint to the function code

    Adding a breakpoint to the function code

  3. Select the Invoke button again.
  4. This locally invokes the function and attaches a debugger to the Lambda emulation environment.

  5. The debugger stops at the breakpoint and you can view the function variables and call stack.
  6. Viewing step through debugging

    Viewing step through debugging

  7. Use the VS Code debugger icons to step through the code.
  8. Using VS Code debugger icons to step through the code.

    Using VS Code debugger icons to step through the code.

  9. In the Local Invoke and Debug Configuration panel. Chose Save Debug Config.
  10. Choose Add Local Invoke and Debug Configuration.
  11. Saving debug configuration

    Saving debug configuration

  12. Enter a debug configuration name which creates a launch.json file and adds the debug configuration.
  13. Naming debug configuration

    Naming debug configuration

    You can create and save multiple debug configurations for different scenarios. See the AWS SAM documentation for more launch.json configuration options.

  14. Once you save the debug configuration, you can use VS Code’s Run and Debug panel and select which debug configuration to run.
Using the Run and Debug panel

Using the Run and Debug panel

Deploying the application

  1. Navigate to the Application Builder section and chose the Deploy SAM Application icon.
  2. Selecting Deploy SAM Application icon

    Selecting Deploy SAM Application icon

    AWS SAM provides two deployment options:

    • Sync uses AWS SAM sync to perform an initial CloudFormation deploy and then allows for quick syncing of your application code, which allows for rapid prototyping. Use this for development environments only, as it doesn’t do a full CloudFormation deploy on code changes.
    • Deploy does a full CloudFormation deploy, which is preferred for non-quick development environments.
    Viewing AWS SAM deployment options

    Viewing AWS SAM deployment options

  3. Select Sync.
  4. Select Specify required parameters and save as defaults.
  5. Specifying SAM sync parameters

    Specifying SAM sync parameters

  6. Select a Region to deploy the stack and enter a stack name. It is good practice to specify that this is a dev stack to avoid confusion when using the Deploy option.
  7. Entering dev stack name

    Entering dev stack name

  8. Select an existing S3 bucket to store the artifacts, or create a new one.
  9. Selecting S3 bucket

    Selecting S3 bucket

  10. Specify the Sync parameters. Ensure you select Watch as this automatically watches for code changes and quickly syncs code changes to the Lambda service
  11. Setting sync parameters

    Setting sync parameters

  12. AWS SAM sync does an initial CloudFormation deploy to build the resources and then waits for code changes.
  13. Make a change to the handler file code and save the file,
  14. Amending code

    Amending code

  15. This performs a quick sync which reduces the time to test in the cloud.
  16. Quickly syncing code

    Quickly syncing code

  17. You can use the Deploy option to deploy a non-quick sync test version, amending the stack name to differentiate it from the dev stack.
Naming test version stack

Naming test version stack

Remote invoke

You can invoke the function in the cloud from your IDE. This allows you to test functionality without having to mock security, external services, or other environment variables.

Once the application is deployed, Application Builder detects changes to samconfig.toml and template.yaml, it updates the resources list with the cloud resources.

Viewing cloud resources

Viewing cloud resources

  1. You can browse directly to the CloudFormation stack to view resources.
  2. Browsing to CloudFormation stack

    Browsing to CloudFormation stack

  3. Selecting the function provides quick link functionality, which includes function details and a link directly to the Lambda console for the function.
  4. Viewing function quick link options

    Viewing function quick link options

  5. Select Invoke in cloud.
  6. Select the same local event file for the local invoke.
  7. Selecting local file for remote invoke

    Selecting local file for remote invoke

  8. Choose Remote Invoke.
  9. The function invokes in the cloud using the local test event and displays the remote invoke results in the local IDE Output pane.

    Viewing remote invoke results

    Viewing remote invoke results

  10. Name and save the local event file as a remote event which becomes available in the Lambda console.
Saving remote test event

Saving remote test event

Viewing logs

You can fetch the Amazon CloudWatch Log streams generated by your Lambda function in the IDE.

  1. Select the Search Logs icon.
  2. Selecting Search Logs icon

    Selecting Search Logs icon

  3. You can optionally filter the results.
Optionally filtering log results

Optionally filtering log results

Conclusion

Lambda is introducing an enhanced local IDE experience to simplify the development of Lambda-based applications using the VS Code IDE and AWS Toolkit. This streamlines the code-test-deploy-debug cycle. A guided walkthrough helps set up your local development environment and provides sample applications to explore Lambda functionality. You can then build, debug, test, and deploy Lambda applications using icon shortcuts and the Command Pallette. This allows you to more easily iterate on your Lambda-based applications without switching between multiple interfaces.

For more serverless learning resources, visit Serverless Land.

Introducing an enhanced in-console editing experience for AWS Lambda

Post Syndicated from Julian Wood original https://aws.amazon.com/blogs/compute/introducing-an-enhanced-in-console-editing-experience-for-aws-lambda/

AWS Lambda is introducing a new code editing experience in the AWS console based on the popular Code-OSS, Visual Studio Code Open Source code editor. This brings the familiar Visual Studio Code interface and many of the features directly into the Lambda console, allowing developers to use their preferred coding environment and tools in the cloud. The Lambda Code Editor displays larger function package sizes and also integrates with Amazon Q Developer. This is an AI-powered coding assistant that provides real-time suggestions and insights to help you write, understand, and troubleshoot your Lambda functions more efficiently.

Overview

Visual Studio Code is the most popular IDE among developers according to the 2023 Stack Overflow Developer Survey. Integrating Code-OSS into the Lambda Console brings a familiar, accessible, and customizable interface to the in-browser code editing capabilities. This provides a coding experience that is substantially similar to working with function code locally. You can install selected extensions, apply preferred themes and settings, and use your familiar keyboard shortcuts and coding preferences.

The new editing experience is included as part of the standard Lambda service, at no extra cost.

Accessibility

The update also addresses important accessibility needs. With features like high color contrast, keyboard-only navigation, and screen reader support, the Code-OSS integration ensures an inclusive and accessible coding experience for all developers.

Differences from Visual Studio Code IDE

The Lambda console’s Code-OSS integration complements, rather than fully replaces, local development workflows. You can view and edit function code that uses an interpreted language, not compiled languages, which is consistent with the previous Lambda console. The terminal window is also unavailable in Code-OSS.

AWS Toolkit for Visual Studio Code extensions

Deeper integration with the AWS Toolkit for VS Code extension provides access to a subset of AWS specific functionality, including Q Developer. This ensures that the Lambda code editing experience benefits from additional developer tooling enhancements provided through the AWS Toolkit.

Larger package sizes

With Lambda, the total package size for ZIP-based functions, including code and libraries, cannot exceed 50 MB. Previously Lambda imposed a 3MB limit for editing code in the console. Now you are able to view function package sizes up to 50 MB in the console, however, there is still a single file limit of 3 MB. This allows you to view function code even when you have larger dependencies.

Using the new features

Viewing code

To experience the new Lambda Code Editor, log into the AWS Management Console and navigate to the Lambda service. Create a new function or edit an existing one. The new Lambda Code Editor is ready to use, with no additional setup required.

This example shows editing an existing function, viewing the function code in the familiar Code-OSS editor.

Viewing function code in the Lambda Code Editor

Viewing function code in the Lambda Code Editor

Previously, the code was not viewable as the code package size was greater than 3 MB. The update allows you to view larger files. The following image shows a package size of 13.3 MB and the Code-OSS editor allows editing of the function handler.

Viewing larger package size

Viewing larger package size

Environment variables

In the left pane, the environment variables are viewable for the function. Select the pencil icon to edit, add, and remove environment variables.

Viewing and editing environment variables

Viewing and editing environment variables

Creating test events

The new split-screen view allows you to test your function and see your code and test results side-by-side, simplifying test event configuration.

  1. Select Create test event to open the panel.
  2. Creating test event

    Creating test event

    You can create Private test events or Shareable test events for other builders to use with access to the account.

  3. Generate an event using an event template for the Amazon API Gateway HTTP API event trigger that the function uses. Save the test event.
  4. Creating API Gateway test event

    Creating API Gateway test event

    Invoke function

  5. Invoke the function by selecting the Invoke button

The function results appear in the Output panel, consistent with the local VS Code IDE experience.

Function invoke result

Function invoke result

The function logs appear below the output.

Viewing function logs

Viewing function logs

This view allows you to view and edit your code, generate and use test events, and invoke your function, all visible within the familiar Lambda Code Editor interface.

Live Tail Logs

Lambda now natively supports Amazon CloudWatch Logs Live Tail. This is an interactive log streaming and analytics capability, which allows you to view and analyze your Lambda function logs in real time.

  1. Select the Run and Debug icon in the Activity Bar on the left-hand side of the code editor in the Code tab.
  2. Select Open CloudWatch Live Tail. This opens the CloudWatch Logs Live Tail bottom drawer.
  3. Select Start to start a Live Tail session and view your Lambda function logs stream in real time.
  4. Alternatively, navigate to the Test tab and select CloudWatch Logs Live Tail to start a Live Tail session.
CloudWatch Logs Live Tail

CloudWatch Logs Live Tail

Keyboard shortcuts

In the left pane Extensions dialog, you can see the keyboard shortcuts are installed by default.

Viewing installed extensions

Viewing installed extensions

Select the Manage gear icon which shows which aspects are configurable.

Viewing configuration options

Viewing configuration options

The Keyboard shortcuts dialog allows you to view and change the shortcuts.

Amending keyboard shortcuts

Amending keyboard shortcuts

Command Palette

Viewing the Command Palette shows available commands.

Viewing Command Palette

Viewing Command Palette

Configuration settings

The Settings panel allows you to configure the Lambda Code Editor to match your local IDE environment if required.

Viewing Settings panel

Viewing Settings panel

Navigate to Themes | Color Themes to customize the theme, including dark mode.

Lambda Console Editor dark mode

Lambda Console Editor dark mode

Downloading function code and template

It is now easier to download the function code and an AWS Serverless Application Model (AWS SAM) template which represents the Cloudformation resources required to set up the function, policies, and triggers. This allows you to start in the console and more easily move to using infrastructure as code, which is a serverless best practice.

  1. Navigate to the Activity Bar Run and Debug section.
  2. Select Download code and SAM template.
  3. Extract the .zip file and open the folder in your local VS Code IDE.

You can continue to edit the function in your local IDE experience, which is consistent with the Lambda Console Editor.

Local VS Code IDE to continue working on function

Local VS Code IDE to continue working on function

Using your local IDE terminal or AWS Toolkit for VS Code, you can update the existing function. You can also use AWS SAM functionality to build and deploy the template as a Cloudformation stack to the cloud.

Using Amazon Q

The Amazon Q Developer AI assistant integrates directly into the code editor. This reduces the need to consult external documentation or tutorials, streamlining your development workflow.

Amazon Q provides inline suggestions or by using keyboard shortcuts for common actions you take, such as initiating Amazon Q or accepting a recommendation.

This example below adds more functionality to a new Lambda function to download an object from S3 with the help of Amazon Q. Enter a comment explaining the functionality you need.

Asking Amazon Q a question

Asking Amazon Q a question

Select tab to accept the suggestion.

Accepting an Amazon Q suggestion

Accepting an Amazon Q suggestion

You can continue to invoke Q manually to keep adding more code suggestions.

Continue adding functionality with Amazon Q

Continue adding functionality with Amazon Q

Conclusion

Lambda is introducing a new AWS console code editing experience based on the popular Code-OSS, Visual Studio Code Open Source code editor. This brings the familiar VS Code IDE interface and features directly into the Lambda console so you can use your preferred coding environment and tools in the cloud. Invoke your function using a new split-screen view to see your code and test results side-by-side, simplifying test event configuration.

The code editor displays larger function package sizes, makes environment variables more visible, and also integrates with Amazon Q Developer. This provides real-time suggestions and insights to help you write, understand, and troubleshoot your Lambda functions more efficiently.

For more serverless learning resources, visit Serverless Land.

Simplifying Lambda function development using CloudWatch Logs Live Tail and Metrics Insights

Post Syndicated from Chris McPeek original https://aws.amazon.com/blogs/compute/simplifying-lambda-function-development-using-cloudwatch-logs-live-tail-and-metrics-insights/

This post is written by Shridhar Pandey, Senior Product Manager, AWS Lambda

Today, AWS is announcing two new features which make it easier for developers and operators to build and operate serverless applications using AWS Lambda. First, the Lambda console now natively supports Amazon CloudWatch Logs Live Tail which provides you real-time visibility into Lambda function logs, making it easier to develop and troubleshoot Lambda functions. Second, the Lambda console now offers Amazon CloudWatch Metrics Insights dashboard for key Lambda function metrics, enabling you to easily identify and troubleshoot the source of errors or performance issues.

This blog post dives into the new capabilities enabled by these launches, how these capabilities simplify the developer and operator experience for building serverless applications with Lambda, and how you can get started with them.

Native CloudWatch Live Tail logs in Lambda console

Customers building serverless applications using Lambda want visibility into the behavior of their Lambda functions in real time, such as when an error occurs or a code change causes unexpected behavior. For example, developers want to instantly see the result of their code or configuration changes on the behavior of the function, and operators want to quickly troubleshoot any critical issues which would prevent the function from operating smoothly.

To help you monitor and troubleshoot the behavior of your function, the Lambda service automatically captures and sends logs to CloudWatch Logs. However, previously, you had to wait for Lambda function logs to be ingested, processed, and stored by CloudWatch Logs before you could view them. Then, you had to navigate to the CloudWatch console to view, search, and query logs using tools like CloudWatch Logs Insights. This caused frequent context switching between the Lambda and CloudWatch consoles in order to access logs, which introduced friction in the process of rapidly developing and troubleshooting Lambda functions.

The Lambda console now natively supports CloudWatch Logs Live Tail, an interactive log streaming and analytics capability which enables developers and operators to view and analyze their Lambda function logs in real time. This capability provides a built-in, real-time view of function logs as they become available in the Lambda console, as seen in the following image. Developers can now easily start a Live Tail session with one click and view the latest log entries as their function is executing. So, they can now edit the function code, deploy changes, invoke the function, and view the result of their code change in real time, without navigating away from the Lambda console. This streamlines and accelerates the author-test-deploy cycle (also known as the “inner dev loop”) when building serverless applications using Lambda.

New Live Tail view in Lambda console

Figure 1 CloudWatch Logs Live Tail in Lambda console

The Live Tail experience in Lambda console also offers fine-grained log analysis capabilities to filter logs, making it easier for operators and DevOps teams to debug and troubleshoot issues and critical errors in their Lambda functions. For example, while investigating errors in the Lambda function, operators can apply filter patterns to only display log events containing keywords of interest e.g., ERROR, exception, etc. This helps narrow down the search to relevant log events and cut out the noise, reducing the mean time to recovery (MTTR) when troubleshooting Lambda function errors. Thus, Live Tail enables operators to proactively monitor the health of their serverless applications built using Lambda and react faster to resolve errors or unexpected behavior.

Live Tail in action

To use Live Tail capabilities on any CloudWatch log group, you must have logs:StartLiveTail, logs:StopLiveTail, and logs:DescribeLogGroups AWS Identity and Access Management (IAM) permissions for that CloudWatch log group. Alternatively, you can add CloudWatchLogsReadOnlyAccess managed IAM policy (which contains these IAM permissions) to your IAM role. See Overview of managing access permissions to your CloudWatch Logs resources to learn more.

To get started with Live Tail in the Lambda console:

  1. Navigate to the Lambda console at https://console.aws.amazon.com/lambda/
  2. In the Functions page, select the Lambda function for which you want to view Live Tail logs.
  3. In the Code tab, select Run and Debug icon in the Activity Bar on the left-hand side of the code editor. This opens the Run and Debug view.
  4. Select Open CloudWatch Live Tail. This opens the CloudWatch Logs Live Tail bottom drawer.The new Code editor experience in the Lambda console showing how to start a CloudWatch Live Tail sessionFigure 2: Starting Live Tail from code editor in Lambda console
  5. Select Start to start a Live Tail session and view your Lambda function logs stream in real time. Alternatively, visit Test tab and select CloudWatch Logs Live Tail to start a Live Tail session.

Active Live Tail session showing logs for the CloudWatch log group associated with the Lambda function.

Figure 3: Active Live Tail session

The CloudWatch Logs Live Tail bottom drawer features a Filter panel on the left-hand side, which contains useful controls such as CloudWatch log group selection, option to filter logs, and the Start and Stop buttons. You can collapse this panel if you want to utilize the entire width of your screen to view logs (without horizontal scrolling) in the Live Tail session, as shown in the following image.

Active Live Tail session showing collapsed Filter panel.

Figure 4: Active Live Tail session with collapsed Filter Panel

The Filter panel has the CloudWatch log group corresponding to your Lambda function selected by default, but you can select other log groups. You can select up to 5 log groups at a time. You can also stop the Live Tail session at any time by selecting Stop in the Filter panel.

To filter logs based on specific terms or keywords, apply patterns using the “Add filter pattern” option in the Filter panel. The filters field is case sensitive. You can specify keywords, phrases, numeric values, or regular expressions in the filter pattern. See Filter pattern syntax for metric filters, subscription filters, filter log events, and Live Tail to learn more about how to use filter patterns to display only log events of interest. For example, you can filter log events containing specific keywords or phrases (e.g., ERROR, FATAL, exception, etc.) as shown in the following image.

Live Tail session showing multiple log groups selected and filter pattern applied for “ERROR” keyword.

Figure 5: Active Live Tail session with multiple log groups selected and filter patterns applied

The Live Tail session automatically stops after 15 minutes (i.e., 900 seconds) of inactivity or when the Lambda console session times out. However, when you restart the Live Tail session, the previously applied filtering criteria will be retained. This means, you can pick up where you left off with just one click.

You get 1,800 minutes of Live Tail session usage per month for free with the AWS Free Tier, after which you pay $0.01 per minute of usage. See CloudWatch pricing page for Live Tail pricing details.

The Live Tail experience in Lambda console is available in all commercial AWS Regions where AWS Lambda and Amazon CloudWatch Logs are available. See Lambda documentation and this introductory video to learn more about native Live Tail support for Lambda.

CloudWatch Metrics Insights dashboard in Lambda console

In order to effectively operate distributed applications, easily identifying the source of errors or performance issues is critical. For example, when you notice a spike in critical metrics like errors or invocation duration in your Lambda dashboard, you want to quickly find out which Lambda functions are causing these spikes. Previously, you had to navigate to the CloudWatch console and query metrics or create custom dashboards.

Now, the Lambda console features a new built-in CloudWatch Metrics Insights dashboard which provides you instant visibility into critical insights for Lambda functions in your account, such as “most invoked Lambda functions”, “functions with highest number of errors”, and “functions taking the longest to run”. The dashboard leverages CloudWatch Metrics Insights capability to enable you to easily identify functions driving the highest usage, errors, and performance issues. Thus, the Metrics Insights dashboard surfaces key insights right where you need them, reducing friction due to context switching and making it easy for your operator team(s) to identify and fix errors and performance anomalies for your serverless applications built using Lambda.

Metrics Insights dashboard in action

You can easily get started with Metrics Insights dashboard without making any code changes or creating custom dashboards. Simply navigate to the Dashboard page in the Lambda console to start accessing the insights surfaced in the Metrics Insights dashboard. The following image shows the Metric Insights dashboard in the Lambda console.

Dashboard page in Lambda console showing Metrics Insights dashboard.

Figure 6: Lambda Dashboard page with Metrics Insights dashboard

The dashboard shows the top 10 Lambda functions in your AWS account with highest number of invocations, errors, and longest invocation duration. In the example shown in the following image, the Lambda function named 1-LambdaConsoleStack-er4D14B2288-VulWZHExuSFp shows the highest error rate among all functions experiencing errors. This could be a signal to the operator team to prioritize identifying the root cause behind the high error rate for this function.

Metrics Insights dashboard with graphs populated with metrics data for Lambda functions.

Figure 7: Metrics Insights dashboard showing top 10 functions with highest errors, invocations, and concurrent executions

The Metrics Insights dashboard displays data for the most recent 3 hours. You can view and query metrics in the CloudWatch console if you require metrics for longer than 3 hours.

Metrics Insights dashboard in Lambda console is now available in all commercial AWS Regions where AWS Lambda and Amazon CloudWatch are available, including the AWS GovCloud (US) Regions, at no additional cost.

Conclusion

This post introduces and illustrates two new Lambda features — native support for CloudWatch Logs Live Tail and Metrics Insights dashboard in the Lambda console. These features simplify the developer and operator experience for serverless applications built using Lambda. Live Tail enables you to view and analyze Lambda logs in real time, which simplifies and accelerates the author-test-deploy cycle and makes it easy to troubleshoot errors in Lambda functions. On the other hand, Metrics Insights dashboard shows key Lambda metrics like errors, invocations, and duration to reduce the mean time to recover (MTTR) from errors and performance issues for Lambda functions.

For more serverless learning resources, visit Serverless Land.

Enhance Amazon EMR scaling capabilities with Application Master Placement

Post Syndicated from Lorenzo Ripani original https://aws.amazon.com/blogs/big-data/enhance-amazon-emr-scaling-capabilities-with-application-master-placement/

In today’s data-driven world, processing large datasets efficiently is crucial for businesses to gain insights and maintain a competitive edge. Amazon EMR is a managed big data service designed to handle these large-scale data processing needs across the cloud. It allows running applications built using open source frameworks on Amazon Elastic Compute Cloud (Amazon EC2), Amazon Elastic Kubernetes Service (Amazon EKS), or AWS Outposts, or completely serverless. One of the key features of Amazon EMR on EC2 is managed scaling, which dynamically adjusts computing capacity in response to application demands, providing optimal performance and cost-efficiency.

Although managed scaling aims to optimize EMR clusters for best price-performance and elasticity, some use cases require more granular resource allocation. For example, when multiple applications are submitted to the same clusters, resource contention may occur, potentially impacting both performance and cost-efficiency. Additionally, allocating the Application Master (AM) container to non-reliable nodes like Spot can potentially result in loss of the container and immediate shutdown of the entire YARN application, resulting in wasted resources and additional costs for rescheduling the entire YARN application. These uses cases require more granular resource allocation and sophisticated scheduling policies to optimize resource utilization and maintain high performance.

Starting with the Amazon EMR 7.2 release, Amazon EMR on EC2 introduced a new feature called Application Master (AM) label awareness, which allows users to enable YARN node labels to allocate the AM containers within On-Demand nodes only. Because the AM container is responsible for orchestrating the overall job execution, it’s crucial to verify that it gets allocated to a reliable instance and not be subjected to shutdown due to Spot Instance interruption. Additionally, limiting AM containers to On-Demand helps maintain consistent application launch time, because the fulfillment of the On-Demand Instance isn’t prone to unavailable Spot capacity or bid price.

In this post, we explore the key features and use cases where this new functionality can provide significant benefits, enabling cluster administrators to achieve optimal resource utilization, improved application reliability, and cost-efficiency in your EMR on EC2 clusters.

Solution overview

The Application Master label awareness feature in Amazon EMR works in conjunction with YARN node labels, a functionality offered by Hadoop that empowers you to define labels to nodes within a Hadoop cluster. You can use these labels to determine which nodes of the cluster should host specific YARN containers (such as mappers vs. reducers in a MapReduce, or drivers vs. executors in Apache Spark).

This feature is enabled by default when a cluster is launched with Amazon EMR 7.2.0 and later using Amazon EMR managed scaling, and it has been configured to use YARN node labels. The following code is a basic configuration setup that enables this feature:

[
   {
     "Classification": "yarn-site",
     "Properties": {
      "yarn.node-labels.enabled": "true",
       "yarn.node-labels.am.default-node-label-expression": "ON_DEMAND"
     }
   }
]

Within this configuration snippet, we activate the Hadoop node label feature and define a value for the yarn.node-labels.am.default-node-label-expression property. This property defines the YARN node label that will be used to schedule the AM container of each YARN application submitted to the cluster. This specific container plays a key role in maintaining the lifecycle of the workflow, so verifying its placement on reliable nodes in production workloads is crucial, because the unexpected shutdown of this container can result in the shutdown and failure of the entire application.

Currently, the Application Master label awareness feature only supports two predefined node labels that can be specified to allocate the AM container of a YARN job: ON_DEMAND and CORE. When one of these labels is defined using Amazon EMR configurations (see the preceding example code), Amazon EMR automatically creates the corresponding node labels in YARN and labels the instances in the cluster accordingly.

To demonstrate how this feature works, we launch a sample cluster and run some Spark jobs to see how Amazon EMR managed scaling integrates with YARN node labels.

Launch an EMR cluster with Application Manager placement awareness

To perform some tests, you can launch the following AWS CloudFormation stack, which provisions an EMR cluster with managed scaling and the Application Manager placement awareness feature enabled. If this is your first time launching an EMR cluster, make sure to create the Amazon EMR default roles using the following AWS Command Line Interface (AWS CLI) command:

aws emr create-default-roles

To create the cluster, choose Launch Stack:

Launch Cloudformation Stack

Provide the following required parameters:

  • VPC – An existing virtual private cloud (VPC) in your account where the cluster will be provisioned
  • Subnet – The subnet in your VPC where you want to launch the cluster
  • SSH Key Name – An EC2 key pair that you use to connect to the EMR primary node

After the EMR cluster has been provisioned, establish a tunnel to the Hadoop Resource Manager web UI to review the cluster configurations. To access the Resource Manager web UI, complete the following steps:

  1. Set up an SSH tunnel to the primary node using dynamic port forwarding.
  2. Point your browser to the URL http://<primary-node-public-dns>:8088/, using the public DNS name of your cluster’s primary node.

This will open the Hadoop Resource Manager web UI, where you can see how the cluster has been configured.

YARN node labels

In the CloudFormation stack, you launched a cluster specifying to allocate the AM containers on nodes labeled as ON_DEMAND. If you explore the Resource Manager web UI, you can see that Amazon EMR created two labels in the cluster: ON_DEMAND and SPOT. To review the YARN node labels present in your cluster, you can inspect the Node Labels page, as shown in the following screenshot.

On this page, you can see how the YARN labels were created in Amazon EMR:

  • During initial cluster creation, default node labels such as ON_DEMAND and SPOT are automatically generated as non-exclusive partitions
  • The DEFAULT_PARTITION label stays vacant because every node gets labeled based on its market type—either being an On-Demand or Spot Instance

In our example, because we launched a single core node as On-Demand, you can observe a single node assigned to the ON_DEMAND partition, and the SPOT partition remains empty. Because the labels are created as non-exclusive, nodes with these labels can run both containers launched with a specific YARN label and also containers that don’t specify a YARN label. For additional details on YARN node labels, see YARN Node Labels in the Hadoop documentation.

Now that we have discussed how the cluster was configured, we can perform some tests to validate and review the behavior of this feature when using it in combination with managed scaling.

Concurrent application submission with Spot Instances

To test the managed scaling capabilities, we submit a simple SparkPi job configured to utilize all available memory on the single core node initially launched in our cluster:

spark-example \
  --deploy-mode cluster \
  --driver-memory 10g \
  --executor-memory 10g \
  --conf spark.dynamicAllocation.maxExecutors=1 \
  --conf spark.yarn.executor.nodeLabelExpression=SPOT \
  SparkPi 800000

In the preceding snippet, we tuned specific Spark configurations to utilize all the resources of the cluster nodes launched (you could also achieve this using the maximizeResourceAllocation configuration while launching an EMR cluster). Because the cluster has been launched using m5.xlarge instances, we can launch individual containers up to 12 GB in terms of memory requirements. With these assumptions, the snippet configures the following:

  • The Spark driver and executors were configured with 10 GB of memory to utilize most of the available memory on the node, in order to have a single container running on each node of our cluster and simplify this example.
  • The node-labels.am.default-node-label-expression parameter was set to ON_DEMAND, making sure the Spark driver is automatically allocated to the ON_DEMAND partition of our cluster. Because we specified this configuration while launching the cluster, the AM containers are automatically requested to be scheduled on ON_DEMAND labeled instances, so we don’t need to specify it at the job level.
  • The yarn.executor.nodeLabelExpression=SPOT configuration verifies that the executors operated exclusively on TASK nodes using Spot Instances. Removing this configuration allows the Spark executors to be scheduled both on SPOT and ON_DEMAND labeled nodes.
  • The dynamicAllocation.maxExecutors setting was set to 1 to delay the processing time of the application and observe the scaling behavior when multiple YARN applications were submitted concurrently in the same cluster.

As the application transitioned to a RUNNING state, we can verify from the YARN Resource Manager UI that its driver placement was automatically assigned to the ON_DEMAND partition of our cluster (see the following screenshot).

Additionally, upon inspecting the YARN scheduler page, we can see that our SPOT partition doesn’t have a resource associated with it because the cluster was launched with just one On-Demand Instance.

Because the cluster didn’t have Spot Instances initially, you can observe from the Amazon EMR console that managed scaling generates a new Spot task group to accommodate the Spark executor requested to run on Spot nodes only (see the following screenshot) . Before this integration, managed scaling didn’t take into account the YARN labels requested by an application, potentially leading to unpredictable scaling behaviors. With this release, managed scaling now considers the YARN labels specified by applications, enabling more predictable and accurate scaling decisions.

While waiting for the launch of the new Spot node, we submitted another SparkPi job with identical specifications. However, because the memory required to allocate the new Spark Driver was 10 GB and such resources were currently unavailable in the ON_DEMAND partition, the application remained in a pending state until resources became available to schedule its container.

Upon detecting the lack of resources to allocate the new Spark driver, Amazon EMR managed scaling commenced scaling the core instance group (On-Demand Instances in our cluster) by launching a new core node. After the new core node was launched, YARN promptly allocated the pending container on the new node, enabling the application to start its processing. Subsequently, the application requested additional Spot nodes to allocate its own executors (see the following screenshot).

This example demonstrates how managed scaling and YARN labels work together to improve the resiliency of YARN applications, while using cost-effective job executions over Spot Instances.

When to use Application Manager placement awareness and managed scaling

You can use this placement awareness feature to improve cost-efficiency by using Spot Instances while protecting the Application Manager from being incorrectly shut down due to Spot interruptions. It’s particularly useful when you want to take advantage of the cost savings offered by Spot Instances while preserving the stability and reliability of your jobs running on the cluster. When working with managed scaling and the placement awareness feature, consider the following best practices:

  • Maximum cost-efficiency for non-critical jobs – If you have jobs that don’t have strict service level agreement (SLA) requirements, you can force all Spark executors to run on Spot Instances for maximum cost savings. This can be achieved by setting the following Spark configuration:
    spark.yarn.executor.nodeLabelExpression=SPOT

  • Resilient execution for production jobs – For production jobs where you require a more resilient execution, you might consider not setting the yarn.executor.nodeLabelExpression parameter. When no label is specified, executors are dynamically allocated between both On-Demand and Spot nodes, providing a more reliable execution.
  • Limit dynamic allocation for concurrent applications – When working with managed scaling and clusters with multiple applications running concurrently (for example, an interactive cluster with concurrent user utilization), you should consider setting a maximum limit for Spark dynamic allocation using the dynamicAllocation.maxExecutors setting. This can help manage resources over-provisioning and facilitate predictable scaling behavior across applications running on the same cluster. For more details, see Dynamic Allocation in the Spark documentation.
  • Managed scaling configurations – Make sure your managed scaling configurations are set up correctly to facilitate efficient scaling of Spot Instances based on your workload requirements. For example, set an appropriate value for Maximum On-Demand instances in managed scaling based on the number of concurrent applications you want to run on the cluster. Additionally, if you’re planning to use your On-Demand Instances for running solely AM containers, we recommend setting scheduler.capacity.maximum-am-resource-percent to 1 using the Amazon EMR capacity-scheduler classification.
  • Improve startup time of the nodes – If your cluster is subject to frequent scaling events (for example, you have a long-running cluster that can run multiple concurrent EMR steps), you might want to optimize the startup time of your cluster nodes. When trying to get an efficient node startup, consider only installing the minimum required set of application frameworks in the cluster and, whenever possible, avoid installing non-YARN frameworks such as HBase or Trino, which might delay the startup of processing nodes dynamically attached by Amazon EMR managed scaling. Finally, whenever possible, don’t use complex and time-consuming EMR bootstrap actions to avoid increasing the startup time of nodes launched with managed scaling.

By following these best practices, you can take advantage of the cost savings of Spot Instances while maintaining the stability and reliability of your applications, particularly in scenarios where multiple applications are running concurrently on the same cluster.

Conclusion

In this post, we explored the benefits of the new integration between Amazon EMR managed scaling and YARN node labels, reviewed its implementation and usage, and defined a few best practices that can help you get started. Whether you’re running batch processing jobs, stream processing applications, or other YARN workloads on Amazon EMR, this feature can help you achieve substantial cost savings without compromising on performance or reliability.

As you embark on your journey to use Spot Instances in your EMR clusters, remember to follow the best practices outlined in this post, such as setting appropriate configurations for dynamic allocation, node label expressions, and managed scaling policies. By doing so, you can make sure that your applications run efficiently, reliably, and at the lowest possible cost.


About the authors

Lorenzo Ripani is a Big Data Solution Architect at AWS. He is passionate about distributed systems, open source technologies and security. He spends most of his time working with customers around the world to design, evaluate and optimize scalable and secure data pipelines with Amazon EMR.

Miranda Diaz is a Software Development Engineer for EMR at AWS. Miranda works to design and develop technologies that make it easy for customers across the world to automatically scale their computing resources to their needs, helping them achieve the best performance at the optimal cost.

Sajjan Bhattarai is a Senior Cloud Support Engineer at AWS, and specializes in BigData and Machine Learning workloads. He enjoys helping customers around the world to troubleshoot and optimize their data platforms.

Bezuayehu Wate is an Associate Big Data Specialist Solutions Architect at AWS. She works with customers to provide strategic and architectural guidance on designing, building, and modernizing their cloud-based analytics solutions using AWS.

How CyberArk is streamlining serverless governance by codifying architectural blueprints

Post Syndicated from Anton Aleksandrov original https://aws.amazon.com/blogs/architecture/how-cyberark-is-streamlining-serverless-governance-by-codifying-architectural-blueprints/

This post was co-written with Ran Isenberg, Principal Software Architect at CyberArk and an AWS Serverless Hero.

Serverless architectures enable agility and simplified cloud resource management. Organizations embracing serverless architectures build robust, distributed cloud applications. As organizations grow and the number of development teams increases, maintaining architectural consistency, standardization, and governance across projects becomes crucial.

In this post, you will discover how CyberArk, a leading identity security company, efficiently implements serverless architecture governance, reduces duplicative efforts, and saves months of development time by codifying architectural blueprints. This approach helps to prevent redundant efforts and promotes uniform architectural standards, facilitating the seamless adoption of organizational best practices and governance across diverse teams.

Overview

The risk of duplicative efforts and architectural inconsistencies is particularly pronounced in large organizations, especially for requirements unrelated to specific business domains owned by individual teams. Diverse approaches to Infrastructure-as-Code, CI/CD, observability, and security can lead to inconsistent implementations across teams. Application developers should focus on delivering business value efficiently, rather than navigating the complexities of building and operating distributed architectures while adhering to organizational best practices. To achieve this, you need an approach that empowers developers and provides guardrails to ensure vetted architectural patterns are consistently applied. This solution should enable accelerated delivery without sacrificing agility and innovation.

Some organizations implement internal wiki consolidating architectural guidance. While well-intentioned, relying solely on documentation assumes development teams diligently follow the guidelines, which often requires manual validation and limits scalability. To overcome this limitation, organizations should adopt a scalable approach that codifies, automates, and promotes architectural best practices. This mechanism allows developers to focus on delivering business-domain value and drives standardized operational excellence, governance, and organizational policies adherence.

Introducing serverless blueprints

CyberArk engineering team had over 900 developers. It was looking for ways to ensure they build their serverless services based on vetted architectural and security best practices with fully automated governance controls enforcement. The solution came in the form of codified architecture blueprints and automated tooling.

Serverless architectures are composed using loosely coupled services, integrated based on the application requirements. Application developers use IaC tools such as AWS CDK and HashiCorp Terraform to define their serverless architectures and integration patterns. CyberArk has augmented the IaC with governance tools, such as cdk-nag, AWS Config, and AWS Control Tower. With these complementary tools in place, they’ve built serverless blueprints which include architectural definitions based on organizational best practices, as well as automatically applied governance controls

To illustrate this, consider a simple serverless architecture pattern. In this common pattern, an SQS queue serves as the event source for a Lambda function, which parses incoming messages and updates an Amazon S3 bucket.

A simple serverless architecture with SQS Queue, Lambda function, and S3 Bucket

Figure 1. A simple serverless architecture with SQS Queue, Lambda function, and S3 Bucket

While this pattern seems simple, turning it into an enterprise-ready service requires additional effort. You must consider aspects like resiliency, security, governance, observability, and coding best practices. Let’s examine several examples codified in architectural blueprints at CyberArk.

Error-handling best practices

Your services should be resilient. Retries can help to overcome occasional network hiccups, but you also need to handle scenarios when your function consistently fails to process particular messages (known as poison message) – for example, because of a code bug. This can lead to endless processing loops, data loss, and potential extra charges. To address this, a blueprint can implement a failure handling mechanism with a dead letter queue, alerting, and redrive. This pattern is straightforward to implement and adds extra resiliency to your architecture. It is also generic and does not contain any business domain code. This is a typical example of an architectural pattern that can be codified in a blueprint and reused across development teams.

The simple serverless architecture with added resiliency best practices

Figure 2. The simple serverless architecture with added resiliency best practices

Security best practices

Another example is securing S3 buckets. Organizations must enforce S3 security best practices, such as enabling access logs, blocking public access, and enabling encryption at rest. Codifying these guardrails in architectural blueprints adds an extra layer that allows your developers to comply with organization standards without having to explicitly implement adherence to each best practice and policy on their own.

The simple serverless architecture with added security best practices

Figure 3. The simple serverless architecture with added security best practices

The following code snippet uses AWS CDK to create an S3 bucket with common best practices:

def _create_bucket(self, server_access_logs_bucket: s3.Bucket, is_production_env: bool) -> s3.Bucket:
    # Create an S3 bucket with AWS-managed keys encryption
    bucket = s3.Bucket(
        self,
        constants.BUCKET_NAME,
        versioned=True if is_production_env else False,
        encryption=s3.BucketEncryption.S3_MANAGED,
        block_public_access=s3.BlockPublicAccess.BLOCK_ALL,
        enforce_ssl=True,
        server_access_logs_bucket=server_access_logs_bucket, 
        # redacted
    )

Additional security best practices you can codify in your blueprints include the principle of least privilege access, VPC-attachment, and code signing for sensitive Lambda functions, and using KMS keys for encryption.

Lambda best practices

Your Lambda functions are another example of where blueprints can help. By providing a function blueprint implementing the baseline for capabilities like observability, idempotency, and batch processing out-of-the-box, you enable developers to focus on their business domain code.

Layered view of a Lambda function in CyberArk’s serverless architecture blueprint

Figure 4. Layered view of a Lambda function in CyberArk’s serverless architecture blueprint

CyberArk embeds Powertools for AWS Lambda, a toolkit that implements serverless best practices to increase developer velocity, into their blueprints. The following code snippets embed Powertools for enabling enhanced observability and implementing batch processing.

# CDK code
lambda_function = lambda.Function(
    environment={
        constants.POWERTOOLS_SERVICE_NAME: constants.SERVICE_NAME,
        constants.POWER_TOOLS_LOG_LEVEL: 'INFO',  
    },
    tracing=lambda.Tracing.ACTIVE,
    layers=["powertools-layer"],
    log_format=lambda.LogFormat.JSON.value,
    system_log_level=lambda.SystemLogLevel.INFO.value
    # redacted
)

# Function handler code
processor = BatchProcessor(event_type=EventType.SQS, model=OrderSqsRecord)

@logger.inject_lambda_context
@metrics.log_metrics
@tracer.capture_lambda_handler(capture_response=False)
def lambda_handler(event, context: LambdaContext):
    return process_partial_response(
        event=event,
        record_handler=record_handler,
        processor=processor,
        context=context,
)

Governance controls

Blueprints are not static; they evolve as you adopt new best practices and governance policies. Developers start with a vetted blueprint but can deviate as they evolve their serverless apps. To enable continuous adherence, it is important to use a combination of organizational governance tools, such as AWS Control Tower and Service Control Policies, and architecture blueprints that embed governance controls automatically enforced by CI/CD. This ensures that any architectural modification will be validated for adhering to organizational standards.

AWS defines proactive controls as mechanisms that prevent developers from deploying resources that violate governance policies. Detective controls are mechanisms that detect, log, and alert on resource or configuration changes that violate governance policies.

Applying governance controls at all stages of CI/CD

Figure 5. Applying governance controls at all stages of CI/CD

Depending on the IaC tool, you can leverage different types of governance tools for proactive control enforcement. The following screenshot shows a proactive control violation identified during CI/CD via the cdk-nag framework. You can see cdk-nag throwing an error for the stack deployment due to Lambda execution role being assigned wild-card permissions.

Exception thrown by cdk-nag for using wildcard permissions

Figure 6. Exception thrown by cdk-nag for using wildcard permissions

See the practical guide for implementing serverless governance.

Sample code

Ran Isenberg has open-sourced a sample Lambda Handler Cookbook blueprint illustrating some of the patterns CyberArk has adopted.

Additional serverless architecture patterns you might consider implementing in your blueprints are server-side encryption for an Amazon SNS topic with an encrypted Amazon SQS queue subscribed, auto-adjusting provisioned concurrency for Lambda functions, secure Serverless Aurora Cluster with bastion host, and more.

See more patterns implemented at serverlessland.com and cdkpatterns.com

Conclusion

Translating architectural and security best practices into modular IaC definitions, such as CDK constructs or Terraform modules, is a scalable and reusable technique that allows CyberArk to reduce duplicative efforts and save months of development time. Using IaC tools like AWS CDK or Terraform, augmented with governance tools like cdk-nag or checkov, enabled CyberArk to share implementation best practices and encode governance policies into architectural blueprints. Development teams adopting these blueprints do not need to reinvent the wheel, each trying to solve the same problem on their own. Instead, they leverage the knowledge codified in the blueprint.

Further reading

Improving platform resilience at Cloudflare through automation

Post Syndicated from Opeyemi Onikute original https://blog.cloudflare.com/improving-platform-resilience-at-cloudflare

Failure is an expected state in production systems, and no predictable failure of either software or hardware components should result in a negative experience for users. The exact failure mode may vary, but certain remediation steps must be taken after detection. A common example is when an error occurs on a server, rendering it unfit for production workloads, and requiring action to recover.

When operating at Cloudflare’s scale, it is important to ensure that our platform is able to recover from faults seamlessly. It can be tempting to rely on the expertise of world-class engineers to remediate these faults, but this would be manual, repetitive, unlikely to produce enduring value, and not scaling. In one word: toil; not a viable solution at our scale and rate of growth.

In this post we discuss how we built the foundations to enable a more scalable future, and what problems it has immediately allowed us to solve.

Growing pains

The Cloudflare Site Reliability Engineering (SRE) team builds and manages the platform that helps product teams deliver our extensive suite of offerings to customers. One important component of this platform is the collection of servers that power critical products such as Durable Objects, Workers, and DDoS mitigation. We also build and maintain foundational software services that power our product offerings, such as configuration management, provisioning, and IP address allocation systems.

As part of tactical operations work, we are often required to respond to failures in any of these components to minimize impact to users. Impact can vary from lack of access to a specific product feature, to total unavailability. The level of response required is determined by the priority, which is usually a reflection of the severity of impact on users. Lower-priority failures are more common — a server may run too hot, or experience an unrecoverable hardware error. Higher-priority failures are rare and are typically resolved via a well-defined incident response process, requiring collaboration with multiple other teams.

The commonality of lower-priority failures makes it obvious when the response required, as defined in runbooks, is “toilsome”. To reduce this toil, we had previously implemented a plethora of solutions to automate runbook actions such as manually-invoked shell scripts, cron jobs, and ad-hoc software services. These had grown organically over time and provided solutions on a case-by-case basis, which led to duplication of work, tight coupling, and lack of context awareness across the solutions.

We also care about how long it takes to resolve any potential impact on users. A resolution process which involves the manual invocation of a script relies on human action, increasing the Mean-Time-To-Resolve (MTTR) and leaving room for human error. This risks increasing the amount of errors we serve to users and degrading trust.

These problems proved that we needed a way to automatically heal these platform components. This especially applies to our servers, for which failure can cause impact across multiple product offerings. While we have mechanisms to automatically steer traffic away from these degraded servers, in some rare cases the breakage is sudden enough to be visible.

Solving the problem

To provide a more reliable platform, we needed a new component that provides a common ground for remediation efforts. This would remove duplication of work, provide unified context-awareness and increase development speed, which ultimately saves hours of engineering time and effort.

A good solution would not allow only the SRE team to auto-remediate, it would empower the entire company. The key to adding self-healing capability was a generic interface for all teams to self-service and quickly remediate failures at various levels: machine, service, network, or dependencies.

A good way to think about auto-remediation is in terms of workflows. A workflow is a sequence of steps to get to a desired outcome. This is not dissimilar to a manual shell script which executes what a human would otherwise do via runbook instructions. Because of this logical fit with workflows, we decided to adopt Temporal

Temporal is a durable execution platform which is useful to gracefully manage infrastructure failures such as network outages and transient failures in external service endpoints. This capability meant we only needed to build a way to schedule “workflow” tasks and have Temporal provide reliability guarantees. This allowed us to focus on building out the orchestration system to support the control and flow of workflow execution in our data centers. 

How does Temporal work?


Before we discuss the system that provides our self-healing functions, let’s explore how the workflow execution engine works, as its native architecture provided numerous benefits that we took advantage of to build a more robust foundation.

The most attractive feature Temporal offered us was the ability to write code that has reliability baked in. Some examples of these primitives are automatic retries, timeouts, rollbacks, and queueing. The Temporal Platform consists of the Temporal Cluster and Worker processes (application code that contains your custom logic).

This architecture allowed us to write our application logic as we normally would, with the added benefits of Temporal. Since Temporal Workers are external to the cluster, we can run tasks anywhere across our global network — a feature that made it easy to build an extensible, easy-to-understand framework for automating tasks.

In Temporal terms, control is provided by the basic principles used to provide workflow execution — Workflows and Activities. A Workflow is simply a sequence of Activities, which are functions that ideally do only ONE task, such as making a request to an external service or rebooting a machine.

Control of workflow behavior can be done using ActivityOptions. This is where you can define timeouts for workflow execution, retry policies, and task queues. Each worker can poll several task queues for both Workflow and Activity tasks. If no worker is polling the task queue in which a Workflow task is declared, nothing happens.

Temporal’s documentation provides a good introduction to writing Temporal workflows.

Building on Temporal

Below, we describe how our automatic remediation system works. It is essentially a way to schedule tasks across our global network with built-in reliability guarantees. With this system, teams can serve their customers more reliably. An unexpected failure mode can be recognized and immediately mitigated, while the root cause can be determined later via a more detailed analysis.

Step one: we need a coordinator


After our initial testing of Temporal, it was now possible to write workflows. But we needed a way to schedule workflow tasks from other internal services. The coordinator was built to serve this purpose, and became the primary mechanism for the authorisation and scheduling of workflows. 

The most important roles of the coordinator are authorisation, workflow task routing, and safety constraints enforcement. Each consumer is authorized via mTLS authentication, and the coordinator uses an ACL to determine whether to permit the execution of a workflow. An ACL configuration looks like the following example.

server_config {
    enable_tls = true
    [...]
    route_rule {
      name  = "global_get"
      method = "GET"
      route_patterns = ["/*"]
      uris = ["spiffe://example.com/worker-admin"]
    }
    route_rule {
      name = "global_post"
      method = "POST"
      route_patterns = ["/*"]
      uris = ["spiffe://example.com/worker-admin"]
      allow_public = true
    }
    route_rule {
      name = "public_access"
      method = "GET"
      route_patterns = ["/metrics"]
      uris = []
      allow_public = true
      skip_log_match = true
    }
}

Each workflow specifies two key characteristics: where to run the tasks and the safety constraints, using an HCL configuration file. Example constraints could be whether to run on only a specific node type (such as a database), or if multiple parallel executions are allowed: if a task has been triggered too many times, that is a sign of a wider problem that might require human intervention. The coordinator uses the Temporal Visibility API to determine the current state of the executions in the Temporal cluster.

An example of a configuration file is shown below:

task_queue_target = "<target>"

# The following entries will ensure that
# 1. This workflow is not run at the same time in a 15m window.
# 2. This workflow will not run more than once an hour.
# 3. This workflow will not run more than 3 times in one day.
#
constraint {
    kind = "concurency"
    value = "1"
    period = "15m"
}

constraint {
    kind = "maxExecution"
    value = "1"
    period = "1h"
}

constraint {
    kind = "maxExecution"
    value = "3"
    period = "24h"
    is_global = true
}

Step two: Task Routing is amazing


An unforeseen benefit of using a central Temporal cluster was the discovery of Task Routing. This feature allows us to schedule a Workflow/Activity on any server that has a running Temporal Worker, and further segment by the type of server, its location, etc. For this reason, we have three primary task queues — the general queue in which tasks can be executed by any worker in the datacenter, the node type queue in which tasks can only be executed by a specific node type in the datacenter, and the individual node queue where we target a specific node for task execution.

We rely on this heavily to ensure the speed and efficiency of automated remediation. Certain tasks can be run in datacenters with known low latency to an external resource, or a node type with better performance than others (due to differences in the underlying hardware). This reduces the amount of failure and latency we see overall in task executions. Sometimes we are also constrained by certain types of tasks that can only run on a certain node type, such as a database.

Task Routing also means that we can configure certain task queues to have a higher priority for execution, although this is not a feature we have needed so far. A drawback of task routing is that every Workflow/Activity needs to be registered to the target task queue, which is a common gotcha. Thankfully, it is possible to catch this failure condition with proper testing.

Step three: when/how to self-heal?

None of this would be relevant if we didn’t put it to good use. A primary design goal for the platform was to ensure we had easy, quick ways to trigger workflows on the most important failure conditions. The next step was to determine what the best sources to trigger the actions were. The answer to this was simple: we could trigger workflows from anywhere as long as they are properly authorized and detect the failure conditions accurately.

Example triggers are an alerting system, a log tailer, a health check daemon, or an authorized engineer via a chatbot. Such flexibility allows a high level of reuse, and permits to invest more in workflow quality and reliability.

As part of the solution, we built a daemon that is able to poll a signal source for any unwanted condition and trigger a configured workflow. We have initially found Prometheus useful as a source because it contains both service-level and hardware/system-level metrics. We are also exploring more event-based trigger mechanisms, which could eliminate the need to use precious system resources to poll for metrics.

We already had internal services that are able to detect widespread failure conditions for our customers, but were only able to page a human. With the adoption of auto-remediation, these systems are now able to react automatically. This ability to create an automatic feedback loop with our customers is the cornerstone of these self-healing capabilities and we continue to work on stronger signals, faster reaction times, and better prevention of future occurrences.

The most exciting part, however, is the future possibility. Every customer cares about any negative impact from Cloudflare. With this platform we can onboard several services (especially those that are foundational for the critical path) and ensure we react quickly to any failure conditions, even before there is any visible impact.

Step four: packaging and deployment

The whole system is written in golang, and a single binary can implement each role. We distribute it as an apt package or a container for maximum ease of deployment.

We deploy a Temporal-based worker to every server we intend to run tasks on, and a daemon in datacenters where we intend to automatically trigger workflows based on the local conditions. The coordinator is more nuanced since we rely on task routing and can trigger from a central coordinator, but we have also found value in running coordinators locally in the datacenters. This is especially useful in datacenters with less capacity or degraded performance, removing the need for a round-trip to schedule the workflows.

Step five: test, test, test

Temporal provides native mechanisms to test an entire workflow, via a comprehensive test suite that supports end-to-end, integration, and unit testing, which we used extensively to prevent regressions while developing. We also ensured proper test coverage for all the critical platform components, especially the coordinator.

Despite the ease of written tests, we quickly discovered that they were not enough. After writing workflows, engineers need an environment as close as possible to the target conditions. This is why we configured our staging environments to support quick and efficient testing. These environments receive the latest changes and point to a different (staging) Temporal cluster, which enables experimentation and easy validation of changes.

After a workflow is validated in the staging environment, we can then do a full release to production. It seems obvious, but catching simple configuration errors before releasing has saved us many hours in development/change-related-task time.

Deploying to production

As you can guess from the title of this post, we put this in production to automatically react to server-specific errors and unrecoverable failures. To this end, we have a set of services that are able to detect single-server failure conditions based on analyzed traffic data. After deployment, we have successfully mitigated potential impact by taking any errant single sources of failure out of production.

We have also created a set of workflows to reduce internal toil and improve efficiency. These workflows can automatically test pull requests on target machines, wipe and reset servers after experiments are concluded, and take away manual processes that cost many hours in toil.

Building a system that is maintained by several SRE teams has allowed us to iterate faster, and rapidly tackle long-standing problems. We have set ambitious goals regarding toil elimination and are on course to achieve them, which will allow us to scale faster by eliminating the human bottleneck.

Looking to the future

Our immediate plans are to leverage this system to provide a more reliable platform for our customers and drastically reduce operational toil, freeing up engineering resources to tackle larger-scale problems. We also intend to leverage more Temporal features such as Workflow Versioning, which will simplify the process of making changes to workflows by ensuring that triggered workflows run expected versions. 

 We are also interested in how others are solving problems using durable execution platforms such as Temporal, and general strategies to eliminate toil. If you would like to discuss this further, feel free to reach out on the Cloudflare Community and start a conversation!

If you’re interested in contributing to projects that help build a better Internet, our engineering teams are hiring.

Extract insights in a 30TB time series workload with Amazon OpenSearch Serverless

Post Syndicated from Satish Nandi original https://aws.amazon.com/blogs/big-data/extract-insights-in-a-30tb-time-series-workload-with-amazon-opensearch-serverless/

In today’s data-driven landscape, managing and analyzing vast amounts of data, especially logs, is crucial for organizations to derive insights and make informed decisions. However, handling large data while extracting insights is a significant challenge, prompting organizations to seek scalable solutions without the complexity of infrastructure management.

Amazon OpenSearch Serverless reduces the burden of manual infrastructure provisioning and scaling while still empowering you to ingest, analyze, and visualize your time-series data, simplifying data management and enabling you to derive actionable insights from data.

We recently announced a new capacity level of 30TB for time series data per account per AWS Region. The OpenSearch Serverless compute capacity for data ingestion and search/query is measured in OpenSearch Compute Units (OCUs), which are shared among various collections with the same AWS Key Management Service (AWS KMS) key. To accommodate larger datasets, OpenSearch Serverless now supports up to 500 OCUs per account per Region, each for indexing and search respectively, more than double from the previous limit of 200. You can configure the maximum OCU limits on search and indexing independently, giving you the reassurance of managing costs effectively. You can also monitor real-time OCU usage with Amazon CloudWatch metrics to gain a better perspective on your workload’s resource consumption. With the support for 30TB datasets, you can analyze data at the 30TB level to unlock valuable operational insights and make data-driven decisions to troubleshoot application downtime, improve system performance, or identify fraudulent activities.

This post discusses how you can analyze 30TB time series datasets with OpenSearch Serverless.

Innovations and optimizations to support larger data size and faster responses

Sufficient disk, memory, and CPU resources are crucial for handling extensive data effectively and conducting thorough analysis. These resources are not just beneficial but crucial for our operations. In time series collections, the OCU disk typically contains older shards that are not frequently accessed, referred to as warm shards. We have introduced a new feature called warm shard recovery prefetch. This feature actively monitors recently queried data blocks for a shard. It prioritizes them during shard movements, such as shard balancing, vertical scaling, and deployment activities. More importantly, it accelerates auto-scaling and provides faster readiness for varying search workloads, thereby significantly improving our system’s performance. The results provided later in this post provide details on the improvements.

A few select customers worked with us on early adoption prior to General Availability. In these trials, we observed up to 66% improvement in warm query performance for some customer workloads. This significant improvement shows the effectiveness of our new features. Additionally, we have enhanced the concurrency between coordinator and worker nodes, allowing more requests to be processed as the OCUs increases through auto scaling. This enhancement has resulted in up to a 10% improvement in query performance for hot and warm queries.

We have enhanced our system’s stability to handle time-series collections of up to 30 TB effectively. Our team is committed to improving system performance, as demonstrated by our ongoing enhancements to the auto-scaling system. These improvements comprised of enhanced shard distribution for optimal placement after rollover, auto-scaling policies based on queue length, and a dynamic sharding strategy that adjusts shard count based on ingestion rate.

In the following section we share an example test setup of a 30TB workload that we used internally, detailing the data being used and generated, along with our observations and results. Performance may vary depending on the specific workload.

Ingest the data

You can use the load generation scripts shared in the following workshop, or you can use your own application or data generator to create a load. You can run multiple instances of these scripts to generate a burst in indexing requests. As shown in the following screenshot, we tested with an index, sending approximately 30 TB of data over a period of 15 days. We used our load generator script to send the traffic to a single index, retaining data for 15 days using a data life cycle policy.

Test methodology

We set the deployment type to ‘Enable redundancy’ to enable data replication across Availability Zones. This deployment configuration will lead to 12-24 hours of data in hot storage (OCU disk memory) and the rest in Amazon Simple Storage Service (Amazon S3). With a defined set of search performance and the preceding ingestion expectation, we set the max OCUs to be 500 for both indexing and search.

As part of the testing, we observed auto-scaling behavior and graphed it. The indexing took around 8 hours to get stabilized at 80 OCU.

On the Search side, it took around 2 days to get stabilized at 80 OCU.

Observations:

Ingestion

The ingestion performance achieved was consistently over 2 TB per day

Search

Queries were of two types, with time ranging from 15 minutes to 15 days.

{"aggs":{"1":{"cardinality":{"field":"carrier.keyword"}}},"size":0,"query":{"bool":{"filter":[{"range":{"@timestamp":{"gte":"now-15m","lte":"now"}}}]}}}

For example

{"aggs":{"1":{"cardinality":{"field":"carrier.keyword"}}},"size":0,"query":{"bool":{"filter":[{"range":{"@timestamp":{"gte":"now-1d","lte":"now"}}}]}}}

The following chart provides the various percentile performance on the aggregation query

The second query was

{"query":{"bool":{"filter":[{"range":{"@timestamp":{"gte":"now-15m","lte":"now"}}}],"should":[{"match":{"originState":"State"}}]}}}

For example

{"query":{"bool":{"filter":[{"range":{"@timestamp":{"gte":"now-15m","lte":"now"}}}],"should":[{"match":{"originState":"California"}}]}}}

The following chart provides the various percentile performance on the search query

The following chart summarizes the time range for different queries

Time-range Query P50 (ms) P90 (ms) P95 (ms) P99 (ms)
15 minutes {“aggs”:{“1”:{“cardinality”:{“field”:”carrier.keyword”}}},”size”:0,”query”:{“bool”:{“filter”:[{“range”:{“@timestamp”:{“gte”:”now-15m”,”lte”:”now”}}}]}}} 325 403.867 441.917 514.75
1 day {“aggs”:{“1”:{“cardinality”:{“field”:”carrier.keyword”}}},”size”:0,”query”:{“bool”:{“filter”:[{“range”:{“@timestamp”:{“gte”:”now-1d”,”lte”:”now”}}}]}}} 7,693.06 12,294 13,411.19 17,481.4
1 hour {“aggs”:{“1”:{“cardinality”:{“field”:”carrier.keyword”}}},”size”:0,”query”:{“bool”:{“filter”:[{“range”:{“@timestamp”:{“gte”:”now-1h”,”lte”:”now”}}}]}}} 1,061.66 1,397.27 1,482.75 1,719.53
1 year {“aggs”:{“1”:{“cardinality”:{“field”:”carrier.keyword”}}},”size”:0,”query”:{“bool”:{“filter”:[{“range”:{“@timestamp”:{“gte”:”now-1y”,”lte”:”now”}}}]}}} 2,758.66 10,758 12,028 22,871.4
4 hour {“aggs”:{“1”:{“cardinality”:{“field”:”carrier.keyword”}}},”size”:0,”query”:{“bool”:{“filter”:[{“range”:{“@timestamp”:{“gte”:”now-4h”,”lte”:”now”}}}]}}} 3,870.79 5,233.73 5,609.9 6,506.22
7 day {“aggs”:{“1”:{“cardinality”:{“field”:”carrier.keyword”}}},”size”:0,”query”:{“bool”:{“filter”:[{“range”:{“@timestamp”:{“gte”:”now-7d”,”lte”:”now”}}}]}}} 5,395.68 17,538.12 19,159.18 22,462.32
15 minutes {“query”:{“bool”:{“filter”:[{“range”:{“@timestamp”:{“gte”:”now-15m”,”lte”:”now”}}}],”should”:[{“match”:{“originState”:”California”}}]}}} 139 190 234.55 6,071.96
1 day {“query”:{“bool”:{“filter”:[{“range”:{“@timestamp”:{“gte”:”now-1d”,”lte”:”now”}}}],”should”:[{“match”:{“originState”:”California”}}]}}} 678.917 1,366.63 2,423 7,893.56
1 hour {“query”:{“bool”:{“filter”:[{“range”:{“@timestamp”:{“gte”:”now-1h”,”lte”:”now”}}}],”should”:[{“match”:{“originState”:”Washington”}}]}}} 259.167 305.8 343.3 1,125.66
1 year {“query”:{“bool”:{“filter”:[{“range”:{“@timestamp”:{“gte”:”now-1y”,”lte”:”now”}}}],”should”:[{“match”:{“originState”:”Washington”}}]}}} 2,166.33 2,469.7 4,804.9 9,440.11
4 hours {“query”:{“bool”:{“filter”:[{“range”:{“@timestamp”:{“gte”:”now-4h”,”lte”:”now”}}}],”should”:[{“match”:{“originState”:”Washington”}}]}}} 462.933 653.6 725.3 1,583.37
7 days {“query”:{“bool”:{“filter”:[{“range”:{“@timestamp”:{“gte”:”now-7d”,”lte”:”now”}}}],”should”:[{“match”:{“originState”:”Washington”}}]}}} 1,353 2,745.1 4,338.8 9,496.36

Conclusion

OpenSearch Serverless not only supports a larger data size than prior releases but also introduces performance improvements like warm shard pre-fetch and concurrency optimization for better query response. These features reduce the latency of warm queries and improve auto-scaling to handle varied workloads. We encourage you to take advantage of the 30TB index support and put it to the test! Migrate your data, explore the improved throughput, and take advantage of the enhanced scaling capabilities.

To get started, refer to Log analytics the easy way with Amazon OpenSearch Serverless. To get hands-on experience with OpenSearch Serverless, follow the Getting started with Amazon OpenSearch Serverless workshop, which has a step-by-step guide for configuring and setting up an OpenSearch Serverless collection.

If you have feedback about this post, share it in the comments section. If you have questions about this post, start a new thread on the Amazon OpenSearch Service forum or contact AWS Support.


About the authors

Satish Nandi is a Senior Product Manager with Amazon OpenSearch Service. He is focused on OpenSearch Serverless and has years of experience in networking, security and AI/ML. He holds a Bachelor’s degree in Computer Science and an MBA in Entrepreneurship. In his free time, he likes to fly airplanes and hang gliders and ride his motorcycle.

Milav Shah is an Engineering Leader with Amazon OpenSearch Service. He focuses on search experience for OpenSearch customers. He has extensive experience building highly scalable solutions in databases, real-time streaming and distributed computing. He also possesses functional domain expertise in verticals like Internet of Things, fraud protection, gaming and AI/ML. In his free time, he likes to ride cycle, hike, and play chess.

Qiaoxuan Xue is a Senior Software Engineer at AWS leading the search and benchmarking areas of the Amazon OpenSearch Serverless Project. His passion lies in finding solutions for intricate challenges within large-scale distributed systems. Outside of work, he enjoys woodworking, biking, playing basketball, and spending time with his family and dog.

Prashant Agrawal is a Sr. Search Specialist Solutions Architect with Amazon OpenSearch Service. He works closely with customers to help them migrate their workloads to the cloud and helps existing customers fine-tune their clusters to achieve better performance and save on cost. Before joining AWS, he helped various customers use OpenSearch and Elasticsearch for their search and log analytics use cases. When not working, you can find him traveling and exploring new places. In short, he likes doing Eat → Travel → Repeat.

Designing Serverless Integration Patterns for Large Language Models (LLMs)

Post Syndicated from Chris McPeek original https://aws.amazon.com/blogs/compute/designing-serverless-integration-patterns-for-large-language-models-llms/

This post is written by Josh Hart, Principal Solutions Architect and Thomas Moore, Senior Solutions Architect

This post explores best practice integration patterns for using large language models (LLMs) in serverless applications. These approaches optimize performance, resource utilization, and resilience when incorporating generative AI capabilities into your serverless architecture.

Overview of serverless, LLMs and example use case

Organizations of all shapes and sizes are harnessing LLMs to build generative AI applications to deliver new customer experiences. Serverless technologies such as AWS Lambda, AWS Step Functions and Amazon API Gateway enable you to move from idea to market faster without thinking about servers. The pay-for-use billing model also allows for increased agility at an optimal cost.

The examples in this post leverage Amazon Bedrock, a fully managed service to access foundation models (FMs). The same principles apply to LLMs hosted on other platforms such as Amazon SageMaker. Amazon Bedrock allows developers to consume LLMs via an API without the complexities of infrastructure management. Amazon SageMaker is a fully managed service to build, train and deploy machine learning models.

The example use-case in this post is leveraging LLMs to create compelling marketing content for the launch of a new family SUV. Images of the vehicle were pre-generated using Amazon Titan Image Generator in Amazon Bedrock, which are shown below.

Three different images of a new family SUV generated by Amazon Titan Image Generator.

Example use case images generated using Titan Image Generator

As organizations adopt LLMs to power generative AI applications, serverless architectures offer an attractive approach for rapid development and cost-effective scaling. The following sections explore several serverless integration patterns to build cost-effective, performant, and fault-tolerant generative AI applications.

Direct AWS Lambda call

Architecture diagram showing AWS Lambda invoking Amazon Bedrock using the InvokeModel API call.

Direct call to Amazon Bedrock from AWS Lambda

The simplest serverless integration pattern is directly calling Bedrock in Lambda using the AWS SDK. Below is an example Lambda function using the Python SDK (boto3), calling the Bedrock InvokeModel API.

import json
import boto3
brt = boto3.client(service_name='bedrock-runtime')

def lambda_handler(event, context):
    body = json.dumps({
        "anthropic_version": "bedrock-2023-05-31",
        "max_tokens": 1000,
        "messages": [{
            "role": "user",
            "content": [{
                "type": "text",
                "text":"Create a 500 word car advert given these images and the following specification: \n {}".format(event['spec'])
            },
            {
                "type": "image",
                "source": {
                    "type": "base64",
                    "media_type": "image/jpeg",
                    "data": event['image']
                }
            }]
        }]
    })

    modelId = 'anthropic.claude-3-sonnet-20240229-v1:0'
    accept = 'application/json'
    contentType = 'application/json'
    response = brt.invoke_model(body=body, modelId=modelId, accept=accept, contentType=contentType)
    response_body = json.loads(response.get('body').read())

    return {
        'statusCode': 200,
        'body': response_body["content"][0]["text"]
    }

The above code requires the Lambda function execution role to have the correct AWS Identity and Access Management (IAM) permissions to Amazon Bedrock, specifically the bedrock:InvokeModel action.

The example uses the Anthropic Claude 3 Sonnet LLM and the Anthropic Claude Messages API for the payload. The InvokeModel call is synchronous and will therefore wait for a response from the LLM. Depending on the model and prompt, the call can take several seconds. Ensure your Lambda function timeout is set appropriately. In most cases it will need to be increased from the default of 3 seconds.

The boto3 client has a default timeout of 60 seconds. Depending on the use case, you may need to increase the boto3 client timeout as shown in the sample code below.

from botocore.config import Config
# Set the read timeout to 600 seconds (10 minutes)
config = Config(read_timeout=600)

# Create the Bedrock client with the custom read timeout configuration
boto3_bedrock = boto3.client(service_name='bedrock-runtime', config=config)

When working with LLMs, the generated text is often substantial, leading to increased response times or even timeouts. Amazon Bedrock provides the ability to stream responses using InvokeModelWithResponseStream which allows you to process and consume the generated text in chunks as it becomes available. This enables a faster response to the client and allows at least a partial response even if a timeout occurs.

When using response streaming with Lambda functions you should set the boto3 read_timeout to a lower value than the function execution timeout, meaning you will have the option to return at least some content. In some situations this is preferred to no response at all. For example, you might set your Lambda function timeout to 2 minutes and your boto3 read timeout to 90 seconds. This gives you 30 seconds to take additional action. Depending on the failure scenario, you might take various actions:

  • Transient errors such as rate limiting or service quotas: Consider backing off and retrying the request or load-balancing requests to another region with cross-region inference.
  • Timeout errors when the boto3 read timeout is hit: Decide whether to retry the request with a simplified prompt (or a shorter response length) or return a partial response.

Prompt chaining with AWS Step Functions    

The direct Lambda pattern works well for simple single-prompt inference. Accomplishing complex tasks with LLMs requires a technique called prompt chaining, where tasks are broken down into smaller well-defined subtask prompts and each prompt is fed to the LLM in a defined order.

Prompt chaining inside a single Lambda function can be time consuming, and may exceed the maximum Lambda timeout of 15 minutes in some cases. AWS Step Functions can be used to solve this issue by orchestrating calls to LLMs. Bedrock has an optimized integration for Step Functions which allows you to use Run as Job (.sync). This integration pattern means Step Functions will wait for the InvokeModel request to complete before progressing to the next state. With Step Functions Standard Workflows you only pay for state transitions, which reduces the cost for Lambda idle wait time.

The below example shows prompt chaining with Step Functions using direct integrations only. The example eliminates the need of custom Lambda code.

Workflow diagram for AWS Step Functions showing an example prompt chain to generate different text content for showroom vehicles.

Prompt chaining using AWS Step Functions

  1. The user input (vehicle description) is passed to Amazon Bedrock via the Step Functions optimized integration.
  2. The generated output of the InvokeModel API call is passed via the ResultPath to the next step.
  3. The state machine sets the input of the next step based on the output of the previous step using the Pass state.
  4. The output of each inference request continues to be passed between each step in the workflow.
  5. The last step runs an inference request and the final result is returned as the output of the state machine.

Another advantage to using AWS Step Functions to invoke the LLM is the built-in error handling. Step Functions can be setup to automatically retry on error and allows you to configure a backoff rate and add jitter to help control throttling. No custom coding is required.

View of the different error handling options in AWS Step Functions for a particular action. Including internal, max attempts, backoff rate, max delay and jitter.

Built-in error handling options for an action in an AWS Step Functions workflow

Handling throttling is particularly important when you are approaching the Bedrock service quota limits, such as the number of requests processed per minute for a particular model. Be aware that some limits are hard limits and cannot be adjusted. See the Bedrock service quotas documentation for the latest information.

Parallel prompts with AWS Step Functions

The performance of the application can be improved by breaking down tasks into smaller sub-tasks and running them in parallel. This can dramatically decrease the overall response time, especially for larger models and complex prompts. In the following example, parallel processing reduced the total execution time of the state machine from 30.8 seconds to 19.2 seconds, an improvement of 37.7% when compared to the same steps run in sequence.

The below example uses the Step Functions parallel state to perform Bedrock InvokeModel actions in parallel.

Example workflow showing prompt chaining using the AWS Step Functions parallel state.

Prompt chaining example using parallel state in AWS Step Functions

  1. The user input (vehicle description) is passed to Amazon Bedrock via the Step Functions optimized integration.
  2. The Step Functions parallel state allows branching logic to perform multiple steps in parallel.
  3. Complex inference tasks are run in parallel to reduce end-to-end execution time.
  4. Shorter tasks can be combined to balance branch execution time with longer running tasks.
  5. The generated output is combined and the final response returned.

In addition to the parallel state, the Step Functions map state can be used to run the same action multiple times in parallel with different inputs. For example if you wanted to generate marketing materials for 100 vehicles with data stored in Amazon S3 you could run the above workflow nested in a distributed map state.

Result caching

Generating text using LLMs can be a computationally intensive and a time-consuming process, especially for complex prompts or long content generation. To improve performance and reduce latency, caching should be used where possible by storing and reusing previously generated responses. This concept is explored in detail in Mastering LLM Caching for Next-Generation AI.

Caching can be implemented at different levels within your application architecture, each with its own advantages and trade-offs. Here are some examples:

  1. Caching inside the Lambda execution environment: if your Lambda function receives repeated prompts or inputs, you can store these results inside memory or the /tmp directory of a warmed execution environment.
  2. External caching services: to overcome the limitations of in-memory caching and leverage more robust caching solutions, you can integrate with external services to store previous results like Amazon ElastiCache (for Redis or Memcached) or Amazon DynamoDB.

The example below uses a Step Functions workflow to check for a cached response in DynamoDB before invoking the model. The cache key in this case could be the LLM prompt. This helps to reduce costs whilst improving performance. The example generates custom vehicle descriptions based on a particular persona, for example to focus on safety features and luggage space for a family, or performance specifications for a motorsport enthusiast.

Example AWS Step Functions workflow that uses Amazon DynamoDB to store and retrieve previously generated LLM responses.

Example AWS Step Functions that uses Amazon DynamoDB to cache LLM responses

When implementing caching, it is crucial to consider factors such as cache invalidation strategies, cache size limitations, and data consistency requirements. For example, if your LLM generates dynamic or personalized content, caching may not be suitable, as the responses could be stale or incorrect for different users or contexts.

Conclusion

This post explored integration patterns for consuming LLMs in serverless applications, enabling an efficient and reliable next generation experience for customers. Single-prompt inference can be achieved with AWS Lambda using the AWS SDK.

Responses from LLMs can be large and often leads to manipulating large text responses in memory, especially for Retrieval-Augmented Generation (RAG) use cases. It’s therefore important to select an optimal memory configuration for your function, and the recommended way to do this is using the AWS Lambda Power Tuning.

When more complex prompt chaining is required it’s best practice to explore Step Functions as a way to reduce idle wait time and avoid being limited by the Lambda 15 minute timeout. Step Functions also bring the benefits of an optimized integration for Bedrock, as well as the ability to handle errors and run tasks in parallel.

Remember that model choice is also an important consideration to balance cost, performance and output capabilities. This is discussed further in Choose the best foundational model for your AI applications.

To find more serverless patterns using Amazon Bedrock take a look at Serverless Land.

Empowering builders: introducing the Dev Alliance and Workers Launchpad Cohort #4

Post Syndicated from Melissa Kargiannakis original https://blog.cloudflare.com/launchpad-cohort4-dev-starter-pack

Today we’re announcing the Dev Starter Pack, an alliance of innovative tools for developers to get started with discounts and free services. We’re also excited to share an update on our Workers Launchpad Program.

Creating from the ground up often means spending countless hours piecing together the right development stack, navigating different pricing models, and managing growing costs — all of which can take your focus away from what truly matters: building your product and growing your business.

Introducing Dev Starter Pack: the tools you need to start building your startup

Hey! Dani Grant here, one of the first PMs at Cloudflare and co-founder of Jam.dev. Ten years ago (during 2014’s Birthday Week), Cloudflare launched Universal SSL, making SSL free on the Internet for the first time, and in one night doubling the size of the encrypted web.

I was a college student back then, and I immediately became enraptured by Cloudflare’s mission: helping build a better Internet. As part of this mission, Cloudflare has developed powerful tools typically accessible only to Internet giants, oftentimes offering them for free to developers and individuals alike. Heck yeah! I joined Cloudflare in January 2015, and 5 years after that, co-founded a developer tool company called Jam, inspired by the impact that I saw building tools for developers could have while at Cloudflare.

It’s now 10 years later, and a lot has changed –– “software ate the world” and it’s now powering all aspects of our lives, from health to finances to how we work. It’s more important than ever to empower every developer with the best tools available, because the faster we build software, the sooner people’s experiences improve.

Today we’re thrilled to announce the Dev Starter Pack, an alliance of like-minded dev tool companies giving away their services for free, or heavily discounting them for developers who want to start companies and build the future.

Not only does this stack include all the tools you need to build a startup, it also includes all the tools you need to build AI-powered features. We believe that the next wave of startups will be AI-native, as AI becomes as ubiquitous as the electricity that powers the servers.

We haven’t even scratched the surface of what’s possible with AI, and we hope this launch gets developers closer to solving the challenges of building non-deterministic software.

If you’re a software engineer, and you want to build a project or a company and need an off the shelf stack of dev tools to get started, go to devstarterpack.io to start using all of these tools.

Each provider is offering developers a heavily discounted or even free plan to get started building. You can redeem these services by either using the special code “devstarterpack” or selecting “Dev Starter Pack” while applying to relevant programs.

We welcome more tools to join the alliance — this is just the beginning. If you are building a developer tool and would like to include your product in the Dev Starter Pack, let us know here, so we can include you. 

What will you build?

We are very excited to see what you will build. Please share with us in Cloudflare’s Discord and community forum, so we can support you however it makes sense.

Software developers are changing the world, and we believe in providing support to help you make an even greater impact. If you’re looking for additional funding or support, check out Cloudflare’s Launchpad for developers turned founders building startups.


Introducing Workers Launchpad Cohort #4

Melissa and Chris from the Cloudflare for Startups team here. Our team is blown away by what customers are demonstrating on the Developer Platform. Just a few weeks ago, our Workers Launchpad Cohort #3 wrapped up. On Demo Day, customers demoed their applications built on Cloudflare, spanning AI, dev tools, IaaS, observability, SaaS, media, and beyond. We’re incredibly proud of Cohort #3 participants, and we look forward to their continued success with Cloudflare.

Following Demo Day of Workers Launchpad Cohort #3, we’ve been excited to receive a surge of new applications from startups around the world. These startups are pushing the boundaries of innovation, particularly in areas like observability, PaaS, AI, automation, e-commerce, and other industries. Many startups that applied this go-around demonstrated that they’ve built some great applications on Cloudflare, and today, we’re excited to announce the accepted participants for our upcoming Workers Launchpad Cohort #4.

Let’s take a look at what Cohort #4 participants are building in their own words:

Adster

Hyperscale revenue powered by real-time data intelligence and AI

Almeta

Predict customer behavior on your website

Best Parents

Disruptive educational travel marketplace for Gen Z under 18

Comigo

Companion app to make therapy an engaging daily practice

Datastrato

A unified data catalog for generative AI infrastructure

Equimake

Create professional 3D projects without technical experience

Evefan

Your own Internet scale events infrastructure

Eventuall

Connecting stars with their fans in paid meet & greets and virtual experiences

Fermat

No-code solution to deploy AI models as internal tools

Fiberplane

Development tool that uses observability data to help test and debug APIs

Firetiger

An engineering observability tool that operates at scale inside customer infrastructure

Flightcast

Video-first podcast hosting & distribution

FlightLevel Technologies

AI Analytics and Footage in the aviation industry.

Gitlip

Powerful, collaborative and lightweight computing platform based on Git

GrackerAI

AI-powered organic growth engine for cybersecurity B2B SaaS

Hackernoon

Community-driven blogging network read by millions of technologists

Hanabi.REST

Prompt to REST API with AI-driven building, testing, and deployment

Infrastack

Next-gen application intelligence and observability platform for developers

June

AI productivity companion

Leed AI

Combined marketing workflows, website, and customer journey for a seamless, AI-accelerated experience

lookbk

Make the Internet more shoppable, starting with fashion on socials

Materialized Intelligence

Data-intensive inference solutions

Maxint

Multi-platform money management powered by AI

Midio

Visual tool to build software and AI agents

NikaPlanet

Transformative geospatial analytics experience with Google Colab, QGIS, ChatGPT, and Miro in one solution

NotHotDog

AI-Powered API Testing Tool

Outerbase

View, edit, query, and visualize your data with AI

Procureezy

AI procurement platform to empower hardware engineers to source smarter and launch sooner

Proma

Process management and automation platform to get work done fast

Render Better

Increase e-commerce revenue by optimizing your site speed, automatically

Sherpo

AI-first no-code platform to build and sell digital content

Speak_

AI platform to surface top talent by evaluating candidates against custom criteria

Tightknit

Embedded community engagement platform built for SaaS

Tinfoil

Powerful analytics with cryptographic privacy guarantees

Velvet

AI gateway to monitor, evaluate, and optimize features

Webstudio

An advanced visual site builder that connects to any headless CMS

Zipr

Streamlined visitor management

The Cloudflare team is ecstatic to work with the amazing participants of Cohort #4. If you want to follow along on Cohort #4’s journey, be sure to follow @CloudflareDev on X and join our Developer Discord server.

Are you a startup building on Cloudflare? Apply for Cohort #5!

Let’s Architect! Building multi-tenant SaaS systems

Post Syndicated from Luca Mezzalira original https://aws.amazon.com/blogs/architecture/lets-architect-building-multi-tenant-saas-systems/

Software as a Service (SaaS) applications offer a transformative solution for businesses worldwide, delivering on-demand software solutions to a global audience. However, building a successful SaaS platform demands on meticulous architectural planning, especially given the inherent challenges of multi-tenancy. It’s also essential to ensure that each tenant’s data remains isolated and protected from unauthorized access and that multi-tenant systems are cost-optimized and can sustain the scaling of the SaaS business provider.

In this blog post, we will explore some of the key elements and best practices for designing and deploying secure and efficient SaaS systems on AWS.

Building cost-optimized multi-tenant SaaS architectures

Cost is a key factor to consider when we design new systems. Multi-tenancy requires teams to think beyond the basics of auto scaling, adopting strategies to allow their architecture to support a complex cost-scaling challenges. In this session, the speaker covers some design patterns for distributed systems to support the continually evolving scale needs of the environment, while optimizing the cost of the infrastructure.

The architectural model chosen for deploying multi-tenant systems—pooled, siloed, or mixed—significantly influences the cost optimization strategy. Each approach offers distinct trade-offs in terms of resource allocation, scalability, and cost efficiency.

Figure 1. The architectural model chosen for deploying multi-tenant systems—pooled, siloed, or mixed—significantly influences the cost-optimization strategy. Each approach offers distinct trade-offs in terms of resource allocation, scalability, and cost efficiency.

Take me to this video

Well-Architected SaaS Lens

The SaaS Lens for the AWS Well-Architected Framework empowers customers to assess and enhance their cloud-based architectures, fostering a deeper understanding of the business implications of their design choices. By bringing together technical leadership and diverse teams to discuss strategies for improving various aspects of the system, the AWS Well-Architected Framework facilitates collaborative decision-making. Moreover, the AWS account team can provide valuable support in conducting these assessments, offering expert guidance and insights. The AWS SaaS Lens specifically focuses on how to design, deploy, and architect multi-tenant SaaS application workloads within the AWS Cloud.

The microservices running in a multi-tenant environment must be able to reference and apply tenant context within each service. At the same time, it’s also our goal to limit the degree to which developers need to introduce any tenant awareness into their code.

Figure 2. The microservices running in a multi-tenant environment must be able to reference and apply tenant context within each service. At the same time, it’s also our goal to limit the degree to which developers need to introduce any tenant awareness into their code.

Take me to this well-architected framework

SaaS anywhere: Designing distributed multi-tenant architectures

Not every SaaS provider has the luxury of running all the moving parts of their solution within their own infrastructure. SaaS teams might support a range of diverse system models, where architectures might include customer-hosted data, edge deployment for parts of the application, and on-premises components. In this session, you can learn the strategies to support the complexities of this distributed model without undermining the resilience, operational efficiency, and agility goals of your solution. The video covers how this influences the onboarding, deployment, and profile management of the SaaS environment.

In this architectural pattern, tenants are demanding to have the ML workload in their environment. So, the SaaS provider only manages the SaaS Control plane where tenants deploy the application plane in their environment, including the ML workload and the necessary components around it.

Figure 3. In this architectural pattern, tenants are demanding to have the ML workload in their environment. So, the SaaS provider only manages the SaaS control plane where tenants deploy the application plane in their environment, including the ML workload and the necessary components around it.

Take me to this video

Deploying multi-tenant SaaS applications on Amazon ECS and AWS Fargate

Containers are frequently employed in multi-tenant SaaS environments to enhance scalability, isolation, and resource efficiency. Developing such systems requires addressing multiple challenges, including tenant isolation, tenant on-boarding, tenant-specific metering, monitoring, and other factors related to multi-tenancy. This session explores how to effectively manage all of these aspects when deploying solutions on AWS Fargate.

Microservices architecture can enhance security isolation by dividing applications into smaller, independent services, reducing the potential impact of a breach.

Figure 4. Microservices architecture can enhance security isolation by dividing applications into smaller, independent services, reducing the potential impact of a breach.

Take me to this video

AWS Serverless SaaS Workshop

Serverless helps to create multi-tenant architectures thanks to services like AWS Lambda that isolate your business logic per request, making them the perfect companion to run a SaaS platform. This workshop provides a hands-on introduction to creating serverless multi-tenant SaaS applications, helping you get started and gain practical experience.

This is the high level architecture of the web application you will use in the AWS Serverless SaaS Workshop. In the labs, you will use this web application to add features that are needed to build this final SaaS application.

Figure 5. This is the high-level architecture of the web application you will use in the AWS Serverless SaaS Workshop. In the labs, you will use this web application to add features that are needed to build this final SaaS application.

Take me to this workshop

See you next time!

Thanks for reading! Multi-tenant SaaS architectures require a careful design of your system. In this post, you have discovered key elements for properly designing your next SaaS workloads. In the next blog, we will talk about modern data architectures.

To revisit any of our previous posts or explore the entire series, visit the Let’s Architect! page.

Startup Program revamped: build and grow on Cloudflare with up to $250,000 in credits

Post Syndicated from Christopher Rotas original https://blog.cloudflare.com/startup-program-250k-credits

Today, we’re pleased to offer startups up to $250,000 in credits to use on Cloudflare’s Developer Platform. This new credits system will allow you to clearly see usage and associated fees to plan for a predictable future after the $250,000 in credits have been used up or after one year, whichever happens first.

You can see eligibility criteria and apply to the start-up program here

What can you use the credits for?

Credits can be applied to all Developer Platform products, as well as Argo and Cache Reserve. Moreover, we provide participants with up to three Enterprise-level domains, which includes CDN, DDoS, DNS, WAF, Zero Trust, and other security and performance products that a participant can enable for their website.

Developer tools and building on Cloudflare

You can use credits for Cloudflare Developer Platform products, including those listed in the table below.

Note: credits for the Cloudflare Startup Program apply to Cloudflare products only, this table is illustrative of similar products in the market.

Speed and performance with Cloudflare

We know that founders need all the help they can get when starting their businesses. Beyond the Developer Platform, you can also use the Startup Program for our speed and performance products. Getting customers where they need to go within milliseconds on your website or application is the difference between closing a sale or not. You can test your speed here and learn how to optimize your speed and performance here with solutions like: Images, Argo, and Early Hints.

Security from Cloudflare

But, wait, there’s more: beyond the Developer Platform products and speed tools, you can also use Cloudflare’s many security features through the Startup Program as well. These include Web Application Firewall (WAF), DDoS Alerts, bundled protection plans, and more. The Startup Program also includes Zero Trust solutions. Learn how others are securing their technology and tools with Cloudflare Zero Trust.

For more inspiration, check out our Built with Cloudflare site, which highlights what other startups are building. 

Who can use the credits?

Eligibility criteria can be found here and include:

  • Companies building a software-based product or service

  • Founded within the last 5 years (2019-2024)

  • Have between $50,000 - $5,000,000 in funding

    • Note that for startups who have not yet raised at least $50,000, there may be other opportunities for lower credit amounts. Please apply with the promo code “BOOTSTRAPPED” if you haven’t raised $50,000 yet, but are interested in the Cloudflare Startup Program

  • Have a LinkedIn profile, valid website, and email address

  • Bonus criteria that adds to your application: being part of an approved accelerator

What will you build?

We’re excited to see what you will build. Please share what you’re up to with us so that we can help you however it makes sense. If you’re actively using Cloudflare’s Developer Platform, we’d love to hear more about what you’re building and share it on our Built with Cloudflare site.

Are you a startup looking for additional support, resources, or access to funding? Apply for our Workers Launchpad Program! The program runs for a few months, and in addition to the Startup Program, participants get access to hands-on bootcamp sessions, Solutions Architect office hours, introductions to VCs, and the opportunity to present at Demo Day.

Why does Cloudflare support founders and startups? 

Founders and developers face enough challenges without having to worry about incurring egregious costs to test technology and start building in the earliest days. You have the world at your fingertips and should be empowered to build and create without limitations. Invest money in your innovation, not in the infrastructure and technology that supports it.

The Startup Program understands this founder experience deeply, as the team is made up of former founders. Cloudflare is committed to programs like this to empower founders building the next big thing. Offering up to $250,000 in credits will allow folks to leverage even more of what we have to offer: a developer experience that removes friction, saves money, and gets applications spun up in hours, not days. 

We want to support founders from everywhere on earth.

Be bold and keep building! Follow @CloudflareDev and join our Developer Discord server.

Are you a startup building on Cloudflare? Apply here!

Building a three-tier architecture on a budget

Post Syndicated from Adam Nemeth original https://aws.amazon.com/blogs/architecture/building-a-three-tier-architecture-on-a-budget/

AWS customers often look for ways to run their systems within or under budget, avoiding unnecessary costs. This post offers practical advice on designing scalable and cost-efficient three-tier architectures by using serverless technologies within the AWS Free Tier.

With AWS, you can start small and scale cost-effectively as your business demand increases. You can begin with minimal investments by using the Free Tier to build a minimum viable product (MVP). Then you can expand resources as your user base grows and your needs evolve, and transition to a full-fledged, large-scale application.

In this blog post, you will learn how to build a three-tier architecture that predominantly relies on AWS service usage within the Free Tier, resulting in a highly affordable architecture.

Note: The Free Tier offerings mentioned within this blog post are subject to change. Always check the AWS Free Tier page for the most current information.

Background: Understanding the AWS Free Tier

The Free Tier provides users with access to a range of AWS services at no cost within predefined monthly usage limits. This offering helps users to run experimentation, development, and even production workloads without charges. The Free Tier is available for more than 100 AWS products today, including Amazon Simple Storage Service (Amazon S3), Amazon Elastic Compute Cloud (Amazon EC2), and Amazon Relational Database Service (Amazon RDS). Depending on the product, there are three types of Free Tier offers:

  • Free trials – Short-term trial offers that start when the first usage begins. After the trial period expires, you pay standard service rates.
  • 12 months free – Offers available to new AWS customers for 12 months following their sign-up date. After the 12-month free term expires, you pay standard service rates.
  • Always free – Offers available to both existing and new AWS customers indefinitely.

For example, the AWS Lambda Free Tier includes one million free requests per month and 400,000 GB-seconds of compute time per month usable for functions across both x86 and AWS Graviton processors. The AWS Lambda Free Tier falls under the always free category.

Walkthrough: Three-tier architecture on AWS

Cost efficiency is a prominent advantage of using AWS serverless services. These services decrease the need for provisioning and managing servers, reducing operational overhead and labor costs. Serverless services like AWS Lambda and Amazon API Gateway use a pay-as-you-go model. This way, you only pay for the resources you consume, providing significant savings compared to maintaining idle infrastructure. Serverless technologies also feature automatic scaling and built-in high availability to increase agility and optimize costs.

A three-tier architecture is a popular implementation of a multi-tier architecture and consists of a presentation tier, business logic tier, and data tier. A three-tier architecture separates an application’s functionality into distinct layers (presentation, business logic, and data) to enable scalability, modularity, and flexibility in software development. This type of architecture is suitable for building a wide range of applications such as web applications, enterprise systems, and mobile apps.

The following image is an example of a three-tier architecture fully built with AWS serverless services. In this example, users authenticate and navigate to the website in the presentation tier. They call APIs, which invoke Lambda functions at the business logic tier. Data is stored in DynamoDB at the data tier.

Users authenticate through Amazon Cognito and navigate to the website in the presentation tier. They call APIs, which invoke Lambda functions at the business logic tier. Data is stored in DynamoDB at the data tier.

Figure 1: Example of a three-tier architecture on AWS

In the following sections, we explore how to use AWS serverless services within the Free Tier to build a similar architecture.

Note: The Free Tier offerings mentioned within this blog post are subject to change. Always check the AWS Free Tier page for the most current information.

Presentation tier

The presentation tier is where your users interact with your offering, such as a webpage or an app. You can use the following services within the Free Tier to build your presentation tier.

AWS service How you can use it Free Tier details*
Amazon S3 Host static and dynamic assets, like a React Single Page Application (SPA), and distribute them to your end users. For the first year, you get 5 GB of standard storage, 20,000 GET requests and 2,000 PUT requests. See Amazon S3 pricing for details.
Amazon CloudFront Use with Amazon S3 for a faster and more performant distribution of your assets to end users. CloudFront gives you access to the AWS content delivery network with more than 410 points of presence worldwide. CloudFront includes an Always Free Tier, with 1 TB of data transfer out to the internet per month and 10 million HTTP(S) requests per month. See Amazon CloudFront pricing for details.
Amazon Cognito Use Amazon Cognito user pools to authenticate your users. You can also integrate Amazon Cognito within your application’s UI for a seamless login experience. Amazon Cognito has an Always Free Tier, including up to 50,000 monthly active users. It also includes 10 GBs of cloud sync storage and 1 million sync operations per month, valid for the first 12 months after sign-up. See Amazon Cognito pricing for details.

*as of September 2024

Business logic tier

The business logic tier is where code translates user actions to application functionality. You can use the following services within the Free Tier to build your business logic tier.

AWS service How you can use it Free Tier details*
Amazon API Gateway Build a front door to your application’s backend by creating REST or WebSocket APIs. Get 1 million monthly API calls for free, valid for the first 12 months after sign-up. See Amazon API Gateway pricing for details.
AWS Lambda Use AWS Lambda for a serverless compute environment that integrates with API Gateway. You can embed your business logic into functions that run on AWS without the need for you to run and manage infrastructure. The Always Free Tier offers 1 million free requests and 400,000 GB-seconds of compute time per month. See AWS Lambda pricing for details.

*as of September 2024

Data tier

The data tier is where your data is stored. You can use the following service within the Free Tier to build your data tier.

AWS service How you can use it Free Tier details*
Amazon DynamoDB Use this serverless NoSQL database for storing data and tracking transactions. In the context of a three-tier architecture, DynamoDB stores and manages the application’s data, providing reliable and secure data access to the business logic tier. The Always Free Tier offers 25GB of free storage, with up to 200 million requests, 25 write capacity units (WCUs), and 25 read capacity units (RCUs) per month.

*as of September 2024

Walkthrough: Monitoring your usage to avoid unexpected charges

If you use consolidated billing or AWS Organizations, the Free Tier usage accumulates at the management account level. Each management account receives one quota of the Free Tier.

To monitor your Free Tier usage and avoid unexpected charges, you can use the following resources:

The following image shows an example of the Free Tier page in the AWS Billing and Cost Management console.

Free Tier dashboard showing usage limit, current usage, and forecasted usage for in-scope services.

Figure 2: AWS Free Tier view in the Cost and Usage Report

We also recommend configuring a zero spend budget within the AWS Billing and Cost Management console. With this budget, you receive notifications when your usage exceeds the Free Tier limits, helping you to avoid unexpected charges. The following image shows an example of this budget setup.

Choose budget type menu with Use a template and Zero spend budget both selected.

Figure 3: Zero spend budget

Conclusion

In this post, we explored how to use AWS serverless services within the Free Tier to build a three-tier application. We also explored how to monitor your Free Tier usage. The Free Tier offers a chance to experiment and develop without additional costs, helping businesses minimize infrastructure expenses early on. AWS serverless architectures bring benefits like cost savings, flexibility, and scalability.

Beyond using services within the Free Tier, you can further optimize the cost of your AWS serverless application. For instance, to prevent incurring unnecessary inter-Region data transfer costs, we recommend starting with a single Region deployment for your application.

To learn more about the Free Tier and which services it offers, check out the AWS Free Tier FAQs.

Additionally, you can explore various architectural patterns for AWS serverless multi-tier architectures and the Serverless Full Stack WebApp Starter Kit to create scalable and cost-effective solutions on AWS.

Efficiently processing batched data using parallelization in AWS Lambda

Post Syndicated from Chris Munns original https://aws.amazon.com/blogs/compute/efficiently-processing-batched-data-using-parallelization-in-aws-lambda/

This post is written by Anton Aleksandrov, Principal Solutions Architect, AWS Serverless

Efficient message processing is crucial when handling large data volumes. By employing batching, distribution, and parallelization techniques, you can optimize the utilization of resources allocated to your AWS Lambda function. This post will demonstrate how to implement parallel data processing within the Lambda function handler, maximizing resource utilization and potentially reducing invocation duration and function concurrency requirements.

Overview

AWS Lambda integrates with various event sources, such as Amazon SQSApache Kafka, or Amazon Kinesis, using event-source mappings. When you configure an event-source mapping, Lambda continuously polls the event source and automatically invokes your function to process the retrieved data. Lambda makes more invocations of your function as the number of messages it reads from the event source increases. This can increase the utilized function concurrency and consume the available concurrency in your account. Click the links to learn more about how Lambda consumes messages from SQS queues and Kinesis streams.

To improve the data processing throughput, you can configure event-source mapping batch window and batch size. These settings ensure that your function is invoked only when a sufficient number of messages have accumulated in the event source. For example, if you configure a batch size of 100 messages and a batch window of 10 seconds, Lambda will invoke your function when either 100 messages have accumulated or 10 seconds have elapsed, whichever happens first.

Event source mapping event batching

Event source mapping event batching

By processing messages in batches, rather than individually, you can improve throughput and optimize costs by reducing the number of polling requests to event sources and the number of function invocations. For instance, processing a million messages without batching would require one million function invocations, but configuring a batch size of 100 messages can reduce the number of invocations to 10,000.

Optimizing batch processing within the Lambda execution environment

Each Lambda execution environment processes one event per invocation. With batching enabled, the event object Lambda sends to the function handler contains an array of messages retrieved and batched by the event-source mapping. Once an execution environment starts processing an event object containing a batch of messages, it won’t handle additional invocations until the current one is complete. However, simply iterating over the array of messages and processing them one by one may not fully utilize the allocated compute resources. This can lead to underutilized or idle compute resources, like CPU capacity, and hence longer overall processing times.

Underutilized Lambda environments

Underutilized Lambda environments

Underutilization of compute resources can be generally caused by two things – non-CPU-intensive blocking tasks, such as sending HTTP requests and waiting for responses, and single-threaded processing when you have more than one vCPU core. To address these concerns and maximize resource utilization, you can implement your functions to process data in parallel. This allows more efficient utilization of the allocated compute capacity, reducing invocation duration, time spent idle, and the total concurrency required. In addition, when you allocate more than 1.8GB of memory to your function, it also gets more than one vCPU, which allows threads to land on separate cores for even better performance and true parallel processing.

Improved concurrency in Lambda environment

Improved concurrency in Lambda environment

When processing messages sequentially with a low compute utilization rate, reducing memory allocation may seem intuitive to save costs. This, however, can result in slower performance due to less CPU capacity being allocated. When your function is parallelizing data processing within the execution environment, you’re getting a higher compute utilization rate, and since raising the memory allocation also provides additional CPU capacity, it can lead to better performance. Use the Lambda Power Tuning tool to find the optimal memory configuration, balancing cost with performance.

Understanding the Lambda execution environment lifecycle

After processing an invocation, the Lambda execution environment is “frozen” by the Lambda service. Lambda runtime considers the invocation complete and “freezes” the execution environment when your function handler returns.

When the Lambda service is looking for an execution environment to process a new incoming invocation, it will first try to “thaw” and use any available execution environments that were previously “frozen”. This cycle repeats until the execution environment is eventually shut down.

Lambda worker lifecycle over time

Lambda worker lifecycle over time

Implementing parallel processing within the Lambda execution environment

You can implement parallel processing by running multiple threads in your function handler, but if those threads are still running when the handler returns, then they will be “frozen” together with the execution environment until the next invocation. This can lead to unexpected behavior, where the execution environment is “thawed” to process a new invocation, however, it still has background threads running and processing data from previous invocations. If you do not handle this properly, the behavior can cascade across multiple invocations, leading to delayed or unfinished processing and complicated debugging.

Threads frozen before finishing

Threads frozen before finishing

To address this concern, you need to ensure that the background threads you spawn in the function handler are done processing data before returning from the handler. All threads spawned within a particular invocation must complete within the same invocation in order not to spill over to subsequent invocations. This is illustrated in the following diagram. You can see threads start and end within the same invocation, and only once all threads have finished, the function handler returns.

Threads returning before end of invoke

Threads returning before end of invoke

Sample code

Programming languages offer diverse techniques and terminology for parallel and concurrent processing. Java employs multi-threading and thread pools. Node.js, though single-threaded, provides event loop and promises (for async programming), as well as child processes and worker threads (for actual multi-threading). Python supports both multi-threading (subject to Global Interpreter Lock) and multi-processing. Concurrent routines is another technique gaining attention.

The following sample is provided for illustration purposes only and is based on Node.js promises running concurrently. The sample code uses a language-agnostic term “worker” to denote a unit of parallel processing. Your specific parallelization implementation depends on your choice of runtime language and frameworks. AWS recommends you use battle-tested frameworks like Powertools for AWS Lambda that implement concurrent batch processing when possible. Regardless of the programming language, it is crucial to ensure all background threads/workers/promises/routines/tasks spawned by the function handler are completed within the same invocation before the handler returns.

Sample implementation with Node.js

const NUMBER_OF_WORKERS = 4;

export const handler = async (event) => {
    const workers = []; 
    const messages = event.Records;
    
    // For handling partial batch processing errors
    const batchItemFailures = [];

    for (let i=0; i<NUMBER_OF_WORKERS;i++){
        // No await here! The waiting will happen later
        const worker = spawnWorker(i, messages, batchItemFailures);
        workers.push(worker);
    }
    
    // This line is crucial. This is where the handler
    // waits for all workers to complete their tasks
    const processingResults = await Promise.allSettled(workers);
    console.log('All done!');

    // Return messageIds of all messages that failed 
    // to process in order to retry
    return {batchItemFailures};
};

async function spawnWorker(id, messages, batchItemFailures){
    console.log(`worker.id=${id} spawning`);
    while (messages.length>0){
        const msg = messages.shift();
        console.log(`worker.id=${id} processing message`);
        try {
            // A blocking, but not CPU-intensive operation 
            await processMessage(msg);
        } catch (err){
            // If message processing failed, add it to 
            // the list of batch item failures
            batchItemFailures.push({ itemIdentifier: msg.messageId});
        }
    }
}

See the sample code and AWS Cloud Development Kit (CDK) stack at github.com.

Testing results

The following chart illustrates a Lambda function processing messages using an SQS event-source mapping. After enabling message processing with 4 workers, the invocation duration and concurrent executions dropped to 1/4th of the previous value, while still processing the same number of messages per second. Thanks to parallelization, the new function is faster and requires less concurrency.

Function performance dashboard

Function performance dashboard

Looking at the invocation log, you can see that the function handler has spawned four workers, and all of them were completed before the handler returned the result. You can also see that although the handler received 20 items, with each item taking 200ms to process, the overall duration is only 1000ms. This is because items were processed in parallel (20 items * 200ms / 4 workers = 1000ms total processing time).

START RequestId: (redacted)  Version: $LATEST
2024-06-18T03:18:03.049Z    INFO    Got messages from SQS
2024-06-18T03:18:03.049Z    INFO    messages.length=20
2024-06-18T03:18:03.049Z    INFO    worker.id=0 spawning
2024-06-18T03:18:03.049Z    INFO    worker.id=0 processing message
2024-06-18T03:18:03.049Z    INFO    worker.id=1 spawning
2024-06-18T03:18:03.049Z    INFO    worker.id=1 processing message
2024-06-18T03:18:03.050Z    INFO    worker.id=2 spawning
2024-06-18T03:18:03.050Z    INFO    worker.id=2 processing message
2024-06-18T03:18:03.050Z    INFO    worker.id=3 spawning
2024-06-18T03:18:03.050Z    INFO    worker.id=3 processing message
2024-06-18T03:18:03.250Z    INFO    worker.id=0 processing message
2024-06-18T03:18:03.250Z    INFO    worker.id=1 processing message
(redacted for brevity)
2024-06-18T03:18:03.852Z    INFO    worker.id=1 processing message
2024-06-18T03:18:03.852Z    INFO    worker.id=2 processing message
2024-06-18T03:18:03.852Z    INFO    worker.id=3 processing message
2024-06-18T03:18:04.052Z    INFO    All done!
END RequestId: (redacted)
REPORT RequestId: (redacted) Duration: 1004.48 ms

Considerations

  • The technique and samples described in this post assume unordered message processing. In case you use ordered event sources, such as SQS FIFO Queues, and require preserving message order, you will need to address that in your implementation code. One technique might be creating a separate thread for each messageGroupId.
  • While providing performance and cost benefits, multi-threading and parallel processing is an advanced technique that requires proper error handling. Lambda supports partial batch responses, where you can report back to the event source that specific messages from the batch failed to be processed so they can be retried. You can collect failed message IDs from each thread and return them as your function handler response. This is illustrated in the sample above. See Handling errors for an SQS event source in Lambda and Best Practices for implementing partial batch responses for additional details.

Conclusion

Efficiently processing large volumes of data implies efficient resource utilization. When processing batches of messages from event sources, validate whether your function would benefit from parallel or concurrent processing within the function handler thus increasing the compute capacity utilization rate. With a high compute capacity utilization rate, you can allocate more memory to your function, thus getting more CPU allocated as well, for faster and more efficient processing. Use frameworks like Powertools for AWS Lambda that implement concurrent batch processing when possible, and use the Lambda Power Tuning tool to find the best memory configuration for your functions, balancing performance and cost.

For more serverless learning resources, visit Serverless Land.