Tag Archives: Technical How-to

Query big data with resilience using Trino in Amazon EMR with Amazon EC2 Spot Instances for less cost

Post Syndicated from Ashwini Kumar original https://aws.amazon.com/blogs/big-data/query-big-data-with-resilience-using-trino-in-amazon-emr-with-amazon-ec2-spot-instances-for-less-cost/

Amazon Elastic Compute Cloud (Amazon EC2) Spot Instances offer spare compute capacity available in the AWS Cloud at steep discounts compared to On-Demand prices. Amazon EMR provides a managed Hadoop framework that makes it straightforward, fast, and cost-effective to process vast amounts of data using EC2 instances. Amazon EMR with Spot Instances allows you to reduce costs for running your big data workloads on AWS. Amazon EC2 can interrupt Spot Instances with a 2-minute notification whenever Amazon EC2 needs to reclaim capacity for On-Demand customers. Spot Instances are best suited for running stateless and fault-tolerant big data applications such as Apache Spark with Amazon EMR, which are resilient against Spot node interruptions.

Trino (formerly PrestoSQL) is an open-source, highly parallel, distributed SQL query engine to run interactive queries as well as batch processing on petabytes of data. It can perform in-place, federated queries on data stored in a multitude of data sources, including relational databases (MySQL, PostgreSQL, and others), distributed data stores (Cassandra, MongoDB, Elasticsearch, and others), and Amazon Simple Storage Service (Amazon S3), without the need for complex and expensive processes of copying the data to a single location.

Before Project Tardigrade, Trino queries failed whenever any of the nodes in Trino clusters failed, and there was no automatic retry mechanism with iterative querying capability. Also, failed queries had to be restarted from scratch. Due to this limitation, the cost of failures of long-running extract, transform, and load (ETL) and batch queries on Trino was high in terms of completion time, compute wastage, and spend. Spot Instances were not appropriate for long-running queries with Trino clusters and only suited for short-lived Trino queries.

In October 2022, Amazon EMR announced a new capability in the Trino engine to detect 2-minute Spot interruption notifications and determine if the existing queries can complete within 2 minutes on those nodes. If the queries can’t finish, Trino will fail them quickly and retry the queries on different nodes. Also, Trino doesn’t schedule new queries on these Spot nodes, which are about to be reclaimed. In November 2022, Amazon EMR added support for Project Tardigrade’s fault-tolerant option in the Trino engine with Amazon EMR 6.8 and above. Enabling this feature mitigates Trino task failures caused by worker node failures due to Spot interruptions or On-Demand node stops. Trino now retries failed tasks using intermediate exchange data checkpointed on Amazon S3 or HDFS.

These new enhancements in Trino with Amazon EMR provide improved resiliency for running ETL and batch workloads on Spot Instances with reduced costs. This post showcases the resilience of Amazon EMR with Trino using fault-tolerant configuration to run long-running queries on Spot Instances to save costs. We simulate Spot interruptions on Trino worker nodes by using AWS Fault Injection Simulator (AWS FIS).

Trino architecture overview

Trino runs a query by breaking up the run into a hierarchy of stages, which are implemented as a series of tasks distributed over a network of Trino workers. This pipelined execution model runs multiple stages in parallel and streams data from one stage to another as the data becomes available. This parallel architecture reduces end-to-end latency and makes Trino a fast tool for ad hoc data exploration and ETL jobs over very large datasets. The following diagram illustrates this architecture.

In a Trino cluster, the coordinator is the server responsible for parsing statements, planning queries, and managing workers. The coordinator is also the node to which a client connects and submits statements to run. Every Trino cluster must have at least one coordinator. The coordinator creates a logical model of a query involving a series of stages, which is then translated into a series of connected tasks running on Trino workers. In Amazon EMR, the Trino coordinator runs on the EMR primary node and workers run on core and task nodes.

Faster insights with lower costs with EC2 Spot

You can save significant costs for your ETL and batch workloads running on EMR Trino clusters with a blend of Spot and On-Demand Instances. You can also reduce time-to-insight with faster query runs with lower costs by running more worker nodes on Spot Instances, using the parallel architecture of Trino.

For example, a long-running query on EMR Trino that takes an hour can be finished faster by provisioning more worker nodes on Spot Instances, as shown in the following figure.

Fault-tolerant Trino configuration in Amazon EMR

Fault-tolerant execution in Trino is disabled by default; you can enable it by setting a retry policy in the Amazon EMR configuration. Trino supports two types of retry policies:

  • QUERY – The QUERY retry policy instructs Trino to retry the whole query automatically when an error occurs on a worker node. This policy is only suitable for short-running queries because the whole query is retried from scratch.
  • TASK – The TASK retry policy instructs Trino to retry individual query tasks in the event of failure. This policy is recommended for long-running ETL and batch queries.

With fault-tolerant execution enabled, intermediate exchange data is spooled on an exchange manager so that another worker node can reuse it in the event of a node failure to complete the query run. The exchange manager uses a storage location on Amazon S3 or Hadoop Distributed File System (HDFS) to store and manage spooled data, which is spilled beyond in-memory buffer size of worker nodes. By default, Amazon EMR release 6.9.0 and later uses HDFS as an exchange manager.

Solution overview

In this post, we create an EMR cluster with following architecture.

We provision the following resources using Amazon EMR and AWS FIS:

  • An EMR 6.9.0 cluster with the following configuration:
    • Apache Hadoop, Hue, and Trino applications
    • EMR instance fleets with the following:
      • One primary node (On-Demand) as the Trino coordinator
      • Two core nodes (On-Demand) as the Trino workers and exchange manager
      • Four task nodes (Spot Instances) as Trino workers
    • Trino’s fault-tolerant configuration with following:
      • TPCDS connector
      • The TASK retry policy
      • Exchange manager directory on HDFS
      • Optional recommended settings for query performance optimization
  • An FIS experiment template to target Spot worker nodes in the Trino cluster with interruptions to demonstrate fault-tolerance of EMR Trino with Spot Instances

We use the new Amazon EMR console to create an EMR 6.9.0 cluster. For more information about the new console, refer to Summary of differences.

Create an EMR 6.9.0 cluster

Complete the following steps to create your EMR cluster:

  1. On the Amazon EMR console, create an EMR 6.9.0 cluster named emr-trino-cluster with Hadoop, Hue, and Trino applications using the Custom application bundle.

We need Hue’s web-based interface for submitting SQL queries to the Trino engine and HDFS on core nodes to store intermediate exchange data for Trino’s fault-tolerant runs.

Using multiple Spot capacity pools (each instance type in each Availability Zone is a separate pool) is a best practice to increase your chances of getting large-scale Spot capacity and minimize the impact of a specific instance type being reclaimed in EMR clusters. The Amazon EMR console allows you to configure up to 5 instance types for your core fleet and 15 instance types for your task fleet with the Spot allocation strategy, which allows up to 30 instance types for each fleet from the AWS Command Line Interface (AWS CLI) or Amazon EMR API.

  1. Configure the primary, core, and task fleets with primary and core nodes with On-Demand Instances (m5.xlarge) and task nodes with Spot Instances using multiple instance types.

When you use the Amazon EMR console, the number of vCPUs of the EC2 instance type are used as the count towards the total target capacity of a core or task fleet by default. For example, an m5.xlarge instance type with 4 vCPUs is considered as 4 units of capacity by default.

  1. On the Actions menu under Core or Task fleet, choose Edit weighted capacity.

  1. Because each instance type with 4 vCPUs (xlarge size) is 4 units of capacity, let’s set the cluster size with 8 core units (2 nodes) with On-Demand and 16 task units (4 nodes) with Spot.

Unlike core and task fleets, the primary fleet is always one instance, so no sizing configuration is needed or available for the primary node on the Amazon EMR console.

  1. Select Price-capacity optimized as your Spot allocation strategy, which launches the lowest-priced Spot Instances from your most available pools.

  1. Configure Trino’s fault-tolerant settings in the Software settings section:
[
  {
    "Classification": "trino-connector-tpcds",
    "Properties": {
      "connector.name": "tpcds"
    }
  },
  {
    "Classification": "trino-config",
    "Properties": {
      "exchange.compression-enabled": "true",
      "query.low-memory-killer.delay": "0s",
      "query.remote-task.max-error-duration": "1m",
      "retry-policy": "TASK"
    }
  },
  {
    "Classification": "trino-exchange-manager",
    "Properties": {
      "exchange.base-directories": "/exchange",
      "exchange.use-local-hdfs": "true"
    }
  }
]

Alternatively, you can create a JSON config file with the configuration, store it in an S3 bucket, and select the file path from its S3 location by selecting Load JSON from Amazon S3.

Let’s understand some optional settings for query performance optimization that we have configured:

  • “exchange.compression-enabled”:”true” – This is recommended to enable compression to reduce the amount of data spooled on exchange manager.
  • “query.low-memory-killer.delay”: “0s” – This will reduce the low memory killer delay to allow the Trino engine to unblock nodes running short on memory faster.
  • “query.remote-task.max-error-duration”: “1m” – By default, Trino waits for up to 5 minutes for the task to recover before considering it lost and rescheduling it. This timeout can be reduced for faster retrying of the failed tasks.

For more details of Trino’s fault-tolerant configuration parameters, refer to Fault-tolerant execution.

  1. Let’s also add a tag key called Name with the value MyTrinoCluster to launch EC2 instances with this tag name.

We’ll use this tag to target Spot Instances in the cluster with AWS FIS.

The EMR cluster will take few minutes to be ready in the Waiting state.

Configure an FIS experiment template to target Spot Instances with interruptions in the EMR Trino cluster

We now use the AWS FIS console to simulate interruptions of Spot Instances in the EMR Trino cluster and showcase the fault-tolerance of the Trino engine. Complete the following steps:

  1. On the AWS FIS console, create an experiment template.

  1. Under Actions, choose Add action.
  2. Create an AWS FIS action with Action type as aws:ec2:send-spot-instance-interruptions and Duration Before Interruption as 2 minutes.
  3. Choose Save.

This means FIS will interrupt targeted Spot Instances after 2 minutes of running the experiment.

  1. Under Targets, choose Edit to target all Spot Instances running in the EMR cluster.
  2. For Resource tags, use Name= MyTrinoCluster.
  3. For Resource filters, use as State.Name=running.
  4. For Selection mode, set to ALL.
  5. Choose Save.

  1. Create a new AWS Identity and Access Management (IAM) role automatically to provide permissions to AWS FIS.

  1. Choose Create experiment template.

Launch Hue and Trino web interfaces

When your EMR cluster is in the Waiting state, connect to the Hue web interface for Trino queries and the Trino web interface for monitoring. Alternatively, you can submit your Trino queries using trino-cli after connecting via SSH to your EMR cluster’s primary node. In this post, we will use the Hue web interface for running queries on the EMR Trino engine.

  1. To connect to Hue interface on the primary node from your local computer, navigate to the EMR cluster’s Properties, Network and security, and EC2 security groups (firewall) section.
  2. Edit the primary node security group’s inbound rule to add your IP address and port (port 22).
  3. Retrieve your EMR cluster’s primary node public DNS from your EMR cluster’s Summary tab.

Refer to View web interfaces hosted on Amazon EMR clusters for details on connecting to web interfaces in the primary node from your local computer. You can set up an SSH tunnel with dynamic port forwarding between your local computer and the EMR primary node. Then you can configure proxy settings for your internet browser by using an add-ons such as FoxyProxy for Firefox or SwitchyOmega for Chrome to manage your SOCKS proxy settings.

  1. Connect to Hue by copying the URL (http://<youremrcluster-primary-node-public-dns>:8888/) in your web browser.
  2. Create an account with your choice of user name and password.

After you log in to your account, you can see the query editor on Hue’s web interface.

By default, Amazon EMR configures the Trino web interface on the Trino coordinator (EMR primary node) to use port 8889.

  1. To connect to the Trino web interface, copy the URL (http://<youremrcluster-primary-node-public-dns>:8889/) in your web browser, where you can monitor the Trino cluster and query performance.

In the following screenshot, we can see six active Trino workers (two core and four task nodes of EMR cluster) and no running queries.

  1. Let’s run the Trino query

    select * from system.runtime.nodes from the Hue query editor to see the coordinator and worker nodes’ status and details.

We can see all cluster nodes are in the active state.

Test fault tolerance on Spot interruptions

To test the fault tolerance on Spot interruptions, complete the following steps:

  1. Run the following Trino query using Hue’s query editor:
with inv as
(select w_warehouse_name,w_warehouse_sk,i_item_sk,d_moy
,stdev,mean, case mean when 0 then null else stdev/mean end cov
from(select w_warehouse_name,w_warehouse_sk,i_item_sk,d_moy
,stddev_samp(inv_quantity_on_hand) stdev,avg(inv_quantity_on_hand) mean
from tpcds.sf100.inventory
,tpcds.sf100.item
,tpcds.sf100.warehouse
,tpcds.sf100.date_dim
where inv_item_sk = i_item_sk
and inv_warehouse_sk = w_warehouse_sk
and inv_date_sk = d_date_sk
and d_year =1999
group by w_warehouse_name,w_warehouse_sk,i_item_sk,d_moy) foo
where case mean when 0 then 0 else stdev/mean end > 1)
select inv1.w_warehouse_sk,inv1.i_item_sk,inv1.d_moy,inv1.mean, inv1.cov
,inv2.w_warehouse_sk,inv2.i_item_sk,inv2.d_moy,inv2.mean, inv2.cov
from inv inv1,inv inv2
where inv1.i_item_sk = inv2.i_item_sk
and inv1.w_warehouse_sk = inv2.w_warehouse_sk
and inv1.d_moy=4
and inv2.d_moy=4+1
and inv1.cov > 1.5
order by inv1.w_warehouse_sk,inv1.i_item_sk,inv1.d_moy,inv1.mean,inv1.cov ,inv2.d_moy,inv2.mean, inv2.cov

When you go to the Trino web interface, you can see the query running on six active worker nodes (two core On-Demand and four task nodes on Spot Instances).

  1. On the AWS FIS console, choose Experiment templates in the navigation pane.
  2. Select the experiment template EMR_Trino_Interrupter and choose Start experiment.

After a few seconds, the experiment will be in the Completed state and it will trigger stopping all four Spot Instances (four Trino workers) after 2 minutes.

After some time, we can observe in the Trino web UI that we have lost four Trino workers (task nodes running on Spot Instances) but the query is still running with the two remaining On-Demand worker nodes (core nodes). Without the fault-tolerant configuration in EMR Trino, the whole query would fail with even a single worker node failure.

  1. Run the select * from system.runtime.nodes query again in Hue to check the Trino cluster nodes status.

We can see four Spot worker nodes with the status shutting_down.

Trino starts shutting down the four Spot worker nodes as soon as they receive the 2-minute Spot interruption notification sent by the AWS FIS experiment. It will start retrying any failed tasks of these four Spot workers on the remaining active workers (two core nodes) of the cluster. The Trino engine will also not schedule tasks of any new queries on Spot worker nodes in the shutting_down state.

The Trino query will keep running on the remaining two worker nodes and succeed despite the interruption of the four Spot worker nodes. Soon after the Spot nodes stop, Amazon EMR will replenish the stopped capacity (four task nodes) by launching four replacement Spot nodes.

Achieve faster query performance for lower cost with more Trino workers on Spot

Now let’s increase Trino workers capacity from 6 to 10 nodes by manually resizing EMR task nodes on Spot Instances (from 4 to 8 nodes).

We run the same query on a larger cluster with 10 Trino workers. Let’s compare the query completion time (wall time in the Trino Web UI) with the earlier smaller cluster with six workers. We can see 32% faster query performance (1.57 minutes vs. 2.33 minutes).

You can run more Trino workers on Spot Instances to run queries faster to meet your SLAs or process a larger number of queries. With Spot Instances available at discounts up to 90% off On-Demand prices, your cluster costs will not increase significantly vs. running the whole compute capacity on On-Demand Instances.

Clean up

To avoid ongoing charges for resources, navigate to the Amazon EMR console and delete the cluster emr-trino-cluster.

Conclusion

In this post, we showed how you can configure and launch EMR clusters with the Trino engine using its fault-tolerant configuration. With the fault tolerant feature, Trino worker nodes can be run as EMR task nodes on Spot Instances with resilience. You can configure a well-diversified task fleet with multiple instance types using the price-capacity optimized allocation strategy. This will make Amazon EMR request and launch task nodes from the most available, lower-priced Spot capacity pools to minimize costs, interruptions, and capacity challenges. We also demonstrated the resilience of EMR Trino against Spot interruptions using an AWS FIS Spot interruption experiment. EMR Trino continues to run queries by retrying failed tasks on remaining available worker nodes in the event of any Spot node interruption. With fault-tolerant EMR Trino and Spot Instances, you can run big data queries with resilience, while saving costs. For your SLA-driven workloads, you can also add more compute on Spot to adhere to or exceed your SLAs for faster query performance with lower costs compared to On-Demand Instances.


About the Authors

Ashwini Kumar is a Senior Specialist Solutions Architect at AWS based in Delhi, India. Ashwini has more than 18 years of industry experience in systems integration, architecture, and software design, with more recent experience in cloud architecture, DevOps, containers, and big data engineering. He helps customers optimize their cloud spend, minimize compute waste, and improve performance at scale on AWS. He focuses on architectural best practices for various workloads with services including EC2 Spot, AWS Graviton, EC2 Auto Scaling, Amazon EKS, Amazon ECS, and AWS Fargate.

Dipayan Sarkar is a Specialist Solutions Architect for Analytics at AWS, where he helps customers modernize their data platform using AWS Analytics services. He works with customers to design and build analytics solutions, enabling businesses to make data-driven decisions.

Validate IAM policies with Access Analyzer using AWS Config rules

Post Syndicated from Anurag Jain original https://aws.amazon.com/blogs/security/validate-iam-policies-with-access-analyzer-using-aws-config-rules/

You can use AWS Identity and Access Management (IAM) Access Analyzer policy validation to validate IAM policies against IAM policy grammar and best practices. The findings generated by Access Analyzer policy validation include errors, security warnings, general warnings, and suggestions for your policy. These findings provide actionable recommendations that help you author policies that are functional and conform to security best practices.

You can use the IAM Policy Validator for AWS CloudFormation and the IAM Policy Validator for Terraform solutions to integrate Access Analyzer policy validation in a proactive manner within your continuous integration and continuous delivery CI/CD pipeline before deploying IAM policies to your Amazon Web Service (AWS) environment. Customers requested a similar capability to validate policies already deployed within their environments as part of the defense-in-depth strategy.

In this post, you learn how to set up and continuously validate and report on compliance of the IAM policies in your environment using AWS Config. AWS Config evaluates the configuration settings of your AWS resources with the help of AWS Config rules, which represent your ideal configuration settings. AWS Config continuously tracks the configuration changes that occur among your resources and checks whether these changes conform to the conditions in your rules. If a resource doesn’t conform to a rule, AWS Config flags the resource and the rule as noncompliant.

You can use this solution to validate identity-based and resource-based IAM policies attached to resources in your AWS environment that might have grammatical or syntactical errors or might not follow AWS best practices. The code used in this post is hosted in a GitHub repository.

Prerequisites

Before you get started, you need:

Step 1: Enable AWS Config to monitor global resources

To get started, enable AWS Config in your AWS account by following the instructions in the AWS Config Developer Guide.

Next, enable the recording of global resources:

  1. Open the AWS Management Console and go to the AWS Config console.
  2. Go to Settings and choose Edit to see the AWS Config recorder settings.
  3. Under General settings, select the Include globally recorded resource types to enable AWS Config to monitor IAM configuration items.
  4. Leave the other settings at their defaults.
  5. Choose Save.
    Figure 1: AWS Config settings page showing inclusion of globally recorded resource types

    Figure 1: AWS Config settings page showing inclusion of globally recorded resource types

  6. After choosing Save, you should see Recording is on at the top of the window.
    Figure 2: AWS Config settings page showing recorder settings

    Figure 2: AWS Config settings page showing recorder settings

    Note: You only need to enable globally recorded resource types in the AWS Region where you’ve configured AWS Config because they aren’t tied to a specific Region and can be used in other Regions. The globally recorded resource types that AWS Config supports are IAM users, groups, roles, and customer managed policies.

Step 2: Deploy the CloudFormation template

In this section, you deploy and test a sample AWS CloudFormation template that creates the following:

  • An AWS Config rule that reports the compliance of IAM policies.
  • An AWS Lambda function that implements and then makes the requests to IAM Access Analyzer and returns the policy validation findings.
  • An IAM role that’s used by the Lambda function with permissions to validate IAM policies using the Access Analyzer ValidatePolicy API.
  • An optional Amazon CloudWatch alarm and Amazon Simple Notification Service (Amazon SNS) topic to provide notification of Lambda function errors.

Follow the steps below to deploy the AWS CloudFormation template:

  1. To deploy the CloudFormation template using the following command, you must have the AWS Command Line Interface (AWS CLI) installed.
  2. Make sure you have configured your AWS CLI credentials.
  3. Clone the solution repository.
    git clone https://github.com/awslabs/aws-iam-access-analyzer-policy-validation-config-rule.git

  4. Navigate to the iam-access-analyzer-config-rule folder of the cloned repository.
    cd aws-iam-access-analyzer-policy-validation-config-rule

  5. Deploy the CloudFormation template using the AWS CLI.

    Note: Change the Region for the parameter — RegionToValidateGlobalResources — to the Region you enabled for global resources in Step 1. Optionally, you can add an email address if you want to receive notifications if the AWS Config rule stops working. Use the code that follows, replacing <us-east-1> with the Region you enabled and <EMAIL_ADDRESS> with your chosen address.

    aws cloudformation deploy \
        --stack-name iam-policy-validation-config-rule \
        --template-file templates/template.yaml \
        --capabilities CAPABILITY_IAM CAPABILITY_NAMED_IAM \
        --parameter-overrides RegionToValidateGlobalResources='<us-east-1>' \
                              ErrorNotificationsEmailAddress='<EMAIL_ADDRESS>'

  6. After successful deployment, you will see the message Successfully created/updated stack – iam-policy-validation-config-rule.
    Figure 3: Successful CloudFormation stack creation reported on the terminal

    Figure 3: Successful CloudFormation stack creation reported on the terminal

    Note: If the CloudFormation stack creation fails, go to the CloudFormation console and select the iam-policy-validation-config-rule stack. Choose Events to review the failure reason.

  7. After deployment, open the CloudFormation console and select the iam-policy-validation-config-rule stack.
  8. Choose Resources to see the resources created by the template.

Step 3: Check noncompliant resources discovered by AWS Config

The AWS Config rule is designed to mark resources that have IAM policies as noncompliant if the resources have validation findings found using the IAM Access Analyzer ValidatePolicy API.

  1. Open the AWS Config console
  2. Choose Rules from the navigation pane on the left and select policy-validation-config-rule.
    Figure 4: AWS Config rules page showing the rule details

    Figure 4: AWS Config rules page showing the rule details

  3. Scroll down on the page and filter Resources in Scope to see the noncompliant resources.
    Figure 5: AWS Config rules page showing noncompliant resources

    Figure 5: AWS Config rules page showing noncompliant resources

    Note: If the AWS Config rule isn’t invoked yet, you can choose Actions and select Re-evaluate to invoke it.

    Figure 6: AWS Config rules page showing evaluation invocation

    Figure 6: AWS Config rules page showing evaluation invocation

Step 4: Modify the AWS Config rule for exceptions

You might want to exempt certain resources from specific policy validation checks. For example, you might need to deploy a more privileged role—such as an administrator role—to your environment and you don’t want that role’s policies to have policy validation findings.

Figure 7: AWS Config rules page showing a noncompliant administrator role

Figure 7: AWS Config rules page showing a noncompliant administrator role

This section shows you how to configure an exceptions file to exempt specific resources.

  1. Start by configuring an exceptions file similar to the one that follows to log general warning findings across the accounts in your organization to make sure your policies conform to best practices by setting ignoreWarningFindings to False.
  2. Additionally, you might want to create an exception that allows administrator roles to use the iam:PassRole action on another role. This combination of action and resource is usually reserved for privileged users. The example file below shows an exception for all the roles created with Administrator in the role path from account 12345678912.

    Example exceptions file:

    {
    "global":{
    "ignoreWarningFindings":false
    },
    "12345678912":{
    "ignoreFindingsWith":[
    {
    "issueCode":"PASS_ROLE_WITH_STAR_IN_ACTION_AND_RESOURCE",
    "resourceType":"AWS::IAM::Role",
    "resourceName":"Administrator/*"
    }
    ]
    }
    }
  3. After the exceptions file is ready, upload the JSON file to the S3 bucket you created as a part of the prerequisites.

    You can manage this exceptions file by hosting it in a central Git repository. When teams need to exempt a particular resource from these policy validation checks, they can submit a pull request to the central repository. An approver can then approve or reject this request and, if approved, deploy the updated exceptions file.

  4. Modify the bucket policy so that the bucket is accessible to your AWS Config rule if the rule is operating in a different account than the bucket was created in. Below is an example of a bucket policy that allows the accounts in your organization to read the exceptions file.
    {
          "Version": "2012-10-17",
          "Statement": [{
              "Effect": "Allow",
              "Principal": {"AWS": "*"},
              "Action": "s3:GetObject",
              "Resource": "arn:aws:s3:::EXAMPLE-BUCKET/my-exceptions-file.json",
              "Condition": {
                  "StringEquals": {
                      "aws:PrincipalOrgId": "<your organization id here>"
                  }
              }
          }]
    }

    Note: For more examples visit example policy validation exceptions file contents.

  5. Deploy the CloudFormation template again using the ExceptionsS3BucketName and ExceptionsS3FilePrefix parameters. The file prefix should be the full prefix of the S3 object exceptions file.
    aws cloudformation deploy \
        --stack-name iam-policy-validation-config-rule \
        --template-file templates/template.yaml \
        --capabilities CAPABILITY_IAM CAPABILITY_NAMED_IAM \
        --parameter-overrides RegionToValidateGlobalResources='<us-east-1>' \
            		ExceptionsS3BucketName='EXAMPLE-BUCKET' \
           		 ExceptionsS3FilePrefix='my-exceptions-file.json'

  6. After you see the Successfully created/updated stack – iam-policy-validation-config-rule message on the terminal or command line and the AWS Config rule has been re-evaluated, the resources mentioned in the exception file should show as Compliant.
    Figure 8: Resource exception result

    Figure 8: Resource exception result

You can find additional customization options in the exceptions file schema.

Cleanup

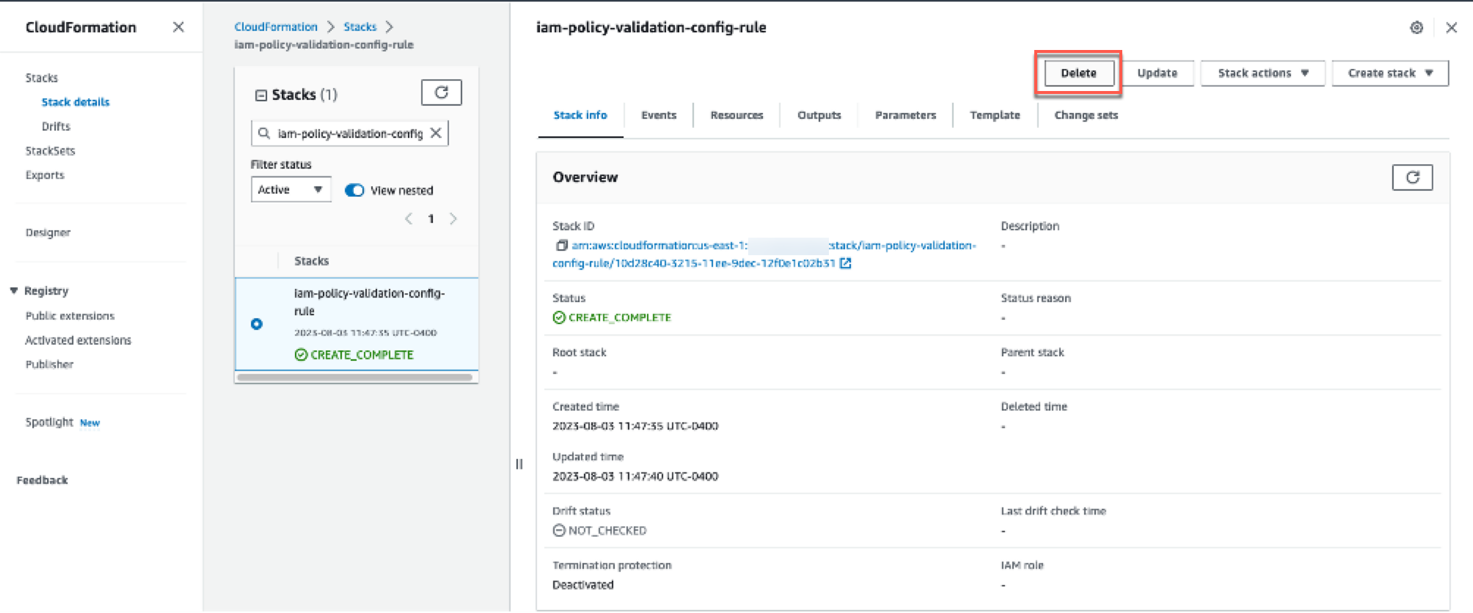
To avoid recurring charges and to remove the resources used in testing the solution outlined in this post, use the CloudFormation console to delete the iam-policy-validation-config-rule CloudFormation stack.

Figure 9: AWS CloudFormation stack deletion

Figure 9: AWS CloudFormation stack deletion

Conclusion

In this post, we demonstrated how you can set up a centralized compliance and monitoring workflow using AWS IAM Access Analyzer policy validation with AWS Config rules to validate identity-based and resource-based policies attached to resources in your account. Using this solution, you can create a single pane of glass to monitor resources and govern centralized compliance for AWS Config-supported resources across accounts. You can also build and maintain exceptions customized to your environment as shown in the example policy validation exceptions file. You can visit the Access Analyzer policy checks reference page for a complete list of policy check validation errors and resolutions.

 
If you have feedback about this post, submit comments in the Comments section below. If you have questions about this post, contact AWS Support.

Want more AWS Security news? Follow us on Twitter.

Author

Matt Luttrell

Matt is a Sr. Solutions Architect on the AWS Identity Solutions team. When he’s not spending time chasing his kids around, he enjoys skiing, cycling, and the occasional video game.

Swara Gandhi

Swara Gandhi

Swara is a solutions architect on the AWS Identity Solutions team. She works on building secure and scalable end-to-end identity solutions. She is passionate about everything identity, security, and cloud.

How to implement multi-tenancy with Amazon Pinpoint

Post Syndicated from Tristan Nguyen original https://aws.amazon.com/blogs/messaging-and-targeting/how-to-implement-multi-tenancy-with-amazon-pinpoint/

Navigating Multi-Tenancy in Amazon Pinpoint

Businesses are constantly evolving, often managing multiple product lines, customer segments, or even geographical locations. Furthermore, many business-to-business (B2B) companies that are Independent Software Vendors (ISVs) will often need to manage their customer’s marketing automation environment. This complexity necessitates a robust customer engagement strategy that can adapt and scale efficiently. However, managing disparate systems for each tenant is not only cumbersome but also resource-intensive, leading to increased operational costs and potential data silos. A multi-tenancy setup in Amazon Pinpoint addresses these challenges head-on, allowing businesses to streamline their customer engagement efforts under a unified architecture.

The question is not just whether to adopt multi-tenancy, but how to implement it in a way that aligns with your unique business requirements. Amazon Pinpoint offers multiple approaches to achieve this. This blog explores three:

  • Single Pinpoint Project: Simple but demands careful permissions management.
  • Multiple Pinpoint Projects: Granular control but limited by soft project quotas.
  • Multiple Account & Multi Pinpoint Projects: Highly scalable but needs comprehensive monitoring.

We’ll delve into the pros, cons, and best use-cases for each as well as how to choose the different multi-tenancy configuration depending on your communications channels needs, guiding you to make an informed architectural decision.

In this blog, we’ll cut through the complexity, helping you align your Amazon Pinpoint architecture with your business goals. Let’s get started.

Single Account / Single Project (SA/SP)

Overview

In a Single Pinpoint Project setup, all customer engagement activities reside within one project and multi-tenancy within this context will leverage customer endpoint attributes. This streamlined approach allows for easy management, especially for those new to Amazon Pinpoint. A configuration example for this case is shown below:

Single Account / Single Project (SA/SP)

When preparing one Pinpoint Project and managing information for multiple tenants, tenant information can be managed by using custom user attributes of endpoints. Also, campaign information can be managed for each tenant by using the tag function for campaign information. The elements required to take this configuration are shown below.

  • S3 buckets that hold customer data:
    • Prepare an S3 bucket to store customer information lists to be imported into Pinpoint. Amazon Pinpoint allows you to import CSV files in S3 as segments. In order to make settings for each tenant in Amazon Pinpoint, we will include tenant information as custom user attributes in the CSV file.
  • 1 Amazon Pinpoint Project:
    • Create 1 Amazon Pinpoint Project.
    • Settings for each channel to be distributed are also required.
    • Campaign information can be assigned to tenant information by using the tag function.
  • Amazon Kinesis:
  • Athena and S3 buckets to analyze event data:
    • Store Amazon Pinpoint event data in S3 and analyze it via Athena. Take advantage of this solution.

One thing to keep in mind when adopting this configuration is that customer endpoint information exists in the same Pinpoint Project. It is possible to specify values that can be used to identify each tenant, such as custom attributes, and solve the problem with AWS Identity and Access Management (IAM) policies, but it is necessary to manage access rights and attributes on your own.

Also, to add an endpoint, you’ll need to specify its Channel and Address. Take note that one project cannot have the same channel and address for different endpoints. From the above, if the channel and address of the endpoint do not overlap between tenants, it is possible to construct your own access permission control, then this pattern can be examined.

Since fewer components are required compared to other patterns, the configuration is easier to start with. Some customers that want to build on top of Pinpoint API and want to simplify configuration on the Pinpoint side as much as possible can also choose this option. However, this approach can get complex to manage later on as you onboard more tenants. The issue presents itself when you want to create detailed reporting for your tenant in this configuration. You’ll have to have dedicated tags on each campaigns, journeys to operationalize granular reporting for your Amazon Pinpoint project.

Lastly, take note of service limits per Amazon Pinpoint project/AWS account to ensure your use case will be scalable should the need arise.

Single Account / Multiple Projects (SA/MP)

Overview

For this architecture, you are still using a single AWS account to host your Amazon Pinpoint environment, however, you will be creating multiple projects for each customer or tenant. A configuration example for this case is shown diagram.

Single Account / Multiple Projects (SA/MP)

In this example, we will create multiple Amazon Pinpoint Projects. One major difference from the case of the Single Pinpoint Project is that it is possible to completely separate customer endpoint information. When importing customer data segments, it is possible to manage each tenant in a separate state simply by importing them from S3 into the target Pinpoint Project. This makes it easy to control permissions via IAM policies.

Also, with Amazon Pinpoint, you can use email addresses, SMS numbers, message templates, etc. for transmission obtained with the relevant account in common to all projects, and event data for each project can be aggregated via Amazon Kinesis. By adopting such a configuration, you gain the benefits of separating endpoint information per project while still retaining basic setting information management and operator operations.

An example starter solution architecture to set up this configuration are shown below.

  • S3 buckets that hold customer data:
    • Similar to SA/SP, prepare an S3 bucket to store a list of customer information to be imported into Pinpoint. CSV to be imported must be prepared for each project.
  • Amazon DynamoDB Table:
    • Prepare a DynamoDB (or other key-value database) table to manage Pinpoint project information. Tenant information can also be stored as metadata in the DynamoDB table.
  • AWS Lambda:
    • Create a Pinpoint Project using Lambda. Amazon Pinpoint allows you to create and configure projects using the Amazon Pinpoint API, the AWS SDK, or the AWS Command Line Interface (AWS CLI). Thus, it is possible to automate the creation of the Pinpoint project and associated campaigns/journeys. Tenant information is also registered in DynamoDB at the time of creation.
  • Multiple Amazon Pinpoint Projects:
    • This is a Project created by Lambda above. There will now be a Pinpoint Project for each tenant, and endpoint information will be completely separated. It is also easy to control access rights for each project by using the IAM function.
    • Message templates: templates can be created and shared across projects.
    • By using Amazon Pinpoint’s event stream settings, campaign/journeys/app/channels events can be streamed to Amazon Kinesis. Multiple Amazon Pinpoint projects can all stream to one Amazon Kinesis stream. When setup correctly, event data will be tagged with the relevant tenant information so that an analytics solution can decompose the stream later on.
  • Athena and S3 buckets to analyze event data:
    • Amazon Pinpoint event data is stored in Amazon S3 and analyzed via Amazon Athena. The analytics solution, Amazon Athena in this case will be responsible for filtering event data and according to the tenant. Refer to this solution for more details.

Note that Pinpoint projects have a soft limit of 100 projects per AWS account, which can be increased via raising a Support Ticket, other quotas also apply at the project and the account level which should be taken into account.

From the above, it is necessary to note that there are restrictions on quotas per account when using the SA/MP and more initial configurations would be required to automate the process of project creation for individual tenants. However, when compared to SA/SP architecture,

Multiple Accounts & Multi Pinpoint Projects (MA/MP)

Overview

Before diving into the MA/MP approach, it’s crucial to understand the role of AWS Organizations in this configuration. AWS Organizations allows you to consolidate multiple AWS accounts into an organization to achieve centralized governance and billing. This feature is particularly useful in a MA/MP setup, as it enables streamlined management of multiple AWS accounts and Amazon Pinpoint projects from a single central management AWS account. For more information on AWS Organizations, you can visit the official AWS Organizations documentation.

In an MA/MP setup, we utilize separate AWS Accounts for each customer or tenant. A configuration example for this case is shown below.

In this example, we have created a Management account and prepared multiple AWS accounts under it. The management account manages the AWS account ID and the Pinpoint project ID, and has a configuration created with Lambda. Customer data and Event Stream Data are managed through a Management account, and information on each project is aggregated. A major benefit of this configuration is the ability to segregate actions of individual tenants, preventing the such as noisy neighbours antipattern. It also enables AWS accounts from being freed from quota restrictions that cannot be handled by a single AWS account. Additionally, Amazon Pinpoint has excellent CloudFormation coverage, and it is also possible to deploy highly reproducible architectures automatically.

The elements required to set up this configuration are shown below.

  • AWS Organizations:
    • Set up Organizations to manage multiple accounts. See Best Practices for setting up multiple accounts.
  • Management account:
    • Create an account to manage multiple account information. Here we will set the following elements. Use IAM roles and Service control policies (SCPs) when manipulating resources across accounts. This allows cross-account access. The required elements are the same as the SA/MP described above.
      • S3 buckets that hold customer data: With AWS, you can utilize S3 data across accounts. Set up cross-account settings and securely link customer data to each account.
      • Dynamo DB Table: Holds your AWS account ID, Pinpoint Project ID, and management information associated with it.
      • AWS Lambda: Create a Pinpoint project using Lambda.
      • Athena and S3 buckets to analyze event data: Event information from multiple accounts and Pinpoint projects is aggregated and analyzed.
  • AWS accounts and Pinpoint projects per tenant:
    • Depending on how tenants are separated, prepare an AWS account and Pinpoint Project. You can also consider automating account creation by using AWS CloudFormation.
    • There are cases where it is necessary to set the distribution channel email address, SMS number, etc. for each account. See the next section for details.
    • Amazon Kinesis is prepared for each account, but everything is stored in the same S3 in the Management account for easier bird-eye’s view reporting.

One thing to keep in mind is that since accounts are separated, it becomes necessary to manage each one separately. For example, newly created account will be placed in the sandbox state, and an application for actual use via support tickets is required for each account. Also, since all reputation is done on a single account, it is also necessary to monitor reputation for each account.

Navigating Channels in Amazon Pinpoint: Aligning Service Delivery with Architecture

Beyond choosing a Pinpoint architecture for multi-tenancy, it’s pivotal to decide which channels best deliver your services and how that decision is affected by your choice of multi-tenancy architecture. Below is a non-exhaustive lists of capabilities in Amazon Pinpoint that will help with your multi-channel, multi-tenancy configurations as well as potential blockers that you’d need to be aware of for each channels.

Email

Email is one of the most versatile channels, with integration with Amazon SES’s configuration sets and email suppression list capability, easily fitting into any of the three multi-tenancy models.

  • Configurations Sets: Using configuration sets, you’d be able to segregate your email sending activities using different IP Pools, as well as different event destinations.
    • You can use configuration sets in both Amazon Pinpoint and Amazon SES. Configuration sets rules that you configure in Amazon SES are also applied to email messages that you send using Amazon Pinpoint.
    • SA/SP and SA/MP: Email templates and sending IP addresses needs to be tagged using configuration sets for each tenant in the Pinpoint project.
    • MA/MP: Email templates and sending IP address can be sent using the account default, or follow granular tagging using configuration sets.
  • Email Suppression List: Suppression list is managed automatically at the account level. Alternatively, you can specify whether a specific configuration can override the account-level suppression list.
    • SA/SP and SA/MP:
      • All tenants will also follow the same account suppression list:
        • If any tenant sends to an email address that hard-bounced or complaint, all other tenants will also be unable to send emails to the same address.
        • You will have to manually override the account-level suppression list for each email addresses.
    • MA/MP:
      • If one of your tenant sends an email to a hard-bounced or complaint address, only the AWS account that the tenant belongs to will respect the suppression list i.e. other tenants in other AWS account can still send email to that email address.
  • Noisy Neighbour Threat: Broadly, this occurs when one tenant’s performance is degraded because of the activities of another tenant. Applied to email, the anti-pattern needs to be addressed because you don’t want one bad actor tenant to affect the entire environment’s email sending activity.
    • SA/SP and SA/MP:
      • Because email bounce and complaint rates are tracked at the account level, it is possible your entire account email sending domain to be blocked due to high bounce/complaint incidences from one bad tenant.
      • To mitigate this, it’s best practice to set up dedicated configuration sets and alarms to alert when any individual tenant is exhibiting high bounce/complaint rate.
    • MA/MP:
      • Offers the most segregation and ensure email identities/domains are only usable by one tenant/account.
  • Email Sending Quota:
    • Email daily sending quota and email sending rate live at the account level.
    • SA/SP and SA/MP:
      • You would need to anticipate the total daily sending quota and sending rate for all tenants in your AWS account and raise the service limits accordingly. Therefore, more planning will be involved to estimate the correct service limit threshold.
    • MA/MP:
      • You can raise service limits per individual tenant’s needs since each tenant will be on a separate AWS account.
      • It is best practice to have business process in place for individual tenant to notify of their email sending quota request in advance so that it can be raised accordingly for their AWS account.
  • For further discussion into sending emails in a multi-tenancy environment, refer to this AWS blog on Multi-Tenancy in SES.

SMS

  • Origination Identity procurement: When opting for MA/MP setup, remember that OIDs (phone numbers) are bound to AWS accounts.
  • Since OIDs do not carry across account, you will need to repeat the procurement process for every new AWS account.Number Pooling: This feature groups phone numbers or sender IDs. It’s particularly useful in a Single Project model to segment communications per tenant.
  • Configuration Sets: With the release of the V2 SMS and Voice API, you can now use configuration sets to manage your SMS opt-out lists, OIDs and event streaming destinations for a multi-tenant environment.
  • Noisy Neighbour Threat:
    • SA/SP and SA/MP:
      • Take note that if you do not specify an OID in your API call, Amazon Pinpoint will attempt to use the most suitable (in terms of throughput and deliverability) OID to send your SMS. This
      • Similar to email, you can leverage number pooling and configuration sets to segregate SMS sending activity within a single account. This helps protect’s your SMS OID reputation because it can be costly and time-consuming to request new OIDs.
    • MA/MP:
      • Offers the most segregation and ensure numbers are only usable by one tenant/account.
  • SMS Opt Outs: Similar to the email channel’s suppression list, opt-outs are managed per account and configuration sets. Therefore, in a MA/MP setup, a customer that has opted out from communication in one account can still receive communications from other accounts.

Push Notifications

Amazon Pinpoint integrates with various push services like FCM, APNS, Baidu Cloud Push, and ADM.

  • Project-level Authentication: Authentication information is set at the Pinpoint Project level, requiring separate management.
    • Therefore, you will not be able to use the SA/SP architecture for multiple tenants using different applications.
  • For more information, refer to the Mobile Push Guide

In-app Messages

  • Pinpoint Project Specific: Similar to push notifications, each Pinpoint Project can only house one in-app message application.
    • If you have multiple applications requiring in-app messages, you will not be able to employ the SA/SP architecture.
  • For more information, refer to the In-app Channel Documentation.

Custom Channels

  • Custom channels in Amazon Pinpoint allow you to send messages through any service that has an API, including third-party services. You can interact with APIs by using a webhook, or by calling an AWS Lambda function.If you are using custom channels extensively from Amazon Pinpoint, you’ll need to be aware of service limits in AWS Lambda, , especially if you’re considering SA/SP or SA/MP architectures.

Conclusion

In this blog, we’ve untangled the intricacies of implementing multi-tenancy in Amazon Pinpoint. Our deep dive covered three architectural patterns:

  • Single Account/Single Project (SA/SP): A beginner-friendly approach offering simple management but requiring meticulous permissions handling to segregate sending activity between different tenants.
  • Single Account/Multiple Projects (SA/MP): Offers granular control over customer data with slight increased in management complexity. However, this approach faces soft quotas and potential ‘Noisy Neighbor’ issues.
  • Multiple Accounts/Multiple Projects (MA/MP): Provides the most flexibility and isolation, albeit with increased management complexity.

Each approach comes with its own set of trade-offs related to ease of management/reporting, scalability, and control over customer data. Our discussion didn’t stop at architecture; we also examined how your multi-tenancy decisions will affect your channel configurations in Amazon Pinpoint. From email and SMS to push notifications, the architectural choices you make will have a direct impact on how efficiently you can manage these distribution channels. Armed with this information, you’re now better equipped to make informed decisions that align with your business objectives.

Call to Action

Your next step? Implement and architect your Amazon Pinpoint environment. Use the best practices and architectural guidelines outlined in this blog post as your north star. Going forward, the architectural blueprint you choose should be tailored to your specific needs—be it user count, company size, or distribution channels. Take into account not just the initial setup but also the long-term management aspects, including the respective service limits and quotas.

Relevant Links

About the Authors

Tristan (Tri) Nguyen

Tristan (Tri) Nguyen

Tristan (Tri) Nguyen is an Amazon Pinpoint and Amazon Simple Email Service Specialist Solutions Architect at AWS. At work, he specializes in technical implementation of communications services in enterprise systems and architecture/solutions design. In his spare time, he enjoys chess, rock climbing, hiking and triathlon.

Tatsuya Nakamura

Tatsuya Nakamura

Nakamura Tatsuya is a Solutions Architect in charge of enterprise companies at AWS. He is mainly in charge of the trading company industry and the distribution/retail industry, also supporting the implementation of Amazon Pinpoint for Japanese customers. His career so far includes ERP implementation support and multiple new web service launches.

How to use AWS Certificate Manager to enforce certificate issuance controls

Post Syndicated from Roger Park original https://aws.amazon.com/blogs/security/how-to-use-aws-certificate-manager-to-enforce-certificate-issuance-controls/

AWS Certificate Manager (ACM) lets you provision, manage, and deploy public and private Transport Layer Security (TLS) certificates for use with AWS services and your internal connected resources. You probably have many users, applications, or accounts that request and use TLS certificates as part of your public key infrastructure (PKI); which means you might also need to enforce specific PKI enterprise controls, such as the types of certificates that can be issued or the validation method used. You can now use AWS Identity and Access Management (IAM) condition context keys to define granular rules around certificate issuance from ACM and help ensure your users are issuing or requesting TLS certificates in accordance with your organizational guidelines.

In this blog post, we provide an overview of the new IAM condition keys available with ACM. We also discuss some example use cases for these condition keys, including example IAM policies. Lastly, we highlight some recommended practices for logging and monitoring certificate issuance across your organization using AWS CloudTrail because you might want to provide PKI administrators a centralized view of certificate activities. Combining preventative controls, like the new IAM condition keys for ACM, with detective controls and comprehensive activity logging can help you meet your organizational requirements for properly issuing and using certificates.

This blog post assumes you have a basic understanding of IAM policies. If you’re new to using identity policies in AWS, see the IAM documentation for more information.

Using IAM condition context keys with ACM to enforce certificate issuance guidelines across your organization

Let’s take a closer look at IAM condition keys to better understand how to use these controls to enforce certificate guidelines. The condition block in an IAM policy is an optional policy element that lets you specify certain conditions for when a policy will be in effect. For instance, you might use a policy condition to specify that no one can delete an Amazon Simple Storage Service (Amazon S3) bucket except for your system administrator IAM role. In this case, the condition element of the policy translates to the exception in the previous sentence: all identities are denied the ability to delete S3 buckets except under the condition that the role is your administrator IAM role. We will highlight some useful examples for certificate issuance later in the post.

When used with ACM, IAM condition keys can now be used to help meet enterprise standards for how certificates are issued in your organization. For example, your security team might restrict the use of RSA certificates, preferring ECDSA certificates. You might want application teams to exclusively use DNS domain validation when they request certificates from ACM, enabling fully managed certificate renewals with little to no action required on your part. Using these condition keys in identity policies or service control policies (SCPs) provide ACM users more control over who can issue certificates with certain configurations. You can now create condition keys to define certificate issuance guardrails around the following:

  • Certificate validation method — Allow or deny a specific validation type (such as email validation).
  • Certificate key algorithm — Allow or deny use of certain key algorithms (such as RSA) for certificates issued with ACM.
  • Certificate transparency (CT) logging — Deny users from disabling CT logging during certificate requests.
  • Domain names — Allow or deny authorized accounts and users to request certificates for specific domains, including wildcard domains. This can be used to help prevent the use of wildcard certificates or to set granular rules around which teams can request certificates for which domains.
  • Certificate authority — Allow or deny use of specific certificate authorities in AWS Private Certificate Authority for certificate requests from ACM.

Before this release, you didn’t always have a proactive way to prevent users from issuing certificates that weren’t aligned with your organization’s policies and best practices. You could reactively monitor certificate issuance behavior across your accounts using AWS CloudTrail, but you couldn’t use an IAM policy to prevent the use of email validation, for example. With the new policy conditions, your enterprise and network administrators gain more control over how certificates are issued and better visibility into inadvertent violations of these controls.

Using service control policies and identity-based policies

Before we showcase some example policies, let’s examine service control policies, or SCPs. SCPs are a type of policy that you can use with AWS Organizations to manage permissions across your enterprise. SCPs offer central control over the maximum available permissions for accounts in your organization, and SCPs can help ensure your accounts stay aligned with your organization’s access control guidelines. You can find more information in Getting started with AWS Organizations.

Let’s assume you want to allow only DNS validated certificates, not email validated certificates, across your entire enterprise. You could create identity-based policies in all your accounts to deny the use of email validated certificates, but creating an SCP that denies the use of email validation across every account in your enterprise would be much more efficient and effective. However, if you only want to prevent a single IAM role in one of your accounts from issuing email validated certificates, an identity-based policy attached to that role would be the simplest, most granular method.

It’s important to note that no permissions are granted by an SCP. An SCP sets limits on the actions that you can delegate to the IAM users and roles in the affected accounts. You must still attach identity-based policies to IAM users or roles to actually grant permissions. The effective permissions are the logical intersection between what is allowed by the SCP and what is allowed by the identity-based and resource-based policies. In the next section, we examine some example policies and how you can use the intersection of SCPs and identity-based policies to enforce enterprise controls around certificates.

Certificate governance use cases and policy examples

Let’s look at some example use cases for certificate governance, and how you might implement them using the new policy condition keys. We’ve selected a few common use cases, but you can find more policy examples in the ACM documentation.

Example 1: Policy to prevent issuance of email validated certificates

Certificates requested from ACM using email validation require manual action by the domain owner to renew the certificates. This could lead to an outage for your applications if the person receiving the email to validate the domain leaves your organization — or is otherwise unable to validate your domain ownership — and the certificate expires without being renewed.

We recommend using DNS validation, which doesn’t require action on your part to automatically renew a public certificate requested from ACM. The following SCP example demonstrates how to help prevent the issuance of email validated certificates, except for a specific IAM role. This IAM role could be used by application teams who cannot use DNS validation and are given an exception.

Note that this policy will only apply to new certificate requests. ACM managed certificate renewals for certificates that were originally issued using email validation won’t be affected by this policy.

{
    "Version":"2012-10-17",
    "Statement":{
        "Effect":"Deny",
        "Action":"acm:RequestCertificate",
        "Resource":"*",
        "Condition":{
            "StringLike" : {
                "acm:ValidationMethod":"EMAIL"
            },
            "ArnNotLike": {
                "aws:PrincipalArn": [ "arn:aws:iam::123456789012:role/AllowedEmailValidation"]
            }
        }
    }
}

Example 2: Policy to prevent issuance of a wildcard certificate

A wildcard certificate contains a wildcard (*) in the domain name field, and can be used to secure multiple sub-domains of a given domain. For instance, *.example.com could be used for mail.example.com, hr.example.com, and dev.example.com. You might use wildcard certificates to reduce your operational complexity, because you can use the same certificate to protect multiple sites on multiple resources (for example, web servers). However, this also means the wildcard certificates have a larger impact radius, because a compromised wildcard certificate could affect each of the subdomains and resources where it’s used. The US National Security Agency warned about the use of wildcard certificates in 2021.

Therefore, you might want to limit the use of wildcard certificates in your organization. Here’s an example SCP showing how to help prevent the issuance of wildcard certificates using condition keys with ACM:

{
  "Version": "2012-10-17",
  "Statement": [
    {
      "Sid": "DenyWildCards",
      "Effect": "Deny",
      "Action": [
        "acm:RequestCertificate"
      ],
      "Resource": [
        "*"
      ],
      "Condition": {
        "ForAnyValue:StringLike": {
          "acm:DomainNames": [
            "${*}.*"
          ]
        }
      }
    }
  ]
}

Notice that in this example, we’re denying a request for a certificate where the leftmost character of the domain name is a wildcard. In the condition section, ForAnyValue means that if a value in the request matches at least one value in the list, the condition will apply. As acm:DomainNames is a multi-value field, we need to specify whether at least one of the provided values needs to match (ForAnyValue), or all the values must match (ForAllValues), for the condition to be evaluated as true. You can read more about multi-value context keys in the IAM documentation.

Example 3: Allow application teams to request certificates for their FQDN but not others

Consider a scenario where you have multiple application teams, and each application team has their own domain names for their workloads. You might want to only allow application teams to request certificates for their own fully qualified domain name (FQDN). In this example SCP, we’re denying requests for a certificate with the FQDN app1.example.com, unless the request is made by one of the two IAM roles in the condition element. Let’s assume these are the roles used for staging and building the relevant application in production, and the roles should have access to request certificates for the domain.

Multiple conditions in the same block must be evaluated as true for the effect to be applied. In this case, that means denying the request. In the first statement, the request must contain the domain app1.example.com for the first part to evaluate to true. If the identity making the request is not one of the two listed roles, then the condition is evaluated as true, and the request will be denied. The request will not be denied (that is, it will be allowed) if the domain name of the certificate is not app1.example.com or if the role making the request is one of the roles listed in the ArnNotLike section of the condition element. The same applies for the second statement pertaining to application team 2.

Keep in mind that each of these application team roles would still need an identity policy with the appropriate ACM permissions attached to request a certificate from ACM. This policy would be implemented as an SCP and would help prevent application teams from giving themselves the ability to request certificates for domains that they don’t control, even if they created an identity policy allowing them to do so.

{
    "Version":"2012-10-17",
    "Statement":[
    {
        "Sid": "AppTeam1",    
        "Effect":"Deny",
        "Action":"acm:RequestCertificate",
        "Resource":"*",      
        "Condition": {
        "ForAnyValue:StringLike": {
          "acm:DomainNames": "app1.example.com"
        },
        "ArnNotLike": {
          "aws:PrincipalARN": [
            "arn:aws:iam::account:role/AppTeam1Staging",
            "arn:aws:iam::account:role/AppTeam1Prod" ]
        }
      }
   },
   {
        "Sid": "AppTeam2",    
        "Effect":"Deny",
        "Action":"acm:RequestCertificate",
        "Resource":"*",      
        "Condition": {
        "ForAnyValue:StringLike": {
          "acm:DomainNames": "app2.example.com"
        },
        "ArnNotLike": {
          "aws:PrincipalARN": [
            "arn:aws:iam::account:role/AppTeam2Staging",
            "arn:aws:iam::account:role/AppTeam2Prod"]
        }
      }
   }
 ] 
}

Example 4: Policy to prevent issuing certificates with certain key algorithms

You might want to allow or restrict a certain certificate key algorithm. For example, allowing the use of ECDSA certificates but restricting RSA certificates from being issued. See this blog post for more information on the differences between ECDSA and RSA certificates, and how to evaluate which type to use for your workload. Here’s an example SCP showing how to deny requests for a certificate that uses one of the supported RSA key lengths.

{
    "Version":"2012-10-17",
    "Statement":{
        "Effect":"Deny",
        "Action":"acm:RequestCertificate",
        "Resource":"*",
        "Condition":{
            "StringLike" : {
                "acm:KeyAlgorithm":"RSA*"
            }
        }
    }
}  

Notice that we’re using a wildcard after RSA to restrict use of RSA certificates, regardless of the key length (for example, 2048, 4096, and so on).

Creating detective controls for better visibility into certificate issuance across your organization

While you can use IAM policy condition keys as a preventative control, you might also want to implement detective controls to better understand certificate issuance across your organization. Combining these preventative and detective controls helps you establish a comprehensive set of enterprise controls for certificate governance. For instance, imagine you use an SCP to deny all attempts to issue a certificate using email validation. You will have CloudTrail logs for RequestCertificate API calls that are denied by this policy, and can use these events to notify the appropriate application team that they should be using DNS validation.

You’re probably familiar with the access denied error message received when AWS explicitly or implicitly denies an authorization request. The following is an example of the error received when a certificate request is denied by an SCP:

"An error occurred (AccessDeniedException) when calling the RequestCertificate operation: User: arn:aws:sts::account:role/example is not authorized to perform: acm:RequestCertificate on resource: arn:aws:acm:us-east-1:account:certificate/* with an explicit deny in a service control policy"

If you use AWS Organizations, you can have a consolidated view of the CloudTrail events for certificate issuance using ACM by creating an organization trail. Please refer to the CloudTrail documentation for more information on security best practices in CloudTrail. Using Amazon EventBridge, you can simplify certificate lifecycle management by using event-driven workflows to notify or automatically act on expiring TLS certificates. Learn about the example use cases for the event types supported by ACM in this Security Blog post.

Conclusion

In this blog post, we discussed the new IAM policy conditions available for use with ACM. We also demonstrated some example use cases and policies where you might use these conditions to provide more granular control on the issuance of certificates across your enterprise. We also briefly covered SCPs, identity-based policies, and how you can get better visibility into certificate governance using services like AWS CloudTrail and Amazon EventBridge. See the AWS Certificate Manager documentation to learn more about using policy conditions with ACM, and then get started issuing certificates with AWS Certificate Manager.

 
If you have feedback about this post, submit comments in the Comments section below. If you have questions about this post, contact AWS Support.

Want more AWS Security news? Follow us on Twitter.

Roger Park

Roger Park

Roger is a Senior Security Content Specialist at AWS Security focusing on data protection. He has worked in cybersecurity for almost ten years as a writer and content producer. In his spare time, he enjoys trying new cuisines, gardening, and collecting records.

Zach Miller

Zach Miller

Zach is a Senior Security Specialist Solutions Architect at AWS. His background is in data protection and security architecture, focused on a variety of security domains, including cryptography, secrets management, and data classification. Today, he is focused on helping enterprise AWS customers adopt and operationalize AWS security services to increase security effectiveness and reduce risk.

Chandan Kundapur

Chandan Kundapur

Chandan is a Principal Product Manager on the AWS Certificate Manager (ACM) team. With over 15 years of cybersecurity experience, he has a passion for driving PKI product strategy.

Brandonn Gorman

Brandonn Gorman

Brandonn is a Senior Software Development Engineer at AWS Cryptography. He has a background in secure system architecture, public key infrastructure management systems, and data storage solutions. In his free time, he explores the national parks, seeks out vinyl records, and trains for races.

Migrate an existing data lake to a transactional data lake using Apache Iceberg

Post Syndicated from Rajdip Chaudhuri original https://aws.amazon.com/blogs/big-data/migrate-an-existing-data-lake-to-a-transactional-data-lake-using-apache-iceberg/

A data lake is a centralized repository that you can use to store all your structured and unstructured data at any scale. You can store your data as-is, without having to first structure the data and then run different types of analytics for better business insights. Over the years, data lakes on Amazon Simple Storage Service (Amazon S3) have become the default repository for enterprise data and are a common choice for a large set of users who query data for a variety of analytics and machine leaning use cases. Amazon S3 allows you to access diverse data sets, build business intelligence dashboards, and accelerate the consumption of data by adopting a modern data architecture or data mesh pattern on Amazon Web Services (AWS).

Analytics use cases on data lakes are always evolving. Oftentimes, you want to continuously ingest data from various sources into a data lake and query the data concurrently through multiple analytics tools with transactional capabilities. But traditionally, data lakes built on Amazon S3 are immutable and don’t provide the transactional capabilities needed to support changing use cases. With changing use cases, customers are looking for ways to not only move new or incremental data to data lakes as transactions, but also to convert existing data based on Apache Parquet to a transactional format. Open table formats, such as Apache Iceberg, provide a solution to this issue. Apache Iceberg enables transactions on data lakes and can simplify data storage, management, ingestion, and processing.

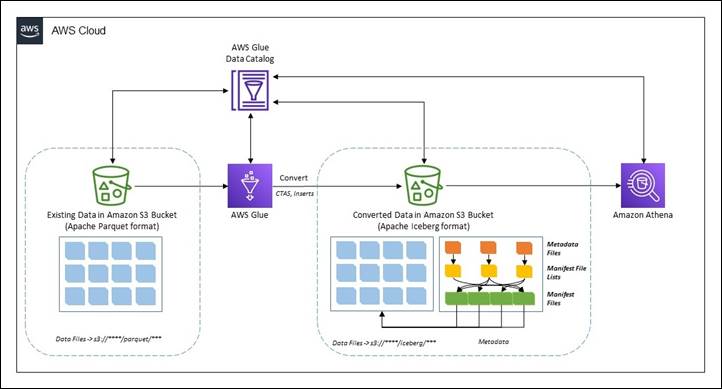
In this post, we show you how you can convert existing data in an Amazon S3 data lake in Apache Parquet format to Apache Iceberg format to support transactions on the data using Jupyter Notebook based interactive sessions over AWS Glue 4.0.

Existing Parquet to Iceberg migration

There are two broad methods to migrate the existing data in a data lake in Apache Parquet format to Apache Iceberg format to convert the data lake to a transactional table format.

In-place data upgrade

In an in-place data migration strategy, existing datasets are upgraded to Apache Iceberg format without first reprocessing or restating existing data. This means the data files in the data lake aren’t modified during the migration and all Apache Iceberg metadata files (manifests, manifest files, and table metadata files) are generated outside the purview of the data. In this method, the metadata are recreated in an isolated environment and colocated with the existing data files. This can be a much less expensive operation compared to rewriting all the data files. The existing data file format must be Apache Parquet, Apache ORC, or Apache Avro. An in-place migration can be performed in either of two ways:

  1. Using add_files: This procedure adds existing data files to an existing Iceberg table with a new snapshot that includes the files. Unlike migrate or snapshot, add_files can import files from a specific partition or partitions and doesn’t create a new Iceberg table. This procedure doesn’t analyze the schema of the files to determine if they match the schema of the Iceberg table. Upon completion, the Iceberg table treats these files as if they are part of the set of files owned by Apache Iceberg.
  2. Using migrate: This procedure replaces a table with an Apache Iceberg table loaded with the source’s data files. The table’s schema, partitioning, properties, and location are copied from the source table. Supported formats are Avro, Parquet, and ORC. By default, the original table is retained with the name table_BACKUP_. However, to leave the original table intact during the process, you must use snapshot to create a new temporary table that has the same source data files and schema.

In this post, we show you how you can use the Iceberg add_files procedure for an in-place data upgrade. Note that the migrate procedure isn’t supported in AWS Glue Data Catalog.

The following diagram shows a high-level representation.

CTAS migration of data

The create table as select (CTAS) migration approach is a technique where all the metadata information for Iceberg is generated along with restating all the data files. This method shadows the source dataset in batches. When the shadow is caught up, you can swap the shadowed dataset with the source.

The following diagram showcases the high-level flow.

Prerequisites

To follow along with the walkthrough, you must have the following:

You can check the data size using the following code in the AWS CLI or AWS CloudShell:

//Run this command to check the data size

aws s3 ls --summarize --human-readable --recursive s3://noaa-ghcn-pds/parquet/by_year/YEAR=2023

As of writing this post, there are 107 objects with total size of 70 MB for year 2023 in the Amazon S3 path.

Note that to implement the solution, you must complete a few preparatory steps.

Deploy resources using AWS CloudFormation

Complete the following steps to create the S3 bucket and the AWS IAM role and policy for the solution:

  1. Sign in to your AWS account and then choose Launch Stack to launch the CloudFormation template.

  1. For Stack name, enter a name.
  2. Leave the parameters at the default values. Note that if the default values are changed, then you must make corresponding changes throughout the following steps.
  3. Choose Next to create your stack.

This AWS CloudFormation template deploys the following resources:

  • An S3 bucket named demo-blog-post-XXXXXXXX (XXXXXXXX represents the AWS account ID used).
  • Two folders named parquet and iceberg under the bucket.
  • An IAM role and a policy named demoblogpostrole and demoblogpostscoped respectively.
  • An AWS Glue database named ghcn_db.
  • An AWS Glue Crawler named demopostcrawlerparquet.

After the the AWS CloudFormation template is successfully deployed:

  1. Copy the data in the created S3 bucket using following command in AWS CLI or AWS CloudShell. Replace XXXXXXXX appropriately in the target S3 bucket name.
    Note: In the example, we copy data only for the year 2023. However, you can work with the entire dataset, following the same instructions.

    aws s3 sync s3://noaa-ghcn-pds/parquet/by_year/YEAR=2023/ s3://demo-blog-post-XXXXXXXX/parquet/year=2023

  2. Open the AWS Management Console and go to the AWS Glue console.
  3. On the navigation pane, select Crawlers.
  4. Run the crawler named demopostcrawlerparquet.
  5. After the AWS Glue crawler demopostcrawlerparquet is successfully run, the metadata information of the Apache Parquet data will be cataloged under the ghcn_db AWS Glue database with the table name source_parquet. Notice that the table is partitioned over year and element columns (as in the S3 bucket).

  1. Use the following query to verify the data from the Amazon Athena console. If you’re using Amazon Athena for the first time in your AWS Account, set up a query result location in Amazon S3.
    SELECT * FROM ghcn_db.source_parquet limit 10;

Launch an AWS Glue Studio notebook for processing

For this post, we use an AWS Glue Studio notebook. Follow the steps in Getting started with notebooks in AWS Glue Studio to set up the notebook environment. Launch the notebooks hosted under this link and unzip them on a local workstation.

  1. Open AWS Glue Studio.
  2. Choose ETL Jobs.
  3. Choose Jupyter notebook and then choose Upload and edit an existing notebook. From Choose file, select required ipynb file and choose Open, then choose Create.
  4. On the Notebook setup page, for Job name, enter a logical name.
  5. For IAM role, select demoblogpostrole. Choose Create job. After a minute, the Jupyter notebook editor appears. Clear all the default cells.

The preceding steps launch an AWS Glue Studio notebook environment. Make sure you Save the notebook every time it’s used.

In-place data upgrade

In this section we show you how you can use the add_files procedure to achieve an in-place data upgrade. This section uses the ipynb file named demo-in-place-upgrade-addfiles.ipynb. To use with the add_files procedure, complete the following:

  1. On the Notebook setup page, for Job name, enter demo-in-place-upgrade for the notebook session as explained in Launch Glue notebook for processing.
  2. Run the cells under the section Glue session configurations. Provide the S3 bucket name from the prerequisites for the bucket_name variable by replacing XXXXXXXX.
  3. Run the subsequent cells in the notebook.

Notice that the cell under Execute add_files procedure section performs the metadata creation in the mentioned path.

Review the data file paths for the new Iceberg table. To show an Iceberg table’s current data files, .files can be used to get details such as file_path, partition, and others. Recreated files are pointing to the source path under Amazon S3.

Note the metadata file location after transformation. It’s pointing to the new folder named iceberg under Amazon S3. This can be checked using .snapshots to check Iceberg tables’ snapshot file location. Also, check the same in the Amazon S3 URI s3://demo-blog-post-XXXXXXXX/iceberg/ghcn_db.db/target_iceberg_add_files/metadata/. Also notice that there are two versions of the manifest list created after the add_files procedure has been run. The first is an empty table with the data schema and the second is adding the files.

The table is cataloged in AWS Glue under the database ghcn_db with the table type as ICEBERG.

Compare the count of records using Amazon Athena between the source and target table. They are the same.

In summary, you can use the add_files procedure to convert existing data files in Apache Parquet format in a data lake to Apache Iceberg format by adding the metadata files and without recreating the table from scratch. Following are some pros and cons of this method.

Pros

  • Avoids full table scans to read the data as there is no restatement. This can save time.
  • If there are any errors during while writing the metadata, only a metadata re-write is required and not the entire data.
  • Lineage of the existing jobs is maintained because the existing catalog still exists.

Cons

  • If data is processed (inserts, updates, and deletes) in the dataset during the metadata writing process, the process must be run again to include the new data.
  • There must be write downtime to avoid having to run the process a second time.
  • If a data restatement is required, this workflow will not work as source data files aren’t modified.

CTAS migration of data

This section uses the ipynb file named demo-ctas-upgrade.ipynb. Complete the following:

  1. On the Notebook setup page, for Job name, enter demo-ctas-upgrade for the notebook session as explained under Launch Glue notebook for processing.
  2. Run the cells under the section Glue session configurations. Provide the S3 bucket name from the prerequisites for the bucket_name variable by replacing XXXXXXXX.
  3. Run the subsequent cells in the notebook.

Notice that the cell under Create Iceberg table from Parquet section performs the shadow upgrade to Iceberg format. Note that Iceberg requires sorting the data according to table partitions before writing to the Iceberg table. Further details can be found in Writing Distribution Modes.

Notice the data and metadata file paths for the new Iceberg table. It’s pointing to the new path under Amazon S3. Also, check under the Amazon S3 URI s3://demo-blog-post-XXXXXXXX/iceberg/ghcn_db.db/target_iceberg_ctas/ used for this post.

The table is cataloged under AWS Glue under the database ghcn_db with the table type as ICEBERG.

Compare the count of records using Amazon Athena between the source and target table. They are same.

In summary, the CTAS method creates a new table by generating all the metadata files along with restating the actual data. Following are some pros and cons of this method:

Pros

  • It allows you to audit and validate the data during the process because data is restated.
  • If there are any runtime issues during the migration process, rollback and recovery can be easily performed by deleting the Apache Iceberg table.
  • You can test different configurations when migrating a source. You can create a new table for each configuration and evaluate the impact.
  • Shadow data is renamed to a different directory in the source (so it doesn’t collide with old Apache Parquet data).

Cons

  • Storage of the dataset is doubled during the process as both the original Apache Parquet and new Apache Iceberg tables are present during the migration and testing phase. This needs to be considered during cost estimation.
  • The migration can take much longer (depending on the volume of the data) because both data and metadata are written.
  • It’s difficult to keep tables in sync if there changes to the source table during the process.

Clean up

To avoid incurring future charges, and to clean up unused roles and policies, delete the resources you created: the datasets, CloudFormation stack, S3 bucket, AWS Glue job, AWS Glue database, and AWS Glue table.

Conclusion

In this post, you learned strategies for migrating existing Apache Parquet formatted data to Apache Iceberg in Amazon S3 to convert to a transactional data lake using interactive sessions in AWS Glue 4.0 to complete the processes. If you have an evolving use case where an existing data lake needs to be converted to a transactional data lake based on Apache Iceberg table format, follow the guidance in this post.

The path you choose for this upgrade, an in-place upgrade or CTAS migration, or a combination of both, will depend on careful analysis of the data architecture and data integration pipeline. Both pathways have pros and cons, as discussed. At a high level, this upgrade process should go through multiple well-defined phases to identify the patterns of data integration and use cases. Choosing the correct strategy will depend on your requirements—such as performance, cost, data freshness, acceptable downtime during migration, and so on.


About the author

Rajdip Chaudhuri is a Senior Solutions Architect with Amazon Web Services specializing in data and analytics. He enjoys working with AWS customers and partners on data and analytics requirements. In his spare time, he enjoys soccer and movies.

Apache Iceberg optimization: Solving the small files problem in Amazon EMR

Post Syndicated from Avijit Goswami original https://aws.amazon.com/blogs/big-data/apache-iceberg-optimization-solving-the-small-files-problem-in-amazon-emr/

In our previous post Improve operational efficiencies of Apache Iceberg tables built on Amazon S3 data lakes, we discussed how you can implement solutions to improve operational efficiencies of your Amazon Simple Storage Service (Amazon S3) data lake that is using the Apache Iceberg open table format and running on the Amazon EMR big data platform. Iceberg tables store metadata in manifest files. As the number of data files increase, the amount of metadata stored in these manifest files also increases, leading to longer query planning time. The query runtime also increases because it’s proportional to the number of data or metadata file read operations. Compaction is the process of combining these small data and metadata files to improve performance and reduce cost. Compaction also gets rid of deleting files by applying deletes and rewriting a new file without deleting records. Currently, Iceberg provides a compaction utility that compacts small files at a table or partition level. But this approach requires you to implement the compaction job using your preferred job scheduler or manually triggering the compaction job.

In this post, we discuss the new Iceberg feature that you can use to automatically compact small files while writing data into Iceberg tables using Spark on Amazon EMR or Amazon Athena.

Use cases for processing small files

Streaming applications are prone to creating a large number of small files, which can negatively impact the performance of subsequent processing times. For example, consider a critical Internet of Things (IoT) sensor from a cold storage facility that is continuously sending temperature and health data into an S3 data lake for downstream data processing and triggering actions like emergency maintenance. Systems of this nature generate a huge number of small objects and need attention to compact them to a more optimal size for faster reading, such as 128 MB, 256 MB, or 512 MB. In this post, we show you a streaming sensor data use case with a large number of small files and the mitigation steps using the Iceberg open table format. For more information on streaming applications on AWS, refer to Real-time Data Streaming and Analytics.

Streaming Architecture

Solution overview

To compact the small files for improved performance, in this example, Amazon EMR triggers a compaction job after the write commit as a post-commit hook when defined thresholds (for example, number of commits) are met. By default, Amazon EMR waits for 10 commits to trigger the post-commit hook compaction utility.

This Iceberg event-based table management feature lets you monitor table activities during writes to make better decisions about how to manage each table differently based on events. As of this writing, only the optimize-data optimization is supported. To learn more about the available optimize data executors and catalog properties, refer to the README file in the GitHub repo.

To use the feature, you can use the iceberg-aws-event-based-table-management source code and provide the built JAR in the engine’s class-path. The following bootstrap action can place the JAR in the engine’s class-path:

sudo aws s3 cp s3://<path>/iceberg-aws-event-based-table-management-0.1.jar /usr/lib/spark/jars/

Note that the Iceberg AWS event-based table management feature works with Iceberg v1.2.0 and above (available from Amazon EMR 6.11.0).

In some use cases, you may want to run the event-based compaction jobs in a different EMR cluster in order to avoid any impact to the ETL jobs running in their current EMR cluster. You can get the metadata, including the cluster ID of your current ETL workflows, from the /mnt/var/lib/info/job-flow.json file and then use a different cluster to process the event-based compactions.

The notebook examples shown in the following sections are also available in the aws-samples GitHub repo.

Prerequisite

For this performance comparison exercise between a Spark external table and an Iceberg table and Iceberg with compaction, we generate a significant number of small files in Parquet format and store them in an S3 bucket. We used the Amazon Kinesis Data Generator (KDG) tool to generate sample sensor data information using the following template:

{"sensorId": {{random.number(5000)}},
 "currentTemperature": {{random.number(
        {
            "min":10,
            "max":150
        }
  )}},
 "status": "{{random.arrayElement(
        ["OK","FAIL","WARN"]
    )}}",
 "date_ts": "{{date.now("YYYY-MM-DD HH:mm:ss")}}"
}

We configured an Amazon Kinesis Data Firehose delivery stream and sent the generated data into a staging S3 bucket. Then we ran an AWS Glue extract, transform, and load (ETL) job to convert the JSON files into Parquet format. For our testing, we generated about 58,176 small objects with total size of 2 GB.

For running the Amazon EMR tests, we used Amazon EMR version emr-6.11.0 with Spark 3.3.2, and JupyterEnterpriseGateway 2.6.0. The cluster used had one primary node (r5.2xlarge) and two core nodes (r5.xlarge). We used a bootstrap action during cluster creation to enable event-based table management:

sudo aws s3 cp s3://<path>/iceberg-aws-event-based-table-management-0.1.jar /usr/lib/spark/jars/

Also, refer to our guidance on how to use an Iceberg cluster with Spark, which is a prerequisite for this exercise.

As part of the exercise, we see new steps are being added to the EMR cluster to trigger the compaction jobs. To enable adding new steps to the running cluster, we add the elasticmapreduce:AddJobFlowSteps action to the cluster’s default role, EMR_EC2_DefaultRole, as a prerequisite.

Performance of Iceberg reads with the compaction utility on Amazon EMR

In the following steps, we demonstrate how to use the compaction utility and what performance benefits you can achieve. We use an EMR notebook to demonstrate the benefits of the compaction utility. For instructions to set up an EMR notebook, refer to Amazon EMR Studio overview.

First, you configure your Spark session using the %%configure magic command. We use the Hive catalog for Iceberg tables.

  1. Before you run the following step, create an Amazon S3 bucket in your AWS account called <your-iceberg-storage-blog>. To check how to create an Amazon S3 bucket, follow the instructions given here. Update the your-iceberg-storage-blog bucket name in the following configuration with the actual bucket name you created to test this example:
    %%configure -f
    {
    "conf":{
        "spark.sql.extensions":"org.apache.iceberg.spark.extensions.IcebergSparkSessionExtensions",
        "spark.sql.catalog.dev":"org.apache.iceberg.spark.SparkCatalog",
        "spark.sql.catalog.dev.catalog-impl":"org.apache.iceberg.aws.glue.GlueCatalog",
        "spark.sql.catalog.dev.io-impl":"org.apache.iceberg.aws.s3.S3FileIO",
        "spark.sql.catalog.dev.warehouse":"s3://<your-iceberg-storage-blog>/iceberg/"
        }
    }

  2. Create a new database for the Iceberg table in the AWS Glue Data Catalog named DB and provide the S3 URI specified in the Spark config as s3://<your-iceberg-storage-blog>/iceberg/db. Also, create another Database named iceberg_db in Glue for the parquet tables. Follow the instructions given in Working with databases on the AWS Glue console to create your Glue databases. Then create a new Spark table in Parquet format pointing to the bucket containing small objects in your AWS account. See the following code:
    spark.sql(""" CREATE TABLE iceberg_db.sensor_data_parquet_table (
        sensorid int,
        currenttemperature int,
        status string,
        date_ts timestamp)
    USING parquet
    location 's3://<your-bucket-with-parquet-files>/'
    """)

  3. Run an aggregate SQL to measure the performance of Spark SQL on the Parquet table with 58,176 small objects:
    spark.sql(""" select maxtemp, mintemp, avgtemp from
    (select
    max(currenttemperature) as maxtemp,
    min(currenttemperature) as mintemp,
    avg(currenttemperature) as avgtemp
    from iceberg_db.sensor_data_parquet_table
    where month(date_ts) between 2 and 10
    order by maxtemp, mintemp, avgtemp)""").show()

In the following steps, we create a new Iceberg table from the Spark/Parquet table using CTAS (Create Table As Select). Then we show how the automated compaction job can help improve query performance.

  1. Create a new Iceberg table using CTAS from the earlier AWS Glue table with the small files:
    spark.sql(""" CREATE TABLE dev.db.sensor_data_iceberg_format USING iceberg AS (SELECT * FROM iceberg_db.sensor_data_parquet_table)""")

  2. Validate that a new Iceberg snapshot was created for the new table:
    spark.sql(""" Select * from dev.db.sensor_data_iceberg_format.snapshots limit 5""").show()

We have confirmed that our S3 folder corresponds to the newly created Iceberg table. It shows that during the CTAS statement, it added 1,879 objects in the new folder with a total size of 1.3 GB. We can conclude that Iceberg did some optimization while loading data from the Parquet table.

  1. Now that you have data in the Iceberg table, run the previous aggregation SQL to check the runtime:
    spark.sql(""" select maxtemp, mintemp, avgtemp from
    (select
    max(currenttemperature) as maxtemp,
    min(currenttemperature) as mintemp,
    avg(currenttemperature) as avgtemp
    from dev.db.sensor_data_iceberg_format
    where month(date_ts) between 2 and 10
    order by maxtemp, mintemp, avgtemp)""").show()

The runtime for the preceding query ran on the Iceberg table with 1,879 objects in 1 minute, 39 seconds. There is already some significant performance improvement by converting the external Parquet table to an Iceberg table.

  1. Now let’s add the configurations needed to apply the automatic compaction of small files in the Iceberg tables. Note the last four newly added configurations in the following statement. The parameter optimize-data.commit-threshold suggests that the compaction will take place after the first successful commit. The default is 10 successful commits to trigger the compaction.
    %%configure -f
    {
    "conf":{
        "spark.sql.extensions":"org.apache.iceberg.spark.extensions.IcebergSparkSessionExtensions",
        "spark.sql.catalog.dev":"org.apache.iceberg.spark.SparkCatalog",
        "spark.sql.catalog.dev.catalog-impl":"org.apache.iceberg.aws.glue.GlueCatalog",
        "spark.sql.catalog.dev.io-impl":"org.apache.iceberg.aws.s3.S3FileIO",
        "spark.sql.catalog.dev.warehouse":"s3://<your-iceberg-storage-blog>/iceberg/",
        "spark.sql.catalog.dev.metrics-reporter-impl":"org.apache.iceberg.aws.manage.AwsTableManagementMetricsEvaluator",
        "spark.sql.catalog.dev.optimize-data.impl":"org.apache.iceberg.aws.manage.EmrOnEc2OptimizeDataExecutor",
        "spark.sql.catalog.dev.optimize-data.emr.cluster-id":"j-1N8J5NZI0KEU3",
        "spark.sql.catalog.dev.optimize-data.commit-threshold":"1"
        }
    }

  2. Run a quick sanity check to confirm that the configurations are working fine with Spark SQL.

  1. 10. To activate the automatic compaction process, add a new record to the existing Iceberg table using a Spark insert:
    spark.sql(""" Insert into dev.db.sensor_data_iceberg_format values(999123, 86, 'PASS', timestamp'2023-07-26 12:50:25') """)

  2. Navigate to the Amazon EMR console to check the cluster steps.

You should see a new step added that goes from Pending to Running and finally the Completed state. Every time the data in the Iceberg table is updated or inserted, based on configuration optimize-data.commit-threshold, the optimize job will automatically trigger to compact the underlying data.

  1. Validate that the record insert was successful.

  1. Check the snapshot table to see that a new snapshot is created for the table with the operation replace.

For every successful run of the background optimize job, a new entry will be added to the snapshot table.

  1. On the Amazon S3 console, navigate to the folder corresponding to the Iceberg table and see that the data files are compacted.

In our case, it was compacted from the previous smaller sizes to approximately 437 MB. The folder will still contain the previous smaller files for time travel unless you issue an expire snapshot command to remove them.

  1. Now you can run the same aggregate query and record the performance after the compaction.

Summary of Amazon EMR testing

The runtime for the preceding aggregation query on the compacted Iceberg table reduced to approximately 59 seconds from the previous runtime of 1 minute, 39 seconds. That is about a 40% improvement. The more small files you have in your source bucket, the bigger performance boost you can achieve with this post-hook compaction implementation. The examples shown in this blog were executed in a small Amazon EMR cluster with only two core nodes (r5.xlarge). To improve the performance of your Spark applications, Amazon EMR provides multiple optimization features that you can implement for your production workloads.

Performance of Iceberg reads with the compaction utility on Athena

To manage the Iceberg table based on events, you can start the Spark 3.3 SQL shell as shown in the following code. Make sure that the athena:StartQueryExecution and athena:GetQueryExecution permission policies are enabled.

spark-sql --conf spark.sql.catalog.my_catalog=org.apache.iceberg.spark.SparkCatalog \
          --conf spark.sql.catalog.my_catalog.catalog-impl=org.apache.iceberg.aws.glue.GlueCatalog \
          --conf spark.sql.catalog.my_catalog.warehouse=<s3-bucket> \
          --conf spark.sql.catalog.my_catalog.metrics-reporter-impl=org.apache.iceberg.aws.manage.AwsTableManagementMetricsEvaluator \
          --conf spark.sql.catalog.my_catalog.optimize-data.impl=org.apache.iceberg.aws.manage.AthenaOptimizeDataExecutor \
          --conf spark.sql.catalog.my_catalog.optimize-data.athena.output-bucket=<s3-bucket>

Clean up

After you complete the test, clean up your resources to avoid any recurring costs:

  1. Delete the S3 buckets that you created for this test.
  2. Delete the EMR cluster.
  3. Stop and delete the EMR notebook instance.

Conclusion

In this post, we showed how Iceberg event-based table management lets you manage each table differently based on events and compact small files to boost application performance. This event-based process significantly reduces the operational overhead of using the Iceberg rewrite_data_files procedure, which needs manual or scheduled operation.

To learn more about Apache Iceberg and implement this open table format for your transactional data lake use cases, refer to the following resources:


About the Authors

Avijit Goswami is a Principal Solutions Architect at AWS specialized in data and analytics. He supports AWS strategic customers in building high-performing, secure, and scalable data lake solutions on AWS using AWS managed services and open-source solutions. Outside of his work, Avijit likes to travel, hike, watch sports, and listen to music.

Rajarshi Sarkar is a Software Development Engineer at Amazon EMR/Athena. He works on cutting-edge features of Amazon EMR/Athena and is also involved in open-source projects such as Apache Iceberg and Trino. In his spare time, he likes to travel, watch movies, and hang out with friends.
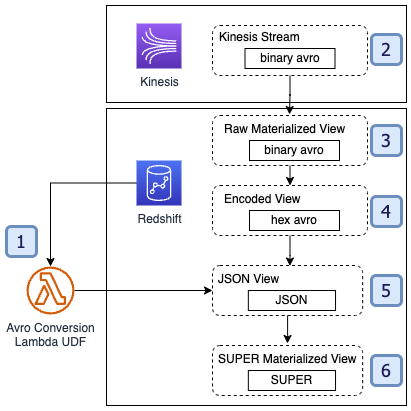
Non-JSON ingestion using Amazon Kinesis Data Streams, Amazon MSK, and Amazon Redshift Streaming Ingestion

Post Syndicated from M Mehrtens original https://aws.amazon.com/blogs/big-data/non-json-ingestion-using-amazon-kinesis-data-streams-amazon-msk-and-amazon-redshift-streaming-ingestion/

Organizations are grappling with the ever-expanding spectrum of data formats in today’s data-driven landscape. From Avro’s binary serialization to the efficient and compact structure of Protobuf, the landscape of data formats has expanded far beyond the traditional realms of CSV and JSON. As organizations strive to derive insights from these diverse data streams, the challenge lies in seamlessly integrating them into a scalable solution.

In this post, we dive into Amazon Redshift Streaming Ingestion to ingest, process, and analyze non-JSON data formats. Amazon Redshift Streaming Ingestion allows you to connect to Amazon Kinesis Data Streams and Amazon Managed Streaming for Apache Kafka (Amazon MSK) directly through materialized views, in real time and without the complexity associated with staging the data in Amazon Simple Storage Service (Amazon S3) and loading it into the cluster. These materialized views not only provide a landing zone for streaming data, but also offer the flexibility of incorporating SQL transforms and blending into your extract, load, and transform (ELT) pipeline for enhanced processing. For a deeper exploration on configuring and using streaming ingestion in Amazon Redshift, refer to Real-time analytics with Amazon Redshift streaming ingestion.

JSON data in Amazon Redshift

Amazon Redshift enables storage, processing, and analytics on JSON data through the SUPER data type, PartiQL language, materialized views, and data lake queries. The base construct to access streaming data in Amazon Redshift provides metadata from the source stream (attributes like stream timestamp, sequence numbers, refresh timestamp, and more) and the raw binary data from the stream itself. For streams that contain the raw binary data encoded in JSON format, Amazon Redshift provides a variety of tools for parsing and managing the data. For more information about the metadata of each stream format, refer to Getting started with streaming ingestion from Amazon Kinesis Data Streams and Getting started with streaming ingestion from Amazon Managed Streaming for Apache Kafka.

At the most basic level, Amazon Redshift allows parsing the raw data into distinct columns. The JSON_EXTRACT_PATH_TEXT and JSON_EXTRACT_ARRAY_ELEMENT_TEXT functions enable the extraction of specific details from JSON objects and arrays, transforming them into separate columns for analysis. When the structure of the JSON documents and specific reporting requirements are defined, these methods allow for pre-computing a materialized view with the exact structure needed for reporting, with improved compression and sorting for analytics.

In addition to this approach, the Amazon Redshift JSON functions allow storing and analyzing the JSON data in its original state using the adaptable SUPER data type. The function JSON_PARSE allows you to extract the binary data in the stream and convert it into the SUPER data type. With the SUPER data type and PartiQL language, Amazon Redshift extends its capabilities for semi-structured data analysis. It uses the SUPER data type for JSON data storage, offering schema flexibility within a column. For more information on using the SUPER data type, refer to Ingesting and querying semistructured data in Amazon Redshift. This dynamic capability simplifies data ingestion, storage, transformation, and analysis of semi-structured data, enriching insights from diverse sources within the Redshift environment.

Streaming data formats

Organizations using alternative serialization formats must explore different deserialization methods. In the next section, we dive into the optimal approach for deserialization. In this section, we take a closer look at the diverse formats and strategies organizations use to effectively manage their data. This understanding is key in determining the data parsing approach in Amazon Redshift.

Many organizations use a format other than JSON for their streaming use cases. JSON is a self-describing serialization format, where the schema of the data is stored alongside the actual data itself. This makes JSON flexible for applications, but this approach can lead to increased data transmission between applications due to the additional data contained in the JSON keys and syntax. Organizations seeking to optimize their serialization and deserialization performance, and their network communication between applications, may opt to use a format like Avro, Protobuf, or even a custom proprietary format to serialize application data into binary format in an optimized way. This provides the advantage of an efficient serialization where only the message values are packed into a binary message. However, this requires the consumer of the data to know what schema and protocol was used to serialize the data to deserialize the message. There are several ways that organizations can solve this problem, as illustrated in the following figure.

Visualization of different binary message serialization approaches

Embedded schema

In an embedded schema approach, the data format itself contains the schema information alongside the actual data. This means that when a message is serialized, it includes both the schema definition and the data values. This allows anyone receiving the message to directly interpret and understand its structure without needing to refer to an external source for schema information. Formats like JSON, MessagePack, and YAML are examples of embedded schema formats. When you receive a message in this format, you can immediately parse it and access the data with no additional steps.

Assumed schema

In an assumed schema approach, the message serialization contains only the data values, and there is no schema information included. To interpret the data correctly, the receiving application needs to have prior knowledge of the schema that was used to serialize the message. This is typically achieved by associating the schema with some identifier or context, like a stream name. When the receiving application reads a message, it uses this context to retrieve the corresponding schema and then decodes the binary data accordingly. This approach requires an additional step of schema retrieval and decoding based on context. This generally requires setting up a mapping in-code or in an external database so that consumers can dynamically retrieve the schemas based on stream metadata (such as the AWS Glue Schema Registry).

One drawback of this approach is in tracking schema versions. Although consumers can identify the relevant schema from the stream name, they can’t identify the particular version of the schema that was used. Producers need to ensure that they are making backward-compatible changes to schemas to ensure consumers aren’t disrupted when using a different schema version.

Embedded schema ID

In this case, the producer continues to serialize the data in binary format (like Avro or Protobuf), similar to the assumed schema approach. However, an additional step is involved: the producer adds a schema ID at the beginning of the message header. When a consumer processes the message, it starts by extracting the schema ID from the header. With this schema ID, the consumer then fetches the corresponding schema from a registry. Using the retrieved schema, the consumer can effectively parse the rest of the message. For example, the AWS Glue Schema Registry provides Java SDK SerDe libraries, which can natively serialize and deserialize messages in a stream using embedded schema IDs. Refer to How the schema registry works for more information about using the registry.

The usage of an external schema registry is common in streaming applications because it provides a number of benefits to consumers and developers. This registry contains all the message schemas for the applications and associates them with a unique identifier to facilitate schema retrieval. In addition, the registry may provide other functionalities like schema version change handling and documentation to facilitate application development.

The embedded schema ID in the message payload can contain version information, ensuring publishers and consumers are always using the same schema version to manage data. When schema version information isn’t available, schema registries can help enforce producers making backward-compatible changes to avoid causing issues in consumers. This helps decouple producers and consumers, provides schema validation at both the publisher and consumer stage, and allows for more flexibility in stream usage to allow for a variety of application requirements. Messages can be published with one schema per stream, or with multiple schemas inside a single stream, allowing consumers to dynamically interpret messages as they arrive.

For a deeper dive into the benefits of a schema registry, refer to Validate streaming data over Amazon MSK using schemas in cross-account AWS Glue Schema Registry.

Schema in file

For batch processing use cases, applications may embed the schema used to serialize the data into the data file itself to facilitate data consumption. This is an extension of the embedded schema approach but is less costly because the data file is generally larger, so the schema accounts for a proportionally smaller amount of the overall data. In this case, the consumers can process the data directly without additional logic. Amazon Redshift supports loading Avro data that has been serialized in this manner using the COPY command.

Convert non-JSON data to JSON

Organizations aiming to use non-JSON serialization formats need to develop an external method for parsing their messages outside of Amazon Redshift. We recommend using an AWS Lambda-based external user-defined function (UDF) for this process. Using an external Lambda UDF allows organizations to define arbitrary deserialization logic to support any message format, including embedded schema, assumed schema, and embedded schema ID approaches. Although Amazon Redshift supports defining Python UDFs natively, which may be a viable alternative for some use cases, we demonstrate the Lambda UDF approach in this post to cover more complex scenarios. For examples of Amazon Redshift UDFs, refer to AWS Samples on GitHub.

The basic architecture for this solution is as follows.

See the following code:

-- Step 1
CREATE OR REPLACE EXTERNAL FUNCTION fn_lambda_decode_avro_binary(varchar)
RETURNS varchar IMMUTABLE LAMBDA 'redshift-avro-udf';

-- Step 2
CREATE EXTERNAL SCHEMA kds FROM KINESIS

-- Step 3
CREATE MATERIALIZED VIEW {name} AUTO REFRESH YES AS
SELECT
    -- Step 4
   t.kinesis_data AS binary_avro,
   to_hex(binary_avro) AS hex_avro,
   -- Step 5
   fn_lambda_decode_avro_binary('{stream-name}', hex_avro) AS json_string,
   -- Step 6
   JSON_PARSE(json_string) AS super_data,
   t.sequence_number,
   t.refresh_time,
   t.approximate_arrival_timestamp,
   t.shard_id
FROM kds.{stream_name} AS t

Let’s explore each step in more detail.

Create the Lambda UDF

The overall goal is to develop a method that can accept the raw data as input and produce JSON-encoded data as an output. This aligns with the Amazon Redshift ability to natively process JSON into the SUPER data type. The specifics of the function depend on the serialization and streaming approach. For example, using the assumed schema approach with Avro format, your Lambda function may complete the following steps:

  1. Take in the stream name and hexadecimal-encoded data as inputs.
  2. Use the stream name to perform a lookup to identify the schema for the given stream name.
  3. Decode the hexadecimal data into binary format.
  4. Use the schema to deserialize the binary data into readable format.
  5. Re-serialize the data into JSON format.

The f_glue_schema_registry_avro_to_json AWS samples example illustrates the process of decoding Avro using the assumed schema approach using the AWS Glue Schema Registry in a Lambda UDF to retrieve and use Avro schemas by stream name. For other approaches (such as embedded schema ID), you should author your Lambda function to handle deserialization as defined by your serialization process and schema registry implementation. If your application depends on an external schema registry or table lookup to process the message schema, we recommend that you implement caching for schema lookups to help reduce the load on the external systems and reduce the average Lambda function invocation duration.

When creating the Lambda function, make sure you accommodate the Amazon Redshift input event format and ensure compliance with the expected Amazon Redshift event output format. For details, refer to Creating a scalar Lambda UDF.

After you create and test the Lambda function, you can define it as a UDF in Amazon Redshift. For effective integration within Amazon Redshift, designate this Lambda function UDF as IMMUTABLE. This classification supports incremental materialized view updates. This treats the Lambda function as idempotent and minimizes the Lambda function costs for the solution, because a message doesn’t need to be processed if it has been processed before.

Configure the baseline Kinesis data stream

Regardless of your messaging format or approach (embedded schema, assumed schema, and embedded schema ID), you begin with setting up the external schema for streaming ingestion from your messaging source into Amazon Redshift. For more information, refer to Streaming ingestion.

CREATE EXTERNAL SCHEMA kds FROM KINESIS

IAM_ROLE 'arn:aws:iam::0123456789:role/redshift-streaming-role';

Create the raw materialized view

Next, you define your raw materialized view. This view contains the raw message data from the streaming source in Amazon Redshift VARBYTE format.

Convert the VARBYTE data to VARCHAR format

External Lambda function UDFs don’t support VARBYTE as an input data type. Therefore, you must convert the raw VARBYTE data from the stream into VARCHAR format to pass to the Lambda function. The best way to do this in Amazon Redshift is using the TO_HEX built-in method. This converts the binary data into hexadecimal-encoded character data, which can be sent to the Lambda UDF.

Invoke the Lambda function to retrieve JSON data

After the UDF has been defined, we can invoke the UDF to convert our hexadecimal-encoded data into JSON-encoded VARCHAR data.

Use the JSON_PARSE method to convert the JSON data to SUPER data type

Finally, we can use the Amazon Redshift native JSON parsing methods like JSON_PARSE, JSON_EXTRACT_PATH_TEXT, and more to parse the JSON data into a format that we can use for analytics.

Considerations

Consider the following when using this strategy:

  • Cost – Amazon Redshift invokes the Lambda function in batches to improve scalability and reduce the overall number of Lambda invocations. The cost of this solution depends on the number of messages in your stream, the frequency of the refresh, and the invocation time required to process the messages in a batch from Amazon Redshift. Using the IMMUTABLE UDF type in Amazon Redshift can also help minimize costs by utilizing the incremental refresh strategy for the materialized view.
  • Permissions and network access – The AWS Identity and Access Management (IAM) role used for the Amazon Redshift UDF must have permissions to invoke the Lambda function, and you must deploy the Lambda function such that it has access to invoke its external dependencies (for example, you may need to deploy it in a VPC to access private resources like a schema registry).
  • Monitoring – Use Lambda function logging and metrics to identify errors in deserialization, connection to the schema registry, and data processing. For details on monitoring the UDF Lambda function, refer to Embedding metrics within logs and Monitoring and troubleshooting Lambda functions.

Conclusion

In this post, we dove into different data formats and ingestion methods for a streaming use case. By exploring strategies for handling non-JSON data formats, we examined the use of Amazon Redshift streaming to seamlessly ingest, process, and analyze these formats in near-real time using materialized views.

Furthermore, we navigated through schema-per-stream, embedded schema, assumed schema, and embedded schema ID approaches, highlighting their merits and considerations. To bridge the gap between non-JSON formats and Amazon Redshift, we explored the creation of Lambda UDFs for data parsing and conversion. This approach offers a comprehensive means to integrate diverse data streams into Amazon Redshift for subsequent analysis.

As you navigate the ever-evolving landscape of data formats and analytics, we hope this exploration provides valuable guidance to derive meaningful insights from your data streams. We welcome any thoughts or questions in the comments section.


About the Authors

M Mehrtens has been working in distributed systems engineering throughout their career, working as a Software Engineer, Architect, and Data Engineer. In the past, M has supported and built systems to process terrabytes of streaming data at low latency, run enterprise Machine Learning pipelines, and created systems to share data across teams seamlessly with varying data toolsets and software stacks. At AWS, they are a Sr. Solutions Architect supporting US Federal Financial customers.

Sindhu Achuthan is a Sr. Solutions Architect with Federal Financials at AWS. She works with customers to provide architectural guidance on analytics solutions using AWS Glue, Amazon EMR, Amazon Kinesis, and other services. Outside of work, she loves DIYs, to go on long trails, and yoga.

Build and deploy to Amazon EKS with Amazon CodeCatalyst

Post Syndicated from Vineeth Nair original https://aws.amazon.com/blogs/devops/build-and-deploy-to-amazon-eks-with-amazon-codecatalyst/

Amazon CodeCatalyst is an integrated service for software development teams adopting continuous integration and deployment (CI/CD) practices into their software development process. CodeCatalyst puts all of the tools that development teams need in one place, allowing for a unified experience for collaborating on, building, and releasing software. You can also integrate AWS resources with your projects by connecting your AWS accounts to your CodeCatalyst space. By managing all of the stages and aspects of your application lifecycle in one tool, you can deliver software quickly and confidently.

Introduction

Containerization has revolutionized the way we develop, deploy, and scale applications. With the rise of managed container services like Amazon Elastic Kubernetes Service (EKS), developers can leverage the power of Kubernetes without worrying about the underlying infrastructure. In this post, we will focus on how DevOps teams can use CodeCatalyst to build and deploy applications to EKS clusters.

CodeCatalyst offers a collection of pre-built actions that encapsulate common container-related tasks such as building and pushing a container image to an ECR and deploying a Kubernetes manifest. In this walkthrough, we will leverage two actions that can greatly simplify the container build and deployment process. We start by building a simple container image with the ‘Push to Amazon ECR’ action from CodeCatalyst labs. This action simplifies the process of building, tagging and pushing an image to an Amazon Elastic Container Registry (ECR). We will also utilize the ‘Deploy to Kubernetes cluster’ action from AWS for pushing our Kubernetes manifests with our updated image.

Architecture diagram demonstrating how a developer uses Cloud9 and a repository to store code, then pushes the image to Amazon ECR and deploys it to Amazon EKS.
Figure 1: Architectural Diagram.

Prerequisites

To follow along with the post, you will need the following items:

Walkthrough

In this walkthrough, we will build a simple Nginx based application and push this to an ECR, we will then build and deploy this image to an EKS cluster. The emphasis of this post, will be on how to translate a fairly common pattern with microservices applications to a CodeCatalyst workflow. At the end of the post, our workflow will look like so:

The image shows how codecatalyst worflow configured. 1st stage is pusing the Image to Amazon ECR followed by Deploy to Amazon EKS
Figure 2: CodeCatalyst workflow.

Create the base workflow

To begin, we will create our workflow, in the CodeCatalyst project, Select CI/CD → Workflows → Create workflow:

Image shows how to create workflow which has Source repository and Branch to be selected from drop down option
Figure 3: Create workflow.

Leave the defaults for the Source Repository and Branch, select Create. We will have an empty workflow:

Image shows how an emapy workflow looks like. It doesn't have any sptes configured which need to be added in this file based on our requirement.
Figure 4: Empty workflow.

We can edit the workflow from within the CodeCatalyst console, or use a Dev Environment. We will create an initial commit of this workflow file, ignore any validation errors at this stage:

Image shows how to create a Dev environment. User need to provide a workflow name, commit message along with Repository name and Branch name.
Figure 5: Creating Dev environment.

Connect to CodeCatalyst Dev Environment

For this post, we will use an AWS Cloud9 Dev Environment. Our first step is to connect to the Dev environment. Select Code → Dev Environments. If you do not already a Dev Instance, you can create an instance by selecting Create Dev Environment.

Image shows how a Dev environment looks like. The environment we created in the previous step, will be listed here.
Figure 6: My Dev environment.

Create a CodeCatalyst secret

Prior to adding the code, we will add a CodeCatalyst secret that will be consumed by our workflow. Using CodeCatalyst secrets ensures that we do not store sensitive data in plaintext in our workflow file. To create the secrets in the CodeCatalyst console, browse to CICD -> Secrets. Select Create Secret with the following details:

The image shows how we can create a secret. We need to pass Name and Value along with option desctption to create a secret.
Figure 7: Adding secrets.

Name: eks_cluster_name

Value: <Your EKS Cluster name>

Connect to the CodeCatalyst Dev Environment

We already have a Dev Environment so we will select Resume Instance. A new browser tab opens for the IDE and will be available in less than a minute. Once the IDE is ready, we can go ahead and start creating the Dockerfile and Kubernetes manifest that make up our application

mkdir WebApp
cat <<EOF > WebApp/Dockerfile
FROM nginx
RUN apt-get update && apt-get install -y curl
EOF

The previous command block creates our Dockerfile, which we will build in our CodeCatalyst workflow from an Nginx base image and installs cURL. Next, we will add our Kubernetes manifest file to create a Kubernetes deployment and service for our application:

Create a directory called Manifests and a file inside the directory called demo-app.yaml. Update the file with code for deployment and Kubernetes Service.

The image shows the code structure of demo-app.yaml file
Figure 8: demo-app.yaml file.

The previous code block shows the Kubernetes manifest file for our deployment, along with a Kubernetes service. We modify the image value to include the URI for our ECR as this value is unique. Once we have created our Dockerfile and Kubernetes manifest, pull the latest changes to our repository, including our workflow file that we just created. In our environment, our repository is called eks-demo-app:

cd eks-demo-app && git pull

We can now edit this file in our IDE. In our example our workflow is Workflow_df84 , we will locate Workflow_df84.yaml in the .codecatalyst\workflows directory in our repository. From here we can double click on the file to launch in the IDE for editing:

Image shows empty workflow yaml file.
Figure 9: workflow file in yaml format.

Add the build steps to workflow

We can assign our workflow a name and configure the action for our build phase. The code outlined in the following diagram is our CodeCatalyst workflow definition

The image shows updated workflow file which has triggers and actions filled.
Figure 10: Workflow updated with build phase.

Kustomize starts from here

The image shows Kustomize steps added in the workflow file.
Figure 11: Workflow updated with Kustomize.

Deployment starts from here

The image shows deployment stage added in the workflow file.
Figure 12: Workflow updated with Deployment phase.

The workflow will now contain two CodeCatalyst actions – PushtoAmazonECR which builds and pushes our container image to the ECR. We have also added a dependent stage DeploytoKubernetesCluster which deploys our Kubernetes manifest.

To save our changes we select File -> Save, we can then commit these to our git repository by typing the following at the terminal:

git add . && git commit -m ‘adding workflow’ && git push

The previous command will commit and push our changes the CodeCatalyst source repository, as we have a branch trigger for main defined, this will trigger a run of the workflow. We can monitor the status of the workflow in the CodeCatalyst console by selecting CICD -> Workflows. Locate your workflow and click on Runs to view the status.

We will now have all two stages available, as depicted at the beginning of this walkthrough. We will now have a container image in our ECR along with the newly built image deployed to our EKS cluster.

Cleaning up

If you have been following along with this workflow, you should delete the resources that you have deployed to avoid further changes. First, delete the Amazon ECR repository and Amazon EKS cluster (along with associated IAM roles) using the AWS console. Second, delete the CodeCatalyst project by navigating to project settings and choosing to Delete Project.

Conclusion

In this post, we explained how teams can easily get started building, scanning, and deploying a microservice application to an EKS cluster using CodeCatalyst. We outlined the stages in our workflow that enabled us to achieve the end-to-end build and release cycle. We also demonstrated how to enhance the developer experience of integrating CodeCatalyst with our Cloud9 Dev Environment.

Call to Action

Learn more about CodeCatalyst here.

Vineeth Nair

Vineeth Nair is a DevOps Architect at Amazon Web Services (AWS), Professional Services. He collaborates closely with AWS customers to support and accelerate their journeys to the cloud and within the cloud ecosystem by building performant, resilient, scalable, secure and cost efficient solutions.

Richard Merritt

Richard Merritt is a DevOps Consultant at Amazon Web Services (AWS), Professional Services. He works with AWS customers to accelerate their journeys to the cloud by providing scalable, secure and robust DevOps solutions.

Process and analyze highly nested and large XML files using AWS Glue and Amazon Athena

Post Syndicated from Navnit Shukla original https://aws.amazon.com/blogs/big-data/process-and-analyze-highly-nested-and-large-xml-files-using-aws-glue-and-amazon-athena/

In today’s digital age, data is at the heart of every organization’s success. One of the most commonly used formats for exchanging data is XML. Analyzing XML files is crucial for several reasons. Firstly, XML files are used in many industries, including finance, healthcare, and government. Analyzing XML files can help organizations gain insights into their data, allowing them to make better decisions and improve their operations. Analyzing XML files can also help in data integration, because many applications and systems use XML as a standard data format. By analyzing XML files, organizations can easily integrate data from different sources and ensure consistency across their systems, However, XML files contain semi-structured, highly nested data, making it difficult to access and analyze information, especially if the file is large and has complex, highly nested schema.

XML files are well-suited for applications, but they may not be optimal for analytics engines. In order to enhance query performance and enable easy access in downstream analytics engines such as Amazon Athena, it’s crucial to preprocess XML files into a columnar format like Parquet. This transformation allows for improved efficiency and usability in analytics workflows. In this post, we show how to process XML data using AWS Glue and Athena.

Solution overview

We explore two distinct techniques that can streamline your XML file processing workflow:

  • Technique 1: Use an AWS Glue crawler and the AWS Glue visual editor – You can use the AWS Glue user interface in conjunction with a crawler to define the table structure for your XML files. This approach provides a user-friendly interface and is particularly suitable for individuals who prefer a graphical approach to managing their data.
  • Technique 2: Use AWS Glue DynamicFrames with inferred and fixed schemas – The crawler has a limitation when it comes to processing a single row in XML files larger than 1 MB. To overcome this restriction, we use an AWS Glue notebook to construct AWS Glue DynamicFrames, utilizing both inferred and fixed schemas. This method ensures efficient handling of XML files with rows exceeding 1 MB in size.

In both approaches, our ultimate goal is to convert XML files into Apache Parquet format, making them readily available for querying using Athena. With these techniques, you can enhance the processing speed and accessibility of your XML data, enabling you to derive valuable insights with ease.

Prerequisites

Before you begin this tutorial, complete the following prerequisites (these apply to both techniques):

  1. Download the XML files technique1.xml and technique2.xml.
  2. Upload the files to an Amazon Simple Storage Service (Amazon S3) bucket. You can upload them to the same S3 bucket in different folders or to different S3 buckets.
  3. Create an AWS Identity and Access Management (IAM) role for your ETL job or notebook as instructed in Set up IAM permissions for AWS Glue Studio.
  4. Add an inline policy to your role with the iam:PassRole action:
  "Version": "2012-10-17",
  "Statement": [
    {
      "Action": ["iam:PassRole"],
      "Effect": "Allow",
      "Resource": "arn:aws:iam::*:role/AWSGlueServiceRole*",
      "Condition": {
        "StringLike": {
          "iam:PassedToService": ["glue.amazonaws.com"]
        }
      }
    }
}
  1. Add a permissions policy to the role with access to your S3 bucket.

Now that we’re done with the prerequisites, let’s move on to implementing the first technique.

Technique 1: Use an AWS Glue crawler and the visual editor

The following diagram illustrates the simple architecture that you can use to implement the solution.

Processing and Analyzing XML file using AWS Glue and Amazon Athena

To analyze XML files stored in Amazon S3 using AWS Glue and Athena, we complete the following high-level steps:

  1. Create an AWS Glue crawler to extract XML metadata and create a table in the AWS Glue Data Catalog.
  2. Process and transform XML data into a format (like Parquet) suitable for Athena using an AWS Glue extract, transform, and load (ETL) job.
  3. Set up and run an AWS Glue job via the AWS Glue console or the AWS Command Line Interface (AWS CLI).
  4. Use the processed data (in Parquet format) with Athena tables, enabling SQL queries.
  5. Use the user-friendly interface in Athena to analyze the XML data with SQL queries on your data stored in Amazon S3.

This architecture is a scalable, cost-effective solution for analyzing XML data on Amazon S3 using AWS Glue and Athena. You can analyze large datasets without complex infrastructure management.

We use the AWS Glue crawler to extract XML file metadata. You can choose the default AWS Glue classifier for general-purpose XML classification. It automatically detects XML data structure and schema, which is useful for common formats.

We also use a custom XML classifier in this solution. It’s designed for specific XML schemas or formats, allowing precise metadata extraction. This is ideal for non-standard XML formats or when you need detailed control over classification. A custom classifier ensures only necessary metadata is extracted, simplifying downstream processing and analysis tasks. This approach optimizes the use of your XML files.

The following screenshot shows an example of an XML file with tags.

Create a custom classifier

In this step, you create a custom AWS Glue classifier to extract metadata from an XML file. Complete the following steps:

  1. On the AWS Glue console, under Crawlers in the navigation pane, choose Classifiers.
  2. Choose Add classifier.
  3. Select XML as the classifier type.
  4. Enter a name for the classifier, such as blog-glue-xml-contact.
  5. For Row tag, enter the name of the root tag that contains the metadata (for example, metadata).
  6. Choose Create.

Create an AWS Glue Crawler to crawl xml file

In this section, we are creating a Glue Crawler to extract the metadata from XML file using the customer classifier created in previous step.

Create a database

  1. Go to the AWS Glue console, choose Databases in the navigation pane.
  2. Click on Add database.
  3. Provide a name such as blog_glue_xml
  4. Choose Create Database

Create a Crawler

Complete the following steps to create your first crawler:

  1. On the AWS Glue console, choose Crawlers in the navigation pane.
  2. Choose Create crawler.
  3. On the Set crawler properties page, provide a name for the new crawler (such as blog-glue-parquet), then choose Next.
  4. On the Choose data sources and classifiers page, select Not Yet under Data source configuration.
  5. Choose Add a data store.
  6. For S3 path, browse to s3://${BUCKET_NAME}/input/geologicalsurvey/.

Make sure you pick the XML folder rather than the file inside the folder.

  1. Leave the rest of the options as default and choose Add an S3 data source.
  2. Expand Custom classifiers – optional, choose blog-glue-xml-contact, then choose Next and keep the rest of the options as default.
  3. Choose your IAM role or choose Create new IAM role, add the suffix glue-xml-contact (for example, AWSGlueServiceNotebookRoleBlog), and choose Next.
  4. On the Set output and scheduling page, under Output configuration, choose blog_glue_xml for Target database.
  5. Enter console_ as the prefix added to tables (optional) and under Crawler schedule, keep the frequency set to On demand.
  6. Choose Next.
  7. Review all the parameters and choose Create crawler.

Run the Crawler

After you create the crawler, complete the following steps to run it:

  1. On the AWS Glue console, choose Crawlers in the navigation pane.
  2. Open the crawler you created and choose Run.

The crawler will take 1–2 minutes to complete.

  1. When the crawler is complete, choose Databases in the navigation pane.
  2. Choose the database you crated and choose the table name to see the schema extracted by the crawler.

Create an AWS Glue job to convert the XML to Parquet format

In this step, you create an AWS Glue Studio job to convert the XML file into a Parquet file. Complete the following steps:

  1. On the AWS Glue console, choose Jobs in the navigation pane.
  2. Under Create job, select Visual with a blank canvas.
  3. Choose Create.
  4. Rename the job to blog_glue_xml_job.

Now you have a blank AWS Glue Studio visual job editor. On the top of the editor are the tabs for different views.

  1. Choose the Script tab to see an empty shell of the AWS Glue ETL script.

As we add new steps in the visual editor, the script will be updated automatically.

  1. Choose the Job details tab to see all the job configurations.
  2. For IAM role, choose AWSGlueServiceNotebookRoleBlog.
  3. For Glue version, choose Glue 4.0 – Support Spark 3.3, Scala 2, Python 3.
  4. Set Requested number of workers to 2.
  5. Set Number of retries to 0.
  6. Choose the Visual tab to go back to the visual editor.
  7. On the Source drop-down menu, choose AWS Glue Data Catalog.
  8. On the Data source properties – Data Catalog tab, provide the following information:
    1. For Database, choose blog_glue_xml.
    2. For Table, choose the table that starts with the name console_ that the crawler created (for example, console_geologicalsurvey).
  9. On the Node properties tab, provide the following information:
    1. Change Name to geologicalsurvey dataset.
    2. Choose Action and the transformation Change Schema (Apply Mapping).
    3. Choose Node properties and change the name of the transform from Change Schema (Apply Mapping) to ApplyMapping.
    4. On the Target menu, choose S3.
  10. On the Data source properties – S3 tab, provide the following information:
    1. For Format, select Parquet.
    2. For Compression Type, select Uncompressed.
    3. For S3 source type, select S3 location.
    4. For S3 URL, enter s3://${BUCKET_NAME}/output/parquet/.
    5. Choose Node Properties and change the name to Output.
  11. Choose Save to save the job.
  12. Choose Run to run the job.

The following screenshot shows the job in the visual editor.

Create an AWS Gue Crawler to crawl the Parquet file

In this step, you create an AWS Glue crawler to extract metadata from the Parquet file you created using an AWS Glue Studio job. This time, you use the default classifier. Complete the following steps:

  1. On the AWS Glue console, choose Crawlers in the navigation pane.
  2. Choose Create crawler.
  3. On the Set crawler properties page, provide a name for the new crawler, such as blog-glue-parquet-contact, then choose Next.
  4. On the Choose data sources and classifiers page, select Not Yet for Data source configuration.
  5. Choose Add a data store.
  6. For S3 path, browse to s3://${BUCKET_NAME}/output/parquet/.

Make sure you pick the parquet folder rather than the file inside the folder.

  1. Choose your IAM role created during the prerequisite section or choose Create new IAM role (for example, AWSGlueServiceNotebookRoleBlog), and choose Next.
  2. On the Set output and scheduling page, under Output configuration, choose blog_glue_xml for Database.
  3. Enter parquet_ as the prefix added to tables (optional) and under Crawler schedule, keep the frequency set to On demand.
  4. Choose Next.
  5. Review all the parameters and choose Create crawler.

Now you can run the crawler, which takes 1–2 minutes to complete.

You can preview the newly created schema for the Parquet file in the AWS Glue Data Catalog, which is similar to the schema of the XML file.

We now possess data that is suitable for use with Athena. In the next section, we perform data queries using Athena.

Query the Parquet file using Athena

Athena doesn’t support querying the XML file format, which is why you converted the XML file into Parquet for more efficient data querying and use dot notation to query complex types and nested structures.

The following example code uses dot notation to query nested data:

SELECT 
    idinfo.citation.citeinfo.origin,
    idinfo.citation.citeinfo.pubdate,
    idinfo.citation.citeinfo.title,
    idinfo.citation.citeinfo.geoform,
    idinfo.citation.citeinfo.pubinfo.pubplace,
    idinfo.citation.citeinfo.pubinfo.publish,
    idinfo.citation.citeinfo.onlink,
    idinfo.descript.abstract,
    idinfo.descript.purpose,
    idinfo.descript.supplinf,
    dataqual.attracc.attraccr, 
    dataqual.logic,
    dataqual.complete,
    dataqual.posacc.horizpa.horizpar,
    dataqual.posacc.vertacc.vertaccr,
    dataqual.lineage.procstep.procdate,
    dataqual.lineage.procstep.procdesc
FROM "blog_glue_xml"."parquet_parquet" limit 10;

Now that we’ve completed technique 1, let’s move on to learn about technique 2.

Technique 2: Use AWS Glue DynamicFrames with inferred and fixed schemas

In the previous section, we covered the process of handling a small XML file using an AWS Glue crawler to generate a table, an AWS Glue job to convert the file into Parquet format, and Athena to access the Parquet data. However, the crawler encounters limitations when it comes to processing XML files that exceed 1 MB in size. In this section, we delve into the topic of batch processing larger XML files, necessitating additional parsing to extract individual events and conduct analysis using Athena.

Our approach involves reading the XML files through AWS Glue DynamicFrames, employing both inferred and fixed schemas. Then we extract the individual events in Parquet format using the relationalize transformation, enabling us to query and analyze them seamlessly using Athena.

To implement this solution, you complete the following high-level steps:

  1. Create an AWS Glue notebook to read and analyze the XML file.
  2. Use DynamicFrames with InferSchema to read the XML file.
  3. Use the relationalize function to unnest any arrays.
  4. Convert the data to Parquet format.
  5. Query the Parquet data using Athena.
  6. Repeat the previous steps, but this time pass a schema to DynamicFrames instead of using InferSchema.

The electric vehicle population data XML file has a response tag at its root level. This tag contains an array of row tags, which are nested within it. The row tag is an array that contains a set of another row tags, which provide information about a vehicle, including its make, model, and other relevant details. The following screenshot shows an example.

Create an AWS Glue Notebook

To create an AWS Glue notebook, complete the following steps:

  1. Open the AWS Glue Studio console, choose Jobs in the navigation pane.
  2. Select Jupyter Notebook and choose Create.

  1. Enter a name for your AWS Glue job, such as blog_glue_xml_job_Jupyter.
  2. Choose the role that you created in the prerequisites (AWSGlueServiceNotebookRoleBlog).

The AWS Glue notebook comes with a preexisting example that demonstrates how to query a database and write the output to Amazon S3.

  1. Adjust the timeout (in minutes) as shown in the following screenshot and run the cell to create the AWS Glue interactive session.

Create basic Variables

After you create the interactive session, at the end of the notebook, create a new cell with the following variables (provide your own bucket name):

BUCKET_NAME='YOUR_BUCKET_NAME'
S3_SOURCE_XML_FILE = f's3://{BUCKET_NAME}/xml_dataset/'
S3_TEMP_FOLDER = f's3://{BUCKET_NAME}/temp/'
S3_OUTPUT_INFER_SCHEMA = f's3://{BUCKET_NAME}/infer_schema/'
INFER_SCHEMA_TABLE_NAME = 'infer_schema'
S3_OUTPUT_NO_INFER_SCHEMA = f's3://{BUCKET_NAME}/no_infer_schema/'
NO_INFER_SCHEMA_TABLE_NAME = 'no_infer_schema'
DATABASE_NAME = 'blog_xml'

Read the XML file inferring the schema

If you don’t pass a schema to the DynamicFrame, it will infer the schema of the files. To read the data using a dynamic frame, you can use the following command:

df = glueContext.create_dynamic_frame.from_options(
    connection_type="s3",
    connection_options={"paths": [S3_SOURCE_XML_FILE]},
    format="xml",
    format_options={"rowTag": "response"},
)

Print the DynamicFrame Schema

Print the schema with the following code:

df.printSchema()

The schema shows a nested structure with a row array containing multiple elements. To unnest this structure into lines, you can use the AWS Glue relationalize transformation:

df_relationalized = df.relationalize(
    "root", S3_TEMP_FOLDER
)

We are only interested in the information contained within the row array, and we can view the schema by using the following command:

df_relationalized.select("root_row.row").printSchema()

The column names contain row.row, which correspond to the array structure and array column in the dataset. We don’t rename the columns in this post; for instructions to do so, refer to Automate dynamic mapping and renaming of column names in data files using AWS Glue: Part 1. Then you can convert the data to Parquet format and create the AWS Glue table using the following command:


s3output = glueContext.getSink(
  path= S3_OUTPUT_INFER_SCHEMA,
  connection_type="s3",
  updateBehavior="UPDATE_IN_DATABASE",
  partitionKeys=[],
  compression="snappy",
  enableUpdateCatalog=True,
  transformation_ctx="s3output",
)
s3output.setCatalogInfo(
  catalogDatabase="blog_xml", catalogTableName="jupyter_notebook_with_infer_schema"
)
s3output.setFormat("glueparquet")
s3output.writeFrame(df_relationalized.select("root_row.row"))

AWS Glue DynamicFrame provides features that you can use in your ETL script to create and update a schema in the Data Catalog. We use the updateBehavior parameter to create the table directly in the Data Catalog. With this approach, we don’t need to run an AWS Glue crawler after the AWS Glue job is complete.

Read the XML file by setting a schema

An alternative way to read the file is by predefining a schema. To do this, complete the following steps:

  1. Import the AWS Glue data types:
    from awsglue.gluetypes import *

  2. Create a schema for the XML file:
    schema = StructType([ 
      Field("row", StructType([
        Field("row", ArrayType(StructType([
                Field("_2020_census_tract", LongType()),
                Field("__address", StringType()),
                Field("__id", StringType()),
                Field("__position", IntegerType()),
                Field("__uuid", StringType()),
                Field("base_msrp", IntegerType()),
                Field("cafv_type", StringType()),
                Field("city", StringType()),
                Field("county", StringType()),
                Field("dol_vehicle_id", IntegerType()),
                Field("electric_range", IntegerType()),
                Field("electric_utility", StringType()),
                Field("ev_type", StringType()),
                Field("geocoded_column", StringType()),
                Field("legislative_district", IntegerType()),
                Field("make", StringType()),
                Field("model", StringType()),
                Field("model_year", IntegerType()),
                Field("state", StringType()),
                Field("vin_1_10", StringType()),
                Field("zip_code", IntegerType())
        ])))
      ]))
    ])

  3. Pass the schema when reading the XML file:
    df = glueContext.create_dynamic_frame.from_options(
        connection_type="s3",
        connection_options={"paths": [S3_SOURCE_XML_FILE]},
        format="xml",
        format_options={"rowTag": "response", "withSchema": json.dumps(schema.jsonValue())},
    )

  4. Unnest the dataset like before:
    df_relationalized = df.relationalize(
        "root", S3_TEMP_FOLDER
    )

  5. Convert the dataset to Parquet and create the AWS Glue table:
    s3output = glueContext.getSink(
      path=S3_OUTPUT_NO_INFER_SCHEMA,
      connection_type="s3",
      updateBehavior="UPDATE_IN_DATABASE",
      partitionKeys=[],
      compression="snappy",
      enableUpdateCatalog=True,
      transformation_ctx="s3output",
    )
    s3output.setCatalogInfo(
      catalogDatabase="blog_xml", catalogTableName="jupyter_notebook_no_infer_schema"
    )
    s3output.setFormat("glueparquet")
    s3output.writeFrame(df_relationalized.select("root_row.row"))

Query the tables using Athena

Now that we have created both tables, we can query the tables using Athena. For example, we can use the following query:

SELECT * FROM "blog_xml"."jupyter_notebook_no_infer_schema " limit 10;

The following screenshot shows the results.

Clean Up

In this post, we created an IAM role, an AWS Glue Jupyter notebook, and two tables in the AWS Glue Data Catalog. We also uploaded some files to an S3 bucket. To clean up these objects, complete the following steps:

  1. On the IAM console, delete the role you created.
  2. On the AWS Glue Studio console, delete the custom classifier, crawler, ETL jobs, and Jupyter notebook.
  3. Navigate to the AWS Glue Data Catalog and delete the tables you created.
  4. On the Amazon S3 console, navigate to the bucket you created and delete the folders named temp, infer_schema, and no_infer_schema.

Key Takeaways

In AWS Glue, there’s a feature called InferSchema in AWS Glue DynamicFrames. It automatically figures out the structure of a data frame based on the data it contains. In contrast, defining a schema means explicitly stating how the data frame’s structure should be before loading the data.

XML, being a text-based format, doesn’t restrict the data types of its columns. This can cause issues with the InferSchema function. For example, in the first run, a file with column A having a value of 2 results in a Parquet file with column A as an integer. In the second run, a new file has column A with the value C, leading to a Parquet file with column A as a string. Now there are two files on S3, each with a column A of different data types, which can create problems downstream.

The same happens with complex data types like nested structures or arrays. For example, if a file has one tag entry called transaction, it’s inferred as a struct. But if another file has the same tag, it’s inferred as an array

Despite these data type issues, InferSchema is useful when you don’t know the schema or defining one manually is impractical. However, it’s not ideal for large or constantly changing datasets. Defining a schema is more precise, especially with complex data types, but has its own issues, like requiring manual effort and being inflexible to data changes.

InferSchema has limitations, like incorrect data type inference and issues with handling null values. Defining a schema also has limitations, like manual effort and potential errors.

Choosing between inferring and defining a schema depends on the project’s needs. InferSchema is great for quick exploration of small datasets, whereas defining a schema is better for larger, complex datasets requiring accuracy and consistency. Consider the trade-offs and constraints of each method to pick what suits your project best.

Conclusion

In this post, we explored two techniques for managing XML data using AWS Glue, each tailored to address specific needs and challenges you may encounter.

Technique 1 offers a user-friendly path for those who prefer a graphical interface. You can use an AWS Glue crawler and the visual editor to effortlessly define the table structure for your XML files. This approach simplifies the data management process and is particularly appealing to those looking for a straightforward way to handle their data.

However, we recognize that the crawler has its limitations, specifically when dealing with XML files having rows larger than 1 MB. This is where technique 2 comes to the rescue. By harnessing AWS Glue DynamicFrames with both inferred and fixed schemas, and employing an AWS Glue notebook, you can efficiently handle XML files of any size. This method provides a robust solution that ensures seamless processing even for XML files with rows exceeding the 1 MB constraint.

As you navigate the world of data management, having these techniques in your toolkit empowers you to make informed decisions based on the specific requirements of your project. Whether you prefer the simplicity of technique 1 or the scalability of technique 2, AWS Glue provides the flexibility you need to handle XML data effectively.


About the Authors

Navnit Shuklaserves as an AWS Specialist Solution Architect with a focus on Analytics. He possesses a strong enthusiasm for assisting clients in discovering valuable insights from their data. Through his expertise, he constructs innovative solutions that empower businesses to arrive at informed, data-driven choices. Notably, Navnit Shukla is the accomplished author of the book titled “Data Wrangling on AWS.

Patrick Muller works as a Senior Data Lab Architect at AWS. His main responsibility is to assist customers in turning their ideas into a production-ready data product. In his free time, Patrick enjoys playing soccer, watching movies, and traveling.

Amogh Gaikwad is a Senior Solutions Developer at Amazon Web Services. He helps global customers build and deploy AI/ML solutions on AWS. His work is mainly focused on computer vision, and natural language processing and helping customers optimize their AI/ML workloads for sustainability. Amogh has received his master’s in Computer Science specializing in Machine Learning.

Sheela Sonone is a Senior Resident Architect at AWS. She helps AWS customers make informed choices and tradeoffs about accelerating their data, analytics, and AI/ML workloads and implementations. In her spare time, she enjoys spending time with her family – usually on tennis courts.
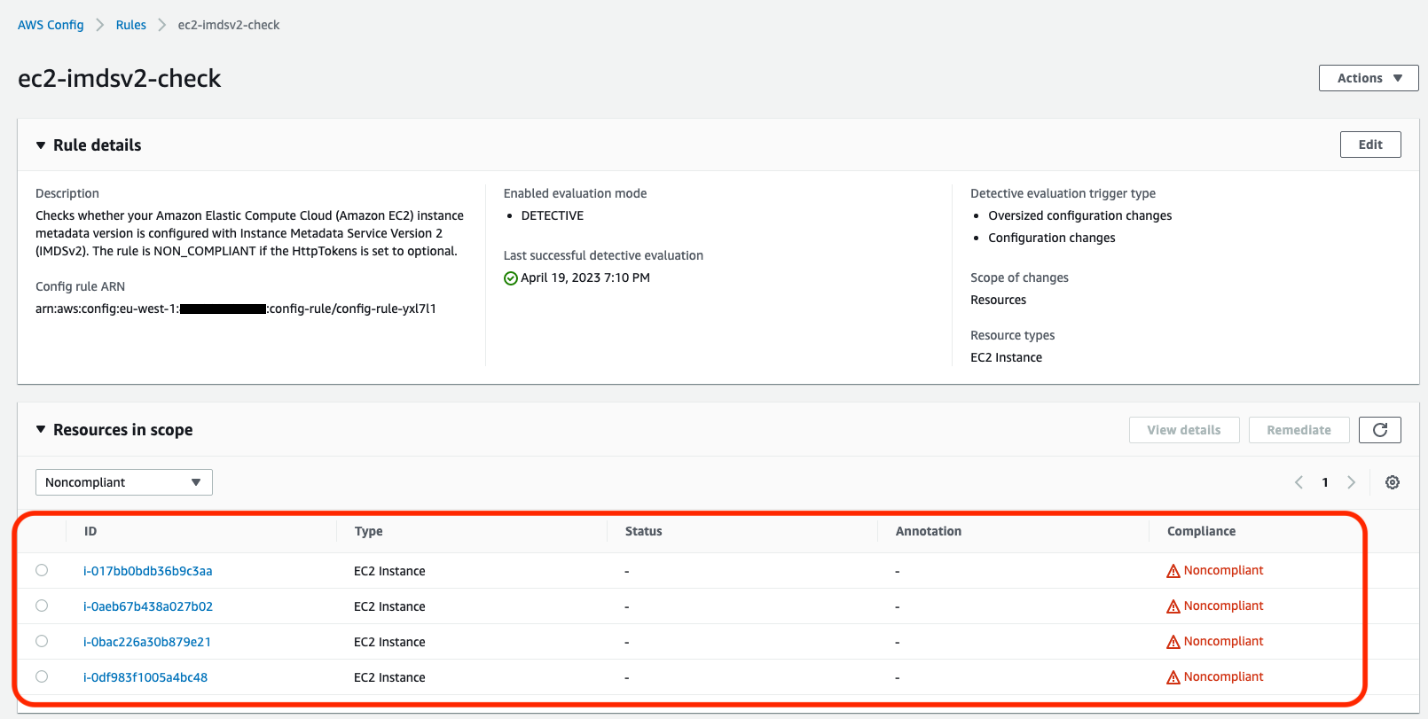
Get the full benefits of IMDSv2 and disable IMDSv1 across your AWS infrastructure

Post Syndicated from Saju Sivaji original https://aws.amazon.com/blogs/security/get-the-full-benefits-of-imdsv2-and-disable-imdsv1-across-your-aws-infrastructure/

The Amazon Elastic Compute Cloud (Amazon EC2) Instance Metadata Service (IMDS) helps customers build secure and scalable applications. IMDS solves a security challenge for cloud users by providing access to temporary and frequently-rotated credentials, and by removing the need to hardcode or distribute sensitive credentials to instances manually or programmatically. The Instance Metadata Service Version 2 (IMDSv2) adds protections; specifically, IMDSv2 uses session-oriented authentication with the following enhancements:

  • IMDSv2 requires the creation of a secret token in a simple HTTP PUT request to start the session, which must be used to retrieve information in IMDSv2 calls.
  • The IMDSv2 session token must be used as a header in subsequent IMDSv2 requests to retrieve information from IMDS. Unlike a static token or fixed header, a session and its token are destroyed when the process using the token terminates. IMDSv2 sessions can last up to six hours.
  • A session token can only be used directly from the EC2 instance where that session began.
  • You can reuse a token or create a new token with every request.
  • Session token PUT requests are blocked if they contain an X-forwarded-for header.

In a previous blog post, we explained how these new protections add defense-in-depth for third-party and external application vulnerabilities that could be used to try to access the IMDS.

You won’t be able to get the full benefits of IMDSv2 until you disable IMDSv1. While IMDS is provided by the instance itself, the calls to IMDS are from your software. This means your software must support IMDSv2 before you can disable IMDSv1. In addition to AWS SDKs, CLIs, and tools like the SSM agents supporting IMDSv2, you can also use the IMDS Packet Analyzer to pinpoint exactly what you need to update to get your instances ready to use only IMDSv2. These tools make it simpler to transition to IMDSv2 as well as launch new infrastructure with IMDSv1 disabled. All instances launched with AL2023 set the instance to provide only IMDSv2 (IMDSv1 is disabled) by default, with AL2023 also not making IMDSv1 calls.

AWS customers who want to get the benefits of IMDSv2 have told us they want to use IMDSv2 across both new and existing, long-running AWS infrastructure. This blog post shows you scalable solutions to identify existing infrastructure that is providing IMDSv1, how to transition to IMDSv2 on your infrastructure, and how to completely disable IMDSv1. After reviewing this blog, you will be able to set new Amazon EC2 launches to IMDSv2. You will also learn how to identify existing software making IMDSv1 calls, so you can take action to update your software and then require IMDSv2 on existing EC2 infrastructure.

Identifying IMDSv1-enabled EC2 instances

The first step in transitioning to IMDSv2 is to identify all existing IMDSv1-enabled EC2 instances. You can do this in various ways.

Using the console

You can identify IMDSv1-enabled instances using the IMDSv2 attribute column in the Amazon EC2 page in the AWS Management Console.

To view the IMDSv2 attribute column:

  1. Open the Amazon EC2 console and go to Instances.
  2. Choose the settings icon in the top right.
  3. Scroll down to IMDSv2, turn on the slider.
  4. Choose Confirm.

This gives you the IMDS status of your instances. A status of optional means that IMDSv1 is enabled on the instance and required means that IMDSv1 is disabled.

Figure 1: Example of IMDS versions for EC2 instances in the console

Figure 1: Example of IMDS versions for EC2 instances in the console

Using the AWS CLI

You can identify IMDSv1-enabled instances using the AWS Command Line Interface (AWS CLI) by running the aws ec2 describe-instances command and checking the value of HttpTokens. The HttpTokens value determines what version of IMDS is enabled, with optional enabling IMDSv1 and IMDSv2 and required means IMDSv2 is required. Similar to using the console, the optional status indicates that IMDSv1 is enabled on the instance and required indicates that IMDSv1 is disabled.

"MetadataOptions": {
                        "State": "applied", 
                        "HttpEndpoint": "enabled", 
                        "HttpTokens": "optional", 
                        "HttpPutResponseHopLimit": 1
                    },

[ec2-user@ip-172-31-24-101 ~]$ aws ec2 describe-instances | grep '"HttpTokens": "optional"' | wc -l
4

Using AWS Config

AWS Config continually assesses, audits, and evaluates the configurations and relationships of your resources on AWS, on premises, and on other clouds. The AWS Config rule ec2-imdsv2-check checks whether your Amazon EC2 instance metadata version is configured with IMDSv2. The rule is NON_COMPLIANT if the HttpTokens is set to optional, which means the EC2 instance has IMDSv1 enabled.

Figure 2: Example of noncompliant EC2 instances in the AWS Config console

Figure 2: Example of noncompliant EC2 instances in the AWS Config console

After this AWS Config rule is enabled, you can set up AWS Config notifications through Amazon Simple notification Service (Amazon SNS).

Using Security Hub

AWS Security Hub provides detection and alerting capability at the account and organization levels. You can configure cross-Region aggregation in Security Hub to gain insight on findings across Regions. If using AWS Organizations, you can configure a Security Hub designated account to aggregate findings across accounts in your organization.

Security Hub has an Amazon EC2 control ([EC2.8] Amazon EC2 instances should use Instance Metadata Service Version 2 (IMDSv2)) that uses the AWS Config rule ec2-imdsv2-check to check if the instance metadata version is configured with IMDSv2. The rule is NON_COMPLIANT if the HttpTokens is set to optional, which means EC2 instance has IMDSv1 enabled.

Figure 3: Example of AWS Security Hub showing noncompliant EC2 instances

Figure 3: Example of AWS Security Hub showing noncompliant EC2 instances

Using Amazon Event Bridge, you can also set up alerting for the Security Hub findings when the EC2 instances are noncompliant for IMDSv2.

{
  "source": ["aws.securityhub"],
  "detail-type": ["Security Hub Findings - Imported"],
  "detail": {
    "findings": {
      "ProductArn": ["arn:aws:securityhub:us-west-2::product/aws/config"],
      "Title": ["ec2-imdsv2-check"]
    }
  }
}

Identifying if EC2 instances are making IMDSv1 calls

Not all of your software will be making IMDSv1 calls; your dependent libraries and tools might already be compatible with IMDSv2. However, to mitigate against compatibility issues in requiring IMDSv2 and disabling IMDSv1 entirely, you must check for remaining IMDSv1 calls from your software. After you’ve identified that there are instances with IMDSv1 enabled, investigate if your software is making IMDSv1 calls. Most applications make IMDSv1 calls at instance launch and shutdown. For long running instances, we recommend monitoring IMDSv1 calls during a launch or a stop and restart cycle.

You can check whether your software is making IMDSv1 calls by checking the MetadataNoToken metric in Amazon CloudWatch. You can further identify the source of IMDSv1 calls by using the IMDS Packet Analyzer tool.

Steps to check IMDSv1 usage with CloudWatch

  1. Open the CloudWatch console.
  2. Go to Metrics and then All Metrics.
  3. Select EC2 and then choose Per-Instance Metrics.
  4. Search and add the Metric MetadataNoToken for the instances you’re interested in.
Figure 4: CloudWatch dashboard for MetadataNoToken per-instance metric

Figure 4: CloudWatch dashboard for MetadataNoToken per-instance metric

You can use expressions in CloudWatch to view account wide metrics.

SEARCH('{AWS/EC2,InstanceId} MetricName="MetadataNoToken"', 'Maximum')
Figure 5: Using CloudWatch expressions to view account wide metrics for MetadataNoToken

Figure 5: Using CloudWatch expressions to view account wide metrics for MetadataNoToken

You can combine SEARCH and SORT expressions in CloudWatch to help identify the instances using IMDSv1.

SORT(SEARCH('{AWS/EC2,InstanceId} MetricName="MetadataNoToken"', 'Sum', 300), SUM, DESC, 10)
Figure 6: Another example of using CloudWatch expressions to view account wide metrics

Figure 6: Another example of using CloudWatch expressions to view account wide metrics

If you have multiple AWS accounts or use AWS Organizations, you can set up a centralized monitoring account using CloudWatch cross account observability.

IMDS Packet Analyzer

The IMDS Packet Analyzer is an open source tool that identifies and logs IMDSv1 calls from your software, including software start-up on your instance. This tool can assist in identifying the software making IMDSv1 calls on EC2 instances, allowing you to pinpoint exactly what you need to update to get your software ready to use IMDSv2. You can run the IMDS Packet Analyzer from a command line or install it as a service. For more information, see IMDS Packet Analyzer on GitHub.

Disabling IMDSv1 and maintaining only IMDSv2 instances

After you’ve monitored and verified that the software on your EC2 instances isn’t making IMDSv1 calls, you can disable IMDSv1 on those instances. For all compatible workloads, we recommend using Amazon Linux 2023, which offers several improvements (see launch announcement), including requiring IMDSv2 (disabling IMDSv1) by default.

You can also create and modify AMIs and EC2 instances to disable IMDSv1. Configure the AMI provides guidance on how to register a new AMI or change an existing AMI by setting the imds-support parameter to v2.0. If you’re using container services (such as ECS or EKS), you might need a bigger hop limit to help avoid falling back to IMDSv1. You can use the modify-instance-metadata-options launch parameter to make the change. We recommend testing with a hop limit of three in container environments.

To create a new instance

For new instances, you can disable IMDSv1 and enable IMDSv2 by specifying the metadata-options parameter using the run-instance CLI command.

aws ec2 run-instances
    --image-id <ami-0123456789example>
    --instance-type c3.large
    --metadata-options “HttpEndpoint=enabled,HttpTokens=required”

To modify the running instance

aws ec2 modify-instance-metadata-options \
--instance-id <instance-0123456789example> \
--http-tokens required \
--http-endpoint enabled

To configure a new AMI

aws ec2 register-image \
    --name <my-image> \
    --root-device-name /dev/xvda \
    --block-device-mappings DeviceName=/dev/xvda,Ebs={SnapshotId=<snap-0123456789example>} \
    --imds-support v2.0

To modify an existing AMI

aws ec2 modify-image-attribute \
    --image-id <ami-0123456789example> \
    --imds-support v2.0

Using the console

If you’re using the console to launch instances, after selecting Launch Instance from AWS Console, choose the Advanced details tab, scroll down to Metadata version and select V2 only (token required).

Figure 7: Modifying IMDS version using the console

Figure 7: Modifying IMDS version using the console

Using EC2 launch templates

You can use an EC2 launch template as an instance configuration template that an Amazon Auto Scaling group can use to launch EC2 instances. When creating the launch template using the console, you can specify the Metadata version and select V2 only (token required).

Figure 8: Modifying the IMDS version in the EC2 launch templates

Figure 8: Modifying the IMDS version in the EC2 launch templates

Using CloudFormation with EC2 launch templates

When creating an EC2 launch template using AWS CloudFormation, you must specify the MetadataOptions property to use only IMDSv2 by setting HttpTokens as required.

In this state, retrieving the AWS Identity and Access Management (IAM) role credentials always returns IMDSv2 credentials; IMDSv1 credentials are not available.

{
"HttpEndpoint" : <String>,
"HttpProtocolIpv6" : <String>,
"HttpPutResponseHopLimit" : <Integer>,
"HttpTokens" : required,
"InstanceMetadataTags" : <String>
}

Using Systems Manager automation runbook

You can run the EnforceEC2InstanceIMDSv2 automation document available in AWS Systems Manager, which will enforce IMDSv2 on the EC2 instance using the ModifyInstanceMetadataOptions API.

  1. Open the Systems Manager console, and then select Automation from the navigation pane.
  2. Choose Execute automation.
  3. On the Owned by Amazon tab, for Automation document, enter EnforceEC2InstanceIMDSv2, and then press Enter.
  4. Choose EnforceEC2InstanceIMDSv2 document, and then choose Next.
  5. For Execute automation document, choose Simple execution.

    Note: If you need to run the automation on multiple targets, then choose Rate Control.

  6. For Input parameters, enter the ID of EC2 instance under InstanceId
  7. For AutomationAssumeRole, select a role.

    Note: To change the target EC2 instance, the AutomationAssumeRole must have ec2:ModifyInstanceMetadataOptions and ec2:DescribeInstances permissions. For more information about creating the assume role for Systems Manager Automation, see Create a service role for Automation.

  8. Choose Execute.

Using the AWS CDK

If you use the AWS Cloud Development Kit (AWS CDK) to launch instances, you can use it to set the requireImdsv2 property to disable IMDSv1 and enable IMDSv2.

new ec2.Instance(this, 'Instance', {
        // <... other parameters>
        requireImdsv2: true,
})

Using AWS SDK

The new clients for AWS SDK for Java 2.x use IMDSv2, and you can use the new clients to retrieve instance metadata for your EC2 instances. See Introducing a new client in the AWS SDK for Java 2.x for retrieving EC2 Instance Metadata for instructions.

Maintain only IMDSv2 EC2 instances

To maintain only IMDSv2 instances, you can implement service control policies and IAM policies that verify that users and software on your EC2 instances can only use instance metadata using IMDSv2. This policy specifies that RunInstance API calls require the EC2 instance use only IMDSv2. We recommend implementing this policy after all of the instances in associated accounts are free of IMDSv1 calls and you have migrated all of the instances to use only IMDSv2.

{
    "Version": "2012-10-17",
    "Statement": [
               {
            "Sid": "RequireImdsV2",
            "Effect": "Deny",
            "Action": "ec2:RunInstances",
            "Resource": "arn:aws:ec2:*:*:instance/*",
            "Condition": {
                "StringNotEquals": {
                    "ec2:MetadataHttpTokens": "required"
                }
            }
        }
    ]
} 

You can find more details on applicable service control policies (SCPs) and IAM policies in the EC2 User Guide.

Restricting credential usage using condition keys

As an additional layer of defence, you can restrict the use of your Amazon EC2 role credentials to work only when used in the EC2 instance to which they are issued. This control is complementary to IMDSv2 since both can work together. The AWS global condition context keys for EC2 credential control properties (aws:EC2InstanceSourceVPC and aws:EC2InstanceSourcePrivateIPv4) restrict the VPC endpoints and private IPs that can use your EC2 instance credentials, and you can use these keys in service control policies (SCPs) or IAM policies. Examples of these policies are in this blog post.

Conclusion

You won’t be able to get the full benefits of IMDSv2 until you disable IMDSv1. In this blog post, we showed you how to identify IMDSv1-enabled EC2 instances and how to determine if and when your software is making IMDSv1 calls. We also showed you how to disable IMDSv1 on new and existing EC2 infrastructure after your software is no longer making IMDSv1 calls. You can use these tools to transition your existing EC2 instances, and set your new EC2 launches, to use only IMDSv2.

If you have feedback about this post, submit comments in the Comments section below. If you have questions about this post, start a new thread on the AWS Compute re:Post or contact AWS Support.

Want more AWS Security news? Follow us on Twitter.

Saju Sivaji

Saju Sivaji

Saju is Senior Technical Program Manager with the AWS Security organization. When Saju isn’t managing security expectation programs to help raise the security bar for both internal and external customers, he enjoys travelling, racket sports, and bicycling.

Joshua Levinson

Joshua Levinson

Joshua is a Principal Product Manager at AWS on the Amazon EC2 team. He is passionate about helping customers with highly scalable features on EC2 and across AWS and enjoys the challenge of building simplified solutions to complex problems. Outside of work, he enjoys cooking, reading with his kids, and Olympic weightlifting.

Build event-driven architectures with Amazon MSK and Amazon EventBridge

Post Syndicated from Florian Mair original https://aws.amazon.com/blogs/big-data/build-event-driven-architectures-with-amazon-msk-and-amazon-eventbridge/

Based on immutable facts (events), event-driven architectures (EDAs) allow businesses to gain deeper insights into their customers’ behavior, unlocking more accurate and faster decision-making processes that lead to better customer experiences. In EDAs, modern event brokers, such as Amazon EventBridge and Apache Kafka, play a key role to publish and subscribe to events. EventBridge is a serverless event bus that ingests data from your own apps, software as a service (SaaS) apps, and AWS services and routes that data to targets. Although there is overlap in their role as the backbone in EDAs, both solutions emerged from different problem statements and provide unique features to solve specific use cases. With a solid understanding of both technologies and their primary use cases, developers can create easy-to-use, maintainable, and evolvable EDAs.

If the use case is well defined and directly maps to one event bus, such as event streaming and analytics with streaming events (Kafka) or application integration with simplified and consistent event filtering, transformation, and routing on discrete events (EventBridge), the decision for a particular broker technology is straightforward. However, organizations and business requirements are often more complex and beyond the capabilities of one broker technology. In almost any case, choosing an event broker should not be a binary decision. Combining complementary broker technologies and embracing their unique strengths is a solid approach to build easy-to-use, maintainable, and evolvable EDAs. To make the integration between Kafka and EventBridge even smoother, AWS open-sourced the EventBridge Connector based on Apache Kafka. This allows you to consume from on-premises Kafka deployments and avoid point-to-point communication, while using the existing knowledge and toolset of Kafka Connect.

Streaming applications enable stateful computations over unbound datasets. This allows real-time use cases such as anomaly detection, event-time computations, and much more. These applications can be built using frameworks such as Apache Flink, Apache Spark, or Kafka Streams. Although some of those frameworks support sending events to downstream systems other than Apache Kafka, there is no standardized way of doing so across frameworks. It would require each application owner to build their own logic to send events downstream. In an EDA, the preferred way to handle such a scenario is to publish events to an event bus and then send them downstream.

There are two ways to send events from Apache Kafka to EventBridge: the preferred method using Amazon EventBridge Pipes or the EventBridge sink connector for Kafka Connect. In this post, we explore when to use which option and how to build an EDA using the EventBridge sink connector and Amazon Managed Streaming for Apache Kafka (Amazon MSK).

EventBridge sink connector vs. EventBridge Pipes

EventBridge Pipes connects sources to targets with a point-to-point integration, supporting event filtering, transformations, enrichment, and event delivery to over 14 AWS services and external HTTPS-based targets using API Destinations. This is the preferred and most easy method to send events from Kafka to EventBridge as it simplifies the setup and operations with a delightful developer experience.

Alternatively, under the following circumstances you might want to choose the EventBridge sink connector to send events from Kafka directly to EventBridge Event Buses:

  • You are have already invested in processes and tooling around the Kafka Connect framework as the platform of your choice to integrate with other systems and services
  • You need to integrate with a Kafka-compatible schema registry e.g., the AWS Glue Schema Registry, supporting Avro and Protobuf data formats for event serialization and deserialization
  • You want to send events from on-premises Kafka environments directly to EventBridge Event Buses

Overview of solution

In this post, we show you how to use Kafka Connect and the EventBridge sink connector to send Avro-serialized events from Amazon Managed Streaming for Apache Kafka (Amazon MSK) to EventBridge. This enables a seamless and consistent data flow from Apache Kafka to dozens of supported EventBridge AWS and partner targets, such as Amazon CloudWatch, Amazon SQS, AWS Lambda, and HTTPS targets like Salesforce, Datadog, and Snowflake using EventBridge API destinations. The following diagram illustrates the event-driven architecture used in this blog post based on Amazon MSK and EventBridge.

Architecture Diagram

The workflow consists of the following steps:

  1. The demo application generates credit card transactions, which are sent to Amazon MSK using the Avro format.
  2. An analytics application running on Amazon Elastic Container Service (Amazon ECS) consumes the transactions and analyzes them if there is an anomaly.
  3. If an anomaly is detected, the application emits a fraud detection event back to the MSK notification topic.
  4. The EventBridge connector consumes the fraud detection events from Amazon MSK in Avro format.
  5. The connector converts the events to JSON and sends them to EventBridge.
  6. In EventBridge, we use JSON filtering rules to filter our events and send them to other services or another Event Bus. In this example, fraud detection events are sent to Amazon CloudWatch Logs for auditing and introspection, and to a third-party SaaS provider to showcase how easy it is to integrate with third-party APIs, such as Salesforce.

Prerequisites

For this walkthrough, you should have the following prerequisites:

Deploy the AWS CDK stack

This walkthrough requires you to deploy an AWS CDK stack to your account. You can deploy the full stack end to end or just the required resources to follow along with this post.

  1. In your terminal, run the following command:
    git clone https://github.com/awslabs/eventbridge-kafka-connector/

  2. Navigate to the cdk directory:
    cd eventbridge-kafka-connector/cdk

  3. Deploy the AWS CDK stack based on your preferences:
  4. If you want to see the complete setup explained in this post, run the following command:
    cdk deploy —context deployment=FULL

  5. If you want to deploy the connector on your own but have the required resources already, including the MSK cluster, AWS Identity and Access Management (IAM) roles, security groups, data generator, and so on, run the following command:
    cdk deploy —context deployment=PREREQ

Deploy the EventBridge sink connector on Amazon MSK Connect

If you deployed the CDK stack in FULL mode, you can skip this section and move on to Create EventBridge rules.

The connector needs an IAM role that allows reading the data from the MSK cluster and sending records downstream to EventBridge.

Upload connector code to Amazon S3

Complete the following steps to upload the connector code to Amazon Simple Storage Service (Amazon S3):

  1. Navigate to the GitHub repo.
  2. Download the release 1.0.0 with the AWS Glue Schema Registry dependencies included.
  3. On the Amazon S3 console, choose Buckets in the navigation pane.
  4. Choose Create bucket.
  5. For Bucket name, enter eventbridgeconnector-bucket-${AWS_ACCOUNT_ID}.

As Because S3 buckets must be globally unique, replace ${AWS_ACCOUNT_ID} with your actual AWS account ID. For example, eventbridgeconnector-bucket-123456789012.

  1. Open the bucket and choose Upload.
  2. Select the .jar file that you downloaded from the GitHub repository and choose Upload.

S3 File Upload Console

Create a custom plugin

We now have our application code in Amazon S3. As a next step, we create a custom plugin in Amazon MSK Connect. Complete the following steps:

  1. On the Amazon MSK console, choose Custom plugins in the navigation pane under MSK Connect.
  2. Choose Create custom plugin.
  3. For S3 URI – Custom plugin object, browse to the file named kafka-eventbridge-sink-with-gsr-dependencies.jar in the S3 bucket eventbridgeconnector-bucket-${AWS_ACCOUNT_ID} for the EventBridge connector.
  4. For Custom plugin name, enter msk-eventBridge-sink-plugin-v1.
  5. Enter an optional description.
  6. Choose Create custom plugin.

MSK Connect Plugin Screen

  1. Wait for plugin to transition to the status Active.

Create a connector

Complete the following steps to create a connector in MSK Connect:

  1. On the Amazon MSK console, choose Connectors in the navigation pane under MSK Connect.
  2. Choose Create connector.
  3. Select Use existing custom plugin and under Custom plugins, select the plugin msk-eventBridge-sink-plugin-v1 that you created earlier.
  4. Choose Next.
  5. For Connector name, enter msk-eventBridge-sink-connector.
  6. Enter an optional description.
  7. For Cluster type, select MSK cluster.
  8. For MSK clusters, select the cluster you created earlier.
  9. For Authentication, choose IAM.
  10. Under Connector configurations, enter the following settings (for more details on the configuration, see the GitHub repository):
    auto.offset.reset=earliest
    connector.class=software.amazon.event.kafkaconnector.EventBridgeSinkConnector
    topics=notifications
    aws.eventbridge.connector.id=avro-test-connector
    aws.eventbridge.eventbus.arn=arn:aws:events:us-east-1:123456789012:event-bus/eventbridge-sink-eventbus
    aws.eventbridge.region=us-east-1
    tasks.max=1
    key.converter=org.apache.kafka.connect.storage.StringConverter
    value.converter=com.amazonaws.services.schemaregistry.kafkaconnect.AWSKafkaAvroConverter
    value.converter.region=us-east-1
    value.converter.registry.name=default-registry
    value.converter.avroRecordType=GENERIC_RECORD

  11. Make sure to replace aws.eventbridge.eventbus.arn, aws.eventbridge.region, and value.converter.region with the values from the prerequisite stack.
  12. In the Connector capacity section, select Autoscaled for Capacity type.
  13. Leave the default value of 1 for MCU count per worker.
  14. Keep all default values for Connector capacity.
  15. For Worker configuration, select Use the MSK default configuration.
  16. Under Access permissions, choose the custom IAM role KafkaEventBridgeSinkStack-connectorRole, which you created during the AWS CDK stack deployment.
  17. Choose Next.
  18. Choose Next again.
  19. For Log delivery, select Deliver to Amazon CloudWatch Logs.
  20. For Log group, choose /aws/mskconnect/eventBridgeSinkConnector.
  21. Choose Next.
  22. Under Review and Create, validate all the settings and choose Create connector.

The connector will be now in the state Creating. It can take up to several minutes for the connector to transition into the status Running.

Create EventBridge rules

Now that the connector is forwarding events to EventBridge, we can use EventBridge rules to filter and send events to other targets. Complete the following steps to create a rule:

  1. On the EventBridge console, choose Rules in the navigation pane.
  2. Choose Create rule.
  3. Enter eb-to-cloudwatch-logs-and-webhook for Name.
  4. Select eventbridge-sink-eventbus for Event bus.
  5. Choose Next.
  6. Select Custom pattern (JSON editor), choose Insert, and replace the event pattern with the following code:
    {
      "detail": {
        "value": {
          "eventType": ["suspiciousActivity"],
          "source": ["transactionAnalyzer"]
        }
      },
      "detail-type": [{
        "prefix": "kafka-connect-notification"
      }]
    }
    

  7. Choose Next.
  8. For Target 1, select CloudWatch log group and enter kafka-events for Log Group.
  9. Choose Add another target.
  10. (Optional: Create an API destination) For Target 2, select EventBridge API destination for Target types.
  11. Select Create a new API destination.
  12. Enter a descriptive name for Name.
  13. Add the URL and enter it as API destination endpoint. (This can be the URL of your Datadog, Salesforce, etc. endpoint)
  14. Select POST for HTTP method.
  15. Select Create a new connection for Connection.
  16. For Connection Name, enter a name.
  17. Select Other as Destination type and select API Key as Authorization Type.
  18. For API key name and Value, enter your keys.
  19. Choose Next.
  20. Validate your inputs and choose Create rule.

EventBridge Rule

The following screenshot of the CloudWatch Logs console shows several events from EventBridge.

CloudWatch Logs

Run the connector in production

In this section, we dive deeper into the operational aspects of the connector. Specifically, we discuss how the connector scales and how to monitor it using CloudWatch.

Scale the connector

Kafka connectors scale through the number of tasks. The code design of the EventBridge sink connector doesn’t limit the number of tasks that it can run. MSK Connect provides the compute capacity to run the tasks, which can be from Provisioned or Autoscaled type. During the deployment of the connector, we choose the capacity type Autoscaled and 1 MCU per worker (which represents 1vCPU and 4GiB of memory). This means MSK Connect will scale the infrastructure to run tasks but not the number of tasks. The number of tasks is defined by the connector. By default, the connector will start with the number of tasks defined in tasks.max in the connector configuration. If this value is higher than the partition count of the processed topic, the number of tasks will be set to the number of partitions during the Kafka Connect rebalance.

Monitor the connector

MSK Connect emits metrics to CloudWatch for monitoring by default. Besides MSK Connect metrics, the offset of the connector should also be monitored in production. Monitoring the offset gives insights if the connector can keep up with the data produced in the Kafka cluster.

Clean up

To clean up your resources and avoid ongoing charges, complete the following the steps:

  1. On the Amazon MSK console, choose Connectors in the navigation pane under MSK Connect.
  2. Select the connectors you created and choose Delete.
  3. Choose Clusters in the navigation pane.
  4. Select the cluster you created and choose Delete on the Actions menu.
  5. On the EventBridge console, choose Rules in the navigation pane.
  6. Choose the event bus eventbridge-sink-eventbus.
  7. Select all the rules you created and choose Delete.
  8. Confirm the removal by entering delete, then choose Delete.

If you deployed the AWS CDK stack with the context PREREQ, delete the .jar file for the connector.

  1. On the Amazon S3 console, choose Buckets in the navigation pane.
  2. Navigate to the bucket where you uploaded your connector and delete the kafka-eventbridge-sink-with-gsr-dependencies.jar file.

Independent from the chosen deployment mode, all other AWS resources can be deleted by using AWS CDK or AWS CloudFormation. Run cdk destroy from the repository directory to delete the CloudFormation stack.

Alternatively, on the AWS CloudFormation console, select the stack KafkaEventBridgeSinkStack and choose Delete.

Conclusion

In this post, we showed how you can use MSK Connect to run the AWS open-sourced Kafka connector for EventBridge, how to configure the connector to forward a Kafka topic to EventBridge, and how to use EventBridge rules to filter and forward events to CloudWatch Logs and a webhook.

To learn more about the Kafka connector for EventBridge, refer to Amazon EventBridge announces open-source connector for Kafka Connect, as well as the MSK Connect Developer Guide and the code for the connector on the GitHub repo.


About the Authors

Florian Mair is a Senior Solutions Architect and data streaming expert at AWS. He is a technologist that helps customers in Germany succeed and innovate by solving business challenges using AWS Cloud services. Besides working as a Solutions Architect, Florian is a passionate mountaineer, and has climbed some of the highest mountains across Europe.

Benjamin Meyer is a Senior Solutions Architect at AWS, focused on Games businesses in Germany to solve business challenges by using AWS Cloud services. Benjamin has been an avid technologist for 7 years, and when he’s not helping customers, he can be found developing mobile apps, building electronics, or tending to his cacti.

How AWS threat intelligence deters threat actors

Post Syndicated from Mark Ryland original https://aws.amazon.com/blogs/security/how-aws-threat-intelligence-deters-threat-actors/

Every day across the Amazon Web Services (AWS) cloud infrastructure, we detect and successfully thwart hundreds of cyberattacks that might otherwise be disruptive and costly. These important but mostly unseen victories are achieved with a global network of sensors and an associated set of disruption tools. Using these capabilities, we make it more difficult and expensive for cyberattacks to be carried out against our network, our infrastructure, and our customers. But we also help make the internet as a whole a safer place by working with other responsible providers to take action against threat actors operating within their infrastructure. Turning our global-scale threat intelligence into swift action is just one of the many steps that we take as part of our commitment to security as our top priority. Although this is a never-ending endeavor and our capabilities are constantly improving, we’ve reached a point where we believe customers and other stakeholders can benefit from learning more about what we’re doing today, and where we want to go in the future.

Global-scale threat intelligence using the AWS Cloud

With the largest public network footprint of any cloud provider, our scale at AWS gives us unparalleled insight into certain activities on the internet, in real time. Some years ago, leveraging that scale, AWS Principal Security Engineer Nima Sharifi Mehr started looking for novel approaches for gathering intelligence to counter threats. Our teams began building an internal suite of tools, given the moniker MadPot, and before long, Amazon security researchers were successfully finding, studying, and stopping thousands of digital threats that might have affected its customers.

MadPot was built to accomplish two things: first, discover and monitor threat activities and second, disrupt harmful activities whenever possible to protect AWS customers and others. MadPot has grown to become a sophisticated system of monitoring sensors and automated response capabilities. The sensors observe more than 100 million potential threat interactions and probes every day around the world, with approximately 500,000 of those observed activities advancing to the point where they can be classified as malicious. That enormous amount of threat intelligence data is ingested, correlated, and analyzed to deliver actionable insights about potentially harmful activity happening across the internet. The response capabilities automatically protect the AWS network from identified threats, and generate outbound communications to other companies whose infrastructure is being used for malicious activities.

Systems of this sort are known as honeypots—decoys set up to capture threat actor behavior—and have long served as valuable observation and threat intelligence tools. However, the approach we take through MadPot produces unique insights resulting from our scale at AWS and the automation behind the system. To attract threat actors whose behaviors we can then observe and act on, we designed the system so that it looks like it’s composed of a huge number of plausible innocent targets. Mimicking real systems in a controlled and safe environment provides observations and insights that we can often immediately use to help stop harmful activity and help protect customers.

Of course, threat actors know that systems like this are in place, so they frequently change their techniques—and so do we. We invest heavily in making sure that MadPot constantly changes and evolves its behavior, continuing to have visibility into activities that reveal the tactics, techniques, and procedures (TTPs) of threat actors. We put this intelligence to use quickly in AWS tools, such as AWS Shield and AWS WAF, so that many threats are mitigated early by initiating automated responses. When appropriate, we also provide the threat data to customers through Amazon GuardDuty so that their own tooling and automation can respond.

Three minutes to exploit attempt, no time to waste

Within approximately 90 seconds of launching a new sensor within our MadPot simulated workload, we can observe that the workload has been discovered by probes scanning the internet. From there, it takes only three minutes on average before attempts are made to penetrate and exploit it. This is an astonishingly short amount of time, considering that these workloads aren’t advertised or part of other visible systems that would be obvious to threat actors. This clearly demonstrates the voracity of scanning taking place and the high degree of automation that threat actors employ to find their next target.

As these attempts run their course, the MadPot system analyzes the telemetry, code, attempted network connections, and other key data points of the threat actor’s behavior. This information becomes even more valuable as we aggregate threat actor activities to generate a more complete picture of available intelligence.

Disrupting attacks to maintain business as usual

In-depth threat intelligence analysis also happens in MadPot. The system launches the malware it captures in a sandboxed environment, connects information from disparate techniques into threat patterns, and more. When the gathered signals provide high enough confidence in a finding, the system acts to disrupt threats whenever possible, such as disconnecting a threat actor’s resources from the AWS network. Or, it could entail preparing that information to be shared with the wider community, such as a computer emergency response team (CERT), internet service provider (ISP), a domain registrar, or government agency so that they can help disrupt the identified threat.

As a major internet presence, AWS takes on the responsibility to help and collaborate with the security community when possible. Information sharing within the security community is a long-standing tradition and an area where we’ve been an active participant for years.

In the first quarter of 2023:

  • We used 5.5B signals from our internet threat sensors and 1.5B signals from our active network probes in our anti-botnet security efforts.
  • We stopped over 1.3M outbound botnet-driven DDoS attacks.
  • We shared our security intelligence findings, including nearly a thousand botnet C2 hosts, with relevant hosting providers and domain registrars.
  • We traced back and worked with external parties to dismantle the sources of 230k L7/HTTP(S) DDoS attacks.

Three examples of MadPot’s effectiveness: Botnets, Sandworm, and Volt Typhoon

Recently, MadPot detected, collected, and analyzed suspicious signals that uncovered a distributed denial of service (DDoS) botnet that was using the domain free.bigbots.[tld] (the top-level domain is omitted) as a command and control (C2) domain. A botnet is made up of compromised systems that belong to innocent parties—such as computers, home routers, and Internet of Things (IoT) devices—that have been previously compromised, with malware installed that awaits commands to flood a target with network packets. Bots under this C2 domain were launching 15–20 DDoS attacks per hour at a rate of about 800 million packets per second.

As MadPot mapped out this threat, our intelligence revealed a list of IP addresses used by the C2 servers corresponding to an extremely high number of requests from the bots. Our systems blocked those IP addresses from access to AWS networks so that a compromised customer compute node on AWS couldn’t participate in the attacks. AWS automation then used the intelligence gathered to contact the company that was hosting the C2 systems and the registrar responsible for the DNS name. The company whose infrastructure was hosting the C2s took them offline in less than 48 hours, and the domain registrar decommissioned the DNS name in less than 72 hours. Without the ability to control DNS records, the threat actor could not easily resuscitate the network by moving the C2s to a different network location. In less than three days, this widely distributed malware and the C2 infrastructure required to operate it was rendered inoperable, and the DDoS attacks impacting systems throughout the internet ground to a halt.

MadPot is effective in detecting and understanding the threat actors that target many different kinds of infrastructure, not just cloud infrastructure, including the malware, ports, and techniques that they may be using. Thus, through MadPot we identified the threat group called Sandworm—the cluster associated with Cyclops Blink, a piece of malware used to manage a botnet of compromised routers. Sandworm was attempting to exploit a vulnerability affecting WatchGuard network security appliances. With close investigation of the payload, we identified not only IP addresses but also other unique attributes associated with the Sandworm threat that were involved in an attempted compromise of an AWS customer. MadPot’s unique ability to mimic a variety of services and engage in high levels of interaction helped us capture additional details about Sandworm campaigns, such as services that the actor was targeting and post-exploitation commands initiated by that actor. Using this intelligence, we notified the customer, who promptly acted to mitigate the vulnerability. Without this swift action, the actor might have been able to gain a foothold in the customer’s network and gain access to other organizations that the customer served.

For our final example, the MadPot system was used to help government cyber and law enforcement authorities identify and ultimately disrupt Volt Typhoon, the widely-reported state-sponsored threat actor that focused on stealthy and targeted cyber espionage campaigns against critical infrastructure organizations. Through our investigation inside MadPot, we identified a payload submitted by the threat actor that contained a unique signature, which allowed identification and attribution of activities by Volt Typhoon that would otherwise appear to be unrelated. By using the data lake that stores a complete history of MadPot interactions, we were able to search years of data very quickly and ultimately identify other examples of this unique signature, which was being sent in payloads to MadPot as far back as August 2021. The previous request was seemingly benign in nature, so we believed that it was associated with a reconnaissance tool. We were then able to identify other IP addresses that the threat actor was using in recent months. We shared our findings with government authorities, and those hard-to-make connections helped inform the research and conclusions of the Cybersecurity and Infrastructure Security Agency (CISA) of the U.S. government. Our work and the work of other cooperating parties resulted in their May 2023 Cybersecurity advisory. To this day, we continue to observe the actor probing U.S. network infrastructure, and we continue to share details with appropriate government cyber and law enforcement organizations.

Putting global-scale threat intelligence to work for AWS customers and beyond

At AWS, security is our top priority, and we work hard to help prevent security issues from causing disruption to your business. As we work to defend our infrastructure and your data, we use our global-scale insights to gather a high volume of security intelligence—at scale and in real time—to help protect you automatically. Whenever possible, AWS Security and its systems disrupt threats where that action will be most impactful; often, this work happens largely behind the scenes. As demonstrated in the botnet case described earlier, we neutralize threats by using our global-scale threat intelligence and by collaborating with entities that are directly impacted by malicious activities. We incorporate findings from MadPot into AWS security tools, including preventative services, such as AWS WAF, AWS Shield, AWS Network Firewall, and Amazon Route 53 Resolver DNS Firewall, and detective and reactive services, such as Amazon GuardDuty, AWS Security Hub, and Amazon Inspector, putting security intelligence when appropriate directly into the hands of our customers, so that they can build their own response procedures and automations.

But our work extends security protections and improvements far beyond the bounds of AWS itself. We work closely with the security community and collaborating businesses around the world to isolate and take down threat actors. In the first half of this year, we shared intelligence of nearly 2,000 botnet C2 hosts with relevant hosting providers and domain registrars to take down the botnets’ control infrastructure. We also traced back and worked with external parties to dismantle the sources of approximately 230,000 Layer 7 DDoS attacks. The effectiveness of our mitigation strategies relies heavily on our ability to quickly capture, analyze, and act on threat intelligence. By taking these steps, AWS is going beyond just typical DDoS defense, and moving our protection beyond our borders.

We’re glad to be able to share information about MadPot and some of the capabilities that we’re operating today. For more information, see this presentation from our most recent re:Inforce conference: How AWS threat intelligence becomes managed firewall rules, as well as an overview post published today, Meet MadPot, a threat intelligence tool Amazon uses to protect customers from cybercrime, which includes some good information about the AWS security engineer behind the original creation of MadPot. Going forward, you can expect to hear more from us as we develop and enhance our threat intelligence and response systems, making both AWS and the internet as a whole a safer place.

 
If you have feedback about this post, submit comments in the Comments section below. If you have questions about this post, contact AWS Support.

Want more AWS Security news? Follow us on Twitter.

Mark Ryland

Mark Ryland

Mark is the director of the Office of the CISO for AWS. He has over 30 years of experience in the technology industry, and has served in leadership roles in cybersecurity, software engineering, distributed systems, technology standardization, and public policy. Previously, he served as the Director of Solution Architecture and Professional Services for the AWS World Public Sector team.

Deploy AWS WAF faster with Security Automations

Post Syndicated from Harith Gaddamanugu original https://aws.amazon.com/blogs/security/deploy-aws-managed-rules-using-security-automations-for-aws-waf/

You can now deploy AWS WAF managed rules as part of the Security Automations for AWS WAF solution. In this post, we show you how to get started and set up monitoring for this automated solution with additional recommendations.

This article discusses AWS WAF, a service that assists you in protecting against typical web attacks and bots that might disrupt availability, compromise security, or consume excessive resources. As requests for your websites are received by the underlying service, they’re forwarded to AWS WAF for inspection against your rules. AWS WAF informs the underlying service to either block, allow, or take another configured action when a request fulfills the criteria stated in your rules. AWS WAF is tightly integrated with Amazon CloudFront, Application Load Balancer (ALB), Amazon API Gateway, and AWS AppSync—all of which are routinely used by AWS customers to provide content for their websites and applications.

To provide a simple, purpose-driven deployment approach, our solutions builder teams developed Security Automations for AWS WAF, a solution that can help organizations that don’t have dedicated security teams to quickly deploy an AWS WAF that filters common web-based malicious activity. Security Automations for AWS WAF deploys a set of preconfigured rules to help you protect your applications from common web exploits.

This solution can be installed in your AWS accounts by launching the provided AWS CloudFormation template.

Security Automations for AWS WAF provides the following features and benefits:

  • Helps secure your web applications with AWS managed rule groups
  • Provide layer 7 flood protection with a predefined HTTP flood custom rule
  • Helps block exploitation of vulnerabilities with a predefined scanners and probes custom rule
  • Detect and deflect intrusion from bots with a honeypot endpoint using a bad bot custom rule
  • Helps block malicious IP addresses based on AWS and external IP reputation lists
  • Building a monitoring dashboard with Amazon CloudWatch
  • Integration with AWS Service Catalog AppRegistry and AWS Systems Manager Application Manager
Figure 1: Design overview of the new Security Automations for AWS WAF solution

Figure 1: Design overview of the new Security Automations for AWS WAF solution

Getting started

Many customers begin their proofs of concept (POC) by using the AWS Management Console for AWS WAF to set up their very first AWS WAF, but quickly realize the benefits of automation, such as increased productivity, enforcing best practices, avoiding repetition, and so on. Manually managing AWS WAF can be time-consuming, especially if you want to duplicate complicated automations across multiple environments.

You can deploy this solution for new and existing supported AWS WAF resources. The implementation guide discusses architectural considerations, configuration steps, and operational best practices for deploying this solution in the AWS Cloud. It includes links to AWS CloudFormation templates and stacks that launch, configure, and run the AWS security, compute, storage, and other services required to deploy this solution on AWS, using AWS best practices for security and availability.

Before you launch the CloudFormation template, review the architecture and configuration considerations discussed in this guide. The template takes about 15 minutes to deploy and includes three basic steps:

Step 1. Launch the stack

  1. Launch the CloudFormation template into your AWS account and select the desired AWS Region.
  2. Enter values for the required parameters: Stack name and Application access log bucket name.
  3. Review the other template parameters and adjust if necessary.

Step 2. Associate the web ACL with your web application

Associate your CloudFront web distributions or ALBs with the web ACL that this solution generates. You can associate as many distributions or load balancers as you want.

Step 3. Configure web access logging

Turn on web access logging for your CloudFront web distributions or ALBs, and send the log files to the appropriate Amazon Simple Storage Service (Amazon S3) bucket. Save the logs in a folder matching the user-defined prefix. If no user-defined prefix is used, save the logs to AWSLogs (default log prefix AWSLogs/).

Customize the solution

This solution provides an example of how to use AWS WAF and other services to build security automations on the AWS Cloud. You can download the open source code from GitHub to apply customizations or build your own security automations that fit your needs. The solution builder team is planning to release a Terraform version for this solution in the near future.

Monitor the solution

This solution includes a Service Catalog AppRegistry resource to register the CloudFormation template and underlying resources as an application in both the Service Catalog AppRegistry and Systems Manager Application Manager. You can monitor the costs and operations data in the Systems Manager console, as shown in Figure 2 that follows.

Figure 2: Example of the application view for the Security Automations for AWS WAF stack in Application Manager

Figure 2: Example of the application view for the Security Automations for AWS WAF stack in Application Manager

CloudWatch dashboards are customizable home pages in the CloudWatch console that you can use to monitor your resources in a single view, including visualizing AWS WAF logs as shown in Figure 3 that follows. The solution creates a simple dashboard that you can customize to monitor additional metrics, alarms and logs. If suspicious activity is reported, you can use the visuals to understand the traffic in more detail and drive incident response actions as needed. From here, you can investigate further by using specific queries with CloudWatch Logs Insights.

Figure 3: Example of an enhanced AWS WAF CloudWatch dashboard that can be built for monitoring your site traffic

Figure 3: Example of an enhanced AWS WAF CloudWatch dashboard that can be built for monitoring your site traffic

Conclusion

In this post, you learned about using the AWS Security Automation template to quickly deploy AWS WAF. If you prefer a simpler solution, we recommend using the one-click CloudFront AWS WAF setup, which offers a simple way to deploy AWS WAF for your CloudFront distribution. By choosing the approach that aligns with your requirements, you can enhance the security of your web applications and safeguard them against potential threats.

For more solutions, visit the AWS Solutions Library.

 
If you have feedback about this post, submit comments in the Comments section below. If you have questions about this post, contact AWS Support.

Want more AWS Security news? Follow us on Twitter.

Harith Gaddamanugu

Harith Gaddamanugu

Harith works at AWS as a Sr. Edge Specialist Solutions Architect. He stays motivated by solving problems for customers across AWS Perimeter Protection and Edge services. When he is not working, he enjoys spending time outdoors with friends and family.

Using Experian identity resolution with AWS Clean Rooms to achieve higher audience activation match rates

Post Syndicated from Omar Gonzalez original https://aws.amazon.com/blogs/big-data/using-experian-identity-resolution-with-aws-clean-rooms-to-achieve-higher-audience-activation-match-rates/

This is a guest post co-written with Tyler Middleton, Experian Senior Partner Marketing Manager, and Jay Rakhe, Experian Group Product Manager.

As the data privacy landscape continues to evolve, companies are increasingly seeking ways to collect and manage data while protecting privacy and intellectual property. First party data is more important than ever for companies to understand their customers and improve how they interact with them, such as in digital advertising across channels. Companies are challenged with having a complete view of their customers as they engage with them across different channels and devices, in addition to other third parties that could complement their data to generate rich insights about their customers. This has driven companies to build identity graph solutions or use well-known identity resolution from providers such as Experian. It has also driven companies to grow their first-party consumer-consented data and collaborate with other companies and partners to create better-informed advertising campaigns.

AWS Clean Rooms allows companies to collaborate securely with their partners on their collective datasets without sharing or copying one another’s underlying data. Combining Experian’s identity resolution with AWS Clean Rooms can help you achieve higher match rates with your partners on your collective datasets when you run an AWS Clean Rooms collaboration. You can achieve higher match rates by using Experian’s diverse offline and digital ID database.

In this post, we walk through an example of a retail advertiser collaborating with a connected television (CTV) provider, facilitated by AWS Clean Rooms and Experian. AWS Clean Rooms facilitates a secure collaboration for an audience activation use case.

Use case overview

Retail advertisers recognize the growing consumer behaviors to use streaming TV services over traditional TV channels. Because of this, you may want to use your customer tiering and past purchase history datasets to target your audience in CTV.

The following example advertiser dataset includes the audience to be targeted on the CTV platform.

Advertiser

ID

First Last Address City State Zip Customer Tier LTV Last Purchase Date
123 Tyler Smith 4128 Et Street Franklin OK 82736 Gold $823 8/1/21
456 Karleigh Jones 2588 Nibh Street Clinton RI 38947 Gold $741 2/2/22
984 Alex Brown 6556 Tincidunt Avenue Madison WI 10975 Silver $231 1/17/22

The following sample CTV provider dataset has email addresses and subscription status.

Email Address Status
[email protected] Subscribed
[email protected] Free Ad Tier
[email protected] Trial

Experian performs identity resolution on each dataset by matching against Experian’s attributes on 250 million consumers and 126 million households. Experian assigns a unique and synthetic Experian ID referred to as a Living Unit ID (LUID) to each matched record.

The Experian LUIDs for an advertiser and CTV provider are unique per consumer record. For example, LU_ADV_123 in the advertiser table corresponds to LU_CTV_135 in the CTV table. To allow the CTV provider and advertiser to match identities across the datasets, Experian generates a collaboration LUID, as shown in the following figure. This allows a double-blind join to be performed against both tables in AWS Clean Rooms.

 Advertiser and CTV Provider Double Blind Join

The following figure illustrates the workflow in our example AWS Clean Rooms collaboration.

Experian identity resolution with AWS Clean Rooms workflow

We walk you through the following high-level steps:

  1. Prepare the data tables with Experian IDs, load the data to Amazon Simple Storage Service (Amazon S3), and catalog the data with AWS Glue.
  2. Associate the configured tables, define the analysis rules, and collaborate with privacy-enhancing controls joining between the Experian LUID encodings using the match table.
  3. Use AWS Clean Rooms to validate that the query conforms to the analysis rules and returns query results that meet all restrictions.

Prepare data tables with Experian IDs, load data to Amazon S3, and catalog data with AWS Glue

First, the advertiser and CTV provider engage with Experian directly to assign Experian LUIDs to their consumer records. During this process, both parties provide identity components to Experian as an input. Experian processes their input data and returns an Experian LUID when a matched identity is found. New and existing Experian customers can start this process by reaching out to Experian Marketing Services.

After the tables are prepared with Experian LUIDs, the advertiser, CTV provider, and Experian join an AWS Clean Rooms collaboration. A collaboration is a secure logical boundary in AWS Clean Rooms in which members perform SQL queries on configured tables. Any participant can create an AWS Clean Rooms collaboration. In this example, the CTV provider has created a collaboration in AWS Clean Rooms and invited the advertiser and Experian to join and contribute data, without sharing their underlying data with each other. The advertiser and Experian will log in to each of their respective AWS accounts and join the collaboration as a member.

The next step is to upload and catalog the data to be queried in AWS Clean Rooms. Each collaborator will upload their dataset to Amazon S3 object storage in their respective accounts. Next, the data is cataloged in the AWS Glue Data Catalog.

Associate the configured tables, define analysis rules, and collaborate with privacy enhancing controls

After the table is cataloged in the AWS Glue Data Catalog, it can be associated with an AWS Clean Rooms configured table. A configured table defines which columns can be used in the collaboration and contains an analysis rule that determines how the data can be queried.

In this step, Experian adds two configured tables that include the collaboration LUIDs that allow the CTV provider and advertiser to match across their datasets.

The advertiser has defined a list analysis rule that allows the CTV provider to run queries that return a row-level list of the collective data. They have also configured their unique Experian advertiser LUIDs as the join keys. In AWS Clean Rooms, join key columns can be used to join datasets, but the values can’t be returned in the result.

{
 "joinColumns": [
   "experian_luid_adv"
 ],
 "listColumns": [
   "ltv",
   "customer_tier"
 ]
}

The CTV provider can perform queries against the datasets. They must duplicate the CTV LUID column to use it as a join key and query dimension, as shown in the following code. This is an important step when configuring a collaboration with Experian as an ID provider.

{
 "joinColumns": [
   "experian_luid_ctv"
 ],
 "listColumns": [
   "experian_luid_ctv_2",
   "sub_status"
 ]
}

Use AWS Clean Rooms to validate the query matches the analysis rule type, expected query structure, and columns and tables defined in the analysis rule

The CTV provider can now perform a SQL query against the datasets using the AWS Clean Rooms console or the AWS Clean Rooms StartProtectedQuery API.

The following sample list query returns the customer tier and LTV (lifetime value) for matched CTV identities:

SELECT DISTINCT ctv.experian_luid_ctv_2,
       ctv.sub_status,
       adv.customer_tier,
       adv.ltv
FROM ctv
   JOIN experian_ctv
       ON ctv.experian_luid_ctv = experian_ctv.experian_luid_ctv
   JOIN experian_adv
       ON experian_ctv.experian_luid_collab = experian_adv.experian_luid_collab
   JOIN adv
       ON experian_adv.experian_luid_adv = adv.experian_luid_adv

The following figure illustrates the results.

AWS Clean Rooms List Query Output

Conclusion

In this post, we showed how a retail advertiser can enrich their data with CTV provider data using Experian in an AWS Clean Rooms collaboration, without sharing or exposing raw data with each other. The advertiser can now use the CTV customer tiering and subscription data to activate specific segments on the CTV platform. For example, if the retail advertiser wants to offer membership to their loyalty program, they can now target their high LTV customers that have a CTV paid subscription. With AWS Clean Rooms, this use case can be expanded further to include additional collaborators to further enrich your data. AWS Clean Rooms partners include identity resolution providers, such as Experian, who can help you more easily join data using Experian identifiers. To learn more about the benefits of Experian identity resolution, refer to Identity resolution solutions. New and existing customers can contact Experian Marketing Services to authorize an AWS Clean Rooms collaboration. Visit the AWS Clean Rooms User Guide to get started using AWS Clean Rooms today.


About the Authors

Omar Gonzalez is a Senior Solutions Architect at Amazon Web Services in Southern California with more than 20 years of experience in IT. He is passionate about helping customers drive business value through the use of technology. Outside of work, he enjoys hiking and spending quality time with his family.

Matt Miller is a Business Development Principal at AWS. In his role, Matt drives customer and partner adoption for the AWS Clean Rooms service specializing in advertising and marketing industry use cases. Matt believes in the primacy of privacy enhanced data collaboration and interoperability underpinning data-driven marketing imperatives from customer experience to addressable advertising. Prior to AWS, Matt led strategy and go-to market efforts for ad technologies, large agencies, and consumer data products purpose-built to inform smarter marketing and deliver better customer experiences.
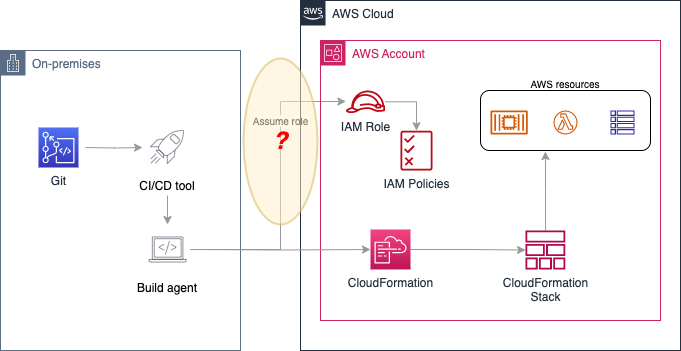
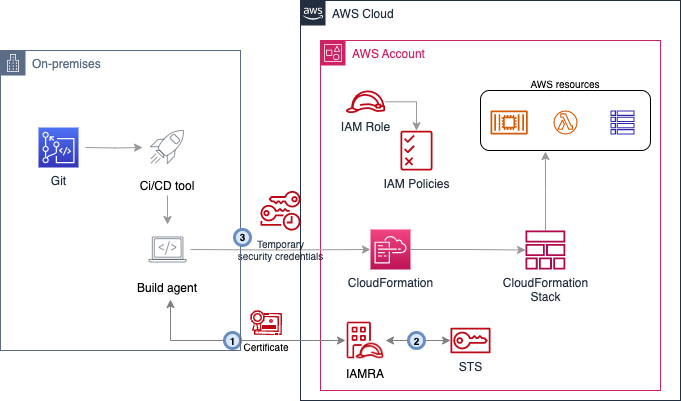
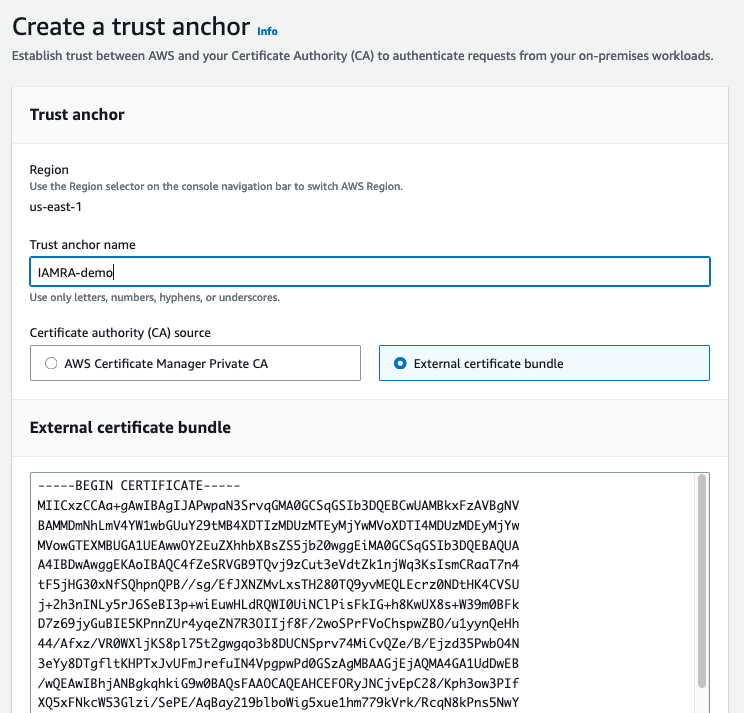
Enable external pipeline deployments to AWS Cloud by using IAM Roles Anywhere

Post Syndicated from Olivier Gaumond original https://aws.amazon.com/blogs/security/enable-external-pipeline-deployments-to-aws-cloud-by-using-iam-roles-anywhere/

Continuous integration and continuous delivery (CI/CD) services help customers automate deployments of infrastructure as code and software within the cloud. Common native Amazon Web Services (AWS) CI/CD services include AWS CodePipeline, AWS CodeBuild, and AWS CodeDeploy. You can also use third-party CI/CD services hosted outside the AWS Cloud, such as Jenkins, GitLab, and Azure DevOps, to deploy code within the AWS Cloud through temporary security credentials use.

Security credentials allow identities (for example, IAM role or IAM user) to verify who they are and the permissions they have to interact with another resource. The AWS Identity and Access Management (IAM) service authentication and authorization process requires identities to present valid security credentials to interact with another AWS resource.

According to AWS security best practices, where possible, we recommend relying on temporary credentials instead of creating long-term credentials such as access keys. Temporary security credentials, also referred to as short-term credentials, can help limit the impact of inadvertently exposed credentials because they have a limited lifespan and don’t require periodic rotation or revocation. After temporary security credentials expire, AWS will no longer approve authentication and authorization requests made with these credentials.

In this blog post, we’ll walk you through the steps on how to obtain AWS temporary credentials for your external CI/CD pipelines by using IAM Roles Anywhere and an on-premises hosted server running Azure DevOps Services.

Deploy securely on AWS using IAM Roles Anywhere

When you run code on AWS compute services, such as AWS Lambda, AWS provides temporary credentials to your workloads. In hybrid information technology environments, when you want to authenticate with AWS services from outside of the cloud, your external services need AWS credentials.

IAM Roles Anywhere provides a secure way for your workloads — such as servers, containers, and applications running outside of AWS — to request and obtain temporary AWS credentials by using private certificates. You can use IAM Roles Anywhere to enable your applications that run outside of AWS to obtain temporary AWS credentials, helping you eliminate the need to manage long-term credentials or complex temporary credential solutions for workloads running outside of AWS.

To use IAM Roles Anywhere, your workloads require an X.509 certificate, issued by your private certificate authority (CA), to request temporary security credentials from the AWS Cloud.

IAM Roles Anywhere can work with your existing client or server certificates that you issue to your workloads today. In this blog post, our objective is to show how you can use X.509 certificates issued by your public key infrastructure (PKI) solution to gain access to AWS resources by using IAM Roles Anywhere. Here we don’t cover PKI solutions options, and we assume that you have your own PKI solution for certificate generation. In this post, we demonstrate the IAM Roles Anywhere setup with a self-signed certificate for the purpose of the demo running in a test environment.

External CI/CD pipeline deployments in AWS

CI/CD services are typically composed of a control plane and user interface. They are used to automate the configuration, orchestration, and deployment of infrastructure code or software. The code build steps are handled by a build agent that can be hosted on a virtual machine or container running on-premises or in the cloud. Build agents are responsible for completing the jobs defined by a CI/CD pipeline.

For this use case, you have an on-premises CI/CD pipeline that uses AWS CloudFormation to deploy resources within a target AWS account. The CloudFormation template, the pipeline definition, and other files are hosted in a Git repository. The on-premises build agent requires permissions to deploy code through AWS CloudFormation within an AWS account. To make calls to AWS APIs, the build agent needs to obtain AWS credentials from an IAM role. The solution architecture is shown in Figure 1.

Figure 1: Using external CI/CD tool with AWS

Figure 1: Using external CI/CD tool with AWS

To make this deployment securely, the main objective is to use short-term credentials and avoid the need to generate and store long-term credentials for your pipelines. This post walks through how to use IAM Roles Anywhere and certificate-based authentication with Azure DevOps build agents. The walkthrough will use Azure DevOps Services with Microsoft-hosted agents. This approach can be used with a self-hosted agent or Azure DevOps Server.

IAM Roles Anywhere and certificate-based authentication

IAM Roles Anywhere uses a private certificate authority (CA) for the temporary security credential issuance process. Your private CA is registered with IAM Roles Anywhere through a service-to-service trust. Once the trust is established, you create an IAM role with an IAM policy that can be assumed by your services running outside of AWS. The external service uses a private CA issued X.509 certificate to request temporary AWS credentials from IAM Roles Anywhere and then assumes the IAM role with permission to finish the authentication process, as shown in Figure 2.

Figure 2: Certificate-based authentication for external CI/CD tool using IAM Roles Anywhere

Figure 2: Certificate-based authentication for external CI/CD tool using IAM Roles Anywhere

The workflow in Figure 2 is as follows:

  1. The external service uses its certificate to sign and issue a request to IAM Roles Anywhere.
  2. IAM Roles Anywhere validates the incoming signature and checks that the certificate was issued by a certificate authority configured as a trust anchor in the account.
  3. Temporary credentials are returned to the external service, which can then be used for other authenticated calls to the AWS APIs.

Walkthrough

In this walkthrough, you accomplish the following steps:

  1. Deploy IAM roles in your workload accounts.
  2. Create a root certificate to simulate your certificate authority. Then request and sign a leaf certificate to distribute to your build agent.
  3. Configure an IAM Roles Anywhere trust anchor in your workload accounts.
  4. Configure your pipelines to use certificate-based authentication with a working example using Azure DevOps pipelines.

Preparation

You can find the sample code for this post in our GitHub repository. We recommend that you locally clone a copy of this repository. This repository includes the following files:

  • DynamoDB_Table.template: This template creates an Amazon DynamoDB table.
  • iamra-trust-policy.json: This trust policy allows the IAM Roles Anywhere service to assume the role and defines the permissions to be granted.
  • parameters.json: This passes parameters when launching the CloudFormation template.
  • pipeline-iamra.yml: The definition of the pipeline that deploys the CloudFormation template using IAM Roles Anywhere authentication.
  • pipeline-iamra-multi.yml: The definition of the pipeline that deploys the CloudFormation template using IAM Roles Anywhere authentication in multi-account environment.

The first step is creating an IAM role in your AWS accounts with the necessary permissions to deploy your resources. For this, you create a role using the AWSCloudFormationFullAccess and AmazonDynamoDBFullAccess managed policies.

When you define the permissions for your actual applications and workloads, make sure to adjust the permissions to meet your specific needs based on the principle of least privilege.

Run the following command to create the CICDRole in the Dev and Prod AWS accounts.

aws iam create-role --role-name CICDRole --assume-role-policy-document file://iamra-trust-policy.json
aws iam attach-role-policy --role-name CICDRole --policy-arn arn:aws:iam::aws:policy/AmazonDynamoDBFullAccess
aws iam attach-role-policy --role-name CICDRole --policy-arn arn:aws:iam::aws:policy/AWSCloudFormationFullAccess

As part of the role creation, you need to apply the trust policy provided in iamra-trust-policy.json. This trust policy allows the IAM Roles Anywhere service to assume the role with the condition that the Subject Common Name (CN) of the certificate is cicdagent.example.com. In a later step you will update this trust policy with the Amazon Resource Name (ARN) of your trust anchor to further restrict how the role can be assumed.

{
    "Version": "2012-10-17",
    "Statement": [
        {
            "Effect": "Allow",
            "Principal": {
                "Service": "rolesanywhere.amazonaws.com"
            },
            "Action": [
                "sts:AssumeRole",
                "sts:TagSession",
                "sts:SetSourceIdentity"
            ],
            "Condition": {
                "StringEquals": {
                    "aws:PrincipalTag/x509Subject/CN": "cicd-agent.example.com"
                }
            }
        }
    ]
}

Issue and sign a self-signed certificate

Use OpenSSL to generate and sign the certificate. Run the following commands to generate a root and leaf certificate.

Note: The following procedure has been tested with OpenSSL 1.1.1 and OpenSSL 3.0.8.

# generate key for CA certificate
openssl genrsa -out ca.key 2048

# generate CA certificate
openssl req -new -x509 -days 1826 -key ca.key -subj /CN=ca.example.com \
    -addext 'keyUsage=critical,keyCertSign,cRLSign,digitalSignature' \
    -addext 'basicConstraints=critical,CA:TRUE' -out ca.crt 

#generate key for leaf certificate
openssl genrsa -out private.key 2048

#request leaf certificate
cat > extensions.cnf <<EOF
[v3_ca]
keyUsage = digitalSignature, nonRepudiation, keyEncipherment, dataEncipherment
EOF

openssl req -new -key private.key -subj /CN=cicd-agent.example.com -out iamra-cert.csr

#sign leaf certificate with CA
openssl x509 -req -days 7 -in iamra-cert.csr -CA ca.crt -CAkey ca.key -set_serial 01 -extfile extensions.cnf -extensions v3_ca -out certificate.crt

The following files are needed in further steps: ca.crt, certificate.crt, private.key.

Configure the IAM Roles Anywhere trust anchor and profile in your workload accounts

In this step, you configure the IAM Roles Anywhere trust anchor, the profile, and the role with the associated IAM policy to define the permissions to be granted to your build agents. Make sure to set the permissions specified in the policy to the least privileged access.

To configure the IAM Role Anywhere trust anchor

  1. Open the IAM console and go to Roles Anywhere.
  2. Choose Create a trust anchor.
  3. Choose External certificate bundle and paste the content of your CA public certificate in the certificate bundle box (the content of the ca.crt file from the previous step). The configuration looks as follows:
Figure 3: IAM Roles Anywhere trust anchor

Figure 3: IAM Roles Anywhere trust anchor

To follow security best practices by applying least privilege access, add a condition statement in the IAM role’s trust policy to match the created trust anchor to make sure that only certificates that you want to assume a role through IAM Roles Anywhere can do so.

To update the trust policy of the created CICDRole

  1. Open the IAM console, select Roles, then search for CICDRole.
  2. Open CICDRole to update its configuration, and then select Trust relationships.
  3. Replace the existing policy with the following updated policy that includes an additional condition to match on the trust anchor. Replace the ARN ID in the policy with the ARN of the trust anchor created in your account.
Figure 4: IAM Roles Anywhere updated trust policy

Figure 4: IAM Roles Anywhere updated trust policy

{
    "Version": "2012-10-17",
    "Statement": [
        {
            "Effect": "Allow",
            "Principal": {
                "Service": "rolesanywhere.amazonaws.com"
            },
            "Action": [
                "sts:AssumeRole",
                "sts:TagSession",
                "sts:SetSourceIdentity"
            ],
            "Condition": {
                "StringEquals": {
                    "aws:PrincipalTag/x509Subject/CN": "cicd-agent.example.com"
                },
                "ArnEquals": {
                    "aws:SourceArn": "arn:aws:rolesanywhere:ca-central-1:111111111111:trust-anchor/9f084b8b-2a32-47f6-aee3-d027f5c4b03b"
                }
            }
        }
    ]
}

To create an IAM Role Anywhere profile and link the profile to CICDRole

  1. Open the IAM console and go to Roles Anywhere.
  2. Choose Create a profile.
  3. In the Profile section, enter a name.
  4. In the Roles section, select CICDRole.
  5. Keep the other options set to default.
Figure 5: IAM Roles Anywhere profile

Figure 5: IAM Roles Anywhere profile

Configure the Azure DevOps pipeline to use certificate-based authentication

Now that you’ve completed the necessary setup in AWS, you move to the configuration of your pipeline in Azure DevOps. You need to have access to an Azure DevOps organization to complete these steps.

Have the following values ready. They’re needed for the Azure DevOps Pipeline configuration. You need this set of information for every AWS account you want to deploy to.

  • Trust anchor ARN – Resource identifier for the trust anchor created when you configured IAM Roles Anywhere.
  • Profile ARN – The identifier of the IAM Roles Anywhere profile you created.
  • Role ARN – The ARN of the role to assume. This role needs to be configured in the profile.
  • Certificate – The certificate tied to the profile (in other words, the issued certificate: file certificate.crt).
  • Private key – The private key of the certificate (private.key).

Azure DevOps configuration steps

The following steps walk you through configuring Azure DevOps.

  1. Create a new project in Azure DevOps.
  2. Add the following files from the sample repository that you previously cloned to the Git Azure repo that was created as part of the project. (The simplest way to do this is to add a new remote to your local Git repository and push the files.)
    • DynamoDB_Table.template – The sample CloudFormation template you will deploy
    • parameters.json – This passes parameters when launching the CloudFormation template
    • pipeline-iamra.yml – The definition of the pipeline that deploys the CloudFormation template using IAM RA authentication
  3. Create a new pipeline:
    1. Select Azure Repos Git as your source.
    2. Select your current repository.
    3. Choose Existing Azure Pipelines YAML file.
    4. For the path, enter pipeline-iamra.yml.
    5. Select Save (don’t run the pipeline yet).
  4. In Azure DevOps, choose Pipelines, and then choose Library.
  5. Create a new variable group called aws-dev that will store the configuration values to deploy to your AWS Dev environment.
  6. Add variables corresponding to the values of the trust anchor profile and role to use for authentication.
    Figure 6: Azure DevOps configuration steps: Adding IAM Roles Anywhere variables

    Figure 6: Azure DevOps configuration steps: Adding IAM Roles Anywhere variables

  7. Save the group.
  8. Update the permissions to allow your pipeline to use the variable group.
    Figure 7: Azure DevOps configuration steps: Pipeline permissions

    Figure 7: Azure DevOps configuration steps: Pipeline permissions

  9. In the Library, choose the Secure files tab to upload the certificate and private key files that you generated previously.
    Figure 8: Azure DevOps configuration steps: Upload certificate and private key

    Figure 8: Azure DevOps configuration steps: Upload certificate and private key

  10. For each file, update the Pipeline permissions to provide access to the pipeline created previously.
    Figure 9: Azure DevOps configuration steps: Pipeline permissions for each file

    Figure 9: Azure DevOps configuration steps: Pipeline permissions for each file

  11. Run the pipeline and validate successful completion. In your AWS account, you should see a stack named my-stack-name that deployed a DynamoDB table.
    Figure 10: Verify CloudFormation stack deployment in your account

    Figure 10: Verify CloudFormation stack deployment in your account

Explanation of the pipeline-iamra.yml

Here are the different steps of the pipeline:

  1. The first step downloads and installs the credential helper tool that allows you to obtain temporary credentials from IAM Roles Anywhere.
    - bash: wget https://rolesanywhere.amazonaws.com/releases/1.0.3/X86_64/Linux/aws_signing_helper; chmod +x aws_signing_helper;
      displayName: Install AWS Signer

  2. The second step uses the DownloadSecureFile built-in task to retrieve the certificate and private key that you stored in the Azure DevOps secure storage.
    - task: DownloadSecureFile@1
      name: Certificate
      displayName: 'Download certificate'
      inputs:
        secureFile: 'certificate.crt'
    
    - task: DownloadSecureFile@1
      name: Privatekey
      displayName: 'Download private key'
      inputs:
        secureFile: 'private.key'

    The credential helper is configured to obtain temporary credentials by providing the certificate and private key as well as the role to assume and an IAM AWS Roles Anywhere profile to use. Every time the AWS CLI or AWS SDK needs to authenticate to AWS, they use this credential helper to obtain temporary credentials.

    bash: |
        aws configure set credential_process "./aws_signing_helper credential-process --certificate $(Certificate.secureFilePath) --private-key $(Privatekey.secureFilePath) --trust-anchor-arn $(TRUSTANCHORARN) --profile-arn $(PROFILEARN) --role-arn $(ROLEARN)" --profile default
        echo "##vso[task.setvariable variable=AWS_SDK_LOAD_CONFIG;]1"
      displayName: Obtain AWS Credentials

  3. The next step is for troubleshooting purposes. The AWS CLI is used to confirm the current assumed identity in your target AWS account.
    task: AWSCLI@1
      displayName: Check AWS identity
      inputs:
        regionName: 'ca-central-1'
        awsCommand: 'sts'
        awsSubCommand: 'get-caller-identity'

  4. The final step uses the CloudFormationCreateOrUpdateStack task from the AWS Toolkit for Azure DevOps to deploy the Cloud Formation stack. Usually, the awsCredentials parameter is used to point the task to the Service Connection with the AWS access keys and secrets. If you omit this parameter, the task looks instead for the credentials in the standard credential provider chain.
    task: CloudFormationCreateOrUpdateStack@1
      displayName: 'Create/Update Stack: Staging-Deployment'
      inputs:
        regionName:     'ca-central-1'
        stackName:      'my-stack-name'
        useChangeSet:   true
        changeSetName:  'my-stack-name-changeset'
        templateFile:   'DynamoDB_Table.template'
        templateParametersFile: 'parameters.json'
        captureStackOutputs: asVariables
        captureAsSecuredVars: false

Multi-account deployments

In this example, the pipeline deploys to a single AWS account. You can quickly extend it to support deployment to multiple accounts by following these steps:

  1. Repeat the Configure IAM Roles Anywhere Trust Anchor for each account.
  2. In Azure DevOps, create a variable group with the configuration specific to the additional account.
  3. In the pipeline definition, add a stage that uses this variable group.

The pipeline-iamra-multi.yml file in the sample repository contains such an example.

Cleanup

To clean up the AWS resources created in this article, follow these steps:

  1. Delete the deployed CloudFormation stack in your workload accounts.
  2. Remove the IAM trust anchor and profile from the workload accounts.
  3. Delete the CICDRole IAM role.

Alternative options available to obtain temporary credentials in AWS for CI/CD pipelines

In addition to the IAM Roles Anywhere option presented in this blog, there are two other options to issue temporary security credentials for the external build agent:

  • Option 1 – Re-host the build agent on an Amazon Elastic Compute Cloud (Amazon EC2) instance in the AWS account and assign an IAM role. (See IAM roles for Amazon EC2). This option resolves the issue of using long-term IAM access keys to deploy self-hosted build agents on an AWS compute service (such as Amazon EC2, AWS Fargate, or Amazon Elastic Kubernetes Service (Amazon EKS)) instead of using fully-managed or on-premises agents, but it would still require using multiple agents for pipelines that need different permissions.
  • Option 2 – Some DevOps tools support the use of OpenID Connect (OIDC). OIDC is an authentication layer based on open standards that makes it simpler for a client and an identity provider to exchange information. CI/CD tools such as GitHub, GitLab, and Bitbucket provide support for OIDC, which helps you to integrate with AWS for secure deployments and resources access without having to store credentials as long-lived secrets. However, not all CI/CD pipeline tools supports OIDC.

Conclusion

In this post, we showed you how to combine IAM Roles Anywhere and an existing public key infrastructure (PKI) to authenticate external build agents to AWS by using short-lived certificates to obtain AWS temporary credentials. We presented the use of Azure Pipelines for the demonstration, but you can adapt the same steps to other CI/CD tools running on premises or in other cloud platforms. For simplicity, the certificate was manually configured in Azure DevOps to be provided to the agents. We encourage you to automate the distribution of short-lived certificates based on an integration with your PKI.

For demonstration purposes, we included the steps of generating a root certificate and manually signing the leaf certificate. For production workloads, you should have access to a private certificate authority to generate certificates for use by your external build agent. If you do not have an existing private certificate authority, consider using AWS Private Certificate Authority.

If you have feedback about this post, submit comments in the Comments section below. If you have questions about this post, start a new thread on the AWS Security, Identity, & Compliance re:Post or contact AWS Support.

Want more AWS Security news? Follow us on Twitter.

Olivier Gaumond

Olivier Gaumond

Olivier is a Senior Solutions Architect supporting public sector customers from Quebec City. His varied experience in consulting, application development, and platform implementation allow him to bring a new perspective to projects. DevSecOps, containers, and cloud native development are among his topics of interest.

Manal Taki

Manal Taki

Manal is a solutions Architect at AWS, based in Toronto. She works with public sector customers to solve business challenges to drive their mission goals by using Amazon Web Services (AWS). She’s passionate about security, and works with customers to enable security best practices to build secure environments and workloads in the cloud.

Manage your workloads better using Amazon Redshift Workload Management

Post Syndicated from Rohit Vashishtha original https://aws.amazon.com/blogs/big-data/manage-your-workloads-better-using-amazon-redshift-workload-management/

With Amazon Redshift, you can run a complex mix of workloads on your data warehouse, such as frequent data loads running alongside business-critical dashboard queries and complex transformation jobs. We also see more and more data science and machine learning (ML) workloads. Each workload type has different resource needs and different service-level agreements (SLAs).

Amazon Redshift workload management (WLM) helps you maximize query throughput and get consistent performance for the most demanding analytics workloads by optimally using the resources of your existing data warehouse.

In Amazon Redshift, you implement WLM to define the number of query queues that are available and how queries are routed to those queues for processing. WLM queues are configured based on Redshift user groups, user roles, or query groups. When users belonging to a user group or role run queries in the database, their queries are routed to a queue as depicted in the following flowchart.

Role-based access control (RBAC) is a new enhancement that helps you simplify the management of security privileges in Amazon Redshift. You can use RBAC to control end-user access to data at a broad or granular level based on their job role. We have introduced support for Redshift roles in WLM queues, you will now find User roles along with User groups and Query groups as query routing mechanism.

This post provides examples of analytics workloads for an enterprise, and shares common challenges and ways to mitigate those challenges using WLM. We guide you through common WLM patterns and how they can be associated with your data warehouse configurations. We also show how to assign user roles to WLM queues and how to use WLM query insights to optimize configuration.

Use case overview

ExampleCorp is an enterprise using Amazon Redshift to modernize its data platform and analytics. They have variety of workloads with users from various departments and personas. The service-level performance requirements vary by the nature of the workload and user personas accessing the datasets. ExampleCorp would like to manage resources and priorities on Amazon Redshift using WLM queues. For this multitenant architecture by department, ExampleCorp can achieve read/write isolation using the Amazon Redshift data sharing feature and meet its unpredictable compute scaling requirements using concurrency scaling.

The following figure illustrates the user personas and access in ExampleCorp.

ExampleCorp has multiple Redshift clusters. For this post, we focus on the following:

  • Enterprise data warehouse (EDW) platform – This has all write workloads, along with some of the applications running reads via the Redshift Data API. The enterprise standardized data from the EDW cluster is accessed by multiple consumer clusters using the Redshift data sharing feature to run downstream reports, dashboards, and other analytics workloads.
  • Marketing data mart – This has predictable extract, transform, and load (ETL) and business intelligence (BI) workloads at specific times of day. The cluster admin understands the exact resource requirements by workload type.
  • Auditor data mart – This is only used for a few hours a day to run scheduled reports.

ExampleCorp would like to better manage their workloads using WLM.

Solution overview

As we discussed in the previous section, ExampleCorp has multiple Redshift data warehouses: one enterprise data warehouse and two downstream Redshift data warehouses. Each data warehouse has different workloads, SLAs, and concurrency requirements.

A database administrator (DBA) will implement appropriate WLM strategies on each Redshift data warehouse based on their use case. For this post, we use the following examples:

  • The enterprise data warehouse demonstrates Auto WLM with query priorities
  • The marketing data mart cluster demonstrates manual WLM
  • The auditors team uses their data mart infrequently for sporadic workloads; they use Amazon Redshift Serverless, which doesn’t require workload management

The following diagram illustrates the solution architecture.

Prerequisites

Before beginning this solution, you need the following:

  • An AWS account
  • Administrative access to Amazon Redshift

Let’s start by understanding some foundational concepts before solving the problem statement for ExampleCorp. First, how to choose between auto vs. manual WLM.

Auto vs. manual WLM

Amazon Redshift WLM enables you to flexibly manage priorities within workloads to meet your SLAs. Amazon Redshift supports Auto WLM or manual WLM for your provisioned Redshift data warehouse. The following diagram illustrates queues for each option.

Auto WLM determines the amount of resources that queries need and adjusts the concurrency based on the workload. When queries requiring large amounts of resources are in the system (for example, hash joins between large tables), the concurrency is lower. For additional information, refer to Implementing automatic WLM. You should use Auto WLM when your workload is highly unpredictable.

With manual WLM, you manage query concurrency and memory allocation, as opposed to auto WLM, where it’s managed by Amazon Redshift automatically. You configure separate WLM queues for different workloads like ETL, BI, and ad hoc and customize resource allocation. For additional information, refer to Tutorial: Configuring manual workload management (WLM) queues.

Use manual when When your workload pattern is predictable or if you need to throttle certain types of queries depending on the time of day, such as throttle down ingestion during business hours. If you need to guarantee multiple workloads are able to run at the same time, you can define slots for each workload.

Now that you have chosen automatic or manual WLM, let’s explore WLM parameters and properties.

Static vs. dynamic properties

The WLM configuration for a Redshift data warehouse is set using a parameter group under the database configuration properties.

The parameter group WLM settings are either dynamic or static. You can apply dynamic properties to the database without a cluster reboot, but static properties require a cluster reboot for changes to take effect. The following table summarizes the static vs. dynamic requirements for different WLM properties.

WLM Property Automatic WLM Manual WLM
Query groups Dynamic Static
Query group wildcard Dynamic Static
User groups Dynamic Static
User group wildcard Dynamic Static
User roles Dynamic Static
User role wildcard Dynamic Static
Concurrency on main Not applicable Dynamic
Concurrency Scaling mode Dynamic Dynamic
Enable short query acceleration Not applicable Dynamic
Maximum runtime for short queries Dynamic Dynamic
Percent of memory to use Not applicable Dynamic
Timeout Not applicable Dynamic
Priority Dynamic Not applicable
Adding or removing queues Dynamic Static

Note the following:

  • The parameter group parameters and WLM switch from manual to auto or vice versa and are static properties, and therefore require a cluster reboot.
  • For the WLM properties Concurrency on main, Percentage of memory to use, and Timeout, which are dynamic for manual WLM, the change only applies to new queries submitted after the value has changed and not for currently running queries.
  • The query monitoring rules, which we discuss later in this post, are dynamic and don’t require a cluster reboot.

In the next section, we discuss the concept of service class, meaning which queue does the query get submitted to and why.

Service class

Whether you use Auto or manual WLM, the user queries submitted go to the intended WLM queue via one of the following mechanisms:

  • User_Groups – The WLM queue directly maps to Redshift groups that would appear in the pg_group table.
  • Query_Groups – Queue assignment is based on the query_group label. For example, a dashboard submitted from the same reporting user can have separate priorities by designation or department.
  • User_Roles (latest addition) – The queue is assigned based on the Redshift roles.

WLM queues from a metadata perspective are defined as service class configuration. The following table lists common service class identifiers for your reference.

ID Service class
1–4 Reserved for system use.
5 Used by the superuser queue.
6–13 Used by manual WLM queues that are defined in the WLM configuration.
14 Used by short query acceleration.
15 Reserved for maintenance activities run by Amazon Redshift.
100–107 Used by automatic WLM queue when auto_wlm is true.

The WLM queues you define based on user_groups, query_groups, or user_roles fall in service class ID 6–13 for manual WLM and service class id 100–107 for automatic WLM.

Using Query_group, you can force a query to go to service class 5 and run in the superuser queue (provided you are an authorized superuser) as shown in the following code:

set query_group to 'superuser';
analyze table_xyz;
vacuum full table_xyz;
reset query_group;

For more details on how to assign a query to a particular service class, refer to Assigning queries to queues.

The short query acceleration (SQA) queue (service class 14) prioritizes short-running queries ahead of longer-running queries. If you enable SQA, you can reduce WLM queues that are dedicated to running short queries. In addition, long-running queries don’t need to contend with short queries for slots in a queue, so you can configure your WLM queues to use fewer query slots (a term used for available concurrency). Amazon Redshift uses an ML algorithm to analyze each eligible query and predict the query’s runtime. Auto WLM dynamically assigns a value for the SQA maximum runtime based on analysis of your cluster’s workload. Alternatively, you can specify a fixed value of 1–20 seconds when using manual WLM.

SQA is enabled by default in the default parameter group and for all new parameter groups. SQA can have a maximum concurrency of six queries.

Now that you understand how queries get submitted to a service class, it’s important to understand ways to avoid runaway queries and initiate an action for an unintended event.

Query monitoring rules

You can use Amazon Redshift query monitoring rules (QMRs) to set metrics-based performance boundaries for WLM queues and specify what action to take when a query goes beyond those boundaries.

The Redshift cluster automatically collects query monitoring metrics. You can query the system view SVL_QUERY_METRICS_SUMMARY as an aid to determine threshold values for defining the QMR. Then create the QMR based on following attributes:

  • Query runtime, in seconds
  • Query return row count
  • The CPU time for a SQL statement

For a complete list of QMRs, refer to WLM query monitoring rules.

Create sample parameter groups

For our ExampleCorp use case, we demonstrate automatic and manual WLM for a provisioned Redshift data warehouse and share a serverless perspective of WLM.

The following AWS CloudFormation template provides an automated way to create sample parameter groups that you can attach to your Redshift data warehouse for workload management.

Enterprise data warehouse Redshift cluster using automatic WLM

For the EDW cluster, we use Auto WLM. To configure the service class, we look at all three options: user_roles, user_groups, and query_groups.

Here’s a glimpse of how this can be set up in WLM queues and then used in your queries.

On the Amazon Redshift console, under Configurations in the navigation pane, choose Workload Management. You can create a new parameter group or modify an existing one created by you. Select the parameter group to edit its queues. There’s always a default queue (the last one in case of multiple queues defined), which is a catch-all for queries that don’t get routed to any specific queue.

User roles in WLM

With the introduction of user roles in WLM queues, now you can manage your workload by adding different roles to different queues. This can help you prioritize the queries based on the roles a user has. When a user runs a query, WLM will check if this user’s roles were added in any workload queues and assign the query to the first matching queue. To add roles into the WLM queue, you can go to the WLM page, create or modify an existing workload queue, add a user’s roles in the queue, and select Matching wildcards to add roles that get matched as wildcards.

For more information about how to convert from groups to roles, refer to Amazon Redshift Roles (RBAC), which walks you through a stored procedure to convert groups to roles.

In the following example, we have created the WLM queue EDW_Admins, which uses edw_admin_role created in Amazon Redshift to submit the workloads in this queue. The EDW_Admins queue is created with a high priority and automatic concurrency scaling mode.

User groups

Groups are collections of users who are all granted permissions associated with the group. You can use groups to simplify permission management by granting privileges just one time. If the members of a group get added or removed, you don’t need to manage them at a user level. For example, you can create different groups for sales, administration, and support and give the users in each group the appropriate access to the data they need for their work.

You can grant or revoke permissions at the user group level, and those changes will apply to all members of the group.

ETL, data analysts, or BI or decision support systems can use user groups to better manage and isolate their workloads. For our example, ETL WLM queue queries will be run with the user group etl. The data analyst group (BI) WLM queue queries will run using the bi user group.

Choose Add queue to add a new queue that you will use for user_groups, in this case ETL. If you would like these to be matched as wildcards (strings containing those keywords), select Matching wildcards. You can customize other options like query priority and concurrency scaling, explained earlier in this post. Choose Save to complete this queue setup.

In the following example, we have created two different WLM queues for ETL and BI. The ETL queue has a high priority and concurrency scaling mode is off, whereas the BI queue has a low priority and concurrency scaling mode is off.

Use the following code to create a group with multiple users:

-- Example of create group with multiple users
create group ETL with user etl_user1, etl_user2;
Create group BI with user bi_user1, bi_user2;

Query groups

Query_Groups are labels used for queries that are run within the same session. Think of these as tags that you may want to use to identify queries for a uniquely identifiable use case. In our example use case, the data analysts or BI or decision support systems can use query_groups to better manage and isolate their workloads. For our example, weekly business reports can run with the query_group label wbr. Queries from the marketing department can be run with a query_group of marketing.

The benefit of using query_groups is that you can use it to constrain results from the STL_QUERY and STV_INFLIGHT tables and the SVL_QLOG view. You can apply a separate label to every query that you run to uniquely identify queries without having to look up their IDs.

Choose Add queue to add a new queue that you will use for query_groups, in this case wbr or weekly_business_report. If you would like these to be matched as wildcards (strings containing those keywords), select Matching wildcards. You can customize other options like query priority and concurrency scaling options as explained earlier in this post. Choose Save to save this queue setup.

Now let’s see how you can force a query to use the query_groups queue just created.

You can assign a query to a queue at runtime by assigning your query to the appropriate query group. Use the SET command to begin a query group:

SET query_group TO wbr;
-- or
SET query_group TO weekly_business_report;

Queries following the SET command would go to the WLM queue Query_Group_WBR until you either reset the query group or end your current login session. For information about setting and resetting server configuration parameter, see SET and RESET, respectively.

The query group labels that you specify must be included in the current WLM configuration; otherwise, the SET query_group command has no effect on query queues.

For more query_groups examples, refer to WLM queue assignment rules.

Marketing Redshift cluster using manual WLM

Expanding on the marketing Redshift cluster use case of ExampleCorp, this cluster serves two types of workloads:

  • Running ETL for a period of 2 hours between 7:00 AM to 9:00 AM
  • Running BI reports and dashboards for the remaining time during the day

When you have such a clarity in the workloads, and your scope of usage is customizable by design, you may want to consider using manual WLM, where you can control the memory and concurrency resource allocation. Auto WLM will still be applicable, but manual WLM can also be a choice.

Let’s set up manual WLM in this case, with two WLM queues: ETL and BI.

To best utilize the resources, we use an AWS Command Line Interface (AWS CLI) command at the start of our ETL, which will make our WLM queues ETL-friendly, providing higher concurrency to the ETL queue. At the end of our ETL, we use an AWS CLI command to change the WLM queue to have BI-friendly resource settings. Modifying the WLM queues doesn’t require a reboot of your cluster; however, modifying the parameters or parameter group does.

If you were to use Auto WLM, this could have been achieved by dynamically changing the query priority of the ETL and BI queues.

By default, when you choose Create, the WLM created will be Auto WLM. You can switch to manual WLM by choosing Switch WLM mode. After switching WLM mode, choose Edit workload queues.

This will open the Modify workload queues page, where you can create your ETL and BI WLM queues.

After you add your ETL and BI queues, choose Save. You should have configured the following:

  • An ETL queue with 60% memory allocation and query concurrency of 9
  • A BI queue with 30% memory allocation and query concurrency of 4
  • A default queue with 10% memory allocation and query concurrency of 2

Your WLM queues should appear with settings as shown in the following screenshot.

Enterprises may prefer to complete these steps in an automated way. For the marketing data mart use case, the ETL starts at 7:00 AM. An ideal start to the ETL flow would be to have a job that makes your WLM settings ETL queue friendly. Here’s how you would modify concurrency and memory (both dynamic properties in manual WLM queues) to an ETL-friendly configuration:

aws redshift --region 'us-east-1' modify-cluster-parameter-group --parameter-group-name manual-wlm-demo --parameters '{"ParameterName": "wlm_json_configuration","ParameterValue": "[{\"query_group\": [], \"user_group\": [\"etl\"],\"query_group_wild_card\": 0,\"user_group_wild_card\": 0, \"query_concurrency\": 9, \"max_execution_time\": 0, \"memory_percent_to_use\": 60, \"name\": \"ETL\" }, {\"query_group\": [], \"user_group\": [\"bi\"],\"query_group_wild_card\": 0,\"user_group_wild_card\": 0, \"query_concurrency\": 3, \"max_execution_time\": 0, \"memory_percent_to_use\": 20, \"name\": \"BI\" }, { \"query_group\": [], \"user_group\": [], \"query_group_wild_card\": 0, \"user_group_wild_card\": 0, \"query_concurrency\": 3, \"max_execution_time\": 5400000, \"memory_percent_to_use\": 20, \"name\": \"Default queue\", \"rules\": [ { \"rule_name\": \"user_query_duration_threshold\", \"predicate\": [ { \"metric_name\": \"query_execution_time\", \"operator\": \">\", \"value\": 10800 } ], \"action\": \"abort\" } ] }, { \"short_query_queue\": \"true\" } ]","Description": "ETL Start, ETL Friendly"}';

The preceding AWS CLI command programmatically sets the configuration of your WLM queues without requiring a reboot of the cluster because the queue settings changed were all dynamic settings.

For the marketing data mart use case, at 9:00 AM or when the ETL is finished, you can have a job run an AWS CLI command to modify the WLM queue resource settings to a BI-friendly configuration as shown in the following code:

aws redshift --region 'us-east-1' modify-cluster-parameter-group --parameter-group-name manual-wlm-demo --parameters '{"ParameterName": "wlm_json_configuration","ParameterValue": "[{\"query_group\": [], \"user_group\": [\"etl\"],\"query_group_wild_card\": 0,\"user_group_wild_card\": 0, \"query_concurrency\": 1, \"max_execution_time\": 0, \"memory_percent_to_use\": 5, \"name\": \"ETL\" }, {\"query_group\": [], \"user_group\": [\"bi\"],\"query_group_wild_card\": 0,\"user_group_wild_card\": 0, \"query_concurrency\": 12, \"max_execution_time\": 0, \"memory_percent_to_use\": 80, \"name\": \"BI\" }, { \"query_group\": [], \"user_group\": [], \"query_group_wild_card\": 0, \"user_group_wild_card\": 0, \"query_concurrency\": 2, \"max_execution_time\": 5400000, \"memory_percent_to_use\": 15, \"name\": \"Default queue\", \"rules\": [ { \"rule_name\": \"user_query_duration_threshold\", \"predicate\": [ { \"metric_name\": \"query_execution_time\", \"operator\": \">\", \"value\": 10800 } ], \"action\": \"abort\" } ] }, { \"short_query_queue\": \"true\" } ]","Description": "ETL End, BI Friendly"}';

Note that in regards to a manual WLM configuration, the maximum slots you can allocate to a queue is 50. However, this doesn’t mean that in an automatic WLM configuration, a Redshift cluster always runs 50 queries concurrently. This can change based on the memory needs or other types of resource allocation on the cluster. We recommend configuring your manual WLM query queues with a total of 15 or fewer query slots. For more information, see Concurrency level.

In case of WLM timeout or a QMR hop action within manual WLM, a query can attempt to hop to the next matching queue based on WLM queue assignment rules. This action in manual WLM is called query queue hopping.

Auditor Redshift data warehouse using WLM in Redshift Serverless

The auditor data warehouse workload runs on the month, and quarter end. For this periodic workload, Redshift Serverless is well suited, both from a cost and ease of administration perspective. Redshift Serverless uses ML to learn from your workload to automatically manage workload and auto scaling of compute needed for your workload.

In Redshift Serverless, you can set up usage and query limits. The query limits let you set up the QMR. You can choose Manage query limits to automatically trigger the default abort action when queries go beyond performance boundaries. For more information, refer to Query monitoring metrics for Amazon Redshift Serverless.

For other detailed limits in Redshift Serverless, refer to Configure monitoring, limits, and alarms in Amazon Redshift Serverless to keep costs predictable.

Monitor using system views for operational metrics

The system views in Amazon Redshift are used to monitor the workload performance. You can view the status of queries, queues, and service classes by using WLM-specific system tables. You can query system tables to explore the following details:

  • View which queries are being tracked and what resources are allocated by the workload manager
  • See which queue a query has been assigned to
  • View the status of a query that is currently being tracked by the workload manager

You can download the sample SQL notebook system queries. You can import this in Query Editor V2.0. The queries in the sample notebook can help you explore your workloads being managed by WLM queues.

Conclusion

In this post, we covered real-world examples for Auto WLM and manual WLM patterns. We introduced user roles assignment to WLM queues, and shared queries on system views and tables to gather operational insights on your WLM configuration. We encourage you to explore using Redshift user roles with workload management. Use the script provided on AWS re:Post to convert groups to roles, and start using user roles for your WLM queues.


About the Authors

Rohit Vashishtha is a Senior Analytics Specialist Solutions Architect at AWS based in Dallas, Texas. He has over 17 years of experience architecting, building, leading, and maintaining big data platforms. Rohit helps customers modernize their analytic workloads using the breadth of AWS services and ensures that customers get the best price/performance with utmost security and data governance.

Harshida Patel is a Principal specialist SA with AWS.

Nita Shah is an Analytics Specialist Solutions Architect at AWS based out of New York. She has been building data warehouse solutions for over 20 years and specializes in Amazon Redshift. She is focused on helping customers design and build enterprise-scale well-architected analytics and decision support platforms.

Yanzhu Ji is a Product Manager in the Amazon Redshift team. She has experience in product vision and strategy in industry-leading data products and platforms. She has outstanding skill in building substantial software products using web development, system design, database, and distributed programming techniques. In her personal life, Yanzhu likes painting, photography, and playing tennis.
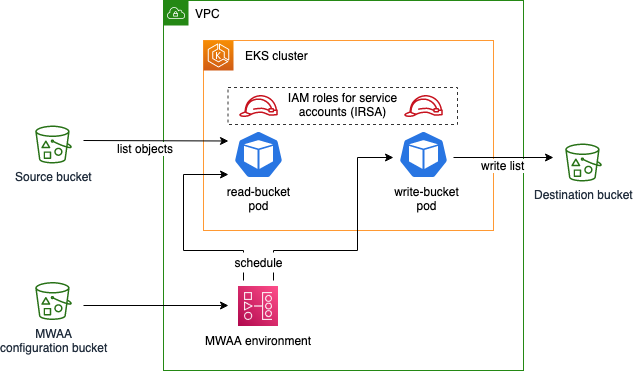
Set up fine-grained permissions for your data pipeline using MWAA and EKS

Post Syndicated from Ulrich Hinze original https://aws.amazon.com/blogs/big-data/set-up-fine-grained-permissions-for-your-data-pipeline-using-mwaa-and-eks/

This is a guest blog post co-written with Patrick Oberherr from Contentful and Johannes Günther from Netlight Consulting.

This blog post shows how to improve security in a data pipeline architecture based on Amazon Managed Workflows for Apache Airflow (Amazon MWAA) and Amazon Elastic Kubernetes Service (Amazon EKS) by setting up fine-grained permissions, using HashiCorp Terraform for infrastructure as code.

Many AWS customers use Amazon EKS to execute their data workloads. The advantages of Amazon EKS include different compute and storage options depending on workload needs, higher resource utilization by sharing underlying infrastructure, and a vibrant open-source community that provides purpose-built extensions. The Data on EKS project provides a series of templates and other resources to help customers get started on this journey. It includes a description of using Amazon MWAA as a job scheduler.

Contentful is an AWS customer and AWS Partner Network (APN) partner. Behind the scenes of their Software-as-a-Service (SaaS) product, the Contentful Composable Content Platform, Contentful uses insights from data to improve business decision-making and customer experience. Contentful engaged Netlight, an APN consulting partner, to help set up a data platform to gather these insights.

Most of Contentful’s application workloads run on Amazon EKS, and knowledge of this service and Kubernetes is widespread in the organization. That’s why Contentful’s data engineering team decided to run data pipelines on Amazon EKS as well. For job scheduling, they started with a self-operated Apache Airflow on an Amazon EKS cluster and later switched to Amazon MWAA to reduce engineering and operations overhead. The job execution remained on Amazon EKS.

Contentful runs a complex data pipeline using this infrastructure, including ingestion from multiple data sources and different transformation jobs, for example using dbt. The whole pipeline shares a single Amazon MWAA environment and a single Amazon EKS cluster. With a diverse set of workloads in a single environment, it is necessary to apply the principle of least privilege, ensuring that individual tasks or components have only the specific permissions they need to function.

By segmenting permissions according to roles and responsibilities, Contentful’s data engineering team was able to create a more robust and secure data processing environment, which is essential for maintaining the integrity and confidentiality of the data being handled.

In this blog post, we walk through setting up the infrastructure from scratch and deploying a sample application using Terraform, Contentful’s tool of choice for infrastructure as code.

Prerequisites

To follow along this blog post, you need the latest version of the following tools installed:

Overview

In this blog post, you will create a sample application with the following infrastructure:

Architecture drawing of the sample application deployed in this blog post

The sample Airflow workflow lists objects in the source bucket, temporarily stores this list using Airflow XComs, and writes the list as a file to the destination bucket. This application is executed using Amazon EKS pods, scheduled by an Amazon MWAA environment. You deploy the EKS cluster and the MWAA environment into a virtual private cloud (VPC) and apply least-privilege permissions to the EKS pods using IAM roles for service accounts. The configuration bucket for Amazon MWAA contains runtime requirements, as well as the application code specifying an Airflow Directed Acyclic Graph (DAG).

Initialize the project and create buckets

Create a file main.tf with the following content in an empty directory:

locals {
  region = "us-east-1"
}

provider "aws" {
  region = local.region
}

resource "aws_s3_bucket" "source_bucket" {
  bucket_prefix = "source"
}

resource "aws_s3_object" "dummy_object" {
  bucket  = aws_s3_bucket.source_bucket.bucket
  key     = "dummy.txt"
  content = ""
}

resource "aws_ssm_parameter" "source_bucket" {
  name  = "mwaa_source_bucket"
  type  = "SecureString"
  value = aws_s3_bucket.source_bucket.bucket
}

resource "aws_s3_bucket" "destination_bucket" {
  bucket_prefix = "destination"
  force_destroy = true
}

resource "aws_ssm_parameter" "destination_bucket" {
  name  = "mwaa_destination_bucket"
  type  = "SecureString"
  value = aws_s3_bucket.destination_bucket.bucket
}

This file defines the Terraform AWS provider as well as the source and destination bucket, whose names are exported as AWS Systems Manager parameters. It also tells Terraform to upload an empty object named dummy.txt into the source bucket, which enables the Airflow sample application we will create later to receive a result when listing bucket content.

Initialize the Terraform project and download the module dependencies by issuing the following command:

terraform init

Create the infrastructure:

terraform apply

Terraform asks you to acknowledge changes to the environment and then starts deploying resources in AWS. Upon successful deployment, you should see the following success message:

Apply complete! Resources: 5 added, 0 changed, 0 destroyed.

Create VPC

Create a new file vpc.tf in the same directory as main.tf and insert the following:

data "aws_availability_zones" "available" {}

locals {
  cidr = "10.0.0.0/16"
  azs  = slice(data.aws_availability_zones.available.names, 0, 3)
}

module "vpc" {
  name               = "data-vpc"
  source             = "terraform-aws-modules/vpc/aws"
  version            = "~> 4.0"
  cidr               = local.cidr
  azs                = local.azs
  public_subnets     = [for k, v in local.azs : cidrsubnet(local.cidr, 8, k + 48)]
  private_subnets    = [for k, v in local.azs : cidrsubnet(local.cidr, 4, k)]
  enable_nat_gateway = true
}

This file defines the VPC, a virtual network, that will later host the Amazon EKS cluster and the Amazon MWAA environment. Note that we use an existing Terraform module for this, which wraps configuration of underlying network resources like subnets, route tables, and NAT gateways.

Download the VPC module:

terraform init

Deploy the new resources:

terraform apply

Note which resources are being created. By using the VPC module in our Terraform file, much of the underlying complexity is taken away when defining our infrastructure, but it’s still useful to know what exactly is being deployed.

Note that Terraform now handles resources we defined in both files, main.tf and vpc.tf, because Terraform includes all .tf files in the current working directory.

Create the Amazon MWAA environment

Create a new file mwaa.tf and insert the following content:

locals {
  requirements_filename = "requirements.txt"
  airflow_version       = "2.6.3"
  requirements_content  = <<EOT
apache-airflow[cncf.kubernetes]==${local.airflow_version}
EOT
}

module "mwaa" {
  source = "github.com/aws-ia/terraform-aws-mwaa?ref=1066050"

  name              = "mwaa"
  airflow_version   = local.airflow_version
  environment_class = "mw1.small"

  vpc_id             = module.vpc.vpc_id
  private_subnet_ids = slice(module.vpc.private_subnets, 0, 2)

  webserver_access_mode = "PUBLIC_ONLY"

  requirements_s3_path = local.requirements_filename
}

resource "aws_s3_object" "requirements" {
  bucket  = module.mwaa.aws_s3_bucket_name
  key     = local.requirements_filename
  content = local.requirements_content

  etag = md5(local.requirements_content)
}

Like before, we use an existing module to save configuration effort for the Amazon MWAA environment. The module also creates the configuration bucket, which we use to specify the runtime dependency of the application (apache-airflow-cncf-kubernetes) in the requirements.txt file. This package, in combination with the preinstalled package apache-airflow-amazon, enables interaction with Amazon EKS.

Download the MWAA module:

terraform init

Deploy the new resources:

terraform apply

This operation takes 20–30 minutes to complete.

Create the Amazon EKS cluster

Create a file eks.tf with the following content:

module "cluster" {
  source = "github.com/aws-ia/terraform-aws-eks-blueprints?ref=8a06a6e"

  cluster_name    = "data-cluster"
  cluster_version = "1.27"

  vpc_id             = module.vpc.vpc_id
  private_subnet_ids = module.vpc.private_subnets
  enable_irsa        = true

  managed_node_groups = {
    node_group = {
      node_group_name = "node-group"
      desired_size    = 1
    }
  }
  application_teams = {
    mwaa = {}
  }

  map_roles = [{
    rolearn  = module.mwaa.mwaa_role_arn
    username = "mwaa-executor"
    groups   = []
  }]
}

data "aws_eks_cluster_auth" "this" {
  name = module.cluster.eks_cluster_id
}

provider "kubernetes" {
  host                   = module.cluster.eks_cluster_endpoint
  cluster_ca_certificate = base64decode(module.cluster.eks_cluster_certificate_authority_data)
  token                  = data.aws_eks_cluster_auth.this.token
}

resource "kubernetes_role" "mwaa_executor" {
  metadata {
    name      = "mwaa-executor"
    namespace = "mwaa"
  }

  rule {
    api_groups = [""]
    resources  = ["pods", "pods/log", "pods/exec"]
    verbs      = ["get", "list", "create", "patch", "delete"]
  }
}

resource "kubernetes_role_binding" "mwaa_executor" {
  metadata {
    name      = "mwaa-executor"
    namespace = "mwaa"
  }
  role_ref {
    api_group = "rbac.authorization.k8s.io"
    kind      = "Role"
    name      = kubernetes_role.mwaa_executor.metadata[0].name
  }
  subject {
    kind      = "User"
    name      = "mwaa-executor"
    api_group = "rbac.authorization.k8s.io"
  }
}

output "configure_kubectl" {
  description = "Configure kubectl: make sure you're logged in with the correct AWS profile and run the following command to update your kubeconfig"
  value       = "aws eks --region ${local.region} update-kubeconfig --name ${module.cluster.eks_cluster_id}"
}

To create the cluster itself, we take advantage of the Amazon EKS Blueprints for Terraform project. We also define a managed node group with one node as the target size. Note that in cases with fluctuating load, scaling your cluster with Karpenter instead of the managed node group approach shown above makes the cluster scale more flexibly. We used managed node groups primarily because of the ease of configuration.

We define the identity that the Amazon MWAA execution role assumes in Kubernetes using the map_roles variable. After configuring the Terraform Kubernetes provider, we give the Amazon MWAA execution role permissions to manage pods in the cluster.

Download the EKS Blueprints for Terraform module:

terraform init

Deploy the new resources:

terraform apply

This operation takes about 12 minutes to complete.

Create IAM roles for service accounts

Create a file roles.tf with the following content:

data "aws_iam_policy_document" "source_bucket_reader" {
  statement {
    actions   = ["s3:ListBucket"]
    resources = ["${aws_s3_bucket.source_bucket.arn}"]
  }
  statement {
    actions   = ["ssm:GetParameter"]
    resources = [aws_ssm_parameter.source_bucket.arn]
  }
}

resource "aws_iam_policy" "source_bucket_reader" {
  name   = "source_bucket_reader"
  path   = "/"
  policy = data.aws_iam_policy_document.source_bucket_reader.json
}

module "irsa_source_bucket_reader" {
  source = "github.com/aws-ia/terraform-aws-eks-blueprints//modules/irsa"

  eks_cluster_id              = module.cluster.eks_cluster_id
  eks_oidc_provider_arn       = module.cluster.eks_oidc_provider_arn
  irsa_iam_policies           = [aws_iam_policy.source_bucket_reader.arn]
  kubernetes_service_account  = "source-bucket-reader-sa"
  kubernetes_namespace        = "mwaa"
  create_kubernetes_namespace = false
}

data "aws_iam_policy_document" "destination_bucket_writer" {
  statement {
    actions   = ["s3:PutObject"]
    resources = ["${aws_s3_bucket.destination_bucket.arn}/*"]
  }
  statement {
    actions   = ["ssm:GetParameter"]
    resources = [aws_ssm_parameter.destination_bucket.arn]
  }
}

resource "aws_iam_policy" "destination_bucket_writer" {
  name   = "irsa_destination_bucket_writer"
  policy = data.aws_iam_policy_document.destination_bucket_writer.json
}

module "irsa_destination_bucket_writer" {
  source = "github.com/aws-ia/terraform-aws-eks-blueprints//modules/irsa"

  eks_cluster_id              = module.cluster.eks_cluster_id
  eks_oidc_provider_arn       = module.cluster.eks_oidc_provider_arn
  irsa_iam_policies           = [aws_iam_policy.destination_bucket_writer.arn]
  kubernetes_service_account  = "destination-bucket-writer-sa"
  kubernetes_namespace        = "mwaa"
  create_kubernetes_namespace = false
}

This file defines two Kubernetes service accounts, source-bucket-reader-sa and destination-bucket-writer-sa, and their permissions against the AWS API, using IAM roles for service accounts (IRSA). Again, we use a module from the Amazon EKS Blueprints for Terraform project to simplify IRSA configuration. Note that both roles only get the minimum permissions that they need, defined using AWS IAM policies.

Download the new module:

terraform init

Deploy the new resources:

terraform apply

Create the DAG

Create a file dag.py defining the Airflow DAG:

from datetime import datetime

from airflow import DAG
from airflow.providers.amazon.aws.operators.eks import EksPodOperator

dag = DAG(
    "dag_with_fine_grained_permissions",
    description="DAG with fine-grained permissions",
    default_args={
        "cluster_name": "data-cluster",
        "namespace": "mwaa",
        "get_logs": True,
        "is_delete_operator_pod": True,
    },
    schedule="@hourly",
    start_date=datetime(2023, 1, 1),
    catchup=False,
)

read_bucket = EksPodOperator(
    task_id="read-bucket",
    pod_name="read-bucket",
    service_account_name="source-bucket-reader-sa",
    image="amazon/aws-cli:latest",
    cmds=[
        "sh",
        "-xc",
        "aws s3api list-objects --output json --bucket $(aws ssm get-parameter --name mwaa_source_bucket --with-decryption --query 'Parameter.Value' --output text)  > /airflow/xcom/return.json",
    ],
    do_xcom_push=True,
    dag=dag,
)

write_bucket = EksPodOperator(
    task_id="write-bucket",
    pod_name="write-bucket",
    service_account_name="destination-bucket-writer-sa",
    image="amazon/aws-cli:latest",
    cmds=[
        "sh",
        "-xc",
        "echo '{{ task_instance.xcom_pull('read-bucket')|tojson }}' > list.json; aws s3 cp list.json s3://$(aws ssm get-parameter --name mwaa_destination_bucket  --with-decryption --query 'Parameter.Value' --output text)",
    ],
    dag=dag,
)

read_bucket >> write_bucket

The DAG is defined to run on an hourly schedule, with two tasks read_bucket with service account source-bucket-reader-sa and write_bucket with service account destination-bucket-writer-sa, running after one another. Both are run using the EksPodOperator, which is responsible for scheduling the tasks on Amazon EKS, using the AWS CLI Docker image to run commands. The first task lists files in the source bucket and writes the list to Airflow XCom. The second task reads the list from XCom and stores it in the destination bucket. Note that the service_account_name parameter differentiates what each task is permitted to do.

Create a file dag.tf to upload the DAG code to the Amazon MWAA configuration bucket:

locals {
  dag_filename = "dag.py"
}

resource "aws_s3_object" "dag" {
  bucket = module.mwaa.aws_s3_bucket_name
  key    = "dags/${local.dag_filename}"
  source = local.dag_filename

  etag = filemd5(local.dag_filename)
}

Deploy the changes:

terraform apply

The Amazon MWAA environment automatically imports the file from the S3 bucket.

Run the DAG

In your browser, navigate to the Amazon MWAA console and select your environment. In the top right-hand corner, select Open Airflow UI . You should see the following:

Screenshot of the MWAA user interface

To trigger the DAG, in the Actions column, select the play symbol and then select Trigger DAG. Click on the DAG name to explore the DAG run and its results.

Navigate to the Amazon S3 console and choose the bucket starting with “destination”. It should contain a file list.json recently created by the write_bucket task. Download the file to explore its content, a JSON list with a single entry.

Clean up

The resources you created in this walkthrough incur AWS costs. To delete the created resources, issue the following command:

terraform destroy

And approve the changes in the Terraform CLI dialog.

Conclusion

In this blog post, you learned how to improve the security of your data pipeline running on Amazon MWAA and Amazon EKS by narrowing the permissions of each individual task.

To dive deeper, use the working example created in this walkthrough to explore the topic further: What happens if you remove the service_account_name parameter from an Airflow task? What happens if you exchange the service account names in the two tasks?

For simplicity, in this walkthrough we used a flat file structure with Terraform and Python files inside a single directory. We did not adhere to the standard module structure proposed by Terraform, which is generally recommended. In a real-life project, splitting up the project into multiple Terraform projects or modules may also increase flexibility, speed, and independence between teams owning different parts of the infrastructure.

Lastly, make sure to study the Data on EKS documentation, which provides other valuable resources for running your data pipeline on Amazon EKS, as well as the Amazon MWAA and Apache Airflow documentation for implementing your own use cases. Specifically, have a look at this sample implementation of a Terraform module for Amazon MWAA and Amazon EKS, which contains a more mature approach to Amazon EKS configuration and node automatic scaling, as well as networking.

If you have any questions, you can start a new thread on AWS re:Post or reach out to AWS Support.


About the Authors

Ulrich Hinze is a Solutions Architect at AWS. He partners with software companies to architect and implement cloud-based solutions on AWS. Before joining AWS, he worked for AWS customers and partners in software engineering, consulting, and architecture roles for 8+ years.

Patrick Oberherr is a Staff Data Engineer at Contentful with 4+ years of working with AWS and 10+ years in the Data field. At Contentful he is responsible for infrastructure and operations of the data stack which is hosted on AWS.

Johannes Günther is a cloud & data consultant at Netlight with 5+ years of working with AWS. He has helped clients across various industries designing sustainable cloud platforms and is AWS certified.
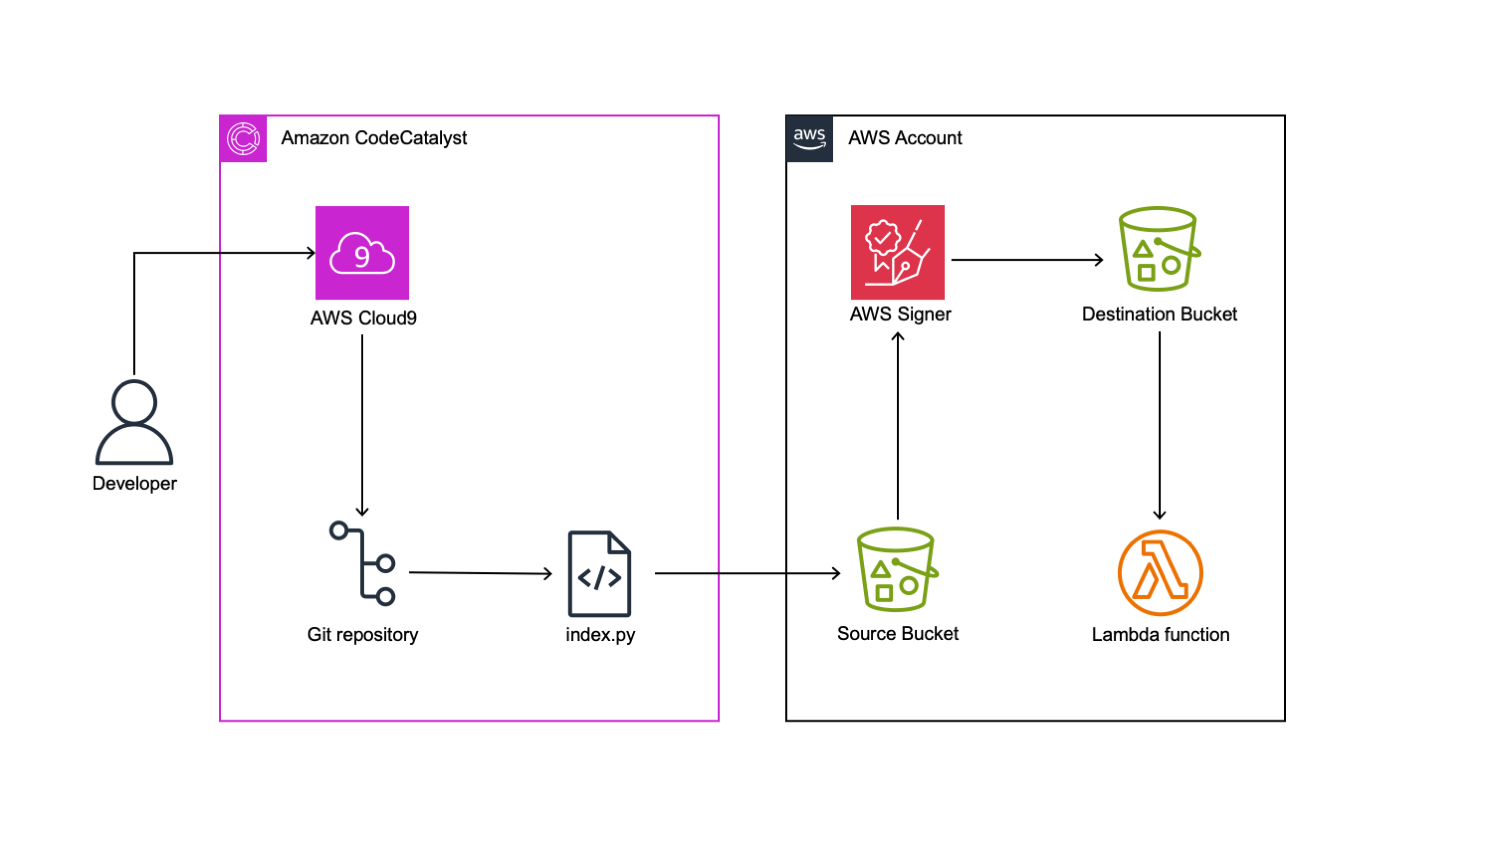
Automate Lambda code signing with Amazon CodeCatalyst and AWS Signer

Post Syndicated from Vineeth Nair original https://aws.amazon.com/blogs/devops/automate-lambda-code-signing-with-amazon-codecatalyst-and-aws-signer/

Amazon CodeCatalyst is an integrated service for software development teams adopting continuous integration and deployment practices into their software development process. CodeCatalyst puts the tools you need all in one place. You can plan work, collaborate on code build, test, and deploy applications with continuous integration/continuous delivery (CI/CD) tools. You can also integrate AWS resources with your projects by connecting your AWS accounts to your CodeCatalyst space. By managing all of the stages and aspects of your application lifecycle in one tool, you can deliver software quickly and confidently.

Introduction

In this post we will focus on how development teams can use Amazon CodeCatalyst with AWS Signer to fully manage the code signing process to ensure the trust and integrity of code assets. We will describe the process of building the AWS Lambda code using a CodeCatalyst workflow, we will then demonstrate the process of signing the code using a signer profile and deploying the signed code to our Lambda function.

In the Develop stage, the engineer commits the code to the Amazon CodeCatalyst repository using the Cloud 9 IDE. The CodeCatalyst workflow sends the index.py file from the repository and puts it into the S3 source bucket after compressing it. AWS Signer signs this content and pushes it to the S3 destination bucket. In the deploy stage, the signed zip file will be deployed into the AWS Lambda function.

Figure 1: Architecture Diagram.

Prerequisites

To follow along with the post, you will need the following items:

Walkthrough

During this tutorial, we will create a step-by-step guide to constructing a workflow utilizing CodeCatalyst. The objective is to employ the AWS Signer service to retrieve Python code from a specified source Amazon S3 bucket, compress and sign the code, and subsequently store it in a destination S3 bucket. Finally, we will utilize the signed code to deploy a secure Lambda function.

Create the base workflow

To begin we will create our workflow in the CodeCatalyst project.

Select CI/CD → Workflows → Create workflow:


Figure 2: Create workflow.

Leave the defaults for the Source Repository and Branch, select Create. We will have an empty workflow:


Figure 3: Empty workflow.

We can edit the workflow from the CodeCatalyst console, or use a Dev Environment. Initially, we will create an initial commit of this workflow file, ignore any validation errors at this stage:

In Commit workflow page, we can add the workflow file name, commit message. Repository name and Branch name can be selected from the drop-down option.
Figure 4: Commit workflow with workflow file name, message repository and branch name.

Connect to CodeCatalyst Dev Environment

We will use an AWS Cloud9 Dev Environment. Our first step is to connect to the dev environment.

Select Code → Dev Environments. If you do not already a Dev Instance you can create an instance by selecting Create Dev Environment.

My Dev Environment tab shows all Environment available.
Figure 5: Create Dev Environment.

We already have a Dev Environment, so will go ahead and select Resume Instance. A new browser tab opens for the IDE and will be available in less than one minute. Once the IDE is ready, we can go ahead and start building our workflow. First, open a terminal. You can then change into the source repository directory and pull the latest changes. In our example, our Git source repository name is lambda-signer

cd lambda-signer && git pull. We can now edit this file in our IDE.

Initially, we will create a basic Lambda code under artifacts directory:

mkdir artifacts
cat <<EOF > artifacts/index.py
def lambda_handler(event, context):
    print('Testing Lambda Code Signing using Signer') 
EOF

The previous command block creates our index.py file which will go inside the AWS Lambda function. When we testing the Lambda Function, we should see message “Testing Lambda Code Signing using Signer” in the console log.

As a next step, we will create the CDK directory and initiate it:

mkdir cdk;
cd cdk && cdk init --language python cdk

The previous command will create a directory called ‘cdk’ and then initiate cdk inside this directory. As a result, we will see another directory named ‘cdk’. We then need to update files inside this directory as per the following screenshot.

Shows the cdk directory structure. Inside this directory, there is a file called app.py. Also there is a subdirectory called cdk. Inside this subdirectory, there are 2 files named cdk_stack.py and lambda_stack.py.
Figure 6: Repository file structure.

Update the content of the files as per the code following snippets:

(Note: Update your region name by replacing the placeholder <Region Name> )

cdk_stack.py:

import os
from constructs import Construct
from aws_cdk import (
    Duration,
    Stack,
    aws_lambda as lambda_,
    aws_signer as signer,
    aws_s3 as s3,
    Aws as aws,
    CfnOutput
)


class CdkStack(Stack):

    def __init__(self, scope: Construct, construct_id: str, **kwargs) -> None:
        super().__init__(scope, construct_id, **kwargs)
        
         # Set the AWS region
        os.environ["AWS_DEFAULT_REGION"] = "<Region Name>"

        # Create the signer profile
        signer_profile_name = "my-signer-profile-" + aws.ACCOUNT_ID
        print(f"signer_profile_name: {signer_profile_name}")
        
        signing_profile = signer.SigningProfile(self, "SigningProfile",
            platform=signer.Platform.AWS_LAMBDA_SHA384_ECDSA,
            signing_profile_name='my-signer-profile' + aws.ACCOUNT_ID,
            signature_validity=Duration.days(365)
        )

        self.code_signing_config = lambda_.CodeSigningConfig(self, "CodeSigningConfig",
            signing_profiles=[signing_profile]
        )
        

        source_bucket_name = "source-signer-bucket-" + aws.ACCOUNT_ID
        source_bucket = s3.Bucket(self, "SourceBucket",
            bucket_name=source_bucket_name,
            block_public_access=s3.BlockPublicAccess.BLOCK_ALL,
            encryption=s3.BucketEncryption.S3_MANAGED,
            versioned=True
        )

        destination_bucket_name = "dest-signer-bucket-" + aws.ACCOUNT_ID
        self.destination_bucket = s3.Bucket(self, "DestinationBucket",
            bucket_name=destination_bucket_name,
            block_public_access=s3.BlockPublicAccess.BLOCK_ALL,
            encryption=s3.BucketEncryption.S3_MANAGED,
            versioned=True
        )
        resolved_signing_profile_name = self.resolve(signing_profile.signing_profile_name)

        CfnOutput(self,"signer-profile",value=signing_profile.signing_profile_name)
        CfnOutput(self,"src-bucket",value=source_bucket.bucket_name)
        CfnOutput(self,"dst-bucket",value=self.destination_bucket.bucket_name)

lambda_stack.py:

from constructs import Construct
from aws_cdk import (
    Duration,
    Stack,
    aws_lambda as lambda_,
    aws_signer as signer,
    aws_s3 as s3,
    Aws as aws,
    CfnOutput
)


class LambdaStack(Stack):

    def __init__(self, scope: Construct, construct_id: str, dst_bucket:s3.Bucket,codesigning_config: lambda_.CodeSigningConfig, **kwargs) -> None:
        super().__init__(scope, construct_id, **kwargs)
        
         # Set the AWS region
        # Get the code from action inputs
        bucket_name = self.node.try_get_context("bucket_name")
        key = self.node.try_get_context("key")

        lambda_function = lambda_.Function(
            self,
            "Function",
		 function_name=’sample-signer-function’,
            code_signing_config=codesigning_config,
            runtime=lambda_.Runtime.PYTHON_3_9,
            handler="index.Lambda_handler",
            code=lambda_.Code.from_bucket(dst_bucket, key)
        )

app.py:

#!/usr/bin/env python3

import aws_cdk as cdk

from cdk.cdk_stack import CdkStack
from cdk.lambda_stack import LambdaStack


app = cdk.App()
signer_stack = CdkStack(app, "cdk")
lambda_stack = LambdaStack(app, "LambdaStack", dst_bucket=signer_stack.destination_bucket,codesigning_config=signer_stack.code_signing_config)

app.synth()

Finally, we will work on Workflow:

In our example, our workflow is Workflow_d892. We will locate Workflow_d892.yaml in the .codecatalyst\workflows directory in our repository.


Figure 7: Workflow yaml file.

Update workflow with remaining steps

We can assign our workflow a name and configure the action. We have five stages in this workflow:

  • CDKBootstrap: Prepare AWS Account for CDK deployment.
  • CreateSignerResources: Deploys Signer resources into AWS Account
  • ZipLambdaCode: Compresses the index.py file and store it in the source S3 bucket
  • SignCode: Sign the compressed python file and push it to the destination S3 bucket
  • Createlambda: Creates the Lambda Function using the signed code from destination S3 bucket.

Please insert the following values for your environment into the workflow file. The environment configuration will be as per the pre-requisite configuration for CodeCatalyst environment setup:

  • <Name of your Environment>: The Name of your CodeCatalyst environment
  • <AWS Account>: The AWS Account connection ID
  • <Role Name>: The CodeCatalyst role that is configured for the environment

(Note: Feel free to update the region configuration to meet your deployment requirements. Supported regions are listed here)

Name: Workflow_d892
SchemaVersion: "1.0"

# Optional - Set automatic triggers.
Triggers:
  - Type: Push
    Branches:
      - main

# Required - Define action configurations.
Actions:
  CDKBootstrap:
    # Identifies the action. Do not modify this value.
    Identifier: aws/[email protected]

    # Specifies the source and/or artifacts to pass to the action as input.
    Inputs:
      # Optional
      Sources:
        - WorkflowSource # This specifies that the action requires this Workflow as a source

    # Required; You can use an environment, AWS account connection, and role to access AWS resources.
    Environment:
      Name: <Name of your Environment>
      Connections:
        - Name: <AWS Account>
          Role: <Role Name> # Defines the action's properties.
    Configuration:
      # Required; type: string; description: AWS region to bootstrap
      Region: <Region Name>
  CreateSignerResources:
    # Identifies the action. Do not modify this value.
    Identifier: aws/[email protected]
    DependsOn:
      - CDKBootstrap
      # Specifies the source and/or artifacts to pass to the action as input.
    Inputs:
      # Optional
      Sources:
        - WorkflowSource # This specifies that the action requires this Workflow as a source

    # Required; You can use an environment, AWS account connection, and role to access AWS resources.
    Environment:
      Name: <Name of your Environment>
      Connections:
        - Name: <AWS Account>
          Role: <Role Name> 
    Configuration:
      # Required; type: string; description: Name of the stack to deploy
      StackName: cdk
      CdkRootPath: cdk
      Region: <Region Name>
      CfnOutputVariables: '["signerprofile","dstbucket","srcbucket"]'
      Context: '{"key": "placeholder"}'
  ZipLambdaCode:
    Identifier: aws/build@v1
    DependsOn:
    - CreateSignerResources
    Inputs:
      Sources:
        - WorkflowSource
    Environment:
      Name: <Name of your Environment>
      Connections:
        - Name: <AWS Account>
          Role: <Role Name> 
#
    Configuration:
      Steps:
        - Run: sudo yum install zip -y
        - Run: cd artifacts && zip lambda-${WorkflowSource.CommitId}.zip index.py
        - Run: aws s3 cp lambda-${WorkflowSource.CommitId}.zip s3://${CreateSignerResources.srcbucket}/tobesigned/lambda-${WorkflowSource.CommitId}.zip
        - Run: S3VER=$(aws s3api list-object-versions --output text --bucket ${CreateSignerResources.srcbucket} --prefix 'tobesigned/lambda-${WorkflowSource.CommitId}.zip' --query 'Versions[*].VersionId')
    Outputs:
      Variables:
      - S3VER
           
  SignCode:
    Identifier: aws/build@v1
    DependsOn:
    - ZipLambdaCode
    Inputs:
      Sources:
        - WorkflowSource
    Environment:
      Name: <Name of your Environment>
      Connections:
        - Name: AWS Account>
          Role: <Role Name> #
    Configuration:
      Steps:
        - Run: export AWS_REGION=<Region Name>
        - Run: SIGNER_JOB=$(aws signer start-signing-job --source --output text --query 'jobId' 's3={bucketName=${CreateSignerResources.srcbucket},key=tobesigned/lambda-${WorkflowSource.CommitId}.zip,version=${ZipLambdaCode.S3VER}}' --destination 's3={bucketName=${CreateSignerResources.dstbucket},prefix=signed-}' --profile-name ${CreateSignerResources.signerprofile})
    Outputs:
      Variables:
        - SIGNER_JOB
  CreateLambda:
    # Identifies the action. Do not modify this value.
    Identifier: aws/[email protected]
    DependsOn:
      - SignCode
      # Specifies the source and/or artifacts to pass to the action as input.
    Inputs:
      # Optional
      Sources:
        - WorkflowSource # This specifies that the action requires this Workflow as a source

    # Required; You can use an environment, AWS account connection, and role to access AWS resources.
    Environment:
      Name: <Name of your Environment>
      Connections:
        - Name: AWS Account>
          Role: <Role Name>
            # Defines the action's properties.
    Configuration:
      # Required; type: string; description: Name of the stack to deploy
      StackName: LambdaStack
      CdkRootPath: cdk
      Region: <Region Name>
      Context: '{"key": "signed-${SignCode.SIGNER_JOB}.zip"}'

We can copy/paste this code into our workflow. To save our changes, we select File -> Save. We can then commit these to our git repository by typing the following at the terminal:

git add . && git commit -m ‘adding workflow’ && git push

The previous command will commit and push the changes that we have made to the CodeCatalyst source repository. As we have a branch trigger for main defined, this will trigger a run of the workflow. We can monitor the status of the workflow in the CodeCatalyst console by selecting CICD -> Workflows. Locate your workflow and click on Runs to view the status.

CodeCatalyst CICD pipeline stage starts with CDKBootstrap stage. Stage 2 is CreateSignerResources. Stage3 is ZipLambdaCode. Stage4 is SignCode and Final Stage is CreateLambda.
Figure 8: Successful workflow execution.

To validate that our newly created Lambda function is using AWS Signed code, we can open the AWS Console in our target region > Lambda > click on the sample-signer-function to inspect the properties.

When open the AWS Lambda function, code tab shows a text message “Your function has signed code and can’t be edited inline"
Figure 9: AWS Lambda function with signed code.

Under the Code Source configuration property, you should see an informational message advising that ‘Your function has signed cofde and can’t be edited inline’. This confirms that the Lambda function is successfully using signed code.

Cleaning up

If you have been following along with this workflow, you should delete the resources that you have deployed to avoid further chargers. In the AWS Console > CloudFormation, locate the LambdaStack, then select and click Delete to remove the stack. Complete the same steps for the CDK stack.

Conclusion

In this post, we explained how development teams can easily get started signing code with AWS Signer and deploying it to Lambda Functions using Amazon CodeCatalyst. We outlined the stages in our workflow that enabled us to achieve the end-to-end release cycle. We also demonstrated how to enhance the developer experience of integrating CodeCatalyst with our AWS Cloud9 Dev Environment and leveraging the power of AWS CDK to use familiar programming languages such as Python to define our infrastructure as code resources.

Richard Merritt

Richard Merritt is a DevOps Consultant at Amazon Web Services (AWS), Professional Services. He works with AWS customers to accelerate their journeys to the cloud by providing scalable, secure and robust DevOps solutions.

Vineeth Nair

Vineeth Nair is a DevOps Architect at Amazon Web Services (AWS), Professional Services. He collaborates closely with AWS customers to support and accelerate their journeys to the cloud and within the cloud ecosystem by building performant, resilient, scalable, secure and cost efficient solutions.


Using Amazon CodeCatalyst Blueprints to Build and Deploy a Video-On-Demand Application to AWS

Post Syndicated from Aaron Grode original https://aws.amazon.com/blogs/devops/using-amazon-codecatalyst-blueprints-to-build-and-deploy-a-video-on-demand-application-to-aws/

In this blog post, we will walk you through how to create and launch new projects in minutes using Amazon CodeCatalyst Blueprints. Blueprints automatically generate source code and a continuous integration and delivery (CI/CD) pipeline to deploy common patterns to your AWS account without requiring extensive programming knowledge. This functionality boosts productivity and lowers time to market for features. To illustrate how to use blueprints, we will walk through how to deploy a video-on-demand web service to your AWS account.

What is Amazon CodeCatalyst? It is an integrated DevOps service for software development teams adopting continuous integration and deployment practices into their software development process. CodeCatalyst provides one place where you can plan work, collaborate on code, and build, test, and deploy applications with continuous integration and continuous delivery (CI/CD) tools. You can easily integrate AWS resources with your projects by connecting your AWS accounts to your CodeCatalyst space. With all of these stages and aspects of an application’s lifecycle in one tool, you can deliver software quickly and confidently.

Prerequisites

To get started with Amazon CodeCatalyst, you need the following prerequisites. Please review them and ensure you have completed all steps before proceeding:

  1. Create an AWS Builder ID. An AWS Builder ID is a new personal profile for everyone who builds on AWS. It is used to access tools and services within AWS, such as Amazon CodeCatalyst.
  2. Join an Amazon CodeCatalyst space. To join a space, you will need to either:
    1. Create an Amazon CodeCatalyst space. If you are creating the space, you will need to specify an AWS account ID for billing and provisioning of resources. If you have not created an AWS account, follow the AWS documentation to create one.
    2. Accept an invitation to an existing space.
  3. Create an AWS Identity and Access Management (IAM) role. Amazon CodeCatalyst will need an IAM role to have permissions to deploy the infrastructure to your AWS account. Follow the documentation for steps how to create an IAM role via the Amazon CodeCatalyst console.

Create the Amazon CodeCatalyst Project

Once all of the prerequisites have been met, you can log in to your Amazon CodeCatalyst space and create a project. Once you are logged in, navigate to your projects and select “Create project” (Figure 1).

Project screen with create project button selected

Figure 1: Project screen with create project button selected

Select Start with a blueprint option and enter into the Choose a blueprint input box, “Video”. Select the Video-on-demand web service blueprint. Choosing this blueprint will open a side panel describing what the blueprint provides and an architecture diagram (Figure 2).

Create project screen with video-on-demand project selected

Figure 2: Create project screen with video-on-demand project selected

After selecting Next, you will be prompted for a project name, an AWS account ID and an IAM role to be associated with the project. Project names must be unique within your space and must be within 3-63 characters. See the official documentation for project naming requirements for more information.

Your AWS account ID and IAM role that you created as part of prerequisites should be automatically populated for you (Figure 3). If they are not present, you need to ensure you have properly linked the account and created the IAM role.

Project configurations listed. Linked AWS account ID and IAM role present

Figure 3: Project configurations listed. Linked AWS account ID and IAM role present

For this specific blueprint, there are more configuration options listed below such as: code repository name, automatic triggers of pipeline, CloudFormation stack name, deployment region and more (Figure 4). Leave all fields under Template parameters, Additional configuration, Deployment Location, and S3 Bucket for AWS CloudFormation Template as their default values.

Additional project configurations listed

Figure 4: Additional project configurations. Leaving default is fine

Once you have finished editing the configuration, choose Create project in the lower right corner. Amazon CodeCatalyst generates your project space and repository.

Walkthrough of the Project Space

Your new code repository is the first item on the overview dashboard. Select View Repository or Source Repositories (Figure 5) to navigate to the code repository for this project. If the repository details are not present on the overview page, wait for approximately 10-15 seconds and refresh the page.

Project overview screen with view repository and source repositories selected

Figure 5: Project overview screen with view repository and source repositories selected

This blueprint provides you with a functioning video-on-demand solution; however, you can modify the code for your specific use case. Blueprints are a template and give users the freedom to add custom business logic.

Adding IAM Permissions

You should have created an IAM role for Amazon CodeCatalyst workflow to use during the prerequisites section. If you have not, please refer to the prerequisites section.

This specific solution provides an IAM Policy that you can attach to your IAM role such that sufficient IAM permissions are present to deploy the solution to your AWS account. The IAM Policy is within the README.md file. Within README.md, under the connections and permissions section, copy the IAM policy and create a new policy via the AWS console. Make sure to attach this IAM policy to your existing IAM role.

CI/CD Workflows

Start the CI/CD process to deploy the video-on-demand solution to your AWS account. Choose View all from the Overview page. This can also be found by selecting CI/CD from the side menu (Figure 6).

Overview page with View All button selected

Figure 6: Overview page with View All button selected

This blueprint comes with one, default workflow called build-and-deployOSS. To build and deploy this application to your AWS account, choose Run on the workflow page (Figure 7).

build-and-deployOSS workflow with Run button selected

Figure 7: build-and-deployOSS workflow with Run button selected

Select the Runs tab or the RunID from the dialog box to view the status of the deployment (Figure 8). This pipeline is building and deploying the full application and will need approximately 10 minutes to run.

build-and-deployOSS workflow with the RunID and Runs tab selected

Figure 8: build-and-deployOSS workflow with the RunID and Runs tab selected

Configure a custom workflow

You can configure custom pipelines within CodeCatalyst. To do this, navigate to the Workflows page within Amazon CodeCatalyst and select Create Workflow (Figure 9).

Workflow page with create workflow button selected

Figure 9: Create a custom workflow

Amazon CodeCatalyst offers a variety of drag and drop solutions to building pipelines using YAML and CloudFormation. For more information on configuring custom workflows within Amazon CodeCatalyst, view the getting started with custom workflows documentation.

Check in on your Workflow

After approximately 10 minutes, the build-and-deployOSS should be complete! The status of the run is listed under Run History (Figure 10).

Run history with the job status highlighted

Figure 10: Run history with the job status highlighted

To validate a successful deployment of the blueprint, login to the AWS Console and navigate to the CloudFormation service. If the status is listed as UPDATE_COMPLETE, then the blueprint has been deployed successfully!

AWS Console showing CloudFormation template successful run

Figure 11: AWS Console showing CloudFormation template successful run

Clean up Your Environment

To avoid incurring future charges, delete the infrastructure provisioned by the Amazon CodeCatalyst workflow. This can be done by deleting the CloudFormation stack. To do this, login to your AWS account and select the CloudFormation service. Select the stack with VideoOnDemand in the title and select the delete button. This will delete the entire stack.

Conclusion

While reading this blog, you learned how to use Amazon CodeCatalyst blueprints by deploying a video-on-demand web service to your AWS account. You used the automatically generated source code and a CI/CD pipeline to deploy the solution in minutes. Now, that you are more familiar with Amazon CodeCatalyst blueprints, you can use it to deliver software quickly and confidently.

To share any feedback on your experience with Amazon CodeCatalyst, please visit the Amazon CodeCatalyst feedback page.

Aliya Shaikh

Aliya Shaikh is an Associate Cloud Application Developer at Amazon Web Services (AWS), Professional Services. She has been with AWS for 10 months and has been focused on Serverless and cloud-native solutions. In her role, Aliya collaborates closely with AWS customers to support and accelerate their journeys to the cloud and within the cloud ecosystem by building performant, resilient, scalable, secure and cost efficient solutions.

Aaron Grode

Aaron Grode is an Associate Cloud Application Developer at Amazon Web Services. He specializes in microservices and serverless architectures. Aaron enjoys assisting customers with cloud migrations, ensuring their transition to the cloud is seamless and successful, while continually delivering innovative solutions.

Stitch Fix seamless migration: Transitioning from self-managed Kafka to Amazon MSK

Post Syndicated from Karthik Kondamudi original https://aws.amazon.com/blogs/big-data/stitch-fix-seamless-migration-transitioning-from-self-managed-kafka-to-amazon-msk/

This post is co-written with Karthik Kondamudi and Jenny Thompson from Stitch Fix.

Stitch Fix is a personalized clothing styling service for men, women, and kids. At Stitch Fix, we have been powered by data science since its foundation and rely on many modern data lake and data processing technologies. In our infrastructure, Apache Kafka has emerged as a powerful tool for managing event streams and facilitating real-time data processing. At Stitch Fix, we have used Kafka extensively as part of our data infrastructure to support various needs across the business for over six years. Kafka plays a central role in the Stitch Fix efforts to overhaul its event delivery infrastructure and build a self-service data integration platform.

If you’d like to know more background about how we use Kafka at Stitch Fix, please refer to our previously published blog post, Putting the Power of Kafka into the Hands of Data Scientists. This post includes much more information on business use cases, architecture diagrams, and technical infrastructure.

In this post, we will describe how and why we decided to migrate from self-managed Kafka to Amazon Managed Streaming for Apache Kafka (Amazon MSK). We’ll start with an overview of our self-managed Kafka, why we chose to migrate to Amazon MSK, and ultimately how we did it.

  1. Kafka clusters overview
  2. Why migrate to Amazon MSK
  3. How we migrated to Amazon MSK
  4. Navigating challenges and lessons learned
  5. Conclusion

Kafka Clusters Overview

At Stitch Fix, we rely on several different Kafka clusters dedicated to specific purposes. This allows us to scale these clusters independently and apply more stringent SLAs and message delivery guarantees per cluster. This also reduces overall risk by minimizing the impact of changes and upgrades and allows us to isolate and fix any issues that occur within a single cluster.

Our main Kafka cluster serves as the backbone of our data infrastructure. It handles a multitude of critical functions, including managing business events, facilitating microservice communication, supporting feature generation for machine learning workflows, and much more. The stability, reliability, and performance of this cluster are of utmost importance to our operations.

Our logging cluster plays a vital role in our data infrastructure. It serves as a centralized repository for various application logs, including web server logs and Nginx server logs. These logs provide valuable insights for monitoring and troubleshooting purposes. The logging cluster ensures smooth operations and efficient analysis of log data.

Why migrate to Amazon MSK

In the past six years, our data infrastructure team has diligently managed our Kafka clusters. While our team has acquired extensive knowledge in maintaining Kafka, we have also faced challenges such as rolling deployments for version upgrades, applying OS patches, and the overall operational overhead.

At Stitch Fix, our engineers thrive on creating new features and expanding our service offerings to delight our customers. However, we recognized that allocating significant resources to Kafka maintenance was taking away precious time from innovation. To overcome this challenge, we set out to find a managed service provider that could handle maintenance tasks like upgrades and patching while granting us complete control over cluster operations, including partition management and rebalancing. We also sought an effortless scaling solution for storage volumes, keeping our costs in check while being ready to accommodate future growth.

After thorough evaluation of multiple options, we found the perfect match in Amazon MSK because it allows us to offload cluster maintenance to the highly skilled Amazon engineers. With Amazon MSK in place, our teams can now focus their energy on developing innovative applications unique and valuable to Stitch Fix, instead of getting caught up in Kafka administration tasks.

Amazon MSK streamlines the process, eliminating the need for manual configurations, additional software installations, and worries about scaling. It simply works, enabling us to concentrate on delivering exceptional value to our cherished customers.

How we migrated to Amazon MSK

While planning our migration, we desired to switch specific services to Amazon MSK individually with no downtime, ensuring that only a specific subset of services would be migrated at a time. The overall infrastructure would run in a hybrid environment where some services connect to Amazon MSK and others to the existing Kafka infrastructure.

We decided to start the migration with our less critical logging cluster first and then proceed to migrating the main cluster. Although the logs are essential for monitoring and troubleshooting purposes, they hold relatively less significance to the core business operations. Additionally, the number and types of consumers and producers for the logging cluster is smaller, making it an easier choice to start with. Then, we were able to apply our learnings from the logging cluster migration to the main cluster. This deliberate choice enabled us to execute the migration process in a controlled manner, minimizing any potential disruptions to our critical systems.

Over the years, our experienced data infrastructure team has employed Apache Kafka MirrorMaker 2 (MM2) to replicate data between different Kafka clusters. Currently, we rely on MM2 to replicate data from two different production Kafka clusters. Given its proven track record within our organization, we decided to use MM2 as the primary tool for our data migration process.

The general guidance for MM2 is as follows:

  1. Begin with less critical applications.
  2. Perform active migrations.
  3. Familiarize yourself with key best practices for MM2.
  4. Implement monitoring to validate the migration.
  5. Accumulate essential insights for migrating other applications.

MM2 offers flexible deployment options, allowing it to function as a standalone cluster or be embedded within an existing Kafka Connect cluster. For our migration project, we deployed a dedicated Kafka Connect cluster operating in distributed mode.

This setup provided the scalability we needed, allowing us to easily expand the standalone cluster if necessary. Depending on specific use cases such as geoproximity, high availability (HA), or migrations, MM2 can be configured for active-active replication, active-passive replication, or both. In our case, as we migrated from self-managed Kafka to Amazon MSK, we opted for an active-passive configuration, where MirrorMaker was used for migration purposes and subsequently taken offline upon completion.

MirrorMaker configuration and replication policy

By default, MirrorMaker renames replication topics by prefixing the name of the source Kafka cluster to the destination cluster. For instance, if we replicate topic A from the source cluster “existing” to the new cluster “newkafka,” the replicated topic would be named “existing.A” in “newkafka.” However, this default behavior can be modified to maintain consistent topic names within the newly created MSK cluster.

To maintain consistent topic names in the newly created MSK cluster and avoid downstream issues, we utilized the CustomReplicationPolicy jar provided by AWS. This jar, included in our MirrorMaker setup, allowed us to replicate topics with identical names in the MSK cluster. Additionally, we utilized MirrorCheckpointConnector to synchronize consumer offsets from the source cluster to the target cluster and MirrorHeartbeatConnector to ensure connectivity between the clusters.

Monitoring and metrics

MirrorMaker comes equipped with built-in metrics to monitor replication lag and other essential parameters. We integrated these metrics into our MirrorMaker setup, exporting them to Grafana for visualization. Since we have been using Grafana to monitor other systems, we decided to use it during migration as well. This enabled us to closely monitor the replication status during the migration process. The specific metrics we monitored will be described in more detail below.

Additionally, we monitored the MirrorCheckpointConnector included with MirrorMaker, as it periodically emits checkpoints in the destination cluster. These checkpoints contained offsets for each consumer group in the source cluster, ensuring seamless synchronization between the clusters.

Network layout

At Stitch Fix, we use several virtual private clouds (VPCs) through Amazon Virtual Private Cloud (Amazon VPC) for environment isolation in each of our AWS accounts. We have been using separate production and staging VPCs since we initially started using AWS. When necessary, peering of VPCs across accounts is handled through AWS Transit Gateway. To maintain the strong isolation between environments we have been using all along, we created separate MSK clusters in their respective VPCs for production and staging environments.

Side note: It will be easier now to quickly connect Kafka clients hosted in different virtual private clouds with recently announced Amazon MSK multi-VPC private connectivity, which was not available at the time of our migration.

Migration steps: High-level overview

In this section, we outline the high-level sequence of events for the migration process.

Kafka Connect setup and MM2 deploy

First, we deployed a new Kafka Connect cluster on an Amazon Elastic Compute Cloud (Amazon EC2) cluster as an intermediary between the existing Kafka cluster and the new MSK cluster. Next, we deployed the 3 MirrorMaker connectors to this Kafka Connect cluster. Initially, this cluster was configured to mirror all the existing topics and their configurations into the destination MSK cluster. (We eventually changed this configuration to be more granular, as described in the “Navigating challenges and lessons learned” section below.)

Monitor replication progress with MM metrics

Take advantage of the JMX metrics offered by MirrorMaker to monitor the progress of data replication. In addition to comprehensive metrics, we primarily focused on key metrics, namely replication-latency-ms and checkpoint-latency-ms. These metrics provide invaluable insights into the replication status, including crucial aspects such as replication lag and checkpoint latency. By seamlessly exporting these metrics to Grafana, you gain the ability to visualize and closely track the progress of replication, ensuring the successful reproduction of both historical and new data by MirrorMaker.

Evaluate usage metrics and provisioning

Analyze the usage metrics of the new MSK cluster to ensure proper provisioning. Consider factors such as storage, throughput, and performance. If required, resize the cluster to meet the observed usage patterns. While resizing may introduce additional time to the migration process, it is a cost-effective measure in the long run.

Sync consumer offsets between source and target clusters

Ensure that consumer offsets are synchronized between the source in-house clusters and the target MSK clusters. Once the consumer offsets are in sync, redirect the consumers of the existing in-house clusters to consume data from the new MSK cluster. This step ensures a seamless transition for consumers and allows uninterrupted data flow during the migration.

Update producer applications

After confirming that all consumers are successfully consuming data from the new MSK cluster, update the producer applications to write data directly to the new cluster. This final step completes the migration process, ensuring that all data is now being written to the new MSK cluster and taking full advantage of its capabilities.

Navigating challenges and lessons learned

During our migration, we encountered three challenges that required careful attention: scalable storage, more granular configuration of replication configuration, and memory allocation.

Initially, we faced issues with auto scaling Amazon MSK storage. We learned storage auto scaling requires a 24-hour cool-off period before another scaling event can occur. We observed this when migrating the logging cluster, and we applied our learnings from this and factored in the cool-off period during production cluster migration.

Additionally, to optimize MirrorMaker replication speed, we updated the original configuration to divide the replication jobs into batches based on volume and allocated more tasks to high-volume topics.

During the initial phase, we initiated replication using a single connector to transfer all topics from the source to target clusters, encompassing a significant number of tasks. However, we encountered challenges such as increasing replication lag for high-volume topics and slower replication for specific topics. Upon careful examination of the metrics, we adopted an alternative approach by segregating high-volume topics into multiple connectors. In essence, we divided the topics into categories of high, medium, and low volumes, assigning them to respective connectors and adjusting the number of tasks based on replication latency. This strategic adjustment yielded positive outcomes, allowing us to achieve faster and more efficient data replication across the board.

Lastly, we encountered Java virtual machine heap memory exhaustion, resulting in missing metrics while running MirrorMaker replication. To address this, we increased memory allocation and restarted the MirrorMaker process.

Conclusion

Stitch Fix’s migration from self-managed Kafka to Amazon MSK has allowed us to shift our focus from maintenance tasks to delivering value for our customers. It has reduced our infrastructure costs by 40 percent and given us the confidence that we can easily scale the clusters in the future if needed. By strategically planning the migration and using Apache Kafka MirrorMaker, we achieved a seamless transition while ensuring high availability. The integration of monitoring and metrics provided valuable insights during the migration process, and Stitch Fix successfully navigated challenges along the way. The migration to Amazon MSK has empowered Stitch Fix to maximize the capabilities of Kafka while benefiting from the expertise of Amazon engineers, setting the stage for continued growth and innovation.

Further reading


About the Authors

Karthik Kondamudi is an Engineering Manager in the Data and ML Platform Group at StitchFix. His interests lie in Distributed Systems and large-scale data processing. Beyond work, he enjoys spending time with family and hiking. A dog lover, he’s also passionate about sports, particularly cricket, tennis, and football.

Jenny Thompson is a Data Platform Engineer at Stitch Fix. She works on a variety of systems for Data Scientists, and enjoys making things clean, simple, and easy to use. She also likes making pancakes and Pavlova, browsing for furniture on Craigslist, and getting rained on during picnics.

Rahul Nammireddy is a Senior Solutions Architect at AWS, focusses on guiding digital native customers through their cloud native transformation. With a passion for AI/ML technologies, he works with customers in industries such as retail and telecom, helping them innovate at a rapid pace. Throughout his 23+ years career, Rahul has held key technical leadership roles in a diverse range of companies, from startups to publicly listed organizations, showcasing his expertise as a builder and driving innovation. In his spare time, he enjoys watching football and playing cricket.

Todd McGrath is a data streaming specialist at Amazon Web Services where he advises customers on their streaming strategies, integration, architecture, and solutions. On the personal side, he enjoys watching and supporting his 3 teenagers in their preferred activities as well as following his own pursuits such as fishing, pickleball, ice hockey, and happy hour with friends and family on pontoon boats. Connect with him on LinkedIn.