Post Syndicated from Channy Yun original https://aws.amazon.com/blogs/aws/aws-iot-fleetwise-now-generally-available-easily-collect-vehicle-data-and-send-to-the-cloud/
Today we announce the general availability of AWS IoT FleetWise, a fully managed AWS service that makes it easier to collect, transform, and transfer vehicle data to the cloud. Last AWS re:Invent 2021, we previewed AWS IoT FleetWise, heard customer feedback, and improved features for various use cases of near-real-time vehicle data processing.
With AWS IoT FleetWise, automakers, fleet operators, and automotive suppliers can take the complex variability out of collecting data from vehicle fleets at scale. You can access standardized fleet-wide vehicle data and avoid developing custom data collection systems, or you can integrate AWS IoT FleetWise to enhance your existing systems. AWS IoT FleetWise enables intelligent data collection that sends the exact data you need from the vehicle to the cloud. You can use the data to analyze vehicle fleet health to more quickly identify potential maintenance issues or make in-vehicle infotainment systems smarter. Furthermore, you can use it to train machine learning (ML) models that improve autonomous driving and advanced driver assistance systems (ADAS).
For example, electric vehicle (EV) battery temperature is a critical metric that should be continuously analyzed for the entire vehicle fleet. In order to avoid costly continuous data ingestion, you may want to optimize the data collection by setting a threshold on EV battery temperature. The results of this analysis would be provided to the automaker’s quality engineering department, enabling fast assessment of the criticality and possible root causes of any issues identified at certain temperatures. Based on the root cause analysis, the automaker can then take short-term actions to support the driver affected by the issue, as well as midterm actions to improve vehicle quality.
How AWS IoT FleetWise Works
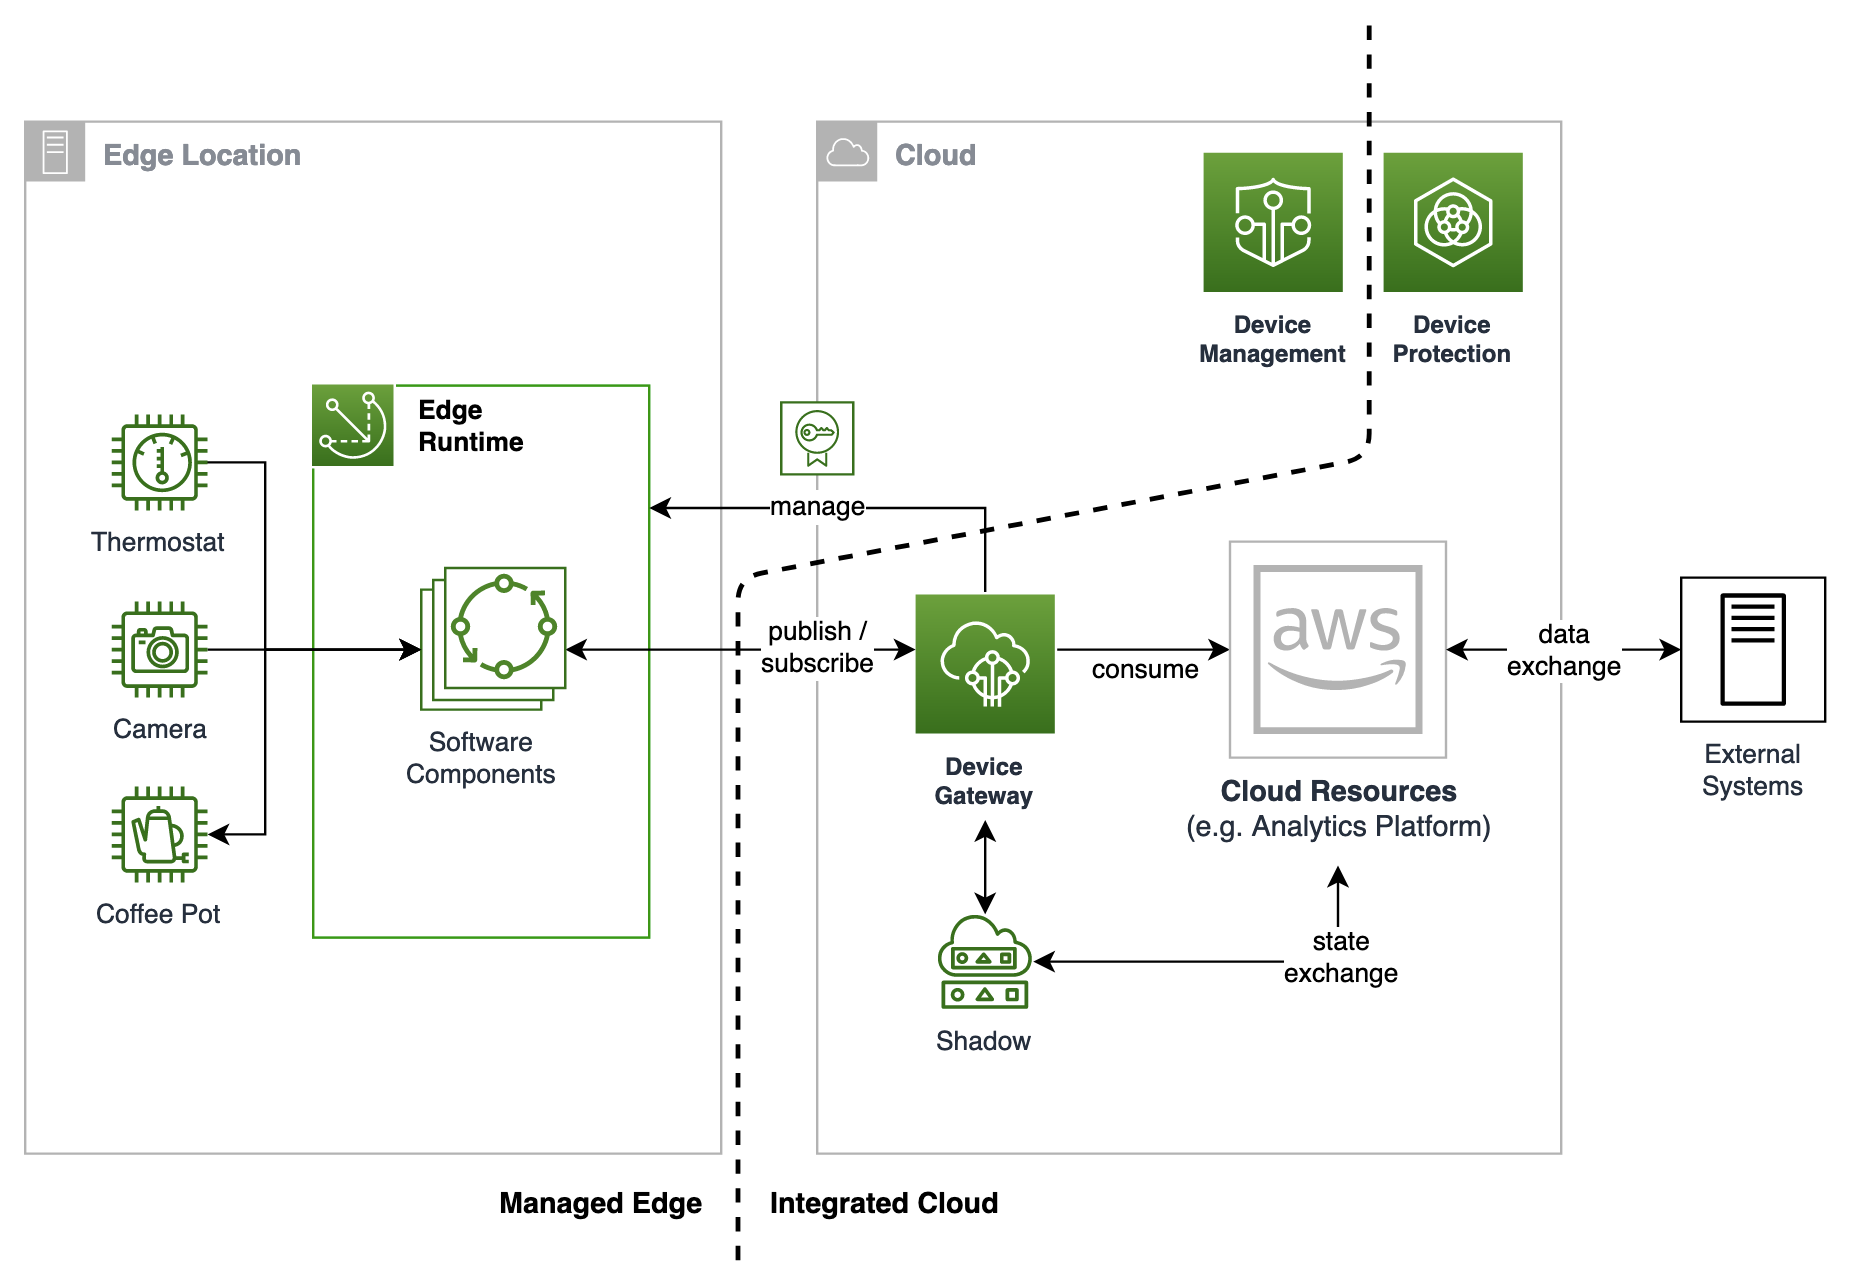
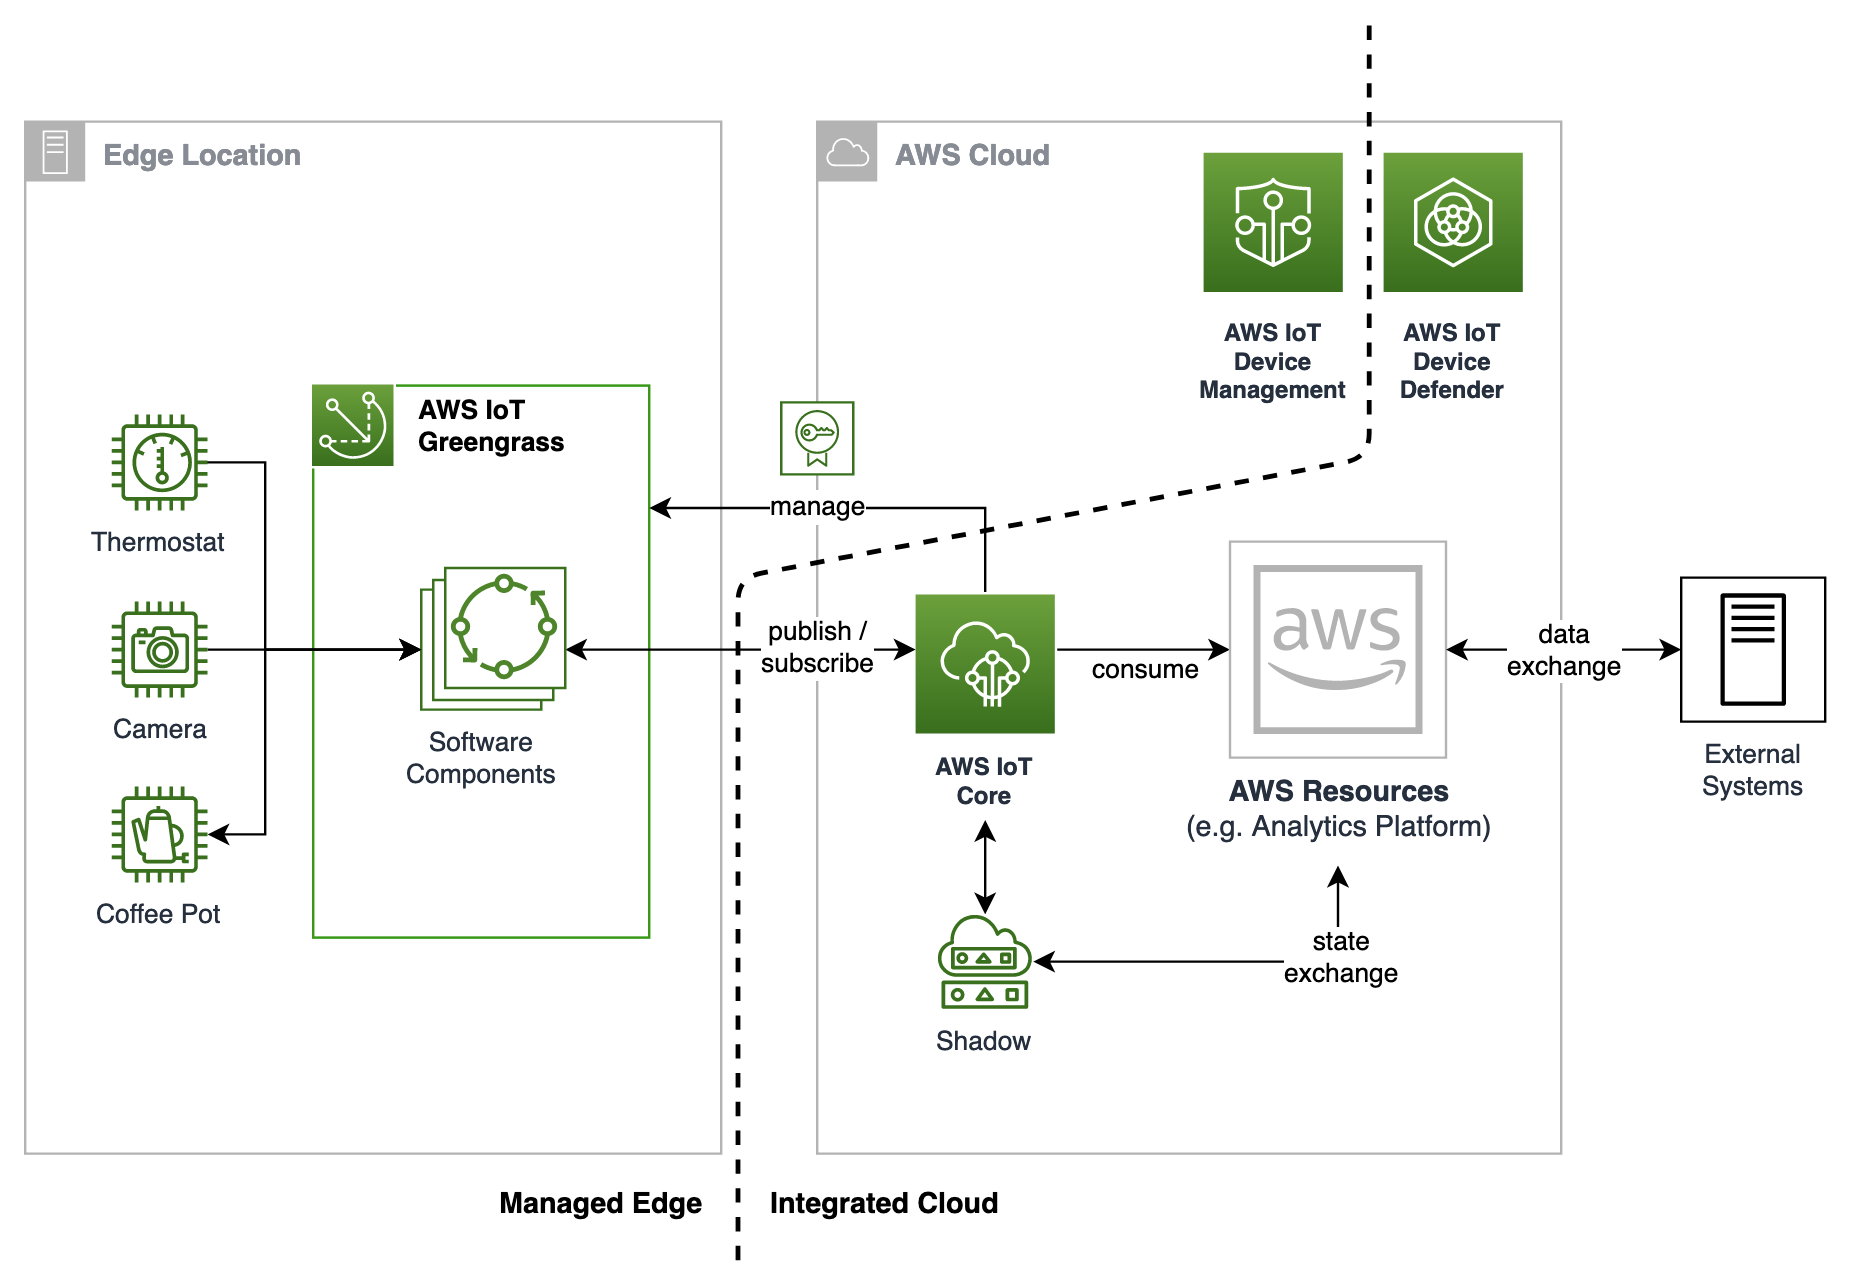
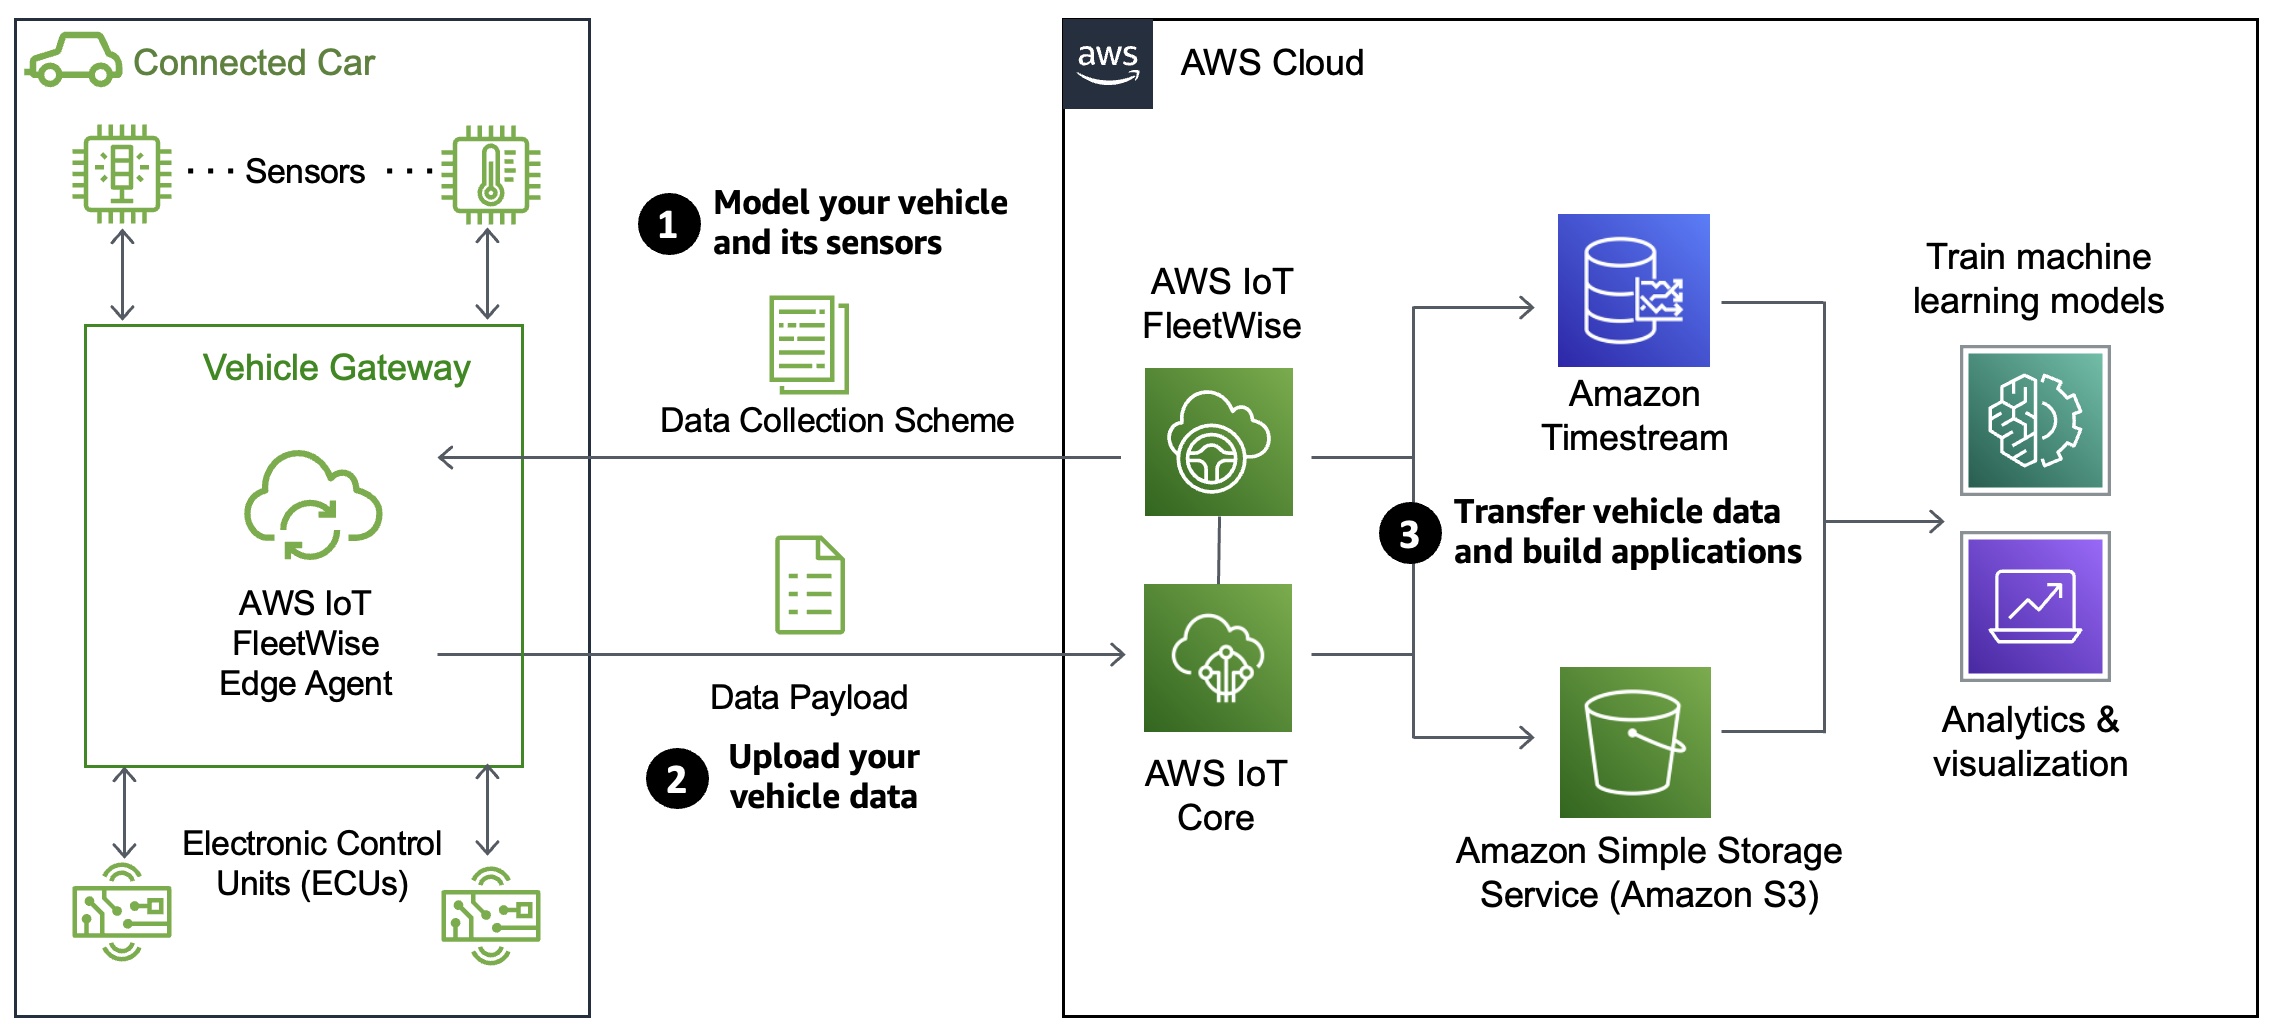
AWS IoT FleetWise provides a vehicle modeling framework that you can use to model your vehicle and its sensors and actuators in the cloud. To enable secure communication between your vehicle and the cloud, AWS IoT FleetWise also provides the AWS IoT FleetWise Edge Agent application that you can use to download and install in-vehicle electronic control units (ECUs) such as the gateway, in-vehicle infotainment controller, etc. You define data collection schemes in the cloud and deploy them to your vehicle.

The AWS IoT FleetWise Edge Agent running in your vehicle uses data collection schemes to control what data to collect and when to transfer it to the cloud. Data collected and ingested through AWS IoT FleetWise Edge Agent software goes directly into your Amazon Timestream table or Amazon Simple Storage Service (Amazon S3) repositories via AWS IoT Core.
AWS IoT FleetWise Features
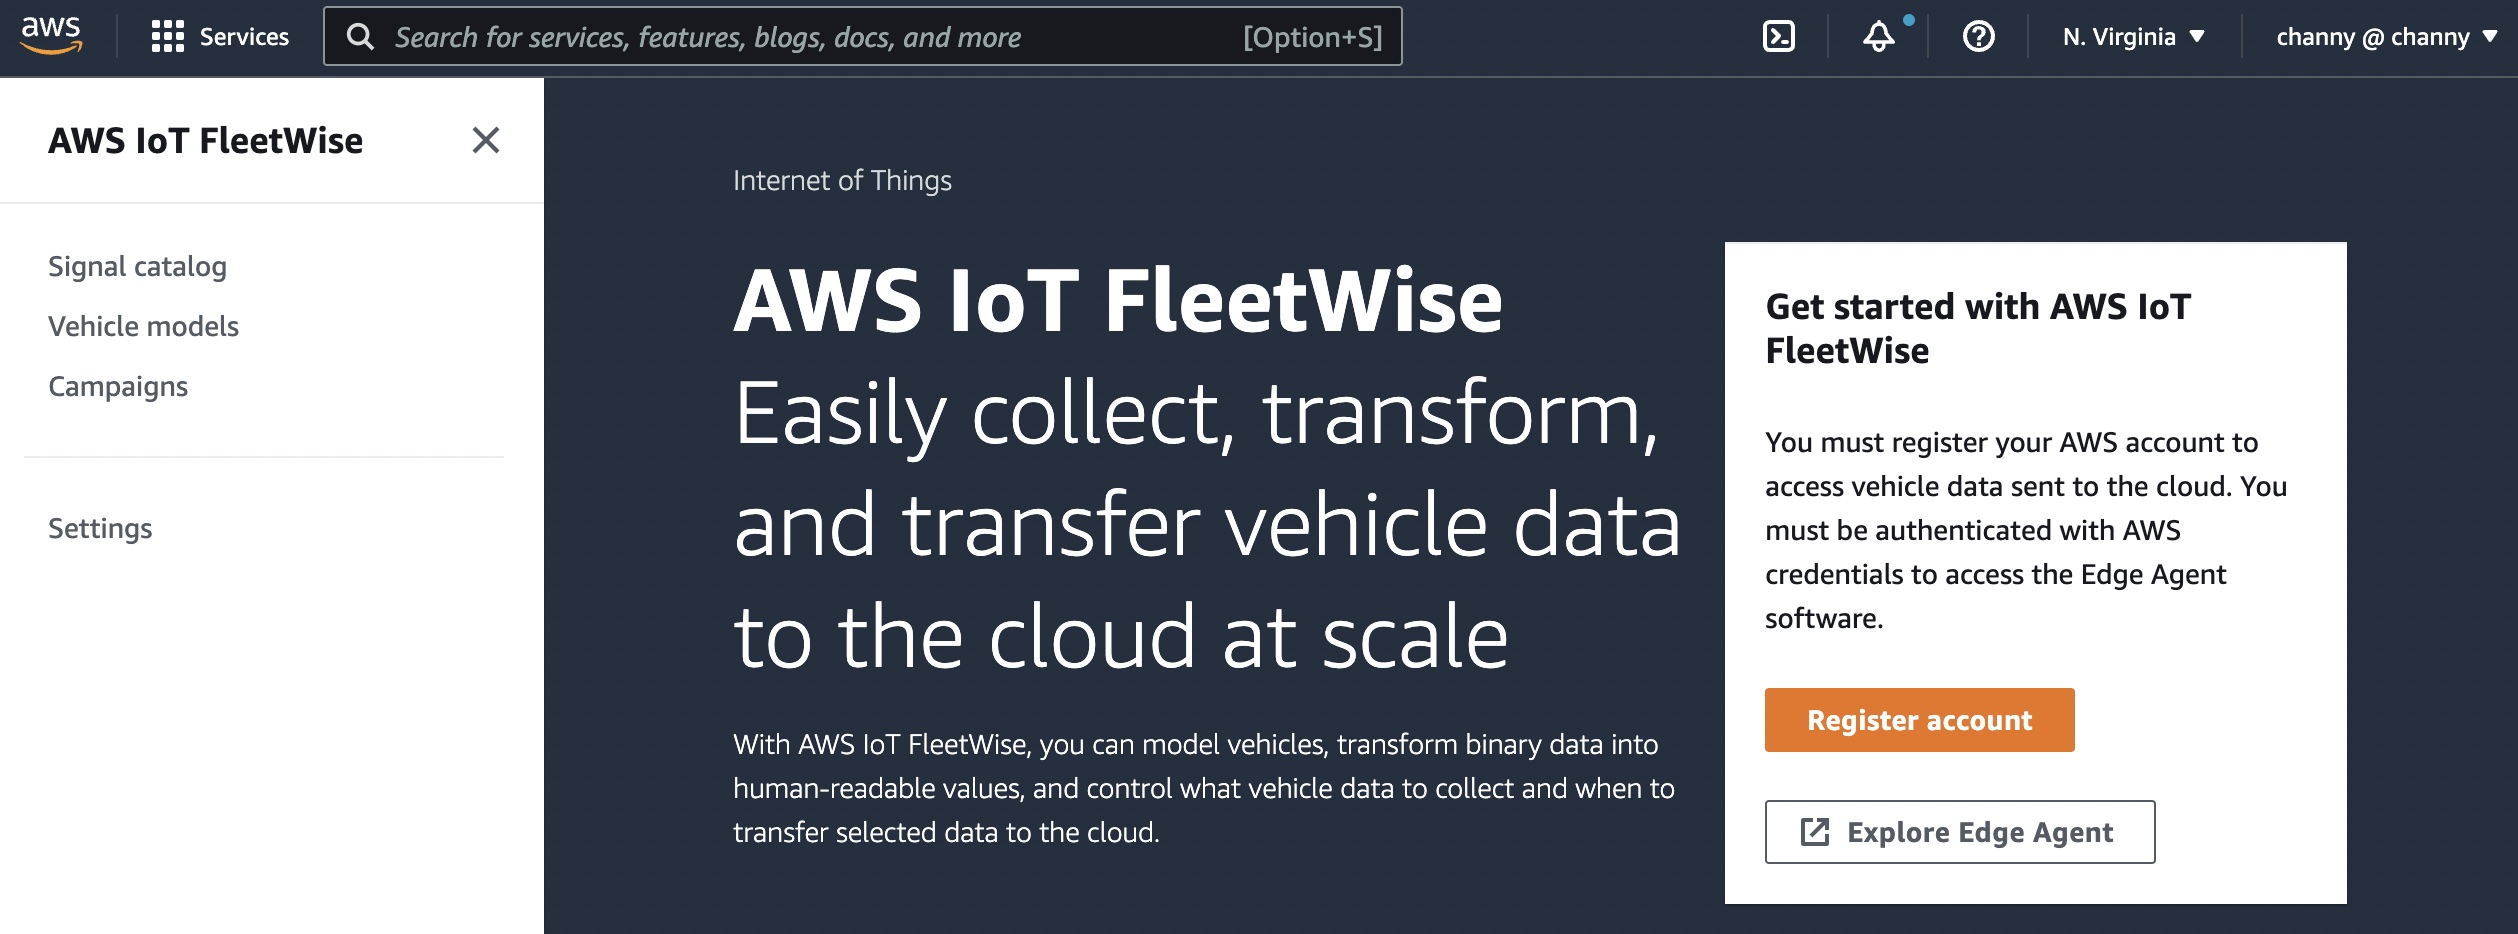
To get started with AWS IoT FleetWise, you can register your account and configure the settings via the AWS console. AWS IoT FleetWise automatically registers your AWS account, IAM role, and Amazon Timestream resources.
The Edge Agent software is a C++ application distributed as source code and is available on GitHub to collect, decode, normalize, cache, and ingest vehicle data to AWS. It supports multiple deployment options, such as vehicle gateways, infotainment systems, telematics control units (TCUs), or aftermarket devices. When vehicles are connected to the cloud, the Edge Agent continually receives data collection schemes and collects, decodes, normalizes and ingests the transformed vehicle data to AWS.

Let’s see the benefits and features of AWS IoT FleetWise:
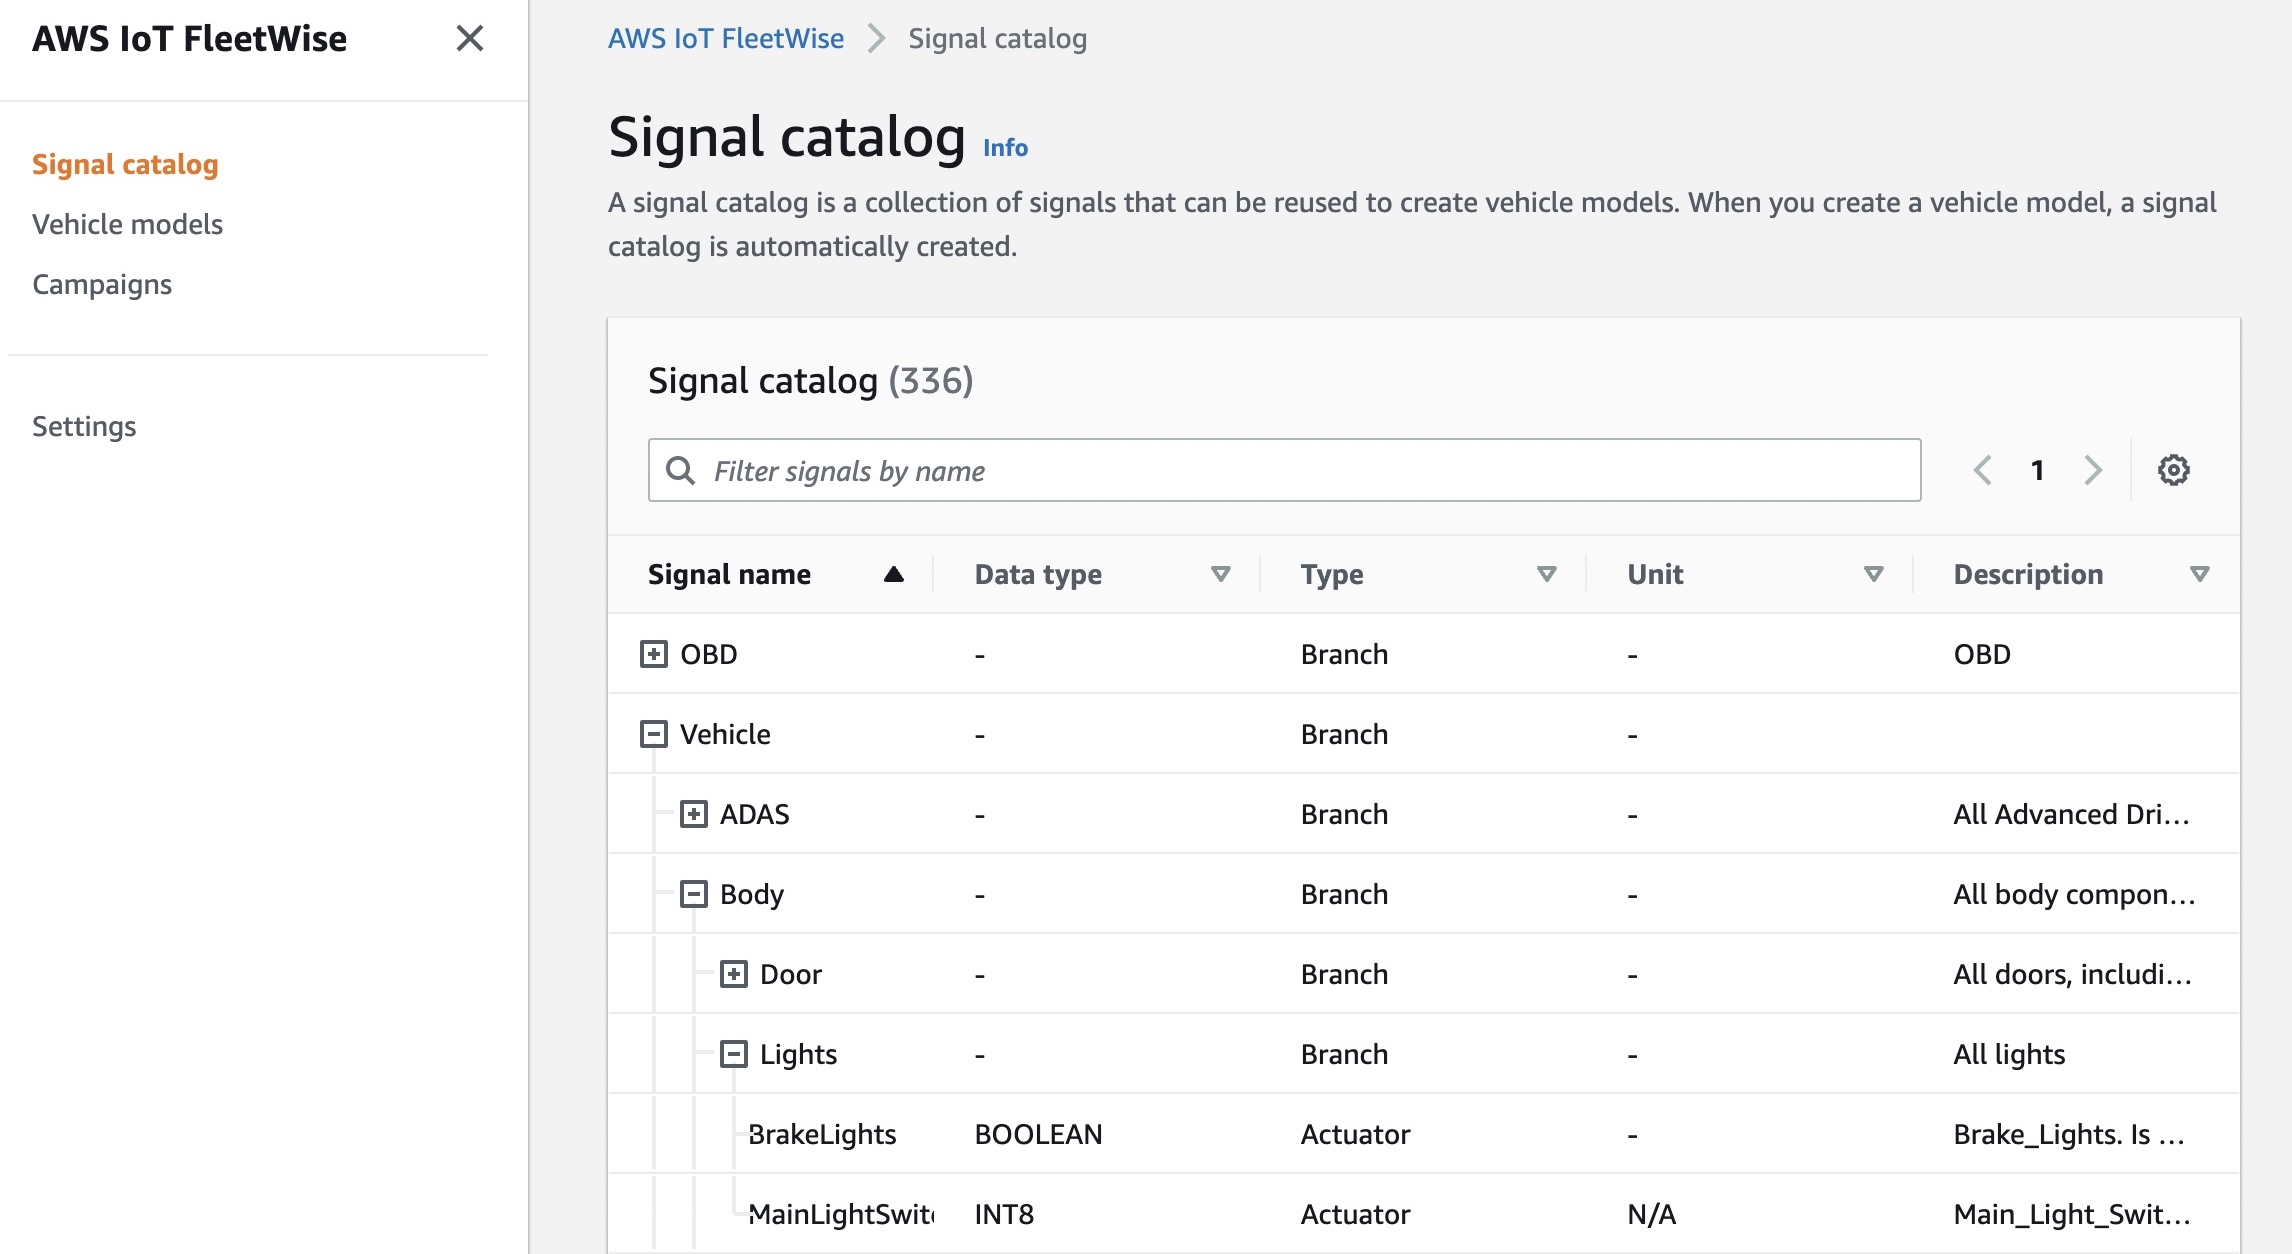
Signal catalog
A signal catalog contains a collection of vehicle signals. Signals are fundamental structures that you define to contain vehicle data and its metadata. A signal can be a sensor and its status, an attribute as static information of the manufacturer, a branch to represent a nested structure such as Vehicle.Powertrain.combustionEngine expression, or an actuator such as the state of a vehicle device. For example, you can create a sensor to receive in-vehicle temperature values and store its metadata, including a sensor name, a data type, and a unit.

Signals in a signal catalog can be used to model vehicles that use different protocols and data formats. For example, there are two cars made by different automakers: one uses the Controller Area Network (CAN) to transmit the in-vehicle temperature data and the other uses On-board Diagnostic (OBD) protocol.
You can define a sensor in the signal catalog to receive in-vehicle temperature values. This sensor can be used to represent the thermocouples in both cars, irrespective of how this temperature data is available within the vehicle networks. For more information, see Create and manage signal catalogs in the AWS documentation.
Vehicle models
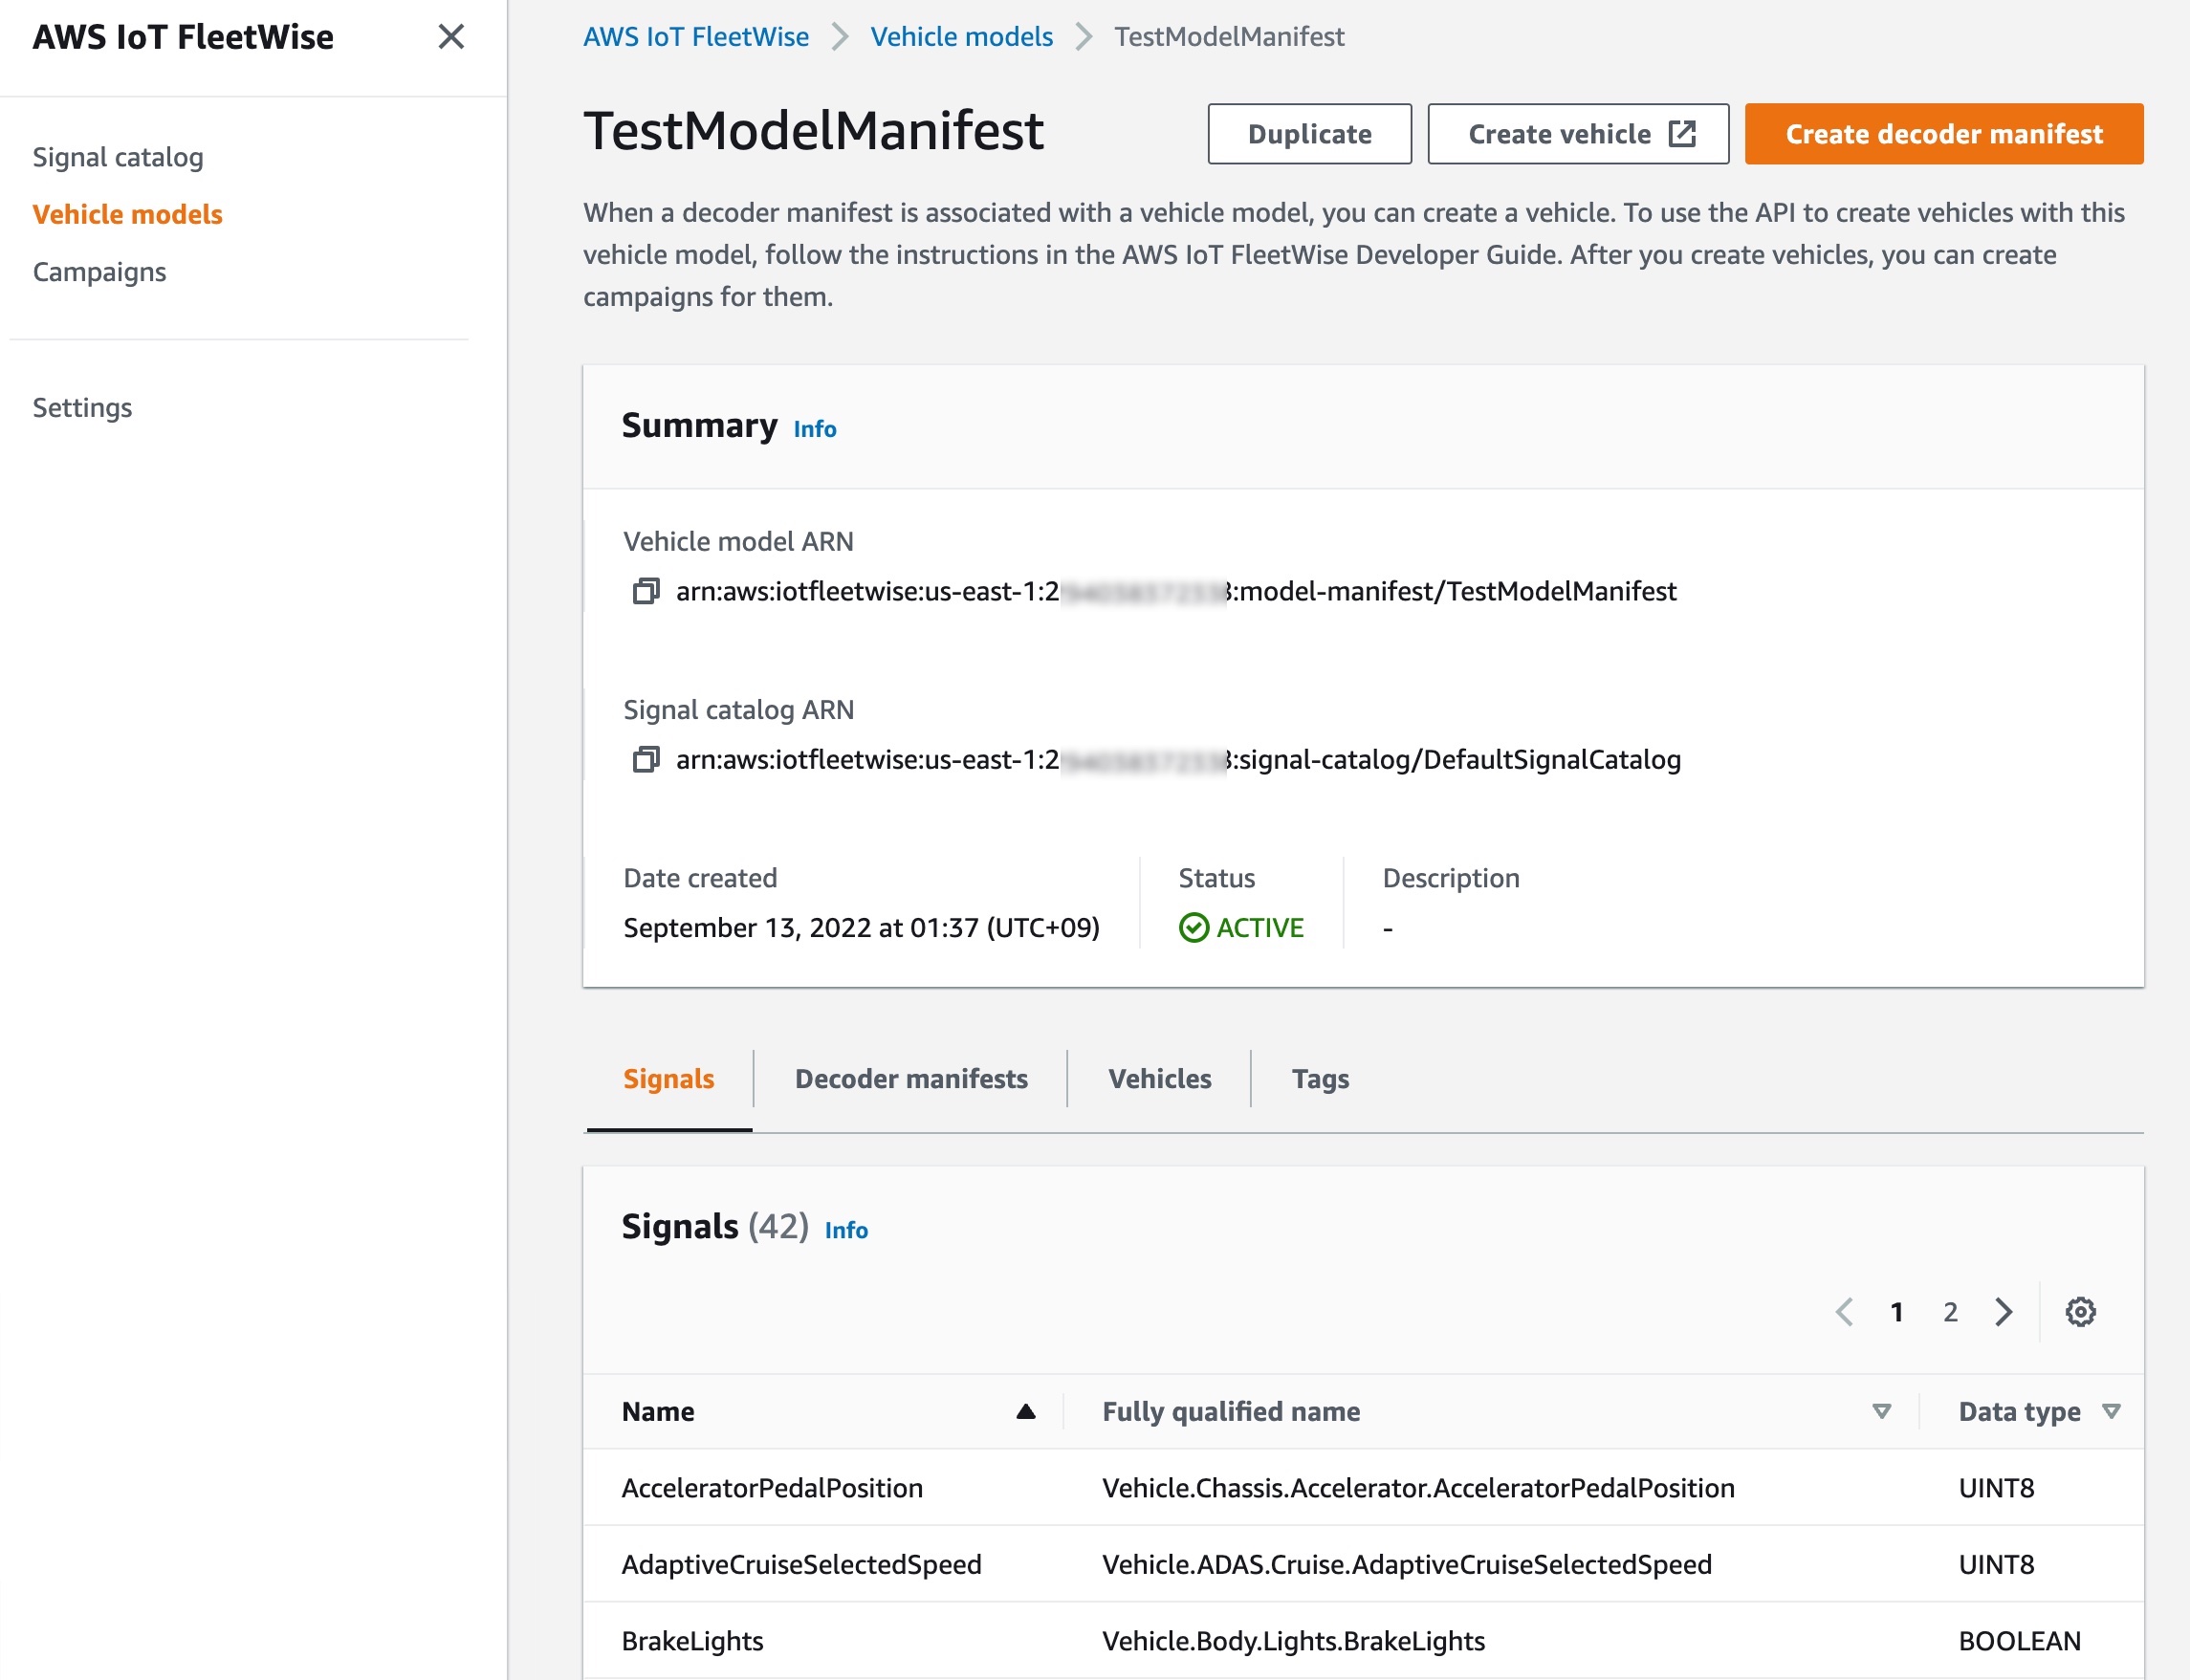
Vehicle models are virtual declarative representations that standardize the format of your vehicles and define relationships between signals in the vehicles. Vehicle models enforce consistent information across multiple vehicles of the same type so that you can quickly configure and create a vehicle fleet. In each vehicle model, you can add signals, including attributes, branches (signal hierarchies), sensors, and actuators.
You can define condition-based schemes to control what data to collect, such as data in-vehicle temperature values that are greater than 40 degrees. You can also define time-based schemes to control how often to collect data. For more information, see Create and manage vehicle models in the AWS documentation.

When a decoder manifest is associated with a vehicle model, you can create a vehicle. Each vehicle corresponds to an AWS IoT thing. You can use an existing AWS IoT thing to create a vehicle or set AWS IoT FleetWise to automatically create an AWS IoT thing for your vehicle. For more information, see Provision vehicles in the AWS documentation. After you create vehicles, you can create campaigns for them.
Campaigns
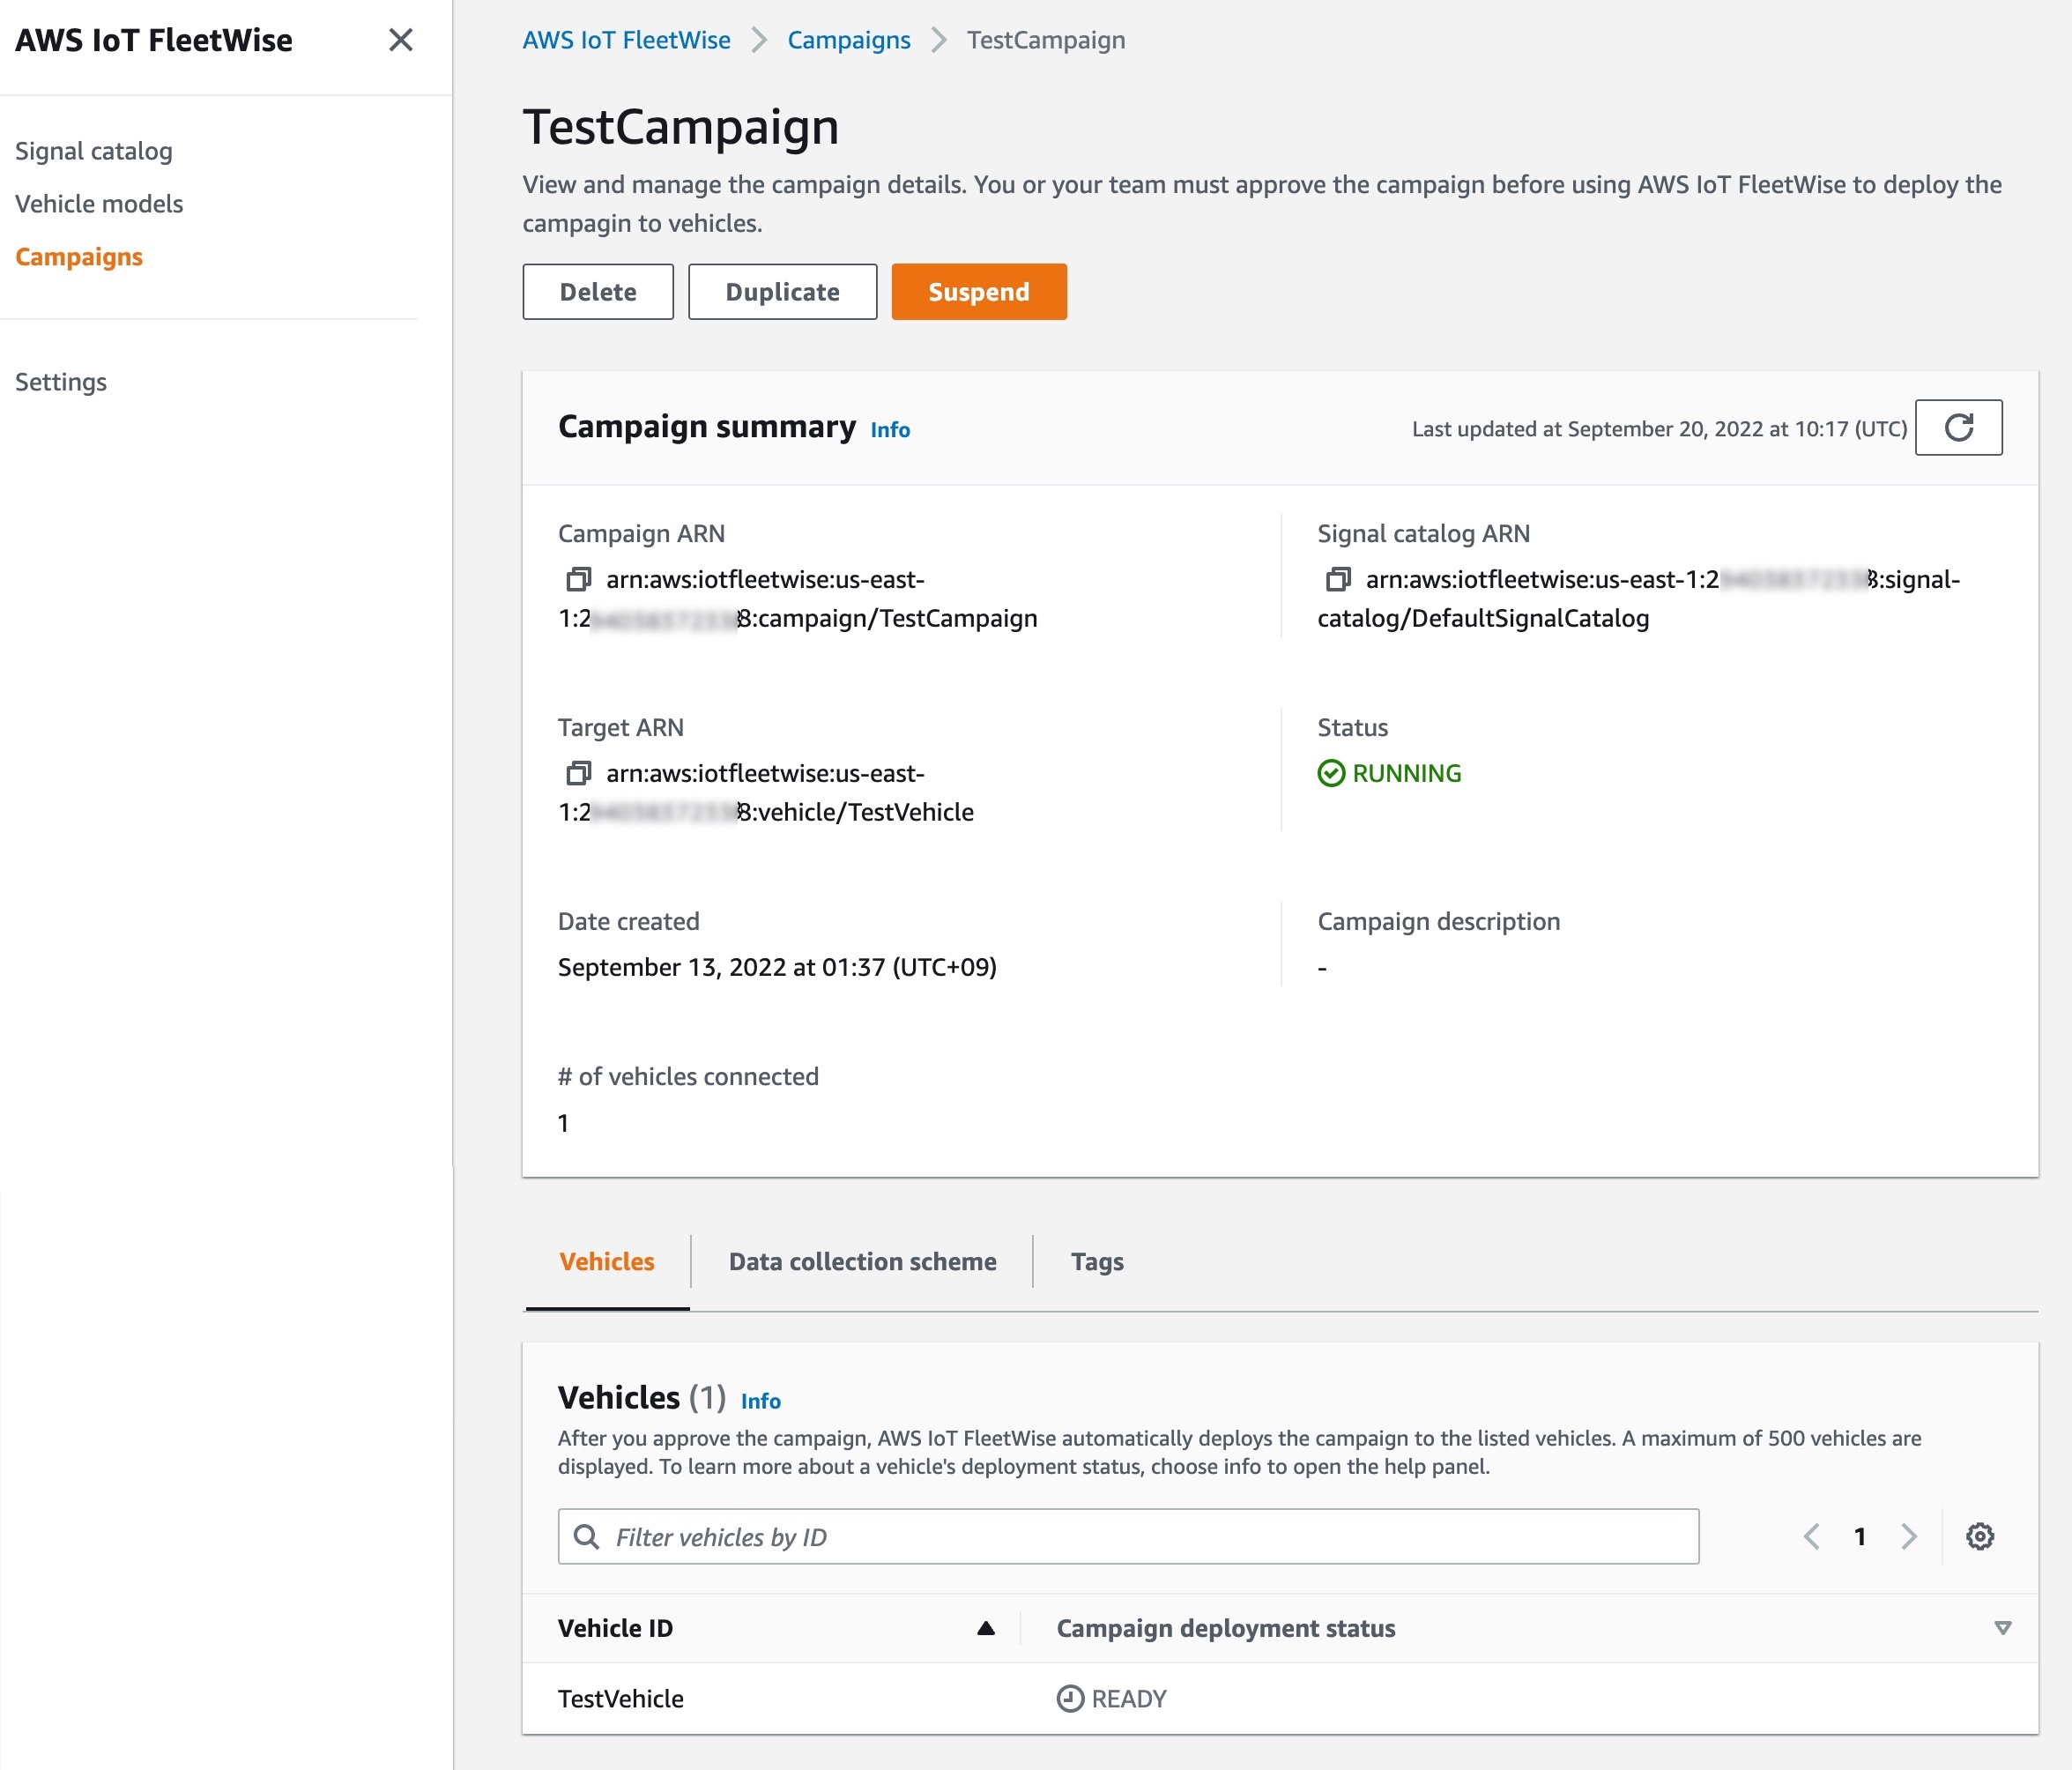
A campaign gives the AWS IoT FleetWise Edge Agent instructions on how to select, collect, and transfer data to the cloud. You can make a campaign with vehicle attributes that you added when creating vehicles, and a data collection scheme. You can manually define the data collection scheme either condition-based logical expressions such as $variable.myVehicle.InVehicleTemperature > 40.0, or time-based data collection in milliseconds such as from 10000 – 60000 milliseconds. To learn more, see Create a campaign in the AWS documentation.
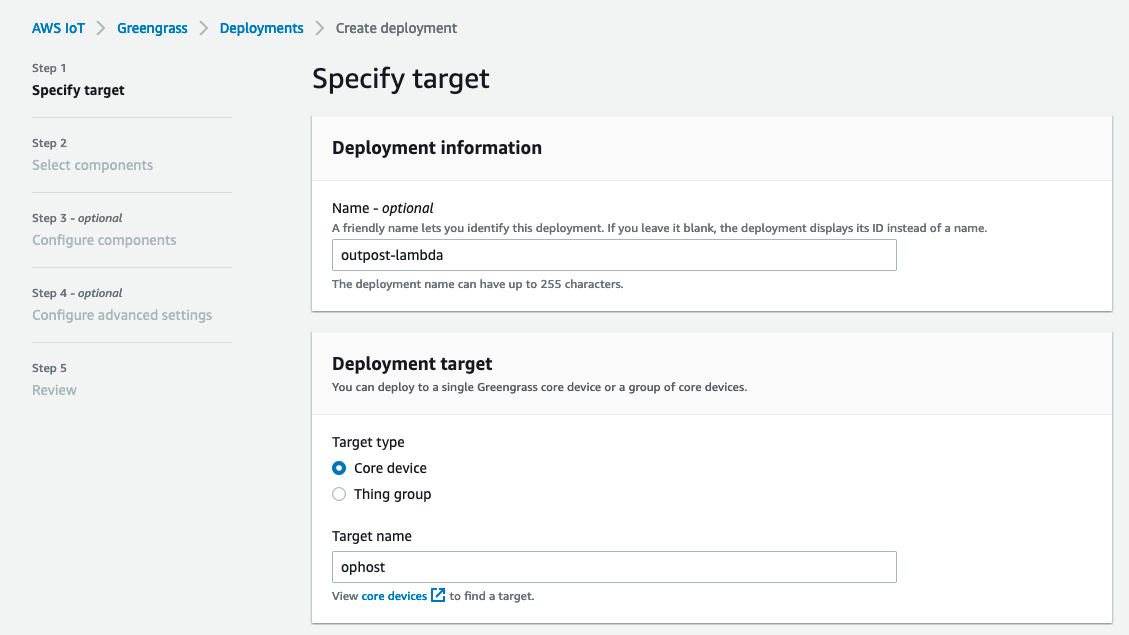
After you create and approve the campaign, AWS IoT FleetWise automatically deploys the campaign to the listed vehicles. The AWS IoT FleetWise Edge Agent software doesn’t start collecting data until a running campaign is deployed to the vehicle. If you want to pause collecting data from vehicles connected to the campaign, on the Campaign summary page, choose Suspend. To resume collecting data from vehicles connected to the campaign, choose Resume.

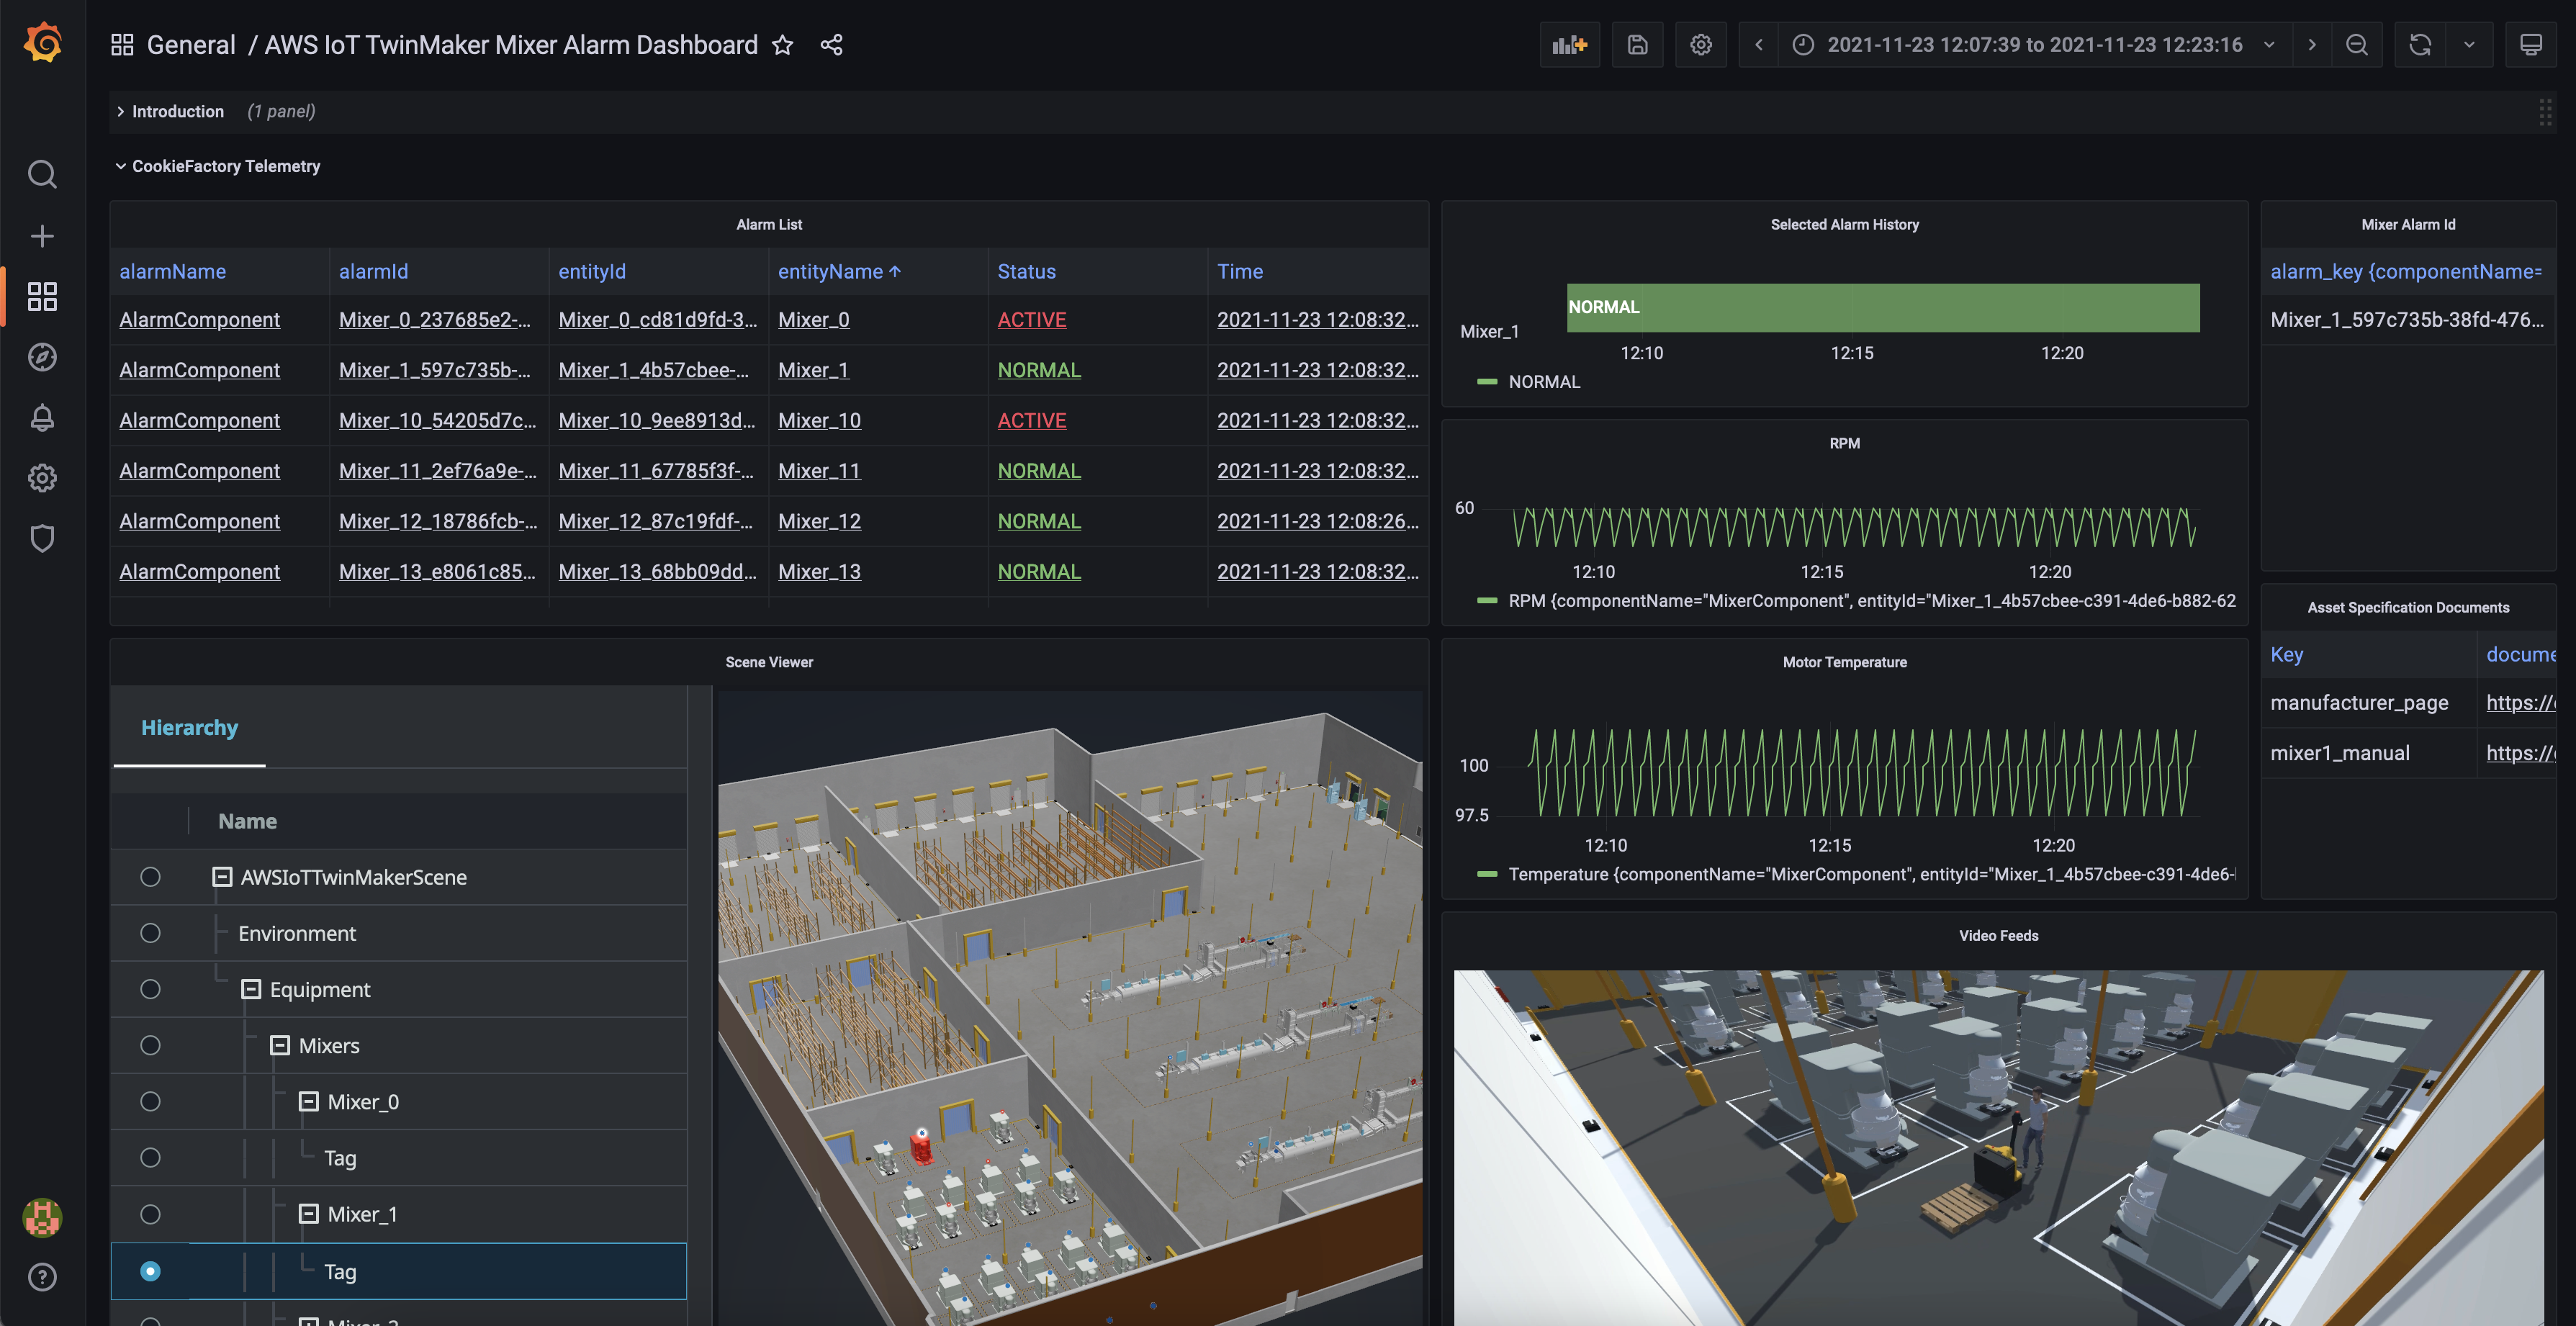
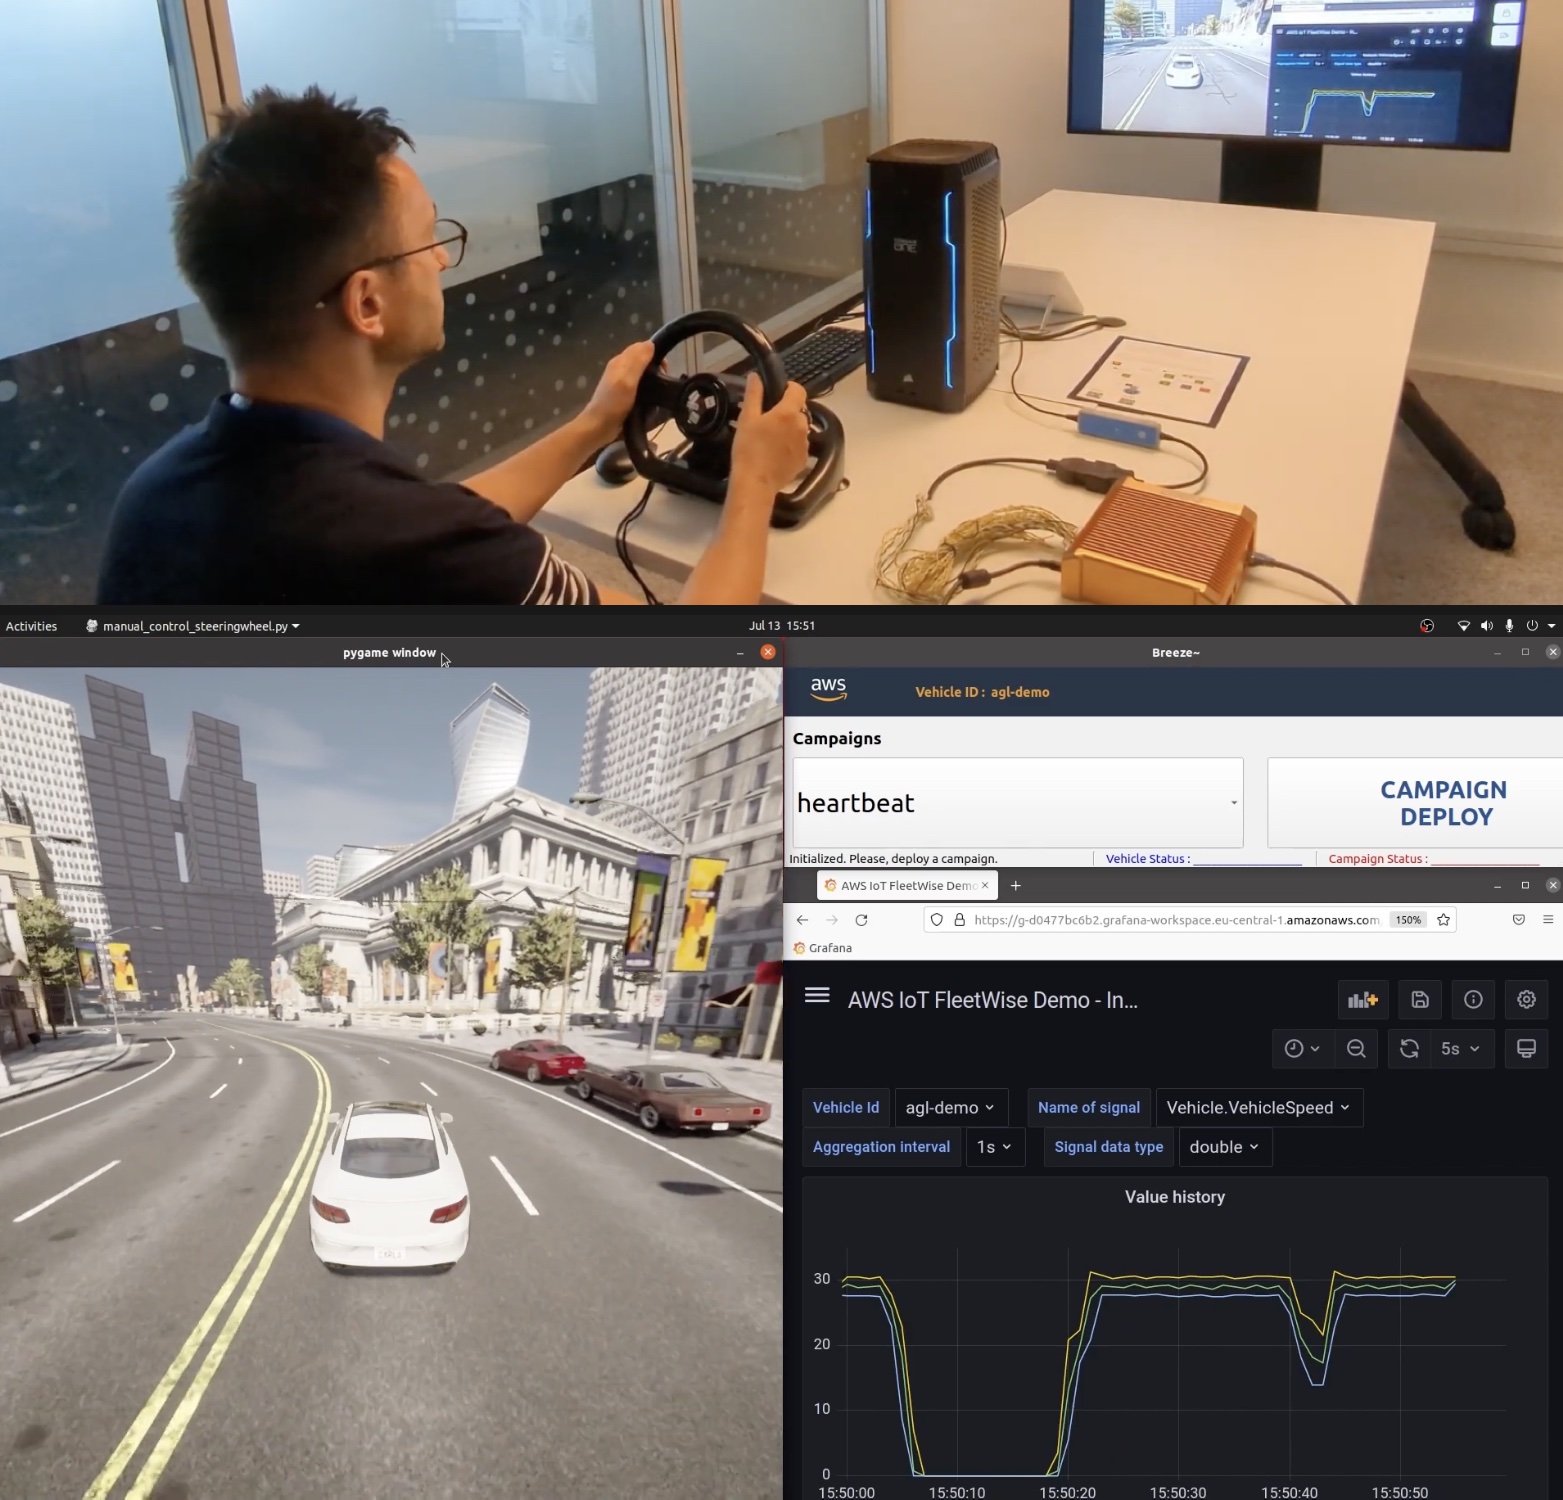
Demo – Visualizing Vehicle Data
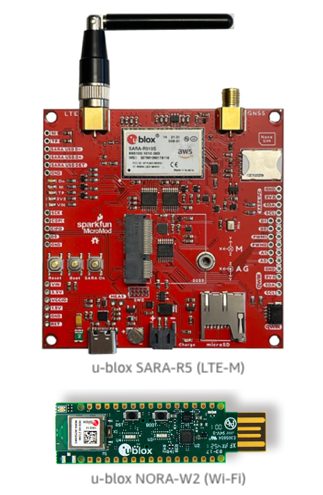
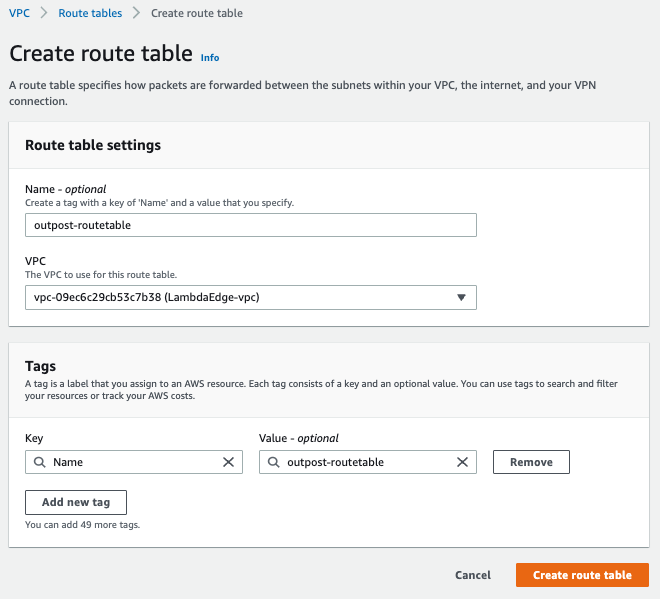
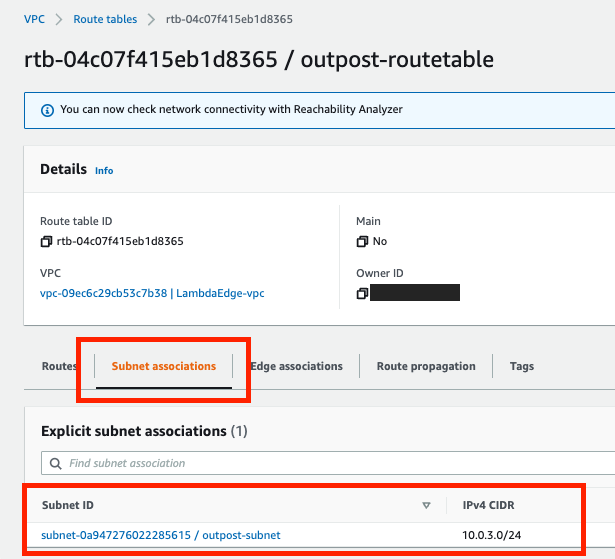
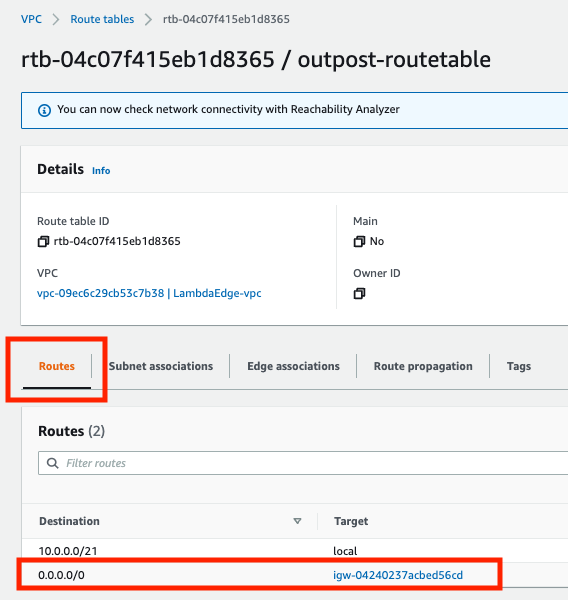
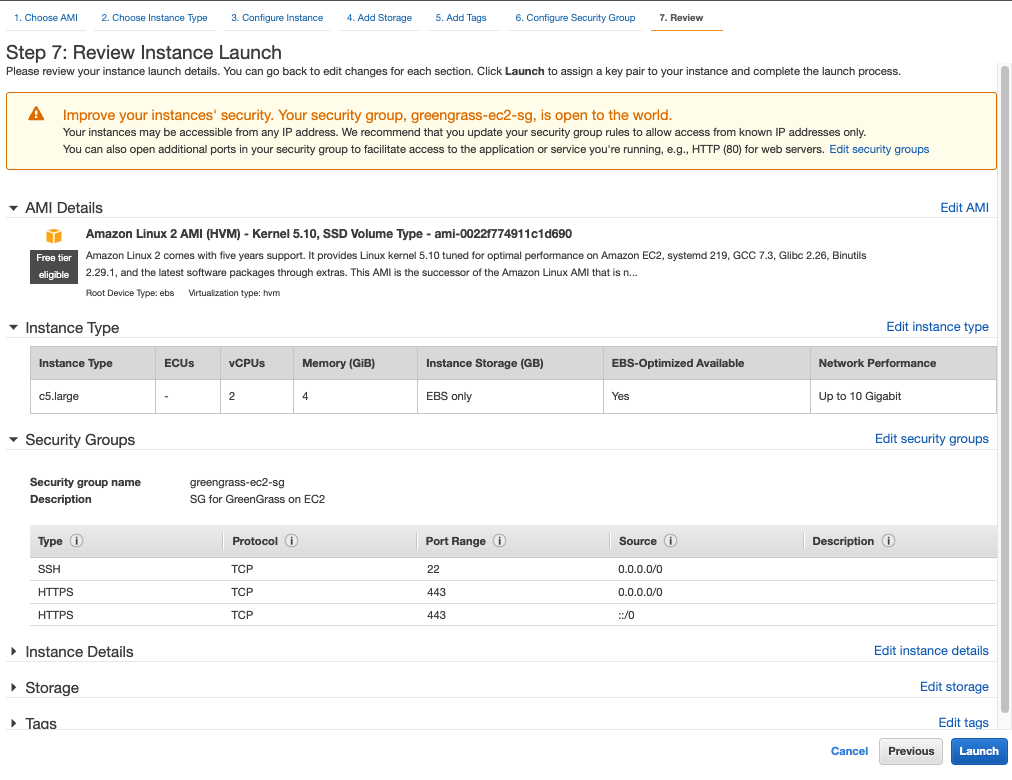
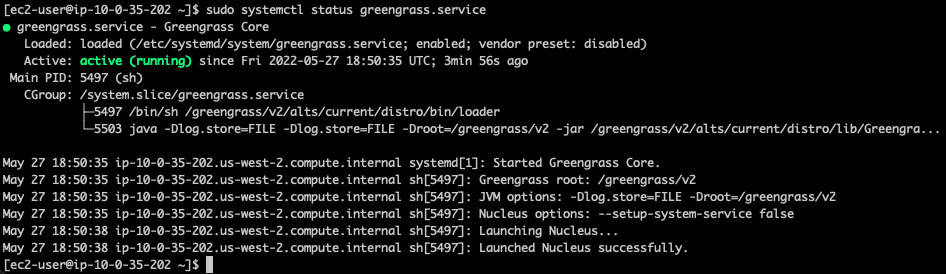
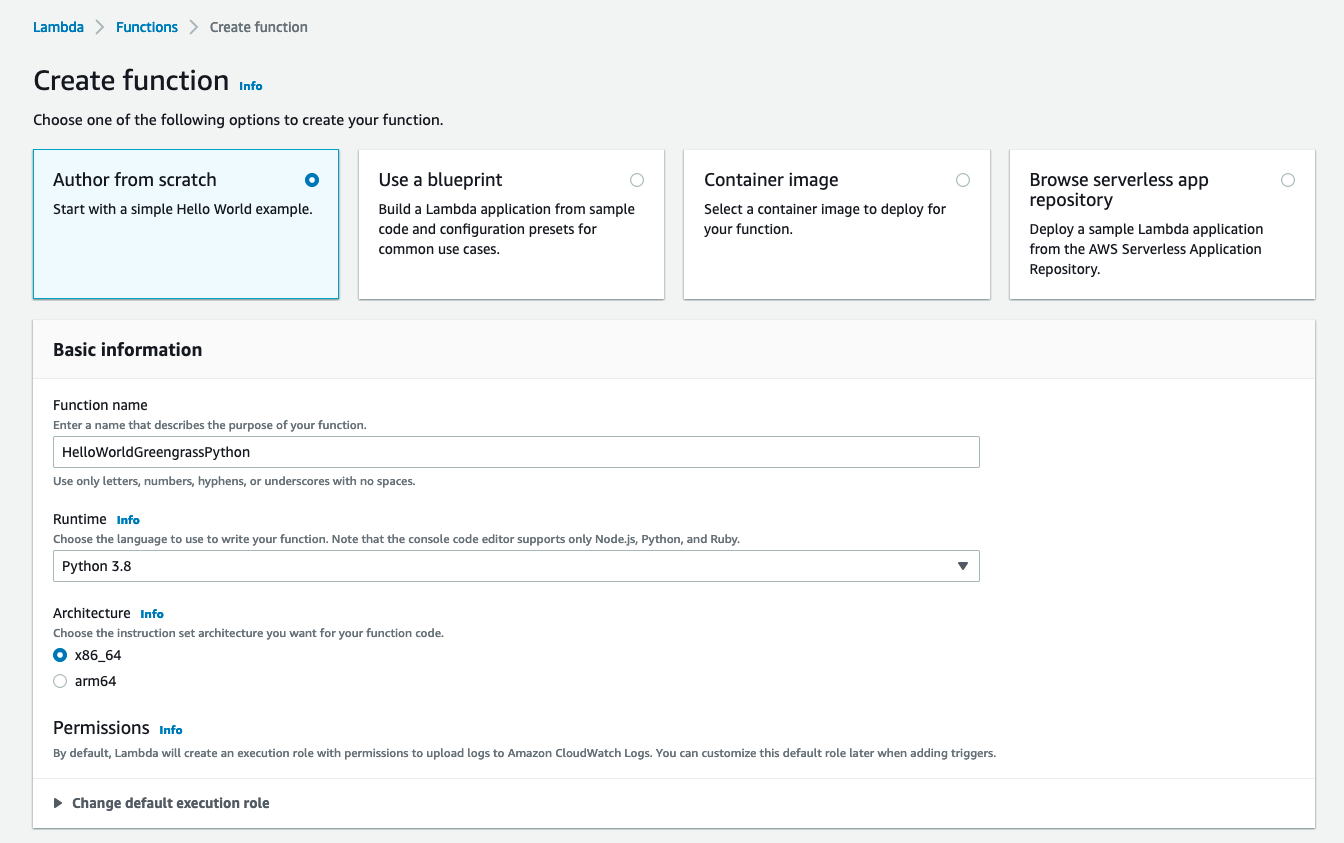
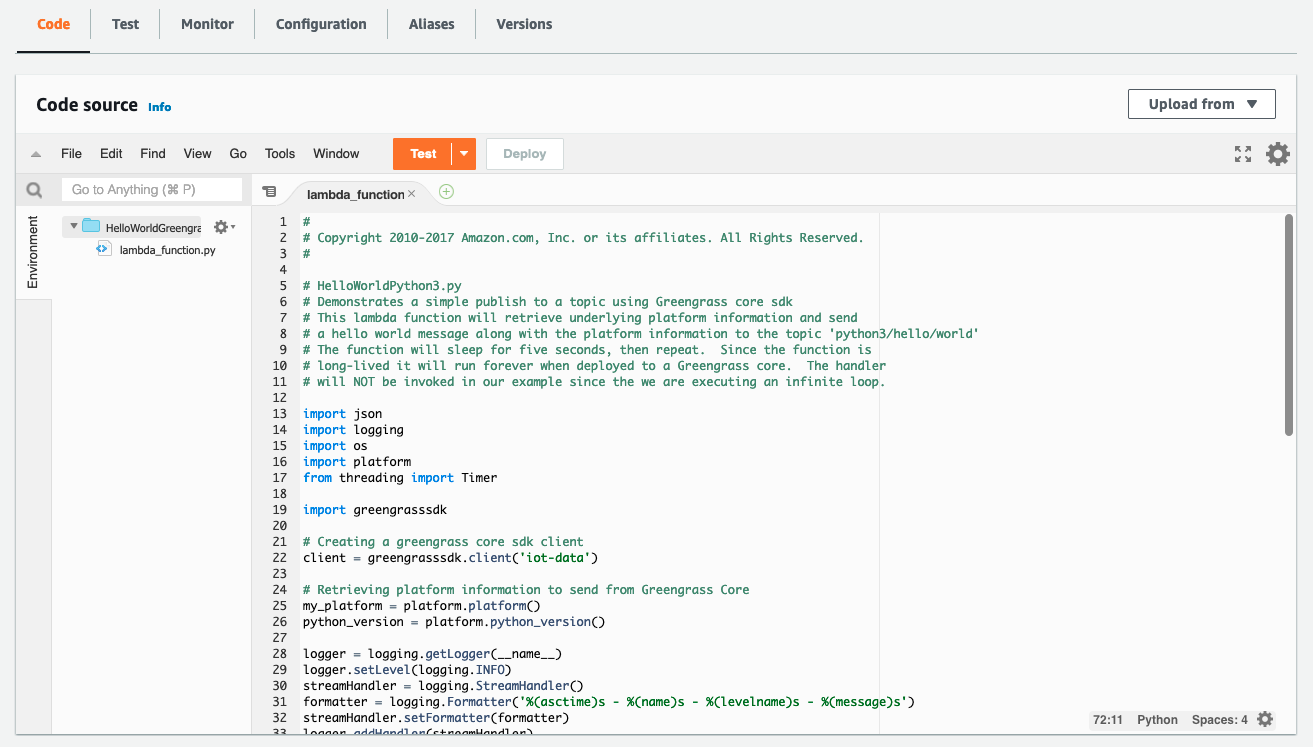
Here is a demo that aims to show how AWS IoT FleetWise can make it easy to collect vehicle data and use it to build visualizing applications. In this demo, you can simulate two kinds of vehicles, an NXP GoldBox powered by an Automotive Grade Linux distribution that runs the AWS IoT FleetWise agent as an AWS IoT Greengrass component or a completely virtual vehicle implemented as an AWS Graviton ARM-based Amazon EC2 instance. To learn more, see the getting started guide and source code in the GitHub repository.
The vehicle in CARLA Simulator can self-drive or be driven with a game steering wheel connected to your desktop. You can watch a live demo video.

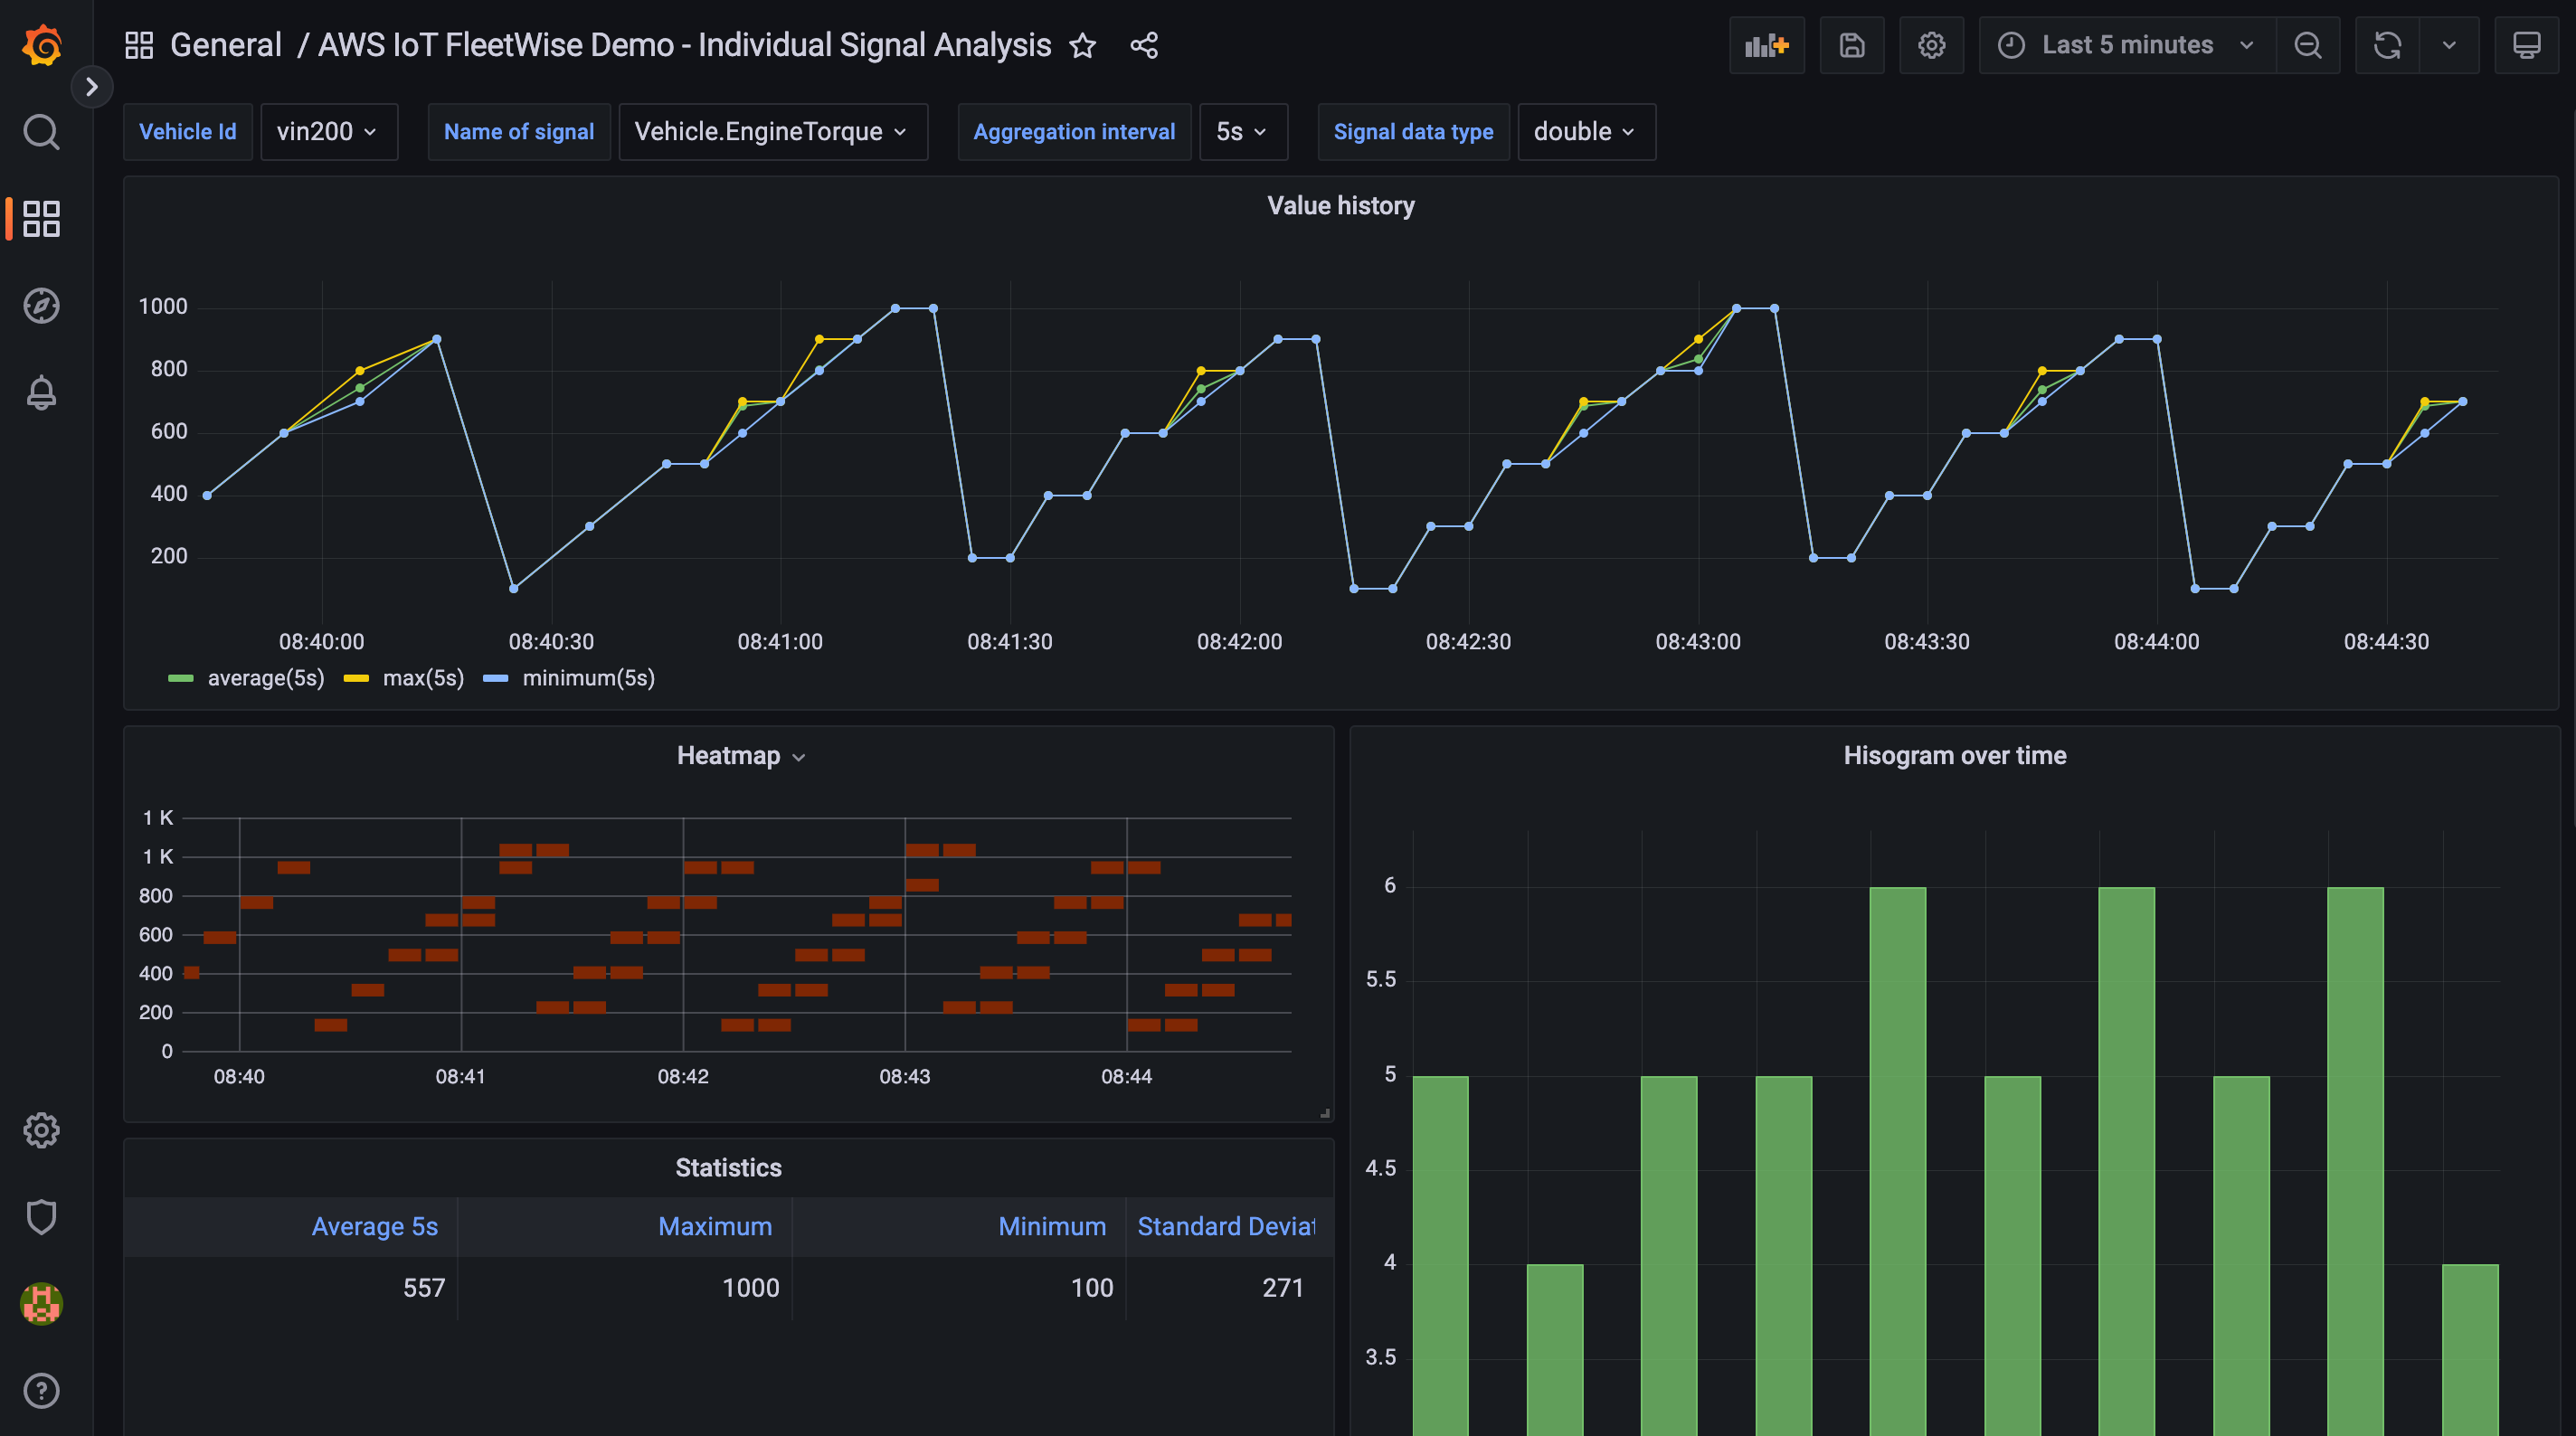
Data is collected by AWS IoT FleetWise and stored in the Amazon Timestream table, and visualized on a Grafana Dashboard.

Customer and Partner Voices
During the preview period, we heard lots of feedback from our customers and partners in automotive industry such as automakers, fleet operators, and automotive suppliers.
 For example, Hyundai Motor Group (HMG) is a global vehicle manufacturer that offers consumers a technology-rich lineup of cars, sport utility vehicles, and electrified vehicles. HMG has used AWS services, such as using Amazon SageMaker, to reduce its ML model training time for autonomous driving models.
Hae Young Kwon, vice president and head of the infotainment development group at HMG, said:
“As a leading global vehicle manufacturer, we have come to appreciate the breadth and depth of AWS services to help create new connected vehicle capabilities. With more data available from our expanding global fleet of connected cars, we look forward to leveraging AWS IoT FleetWise to discover how we can build more personalized ownership experiences for our customers.”
 LG CNS is a global IT service provider and AWS Premier Consulting Partner that is transforming smart transportation services by building an advanced transportation system that is convenient and safe by maximizing the operational efficiency of multiple modes of transport, including buses, subways, taxis, railways, and airplanes.
Jae Seung Lee, vice president at LG CNS, said:
“At LG CNS, we are committed to advancing the technology that is powering the future of transportation. By using AWS IoT FleetWise, we are creating a new data platform that allows us to ingest, analyze, and simulate vehicle conditions in real-time. With these advanced insights, our customers can gain a better understanding of their vehicles and, as a result, improve decision-making about their fleets.”
 Bridgestone is a global leader in tires and rubber building on its expertise to provide solutions for safe and sustainable mobility. Bridgestone has worked with AWS for several years to develop a system that delivers insights derived from the interaction between a tire and a vehicle using advanced machine learning capabilities on Amazon SageMaker.
Brian Goldstine, president of mobility solutions and fleet management at Bridgestone Americas Inc. said:
“Bridgestone has been working with AWS to transform the digital services we provide to our automotive manufacturer, fleet, and retail customers. We look forward to exploring how AWS IoT FleetWise will make it easier for our customers to collect detailed tire data, which can provide new insights for their products and applications.”
 Renesas Electronics Corporation is a global leader in microcontrollers, analog, power, and system on chips (SoC) products. Renesas launched cellular-to-cloud IoT development platforms and its cloud development kits to run on AWS IoT Core and FreeRTOS.
Yusuke Kawasaki, director at Renesas Electronics Corporation, said:
“The volume of connected vehicle data is forecast to increase dramatically over the next few years, driven by new and evolving customer expectations. As a result, Renesas is focused on addressing the needs of automotive engineers facing increasing system complexity. Incorporating AWS IoT FleetWise into our vehicle gateway solution will enable our customers to enjoy our market-ready approach for large-scale data collection and accelerate their cloud development strategy. We look forward to further collaborating with AWS to provide a better and simpler development environment for our customers.”
By working with AWS IoT FleetWise Partners, you can take advantage of solutions to streamline your IoT projects, reduce the risk of your efforts, and accelerate time to value. To learn more how AWS accelerates the automotive industry’s digital transformation, see AWS for Automotive.
Now Available
AWS IoT FleetWise is now generally available in the US East (N. Virginia) and Europe (Frankfurt) Regions. You pay for the vehicles you have created and messages per vehicle per month. Additional services used alongside AWS IoT FleetWise, such as AWS IoT Core and Amazon Timestream, are billed separately. For more detail, see the AWS IoT FleetWise pricing page.
To learn more, see the AWS IoT FleetWise resources page including documentations, videos, and blog posts. Please send feedback to AWS re:Post for AWS IoT FleetWise or through your usual AWS support contacts.
– Channy

 Leadership session – To kick off the day, we have a leadership session featuring


 Infineon Technologies AG specializes in semiconductor solutions the goal of which is to make life easier, safer, and greener. Sivaram Trikutam, Vice President, Wi-Fi Product Line at Infineon Technologies, said:
 IFW56810 Cloud Connectivity Manager
 Espressif Systems is a multinational, fabless semiconductor company with a strong focus on providing connectivity solutions to internet-connected devices. Amey Inamdar, Director of Technical Marketing, Espressif Systems, said:
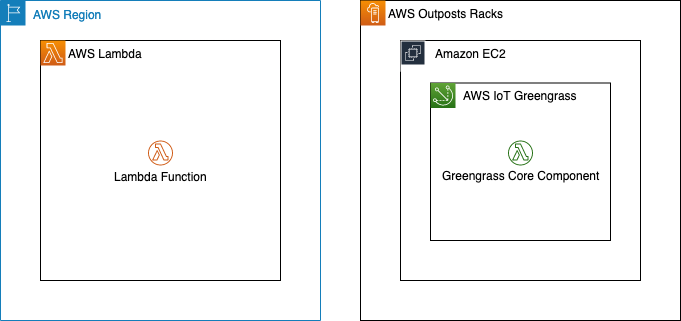


 ” to my colleagues, and have a coffee while asking all your serverless questions. You can find all the upcoming AWS Summits in the events section at the end of this post.