Post Syndicated from Explosm.net original https://explosm.net/comics/papa-bear
New Cyanide and Happiness Comic
Post Syndicated from Explosm.net original https://explosm.net/comics/papa-bear
New Cyanide and Happiness Comic
Post Syndicated from original https://xkcd.com/2804/

Post Syndicated from Patrick Kennedy original https://www.servethehome.com/asus-and-intel-agree-on-deal-for-a-nuc-future/
Intel and ASUS announced a term sheet that will see a new ASUS NUC BU stood up and 10th to 13th gen NUC manufacturing to be done by ASUS
The post ASUS and Intel Agree on Deal for a NUC Future appeared first on ServeTheHome.
Post Syndicated from original https://lwn.net/Articles/938536/
Version
3.0 of Cython (described
as “a programming language that makes writing C
“) has been
extensions for the Python language as easy as Python itself
released. Changes include support for Python through 3.11 (but 2.6 support
was dropped), the implementation of a number of PEPs, initial support for
the CPython limited API, better exception handling, and more.
Post Syndicated from original https://lwn.net/Articles/938524/
The 2023 sambaXP conference was held May 10 and 11 in Goettingen, Germany.
Videos
of the talks held there have now been posted on YouTube; topics covered
include an io_uring update, fuzzing, passwordless services, GPL compliance,
and much more.
Post Syndicated from Ajay Vohra original https://aws.amazon.com/blogs/big-data/automate-secure-access-to-amazon-mwaa-environments-using-existing-openid-connect-single-sign-on-authentication-and-authorization/
Customers use Amazon Managed Workflows for Apache Airflow (Amazon MWAA) to run Apache Airflow at scale in the cloud. They want to use their existing login solutions developed using OpenID Connect (OIDC) providers with Amazon MWAA; this allows them to provide a uniform authentication and single sign-on (SSO) experience using their adopted identity providers (IdP) across AWS services. For ease of use for end-users of Amazon MWAA, organizations configure a custom domain endpoint to their Apache Airflow UI endpoint. For teams operating and managing multiple Amazon MWAA environments, securing and customizing each environment is a repetitive but necessary task. Automation through infrastructure as code (IaC) can alleviate this heavy lifting to achieve consistency at scale.
This post describes how you can integrate your organization’s existing OIDC-based IdPs with Amazon MWAA to grant secure access to your existing Amazon MWAA environments. Furthermore, you can use the solution to provision new Amazon MWAA environments with the built-in OIDC-based IdP integrations. This approach allows you to securely provide access to your new or existing Amazon MWAA environments without requiring AWS credentials for end-users.
Managing multiple user names and passwords can be difficult—this is where SSO authentication and authorization comes in. OIDC is a widely used standard for SSO, and it’s possible to use OIDC SSO authentication and authorization to access Apache Airflow UI across multiple Amazon MWAA environments.
When you provision an Amazon MWAA environment, you can choose public or private Apache Airflow UI access mode. Private access mode is typically used by customers that require restricting access from only within their virtual private cloud (VPC). When you use public access mode, the access to the Apache Airflow UI is available from the internet, in the same way as an AWS Management Console page. Internet access is needed when access is required outside of a corporate network.
Regardless of the access mode, authorization to the Apache Airflow UI in Amazon MWAA is integrated with AWS Identity and Access Management (IAM). All requests made to the Apache Airflow UI need to have valid AWS session credentials with an assumed IAM role that has permissions to access the corresponding Apache Airflow environment. For more details on the permissions policies needed to access the Apache Airflow UI, refer to Apache Airflow UI access policy: AmazonMWAAWebServerAccess.
Different user personas such as developers, data scientists, system operators, or architects in your organization may need access to the Apache Airflow UI. In some organizations, not all employees have access to the AWS console. It’s fairly common that employees who don’t have AWS credentials may also need access to the Apache Airflow UI that Amazon MWAA exposes.
In addition, many organizations have multiple Amazon MWAA environments. It’s common to have an Amazon MWAA environment setup per application or team. Each of these Amazon MWAA environments can be run in different deployment environments like development, staging, and production. For large organizations, you can easily envision a scenario where there is a need to manage multiple Amazon MWAA environments. Organizations need to provide secure access to all of their Amazon MWAA environments using their existing OIDC provider.
The solution architecture integrates an existing OIDC provider to provide authentication for accessing the Amazon MWAA Apache Airflow UI. This allows users to log in to the Apache Airflow UI using their OIDC credentials. From a system perspective, this means that Amazon MWAA can integrate with an existing OIDC provider rather than having to create and manage an isolated user authentication and authorization through IAM internally.
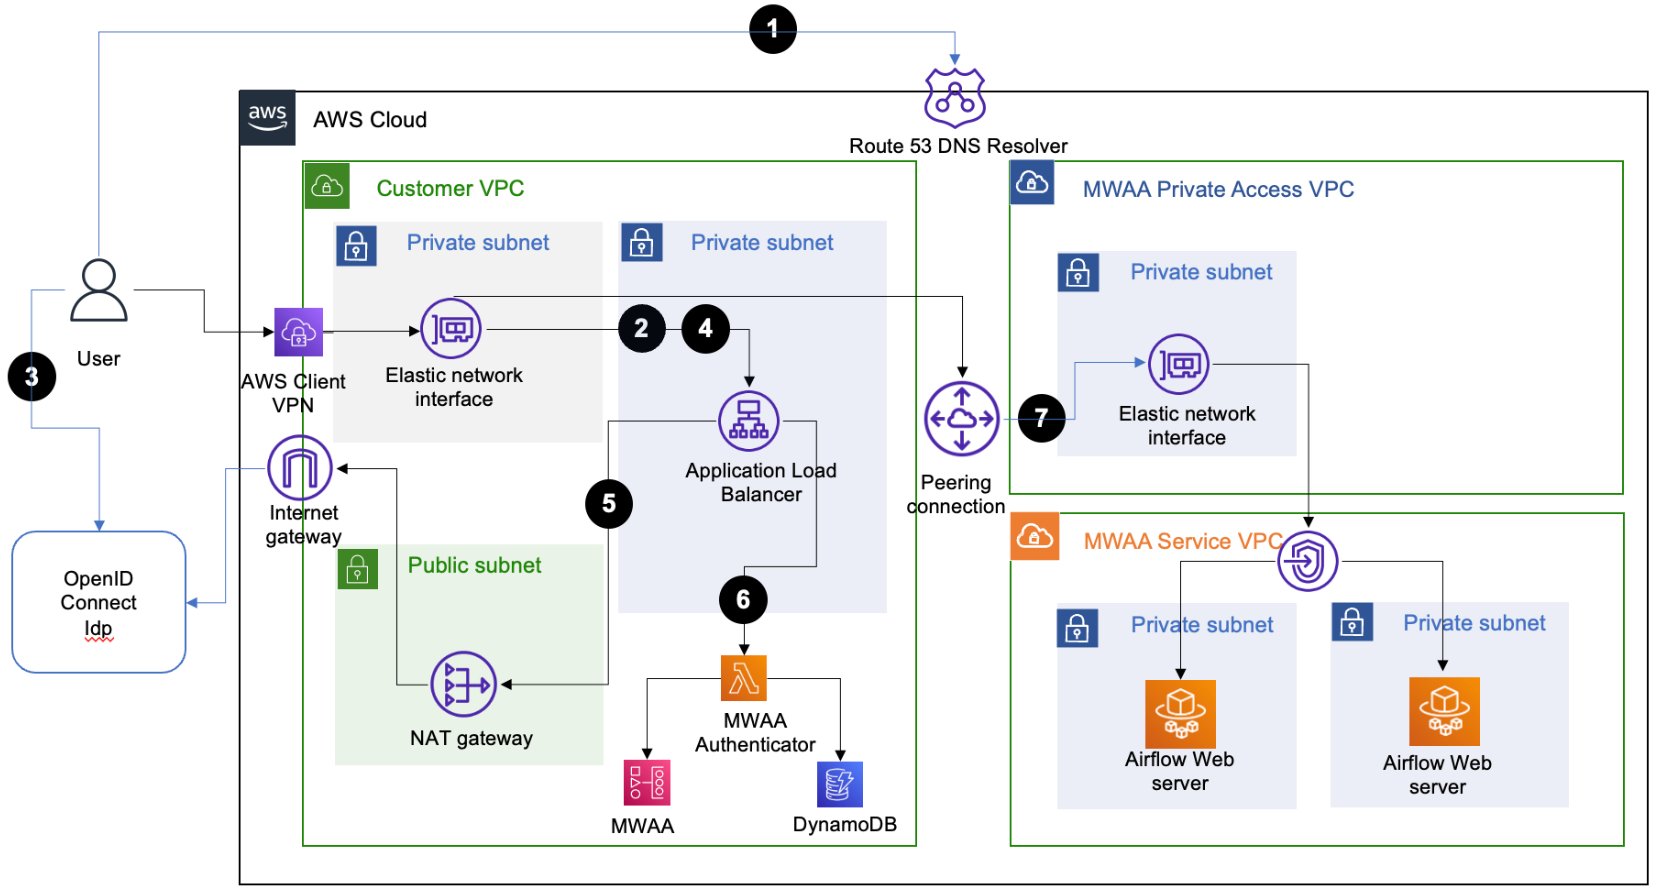
The solution architecture relies on an Application Load Balancer (ALB) setup with a fully qualified domain name (FQDN) with public (internet) or private access. This ALB provides SSO access to multiple Amazon MWAA environments. The user-agent (web browser) call flow for accessing an Apache Airflow UI console to the target Amazon MWAA environment includes the following steps:
/aws_mwaa/aws-console-sso with a set of query parameters populated. The request uses the required parameters mwaa_env and rbac_role as placeholders for the target Amazon MWAA environment and the Apache Airflow role-based access control (RBAC) role, respectively.redirect_url with the authorization code included in the URL.access_token and OpenID JWT token with openid email scope from the OIDC IdP. It then forwards the login request to the Amazon MWAA authenticator AWS Lambda function with the JWT token included in the request header in the x-amzn-oidc-data parameter.mwaa_env and rbac_role stored in an Amazon DynamoDB table. The use of DynamoDB for authorization here is optional; the Lambda code function is_allowed can be customized to use other authorization mechanisms.For the Amazon MWAA environments configured with public access mode, the user agent uses public routing over the internet to connect to the ALB hosted in a public subnet.
The following diagram illustrates the solution architecture with a numbered call flow sequence for internet network reachability.

For Amazon MWAA environments configured with private access mode, the user agent uses private routing over a dedicated AWS Direct Connect or AWS Client VPN to connect to the ALB hosted in a private subnet.
The following diagram shows the solution architecture for Client VPN network reachability.
To make setting up this solution easier, we have released a pre-built solution that automates the tasks involved. The solution has been built using the AWS Cloud Development Kit (AWS CDK) using the Python programming language. The solution is available in our GitHub repository and helps you achieve the following:
The solution offers a number of customization options, which can be specified in the cdk.context.json file. Follow the setup instructions to complete the integration to your existing Amazon MWAA environments or create new Amazon MWAA environments with SSO enabled. The setup process creates an ALB with an HTTPS listener that provides the user access endpoint. You have the option to define the type of ALB that you need. You can define whether your ALB will be public facing (internet accessible) or private facing (only accessible within the VPC). It is recommended to use a private ALB with your new or existing Amazon MWAA environments configured using private UI access mode.
The following sections describe the specific implementation steps and customization options for each use case.
Before you continue with the installation steps, make sure you have completed all prerequisites and run the setup-venv script as outlined within the README.md file of the GitHub repository.
If you’re integrating with a single existing Amazon MWAA environment, follow the guides in the Quick start section. You must specify the same ALB VPC as that of your existing Amazon MWAA VPC. You can specify the default Apache Airflow RBAC role that all users will assume. The ALB with an HTTPS listener is configured within your existing Amazon MWAA VPC.
To connect to multiple existing Amazon MWAA environments, specify only the Amazon MWAA environment name in the JSON file. The setup process will create a new VPC with subnets hosting the ALB and the listener. You must define the CIDR range for this ALB VPC such that it doesn’t overlap with the VPC CIDR range of your existing Amazon MWAA VPCs.
When the setup steps are complete, implement the post-deployment configuration steps. This includes adding the ALB CNAME record to the Amazon Route 53 DNS domain.
For integrating with Amazon MWAA environments configured using private access mode, there are additional steps that need to be configured. These include configuring VPC peering and subnet routes between the new ALB VPC and the existing Amazon MWAA VPC. Additionally, you need to configure network connectivity from your user-agent to the private ALB endpoint resolved by your DNS domain.
You can configure the new Amazon MWAA environments you want to provision through this solution. The cdk.context.json file defines a dictionary entry in the MwaaEnvironments array. Configure the details that you need for each of the Amazon MWAA environments. The setup process creates an ALB VPC, ALB with an HTTPS listener, Lambda authorizer function, DynamoDB table, and respective Amazon MWAA VPCs and Amazon MWAA environments in them. Furthermore, it creates the VPC peering connection between the ALB VPC and the Amazon MWAA VPC.
If you want to create Amazon MWAA environments with private access mode, the ALB VPC CIDR range specified must not overlap with the Amazon MWAA VPC CIDR range. This is required for the automatic peering connection to succeed. It can take between 20–30 minutes for each Amazon MWAA environment to finish creating.
When the environment creation processes are complete, run the post-deployment configuration steps. One of the steps here is to add authorization records to the created DynamoDB table for your users. You need to define the Apache Airflow rbac_role for each of your end-users, which the Lambda authorizer function matches to provide the requisite access.
Once you’ve completed with the post-deployment steps, you can log in to the URL using your ALB FQDN. For example, If your ALB FQDN is alb-sso-mwaa.example.com, you can log in to your target Amazon MWAA environment, named Env1, assuming a specific Apache Airflow RBAC role (such as Admin), using the following URL: https://alb-sso-mwaa.example.com/aws_mwaa/aws-console-sso?mwaa_env=Env1&rbac_role=Admin. For the Amazon MWAA environments that this solution created, you need to have appropriate Apache Airflow rbac_role entries in your DynamoDB table.
The solution also provides a logout feature. To log out from an Apache Airflow console, use the normal Apache Airflow console logout. To log out from the ALB, you can, for example, use the URL https://alb-sso-mwaa.example.com/logout.
Follow the readme documented steps in the section Destroy CDK stacks in the GitHub repo, which shows how to clean up the artifacts created via the AWS CDK deployments. Remember to revert any manual configurations, like VPC peering connections, that you might have made after the deployments.
This post provided a solution to integrate your organization’s OIDC-based IdPs with Amazon MWAA to grant secure access to multiple Amazon MWAA environments. We walked through the solution that solves this problem using infrastructure as code. This solution allows different end-user personas in your organization to access the Amazon MWAA Apache Airflow UI using OIDC SSO.
To use the solution for your own environments, refer to Application load balancer single-sign-on for Amazon MWAA. For additional code examples on Amazon MWAA, refer to Amazon MWAA code examples.
 Ajay Vohra is a Principal Prototyping Architect specializing in perception machine learning for autonomous vehicle development. Prior to Amazon, Ajay worked in the area of massively parallel grid-computing for financial risk modeling.
 Jaswanth Kumar is a customer-obsessed Cloud Application Architect at AWS in NY. Jaswanth excels in application refactoring and migration, with expertise in containers and serverless solutions, coupled with a Masters Degree in Applied Computer Science.
 Aneel Murari is a Sr. Serverless Specialist Solution Architect at AWS based in the Washington, D.C. area. He has over 18 years of software development and architecture experience and holds a graduate degree in Computer Science. Aneel helps AWS customers orchestrate their workflows on Amazon Managed Apache Airflow (MWAA) in a secure, cost effective and performance optimized manner.
 Parnab Basak is a Solutions Architect and a Serverless Specialist at AWS. He specializes in creating new solutions that are cloud native using modern software development practices like serverless, DevOps, and analytics. Parnab works closely in the analytics and integration services space helping customers adopt AWS services for their workflow orchestration needs.
Post Syndicated from Bhupinder Chadha original https://aws.amazon.com/blogs/big-data/introducing-field-based-coloring-experience-for-amazon-quicksight/
Color plays a crucial role in visualizations. It conveys meaning, captures attention, and enhances aesthetics. You can quickly grasp important information when key insights and data points pop with color. However, it’s important to use color judiciously to enhance readability and ensure correct interpretation. Color should also be accessible and consistent to enable users to establish visual patterns and comprehend data effectively.
In line with data visualization best practices, Amazon QuickSight is announcing the launch of field-based coloring options, which provides a fresh approach to configuring colors across visuals in addition to the visual-level color settings. With field-based colors, you can now enjoy the following benefits:
At present, users in QuickSight can either assign colors to their charts using themes or the on-visual menu. In addition to these options, the launch of field-based coloring allows authors to specify colors on a per-field basis, simplifying the process of setting colors and ensuring consistency across all visuals that use the same field. The following example shows that, before this feature was available, both charts using the color field Ship region displayed different colors across the field values.

With the implementation of field colors, authors now have the capability to maintain consistent color schemes across visuals that utilize the same field. This is achieved by defining distinct colors for each field value, which ensures uniformity throughout. In contrast to the previous example, both charts now showcase consistent colors for the Ship region field.

In the past, the default coloring logic used to be based on the sorting order, which means that colors would stay the same for a given sort order. However, this caused inconsistency because the same values could display different colors when the sorting order changed or when they were filtered. The following example shows that the colors for each segment field (Online, In-Store, and Catalog) on the donut chart differ from the colors on the bar chart after sorting.
The assigned colors persist and remain unchanged during any visual interaction, such as sorting or filtering, by defining field-based colors. Notice that, after sorting the donut chart another way, the legend order changes, but the colors remain the same.
In this section, we demonstrate the various ways you can customize field colors.
There are two ways to add or edit field-based color:


Note the following considerations:
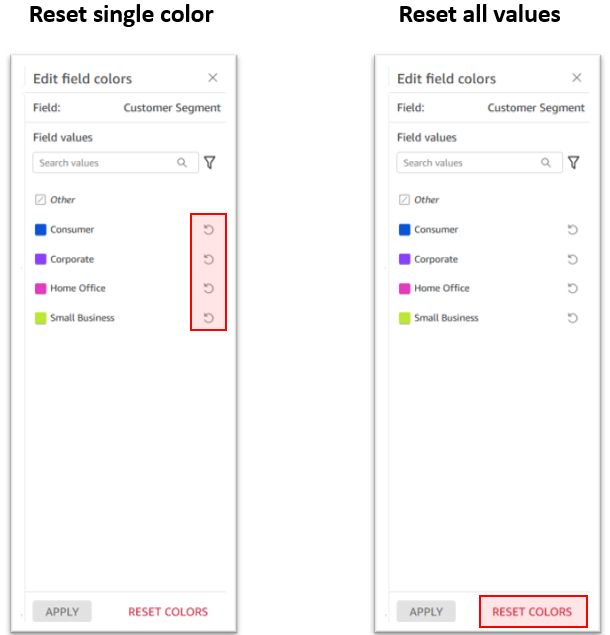
If your visuals have colors assigned through the on-visual menu, the field-based colors aren’t visible. This is because on-visual colors take precedence over the field-based color settings. However, you can easily reset the visual-based colors to reveal the underlying field-based colors in such cases.
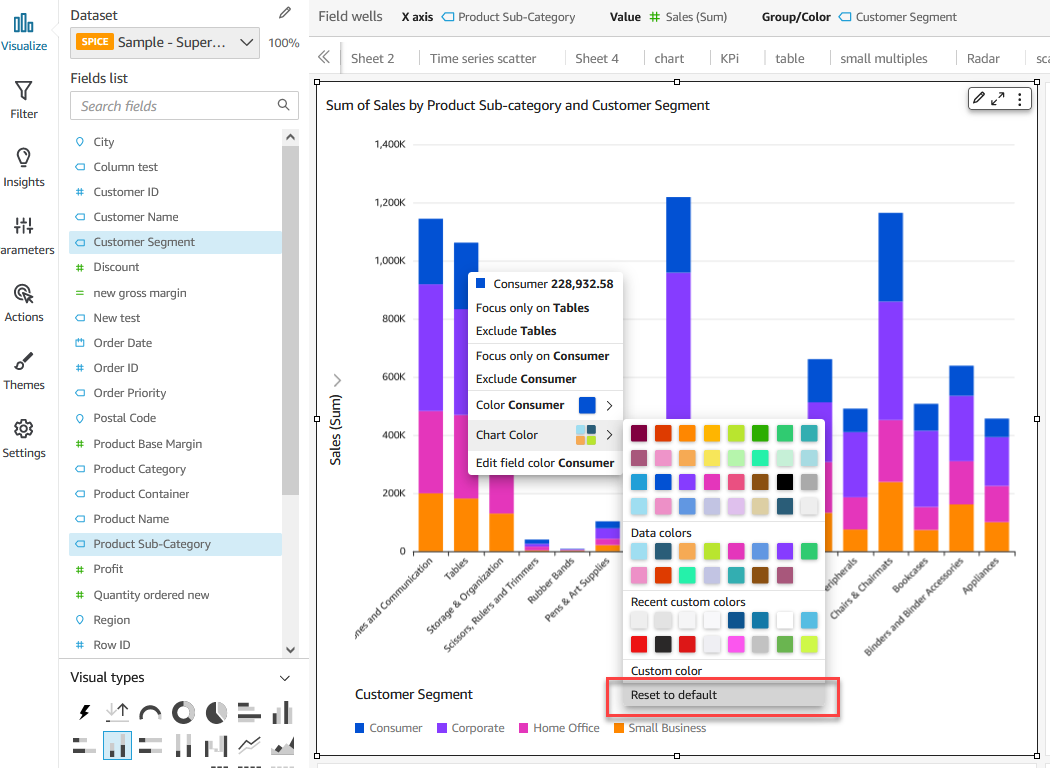
If you want to change the color of a specific value, simply choose the reset icon next to the edited color. Alternatively, if you want to reset all colors, choose Reset colors at the bottom. This restores all edited values to their default color assignment.
When values that you’ve assigned colors to no longer appear in data, QuickSight labels the values as unused. You can view the unused color assignments and choose to delete them if you’d like.

Field-based coloring options in QuickSight simplify the process of achieving consistent and visually appealing visuals. The persistence of default colors during interactions, such as filtering and sorting, enhances the user experience. Start using field-based coloring today for consistent coloring experience and to enable better comparisons and pattern recognition for effective data interpretation and decision-making.
 Bhupinder Chadha is a senior product manager for Amazon QuickSight focused on visualization and front end experiences. He is passionate about BI, data visualization and low-code/no-code experiences. Prior to QuickSight he was the lead product manager for Inforiver, responsible for building a enterprise BI product from ground up. Bhupinder started his career in presales, followed by a small gig in consulting and then PM for xViz, an add on visualization product.
Post Syndicated from Cliff Robinson original https://www.servethehome.com/beelink-gtr7-and-gtr6-bottom-cover-replacement-to-cool-amd-platforms/
Beelink announced a new bottom cover for the Beelink GTR7 and GTR6 to aid in cooling and seems to be stepping up support efforts
The post Beelink GTR7 and GTR6 Bottom Cover Replacement to Cool AMD Platforms appeared first on ServeTheHome.
Post Syndicated from Luke Notley original https://aws.amazon.com/blogs/security/how-to-scan-ec2-amis-using-amazon-inspector/
Amazon Inspector is an automated vulnerability management service that continually scans Amazon Web Services (AWS) workloads for software vulnerabilities and unintended network exposure. Amazon Inspector supports vulnerability reporting and deep inspection of Amazon Elastic Compute Cloud (Amazon EC2) instances, container images stored in Amazon Elastic Container Registry (Amazon ECR), and AWS Lambda functions. Operating system and programming language support is extensive, ranging from Bottlerocket to Windows Server.
Many customers use Amazon EC2 Auto Scaling groups as part of their resilience and scaling architecture for their workloads. With Auto Scaling groups, you can scale and deploy rapidly by using Amazon Machine Images (AMIs). However, AMIs within your environment can quickly become outdated as new vulnerabilities are discovered. A security best practice is to perform routine vulnerability assessments of your AMIs to identify whether newfound vulnerabilities apply to them. If you identify a vulnerability, you can update the AMI with the appropriate security patches, test the AMI in lower environments, and deploy the updated AMI in your environment. At this time, Amazon Inspector only supports scanning of running EC2 instances.
In this blog post, we’ll share a solution that you can use with Amazon EventBridge, AWS Lambda, AWS Step Functions, Amazon Simple Notification Service (Amazon SNS), and Amazon Simple Storage Service (Amazon S3) to scan AMIs and generate Amazon Inspector finding reports to help ensure that your AMIs are scanned for known vulnerabilities and updated prior to deployment. Then, we will show you how to periodically scan selected EC2 AMIs based on a tagging strategy, and take automated actions.
The solution provided in this post has a number of items that you will need to review and address before you deploy the solution:
If you don’t add this additional policy, the Step Functions state machine won’t allow the EC2 instances to launch. For more information, see Key policy sections that allow access to the customer managed key.
In this solution, you will use the follow AWS services and features:
Figure 1 shows the solution architecture.
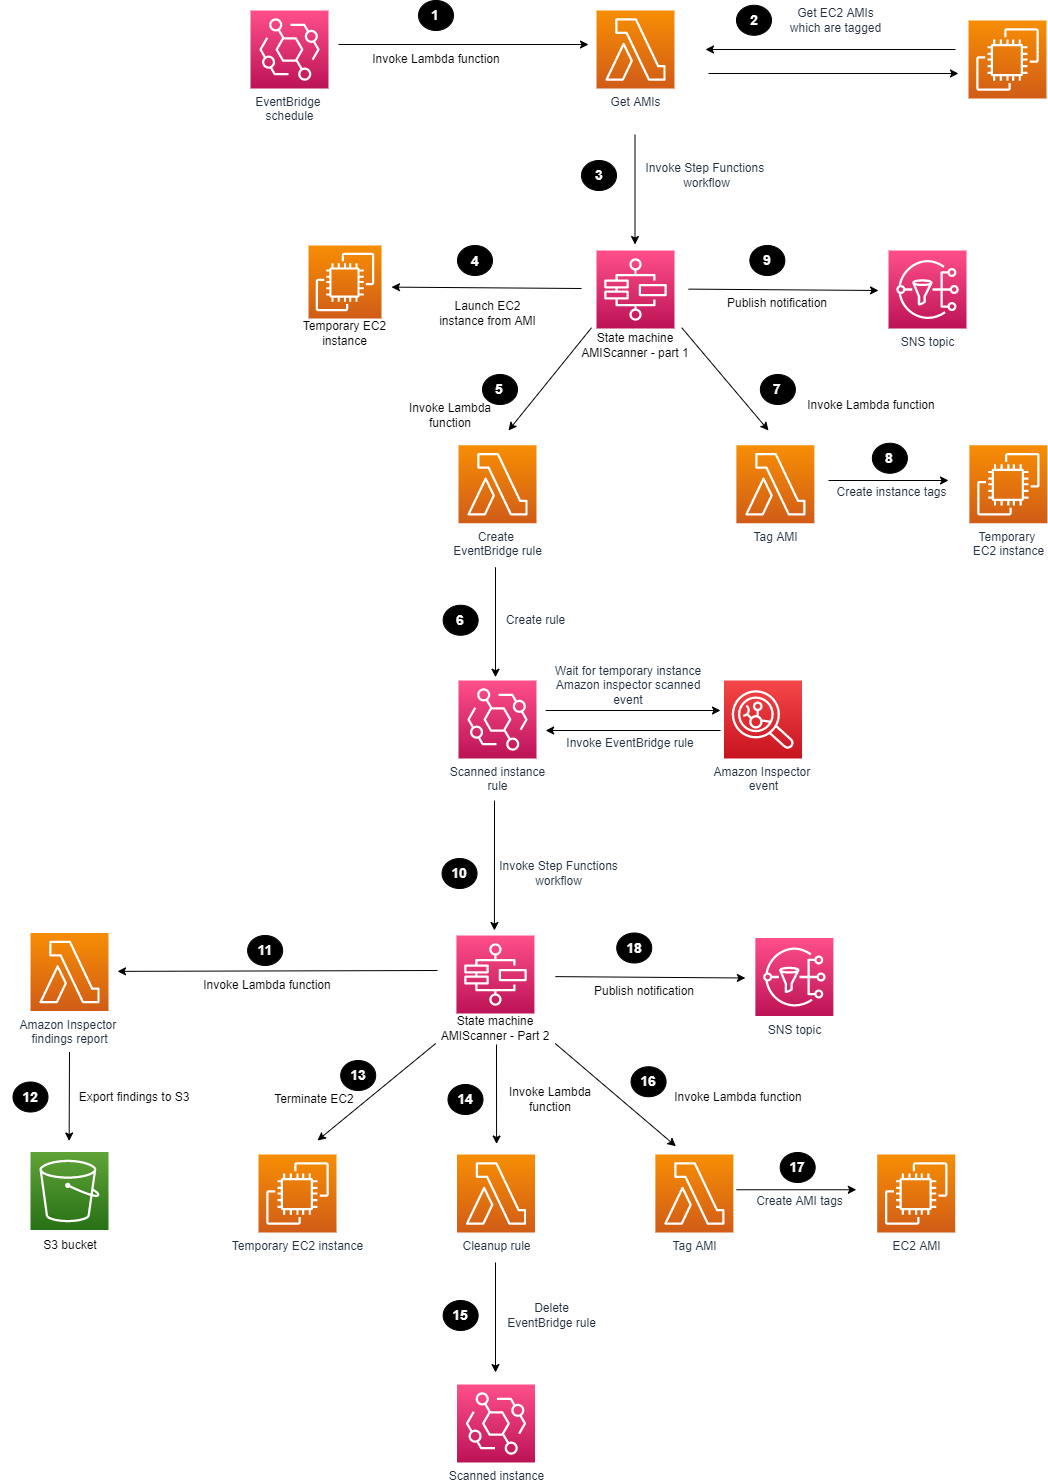
Figure 1: Amazon Inspector scanning of an AMI
The high-level workflow of the solution is as follows:
The solution will be deployed with the scheduled rule in Amazon EventBridge disabled to allow you to create your tagging strategy and to familiarize yourself with the solution. Later in this post, we’ll cover how to enable the Amazon EventBridge scheduled rule.
For this next step, make sure that you deploy the CloudFormation template provided for multi-AMI scanning in the AWS account and Region where you want to test this solution.
![]()
Make sure that you configure the following parameters in the CloudFormation template so that it deploys successfully:
After the CloudFormation stack has deployed successfully, you can use the deployed solution.
The first Step Functions state machine requires parameters to be passed in; the SingleAMI Lambda function accomplishes this. You can start the Lambda function by creating a test event and passing the correct JSON text and parameters. The following parameters are available in the output section of the CloudFormation stack that the solution deployed:
The following is an example parameter configuration and JSON that you can use to run the Lambda function. Make sure to replace each <user input placeholder> with your own information.
After the first state machine is finished, the EventBridge rule listens for the successful Amazon Inspector scan event. An SNS notification is sent, similar to the following.
After Amazon Inspector has finished scanning the EC2 instance, and the second state machine completes successfully, the Amazon Inspector finding report appears in the S3 bucket and notifications appear on the SNS topic that was created. The following is an example of an SNS notification.
You can enable the EventBridge scheduled rule to handle multiple AMIs and automatic scheduling. The scheduled rule invokes a Lambda function on a scheduled basis that identifies AMIs with the appropriate tags and passes parameters to the Step Functions workflow.

Figure 2: Enable Amazon EventBridge scheduled rule
With Amazon Athena, you can run SQL queries on raw data that is stored in S3 buckets. The Amazon Inspector reports are exported to S3, and you can query the data and create tables by using AWS Glue crawlers. To make sure that AWS Glue can crawl the S3 data, you need to add the role that you create for AWS Glue to the AWS KMS key permissions, so that AWS Glue can decrypt the S3 data. The following is an example policy JSON that you can update. Make sure to replace the AWS account ID <111122223333> and S3 bucket name <DOC-EXAMPLE-BUCKET-111122223333> with your own information.
After an AWS Glue Data Catalog has been built, you can run the crawler on a scheduled basis to help keep the catalog up to date with the latest Amazon Inspector findings as they are exported into the S3 bucket.
Using Amazon Athena, you can run queries against the Amazon Inspector reports to generate output data that is relevant to your environment. For example, to list the AMIs that are affected by high-severity findings, you can run the following SQL query. Make sure to replace <DOC-EXAMPLE-BUCKET-111122223333> with your own information.
With the results, you can use AWS Systems Manager to update the relevant AMIs to include the latest patches and update the launch template used in your Auto Scaling groups.
To further extend this solution, you can also use Amazon QuickSight to visualize the data by connecting to the AWS Glue table and producing dashboards for consumption.
By performing security assessments of your AMIs on a regular basis, you can gain greater visibility and control over the security of your EC2 instances that are created from those AMIs. In this blog post, you learned how to set up AMI vulnerability assessments, and how the results of these continuous vulnerability assessments can help you keep your environment up to date with security patches. For additional hands-on walkthroughs for Amazon Inspector, see Amazon Inspector workshops. You can find the code for this blog post in the inspector-ami-scanning-solution GitHub repository.
If you have feedback about this post, submit comments in the Comments section below. If you have questions about this post, contact AWS Support.
Want more AWS Security news? Follow us on Twitter.
Post Syndicated from Barry Kaufman original https://www.backblaze.com/blog/how-to-back-up-your-android/

Think for a second about that Android device in your hand. Maybe it’s a smartphone, maybe it’s a tablet. Whether it’s a Samsung, Google, or Motorola, it still has Android in its DNA. But more important than its DNA is the data stored in its memory.
You probably don’t think about how much irreplaceable data is in there—treasured photos, important documentation, passwords, bank information, the list goes on. But you might want to give it a few minutes of your time because, as smart as your phone is, it’s also remarkably fragile. A trip down the stairs or a dip in the toilet and your phone is toast, taking with it all of that important data. Opening one wrong email or clicking one wrong link could be all it takes for ransomware to infiltrate your data.
In cases like these, the best solution is an ounce of prevention: Getting all those important files backed up before disaster strikes.
Before we get your Droid all backed up and ready to roll, it’s important to understand why you should back up, why syncing isn’t enough, how different phones offer different means of backup, and why a 3-2-1 backup strategy should be your ultimate goal.
And since we’re talking Androids, we’ll obviously be spending a little time in a galaxy far, far away.
In order to understand the importance of backing up your Android, it might help to picture perhaps two of the most famous droids in cinematic history, and in fact the characters who inspired your phone’s name: R2-D2 and C-3PO.
(Seriously, Lucasfilm registered the trademark on the word “droid” in 1977 and has licensed it to both Motorola and Verizon. If you’re reading this, Disney, please don’t sue.)
If you recall the movie “The Force Awakens,” you’ll remember the sub-plot about the search for Luke Skywalker, who had gone into hiding. As the film opens, plucky little droid BB-8 obtained part of the map that could locate him. However, the rest of the map was locked away in R2-D2’s memory units, rendering BB-8’s map useless. Since R2-D2 was mysteriously shut down for purposes of advancing the movie’s plot, that data was unobtainable and thus required a whole film’s worth of daring adventure to restore.
Fortunately, Princess Leia and company seem to have learned their lesson about proper backups by the time of “Rise of Skywalker,” since they had a backup ready for C-3PO. After wiping his hard drive so that the protocol droid could bypass his programming and read the Sith language found on an ancient knife (yes, the plot was that ridiculous), 3PO was able to restore his memories thanks to a backup he’d entrusted to R2.
Had they chosen to merely sync C-3PO’s internal data, he would have been stuck remembering nothing of the Star Wars saga except for “Rise of Skywalker,” which would be a tragic fate for anyone.
With syncing, data is maintained in one form across devices or platforms. This has its usefulness, especially when you can edit something on your phone or tablet and see those changes on your laptop, for example, but also has drawbacks that make it a poor substitute for backing up. Among them:
It’s all well and good to hear about backing up fictional droids, but what about the actual Android device in your hand? Thankfully, it’s somehow even simpler in our galaxy than it is in one where people have actual spaceships.
Both Google and Samsung have backup programs for their respective devices, and we’ll explain a third option where you manage the backups.
Native to Google’s Pixel devices, but also found on nearly every Android device since it was introduced in 2021, Google One offers a backup service analogous to iCloud, with 15GB of free storage tied to your Google account.
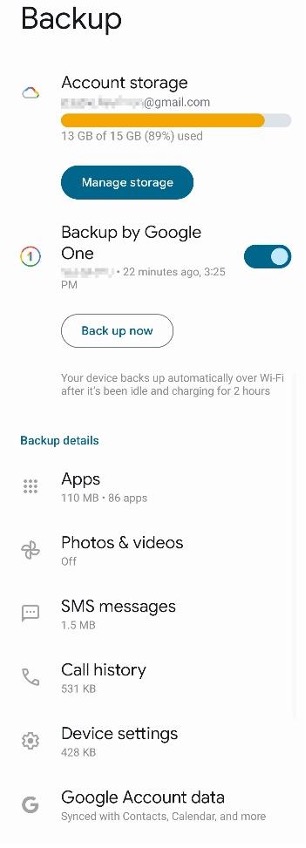
Pros: Works automatically. Backs up apps, phone history, text messages, photos, contacts, and assorted calendar information associated with your account. It can also load data automatically onto a new device when you sign in with your Google account.
Cons: You have to pick and choose what gets backed up. Yes, this is a con. This level of control might seem nice, but again, we’d recommend you just back up everything. Honestly, the more granular you get with what gets backed up, the more likely you are to forget to back up something you might need. It also operates more like a sync than a backup, so accidental erasure is still a risk. To truly back up your data and keep it safe, you’ll need to keep a third copy of the data somewhere (we’ll explain that later). Also, if you get close to maxing out your storage, ready yourself for endless reminders to buy more storage across all of your devices.
As the heavy hitter in the Android space, Samsung wasn’t about to let its Galaxy devices go without a built-in backup solution. Samsung’s Smart Switch comes pre-loaded on every Galaxy device. While it’s designed for moving data from one Galaxy to another, it can also create a backup to your Mac or PC using the Smart Switch app.
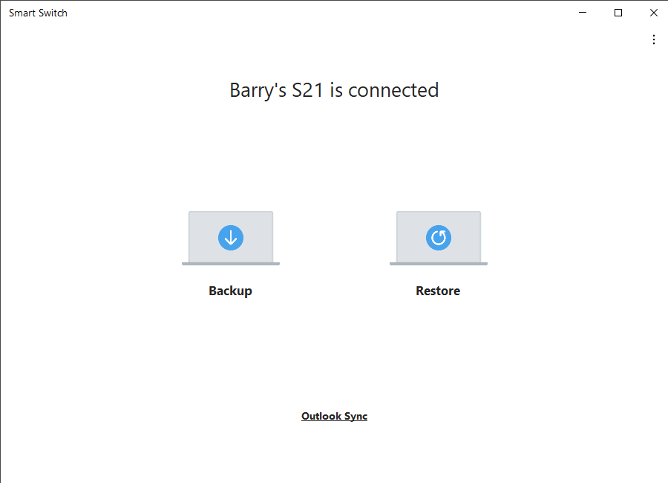
Of course, one of the great advantages of the Android operating system is its ability to play nice with pretty much every other operating system, unlike its Apple counterpart. Simply plug your charging cable into an available USB slot and your phone will essentially act like an external hard drive. On a Windows machine, this will show up like a separate hard drive nested under your PC in file explorer. On a Mac, you’ll need to take the extra step of downloading Android File Transfer.
Pros: Functions essentially like an external drive, meaning you can track down individual files or whole folders for targeted backup.
Cons: Android’s file structure can often make individual files difficult to track down. Transfer times can often drag on to the point of absurdity.
The guides in this series help you protect your content across many different platforms. We’re working on developing this list—please comment below if you’d like to see another platform covered.
Now that you have your data safely backed up and secured against any accidental destruction, loss, or damage to your Android, you might think you’re safe. But the cornerstone of any good backup strategy rests on not one, not two, but three pillars.
If you really need to be told why this is important, we’ve covered it here. But suffice to say, a 3-2-1 strategy relies on a trio of separate, redundant backups. One copy of your data stays on your Android device. Another copy of your data is stored on a separate on-premises device, such as your PC or an external hard drive (or, if available, a convenient R2-model astromech). Finally, a third copy stays off-premises—preferably in the cloud—to avoid the possibility of theft, fire, or total planetary destruction via Death Star.
If you’re a Backblaze Computer Backup user, that last step is taken care of. Backblaze backs up your entire computer, including any Android backups you saved to your Mac or PC.
By maintaining three redundant copies of important data—two on local devices and a third in a separate location—you are comprehensively protected against data loss. You may not be carrying around plans for the Empire’s new battle station, but the precious memories locked away on your Android device are just as important as protecting them.
May the force be with you (and again, Disney, please don’t sue).
The post How to Back Up Your Android appeared first on Backblaze Blog | Cloud Storage & Cloud Backup.
Post Syndicated from Matt Granger original https://www.youtube.com/watch?v=uA1Alg_SRYw
Post Syndicated from Talks at Google original https://www.youtube.com/watch?v=N-z5vozAUvE
Post Syndicated from Caitlin Condon original https://blog.rapid7.com/2023/07/18/etr-critical-zero-day-vulnerability-in-citrix-netscaler-adc-and-netscaler-gateway/
On Tuesday, July 18, Citrix published a security bulletin warning users of three new vulnerabilities affecting NetScaler ADC and NetScaler Gateway. Of the three vulnerabilities, CVE-2023-3519 is the most severe—successful exploitation allows unauthenticated attackers to execute code remotely on vulnerable target systems that are configured as a Gateway.
CVE-2023-3519 is known to be exploited in the wild. This product line is a popular target for attackers of all skill levels, and we expect that exploitation will increase quickly. Rapid7 strongly recommends updating to a fixed version on an emergency basis, without waiting for a typical patch cycle to occur. See the Citrix advisory for more information.
According to Citrix, the following supported versions of NetScaler ADC and NetScaler Gateway are affected by the vulnerabilities:
The advisory notes that NetScaler ADC and NetScaler Gateway version 12.1 is End Of Life (EOL) and is vulnerable. Citrix recommends that customers who are using an EOL version upgrade their appliances to one of the supported fixed versions below.
All three CVEs are remediated in the following fixed product versions:
Patches are available for vulnerable versions of NetScaler ADC and NetScaler Gateway and should be applied on an emergency basis. For more information, see Citrix’s advisory.
Our engineering team is investigating vulnerability check implementation options for InsightVM and Nexpose customers. We will update this blog with further information by 2 PM ET.
Post Syndicated from Dominik Richter original https://aws.amazon.com/blogs/messaging-and-targeting/how-quirion-created-nested-email-templates-using-amazon-simple-email-service-ses/
This is part two of the two-part guest series on extending Simple Email Services with advanced functionality. Find part one here.
quirion, founded in 2013, is an award-winning German robo-advisor with more than 1 billion Euro under management. At quirion, we send out five thousand emails a day to more than 60,000 customers.
We chose Amazon Simple Email Service (SES) because it is an easy-to-use and cost-effective email platform. In particular, we benefit from email templates in SES, which ensure a consistent look and feel of our communication. These templates come with a styled and personalized HTML email body, perfect for transactional emails. However, managing many email templates can be challenging. Several templates share common elements, such as the company’s logo, name or imprint. Over time, some of these elements may change. If they are not updated across all templates, the result is an inconsistent set of templates. To overcome this problem, we created an application to extend the SES template functionality with an interface for creating and managing nested templates.
This post shows how you can implement this solution using Amazon Simple Storage Service (Amazon S3), Amazon API Gateway, AWS Lambda and Amazon DynamoDB.
The solution we built is fully serverless, which means we do not have to manage the underlying infrastructure. We use AWS Cloud Development Kit (AWS CDK) to deploy the architecture.
The figure below describes the architecture diagram for the proposed solution.

The solution is simplified for this blog post and is used to show the possibilities of SES. We will not discuss the code of the Lambda function as there are several ways to implement it depending on your preferred programming language.
$ git clone https://github.com/quirionit/aws-ses-examples.git
$ cd aws-ses-examples/projects/go-src
$ go mod tidy
$ cd ../../projects/template-api
$ npm install
$ cdk deployTo create a nested email template, complete the following steps:


aws-ses-examples/projects/template-api/files and run the following command. Note that you must use your gateway’s Invoke URL.
curl -F [email protected] -F "isWrapper=true" -F "templateName=m-full" -F "child=content" -F "variables=FIRSTNAME" -F "variables=LASTNAME" -F "plain=Hello {{.FIRSTNAME}} {{.LASTNAME}},{{template \"content\" .}}" YOUR INVOKE URL/emailsThe request triggers the Lambda function, which creates a template in DynamoDB and S3. In addition, the Lambda function uses the properties of the request to decide when and how to create a template in SES. With “isWrapper=true” the template is marked as a template that wraps another template and therefore no template is created in SES. “child=content” specifies the entry point for the child template that is used within m-full.html. It also uses FIRSTNAME and LASTNAME as replacement tags for personalization.


aws-ses-examples/projects/template-api/files in a text editor.aws-ses-examples/projects/template-api/files and run the following command:aws ses send-templated-email --cli-input-json file://send-order-confirmation.jsonaws-ses-examples/projects/template-api.cdk destroy.aws ses delete-template --template-name order-confirmationThere are several ways to extend this solution’s functionality, including the ones below:
In this blog post, we explored how to use Amazon SES with email templates to easily create complex transactional emails. The AWS CLI was used to trigger SES to send an email, but that could easily be replaced by other AWS services like Step Functions. This solution as a whole is a fully serverless architecture where we don’t have to manage the underlying infrastructure. We used the AWS CDK to deploy a predefined architecture and analyzed the deployed resources.
About the authors
 |
Mark Kirchner is a backend engineer at quirion AG. He uses AWS CDK and several AWS services to provide a cloud backend for a web application used for financial services. He follows a full serverless approach and enjoys resolving problems with AWS. |
 |
Dominik Richter is a Solutions Architect at Amazon Web Services. He primarily works with financial services customers in Germany and particularly enjoys Serverless technology, which he also uses for his own mobile apps. |
The content and opinions in this post are those of the third-party author and AWS is not responsible for the content or accuracy of this post.
Post Syndicated from Dominik Richter original https://aws.amazon.com/blogs/messaging-and-targeting/how-quirion-sends-attachments-using-email-templates-with-amazon-simple-email-service-ses/
This is part one of the two-part guest series on extending Simple Email Services with advanced functionality. Find part two here.
quirion is an award-winning German robo-advisor, founded in 2013, and with more than 1 billion euros under management. At quirion, we send out five thousand emails a day to more than 60,000 customers.
We chose Amazon Simple Email Service (SES) because it is an easy-to-use and cost-effective email platform. In particular, we benefit from email templates in SES, which ensure a consistent look and feel of our communication. These templates come with a styled and personalized HTML email body, perfect for transactional emails. Sometimes it is necessary to add attachments to an email, which is currently not supported by the SES template feature. To overcome this problem, we created a solution to use the SES template functionality and add file attachments.
This post shows how you can implement this solution using Amazon Simple Storage Service (Amazon S3), Amazon EventBridge, AWS Lambda and AWS Step Functions.
The solution we built is fully serverless, which means we do not have to manage the underlying infrastructure. We use AWS Cloud Development Kit (AWS CDK) to deploy the architecture and analyze the resources.
The solution extends SES to send attachments using email templates. SES offers three possibilities for sending emails:
In this post, we will combine the Raw and the Templated options.
The figure below describes the architecture diagram for the proposed solution.
The solution is simplified for this blog post and is used to show the possibilities of SES. We will not discuss the code of the lambda function as there are several ways to implement it depending on your preferred programming language.

To download and deploy the application run the following commands:
$ git clone [email protected]:quirionit/aws-ses-examples.git
$ cd aws-ses-examples/projects/go-src
$ go mod tidy
$ cd ../../projects/email-sender
$ npm install
$ cdk deployIn your terminal, navigate to aws-ses-examples/projects/email-sender and run:
aws ses create-template --cli-input-json file://files/hello_doc.json
To upload a document to S3, complete the following steps:
aws-ses-examples/projects/email-sender/files into the folder.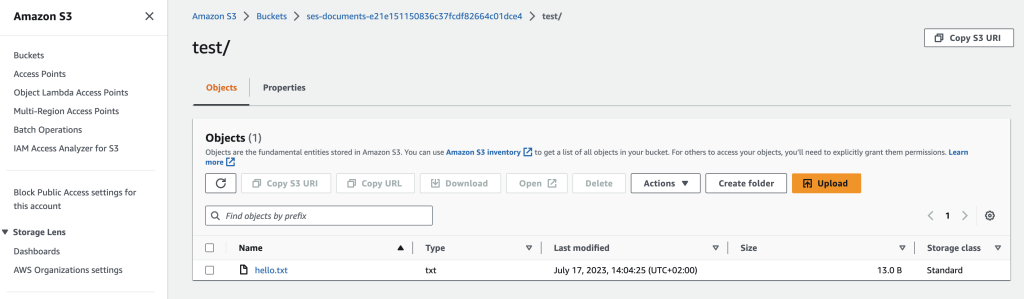
To trigger sending an email, complete the following steps:
aws-ses-examples/projects/email-sender/files/event.json. Don’t forget to replace the sender, recipient and bucket with your values.


aws-ses-examples/projects/email-sender.cdk destroy.aws ses delete-template --template-name HelloDocument
There are several ways to extend this solution’s functionality, see some of them below:
In this blog post, we explored how to use Amazon SES to send attachments using email templates. We used an Amazon EventBridge to trigger a Step Function that chooses between sending a raw or templated SES email. This solution uses a full serverless architecture without having to manage the underlying infrastructure. We used the AWS CDK to deploy a predefined architecture and analyzed the deployed resources.
About the authors
|
Mark Kirchner is a backend engineer at quirion AG. He uses AWS CDK and several AWS services to provide a cloud backend for a web application used for financial services. He follows a full serverless approach and enjoys resolving problems with AWS. |
|
Dominik Richter is a Solutions Architect at Amazon Web Services. He primarily works with financial services customers in Germany and particularly enjoys Serverless technology, which he also uses for his own mobile apps. |
The content and opinions in this post are those of the third-party author and AWS is not responsible for the content or accuracy of this post.
Post Syndicated from original https://lwn.net/Articles/938236/
In a session at the 2023 Real Time Linux Summit, Thomas Gleixner answered
questions about the realtime feature of the kernel, its status, and the Real-Time Linux
project’s plans for the future. The talk was billed as a “Q&A about
PREEMPT_RT” with a caveat: “anything except printk() and
documentation”. As might be guessed, the first two questions were on just
those topics, but there were plenty of other questions (and answers) too.
The summit was
held in conjunction with the inaugural Embedded
Open Source Summit in Prague, Czechia at the end of June.
Post Syndicated from original https://lwn.net/Articles/938488/
Security updates have been issued by Fedora (java-1.8.0-openjdk), Red Hat (bind, bind9.16, curl, edk2, java-1.8.0-ibm, kernel, kernel-rt, and kpatch-patch), SUSE (iniparser, installation-images, java-1_8_0-ibm, kernel, libqt5-qtbase, nodejs16, openvswitch, and ucode-intel), and Ubuntu (linux-oem-6.0 and linux-xilinx-zynqmp).
Post Syndicated from Omer Yoachimik original http://blog.cloudflare.com/ddos-threat-report-2023-q2/
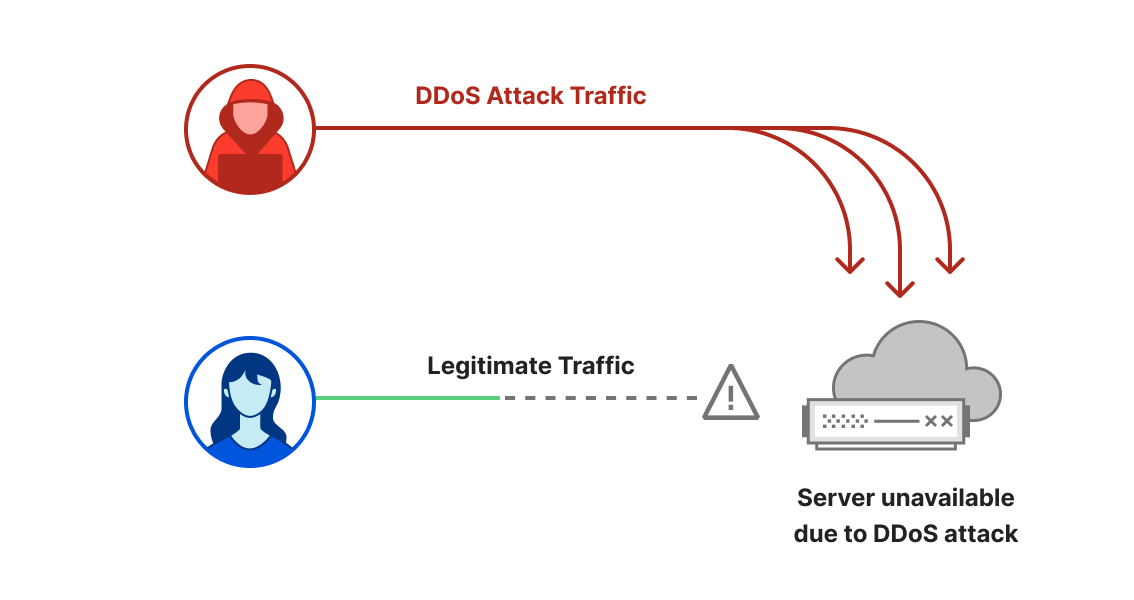
Welcome to the second DDoS threat report of 2023. DDoS attacks, or distributed denial-of-service attacks, are a type of cyber attack that aims to disrupt websites (and other types of Internet properties) to make them unavailable for legitimate users by overwhelming them with more traffic than they can handle — similar to a driver stuck in a traffic jam on the way to the grocery store.
We see a lot of DDoS attacks of all types and sizes and our network is one of the largest in the world spanning more than 300 cities in over 100 countries. Through this network we serve over 63 million HTTP requests per second at peak and over 2 billion DNS queries every day. This colossal amount of data gives us a unique vantage point to provide the community access to insightful DDoS trends.
For our regular readers, you might notice a change in the layout of this report. We used to follow a set pattern to share our insights and trends about DDoS attacks. But with the landscape of DDoS threats changing as DDoS attacks have become more powerful and sophisticated, we felt it's time for a change in how we present our findings. So, we'll kick things off with a quick global overview, and then dig into the major shifts we're seeing in the world of DDoS attacks.
Reminder: an interactive version of this report is also available on Cloudflare Radar. Furthermore, we’ve also added a new interactive component that will allow you to dive deeper into attack activity in each country or region.
The second quarter of 2023 was characterized by thought-out, tailored and persistent waves of DDoS attack campaigns on various fronts, including:
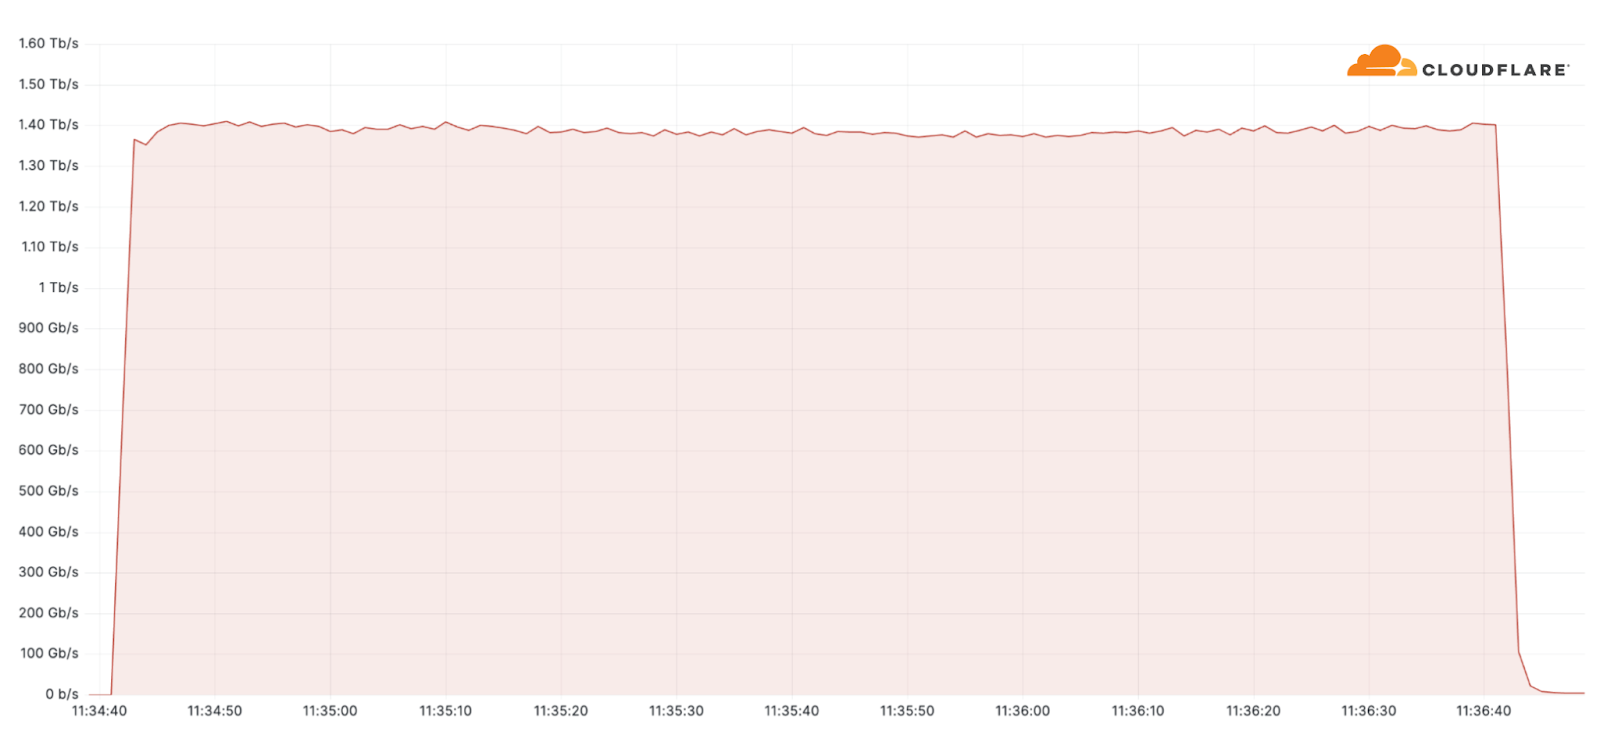
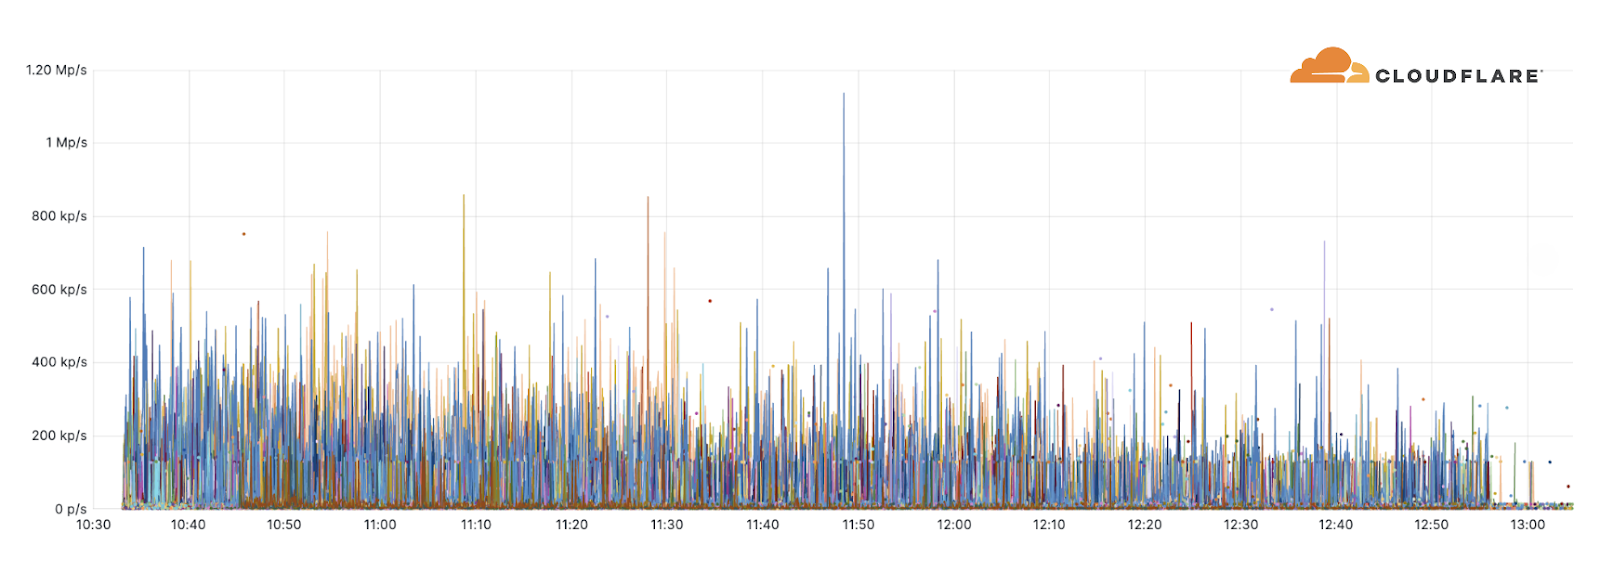
Additionally, one of the largest attacks we’ve seen this quarter was an ACK flood DDoS attack which originated from a Mirai-variant botnet comprising approximately 11K IP addresses. The attack targeted an American Internet Service Provider. It peaked at 1.4 terabit per seconds (Tbps) and was automatically detected and mitigated by Cloudflare’s systems.
Despite general figures indicating an increase in overall attack durations, most of the attacks are short-lived and so was this one. This attack lasted only two minutes. However, more broadly, we’ve seen that attacks exceeding 3 hours have increased by 103% QoQ.
Now having set the stage, let’s dive deeper into these shifts we’re seeing in the DDoS landscape.
On June 14, Pro-Russian hacktivist groups Killnet, a resurgence of REvil and Anonymous Sudan announced that they have joined forces to execute “massive” cyber attacks on the Western financial system including European and US banks, and the US Federal Reserve System. The collective, dubbed “Darknet Parliament”, declared its first objective was to paralyze SWIFT (Society for Worldwide Interbank Financial Telecommunication). A successful DDoS attack on SWIFT could have dire consequences because it's the main service used by financial institutions to conduct global financial transactions.
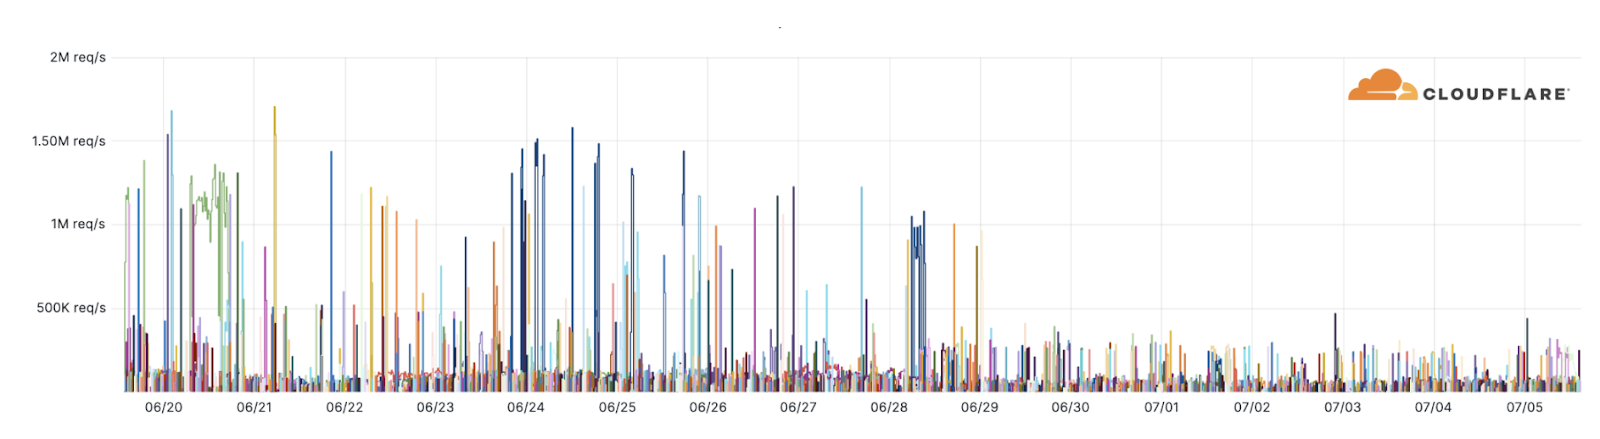
Beyond a handful of publicized events such as the Microsoft outage which was reported by the media, we haven’t observed any novel DDoS attacks or disruptions targeting our customers. Our systems have been automatically detecting and mitigating attacks associated with this campaign. Over the past weeks, as many as 10,000 of these DDoS attacks were launched by the Darknet Parliament against Cloudflare-protected websites (see graph below).
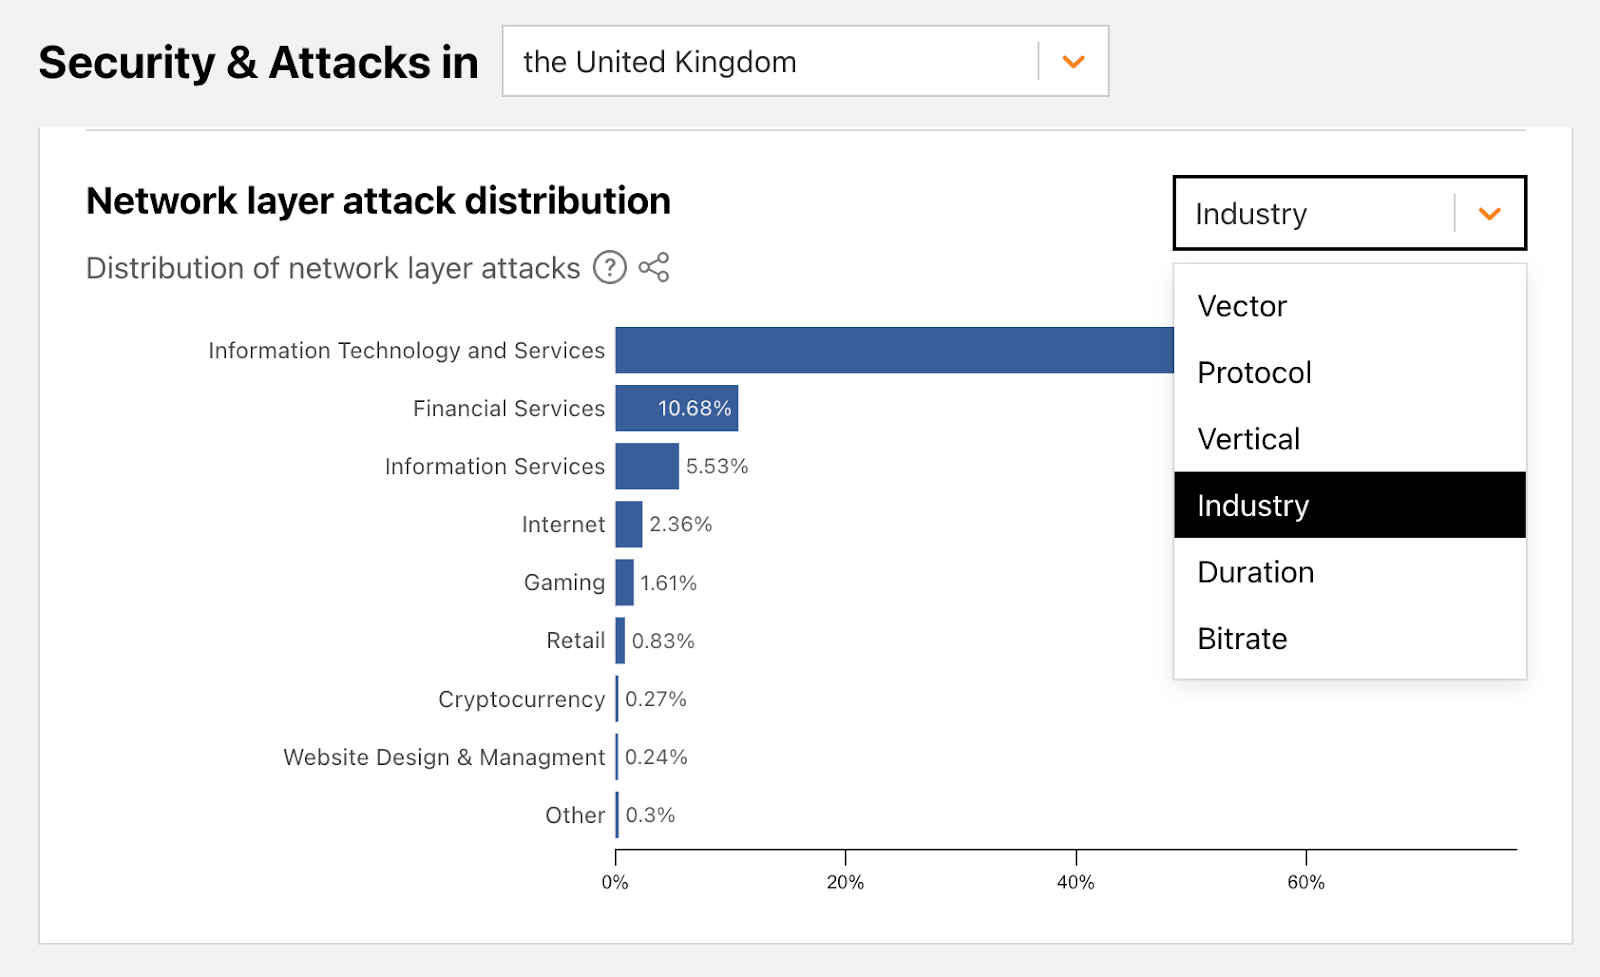
Despite the hacktivists’ statements, Banking and Financial Services websites were only the ninth most attacked industry — based on attacks we’ve seen against our customers as part of this campaign.
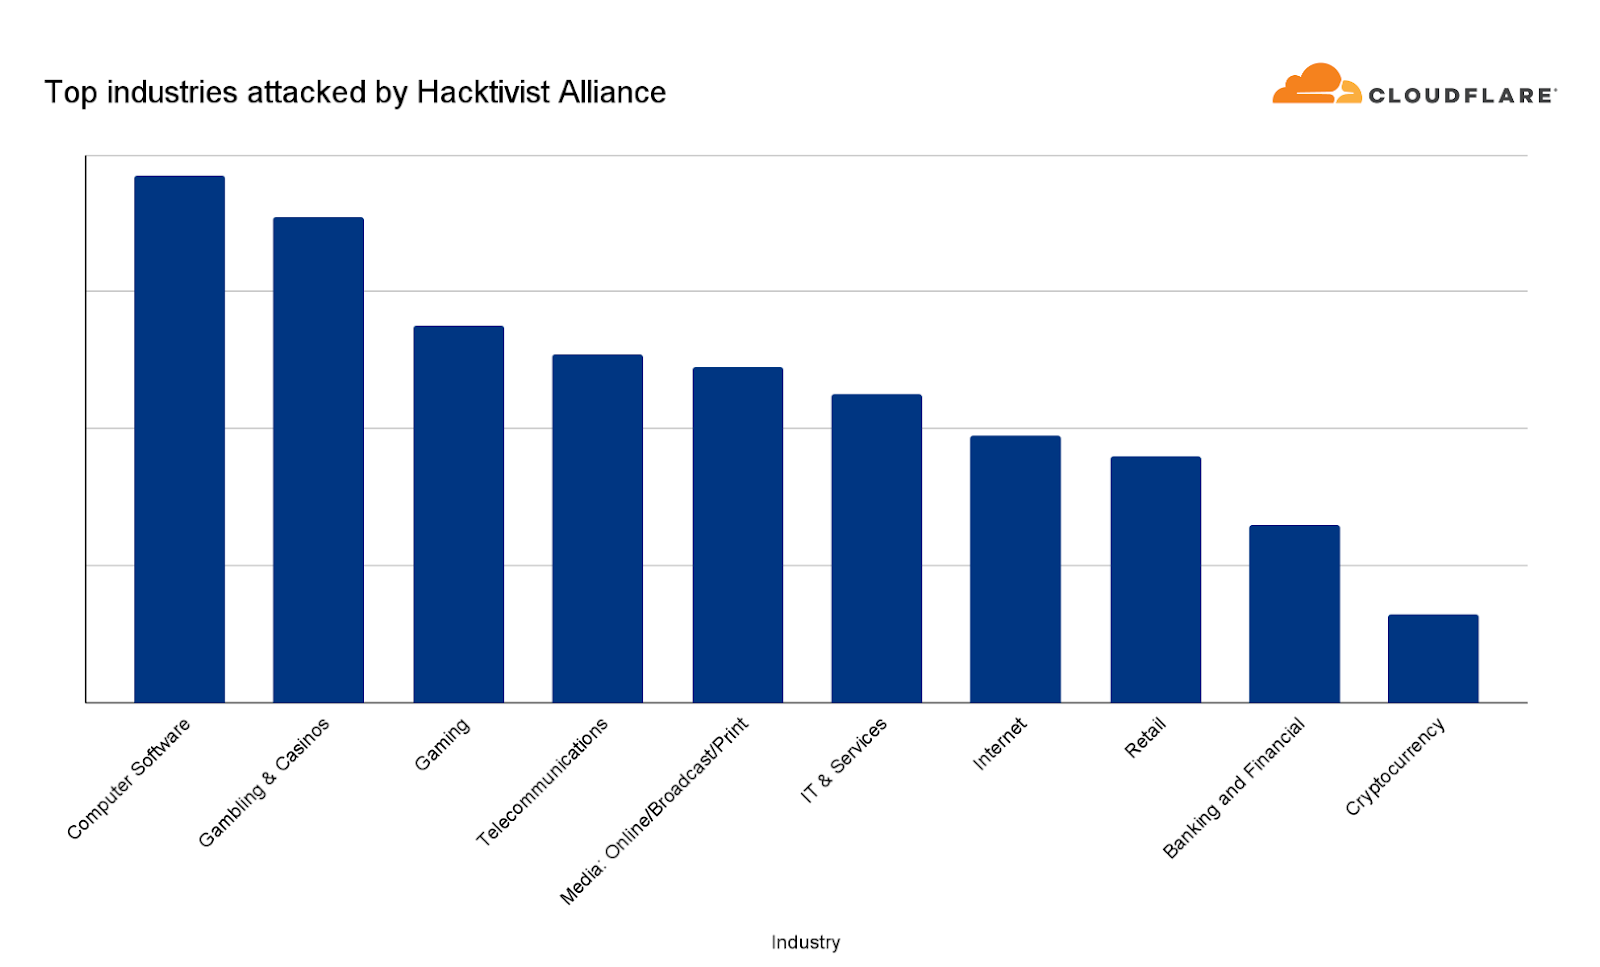
The most attacked industries were Computer Software, Gambling & Casinos and Gaming. Telecommunications and Media outlets came in fourth and fifth, respectively. Overall, the largest attack we witnessed in this campaign peaked at 1.7 million requests per second (rps) and the average was 65,000 rps.
For perspective, earlier this year we mitigated the largest attack in recorded history peaking at 71 million rps. So these attacks were very small compared to Cloudflare scale, but not necessarily for an average website. Therefore, we shouldn’t underestimate the damage potential on unprotected or suboptimally configured websites.
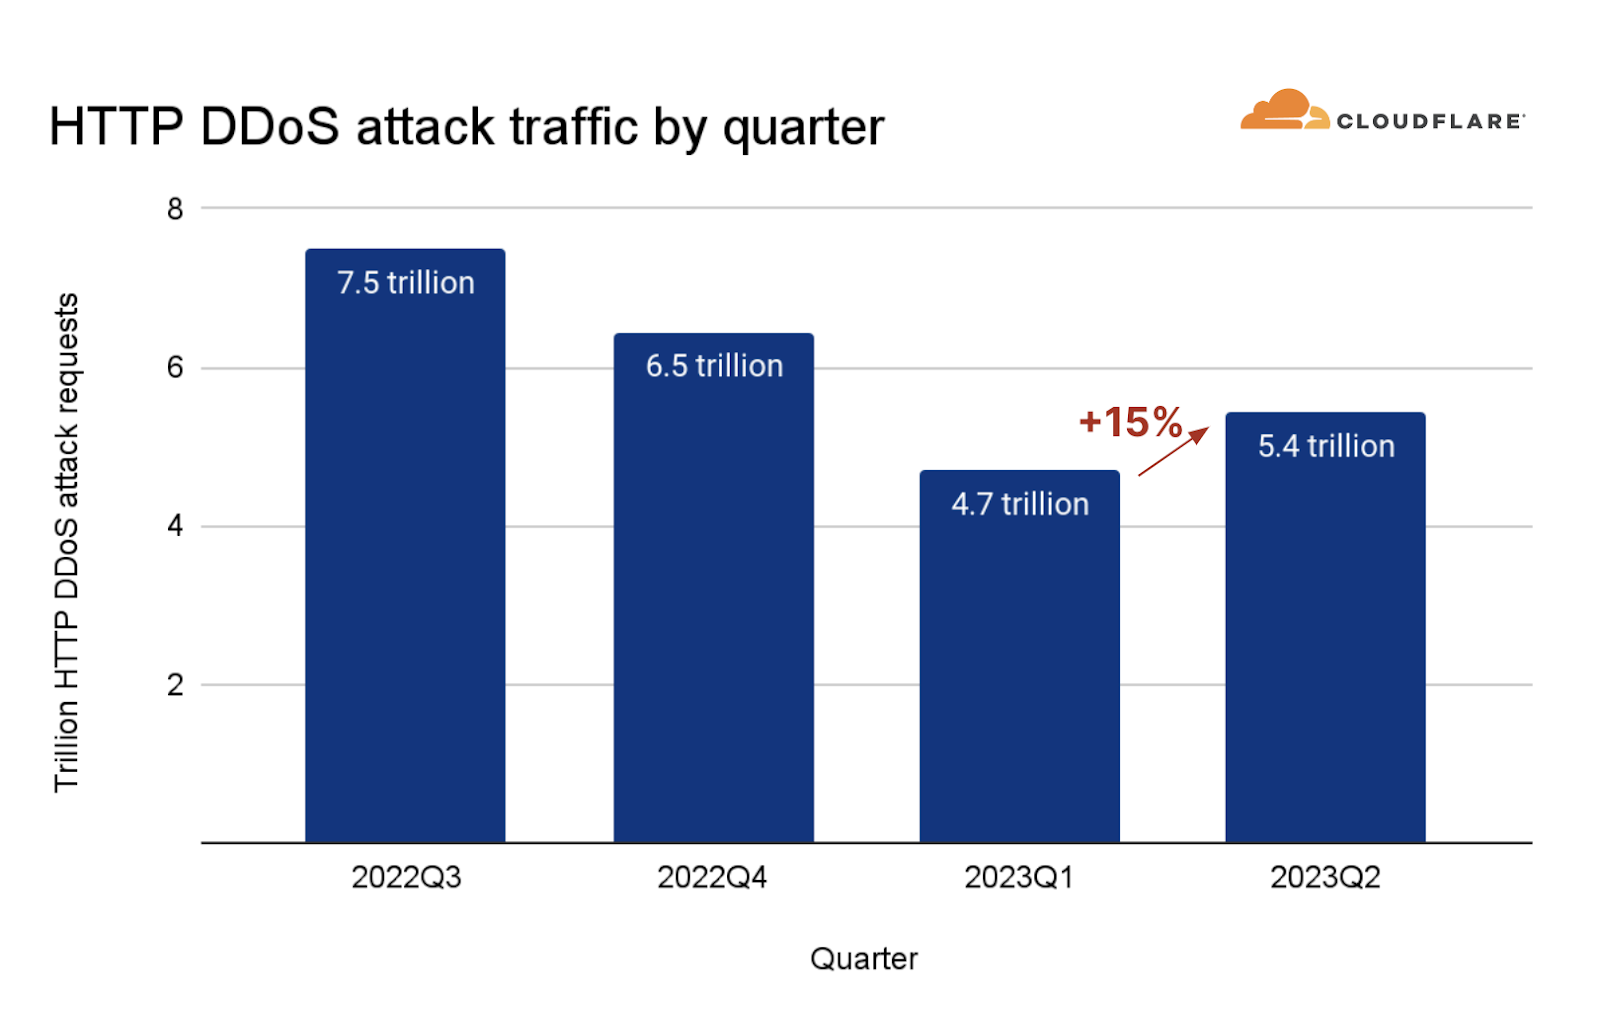
An HTTP DDoS attack is a DDoS attack over the Hypertext Transfer Protocol (HTTP). It targets HTTP Internet properties such as websites and API gateways. Over the past quarter, HTTP DDoS attacks increased by 15% quarter-over-quarter (QoQ) despite a 35% decrease year-over-year (YoY).
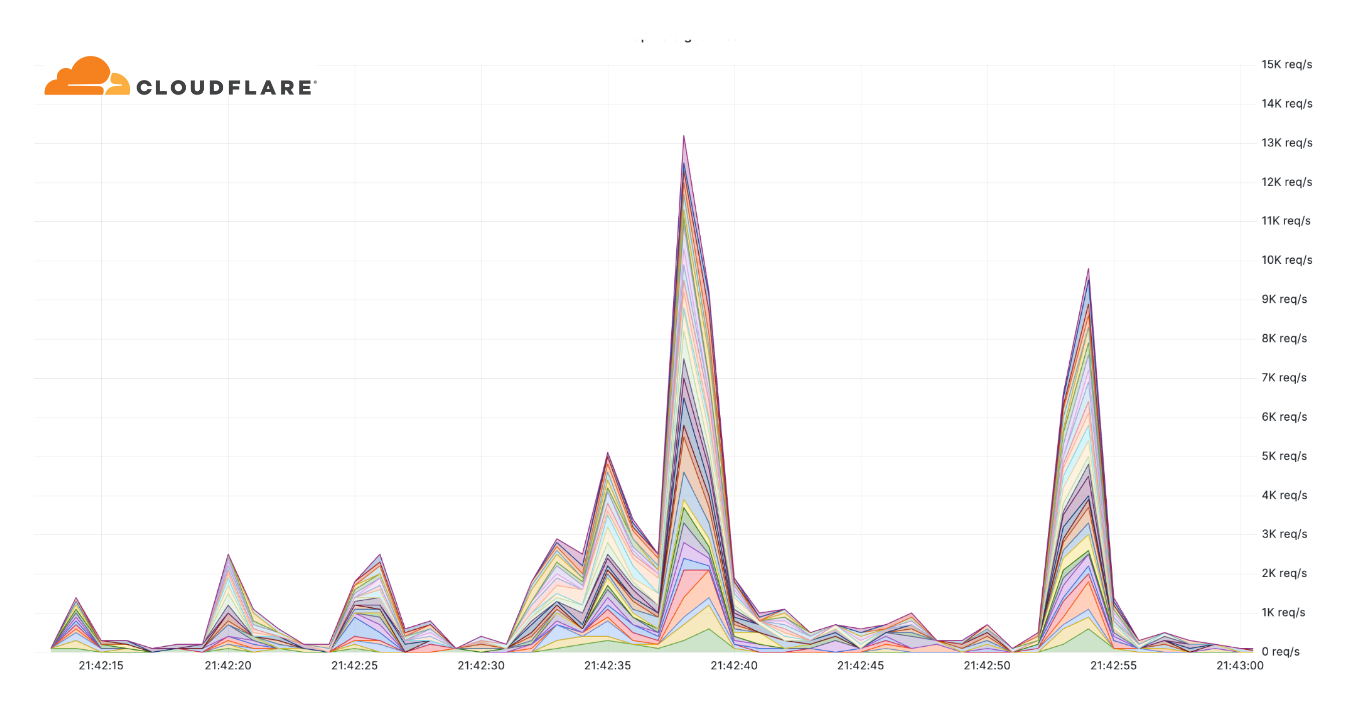
Additionally, we've observed an alarming uptick in highly-randomized and sophisticated HTTP DDoS attacks over the past few months. It appears as though the threat actors behind these attacks have deliberately engineered the attacks to try and overcome mitigation systems by adeptly imitating browser behavior very accurately, in some cases, by introducing a high degree of randomization on various properties such as user agents and JA3 fingerprints to name a few. An example of such an attack is provided below. Each different color represents a different randomization feature.
Furthermore, in many of these attacks, it seems that the threat actors try to keep their attack rates-per-second relatively low to try and avoid detection and hide amongst the legitimate traffic.
This level of sophistication has previously been associated with state-level and state-sponsored threat actors, and it seems these capabilities are now at the disposal of cyber criminals. Their operations have already targeted prominent businesses such as a large VoIP provider, a leading semiconductor company, and a major payment & credit card provider to name a few.
Protecting websites against sophisticated HTTP DDoS attacks requires intelligent protection that is automated and fast, that leverages threat intelligence, traffic profiling and Machine Learning/statistical analysis to differentiate between attack traffic and user traffic. Moreover, even increasing caching where applicable can help reduce the risk of attack traffic impacting your origin. Read more about DDoS protection best practices here.
The Domain Name System, or DNS, serves as the phone book of the Internet. DNS helps translate the human-friendly website address (e.g. www.cloudflare.com) to a machine-friendly IP address (e.g. 104.16.124.96). By disrupting DNS servers, attackers impact the machines’ ability to connect to a website, and by doing so making websites unavailable to users.
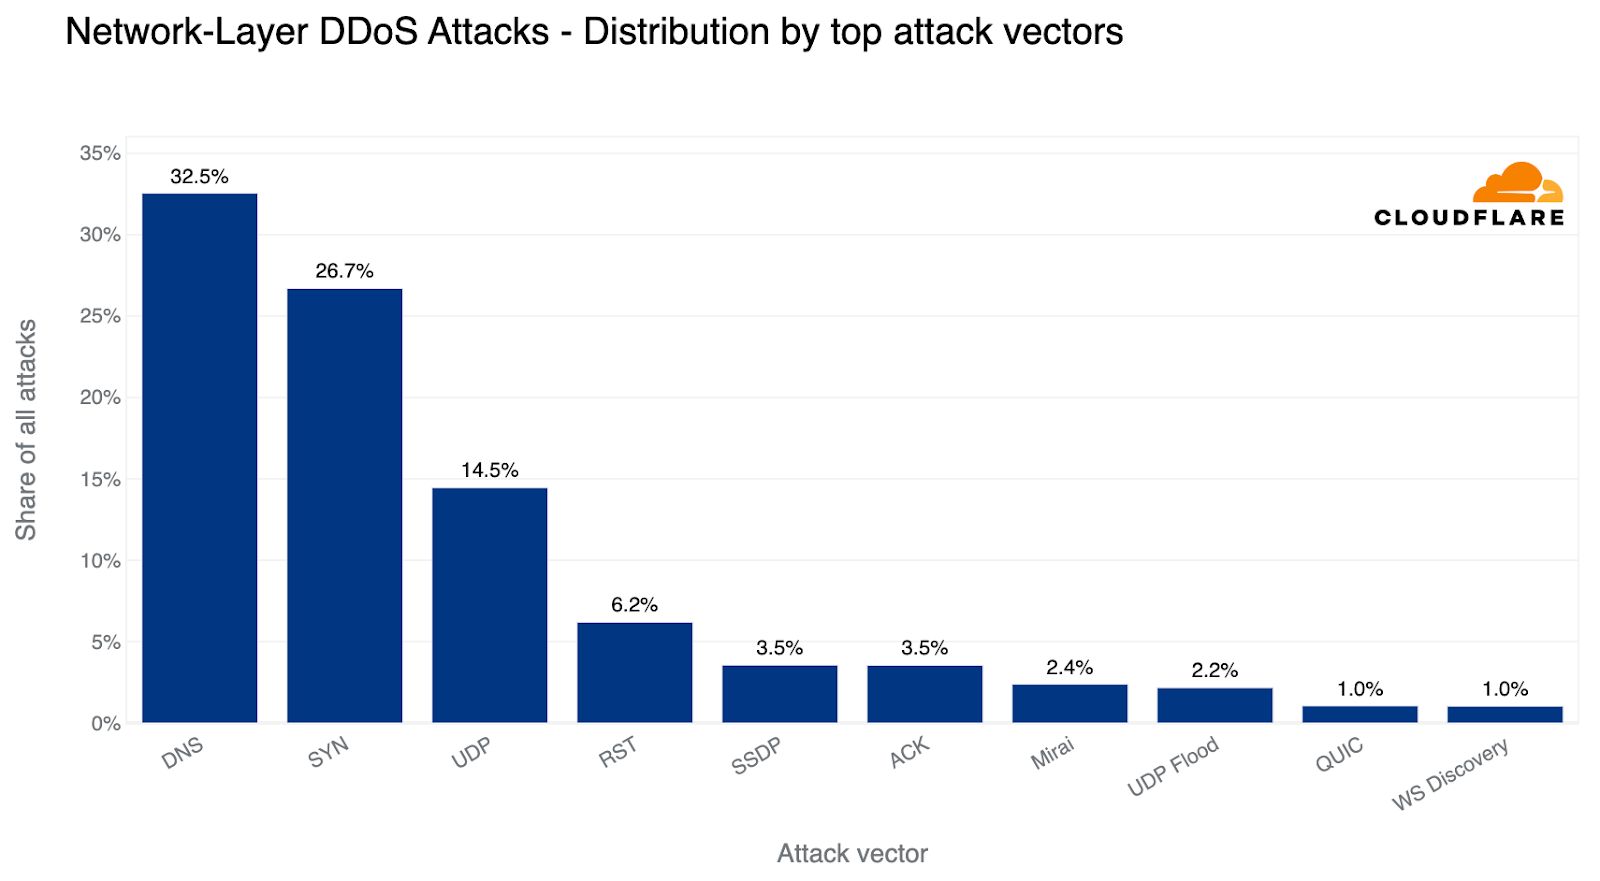
Over the past quarter, the most common attack vector was DNS-based DDoS attacks — 32% of all DDoS attacks were over the DNS protocol. Amongst these, one of the more concerning attack types we’ve seen increasing is the DNS Laundering attack which can pose severe challenges to organizations that operate their own authoritative DNS servers.
The term “Laundering” in the DNS Laundering attack name refers to the analogy of money laundering, the devious process of making illegally-gained proceeds, often referred to as "dirty money," appear legal. Similarly, in the DDoS world, a DNS Laundering attack is the process of making bad, malicious traffic appear as good, legitimate traffic by laundering it via reputable recursive DNS resolvers.
In a DNS Laundering attack, the threat actor will query subdomains of a domain that is managed by the victim’s DNS server. The prefix that defines the subdomain is randomized and is never used more than once or twice in such an attack. Due to the randomization element, recursive DNS servers will never have a cached response and will need to forward the query to the victim’s authoritative DNS server. The authoritative DNS server is then bombarded by so many queries until it cannot serve legitimate queries or even crashes all together.
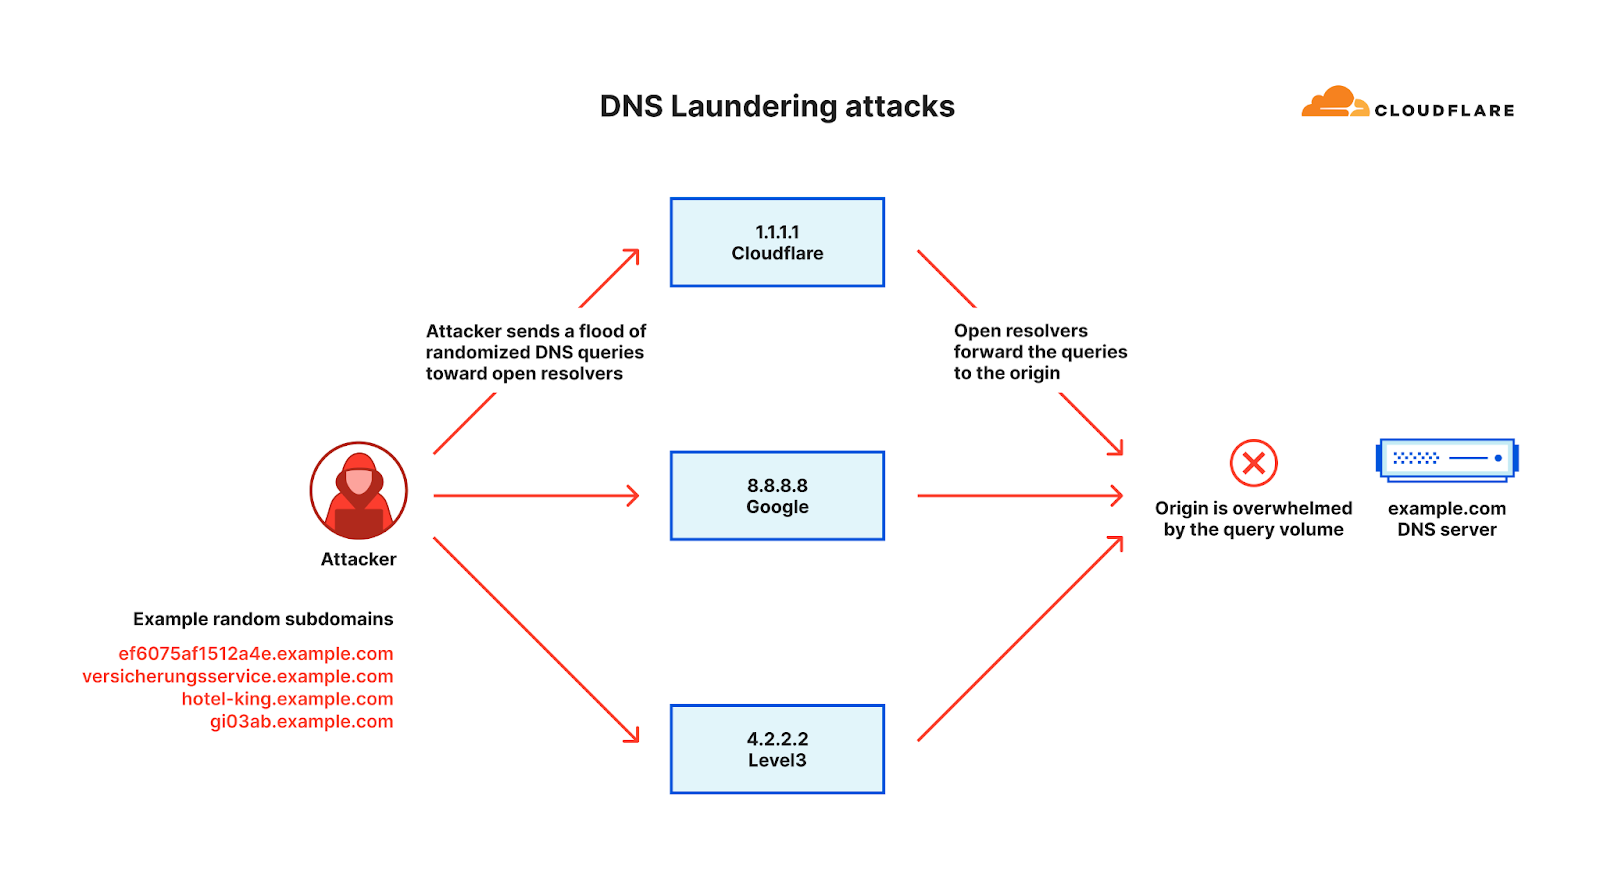
From the protection point of view, the DNS administrators can’t block the attack source because the source includes reputable recursive DNS servers like Google’s 8.8.8.8 and Cloudflare’s 1.1.1.1. The administrators also cannot block all queries to the attacked domain because it is a valid domain that they want to preserve access to legitimate queries.
The above factors make it very challenging to distinguish legitimate queries from malicious ones. A large Asian financial institution and a North American DNS provider are amongst recent victims of such attacks. An example of such an attack is provided below.
Similar to the protection strategies outlined for HTTP applications, protecting DNS servers also requires a precise, fast, and automated approach. Leveraging a managed DNS service or a DNS reverse proxy such as Cloudflare’s can help absorb and mitigate the attack traffic. For those more sophisticated DNS attacks, a more intelligent solution is required that leverages statistical analysis of historical data to be able to differentiate between legitimate queries and attack queries.
As we’ve previously disclosed, we are witnessing an evolution in botnet DNA. The era of VM-based DDoS botnets has arrived and with it hyper-volumetric DDoS attacks. These botnets are comprised of Virtual Machines (VMs, or Virtual Private Servers, VPS) rather than Internet of Things (IoT) devices which makes them so much more powerful, up to 5,000 times stronger.
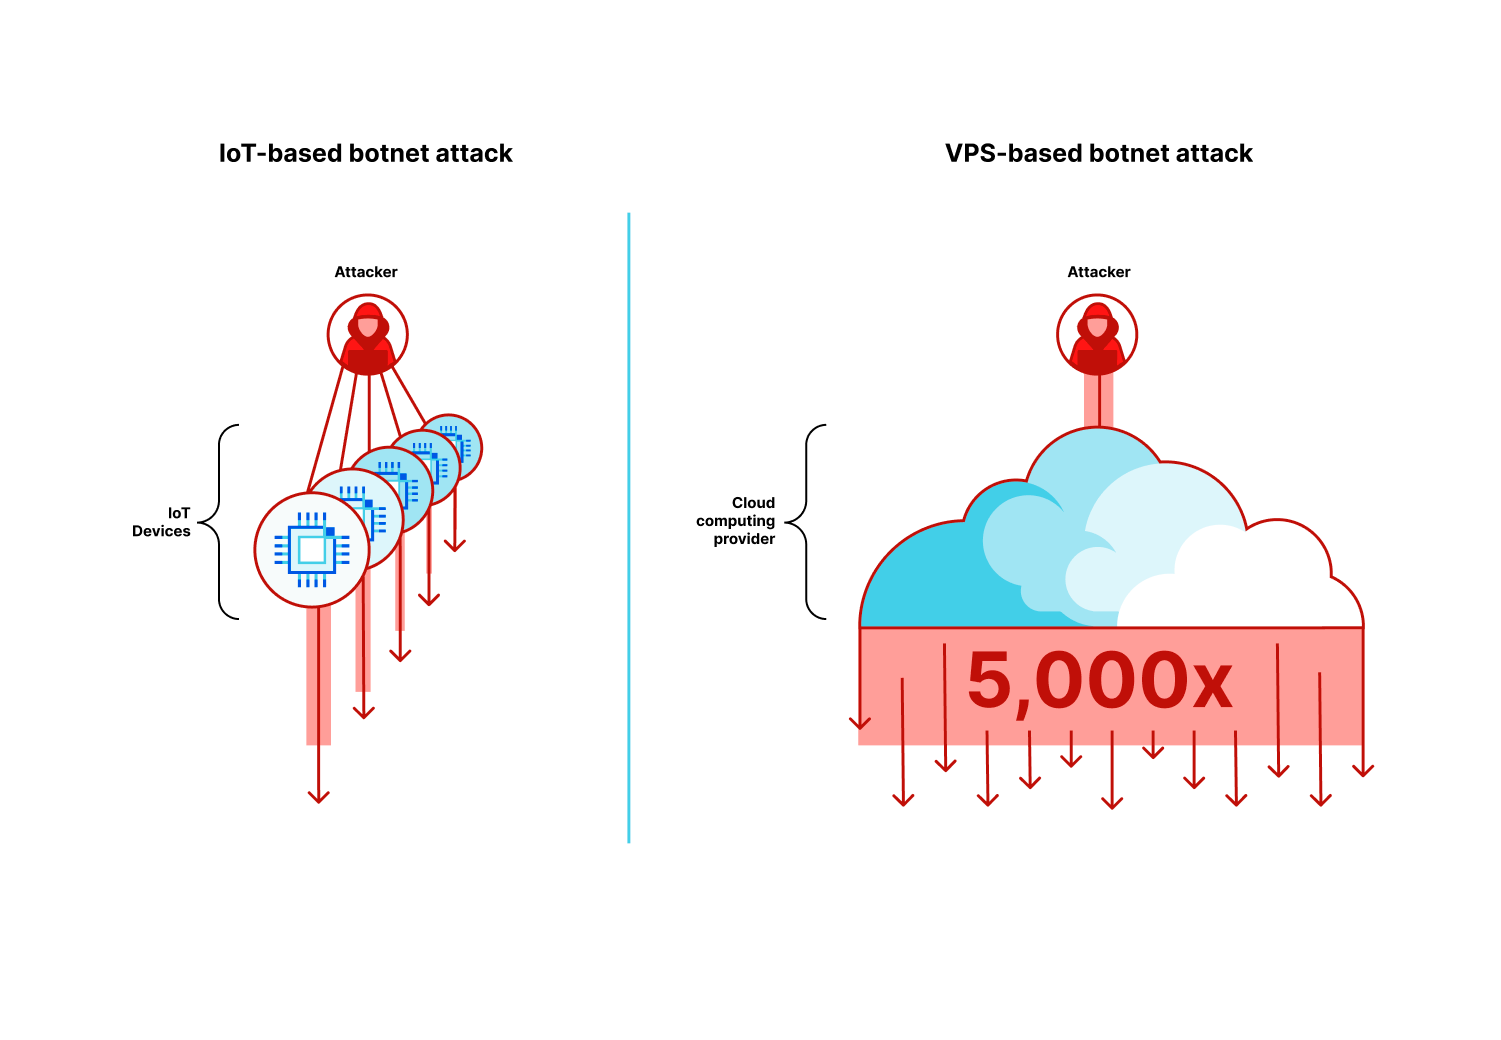
Because of the computational and bandwidth resources that are at the disposal of these VM-based botnets, they’re able to generate hyper-volumetric attacks with a much smaller fleet size compared to IoT-based botnets.
These botnets have executed one largest recorded DDoS attacks including the 71 million request per second DDoS attack. Multiple organizations including an industry-leading gaming platform provider have already been targeted by this new generation of botnets.
Cloudflare has proactively collaborated with prominent cloud computing providers to combat these new botnets. Through the quick and dedicated actions of these providers, significant components of these botnets have been neutralized. Since this intervention, we have not observed any further hyper-volumetric attacks yet, a testament to the efficacy of our collaboration.
While we already enjoy a fruitful alliance with the cybersecurity community in countering botnets when we identify large-scale attacks, our goal is to streamline and automate this process further. We extend an invitation to cloud computing providers, hosting providers, and other general service providers to join Cloudflare’s free Botnet Threat Feed. This would provide visibility into attacks originating within their networks, contributing to our collective efforts to dismantle botnets.
In March 2023, we disclosed a zero-day vulnerability (CVE-2022-26143), named TP240PhoneHome, which was identified in the Mitel MiCollab business phone system, exposing the system to UDP amplification DDoS attacks.
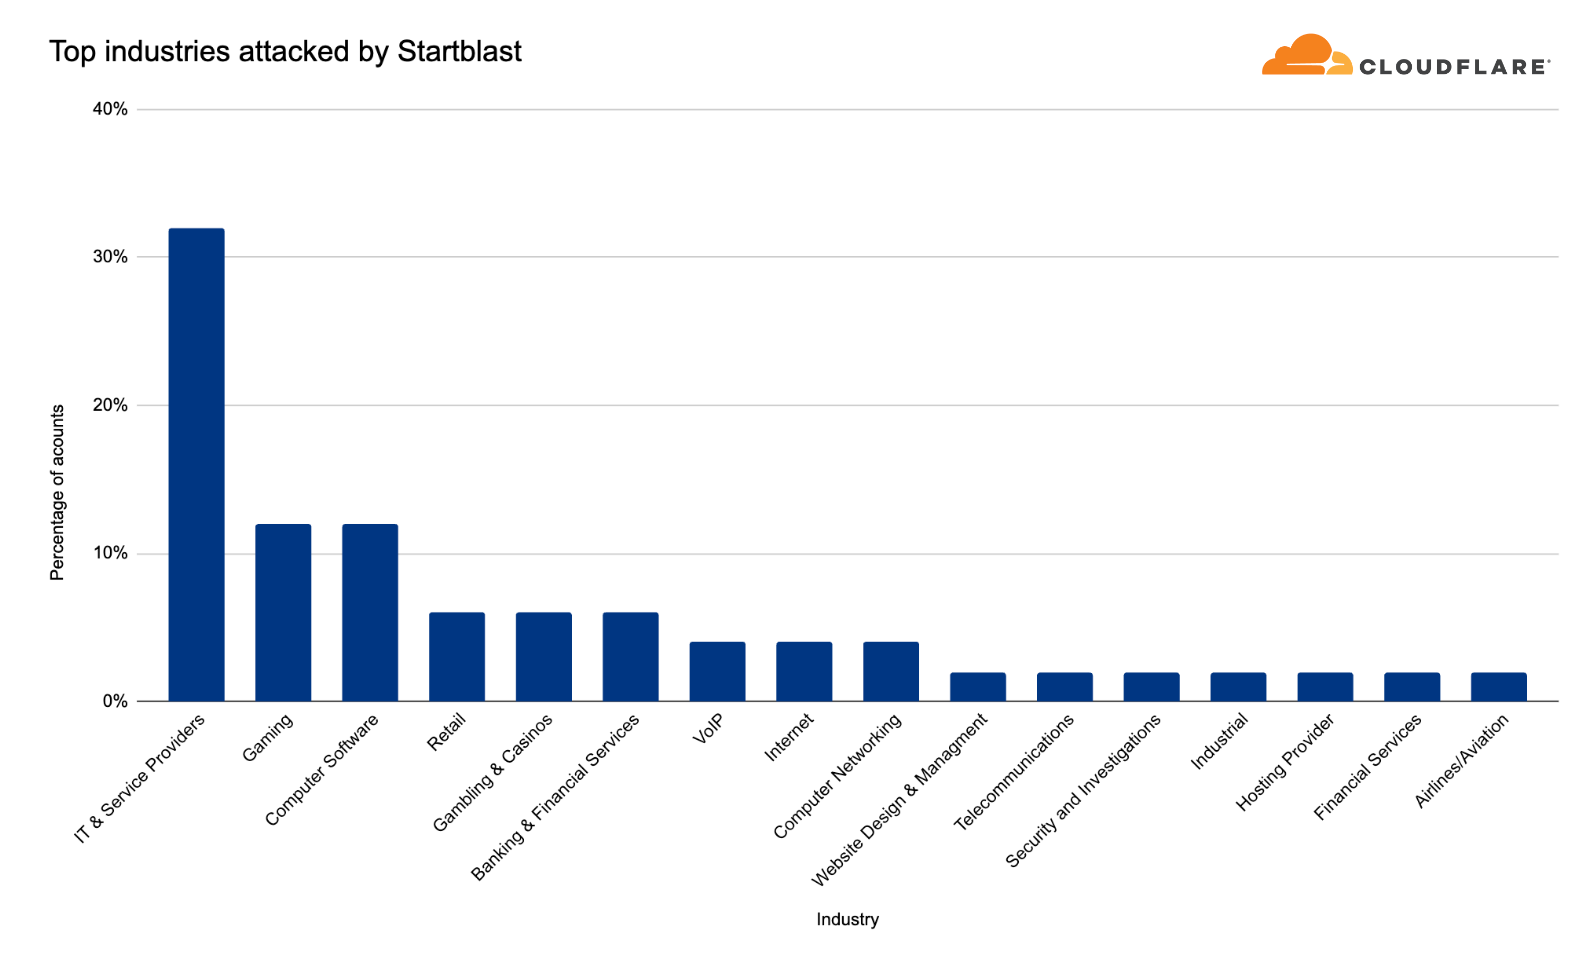
This exploit operates by reflecting traffic off vulnerable servers, amplifying it in the process, with a factor as high as 220 billion percent. The vulnerability stems from an unauthenticated UDP port exposed to the public Internet, which could allow malicious actors to issue a 'startblast' debugging command, simulating a flurry of calls to test the system.
As a result, for each test call, two UDP packets are sent to the issuer, enabling an attacker to direct this traffic to any IP and port number to amplify a DDoS attack. Despite the vulnerability, only a few thousand of these devices are exposed, limiting the potential scale of attack, and attacks must run serially, meaning each device can only launch one attack at a time.
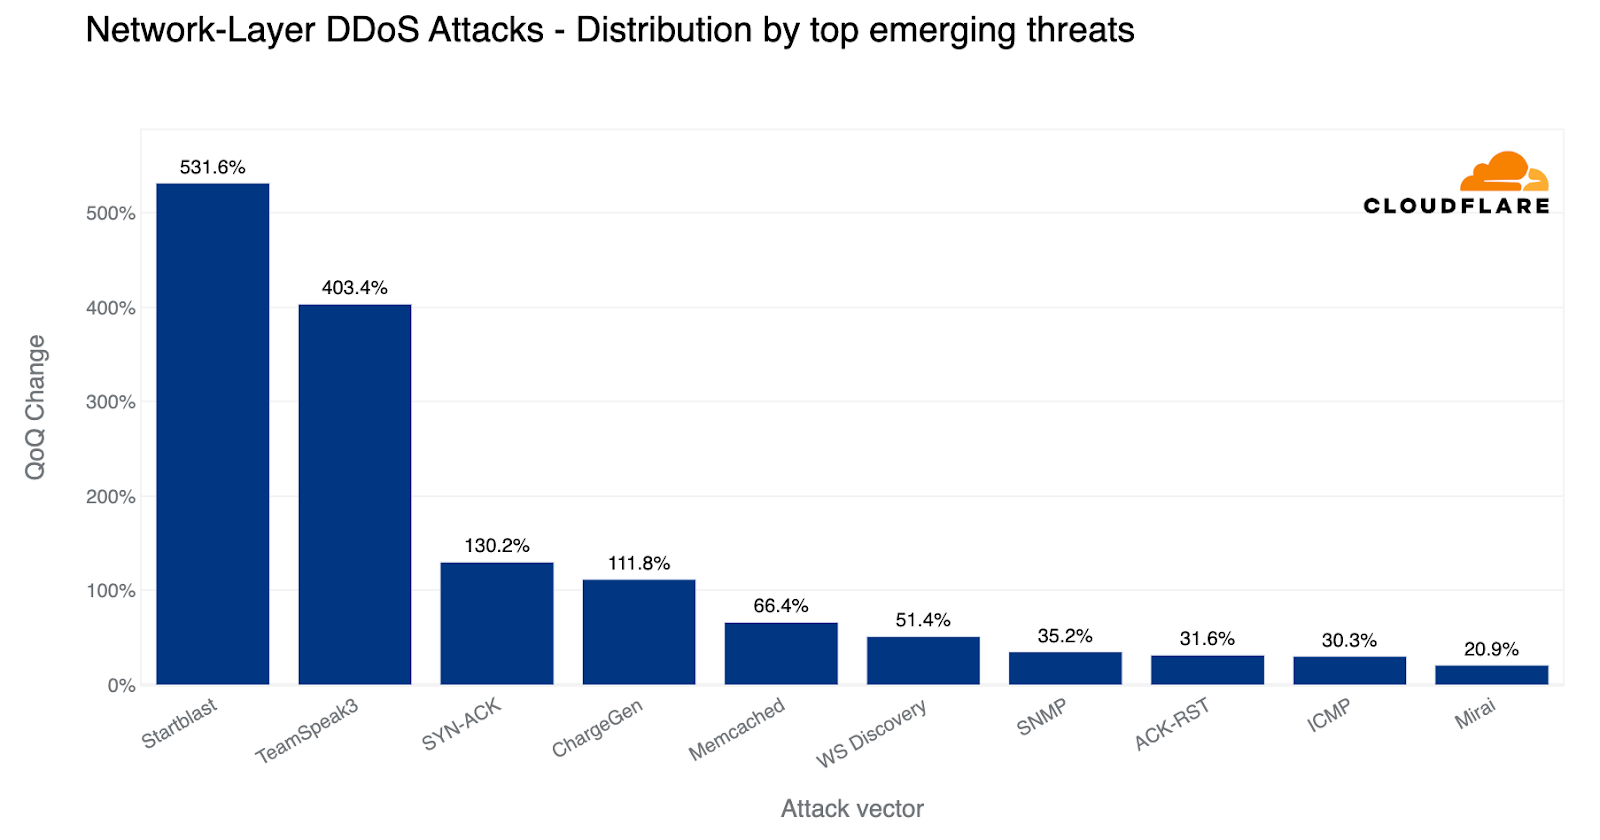
Overall, in the past quarter, we’ve seen additional emerging threats such as DDoS attacks abusing the TeamSpeak3 protocol. This attack vector increased by a staggering 403% this quarter.
TeamSpeak, a proprietary voice-over-Internet Protocol (VoIP) that runs over UDP to help gamers talk with other gamers in real time. Talking instead of just chatting can significantly improve a gaming team’s efficiency and help them win. DDoS attacks that target TeamSpeak servers may be launched by rival groups in an attempt to disrupt their communication path during real-time multiplayer games and thus impact their team’s performance.
Overall, HTTP DDoS attacks increased by 15% QoQ despite a 35% decrease YoY. Additionally, network-layer DDoS attacks decreased this quarter by approximately 14%.
In terms of total volume of attack traffic, the US was the largest source of HTTP DDoS attacks. Three out of every thousand requests we saw were part of HTTP DDoS attacks originating from the US. China came in second place and Germany in third place.
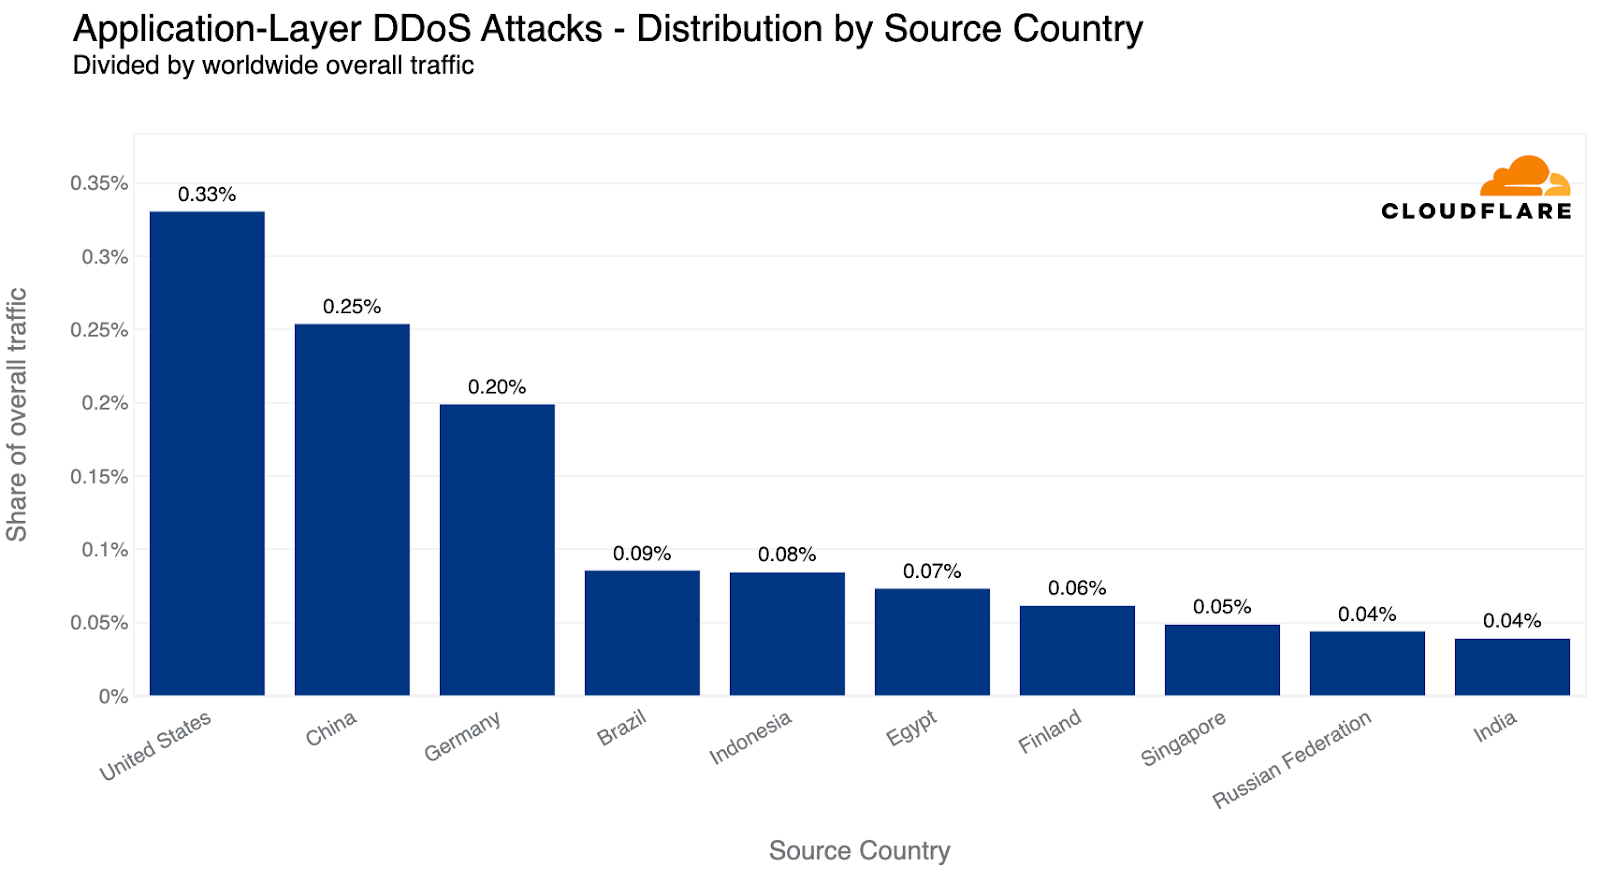
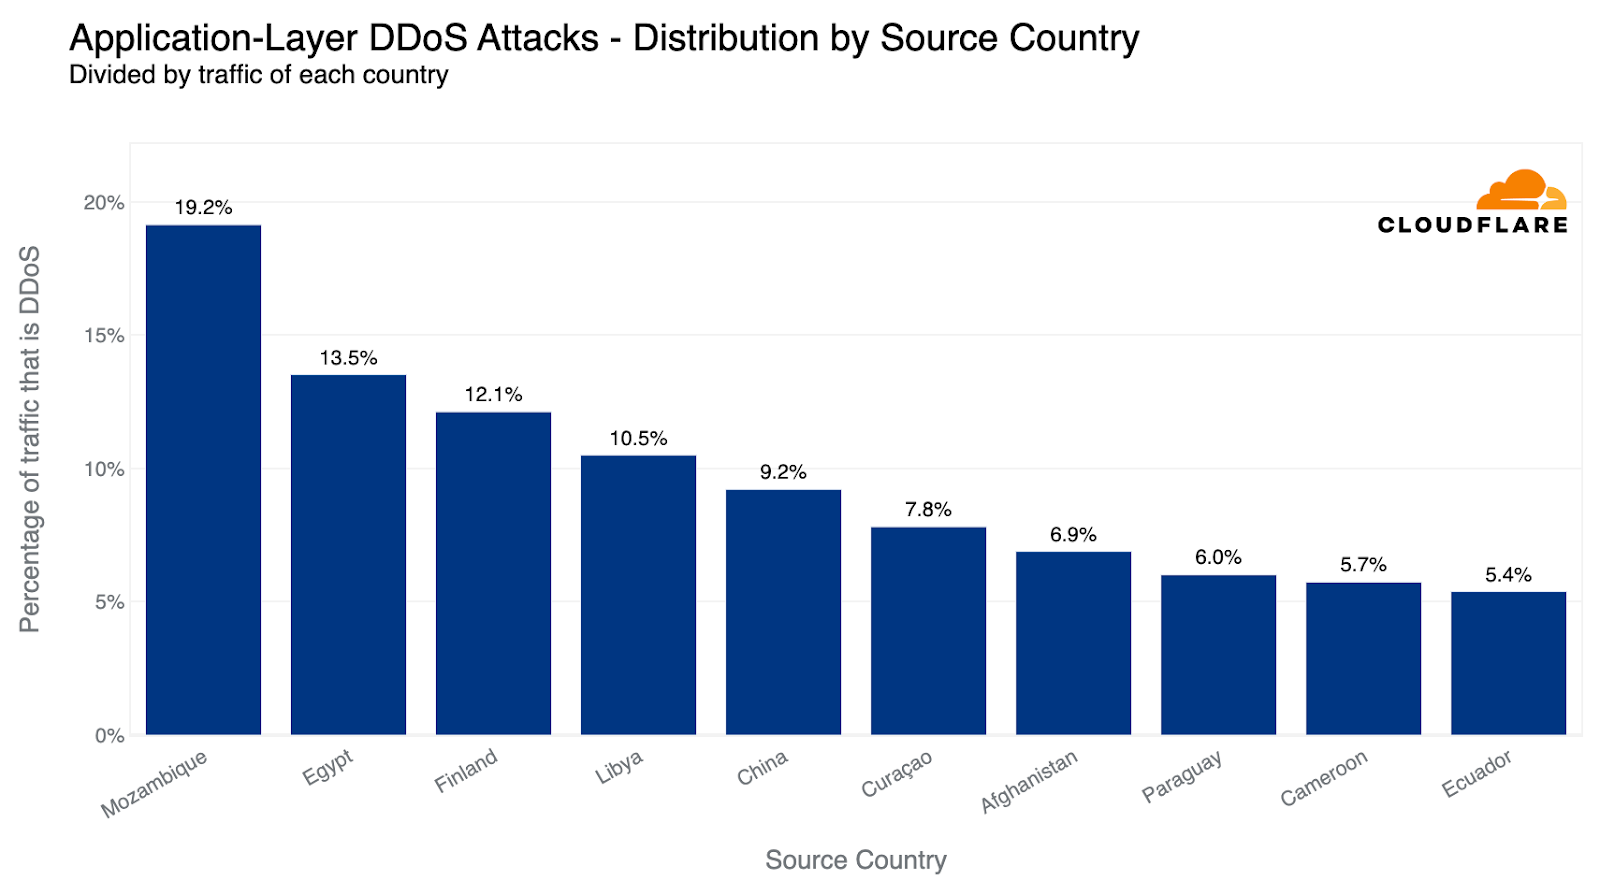
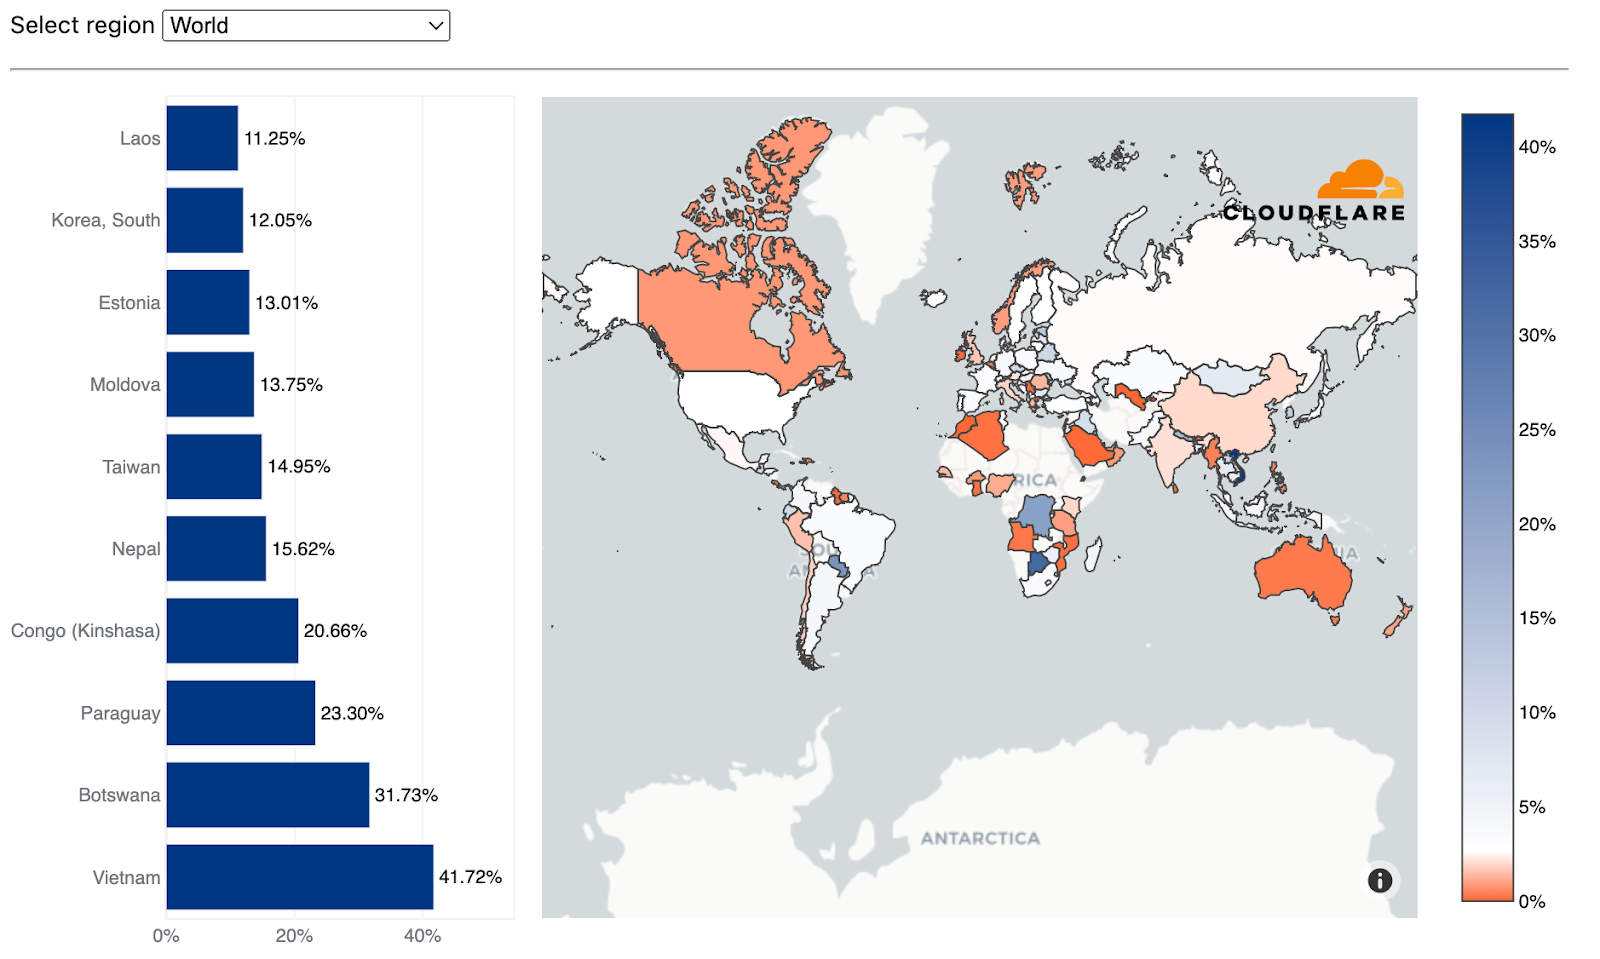
Some countries naturally receive more traffic due to various factors such as market size, and therefore more attacks. So while it’s interesting to understand the total amount of attack traffic originating from a given country, it is also helpful to remove that bias by normalizing the attack traffic by all traffic to a given country.
When doing so, we see a different pattern. The US doesn’t even make it into the top ten. Instead, Mozambique, Egypt and Finland take the lead as the source countries of the most HTTP DDoS attack traffic relative to all of their traffic. Almost a fifth of all HTTP traffic originating from Mozambique IP addresses were part of DDoS attacks.
Using the same calculation methodology but for bytes, Vietnam remains the largest source of network-layer DDoS attacks (aka L3/4 DDoS attacks) for the second consecutive quarter — and the amount even increased by 58% QoQ. Over 41% of all bytes that were ingested in Cloudflare’s Vietnam data centers were part of L3/4 DDoS attacks.
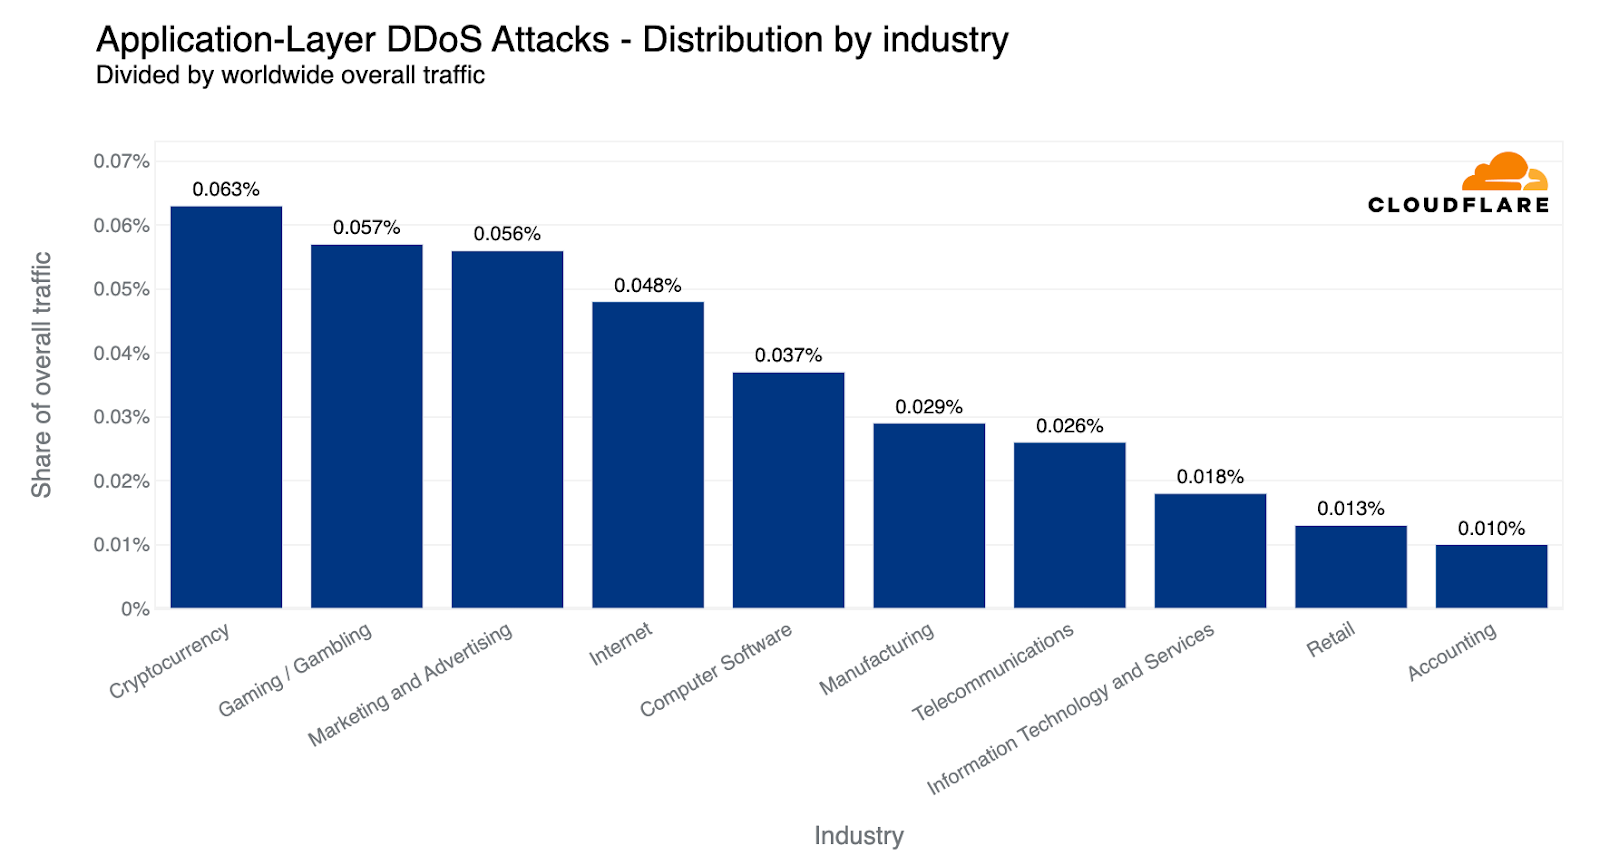
When examining HTTP DDoS attack activity in Q2, Cryptocurrency websites were targeted with the largest amount of HTTP DDoS attack traffic. Six out of every ten thousand HTTP requests towards Cryptocurrency websites behind Cloudflare were part of these attacks. This represents a 600% increase compared to the previous quarter.
After Crypto, Gaming and Gambling websites came in second place as their attack share increased by 19% QoQ. Marketing and Advertising websites not far behind in third place with little change in their share of attacks.
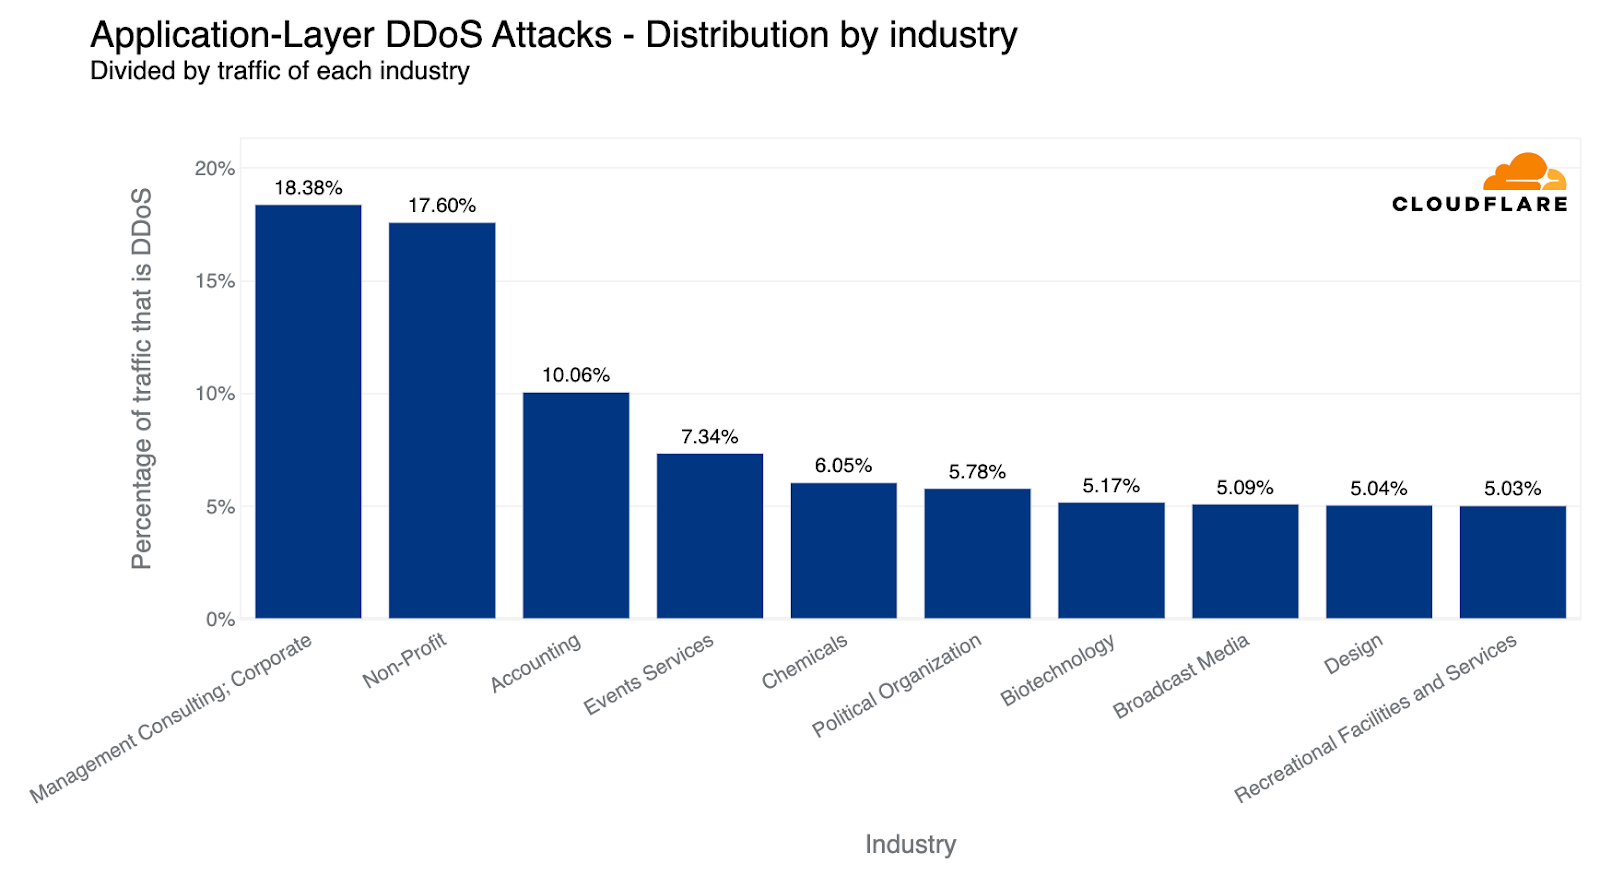
However, when we look at the amount of attack traffic relative to all traffic for any given industry, the numbers paint a different picture. Last quarter, Non-profit organizations were attacked the most — 12% of traffic to Non-profits were HTTP DDoS attacks. Cloudflare protects more than 2,271 Non-profit organizations in 111 countries as part of Project Galileo which celebrated its ninth anniversary this year. Over the past months, an average of 67.7 million cyber attacks targeted Non-profits on a daily basis.
Overall, the amount of DDoS attacks on Non-profits increased by 46% bringing the percentage of attack traffic to 17.6%. However, despite this growth, the Management Consulting industry jumped to the first place with 18.4% of its traffic being DDoS attacks.
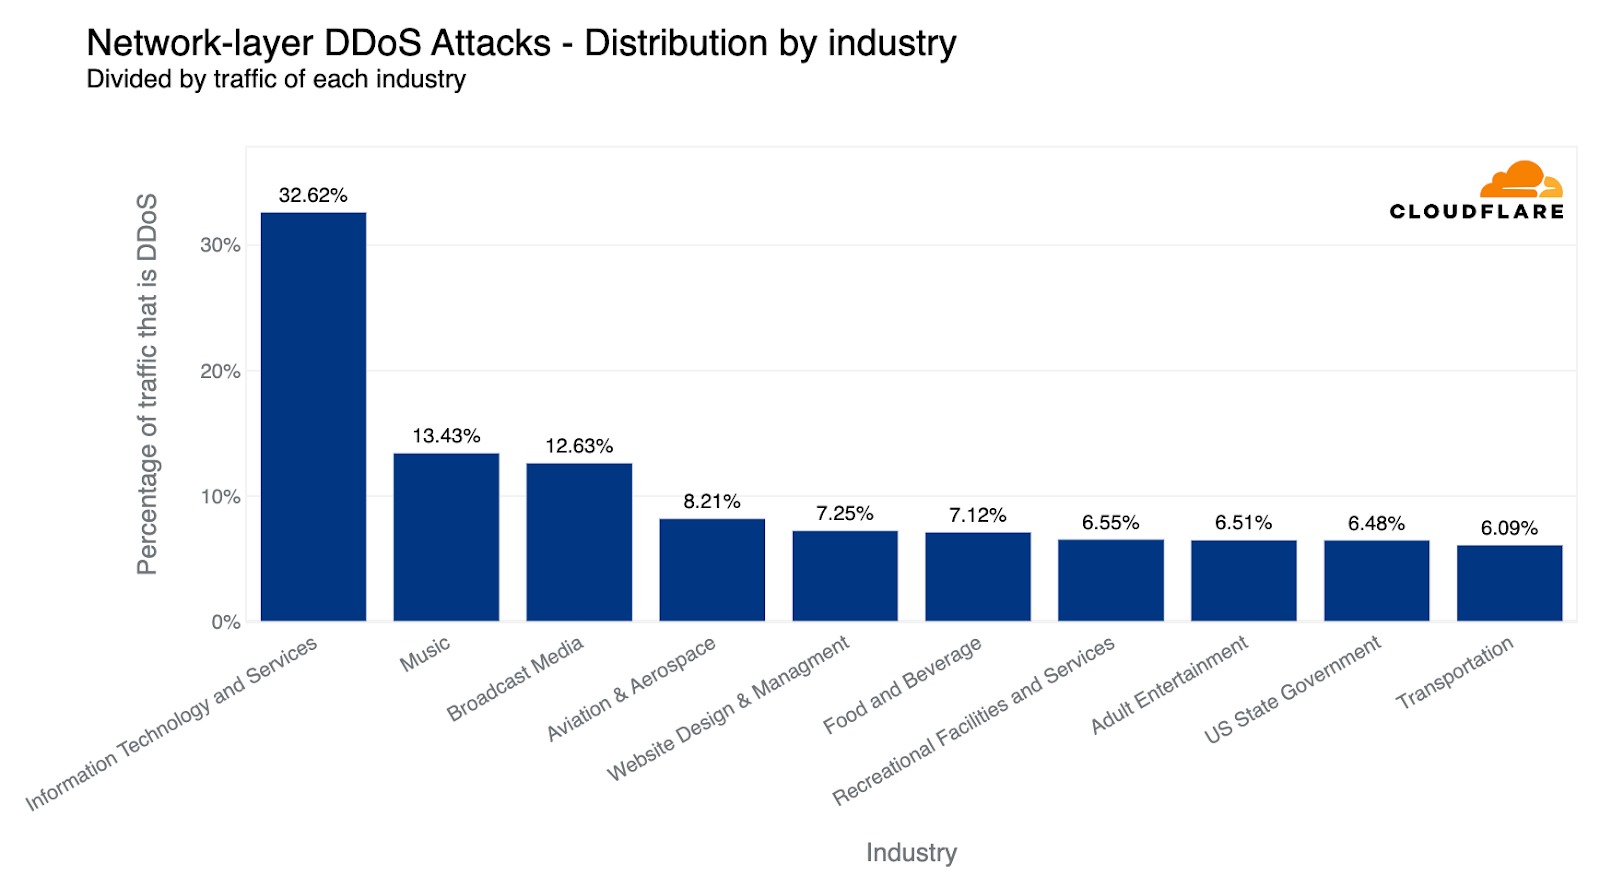
When descending the layers of the OSI model, the Internet networks that were most targeted belonged to the Information Technology and Services industry. Almost every third byte routed to them were part of L3/4 DDoS attacks.
Surprisingly enough, companies operating in the Music industry were the second most targeted industry, followed by Broadcast Media and Aviation & Aerospace.
Cryptocurrency websites experienced the highest number of attacks worldwide, while Management Consulting and Non-profit sectors were the most targeted considering their total traffic. However, when we look at individual regions, the situation is a bit different.
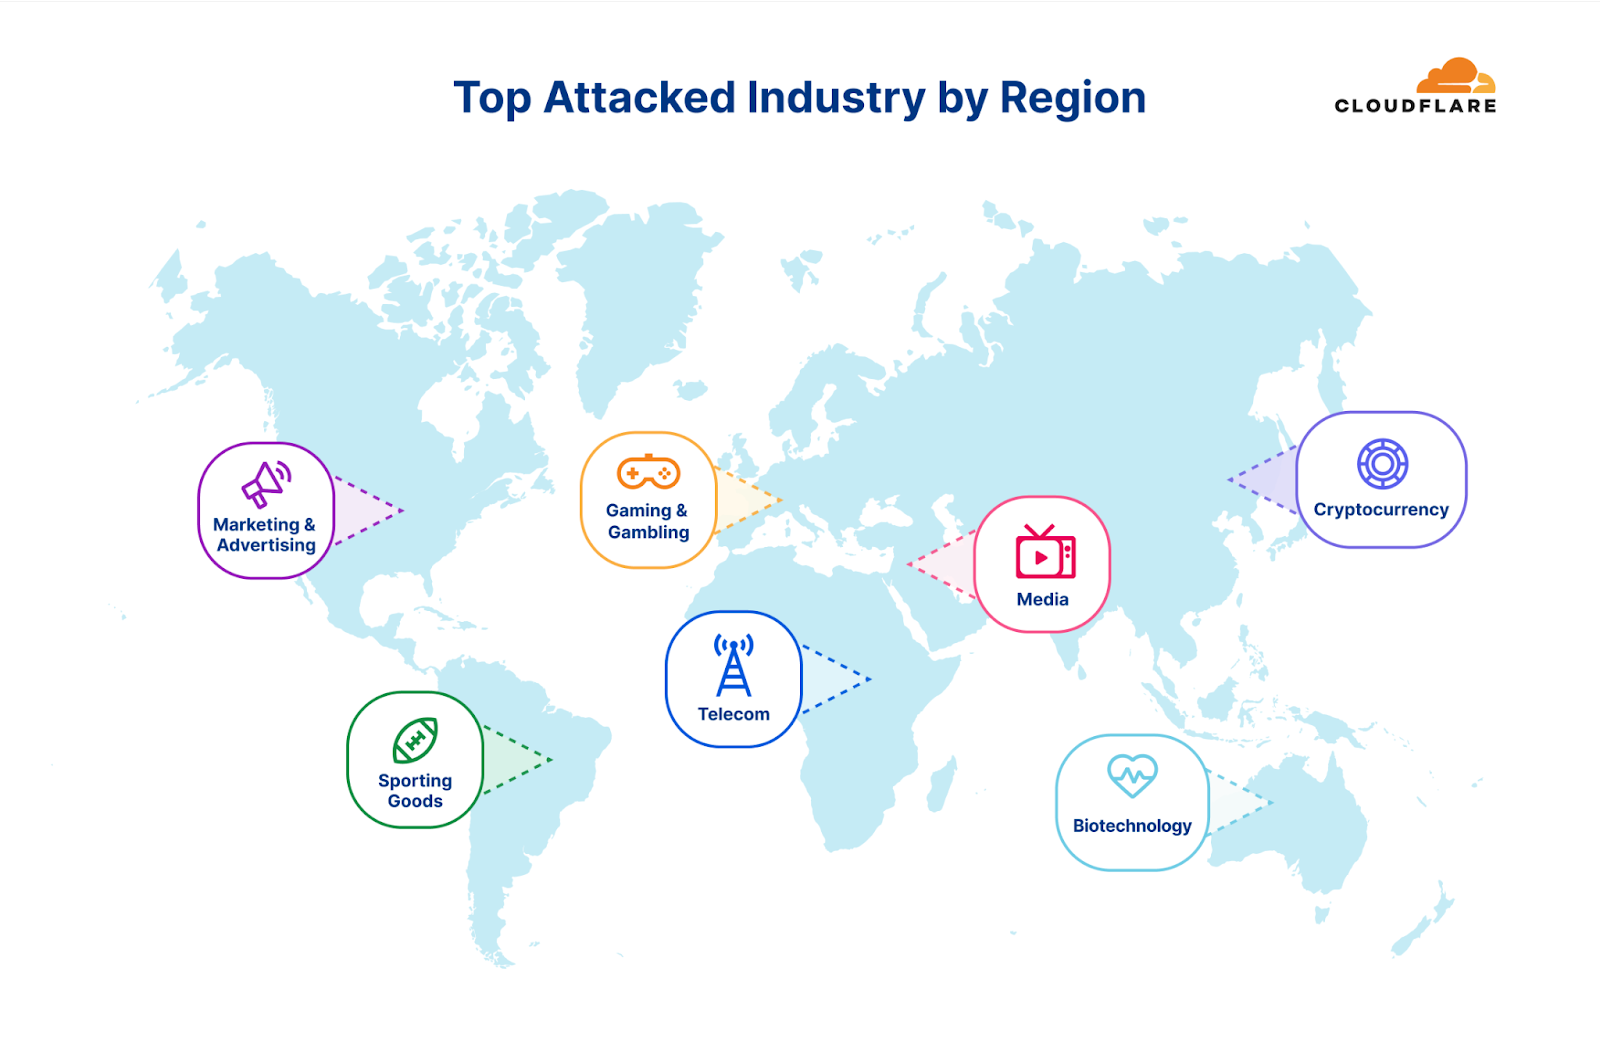
The Telecommunications industry remains the most attacked industry in Africa for the second consecutive quarter. The Banking, Financial Services and Insurance (BFSI) industry follows as the second most attacked. The majority of the attack traffic originated from Asia (35%) and Europe (25%).
For the past two quarters, the Gaming and Gambling industry was the most targeted industry in Asia. In Q2, however, the Gaming and Gambling industry dropped to second place and Cryptocurrency took the lead as the most attacked industry (~50%). Substantial portions of the attack traffic originated from Asia itself (30%) and North America (30%).
For the third consecutive quarter, the Gaming & Gambling industry remains the most attacked industry in Europe. The Hospitality and Broadcast Media industries follow not too far behind as the second and third most attacked. Most of the attack traffic came from within Europe itself (40%) and from Asia (20%).
Surprisingly, half of all attack traffic targeting Latin America was aimed at the Sporting Goods industry. In the previous quarter, the BFSI was the most attacked industry. Approximately 35% of the attack traffic originated from Asia, and another 25% originated from Europe.
The Media & Newspaper industries were the most attacked in the Middle East. The vast majority of attack traffic originated from Europe (74%).
For the second consecutive quarter, Marketing & Advertising companies were the most attacked in North America (approximately 35%). Manufacturing and Computer Software companies came in second and third places, respectively. The main sources of the attack traffic were Europe (42%) and the US itself (35%).
This quarter, the Biotechnology industry was the most attacked. Previously, it was the Health & Wellness industry. Most of the attack traffic originated from Asia (38%) and Europe (25%).
When examining the total volume of attack traffic, last quarter, Israel leaped to the front as the most attacked country. This quarter, attacks targeting Israeli websites decreased by 33% bringing it to the fourth place. The US takes the lead again as the most attacked country, followed by Canada and Singapore.
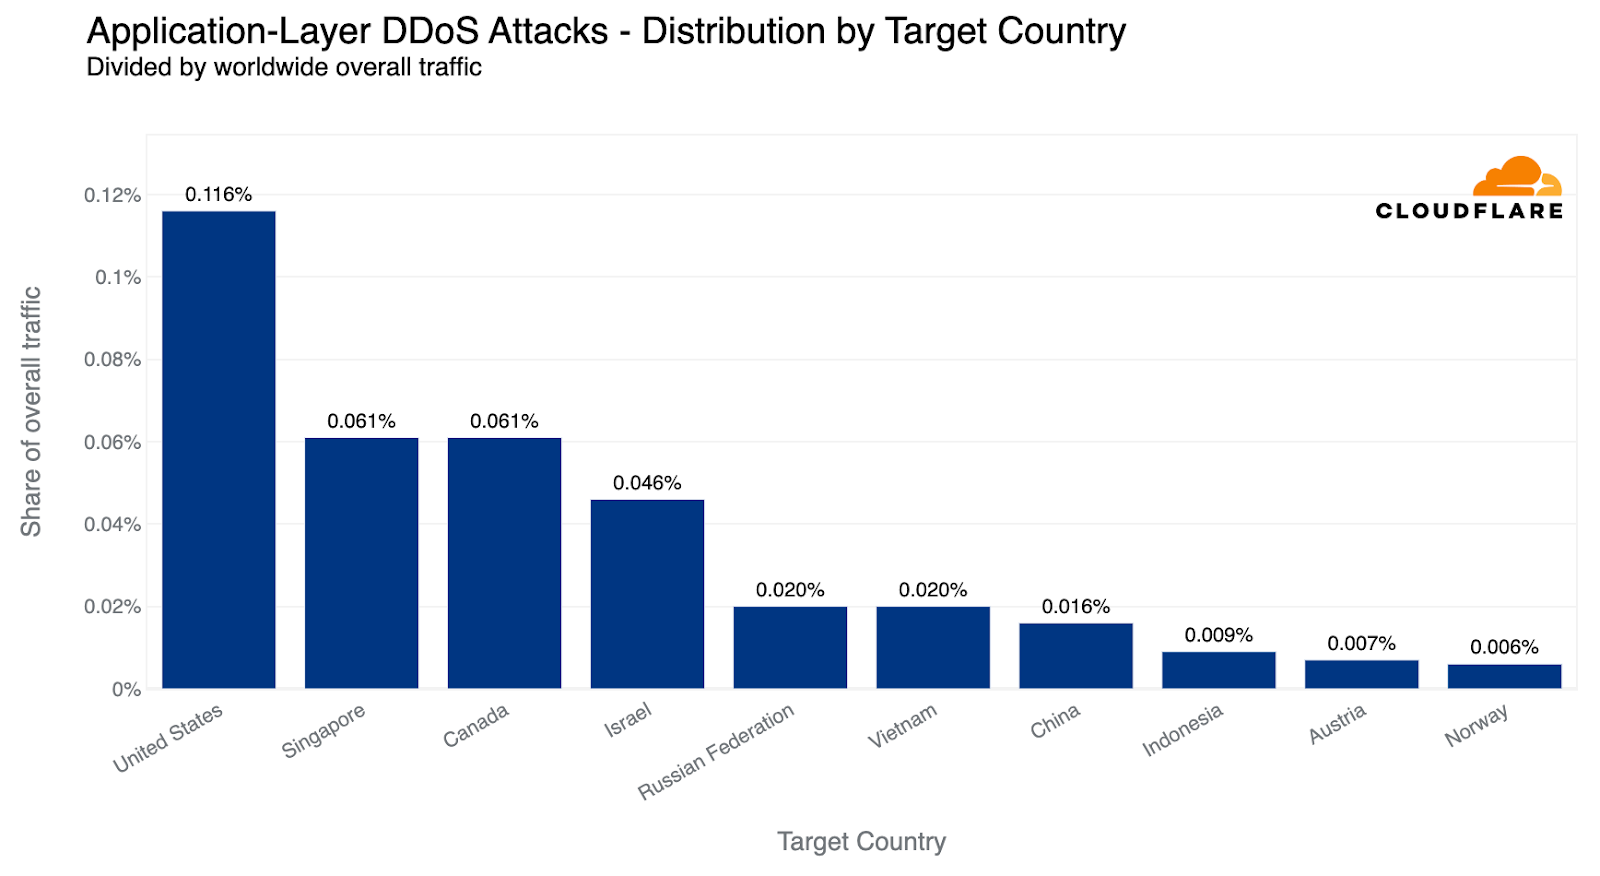
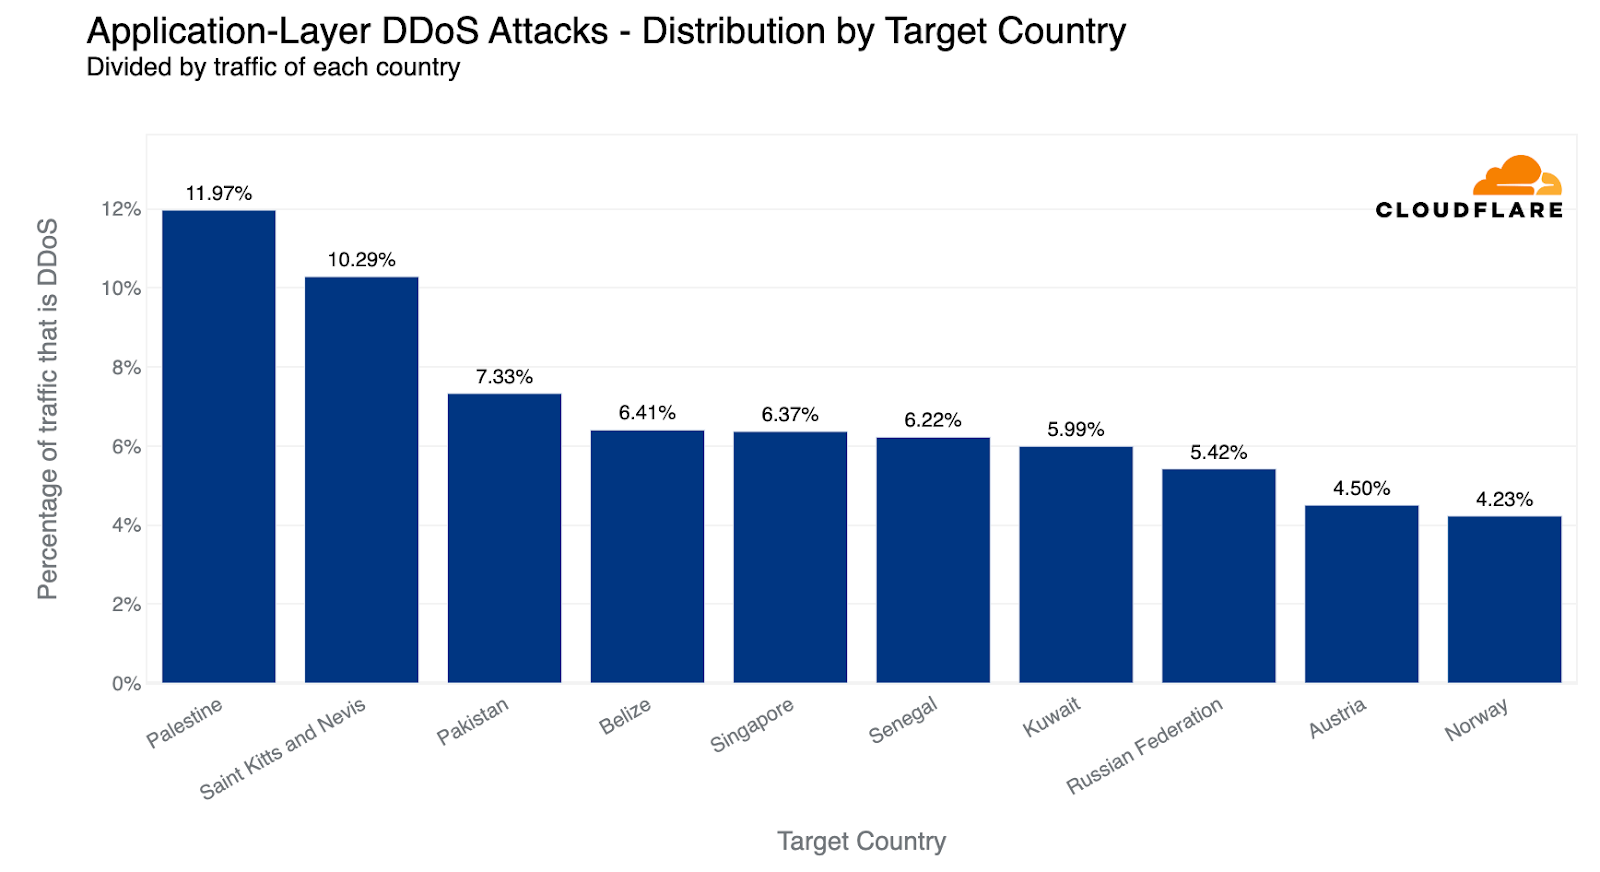
If we normalize the data per country and region and divide the attack traffic by the total traffic, we get a different picture. Palestine jumps to the first place as the most attacked country. Almost 12% of all traffic to Palestinian websites were HTTP DDoS attacks.
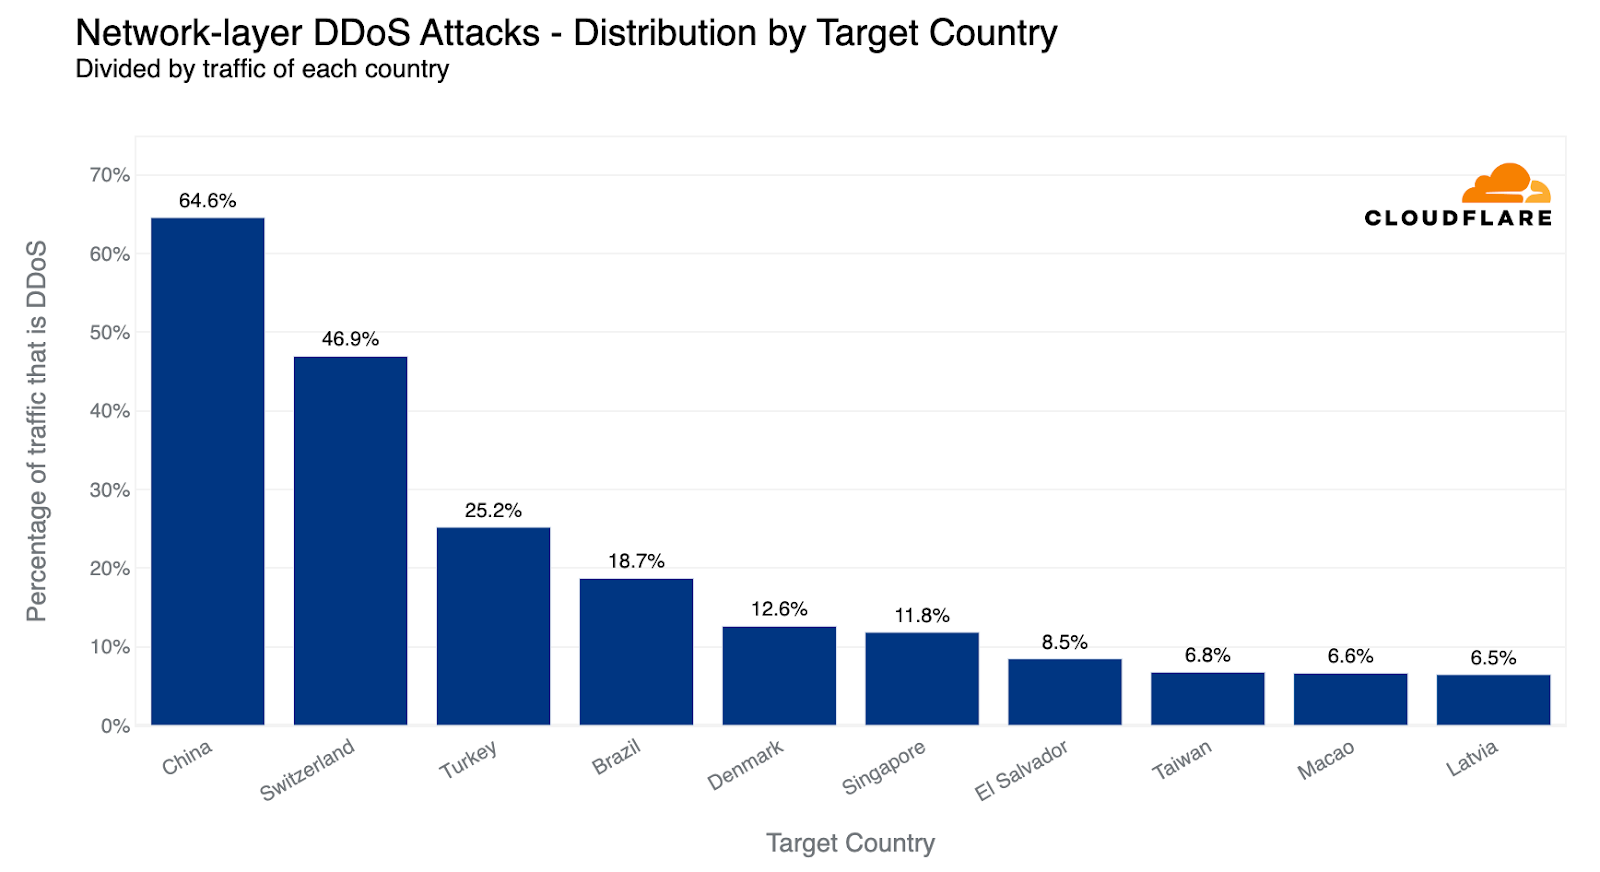
Last quarter, we observed a striking deviation at the network layer, with Finnish networks under Cloudflare's shield emerging as the primary target. This surge was likely correlated with the diplomatic talks that precipitated Finland's formal integration into NATO. Roughly 83% of all incoming traffic to Finland comprised cyberattacks, with China a close second at 68% attack traffic.
This quarter, however, paints a very different picture. Finland has receded from the top ten, and Chinese Internet networks behind Cloudflare have ascended to the first place. Almost two-thirds of the byte streams towards Chinese networks protected by Cloudflare were malicious. Following China, Switzerland saw half of its inbound traffic constituting attacks, and Turkey came third, with a quarter of its incoming traffic identified as hostile.
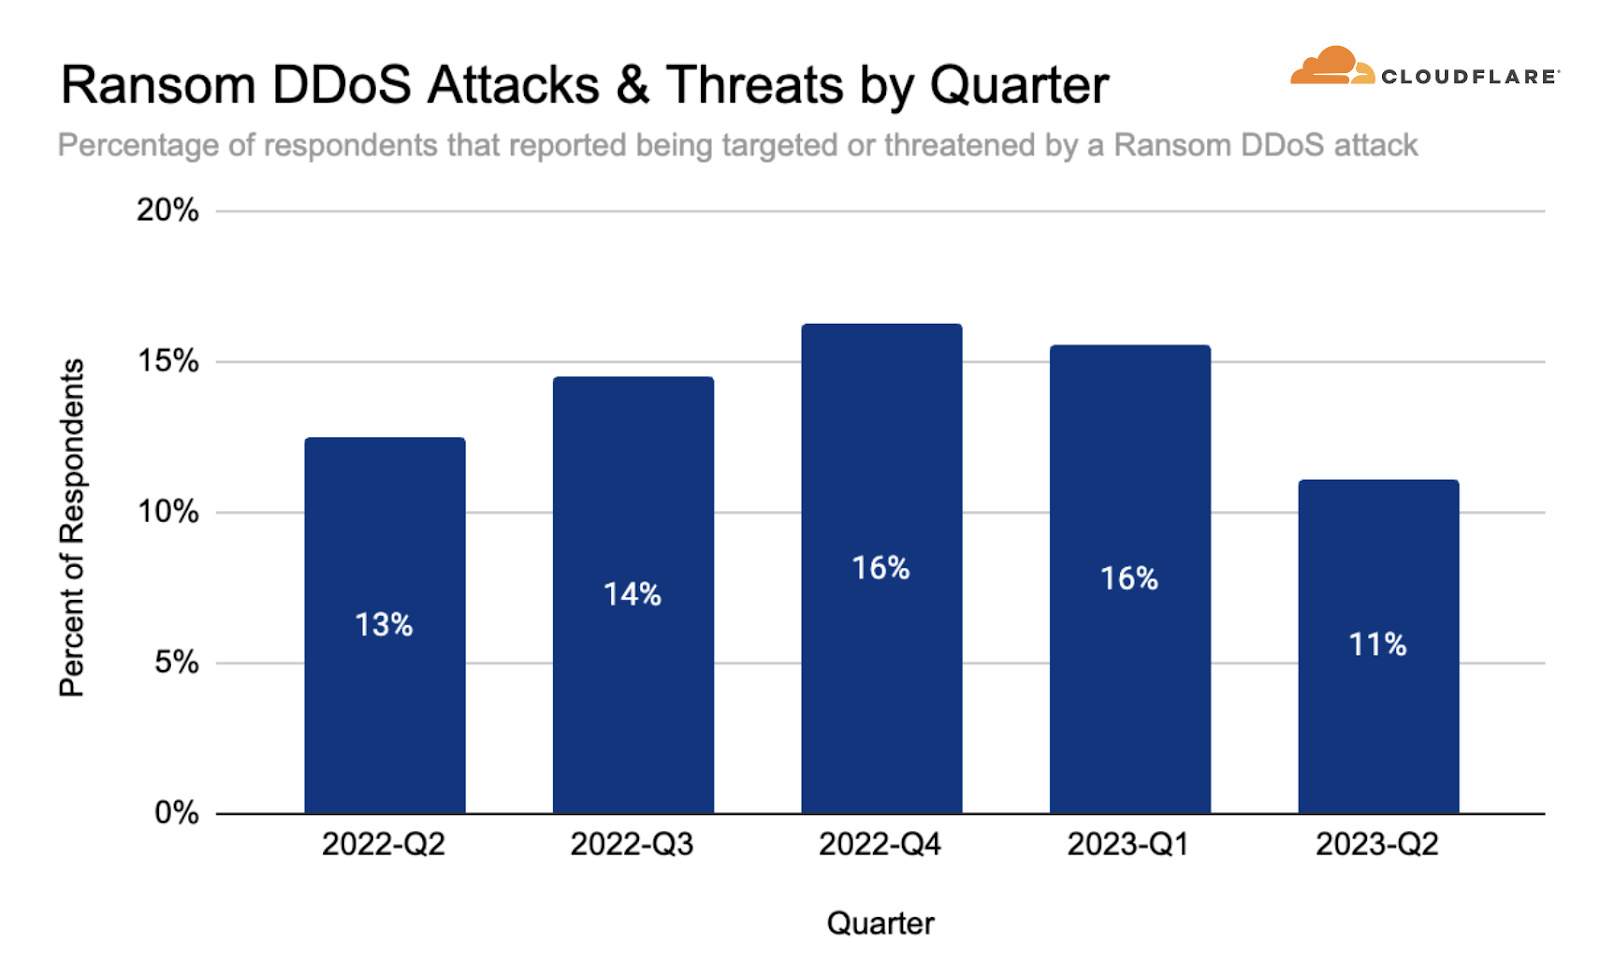
Occasionally, DDoS attacks are carried out to extort ransom payments. We’ve been surveying Cloudflare customers over three years now, and have been tracking the occurrence of Ransom DDoS attack events.
Unlike Ransomware attacks, where victims typically fall prey to downloading a malicious file or clicking on a compromised email link which locks, deletes or leaks their files until a ransom is paid, Ransom DDoS attacks can be much simpler for threat actors to execute. Ransom DDoS attacks bypass the need for deceptive tactics such as luring victims into opening dubious emails or clicking on fraudulent links, and they don't necessitate a breach into the network or access to corporate resources.
Over the past quarter, reports of Ransom DDoS attacks decreased. One out of ten respondents reported being threatened or subject to Ransom DDoS attacks.
In recent months, there's been an alarming escalation in the sophistication of DDoS attacks. And even the largest and most sophisticated attacks that we’ve seen may only last a few minutes or even seconds — which doesn’t give a human sufficient time to respond. Before the PagerDuty alert is even sent, the attack may be over and the damage is done. Recovering from a DDoS attack can last much longer than the attack itself — just as a boxer might need a while to recover from a punch to the face that only lasts a fraction of a second.
Security is not one single product or a click of a button, but rather a process involving multiple layers of defense to reduce the risk of impact. Cloudflare's automated DDoS defense systems consistently safeguard our clients from DDoS attacks, freeing them up to focus on their core business operations. These systems are complemented by the vast breadth of Cloudflare capabilities such as firewall, bot detection, API protection and even caching which can all contribute to reducing the risk of impact.
The DDoS threat landscape is evolving and increasingly complex, demanding more than just quick fixes. Thankfully, with Cloudflare's multi-layered defenses and automatic DDoS protections, our clients are equipped to navigate these challenges confidently. Our mission is to help build a better Internet, and so we continue to stand guard, ensuring a safer and more reliable digital realm for all.
Cloudflare’s systems constantly analyze traffic and automatically apply mitigation when DDoS attacks are detected. Each attacked customer is prompted with an automated survey to help us better understand the nature of the attack and the success of the mitigation. For over two years, Cloudflare has been surveying attacked customers. One of the questions in the survey asks the respondents if they received a threat or a ransom note. Over the past two years, on average, we collected 164 responses per quarter. The responses of this survey are used to calculate the percentage of Ransom DDoS attacks.
Source country
At the application-layer, we use the attacking IP addresses to understand the origin country of the attacks. That is because at that layer, IP addresses cannot be spoofed (i.e., altered). However, at the network layer, source IP addresses can be spoofed. So, instead of relying on IP addresses to understand the source, we instead use the location of our data centers where the attack packets were ingested. We’re able to get geographical accuracy due to our large global coverage in over 285 locations around the world.
Target country
For both application-layer and network-layer DDoS attacks, we group attacks and traffic by our customers’ billing country. This lets us understand which countries are subject to more attacks.
Target industry
For both application-layer and network-layer DDoS attacks, we group attacks and traffic by our customers’ industry according to our customer relations management system. This lets us understand which industries are subject to more attacks.
Total volume vs. percentage
For both source and target insights, we look at the total volume of attack traffic compared to all traffic as one data point. Additionally, we also look at the percentage of attack traffic towards or from a specific country, to a specific country or to a specific industry. This gives us an “attack activity rate” for a given country/industry which is normalized by their total traffic levels. This helps us remove biases of a country or industry that normally receives a lot of traffic and therefore a lot of attack traffic as well.
How we calculate attack characteristics
To calculate the attack size, duration, attack vectors and emerging threats, we bucket attacks and then provide the share of each bucket out of the total amount for each dimension. On the new Radar component, these trends are calculated by number of bytes instead. Since attacks may vary greatly in number of bytes from one another, this could lead to trends differing between the reports and the Radar component.
When we describe ‘top countries’ as the source or target of attacks, it does not necessarily mean that that country was attacked as a country, but rather that organizations that use that country as their billing country were targeted by attacks. Similarly, attacks originating from a country does not mean that that country launched the attacks, but rather that the attack was launched from IP addresses that have been mapped to that country. Threat actors operate global botnets with nodes all over the world, and in many cases also use Virtual Private Networks and proxies to obfuscate their true location. So if anything, the source country could indicate the presence of exit nodes or botnet nodes within that country.
Post Syndicated from Omer Yoachimik original http://blog.cloudflare.com/ddos-threat-report-2023-q2-es-es/

Te damos la bienvenida al segundo informe sobre amenazas DDoS de 2023. Los ataques DDoS, o ataques de denegación de servicio distribuido, son un tipo de ciberataque cuyo objetivo es sobrecargar de tráfico sitios web (y otros tipos de propiedades de Internet) para interrumpir el funcionamiento normal y que los usuarios legítimos no puedan acceder a ellos, lo mismo que cuando un conductor está atrapado en un atasco de camino al supermercado.
Observamos muchos ataques DDoS de diferentes tipos y tamaños, y nuestra red es una de las mayores del mundo, ya que abarca más de 300 ciudades en más de 100 países. A través de esta red atendemos más de 63 millones de solicitudes HTTP por segundo durante picos de tráfico y más de 2 billones de consultas de DNS cada día. Esta ingente cantidad de datos nos ofrece una perspectiva privilegiada para dar a conocer a la comunidad tendencias reveladoras sobre los ataques DDoS.
Nuestros lectores habituales quizá noten un cambio en el diseño de este informe. Solíamos seguir un patrón fijo para compartir nuestras percepciones y tendencias sobre los ataques DDoS. Sin embargo, creemos que ha llegado el momento de cambiar la forma de presentar nuestras conclusiones en vista de los cambios observados en el panorama de las amenazas DDoS conforme avanzan en potencia y sofisticación. Así pues, empezaremos con una rápida visión global y, a continuación, profundizaremos en los principales cambios que estamos observando en el mundo de los ataques DDoS.
Recordatorio: puedes consultar la versión interactiva de este informe en Cloudflare Radar. Además, hemos añadido un nuevo elemento interactivo que te permitirá analizar la actividad de los ataques en cada país o región.
El 2º trimestre de 2023 se caracterizó por oleadas de campañas de ataques DDoS persistentes, que se concibieron y adaptaron para dirigirse a varios frentes. Destacamos:
Además, uno de los mayores ataques que hemos observado este trimestre fue un ataque DDoS de inundación ACK que se originó en una variante de la botnet Mirai y que comprendía aproximadamente 11 000 direcciones IP. El ataque iba dirigido a un proveedor de acceso a Internet estadounidense y alcanzó un pico de 1,4 terabits por segundo (TB/s), pero los sistemas de Cloudflare pudieron detectarlo y mitigarlo.
A pesar de que las cifras generales indican un aumento en la duración global de los ataques, la mayoría de ellos fueron de corta duración como este, ya que solo duró dos minutos. Sin embargo, en términos más generales, hemos observado que los ataques de más de 3 horas aumentaron un 103 % en términos intertrimestrales.
Con este escenario, profundicemos en estos cambios que estamos observando en el panorama de los ataques DDoS.
El 14 de junio, los grupos hacktivistas prorrusos Killnet, un resurgimiento de REvil y Anonymous Sudan anunciaron su unión para ejecutar ciberataques "masivos" contra el sistema financiero occidental, incluidos bancos europeos y estadounidenses, y el Sistema de la Reserva Federal de Estados Unidos. El colectivo, apodado "Darknet Parliament", declaró que su primer objetivo era paralizar la red SWIFT (Sociedad para las Telecomunicaciones Financieras Interbancarias Mundiales). Un ataque DDoS llevado a cabo con éxito contra el sistema SWIFT podría tener consecuencias nefastas, ya que es el principal servicio utilizado por las instituciones financieras para realizar transacciones mundiales.
Aparte de una serie de sucesos que se han hecho públicos, como la interrupción de Microsoft de la que se hicieron eco los medios de comunicación, no hemos observado ningún ataque DDoS novedoso ni interrupciones dirigidas a nuestros clientes. Nuestros sistemas han estado detectando y mitigando automáticamente los ataques asociados a esta campaña. En las últimas semanas, Darknet Parliament ha sido el autor de hasta 10 000 ataques DDoS contra sitios web protegidos por Cloudflare (véase el gráfico siguiente).
A pesar de las declaraciones formuladas por los hacktivistas, los sitios web de banca y servicios financieros solo fueron el noveno sector más afectado, según los ataques que hemos observado contra nuestros clientes en el marco de esta campaña.
Los principales blancos de ataque fueron los sectores de software informático, apuestas y casinos y videojuegos. El sector de las telecomunicaciones y los medios de comunicación ocuparon el cuarto y quinto lugar, respectivamente. En general, el mayor ataque que presenciamos en esta campaña alcanzó un máximo de 1,7 millones de solicitudes por segundo y la media fue de 65 000 de solicitudes por segundo.
Poniendo estas cifras en perspectiva, a principios de este año mitigamos el mayor ataque registrado en la historia, que alcanzó un pico de 71 millones de solicitudes por segundo. Por tanto, los ataques que hemos mencionado fueron muy pequeños en comparación con la escala de Cloudflare, pero no necesariamente para un sitio web medio. Por consiguiente, no debemos subestimar el potencial de daño en sitios web con una protección o configuración deficientes.
Un ataque DDoS HTTP es un ataque DDoS a través del protocolo de transferencia de hipertexto (HTTP). Se dirige a propiedades HTTP de Internet, como sitios web y puertas de enlace de API. En el último trimestre, los ataques DDoS HTTP se incrementaron un 15 % intertrimestral, a pesar de que descendieron un 35 % respecto al mismo periodo del año pasado.
Además, hemos observado un incremento alarmante de ataques DDoS HTTP sofisticados con un alto grado de aleatoriedad en los últimos meses. Parece como si los ciberdelincuentes que están detrás de estos ataques los hubieran diseñado intencionadamente para eludir los sistemas de mitigación, imitando de forma eficaz el comportamiento del navegador con mucha precisión. En algunos casos, presentan un alto grado de aleatoriedad en varias propiedades como los agentes de usuario y las huellas JA3, por nombrar algunas. A continuación, mostramos un ejemplo de un ataque de este tipo. Cada color representa una función de aleatoriedad distinta.
Por otra parte, en muchos de estos ataques, parece que los ciberdelincuentes intentan mantener la velocidad de ataque por segundo relativamente baja para tratar evitar la detección y ocultarse entre el tráfico legítimo.
Este nivel de sofisticación solía asociarse con ciberdelincuentes a nivel estatal y patrocinados por el Estado. Ahora parece que estas capacidades están al alcance de los ciberdelincuentes, que ya han dirigido sus ataques a empresas destacadas, como un gran proveedor de VoIP, una empresa líder en semiconductores y un importante proveedor de servicios de pago y tarjetas de crédito, entre otros.
La protección de los sitios web contra ataques DDoS HTTP sofisticados requiere una defensa inteligente, automatizada y rápida, que utilice la información sobre amenazas, la elaboración de perfiles de tráfico y el análisis estadístico/de aprendizaje automático para diferenciar entre los ataques de tráfico y el tráfico de los usuarios. Además, incluso el aumento del almacenamiento en caché, cuando proceda, puede ayudar a reducir el riesgo de que el tráfico de ataque afecte a tu servidor de origen. Consulta más información sobre las prácticas recomendadas de protección contra DDoS aquí.
El sistema de nombres de dominio, o DNS, funciona como la guía telefónica de Internet. El DNS ayuda a traducir la dirección de un sitio web legible por humanos (p. ej., www.cloudflare.com) a una dirección IP legible para la máquina (p. ej., 104.16.124.96). Cuando los atacantes interrumpen los servidores DNS, afectan a la capacidad de las máquinas para conectarse a un sitio web, y al hacerlo impiden que los usuarios accedan a los sitios web.
En el último trimestre, los ataques DDoS a través del DNS representaron el vector de ataque más común. El 32 % de todos los ataques DDoS se produjeron a través del protocolo DNS. Entre ellos, uno de los ataques en auge más preocupantes es el ataque de blanqueo de DNS (DNS Laundering), que puede plantear graves problemas a las organizaciones que gestionan sus propios servidores DNS autoritativos.
El término "blanqueo" en el nombre del ataque "DNS Laundering" hace referencia a la analogía del blanqueo de dinero, el tortuoso proceso de hacer que las ganancias obtenidas ilegalmente, comúnmente conocidas como "dinero negro", parezcan legales. Del mismo modo, en el mundo de los ataques DDoS, un ataque de blanqueo de DNS es el proceso de hacer que el tráfico malicioso parezca tráfico legítimo, blanqueándolo a través de resolvedores de DNS recursivo de confianza.
En un ataque de blanqueo de DNS, el ciberdelincuente consultará subdominios de un dominio gestionado por el servidor DNS de la víctima. El prefijo que define el subdominio es aleatorio y nunca se utiliza más de una o dos veces en un ataque de este tipo. Debido al componente de aleatoriedad, los servidores DNS recursivos nunca tendrán una respuesta en caché y tendrán que reenviar la consulta al servidor DNS autoritativo de la víctima. Entonces, el servidor DNS autoritativo recibe tal bombardeo de consultas que no puede atender consultas legítimas, e incluso se bloquea por completo.
Desde el punto de vista de la protección, los administradores de DNS no pueden bloquear el origen del ataque porque este incluye servidores DNS recursivos de confianza, como el 8.8.8.8 de Google y el 1.1.1.1 de Clouflare. Los administradores tampoco pueden bloquear todas las consultas al dominio atacado porque es un dominio válido y quieren preservar el acceso a las consultas legítimas.
Los factores anteriores hacen que sea muy difícil distinguir las consultas legítimas de las malintencionadas. Una gran institución financiera asiática y un proveedor de DNS norteamericano son dos de las últimas víctimas de este tipo de ataques. A continuación, mostramos un ejemplo de un ataque de este tipo.
Al igual que las estrategias de protección descritas para las aplicaciones HTTP, la protección de los servidores DNS también requiere un enfoque preciso, rápido y automatizado. La utilización de un servicio DNS gestionado o un proxy inverso DNS como el de Cloudflare puede ayudar a absorber y mitigar los ataques de tráfico. Para los ataques DNS más sofisticados, se requiere una solución más inteligente que use el análisis estadístico de los datos históricos para poder diferenciar entre consultas legítimas y consultas de ataque.
Como hemos revelado anteriormente, estamos siendo testigos de una evolución en el ADN de las botnets. Ha llegado la era de las botnets DDoS en máquinas virtuales y, con ella, los ataques DDoS hipervolumétricos. Estas botnets se componen de máquinas virtuales (VM) o servidores privados virtuales (VPS) en lugar de dispositivos del Internet de las cosas (IoT), lo que multiplica por 5 000 su eficacia.
Debido a los recursos informáticos y de ancho de banda de que disponen estas botnets basadas en máquinas virtuales, son capaces de generar ataques hipervolumétricos con una flota mucho menor en comparación con las botnets basadas en dispositivos IoT.
Estas botnets han ejecutado uno de los mayores ataques DDoS registrados, incluido el ataque DDoS de 71 millones de solicitudes por segundo. Numerosas organizaciones, incluido un proveedor de plataformas de videojuegos líder del sector, ya han sido blanco de esta nueva generación de botnets.
Cloudflare ha colaborado proactivamente con destacados proveedores de informática en la nube para hacer frente estas nuevas botnets. Gracias a la intervención rápida y dedicada de estos proveedores, se han neutralizado componentes significativos de estas amenazas. Desde esta intervención, aún no hemos observado ningún otro ataque hipervolumétrico, lo que demuestra la eficacia de nuestra colaboración.
Si bien ya compartimos una alianza fructífera con la comunidad de la ciberseguridad para contrarrestar las botnets cuando identificamos ataques a gran escala, nuestro objetivo es agilizar y automatizar aún más este proceso. Extendemos una invitación a los proveedores de informática en la nube, proveedores de alojamiento y otros proveedores de servicios generales para que se unan a Botnet Threat Feed de Cloudflare de manera gratuita. Esta solución ofrece visibilidad de los ataques originados en sus redes, lo que contribuirá a nuestros esfuerzos comunes para desmantelar las botnets.
En marzo de 2022, revelamos una vulnerabilidad de día cero (CVE-2022-26143), denominada TP240PhoneHome, que se identificó en el sistema de telefonía empresarial Mitel MiCollab y que expuso al sistema a ataques DDoS de amplificación UDP.
Esta vulnerabilidad funciona reflejando el tráfico de los servidores expuestos y es capaz de amplificar el tráfico de ataque en un factor de 220 000 millones por ciento. La vulnerabilidad se deriva de un puerto UDP no autenticado expuesto a la red pública de Internet, que podría permitir a ciberdelincuentes emitir un comando de depuración "startblast", simulando una avalancha de llamadas para probar el sistema.
Como resultado, por cada llamada de prueba, se envían dos paquetes UDP al emisor, lo que permite a un atacante dirigir este tráfico a cualquier dirección IP y número de puerto para amplificar un ataque DDoS. A pesar de la vulnerabilidad, solo unos pocos miles de estos dispositivos están expuestos, lo que limita la escala potencial del ataque. Además, los ataques se deben ejecutar en serie, lo que significa que cada dispositivo solo puede lanzar un ataque a la vez.
En general, en el último trimestre hemos observado otras amenazas emergentes como los ataques DDoS que abusan del protocolo TeamSpeak3. Este vector de ataque aumentó un asombroso 403 % este trimestre.
TeamSpeak, una aplicación patentada de protocolo de voz sobre Internet (VoIP), funciona sobre UDP para ayudar a los jugadores a hablar con otros jugadores en tiempo real. Hablar en lugar de solo chatear puede mejorar significativamente la eficacia de un equipo de jugadores y ayudarles a ganar. Grupos rivales pueden lanzar ataques DDoS contra servidores de TeamSpeak en un intento de interrumpir su vía de comunicación durante las partidas multijugador en tiempo real y afectar así al rendimiento de su equipo.
En general, los ataques DDoS HTTP se alzaron un 15 % en términos intertrimestrales, pese a que disminuyeron un 35 % respecto al mismo periodo del año pasado. Además, los ataques DDoS a la capa de red se contrajeron un 14 % aproximadamente durante el trimestre en revisión.
En términos de volumen total de ataques de tráfico, EE. UU. fue el principal origen de ataques DDoS HTTP. Tres de cada mil solicitudes que observamos formaban parte de ataques DDoS HTTP originados en EE. UU. China ocupó el segundo lugar y Alemania el tercero.
Algunos países reciben de por sí más tráfico debido a diversos factores, como el tamaño del mercado, y por tanto más ataques. Por tanto, aunque es interesante comprender la cantidad total de ataques de tráfico originados en un país determinado, también es útil eliminar ese sesgo normalizando el ataque de tráfico por todo el tráfico dirigido a un país determinado.
Al hacerlo, observamos un patrón diferente. EE. UU. ni siquiera figura entre los diez primeros puestos. En su lugar, Mozambique, Egipto y Finlandia toman la delantera como los países donde se originó el mayor volumen de ataques de tráfico DDoS HTTP en relación con todo su tráfico. Casi una quinta parte de todo el tráfico HTTP procedente de direcciones IP de Mozambique formaba parte de ataques DDoS.
Si utilizamos la misma metodología de cálculo, pero para los bytes, observamos que Vietnam sigue siendo el principal origen de ataques DDoS a la capa de red (también conocidos como ataques DDoS a las capas 3 y 4) por segundo trimestre consecutivo, y la cantidad incluso aumentó un 58 % intertrimestral. Más del 41 % de todos los bytes que absorbieron los centros de datos de Cloudflare en Vietnam formaban parte de ataques DDoS a las capas 3 y 4.
Cuando analizamos la actividad de ataques DDoS HTTP en el segundo trimestre, observamos que los sitios web de criptomonedas fueron blanco de la mayor cantidad de ataques de tráfico DDoS HTTP. Seis de cada diez mil solicitudes HTTP hacia sitios web de criptomonedas que confían en Cloudflare formaron parte de estos ataques. Esta cifra se ha disparado un 600 % en comparación con el trimestre anterior.
Por detrás de las criptomonedas, los sitios web de videojuegos y apuestas ocuparon el segundo lugar, cuyo porcentaje de ataque aumentó un 19 % respecto al trimestre anterior. Los sitios web de marketing y publicidad les siguieron de cerca en tercer lugar, si bien apenas hubo cambios en su porcentaje de ataques.
Sin embargo, si nos fijamos en la cantidad de ataques de tráfico en relación con todo el tráfico de un sector determinado, las cifras muestran un panorama diferente. El trimestre pasado, las organizaciones sin ánimo de lucro fueron las más afectadas. Los ataques DDoS HTTP representaron el 12 % del tráfico dirigido a estas organizaciones. Cloudflare protege a más de 2271 organizaciones sin ánimo de lucro en 111 países como parte del proyecto Galileo, que celebró su noveno aniversario este año . En los últimos meses, una media de 67,7 millones de ciberataques se dirigieron diariamente a este tipo de organizaciones.
En general, la cantidad de ataques DDoS contra organizaciones sin ánimo de lucro se alzó un 46 %, con lo que el porcentaje de ataques de tráfico alcanzó el 17,6 %. Sin embargo, a pesar de este crecimiento, el sector de la consultoría de gestión saltó al primer puesto teniendo en cuenta que los ataques DDoS representaron un 18,4 % de su tráfico.
Cuando descendemos por las capas del modelo OSI, observamos que las redes de Internet más afectadas pertenecían a los sectores de las tecnologías de la información y los servicios. Casi uno de cada tres bytes dirigidos a estos sectores formaban parte de ataques DDoS a las capas 3 y 4.
Sorprendentemente, las empresas del sector de la música fueron el segundo mayor blanco de ataques, seguidas por el sector de medios audiovisuales, y la industria aeronáutica y aeroespacial.
Los sitios web de criptomonedas experimentaron el mayor número de ataques en todo el mundo, mientras que el sector de consultoría de gestión y las organizaciones sin ánimo de lucro fueron los más afectados teniendo en cuenta su tráfico total. Sin embargo, si observamos las regiones individuales, la situación es un poco diferente.
El sector de las telecomunicaciones siguió siendo el más afectado por los ataques DDoS en África por segundo trimestre consecutivo. El sector de servicios bancarios, financieros y seguros (BFSI) ocupó el segundo lugar. La mayor parte de los ataques de tráfico se originó en Asia (35 %) y Europa (25 %).
Durante los dos últimos trimestres, el sector de los videojuegos y las apuestas fue el peor parado en Asia. En el 2º trimestre, sin embargo, bajó al segundo puesto y las criptomonedas encabezaron la lista como el sector más afectado (aproximadamente el 50 %). Una parte importante de los ataques de tráfico se originó en la propia Asia (30 %) y Norteamérica (30 %).
Por tercer trimestre consecutivo, el sector de los videojuegos sigue siendo el peor parado en Europa. Le siguieron de cerca los sectores de la hostelería y los medios audiovisuales, que ocuparon el segundo y el tercer puesto como sectores más afectados. La mayor parte de los ataques de tráfico se originó dentro de la propia Europa (40 %) y Asia (20 %).
Sorprendentemente, la mitad de los ataques de tráfico dirigidos a Latinoamérica tuvo como objetivo al sector de los artículos deportivos. En el trimestre anterior, el sector BFSI fue el principal blanco de ataques. Aproximadamente el 35 % de los ataques de tráfico procedieron de Asia, y otro 25% de Europa.
Los sectores de medios de comunicación y prensa fueron objeto del mayor número de ataques en Oriente Próximo. La gran mayoría de los ataques de tráfico se originaron en Europa (74 %).
Por segundo trimestre consecutivo, las empresas de marketing y publicidad fueron las más afectadas en Norteamérica (aproximadamente el 35 %). Las empresas manufactureras y de software informático ocuparon el segundo y tercer lugar, respectivamente. Los principales orígenes de los ataques de tráfico fueron Europa (42 %) y EE. UU. (35 %).
Este trimestre, el sector de la biotecnología fue el que recibió el mayor número de ataques. Anteriormente, fue el sector de la salud y el bienestar. La mayor parte de los ataques de tráfico procedieron de Asia (38 %) y Europa (25 %).
Si analizamos el volumen total de los ataques de tráfico, Israel encabezó la lista de los países más afectados el trimestre pasado. Este trimestre, los ataques dirigidos a sitios web israelíes disminuyeron un 33 %, bajando así a la cuarta posición. EE. UU. vuelve a tomar la delantera como país más afectado, seguido de Canadá y Singapur.
Si normalizamos los datos por países y regiones y dividimos el tráfico de ataque por el tráfico total, obtenemos una imagen diferente. Palestina saltó al primer puesto como país más afectado. Casi el 12 % de todo el tráfico a sitios web palestinos fueron ataques DDoS HTTP.
El trimestre pasado, observamos una sorprendente desviación en la capa de red, cuando las redes finlandesas que usan las soluciones de protección de Cloudflare fueron el objetivo principal de los ataques. Este aumento estuvo probablemente relacionado con las conversaciones diplomáticas que precipitaron la integración formal de Finlandia en la OTAN. Los ciberataques representaron aproximadamente el 83 % de todo el tráfico entrante a Finlandia, seguido de cerca por China, con un 68 % de ataques de tráfico.
Este trimestre, sin embargo, muestra un panorama muy diferente. Finlandia no estuvo en los diez primeros puestos, y las redes chinas protegidas por Cloudflare estuvieron a la cabeza. Casi dos tercios de los flujos de bytes hacia redes chinas protegidas por Cloudflare eran maliciosos. Suiza se coló en segunda posición, donde la mitad del tráfico entrante formó parte de ataques. Turquía ocupó el tercer lugar, donde una cuarta parte de su tráfico entrante se identificó como hostil.
En ocasiones, los ataques DDoS se llevan a cabo para extorsionar el pago de rescates. Llevamos más de tres años encuestando a los clientes de Cloudflare y haciendo un seguimiento de los casos de ataques DDoS de rescate.
A diferencia de los ataques de ransomware, en los que las víctimas suelen caer en la trampa y descargan un archivo malicioso o hacen clic en un enlace de correo electrónico en riesgo que bloquea, elimina o filtra sus archivos hasta que se paga un rescate, los ataques DDoS de rescate pueden ser mucho más sencillos de ejecutar para los ciberdelincuentes. Los ataques DDoS de rescate no necesitan hacer uso de tácticas engañosas, como atraer a las víctimas para que abran correos electrónicos dudosos o hagan clic en enlaces fraudulentos, y tampoco necesitan aprovechar una brecha en la red ni acceder a los recursos corporativos.
En el último trimestre, se observó una disminución de las denuncias de ataques DDoS de rescate. Uno de cada diez encuestados declaró haber sufrido amenazas o ataques DDoS de rescate.
En los últimos meses, se ha producido una escalada alarmante en la sofisticación de los ataques DDoS. Incluso los ataques más grandes y sofisticados que hemos observado pueden durar solo unos minutos o incluso segundos, lo que no da a un humano tiempo suficiente para responder. Antes incluso de que se envíe la alerta PagerDuty, el ataque puede haber terminado con consecuencias nefastas. La recuperación de un ataque DDoS puede durar mucho más que el propio ataque, igual que un boxeador puede necesitar un tiempo para recuperarse de un puñetazo en la cara que solo dura una fracción de segundo.
La seguridad no es un único producto ni se activa con solo hacer clic en un botón, es más bien un proceso que implica numerosas capas de protección para reducir el riesgo de impacto. Los sistemas automatizados de protección contra ataques DDoS de Cloudflare protegen sistemáticamente a nuestros clientes de los ataques DDoS, permitiéndoles centrarse en sus operaciones empresariales principales. Estos sistemas se complementan con la amplia gama de funciones de Cloudflare, como firewalls, detección de bots, protección de API e incluso almacenamiento en caché, que pueden contribuir a reducir el riesgo de impacto.
El panorama de las amenazas DDoS está evolucionando y es cada vez más complejo, lo que exige algo más que soluciones rápidas. Afortunadamente, con las soluciones de protección multicapa y protección DDoS automáticas de Cloudflare, nuestros clientes están bien preparados para afrontar estos retos con confianza. Nuestra misión es ayudar a mejorar Internet, por lo que seguimos en guardia para garantizar un mundo digital más seguro y fiable para todos.
Los sistemas de Cloudflare analizan constantemente el tráfico y aplican soluciones de mitigación de forma automática cuando se detectan ataques DDoS. Cada víctima de un ataque recibe una encuesta automatizada que nos ayuda a comprender mejor la naturaleza del ataque y el éxito de las medidas de mitigación. Durante más de dos años, hemos formulado las preguntas de esta encuesta a aquellos clientes que han sido víctimas de ataques. Una de ellas es si han recibido una amenaza o nota de rescate. En los dos últimos años, hemos recopilado una media de 164 respuestas por trimestre, que utilizamos para calcular el porcentaje de ataques DDoS de rescate.
País de origen
En la capa de aplicación, utilizamos las direcciones IP enemigas para conocer el país de origen de los ataques. Esto se debe a que, en esa capa, las direcciones IP no se pueden suplantar (es decir, alterar). Sin embargo, en la capa de red, las direcciones IP de origen sí se pueden suplantar. Así que, en lugar de basarnos en las direcciones IP para conocer el origen, utilizamos la ubicación de nuestros centros de datos donde se detectaron los paquetes de ataque. Podemos obtener precisión geográfica gracias a nuestra amplia cobertura global en más de 285 ubicaciones de todo el mundo.
País objetivo
Tanto para los ataques DDoS a la capa de aplicación como a la capa de red, agrupamos los ataques y el tráfico según el país de facturación de nuestros clientes. Esta metodología nos permite comprender qué países son objeto de más ataques.
Sector objetivo
Tanto para los ataques DDoS a la capa de aplicación como a la capa de red, agrupamos los ataques y el tráfico según el sector de nuestros clientes, de acuerdo con nuestro sistema de gestión de relaciones con los clientes. Esta metodología nos permite saber qué sectores son objeto de más ataques.
Volumen total vs. porcentaje
En cuanto a la información sobre los países de origen y países objetivo, observamos el volumen total de tráfico de ataque comparado con todo el tráfico como un punto de datos. Además, también observamos el porcentaje de ataques de tráfico hacia o desde un país concreto, a un país específico o a un sector determinado. Este análisis nos ofrece la "velocidad de la actividad de ataque" para un país/sector determinado, normalizada por sus niveles de tráfico total. De esta manera, eliminamos los sesgos de un país o sector que normalmente recibe mucho tráfico y, por tanto, también muchos ataques de tráfico.
Cómo calculamos las características de los ataques
Para calcular el tamaño, la duración y los vectores de ataque, así como las amenazas emergentes, agrupamos los ataques en categorías y luego establecemos la proporción de cada categoría respecto a la cantidad total de cada aspecto. En el nuevo elemento de Radar, estas tendencias se calculan en cambio por número de bytes. Como los ataques pueden variar mucho en número de bytes entre sí, esto podría dar lugar a tendencias diferentes entre los informes y el elemento de Radar.
Cuando describimos los "principales países" como el origen o el objetivo de ataques, no significa necesariamente que ese país haya sido atacado como país, sino que las organizaciones que utilizan ese país como país de facturación fueron objeto de ataques. Del mismo modo, los ataques originados en un país no significan que ese país lanzara los ataques, sino que el ataque se lanzó desde direcciones IP que han sido asignadas a ese país. Los ciberdelincuentes operan botnets globales con nodos en todo el mundo, y en muchos casos también utilizan redes privadas virtuales y proxies para ocultar su verdadera ubicación. Así que, en todo caso, el país de origen podría indicar la presencia de nodos de salida o nodos de botnets dentro de ese país.
Post Syndicated from The History Guy: History Deserves to Be Remembered original https://www.youtube.com/watch?v=vz0Udz-AGAY